Article

Changes in Exosomal miRNA Composition in Thyroid Cancer Cells after Prolonged Exposure to Real Microgravity in Space

1
The Saban Research Institute, Children’s Hospital Los Angeles, University of Southern California, 4650 Sunset Blvd., Los Angeles, CA 90027, USA
2
Department of Microgravity and Translational Regenerative Medicine, Clinic for Plastic, Aesthetic and Hand Surgery, Otto von Guericke University, Universitätsplatz 2, 39106 Magdeburg, Germany
3
Department of Biomedicine, Aarhus University, Ole Worms Allé 4, 8000 Aarhus C, Denmark
4
Department of Ophthalmology, Aarhus University Hospital, 8200 Aarhus N, Denmark
5
Research Group “Magdeburger Arbeitsgemeinschaft für Forschung unter Raumfahrt- und Schwerelosigkeitsbedingungen” (MARS), Otto von Guericke University, 39106 Magdeburg, Germany
6
Deutsches Zentrum für Luft- und Raumfahrt (DLR), Raumfahrtagentur im DLR, Bonn-Oberkassel, 53227 Bonn, Germany
*
Author to whom correspondence should be addressed.
Int. J. Mol. Sci. 2021, 22(23), 12841; https://0-doi-org.brum.beds.ac.uk/10.3390/ijms222312841
Submission received: 4 November 2021 / Revised: 24 November 2021 / Accepted: 25 November 2021 / Published: 27 November 2021
(This article belongs to the Special Issue Microgravity and Space Medicine 2.0)

Abstract

:
As much as space travel and exploration have been a goal since humankind looked up to the stars, the challenges coming with it are manifold and difficult to overcome. Therefore, researching the changes the human organism undergoes following exposure to weightlessness, on a cellular or a physiological level, is imperative to reach the goal of exploring space and new planets. Building on the results of our CellBox-1 experiment, where thyroid cancer cells were flown to the International Space Station, we are now taking advantage of the newest technological opportunities to gain more insight into the changes in cell–cell communication of these cells. Analyzing the exosomal microRNA composition after several days of microgravity might elucidate some of the proteomic changes we have reported earlier. An array scan of a total of 754 miRNA targets revealed more than 100 differentially expressed miRNAs in our samples, many of which have been implicated in thyroid disease in other studies.

1. Introduction

Space, the final frontier, is the ultimate goal for humans to explore. The fascination of the stars and the longing to reach them is as old as humankind itself. Through technological advancement combined with the age of information, space travel has become part of our reality. Multiple programs, manned or unmanned, have broadened our knowledge about space and the planets of our solar system; exploration of its planets and even commercial travel seems possible in the near future [1,2,3,4,5,6]. Still, research must find solutions to overcome multiple challenges to advance to these goals, not only on a technical level but also to prevent the rather dramatic effects the space environment wields over the human organism. The fact is that prolonged lack of exposure to gravitational forces can lead to numerous impairments in multiple physiological systems [7,8,9,10,11,12]. Therefore, researchers have started investigating the effects of weightlessness on the human body early in the history of spaceflight [13,14,15].
Even with the addition of several new enterprises in the field of interstellar travel, spaceflights are still rare and require extensive preparation and funding. Hence, most of the initial cell biological experiments are conducted on Earth under simulated microgravity (s-μg) conditions. To adequately simulate weightlessness in a laboratory setting, disparate devices have been developed over the years, such as the random positioning machine (RPM) and clinostats [16,17,18,19,20].
The changes observed after cell incubation within these devices often predict cellular changes during spaceflight, but by direct comparison, s-μg and real microgravity (r-μg) do not cause identical effects [21]. When our team was presented with the opportunity to conduct experiments under prolonged microgravity as part of a joint enterprise with the German Aerospace Center (Deutsches Zentrum für Luft- und Raumfahrt, DLR) (Bonn, Germany) and the Chinese Manned Space Engineering Office (CMSEO) (Beijing, PR China) [22] during the Shenzhou-8/SimBox Spaceflight mission in 2011, we took on the challenge. Both the planning and execution of cell culture experiments on the unmanned Shenzhou-8 spacecraft was a major undertaking. The cell culture equipment had to be developed to withstand the physical forces during the mission and had to be adapted to small, automated modules to enable fluid exchanges [23,24].
Extensive hardware tests prior to and during the Shenzhou-8 mission and the results and insights gained through the following analysis of the harvested samples provided us with the essential knowledge to equip a follow-up experiment under prolonged exposure to r-μg conditions (r-μg). Our team described changes of cancer cells from two to three-dimensional growth after exposure to simulated microgravity on the RPM before [24]. Moreover, genomic adaptations in pathways involved in the cytoskeletal composition were identified [25,26,27]. For the above-mentioned follow-up investigation, the human follicular thyroid cancer cell line FTC-133 was flown to the International Space Station (ISS) on the SpaceX CRS-3 cargo mission in newly designed, automated CellBox-1 modules, as described in more detail in Section 4.2. Incubation aboard the ISS proceeded for 12 days, following a pre-determined feeding and fixation schedule (flight module, FM). Concurrently, cells from the same passage were grown under the exact same conditions considering the hardware, temperature, and fluid exchange schedule in a laboratory on Earth (ground module, GM). The harvested cells and supernatant were analyzed to determine the growth behavior, adaptations in gene and protein expression, and protein interactions [26].
In an attempt to gain more knowledge on the underlying cellular changes of the differential protein expression following exposure to microgravity, we decided to re-analyze the CellBox-1 sample supernatants, this time regarding their exosome content. Exosomes are a group of extracellular vesicles (EVs), which have gained increasing interest and attention over the last decade. EVs are a family of lipid bilayer-delimited particles, which are naturally released into the extracellular environment by the majority of (if not all) cells and do not replicate [28,29,30]. Over the last decade, their high potential as biomarkers, as well as therapeutic vessels in clinical applications became apparent, due to their emerging roles in normal physiology, as well as various diseases. Diverse subtypes of EVs have been defined, but the three major types are categorized in exosomes, microvesicles, and apoptotic bodies. They are found in circulating body fluids, including blood, saliva, and urine [28,31,32,33,34]. EVs reflect their cell of origin with respect to their cargo, which consists of proteins, nucleic acids, lipids, metabolites, and even organelles from the parent cell. Initially thought to solely be a means of cellular waste disposal, more and more functional roles of EVs have been elucidated over the years, and concurrently, the interest in their implications and possible uses have led to the development of various methods of isolation and analysis [35,36,37,38]. Transfer of functional proteins and RNA, molecular recycling, creation of a metastatic niche for cancer and pathfinding through the environment, and quorum sensing are only a few [39,40,41,42,43,44,45,46]. EVs facilitate the horizontal transfer of information between different cells and are most likely the organism’s most important tool in cell–cell communication. With their potential to serve as biomarkers for a wide array of diseases in clinical diagnosis, the role of EVs in the tumor microenvironment has been studied extensively over the last decade. EVs are transferred from tumors to the surrounding extracellular environment and, thus, modulate the immune and therapy response, and promote matrix remodeling, as well as angiogenesis [47,48,49,50]. Conversely, the transfer of EVs from the tumor microenvironment to tumor cells enhances tumorigenesis by increasing tumor cell proliferation, resistance to chemotherapy, and migration [50,51,52,53,54,55]. As mentioned above, EVs can travel to distant areas of the organism, where they can be involved in the preparation of the pre-metastatic niche [39,40,41,42,43,44].
Our groups’ interest is focused on exosomes, also known as small EVs, vesicles of endosomal origin defined by their size, biogenesis, and multiple well-defined markers. Exosomes range in size from roughly 30 to 150 nm and are further defined by the presence of specific transmembrane, extracellular, and cytosolic proteins, as well as the absence of some intracellular proteins present in other EVs. The International Society for Extracellular Vesicles (ISEV) has detailed the minimal experimental requirements for a definition of exosomes and other EVs [37,56]. Additionally, exosomes can be distinguished by their release mechanism to the extracellular environment via fusion of late endosomes/multivesicular bodies (MVBs) with the plasma membrane (Figure 1) [57,58]. The challenges of studying exosomes—their small size, low yields and/or co-precipitation of aggregated and bound proteins during isolation and enrichment—have been met by the research community with the development of new methods to characterize these promising particles. The most common methods of determining the size distribution and concentration of exosomes, along with the determination of cell origin and distinguishing between different EVs have been described in detail [59,60,61]. Previously, we have used a method based on the single-particle interferometric reflectance imaging sensor (SP-IRIS) (ExoView™, NanoView Biosciences, Boston, MA, USA), which permits multiplexed phenotyping and digital counting of various populations of individual exosomes captured on a microarray-based chip. This method allows the characterization of exosomes directly from human biofluids without the need for prior vesicle isolation or concentration and so grants a detailed analysis with a very small sample size [60,62,63].
Here, we are presenting the results of our continuative analysis of the exosomal composition of the CellBox-1 samples for integration with the entirety of our previous findings. To delve deeper into the regulatory changes of protein expression after prolonged exposure to r-μg, we opted to analyze potential changes in the exosomal microRNA (miRNA) content. miRNAs are small, non-coding RNA molecules found in animals, plants and some viruses and are involved mainly in the post-transcriptional regulation of gene expression [64,65]. First discovered in 1993, their regulatory function was not elucidated until the early 2000s [66,67,68,69]. The majority of miRNA “genes” are located in intergenic regions or in antisense orientation in annotated genes [65,67,70]. They are transcribed as fairly long primary transcripts, the pri-miRNA, then transformed into the hairpin-shaped pre-miRNA by the RNase III Drosha [71,72]. After being transported into the cytoplasm, the pre-miRNA is cleaved to the mature miRNA by Dicer, a critical member of the RISC complex (RNA-induced silencing complex), with a length of 19–25 nucleotides [65,73,74,75] (Figure 1). miRNAs pair with mRNAs to direct post-transcriptional repression (mainly) by way of either direct translational repression, mRNA destabilization or both [66,76]. Another member of the RISC complex, Ago2, is activated by the miRNA/mRNA pairing and cleaves the mRNA [77]. The various molecular processes involved in miRNA-directed translational repression and mRNA destabilization, which include inhibition of translation initiation and poly(A) shortening, are reviewed in detail by Filipowicz et al. [78]. The number of defined miRNAs has passed 1200 and is rising continuously. With the large quantity of reported miRNAs in cancer research, our interest in this group of protein regulators was easily triggered, and our prospects were to find some common links between changes in the exosomal miRNA cargo and our previously reported genomic and proteomic cellular changes following extended exposure to r-μg. Optimizing for source material, as well as the given hypotheses, is crucial, as the different protocols differ drastically in yield, purity, and functionality of the harvested EVs, as shown in comparative studies [35,79,80].
Likewise, the definition and description of EVs have varied greatly and proved overwhelming at times. As a result, the ISEV set the minimal required standard in defining the different vesicles to the report of amounts of several proteins (three or more) in at least a semi-quantitative manner in any EV preparation, including EV isolates obtained from body fluids or from secreting cells in vitro. The proteins described and characterized should be proteins expected to be present in the EVs of interest, especially transmembrane proteins and cytosolic proteins with membrane-binding capacity. In addition, the level of presence of proteins not expected to be enriched in EVs of endosomal origin should also be determined [56]. Transmembrane proteins expected to be present in exosomal preparations include, among others, tetraspanins (CD9, CD63, CD81), integrins, and growth factor receptors. The group of expected or enriched cytosolic proteins includes endosome or membrane-binding proteins (TSG101) and signal transduction or scaffolding proteins (syntenin). Intracellular proteins that are absent or under-represented in exosomes but present in other types of EVs are proteins found in the endoplasmic reticulum (ER) (calnexin) or the Golgi apparatus (GM130) [56].

2. Results

Exosomal miRNAs are instrumental in post-transcriptional regulation of protein expression and have earned recognition, particularly in tumorigenic pathways, including thyroid cancer [81,82,83,84]. With methods in place to engineer either cell-secreted or artificial exosomes loaded with a cargo of choice, as well as the possibility to target the recipient cell of choice precisely via surface protein presentation, the choice to scan our samples for differential miRNA expression was easy. The application of the TaqMan system is widely used and standardized, and therefore, offers numerous options for a thorough analysis. The EVs isolated from the CellBox-1 samples have been defined as exosomes in our previous publication [63]; hence we were able to use these EVs directly for any follow-up analyses.

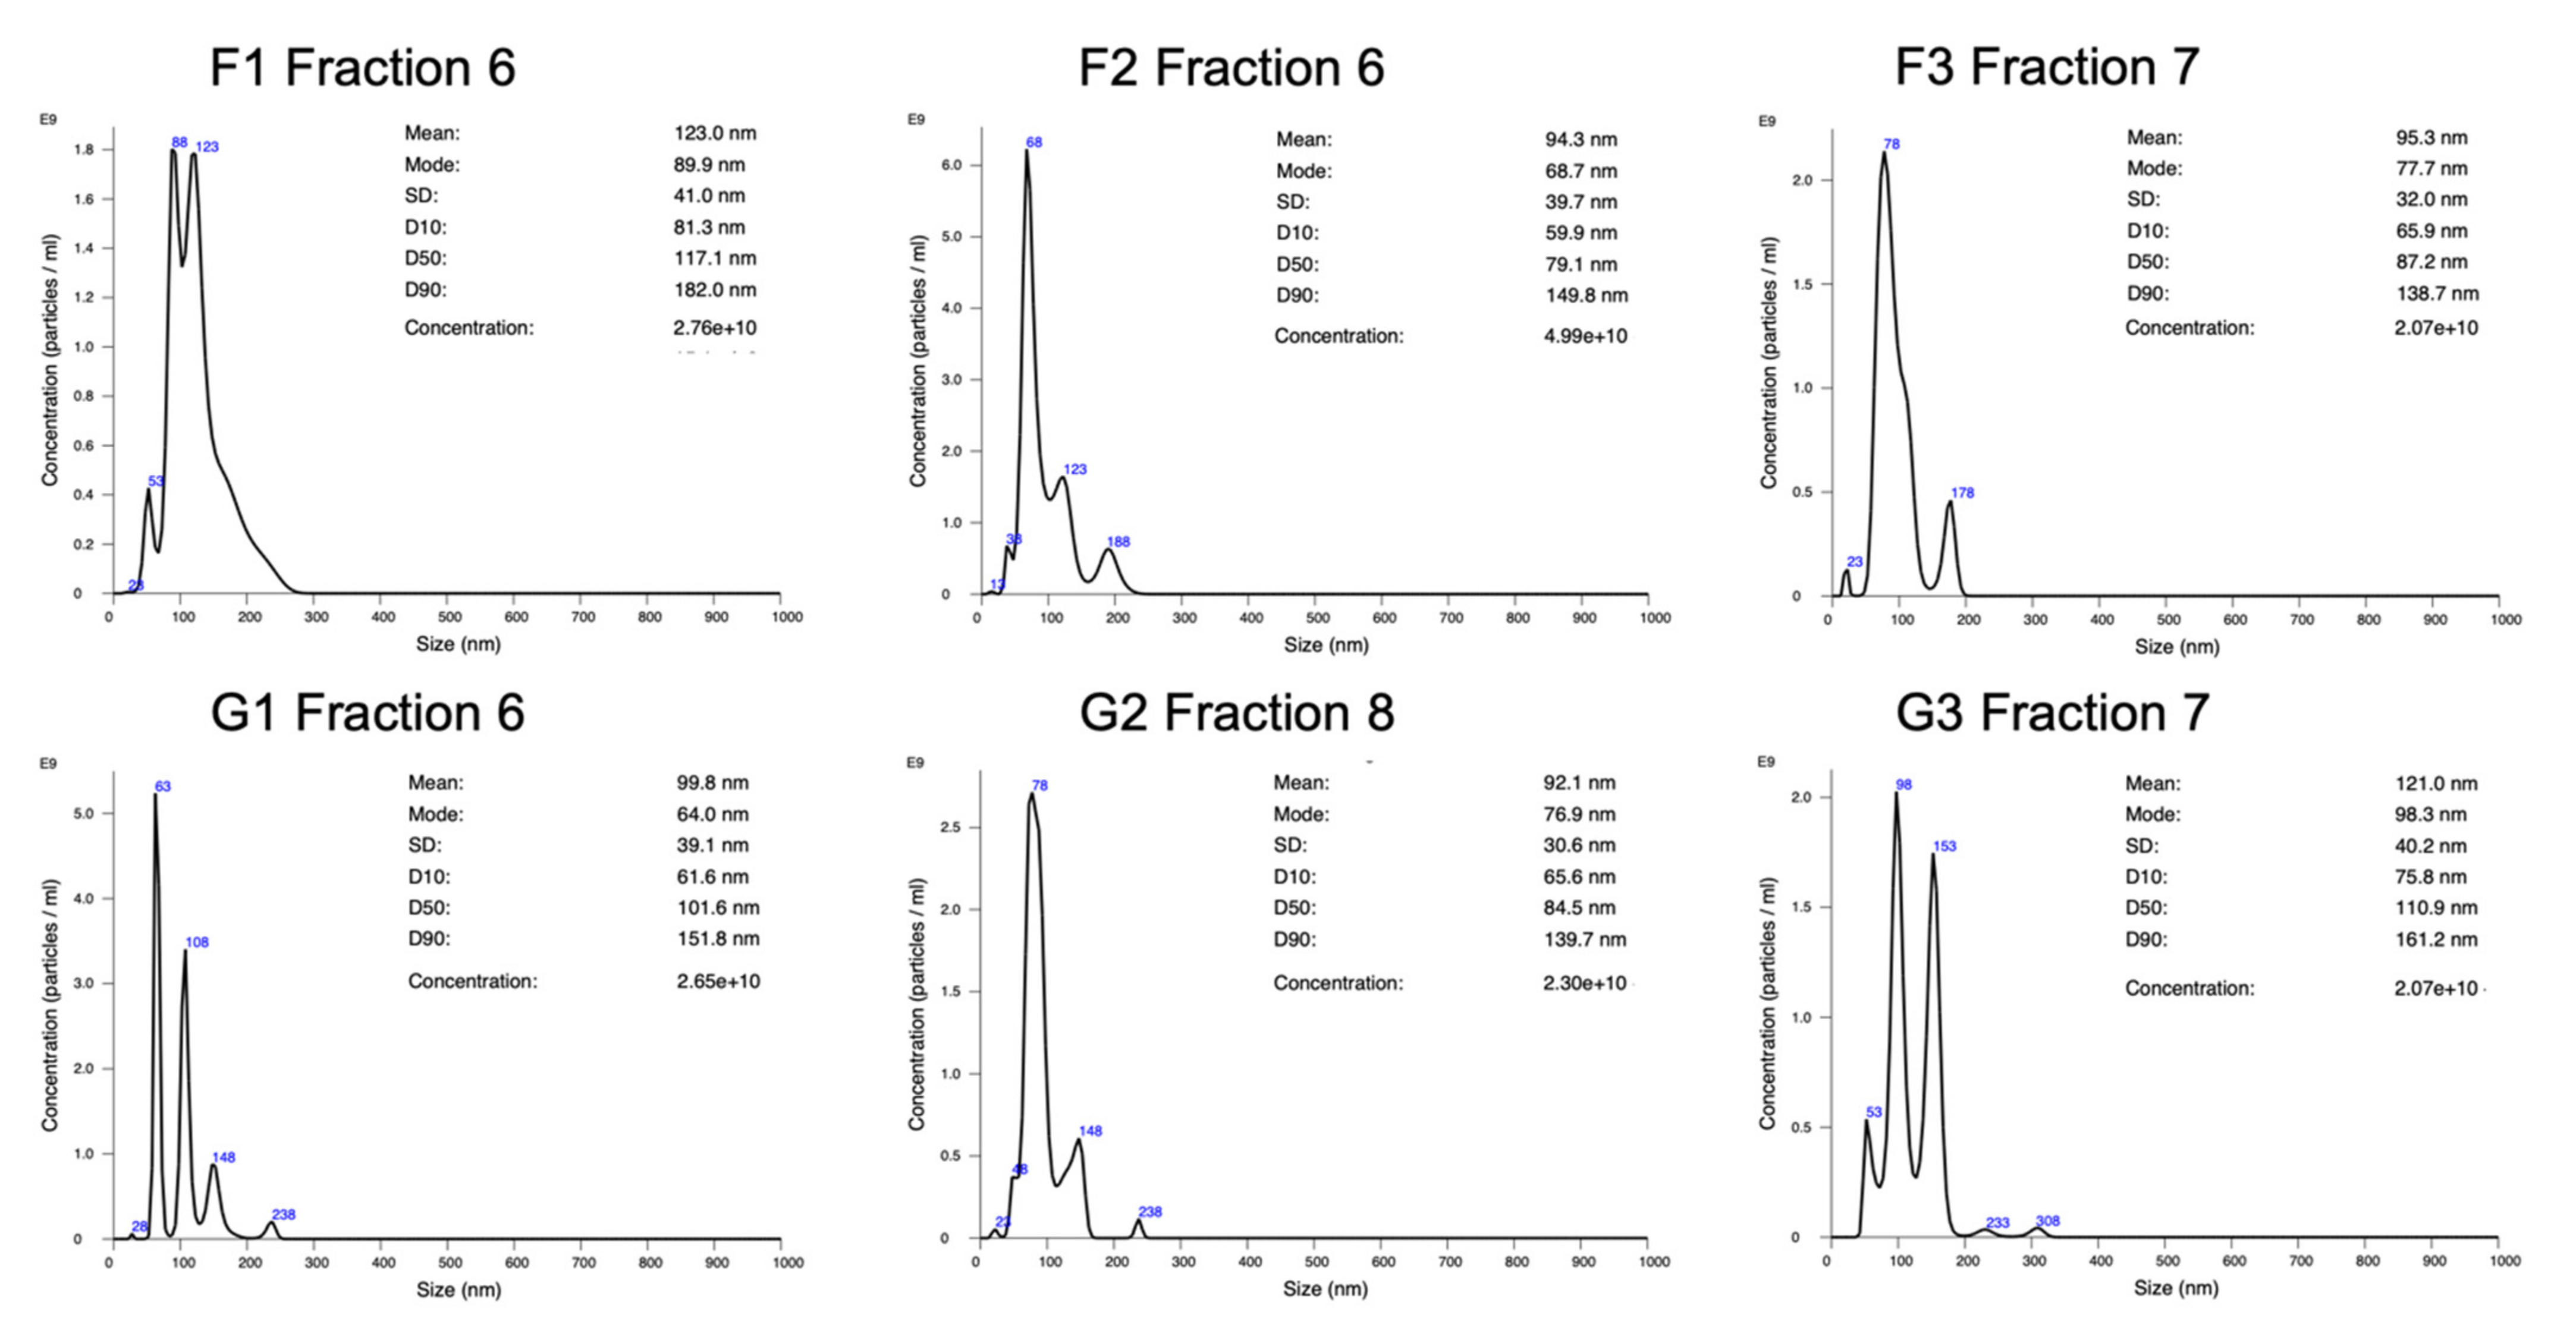
2.1. Particle Concentration and Size Distribution Analysis by NanoSight

Following the exosome isolation via size exclusion chromatography (SEC) the concentration and size distribution of the harvested particles was evaluated by nanoparticle tracking analysis (NTA) using a NanoSight instrument. Since the EVs present in all samples were already characterized as exosomes previously, this single analysis is sufficient to validate the harvested particles. The two fractions per sample containing the desired particles were analyzed; for the GMs, the mean size ranged from 92.1 to 129.6 nm with an average of 107.3 nm. The mode, meaning the size of the majority of particles, ranged from 64 to 117.8 nm, averaging 86.9 nm. The FM mean particle size ranged from 94.3 to 114.9 nm with an average of 106.8 nm, and the mode ranged from 68.7 to 98.3 nm, averaging 83.8 nm.
The concentration of the FM samples was determined at an average of 2.7 × 10¹⁰ particles/mL, ranging from 1.31 × 10¹⁰ to 4.99 × 10¹⁰ particles/mL; the GM samples averaged at a concentration of 2.0 × 10¹⁰ particles/mL in the range from 1.15 × 10¹⁰ to 2.65 × 10¹⁰ particles/mL. Figure 2 displays the size graphs for one fraction per sample, and the entire reports can be found in Supplementary Figure S1.

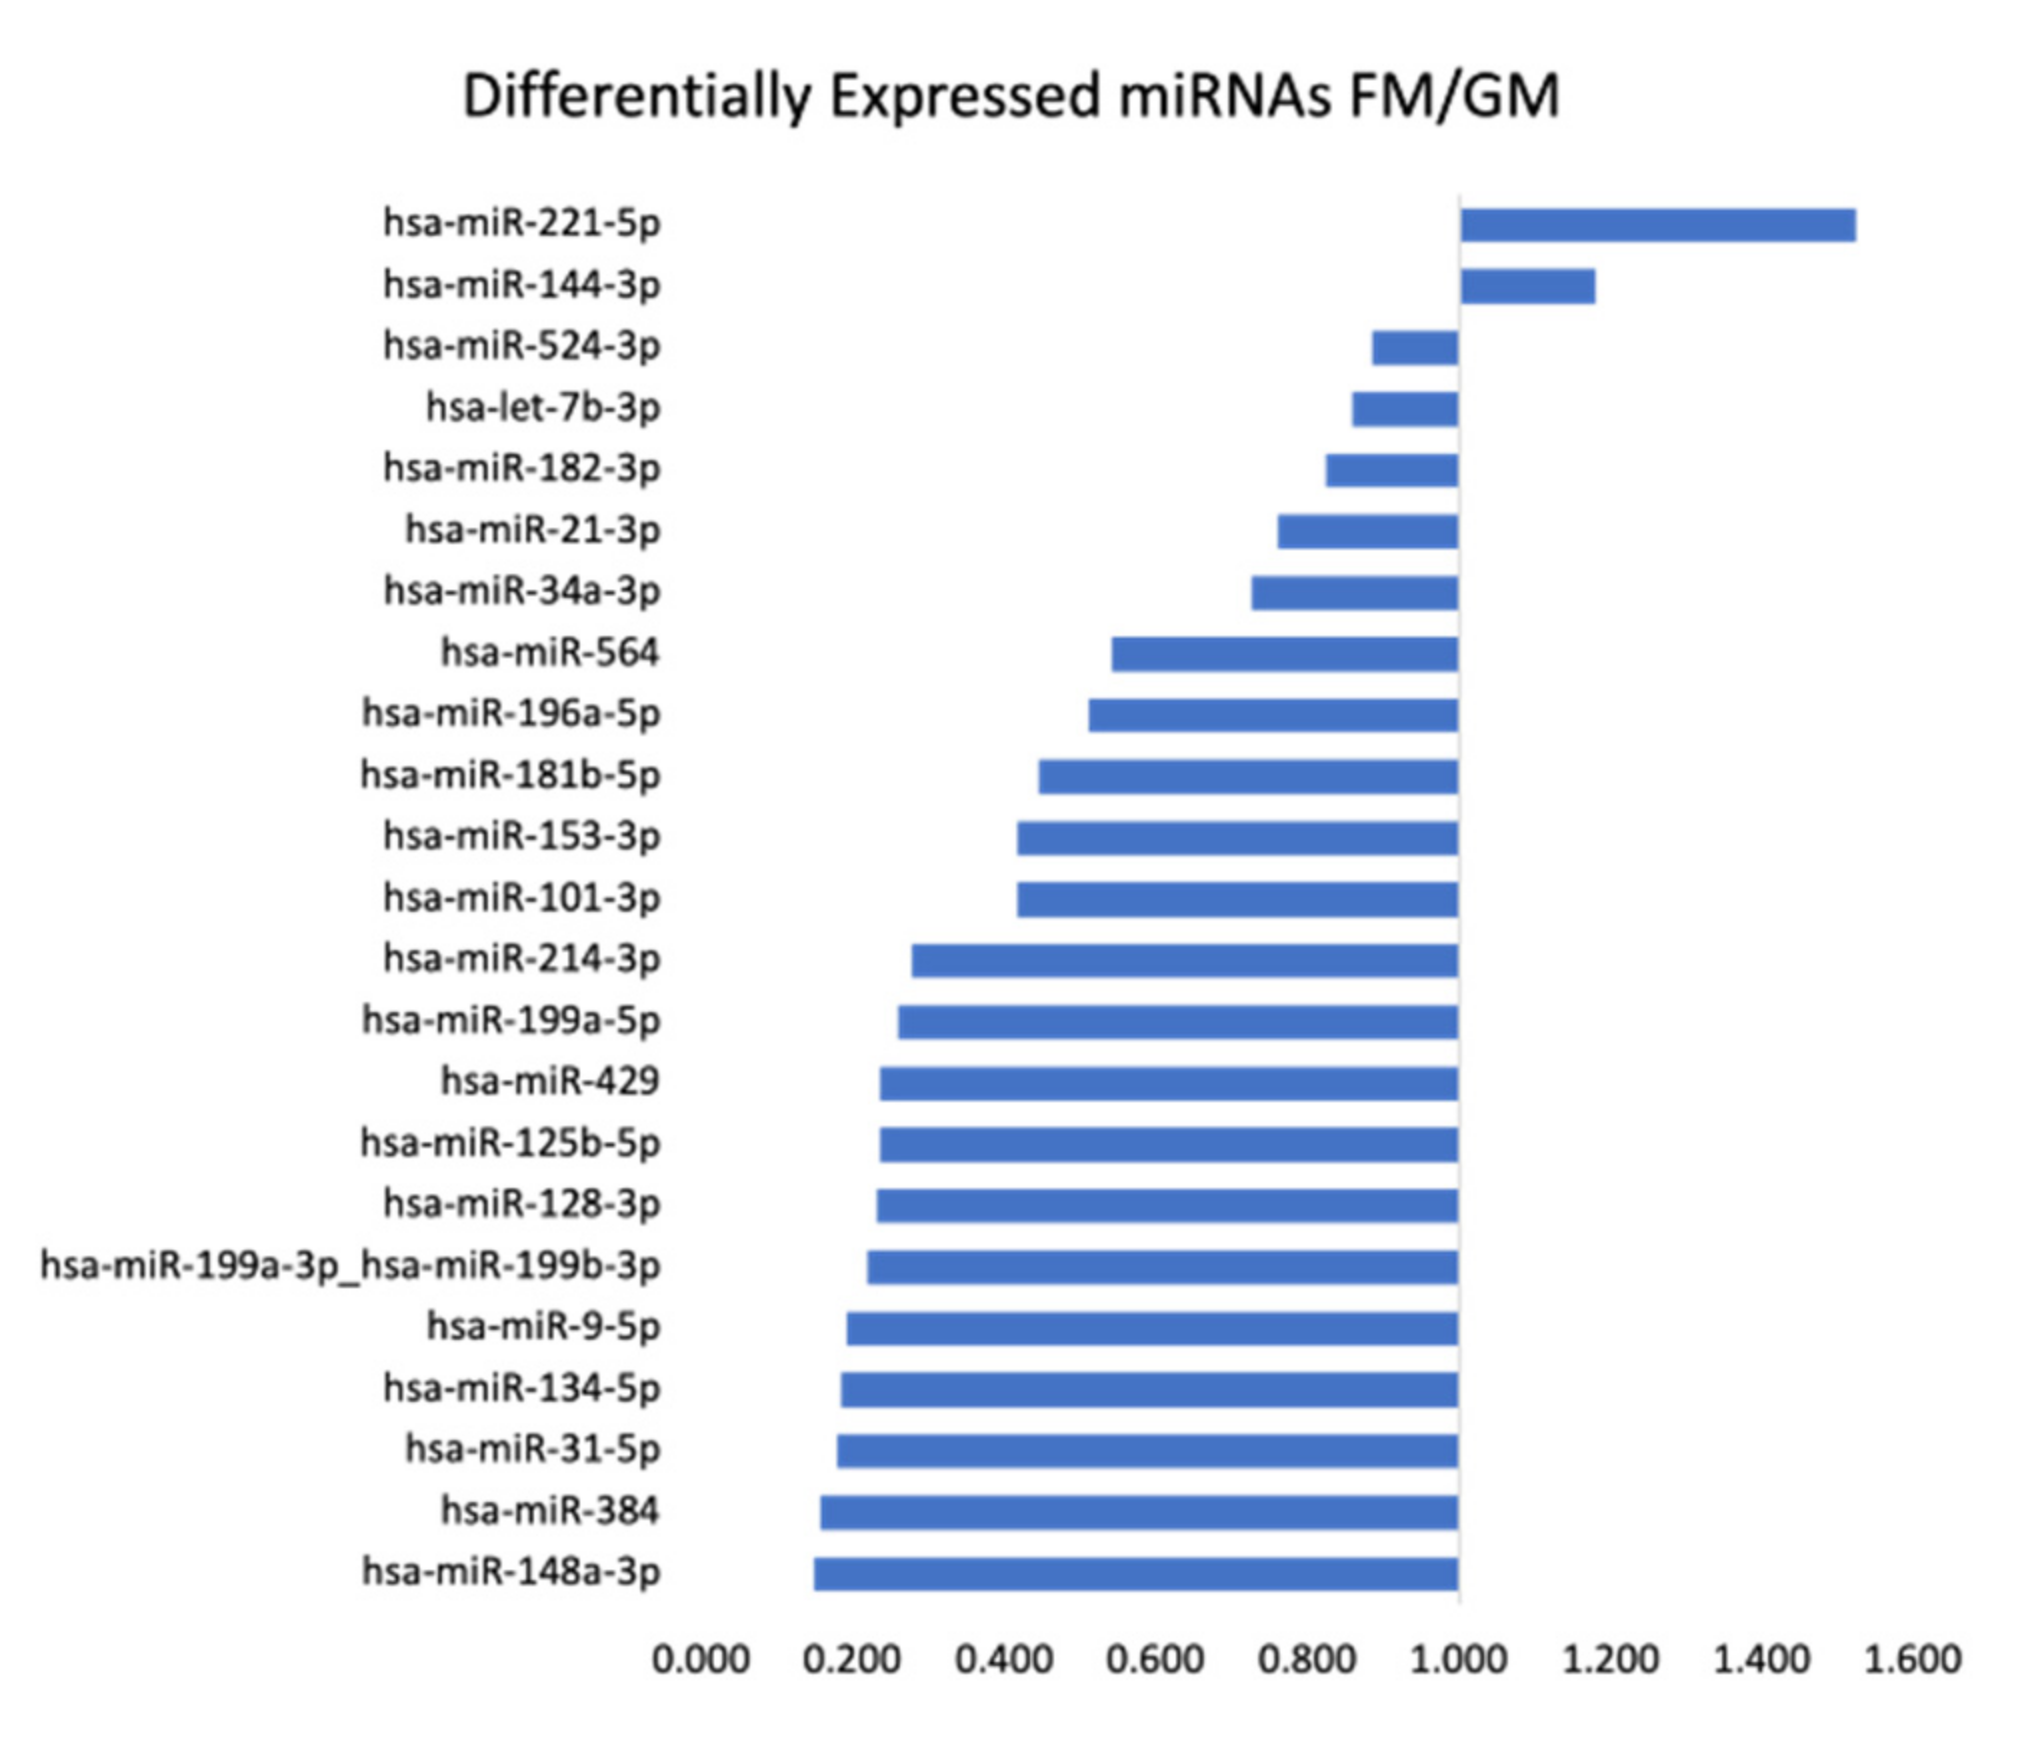
2.2. TaqMan™ Advanced miRNA Human Array Cards

The TaqMan™ Advanced miRNA Arrays offer a valuable first insight into any different expression patterns of any given samples, as the investigator is able to scan 754 targets in a streamlined and validated experimental setup. The human array cards have been developed to screen for miRNAs that have been reported as valuable markers in cancer and other relevant diseases. The analysis of total RNA cargo isolated from exosomes following our scan of one FM and GM CellBox-1 sample each disclosed a surprisingly large amount of differentially expressed miRNAs.
A total of 119 miRNAs were either elevated or decreased in the FM in comparison to the GM (Table 1). A total of 19 miRNAs displayed a higher relative quantification (RQ) value in FM, the percent increase ranging from 7% to 48%, with hsa-miR-553 leading the list. Hsa-miR-941 (138% increase), hsa-miR-1286 (132% increase), and hsa-miR-548d-5p (119% increase) also revealed more than double the expression compared to the GM. Expression of another four miRNAs was increased in the range of 94–81%: hsa-miR-154-3p (94%), hsa-miR-548g-3p (91%), hsa-miR-500a-3p (83%), and hsa-miR-583 (81%); the adjacent 11 miRNAs displayed expressional elevations between 52% and 7%.
Table 1. Differentially expressed microRNAs in FM compared to GM.
TargetRQ% ChangeTargetRQ% Change
hsa-miR-5535.476448%hsa-miR-28-5p0.331−67%
hsa-miR-9412.382138%hsa-miR-13020.328−67%
hsa-miR-12862.321132%hsa-miR-208b-3p0.323−68%
hsa-miR-548d-5p2.191119%hsa-miR-30c-2-3p0.320−68%
hsa-miR-154-3p1.94494%hsa-miR-367-3p0.312−69%
hsa-miR-548g-3p1.91391%hsa-miR-1-3p0.304−70%
hsa-miR-500a-3p1.82783%hsa-miR-452-5p0.287−71%
hsa-miR-5831.81481%hsa-miR-197-3p0.282−72%
hsa-miR-221-5p1.52352%hsa-miR-214-3p0.276−72%
hsa-miR-6261.43343%hsa-miR-208a-3p0.272−73%
hsa-miR-16-5p1.40140%hsa-miR-199a-5p0.259−74%
hsa-miR-12031.33734%hsa-miR-100-5p0.259−74%
hsa-miR-378a-3p1.28729%hsa-miR-103a-3p0.249−75%
hsa-miR-452-3p1.26827%hsa-miR-625-5p0.247−75%
hsa-miR-144-3p1.18018%hsa-miR-376a-3p0.246−75%
hsa-miR-200a-5p1.09710%hsa-miR-380-3p0.242−76%
hsa-miR-302d-3p1.0939%hsa-miR-4290.236−76%
hsa-miR-6461.0848%hsa-miR-125b-5p0.235−77%
hsa-miR-34b-3p1.0677%hsa-miR-7-1-3p0.231−77%
hsa-miR-6330.977−2%hsa-miR-128-3p0.231−77%
hsa-miR-1255a0.952−5%hsa-miR-374b-5p0.229−77%
hsa-miR-524-3p0.885−11%hsa-miR-323b-5p0.229−77%
hsa-miR-6060.883−12%hsa-miR-653-5p0.228−77%
hsa-miR-1260a0.875−12%hsa-miR-199a-3p_
hsa-miR-199b-3p
0.219−78%
hsa-let-7b-3p0.859−14%
hsa-miR-133b0.842−16%hsa-miR-4480.218−78%
hsa-miR-6450.841−16%hsa-miR-501-5p0.217−78%
hsa-miR-576-3p0.839−16%hsa-miR-423-5p0.197−80%
hsa-miR-182-3p0.823−18%hsa-miR-487a-3p0.197−80%
hsa-miR-548j-5p0.816−18%hsa-miR-378a-5p0.191-81%
hsa-miR-27a-5p0.806−19%hsa-miR-9-5p0.191−81%
hsa-miR-7650.799−20%hsa-miR-374a-5p0.191−81%
hsa-miR-361-3p0.787−21%hsa-miR-548a-3p0.189−81%
hsa-miR-628-3p0.778−22%hsa-miR-3250.186−81%
hsa-miR-21-3p0.761−24%hsa-miR-134-5p0.184−82%
hsa-miR-181c-3p0.751−25%hsa-let-7d-5p0.182−82%
hsa-miR-770-5p0.729−27%hsa-miR-31-5p0.178−82%
hsa-miR-34a-3p0.725−27%hsa-miR-21100.170−83%
hsa-miR-593-3p0.660−34%hsa-miR-92a-3p0.165−83%
hsa-miR-548k0.620−38%hsa-miR-148b-3p0.164−84%
hsa-miR-552-3p0.612−39%hsa-miR-3840.157−84%
hsa-miR-5620.594−41%hsa-miR-502-3p0.155−85%
hsa-miR-10b-3p0.562−44%hsa-miR-148a-3p0.149−85%
hsa-miR-548n0.544−46%hsa-miR-342-5p0.145−86%
hsa-miR-5640.541−46%hsa-miR-200a-3p0.138−86%
hsa-miR-551a0.521−48%hsa-miR-490-3p0.138−86%
hsa-miR-196a-5p0.511−49%hsa-miR-200c-3p0.136−86%
hsa-miR-516b-5p0.480−52%hsa-miR-744-5p0.135−87%
hsa-miR-190a-5p0.467−53%hsa-miR-25-3p0.122−88%
hsa-miR-133a-3p0.449−55%hsa-miR-450b-3p0.118−88%
hsa-miR-181b-5p0.444−56%hsa-miR-27b-3p0.108−89%
hsa-miR-153-3p0.417−58%hsa-miR-485-5p0.100−90%
hsa-miR-101-3p0.417−58%hsa-miR-483-5p0.098−90%
hsa-miR-18a-3p0.411−59%hsa-miR-518f-3p0.097−90%
hsa-miR-548e-3p0.402−60%hsa-miR-525-3p0.091−91%
hsa-miR-147a0.397−60%hsa-miR-5670.089−91%
hsa-miR-338-3p0.368−63%hsa-miR-324-5p0.084−92%
hsa-miR-660-5p0.346−65%hsa-miR-339-3p0.070−93%
hsa-miR-518c-3p0.335−66%hsa-miR-518d-3p0.069−93%
hsa-miR-1370.332−67%hsa-miR-501-3p0.066−93%
Of the 100 scanned miRNA targets with decreased RQ values, the percentage ranged from 2% to 93%; the detailed list can be found in Table 1. Briefly, 12 miRNAs displayed expression decreases below 20% (2–19%), and 16 ranged between 20% and 49%. The largest group could be found in the range between 50% and 80%, namely 39 of all scanned targets. A total of 24 miRNAs could be found grouped together with an expression decrease between 81% and 89%. Lastly, the nine remaining targets with the largest decrease in expression were the following: hsa-miR-485-5p, hsa-miR-483-5p, hsa-miR-518f-3p (all −90%), hsa-miR-525-3p, hsa-miR-567 (both −91%), hsa-miR-324-5p (−92%), and hsa-miR-339-3p, hsa-miR-518d-3p, hsa-miR-501-3p (all −93%).
Following another thorough in silico investigation, we discovered that a total of 23 of these differentially expressed miRNAs have been described in the pathogenesis of various thyroid cancers previously [84]. Hence, we decided to focus on these oncomiRs and tumor suppressors for further verification. Only two of the overexpressed miRNAs in the FM compared to the GM were found in this group, namely hsa-miR-221-5p (52% increase) and hsa-miR-144-3p (18% increase). The remaining 21 miRNAs were downregulated in varying degrees, starting from an 11% decrease up to an 85% decrease in the case of hsa-miR-148a-3p, as displayed in detail in Figure 3.
Figure 3. Differentially expressed miRNAs comparing FM with GM with TaqMan™ Advanced miRNA with the relevant impact in thyroid cancer.
Ijms 22 12841 g003

2.3. TaqMan™ Advanced miRNA Single Target Assays
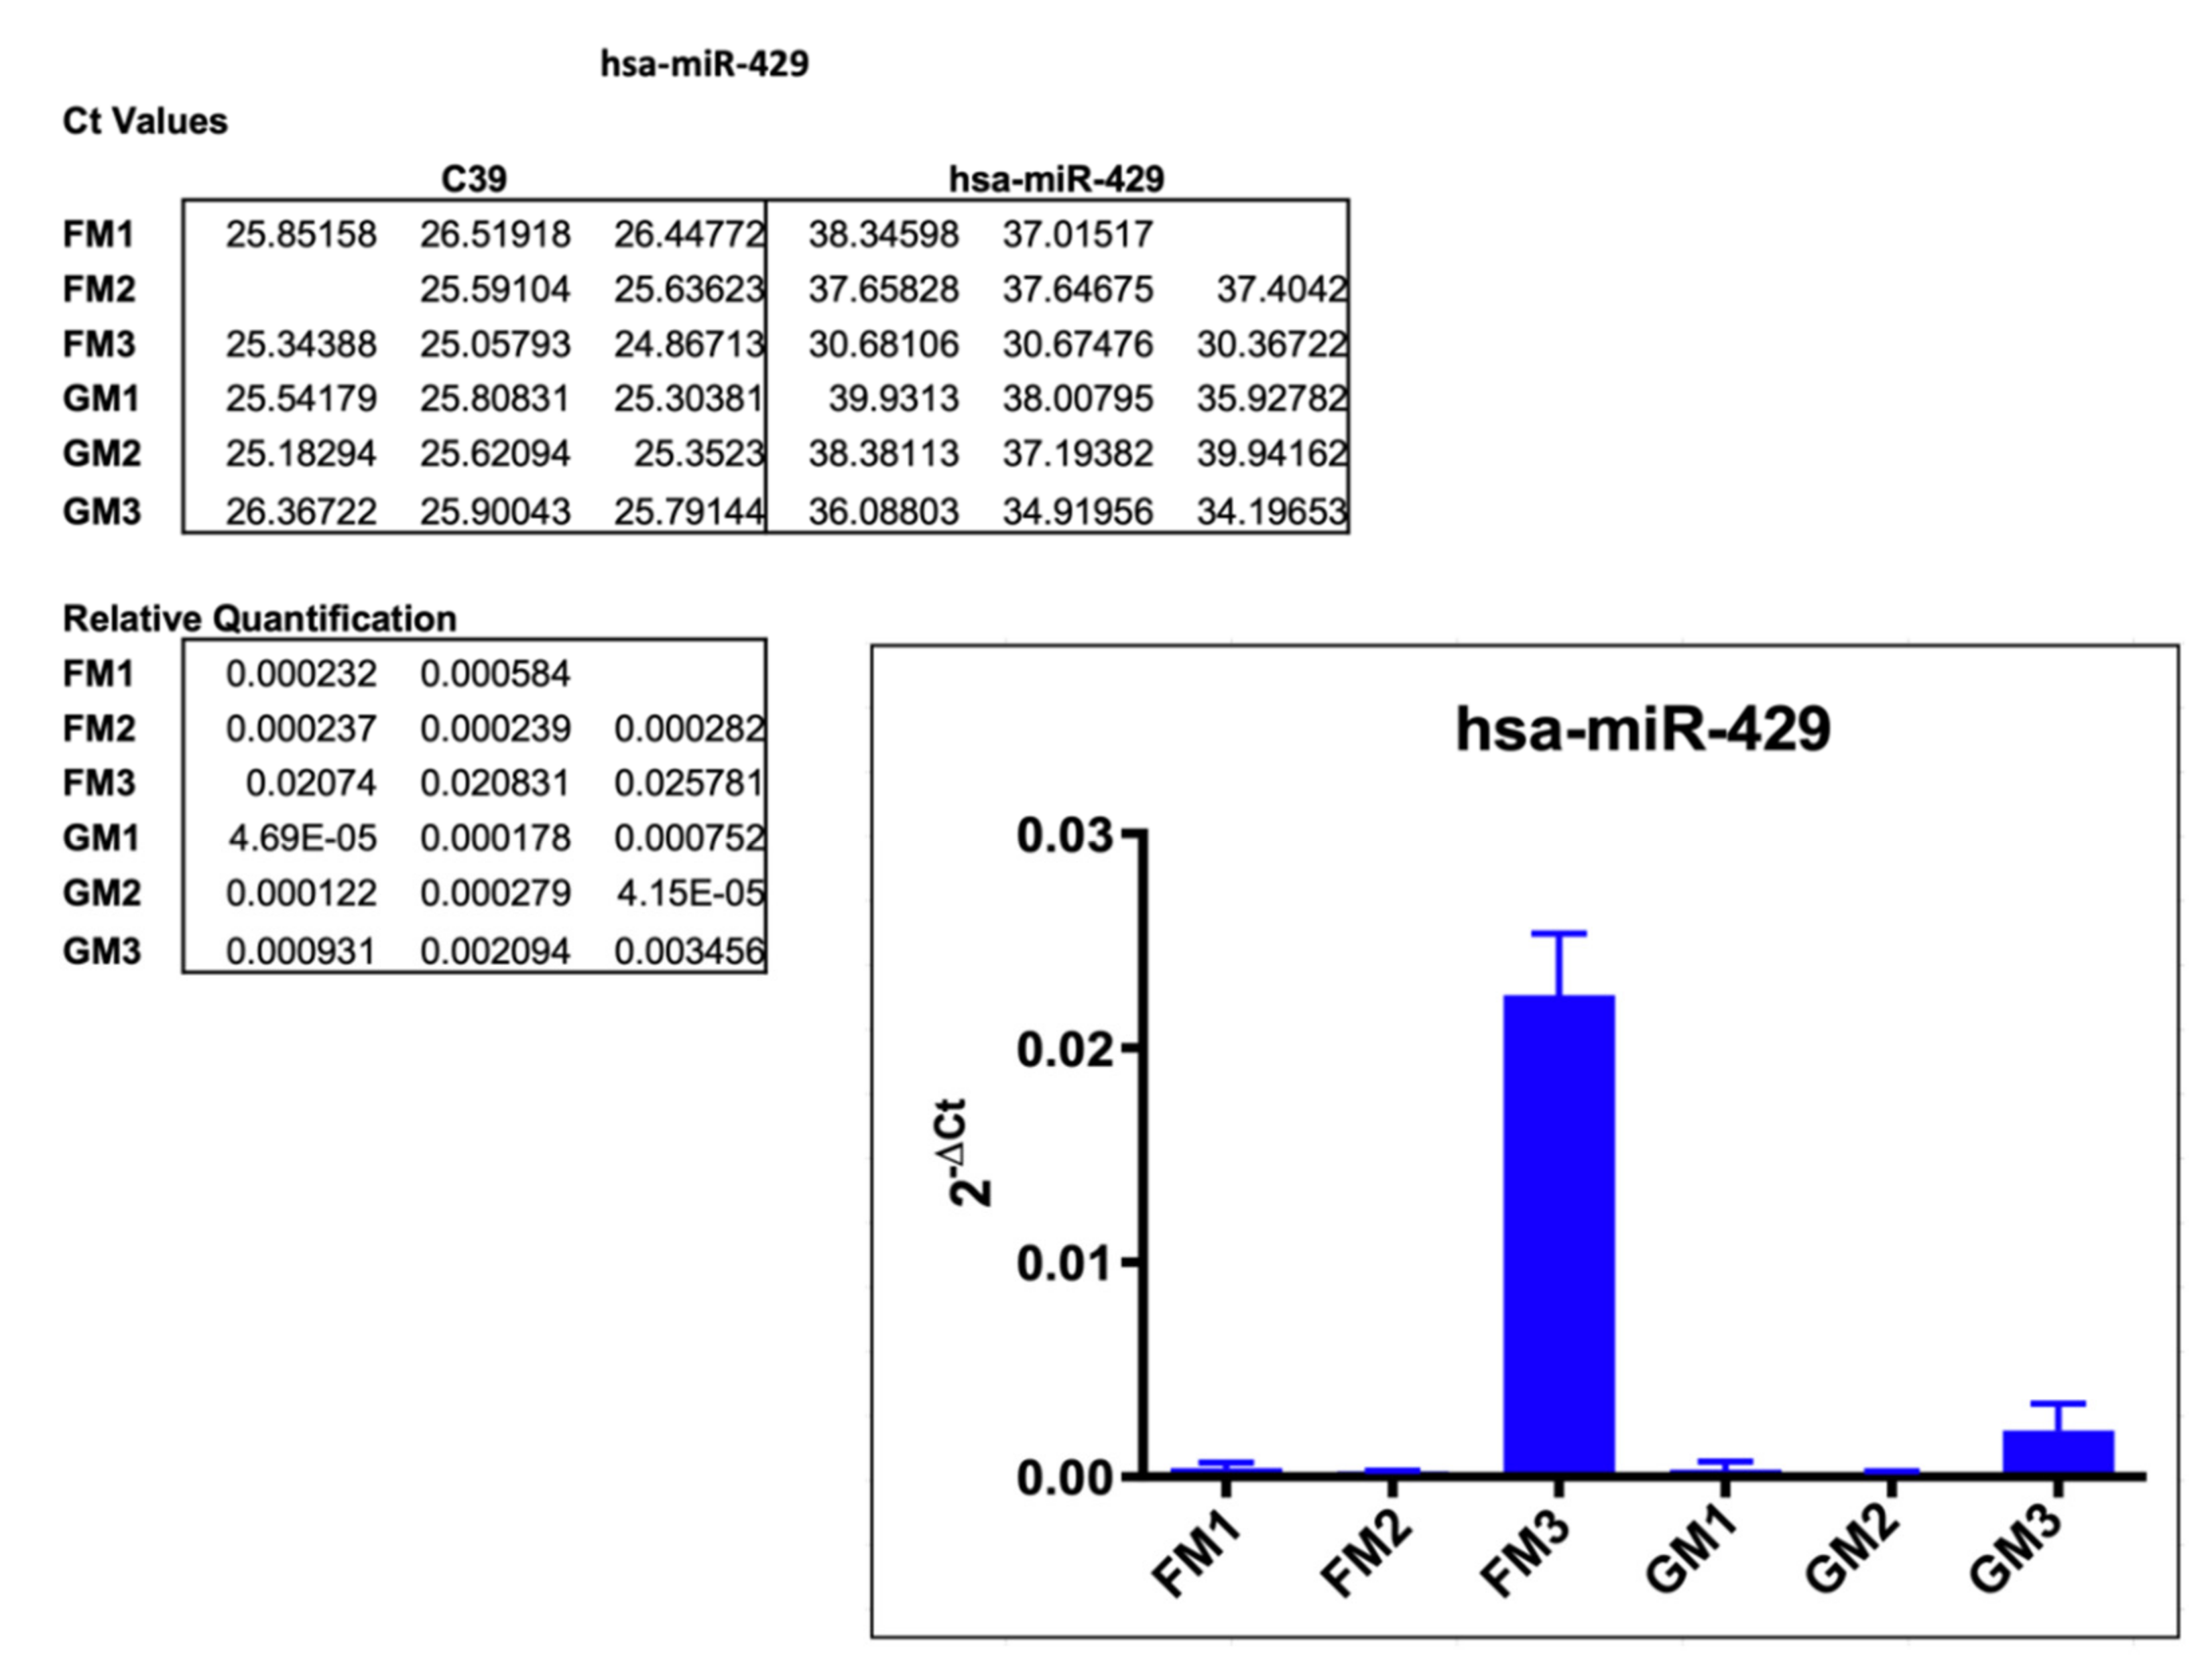
Even though an application as a biomarker usually comes to mind first and would be easiest to utilize, two facts discouraged us from choosing this route: (a) the number of overexpressed miRNAs in our FM sample was distinctly lower compared to the GM, and (b) only two of these were reported as oncomiRs in thyroid cancer. Namely, hsa-miR-221-5p was upregulated most, but the 3p-strand is the one described in papillary thyroid carcinoma (PTC) previously [81,82,84,85,86]. The second oncomiR overexpressed in FM, hsa-miR-144-3p, is the lower expressed strand of the hairpin; hence most of the reports regarding hsa-miR-144 in PTC and MTC (medullary thyroid carcinoma) were evaluating the 5p strand [83,87]. Therefore, we decided to focus on the more intriguing tumor suppressors.
Three of these tumor-suppressor miRNAs were chosen to be validated using TaqMan™ Advanced Single Target assays: hsa-miR-429 (decreased by 76%), hsa-miR-128-3p (77% decrease), and hsa-miR-199a-5p (downregulated 78%). All three have been described in thyroid tumors previously [88,89,90,91].

2.3.1. hsa-miR-429

In the initial TaqMan™ Advanced miRNA Array scan, the hsa-miR-429 expression was decreased by 76% in FM compared to GM. In a follow-up single assay, all FM and GM samples were analyzed, resulting in an increased expression across the board of varying degrees. The Ct values in all triplicates of FM1 and FM2 were at around 37 to 38 and averaged 38.23 in GM1 and GM1. Normalization with C39 led to relative quantification values of 0.0004 and 0.00025 (FM1, FM2) vs. 0.00032 and 0.00014. FM3 though displayed a much more dominant increase in miR-429 expression, at Ct values of 30 to 31 (FM3) compared to 35.1 (GM1) with a resulting relative quantification of 0.022 (FM3) vs. 0.0021 (GM3) (Figure 4).

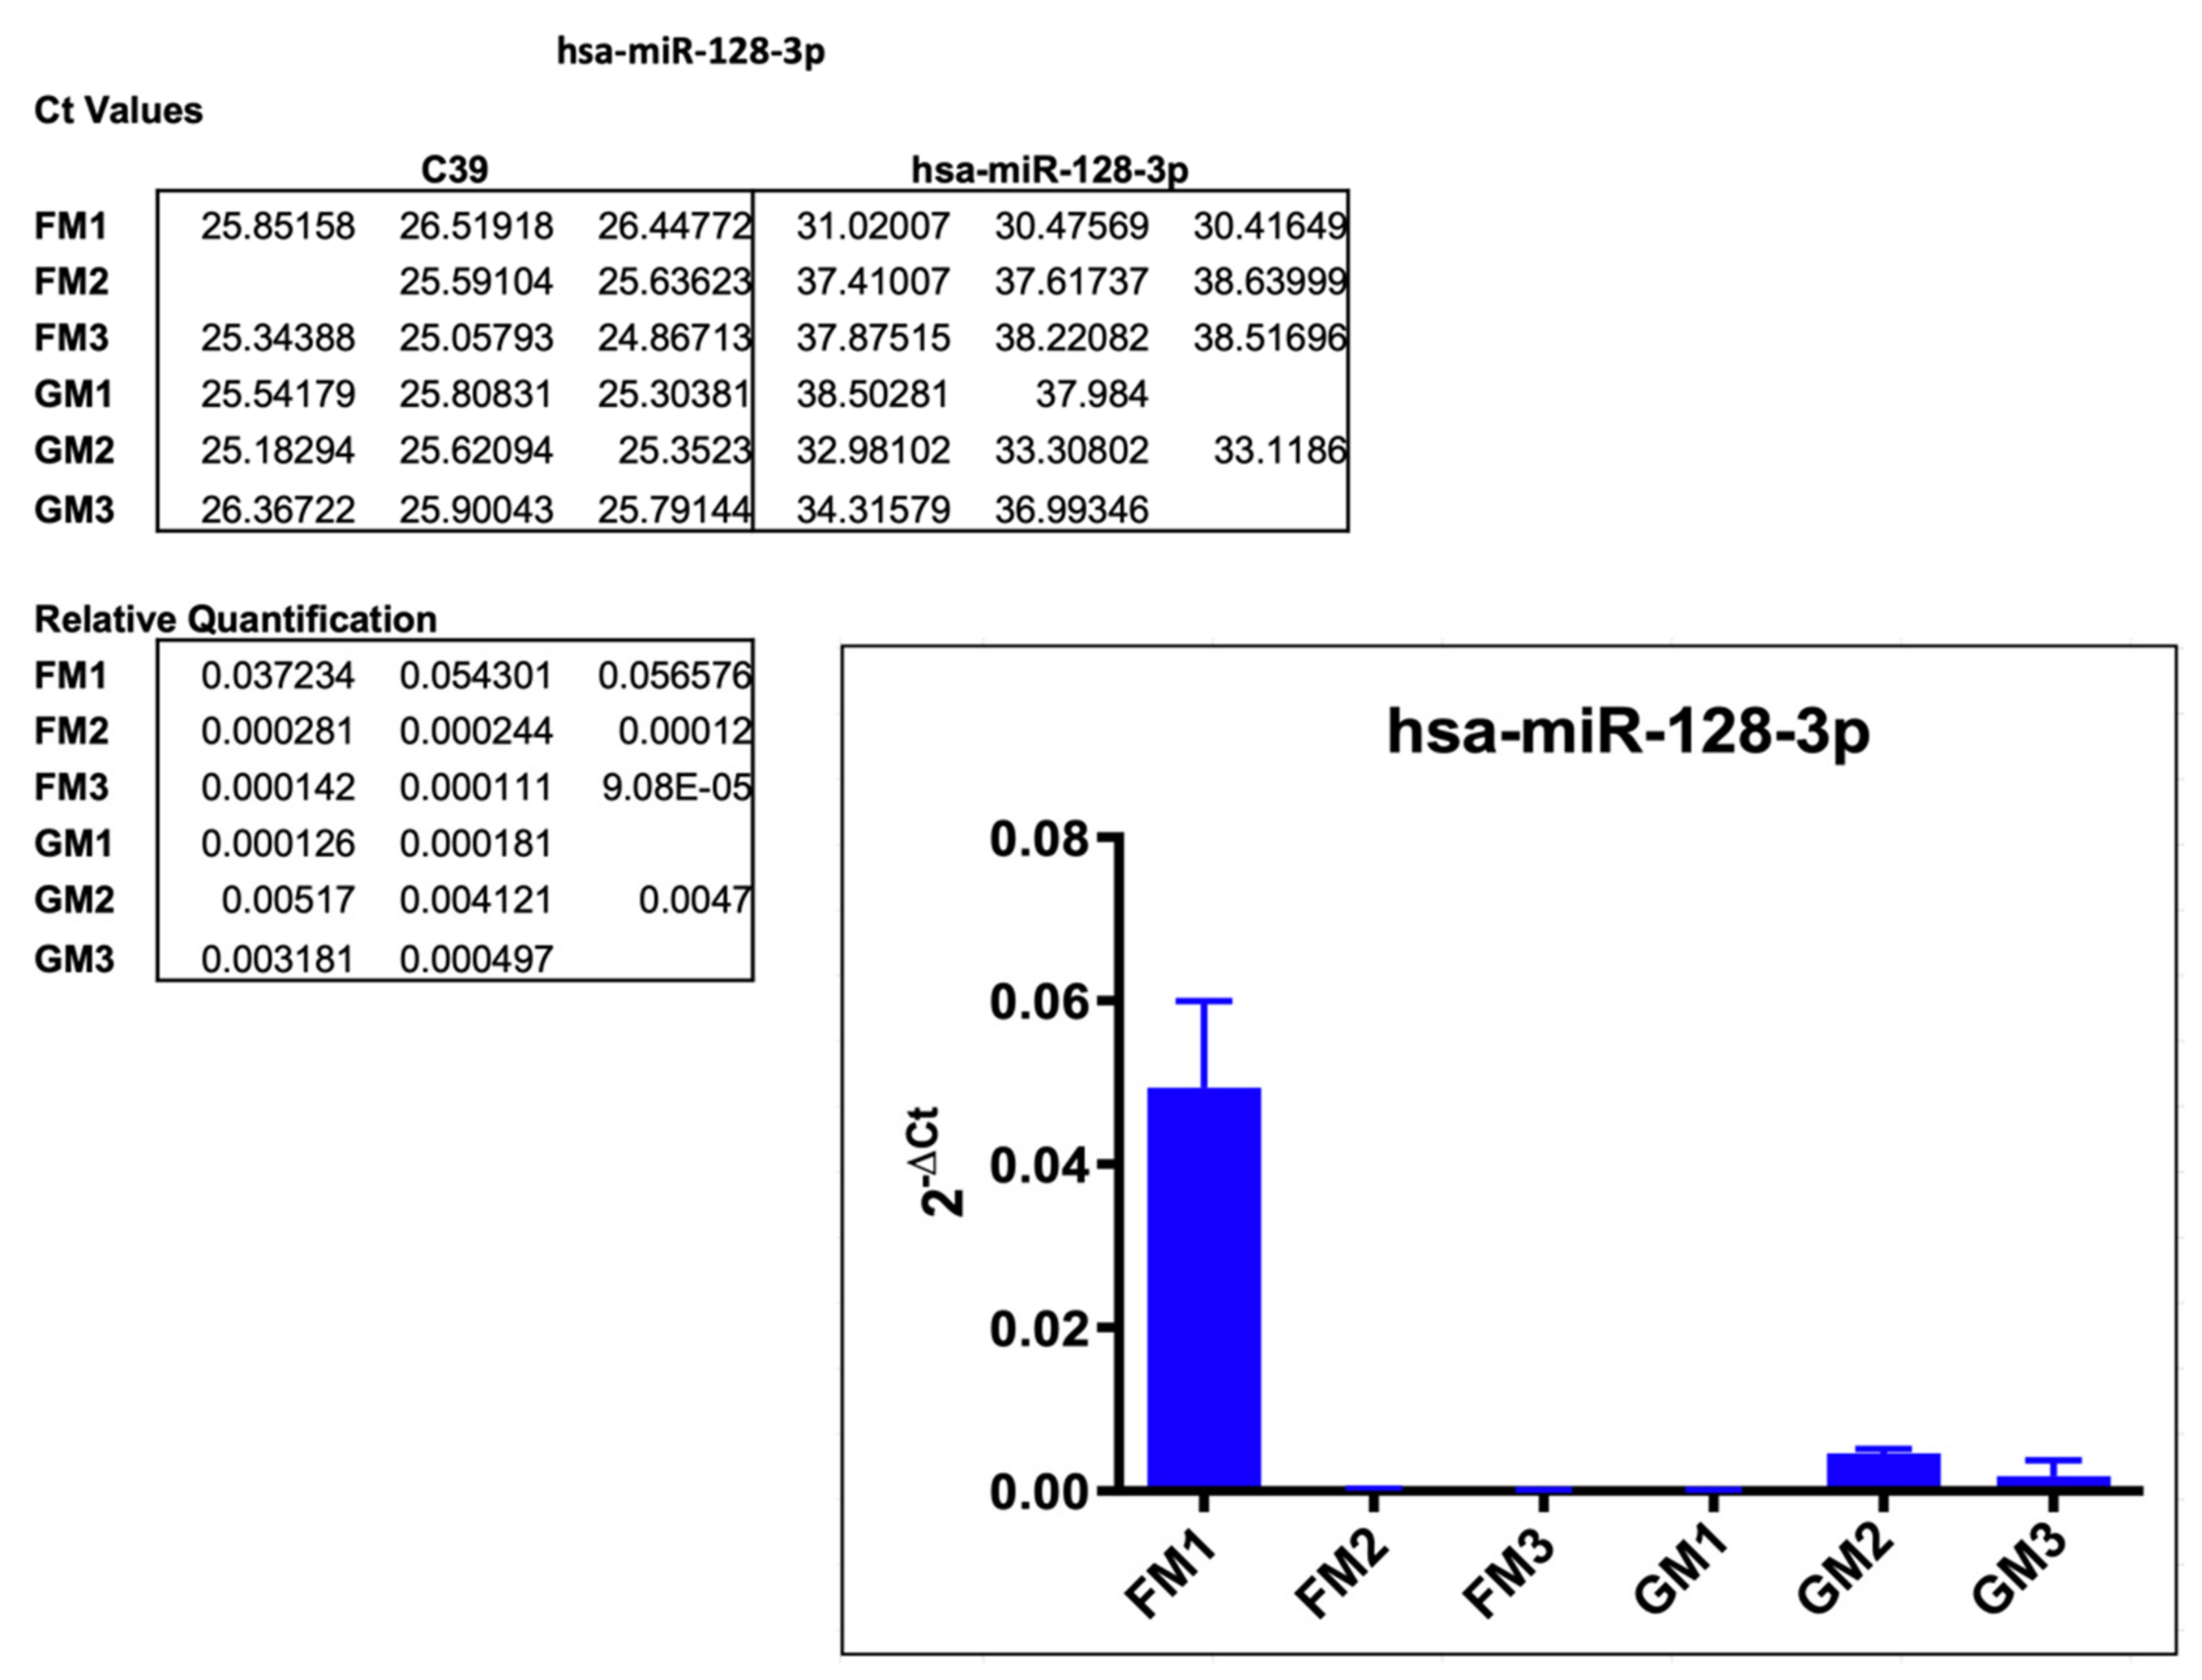
2.3.2. hsa-miR-128-3p

Based on a 77% decrease in miR-128-3p expression in the array scan, the results of the single assay analysis delivered mixed results. As depicted in Figure 5, FM2 and FM3 supported this trend amplifying at Ct values between 37.4 and 38.2, compared to the GM values ranging at an average of 34.1, leading to a relative quantification of 0.0002 and 0.0001 vs. 0.0046 and 0.0018 on average. FM1, on the other hand, showed an increase in expression at Ct values from 30.4 to 31 vs. GM at values at around 38, with the respective average in relative quantification of 0.049 (FM1) and 0.00015 (GM1). These inconsistent results may have various underlying reasons, as the positioning of the modules on the racks may have subjected these samples to varying extents of different in-flight stressors, such as space radiation or acceleration forces, as described in the discussion.

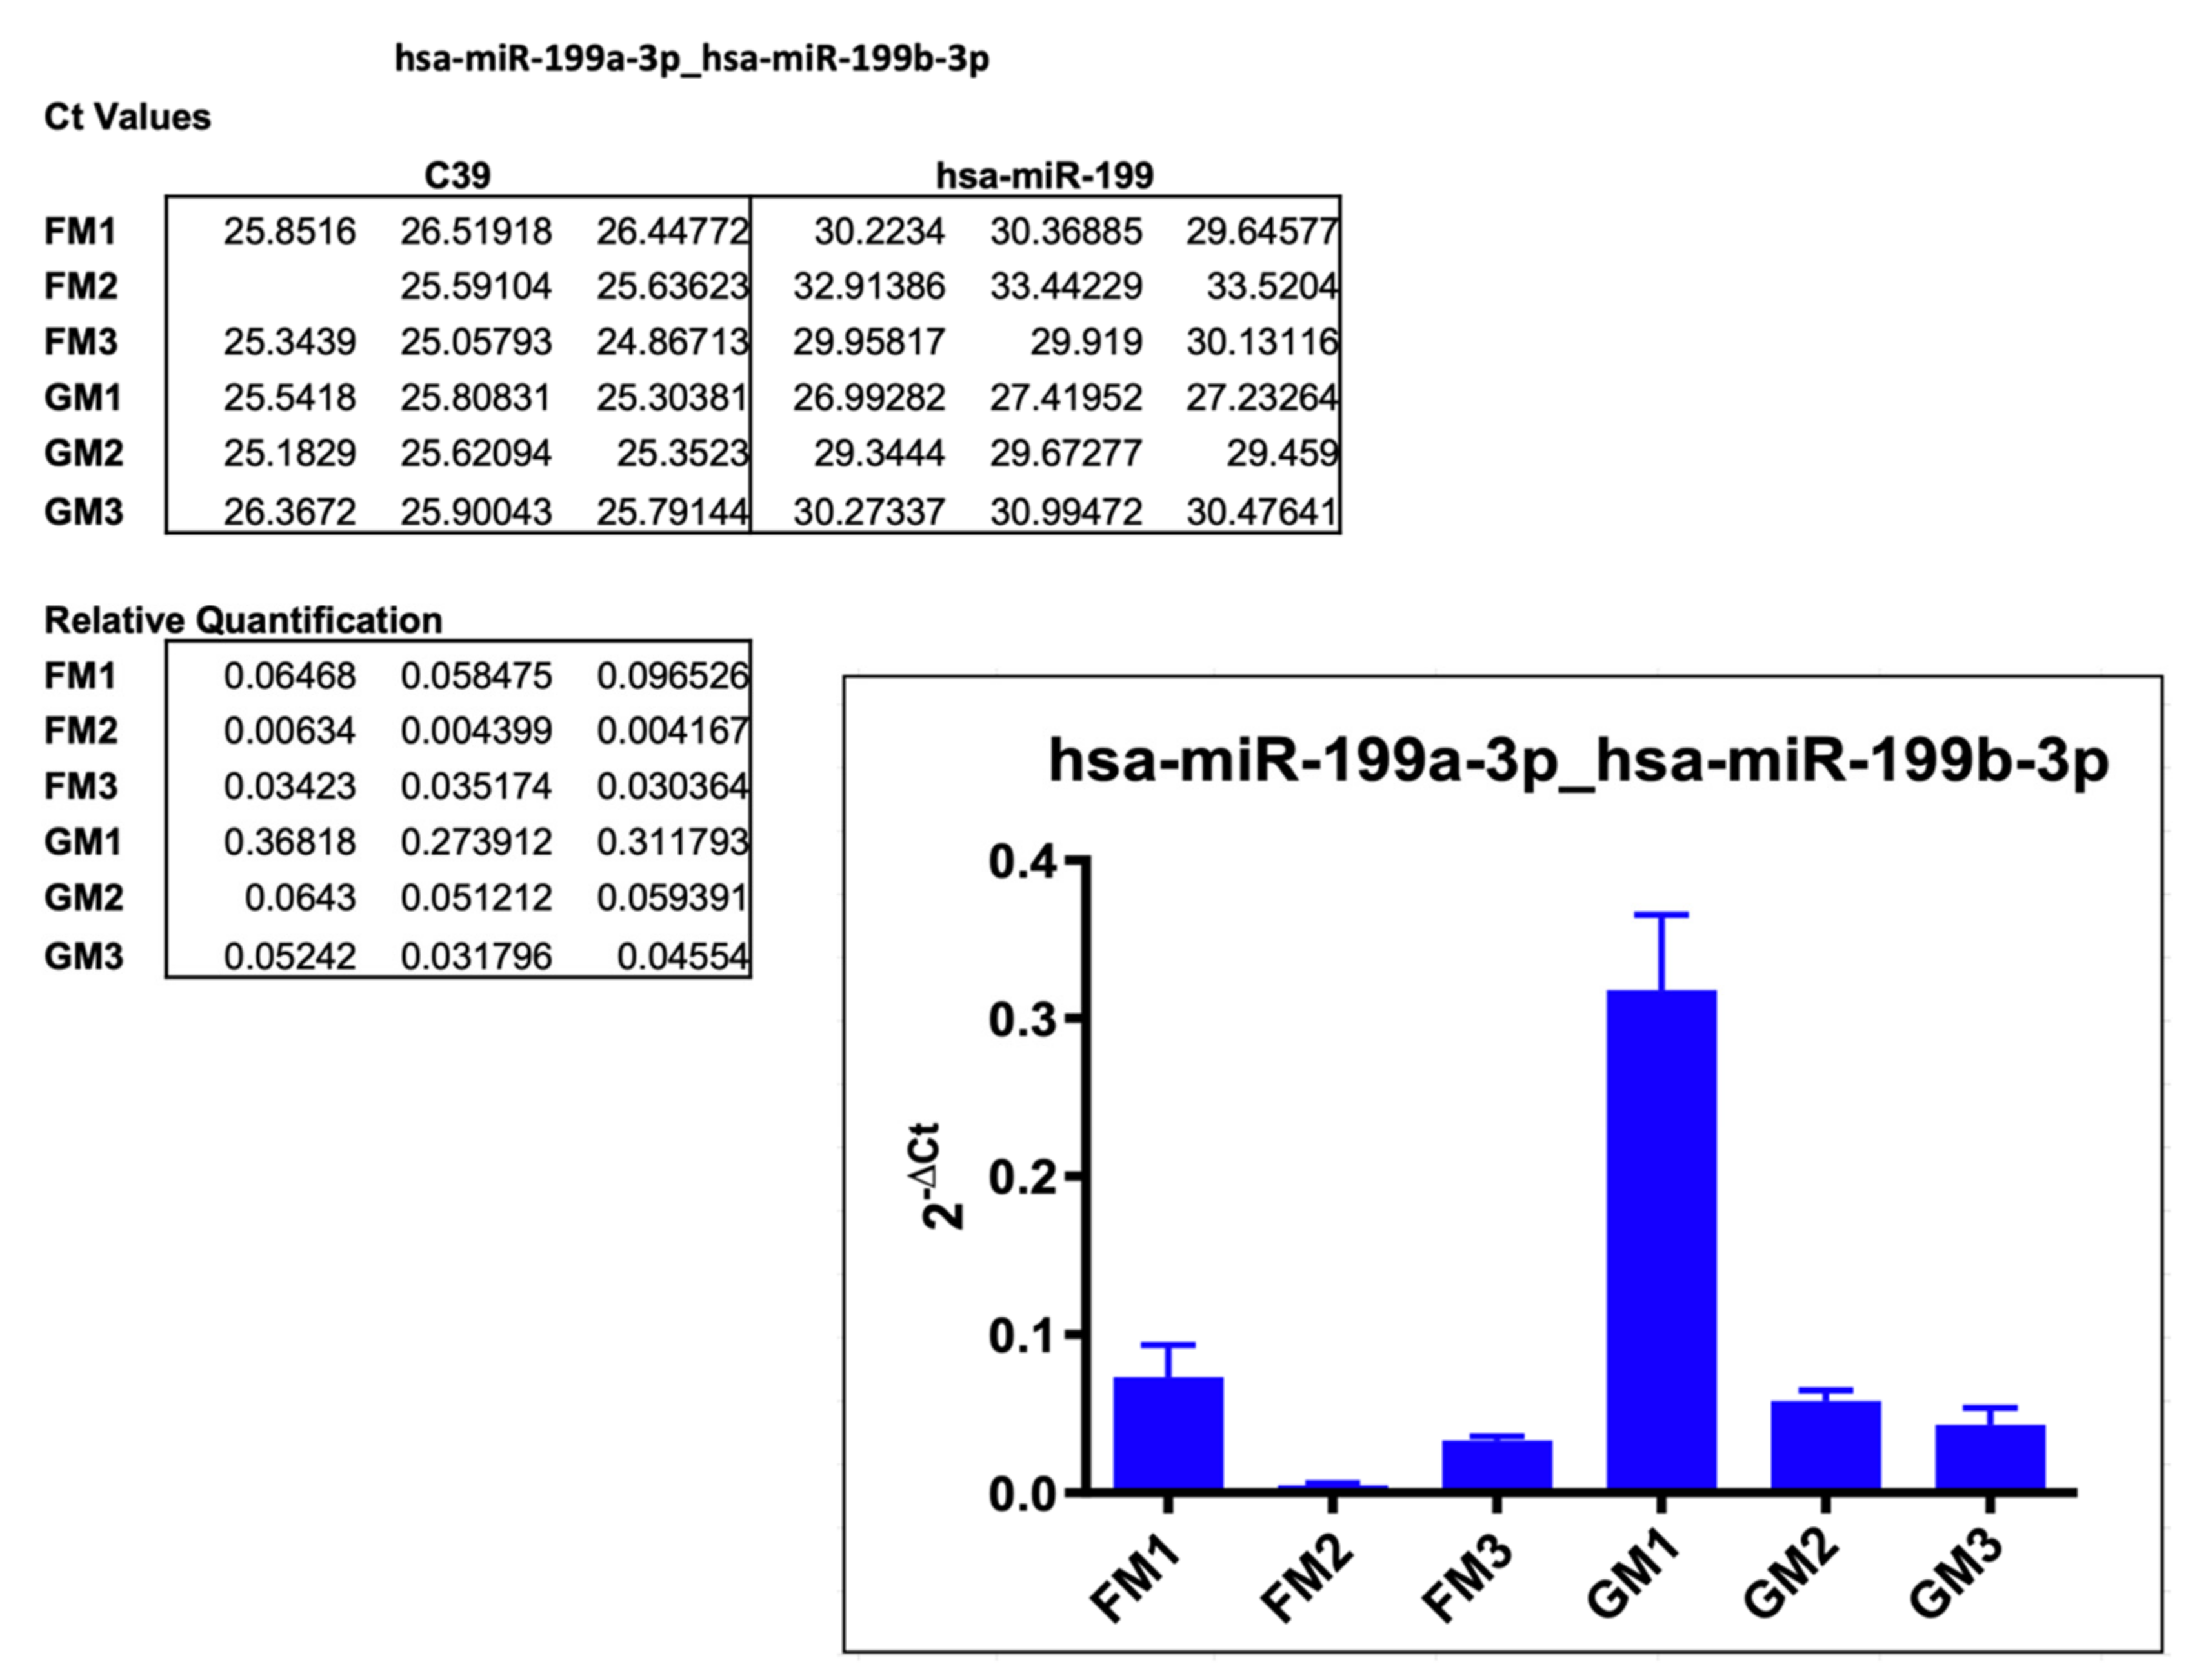
2.3.3. hsa-miR-199a-3p_hsa-miR199b-3p

The last miR chosen for validation via single assay was hsa-miR-199a-3p_hsa-199b-3p. The expression decrease in the array scan was 78% in FM vs. GM, and this trend could be validated across all three sample sets, as shown in Figure 6. With average relative quantification values of 0.07 vs. 0.31 (FM1 vs. GM1), 0.004 vs. 0.05 (FM2 vs. GM2), and 0.03 vs. 0.04 (FM3 vs. GM3), all exosomes isolated from FM contained a lower amount of miR-199. The underlying Ct values were in the range from 29.64 to 33.52, with an average of 31.12 (FMs) and 26.99 to 30.99 with an average of 29.09 (GMs).

3. Discussion

Ever since the first manned space missions, the experienced effects of microgravity on the human organism have been a focal point of space research. Overcoming these extensive changes and adaptations, which span from gene expression alterations and cellular modifications to physiological adjustments, is mandatory to successfully continue the quest of space exploration and travel. Extensive studies on the occurrent physiological adaptations to the cardiovascular, musculoskeletal, and sensorimotor systems and the implications of varying durations of spaceflight were undertaken, and processes to prepare and recondition space travelers were developed [92,93,94]. Still, despite all efforts and scientific advances, many questions remain unanswered and are challenging space explorers, so the search for further insights continues.
In recent years, our group has studied multiple cell culture systems regarding their genomic and proteomic adaptations resulting from exposure to various conditions of weightlessness [25,26,95,96]. One of these systems we have explored is thyroid cancer, an endocrine tumor of continuously increasing incidence over the last decades [97,98]. To expand our knowledge further and to better understand the underlying cellular pathways leading to the demonstrated changes, we decided to re-evaluate the CellBox-1 samples in regard to their EV content and composition. EVs have taken a prominent place in the rankings of intercellular communication and post-transcriptional proteomic regulation over the last decade, and their significance as disease biomarkers and potential pharmaceuticals should not be underestimated [31,99,100,101,102]. Recently, we described the changes in exosomal secretion and populations under prolonged exposure to microgravity in the human follicular thyroid cancer cell line FTC-133, which our group has studied in various conditions of weightlessness before [24,63,103]. In these preliminary experiments on the exosomal secretion, we determined the number of secreted vesicles, their size distribution, and their population regarding the tetraspanin surface expression to evaluate the influence of microgravity on changes in the cellular cross-talk [63].
The impact of non-coding RNAs on regulatory processes in cells has been found to be more and more prominent, particularly in tumor networks [104,105,106,107]. Small non-coding RNAs, or miRNAs, have been described as highly adaptable cargo in tumor-associated exosomes, secreted from not only tumor cells but also from tumor-associated cells or immune cells. Given the ever-growing, vast pool of knowledge in this field, as well as the availability of new methods to re-analyze the samples from our prior experiments, miRNAs suggested themselves as the next logical targets. To get an initial overview of any given changes in our flight samples compared to the ground controls, we set up an initial screen over a total of 754 miRNA targets using the TaqMan™ array methodology. Surprisingly, we found almost 120 miRNAs differentially expressed in our samples. To narrow the selection of targets of interest for further validation, we analyzed the list filtering for miRNAs previously reported in thyroid cancer. This resulted in a pool of 23 miRNAs, 2 of them overexpressed in FM compared to GM; the remaining 21 were downregulated (Figure 3). From this group, we selected three miRNAs to be validated in all CellBox-1 samples via TaqMan™ single assays.
Before discussing these miRNAs, we would like to direct the reader’s attention to one miRNA, which was neither part of the list of previously described in thyroid cancer targets and hence, was not further evaluated in this study. We would like to include and point out hsa-miR-553 in our discussion, particularly because of its extraordinary high expression difference in the array screening. As recorded in Table 1, the RQ value of the FM was 5.476, which corresponds to the quite astonishing increase of 448% compared to our calibrator, GM. hsa-miR-553 was first specified by Cummins et al. [108] in 2006 as part of the colorectal miRNAome, which was determined via an extensive screening of non-coding RNAs tags in human colorectal cells. Ever since this miRNA has been reported on only one more time in relation to a malignant disease: Liang et al. revealed that miR-553 promoted proliferation, metastasis, and tumor-associated macrophage (TAM) resistance in MCF-7 and MCF-7/TAMR breast cancer cells; and high expression levels of miR-599 was correlated with poor prognosis. The circular RNA circBMPR2 served as a miR-553 sponge and decreased the abundance of miR-553 in the cytoplasm, according to the authors. Vice versa, miR-553 overexpression could partly reverse the effects of circBMPR2 on breast cancer cells. Moreover, circBMPR2 and miR-553 could regulate the expression of each other, forming a negative-feedback loop [109]. Therefore, despite the impressive increase of hsa-miR-553, we decided to not further investigate this miRNA at this time but rather shift our focus on several of the tumor suppressors described in thyroid cancers, as this might offer valuable insights to pathways we have described in FTC-133 prior, and which could be targeted in an effort to reduce tumorigenicity or even point towards possible therapeutic approaches.
As mentioned previously, the oncomiRs are a promising and logical target in tumor and exosome research. Significantly in EVs, upregulated miRNAs can be easily measured via liquid biopsies, and with possible specificity to any particular cancer, can easily serve as biomarkers and for disease staging. However, in view of the possibilities that exosomes offer regarding cargo loading and targeted delivery, tumor suppressors are a much more fascinating topic to explore. The prospects in developing and using tumor suppressor-laden exosomes to specifically target tumor cells and to circumvent their adaptations to the tumor environment and the organism’s immune response are worth the efforts. Hence, we were focusing on three miRNAs previously distinguished as tumor suppressors in thyroid cancer and additionally downregulated in our FM sample. This downregulation would be consistent with an increase in malignancy as a result of the extended exposure to microgravity, which supports our previous results within this cell line and other cell systems we have worked with [24,26,27,103,110].

3.1. hsa-miR-429

hsa-miR-429 is a member of the miR-200 family, along with miR-200a, miR-200b, miR-200c, and miR-141, and its genetic location can be found on chromosome 1 [111]. The evidence points to an involvement of miR-429 dysregulation in EMT, progression, development, invasion, metastasis, apoptosis, and drug resistance [112,113,114]. Similar to many other miRNAs, miR-429 has been characterized in multiple different tissues and types of cancers and has been portrayed as a relevant contributor to tumorigenesis as either a tumor suppressor or promoter in very tumor-specific patterns [88,115,116,117]. Aside from thyroid cancer, tumor-suppressive properties have been reported for miR-429 in breast cancer, cervical cancer, gastric cancer, glioblastoma, and osteosarcoma, to only name a few. An association of miR-429 in tumor progression, proliferation, migration, invasion, and metastasis has been discussed in this regard, as well as the induction of apoptosis, cell cycle arrest, and drug resistance in instances [118]. Contrastingly, miR-429 has displayed oncogenic characteristics in lung cancer, prostate cancer, and endometrial carcinoma. Here also, the miR is correlated with tumor development, progression, proliferation, and drug resistance. In certain tumors, namely colorectal cancer, bladder cancer, and hepatocellular carcinomas, miR-429 still has a quite paradoxical role—it has been reported as up and downregulated in the same tissues with the concurrent results. The type of involvement is consistent with the previously described conditions [118].
In thyroid cancer, miR-429 was evaluated in clinical samples and cell lines alike. The study authors found miR-429 significantly decreased studying 59 pairs of primary tumors and nontumorous control tissues, and transfection of miR-429 in thyroid cancer cell lines substantially inhibited cell proliferation, migration, and invasion ability. Moreover, miR-429 upregulation-induced apoptosis in several cell lines. Zinc finger E-box-binding homeobox 1 (ZEB1) was identified as a direct target of miR-429, and miR-429 transfection could inhibit ZEB1 by direct binding to its 3′-untranslated region (3′-UTR). ZEB1 is a well-known player in cancer, driving EMT, metastasis, and therapy resistance in many human cancers [119,120,121]. ZEB1 owes its pivotal role to the downregulation of E-cadherin and the regulation of further proteins involved in tumor progression, such as Crumbs3, HUGL2, and PATJ (Pals1-associated tight junction). Therapy resistance is not only limited to chemotherapy resistance but is also reported to influence radioresistance [120,122]. Further, ZEB1 reportedly regulates the development of an inflammatory phenotype and the activation of macrophages towards TAMs [122,123]. These data clearly suggest a role as a tumor suppressor in this disease pattern; our recent results substantiate these findings. We found that hsa-miR-429 was downregulated 76% in FM compared to GM in our initial scan, but we could not solidly validate these results with the following single target assay.

3.2. hsa-miR-128-3p

Cleaved from the stem-loop hsa-miR-128-2, miR-128-3p is the main mature strand with reports in more than 150 published experiments. It has been described—besides cancer—in various diseases physiological processes, such as rheumatoid arthritis, multiple sclerosis, atrial fibrosis, and vascular disease, response to sepsis and acute kidney injury, osteogenesis and bone healing, to name a few [124,125,126,127,128,129]. Mets et al. reported miR-128-3p as a candidate for an oncomiR in T-cell acute lymphoblastic leukemia as it downregulates PHF6, which plays an important tumor-suppressive role in this disorder. Other than that, miR-128-3p is mainly described in cancer as a tumor suppressor by inhibiting most processes during tumor development and progression, and the examples are manifold. Downregulating this miR accelerates progression in prostate, ovarian, and breast cancer, and in cervical cancer proliferation, migration, and invasion increases with diminishing miR-129-3p levels [130,131,132,133,134]. Additionally, miR-128-3p has been shown to increase chemosensitivity in colorectal cancer after transmission via exosomes or nanoparticles, making it a prime target in the attempt to overcome therapy resistance.
In a study examining papillary thyroid cancer (PTC) and follicular thyroid carcinoma (FTC) tissues and various thyroid carcinoma cell lines, miR-128 expression was markedly downregulated. Functionally over-expressing the miR markedly inhibited cancer cell migration and invasion, and these processes were reversible by silencing miR-128 expressions in thyroid tumor cells, leading to reduced apoptosis, enhanced proliferation, and metastasis. These results were supported by an in vivo xenograft tumor model where the overexpression of miR-128 reduced the tumor growth rate and tumor weight [89]. Interestingly, miR-128 also seems to target ZEB1 in a tumor-suppressive manner. The circular RNA circ-ABCB10 is a strong promoter of tumorigenesis in breast and cervical cancer. Circ-ABCB10 acts as a sponge for miR-128, which in turn results in an increase in its direct target ZEB1, leading to augmented cell proliferation, migration, invasion, and inhibition of apoptosis in cervical cancer [135]. In esophageal squamous-cell cancer (ESCC), ZEB1 is a crucial mediator of epithelial-mesenchymal transition and induces malignant progression. In their study, Zhao et al. found that miR-128-3p was downregulated in ESCC tissues and cells and downregulated expression of miR-128-3p was testified to be associated with poor prognosis of ESCC patients. In vitro and in vivo, the authors demonstrated that miR-128-3p could suppress cell migration, invasion, and metastasis [136]. As with miR-429, our array scan shows a downregulation of miR-128-3p, and we were able to verify this in two samples during the single assay analysis. This is in accordance with a rise in tumorigenicity in the FM samples in FTC-133 and a development towards a more aggressive phenotype, which has been observed in previous studies.

3.3. hsa-miR-199

The hsa-miR-199 family consists of three stem-loops, which all are cleaved into two mature miRNAs: hsa-miR-199b, hsa-miR-199a-1, and hsa-miR-199a-2. As listed in Table 1, in our initial screening array, we found three mature miRs of this family downregulated, miR-199a-3p, miR-199b-3p, and miR-199a-5p, and all three of these have been previously described in thyroid cancers as tumor suppressors [84]. The selection to validate miR-199a-5p was made due to mechanical advantages. As all previously-discussed miRs, hsa-miR-199a-5p has been reported as an oncomiR in a few malignancies, but mostly the mature l miRs of the entire family has been associated with tumor suppression. Our chosen target inhibits proliferation, migration, and invasion in colorectal cancer by negatively regulating integrin α3β1 (ITGA3), which has been linked to intercellular communication and serves an important role in the signaling among cells and the extracellular matrix. In addition, it was suggested that miR-199a-5p overexpression suppresses the EMT of colorectal cancer cells, whereas the overexpression of ITGA3 restores this effect [137]. The same holds true by looking at another miR199a-5p direct target, ROCK1 (Rho-associated coiled coil-containing protein kinase 1), Zhu and colleagues demonstrated in their study that microRNA-199a-5p was significantly downregulated in colorectal cancer cell lines and tissue samples and was associated with a poor prognostic phenotype. MicroRNA-199a-5p suppressed colorectal cancer cell proliferation, migration, and invasion and induced cell apoptosis [138]. Contrastingly, in cervical cancer, miR-199a-5p promotes the same aspects—proliferation, migration, and EMT—via direct targeting of protein inhibitors of activated signal transducer and activators of transcription 3 (PIAS3). PIAS3 is a regulator protein of other key transcription factors, including MITF, NFκB, SMAD, and estrogen receptors [139,140].
Looking at thyroid tumors, the miR-199 family has been reported as aiding in the suppression of cell proliferation, invasion, metastasis, and enhancing apoptosis. The ectopic expression level of miR-199b-5p in papillary thyroid carcinoma cell B-CPAP could inhibit growth, migration, and invasion, as well as epithelial-mesenchymal transition (EMT) and decreased cell metastasis in vivo, and alongside it improved the sensitivity of thyroid carcinoma cells to chemotherapy. Silencing miR-199b-5p caused contradictory outcomes [84,141]. miR-199a-3p also seems to play an important role in tumor inhibition. A link between miR-199a-3p expression in thyroid tissues and clinicopathologic features was evaluated by Liu and colleagues, as well as its potential usefulness in prediction for invasion and metastasis of PTC [84,90]. Lastly, miR-199a-5p has been depicted as an inhibitor of progression, cell proliferation, migration, and invasion and a promoter of apoptosis in PTC [91,142]. In addition, it was identified as a potential diagnostic biomarker in this disease [143]. Turning our attention to follicular thyroid carcinoma, the tumor type corresponding with our CellBox-1 samples, mir-199a-5p, has been reported to act via suppressing connective tissue growth factor (CTGF). Through comparison of clinical FTC samples and physiological controls, an under-expression of miR-199a-5p in FTC tissue samples combined with overexpression of CTGF was identified, proving a negatively correlated relationship between CTGF and miR-199a-5p [144]. In this miR, our study results clearly demonstrate a reduction in expression across the array scan, as well as the individual single assay analysis, which explains a development towards a more tumorigenic state of the FM samples in deactivating the tumor-suppressive potency of this group of miRs. With a decrease of miR-199 expression, the aggressiveness and invasiveness of the tumor cells should increase, and previous studies have pointed to such a development after exposure to microgravity conditions due to the various stressors the cells are subjected to [145].
To tie in this miR with the two previously discussed, miR-199a-5p also targets ZEB1 in multiple malignancies. It confers a tumor-suppressive role in triple-negative breast cancer (TNBC), in retarding proliferation, migration, invasion, and stem cell-like characteristics. The authors demonstrated modulation of EMT genes and stem cancer markers and suspect that miR-199a-5p may be involved in chemotherapy sensitivity in TNBC [146]. Further, through targeting ZEB1, miR-199a-5p inhibits EMT of ovarian ectopic endometrial stromal cells via the PI3K/Akt/mTOR signal pathway and in human renal tubular epithelial cells [147,148].
All in all, our studies show solid support for the hypothesis that these miRs have a role in reducing tumorigenesis in thyroid cancer. Their decrease in FM samples, as shown in the scan and the majority of single assays, match the previously-described intensification of oncogenic properties in thyroid cancer cells after subjection to s- and r-μg. The variance in some samples could be due to the exact positioning of the FMs during the spaceflight, which would subject the cells to different intensities of various other stressors besides microgravity, such as space irradiation, to just name one. This study shows once more the difficulties one is facing in space research since every change in the external conditions may lead to unexpected or never-before observed adaptations.
It has been amply demonstrated that post-transcriptional protein regulation through miRNAs is manifold but also very specific in regard to the particular tissues and environments. However, with this in mind, the possibilities of finding common denominators within the vast number of targets are always abounded. As shown in this publication, microRNA research is a great starting point to find new angles and viewpoints to an otherwise well-known picture. This holds true for the additional angle of microgravity research. Our group has demonstrated the benefit of utilizing real or s-μg in solving some of the riddles of tumor biology despite the challenges. With the aid of recently-developed methods and technical advances in exosome and miRNA research, we are opening another door to a better understanding of cancer and to the development of new therapeutic routes to battle this devastating disease.

4. Materials and Methods

4.1. Cell Cultures

Human follicular thyroid cancer cells (FTC-133), purchased from the Health Protection Agency Culture Collections (HPACC, Salisbury, UK), were cultured in RPMI-1640 (Invitrogen, Eggenstein, Germany), supplemented with 10% fetal calf serum (FCS, Biochrom, Berlin, Germany), penicillin (100 U/mL; Merck Millipore, Burlington, MA, USA), and streptomycin (100 µg/mL; Merck Millipore) at 37 °C and 5% CO2, as described previously [26]. Prior to the start of the experiment, 106 cells were loaded into an automated cell culture system, the FM hardware [24], or alternatively seeded in T-25 culture flasks for the ground control experiments. The medium exchange and cell fixation at the experimental endpoint were automated following a preset schedule [25].

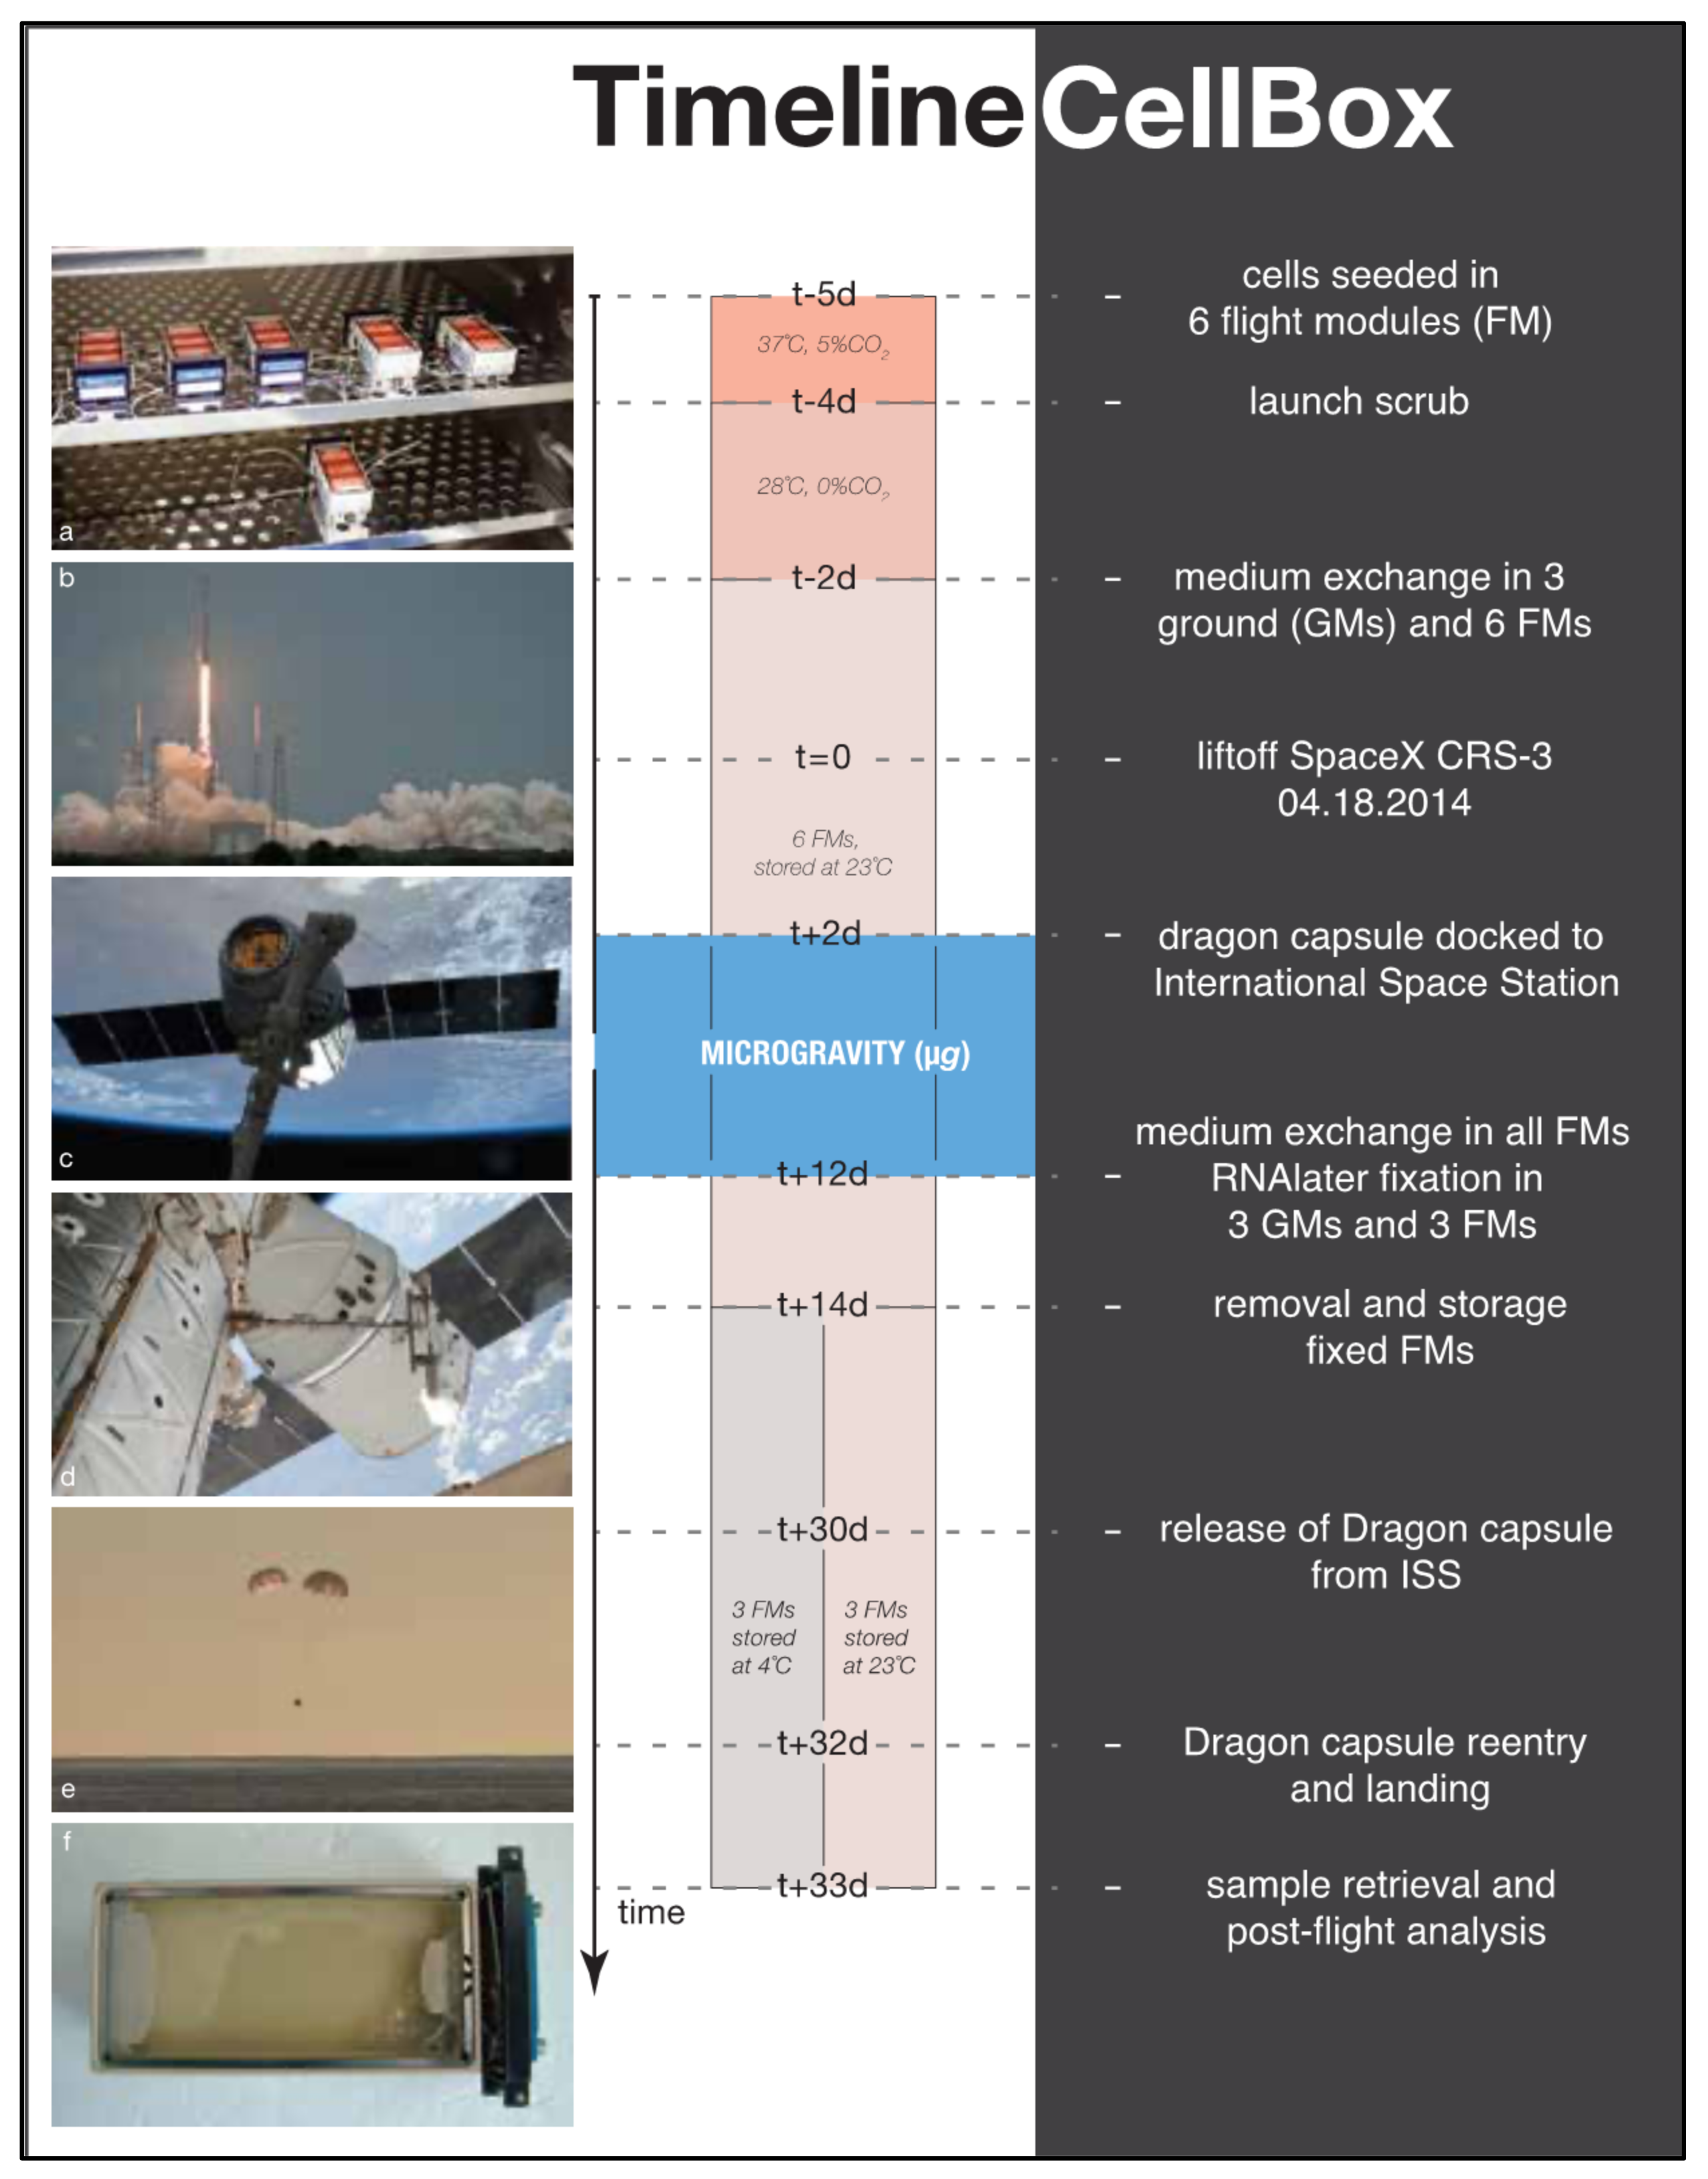
4.2. CellBox-1 Spaceflight Experiment

The CellBox-1 spaceflight experiment was conducted as part of the SpaceX CRS-3 Commercial Resupply Service mission, launched on 18 April 2014 (https://www.dlr.de/content/de/bilder/2014/2/start-des-des-cellbox-experiments_15157.html), Riwaldt et al. reported methods and results in detail [25]. In short, 1 × 10⁶ FTC-133 were seeded in nine cell containers (FM) and incubated at 37 °C and 5% CO2. Twenty-four hours prior to launch, three FMs were transferred to an incubation chamber at 23 °C at Cape Canaveral to serve as ground controls (GM). The remaining six FMs were moved to the Dragon capsule and flown to the International Space Station (ISS). Upon arrival at the ISS, the FMs were incubated continuously at 23 °C at a g-force oscillating around ±0.005 g. After 12 days of microgravity, the cells of three FMs were fixed using RNAlater via an automated process [24], collecting the aspirated media. The remaining three FMs were continuously incubated at 23 °C for the remainder of the spaceflight and, therefore, were not included in this analysis. The GMs were treated identically and simultaneously on the ground. Forty-eight hours post-fixation, both the FMs and GMs were cooled to 4 °C. After the return of the Dragon vessel on 20 May 2014, all containers were returned to the lab for cell and cell supernatant harvest (Figure 7).

4.3. Exosome Harvest and Isolation

Following harvest, the cell supernatants of the FMs and GMs underwent an adjusted differential centrifugation protocol [149]. Two consecutive spins at 300× g (10 min, 4 °C) using a swinging bucket rotor, followed by centrifugation at 2500× g (15 min, 4 °C, twice) pelleted cells, cell debris, and large vesicles. Additional high-speed centrifugation was not necessary as the analysis via ExoView® does not require preceding particle isolation. The collected supernatants were divided into 2 mL aliquots and stored at −80 °C until further analysis.

4.4. TaqMan™ Advanced miRNA Arrays

As previously reported, we have analyzed the CellBox-1 samples regarding their exosome number, size distribution and tetraspanin colocalization pattern via ExoView using the EV-TETRA-C ExoView Tetraspanin Kit (NanoView Biosciences, Boston, MA, USA) [63]. One sample each was used for further analysis of the miRNA content and to scan for expression changes. The method of choice was the TaqMan™ Advanced miRNA Array, using the Human A and B Cards (ThermoFisher Scientific, Waltham, MA, USA) according to the manufacturer’s protocol. In summary, following the exosome harvest, the total RNA cargo was isolated, and the miRNA present was transcribed into cDNA via a TaqMan™ Advanced miRNA cDNA Synthesis Kit (ThermoFisher Scientific, Waltham, MA, USA). The resulting cDNA template was diluted 1:10 and mixed with the remaining reaction components (TaqMan® Fast Advanced Master Mix (2x), ThermoFisher Scientific, Waltham, MA, USA, RNase-free water) and applied onto the array cards. The sealed cards were loaded into the 7900HT Fast Real-Time PCR System with 384-Well Block Module (ThermoFisher Scientific, Waltham, MA, USA) and amplified with the following thermal protocol (Table 2).
Table 2. TaqMan™ Advanced miRNA Array Thermal Protocol.
StepTemperatureTimeCycles
Enzyme activation92 °C10 min1
Denature95 °C1 s40
Anneal/Extend60 °C20 s
Figure 7. Timeline CellBox-1 experiment. (a) 1x10⁶ FTC-133 thyroid cancer cells seeded in six flight modules (FMs) incubated at 37 °C, 5%CO2. (b) Falcon-9 launches within Cargo Resupply Services mission 3 (SpaceX CRS-3). (c) Dragon capsule adjacent to International Space Station (ISS). (d) SpaceX capsule docked to ISS. (e) Capsule reentry and Pacific Ocean landing. (f) Flight module inspection before post-flight analysis (picture a courtesy RaisFoto, pictures b-e photo credit SpaceX).
Ijms 22 12841 g007
The analysis of the results was carried out with ThermoFisher’s ExpressionSuiteTM Software and displayed as a Comparative Ct (ΔΔCt).

4.5. Exosome Isolation by Size Exclusion Chromatography

The samples were centrifuged at 300× g for 10 min, followed by centrifugation at 3000× g for 10 min. The clarified supernatant was then concentrated to approximately 500 μL on a 100 KD Amicon Ultra Centrifugal filter (Millipore, Temecula, CA, USA). The exosomes were then isolated from the concentrated supernatant by size exclusion chromatography (SEC). Sephacryl S-300 High Resolution (GE Healthcare, Chicago, IL, USA) was packed on a glass econo-column chromatography column (BioRad, Hercules, CA, USA) (10 cm height, 1.5 cm diameter). The column was washed with 0.32% Sodium Citrate in PBS, and the supernatant was loaded onto the column and allowed to enter the resin by gravity flow. The eluate was collected in 23 fractions of 15 drops (~500 μL) on a Model 2110 Fraction Collector (BioRad, Hercules, CA, USA). For each fraction, the presence of exosomes was determined by nanoparticle tracking analysis as described below. The exosome-containing fractions were then further concentrated to 1/100th of the original supernatant.

4.6. Exosome Characterization by Nanoparticle Tracking Analysis

The isolated exosomes were analyzed with a NanoSight NS300 (Malvern Panalytical Inc., Westborough, MA, USA). The NS300 allows rapid analysis of the size distribution and concentration of all types of nanoparticles from 0.01 to 1 µm in diameter. Particles in liquid suspension were loaded into a sample chamber, which is illuminated by a laser beam. Particles in the path of the beam scatter the laser light and is viewed with a digital camera, which captures a video of the particles moving under Brownian motion. The Nanoparticle Tracking Analysis (NTA) software analyses the particles individually and simultaneously (particle-by-particle), and by using the Stokes Einstein equation, calculates their hydrodynamic diameters [150].

4.7. TaqMan™ Advanced Single-Tube miRNA Assays

The validation of our selected miRNA target followed the protocol described above in Section 4.4., differing in the use of single-tube assays for hsa-miR-429, hsa-miR-128-3p, and hsa-miR-199a-5p rather than array cards and the use of C. elegans miR-39 as a normalizer (C39). Exosomes, and subsequently the contained RNA, were isolated from the remaining FM and GM as described above. After transcription of the received miRNA to cDNA (TaqMan™ Advanced miRNA cDNA Synthesis Kit, ThermoFisher Scientific, Waltham, MA, USA), the targets were quantitatively amplified using the thermal protocol below (Table 3) using a CFX96 Touch Real-Time PCR System and analyzed with the CFX Maestro Software (Bio-Rad Laboratories, Inc., Hercules, CA, USA).

5. Conclusions

Our study results emphasize that exosomes and exosomal miRNAs can be critical tools to tie together the knowledge the microgravity research community has gathered so far. Even though this report focuses solely on thyroid cancers, the importance of the roles of exosomes and miRNAs in understanding and validating phenomena previously described is eminent. The use of cutting-edge technologies enabled us to further describe the cellular changes space travelers are subjected to, even years after the actual mission. Additionally, these analyses once again show how adaptable tumor cells react to even the slightest changes in the surrounding environment, be it microgravity or other related stressors. Further studies will certainly unravel and solidify necessary links on the path to finding a cure for cancer.

Supplementary Materials

Author Contributions

Conceptualization, P.M.W. and D.G.; methodology, P.M.W. and P.N.; software, P.M.W. and P.N.; validation, D.G., P.M.W. and M.W.; formal analysis, P.M.W. and P.N.; investigation, P.M.W., P.N., S.R., M.W. and M.B.; resources, M.B., M.I. and D.G.; writing—original draft preparation, P.M.W.; writing—review and editing, D.G., T.J.C., M.K. and M.W.; visualization, P.M.W. and M.K.; supervision, D.G. and P.M.W.; project administration, D.G.; funding acquisition, D.G. and M.I. All authors have read and agreed to the published version of the manuscript.

Funding

This research was funded by Deutsches Zentrum für Luft- und Raumfahrt (DLR), BMWi projects 50WB1524 and 50WB1924 (D.G.).

Institutional Review Board Statement

Not applicable.

Informed Consent Statement

Not applicable.

Data Availability Statement

Not applicable.

Acknowledgments

The authors like to thank the DLR Space Administration, Bonn, Germany, for giving us the opportunity to participate in the SpaceX CRS-3 Mission. Finally, we would like to thank NASA, the companies SpaceX, and Airbus Defense and Space for bringing our cells to the International Space Station. This work was performed with the support of the ExtraCellular Vesicle Core at The Saban Research Institute of Children’s Hospital Los Angeles.

Conflicts of Interest

The authors declare no conflict of interest.

Abbreviations

ABAntibody
CTGFConnective Tissue Growth Factor
C39C. elegans miR-39
EMTEpithelial to Mesenchymal Transition
ESCCEsophageal Squamous-Cell Cancer
EVExtracellular Vesicle
GMGround Module
FMFlight Module
FTCFollicular Thyroid Carcinoma
ILVIntraluminal Vesicle
MVBsMultivesicular Bodies
ITGA3Integrin α3β1
MTCMedullary Thyroid Carcinoma
NTANanoparticle Tracking Analysis
ONOvernight
PTCPapillary Thyroid Cancer
RISCRNA-induced Silencing Complex
ROCK1Rho-associated Coiled Coil-containing Protein Kinase 1
RPMRandom Positioning Machine
RQRelative Quantification
RTRoom Temperature
r-μgReal Microgravity
s-μgSimulated Microgravity
SECSize Exclusion Chromatography
SDStandard Deviation
SP-IRISSingle-Particle Interferometric Reflectance Imaging Sensor
TAMTumor Associated Macrophage
TMETumor Microenvironment
TNBCTriple-negative Breast Cancer
ZEB1Zinc Finger E-box-binding Homeobox 1

References

  1. NASA. First Human-Made Object to Enter Space. Available online: https://www.nasa.gov/mission_pages/explorer/bumper.html (accessed on 6 September 2021).
  2. NASA. Space Programs. Available online: http://adc.gsfc.nasa.gov/adc/education/space_ex/probes.html (accessed on 6 September 2021).
  3. Mann, A. The Vostok Program: The Soviet’s First Crewed Spaceflight Program. Available online: https://www.space.com/vostok-program.html (accessed on 6 September 2021).
  4. SpaceX Space Station. Transporting Humans to the Orbiting Laboratory. Available online: https://www.spacex.com/human-spaceflight/iss/index.html (accessed on 6 September 2021).
  5. Davenport, J. Virgin Galactic Successfully Flies Six Person Crew Including Founder Sir Richard Branson. Available online: https://www.nasaspaceflight.com/2021/07/virgin-galactic-fly-founder-branson/ (accessed on 6 September 2021).
  6. Davenport, J. Blue Origin Launches First Crewed Flight with Four Crew, Including Founder Jeff Bezos and “Mercury 13” Aviatrix Wally Funk. Available online: https://www.nasaspaceflight.com/2021/07/blue-origin-first-crew/ (accessed on 6 September 2021).
  7. Baldwin, K.M. Effect of spaceflight on the functional, biochemical, and metabolic properties of skeletal muscle. Med. Sci. Sports Exerc. 1996, 28, 983–987. [Google Scholar] [CrossRef]
  8. Baldwin, K.M.; White, T.P.; Arnaud, S.B.; Edgerton, V.R.; Kraemer, W.J.; Kram, R.; Raab-Cullen, D.; Snow, C.M. Musculoskeletal adaptations to weightlessness and development of effective countermeasures. Med. Sci. Sports Exerc. 1996, 28, 1247–1253. [Google Scholar] [CrossRef] [PubMed]
  9. Stampi, C. Sleep and Circadian Rhythms in Space. J. Clin. Pharmacol. 1994, 34, 518–534. [Google Scholar] [CrossRef] [PubMed]
  10. Strollo, F. Hormonal changes in humans during spaceflight. Adv. Space Biol. Med. 1999, 7, 99–129. [Google Scholar] [PubMed]
  11. Taylor, G.R. Overview of spaceflight immunology studies. J. Leukoc. Biol. 1993, 54, 179–188. [Google Scholar] [CrossRef] [PubMed]
  12. White, R.J. Averner, M. Humans in space. Nature 2001, 409, 1115–1118. [Google Scholar] [CrossRef]
  13. White, R.J. Weightlessness and the human body. Sci. Am. 1998, 279, 58–63. [Google Scholar] [CrossRef] [PubMed]
  14. Garrett-Bakelman, F.E.; Darshi, M.; Green, S.J.; Gur, R.C.; Lin, L.; Macias, B.R.; McKenna, M.J.; Meydan, C.; Mishra, T.; Nasrini, J.; et al. The NASA Twins Study: A multidimensional analysis of a year-long human spaceflight. Science 2019, 364, 6436. [Google Scholar] [CrossRef]
  15. Battista, N.; Meloni, M.A.; Bari, M.; Mastrangelo, N.; Galleri, G.; Rapino, C.; Dainese, E.; Agrò, A.F.; Pippia, P.; Maccarrone, M. 5-Lipoxygenase-dependent apoptosis of human lymphocytes in the International Space Station: Data from the ROALD experiment. FASEB J. 2012, 26, 1791–1798. [Google Scholar] [CrossRef]
  16. Hoson, T.; Kamisaka, S.; Masuda, Y.; Yamashita, M.; Buchen, B. Evaluation of the three-dimensional clinostat as a simulator of weightlessness. Planta 1997, 203, S187–S197. [Google Scholar] [CrossRef]
  17. Maccarrone, M.; Battista, N.; Meloni, M.; Bari, M.; Galleri, G.; Pippia, P.; Cogoli, A.; Finazzi-Agrò, A. Creating conditions similar to those that occur during exposure of cells to microgravity induces apoptosis in human lymphocytes by 5-lipoxygenase-mediated mitochondrial uncoupling and cytochrome c release. J. Leukoc. Biol. 2003, 73, 472–481. [Google Scholar] [CrossRef]
  18. Van Loon, J. Some history and use of the random positioning machine, RPM, in gravity related research. Adv. Space Res. 2007, 39, 1161–1165. [Google Scholar] [CrossRef]
  19. Herranz, R.; Anken, R.; Boonstra, J.; Braun, M.; Christianen, P.C.; de Geest, M.; Hauslage, J.; Hilbig, R.; Hill, R.J.; Lebert, M.; et al. Ground-based facilities for simulation of microgravity: Organism-specific recommendations for their use, and recommended terminology. Astrobiology 2013, 13, 1–17. [Google Scholar] [CrossRef] [Green Version]
  20. Pietsch, J.; Bauer, J.; Egli, M.; Infanger, M.; Wise, P.; Ulbrich, C.; Grimm, D. The effects of weightlessness on the human organism and mammalian cells. Curr. Mol. Med. 2011, 11, 350–364. [Google Scholar] [CrossRef] [PubMed]
  21. Schwarzenberg, M.; Pippia, P.; Meloni, M.A.; Cossu, G.; Cogoli-Greuter, M.; Cogoli, A. Signal transduction in T lymphocytes--a comparison of the data from space, the free fall machine and the random positioning machine. Adv. Space Res. 1999, 24, 793–800. [Google Scholar] [CrossRef]
  22. German Aerospace Center, DLR. Germany and China—Joint Experiments in Space. Available online: https://www.dlr.de/content/en/downloads/news-archive/2011/20111101_germany-and-china---joint-experiments-in-space_1805.pdf?__blob=publicationFile&v=10 (accessed on 6 September 2021).
  23. Kramer, C.D.; Kalla, E.M. The challenge of designing biomedical equipment during human research for long duration low-gravity NASA missions. In Proceedings of the 1997 16th South Biomed Engineer Conference, Biloxi, MS, USA, 4–6 April 1997; pp. 30–37. [Google Scholar]
  24. Pietsch, J.; Ma, X.; Wehland, M.; Aleshcheva, G.; Schwarzwälder, A.; Segerer, J.; Birlem, M.; Horn, A.; Bauer, J.; Infanger, M.; et al. Spheroid formation of human thyroid cancer cells in an automated culturing system during the Shenzhou-8 Space mission. Biomaterials 2013, 34, 7694–7705. [Google Scholar] [CrossRef]
  25. Riwaldt, S.; Pietsch, J.; Sickmann, A.; Bauer, J.; Braun, M.; Segerer, J.; Schwarzwälder, A.; Aleshcheva, G.; Corydon, T.J.; Infanger, M.; et al. Identification of proteins involved in inhibition of spheroid formation under microgravity. Proteomics 2015, 15, 2945–2952. [Google Scholar] [CrossRef]
  26. Riwaldt, S.; Bauer, J.; Pietsch, J.; Braun, M.; Segerer, J.; Schwarzwälder, A.; Corydon, T.J.; Infanger, M.; Grimm, D. The Importance of Caveolin-1 as Key-Regulator of Three-Dimensional Growth in Thyroid Cancer Cells Cultured under Real and Simulated Microgravity Conditions. Int. J. Mol. Sci. 2015, 16, 28296–28310. [Google Scholar] [CrossRef] [PubMed]
  27. Riwaldt, S.; Bauer, J.; Wehland, M.; Slumstrup, L.; Kopp, S.; Warnke, E.; Dittrich, A.; Magnusson, N.E.; Pietsch, J.; Corydon, T.J.; et al. Pathways Regulating Spheroid Formation of Human Follicular Thyroid Cancer Cells under Simulated Microgravity Conditions: A Genetic Approach. Int. J. Mol. Sci. 2016, 17, 528. [Google Scholar] [CrossRef] [PubMed] [Green Version]
  28. Colombo, M.; Raposo, G.; Thery, C. Biogenesis, secretion, and intercellular interactions of exosomes and other extracellular vesicles. Annu. Rev. Cell Dev. Biol. 2014, 30, 255–289. [Google Scholar] [CrossRef]
  29. Quek, C.; Hill, A.F. The role of extracellular vesicles in neurodegenerative diseases. Biochem. Biophys. Res. Commun. 2017, 483, 1178–1186. [Google Scholar] [CrossRef] [PubMed]
  30. Bank, I.E.; Timmers, L.; Gijsberts, C.M.; Zhang, Y.N.; Mosterd, A.; Wang, J.W.; Chan, M.Y.; De Hoog, V.; Lim, S.K.; Sze, S.K.; et al. The diagnostic and prognostic potential of plasma extracellular vesicles for cardiovascular disease. Expert Rev. Mol. Diagn. 2015, 15, 1577–1588. [Google Scholar] [CrossRef] [PubMed]
  31. Abels, E.R.; Breakefield, X.O. Introduction to Extracellular Vesicles: Biogenesis, RNA Cargo Selection, Content, Release, and Uptake. Cell. Mol. Neurobiol. 2016, 36, 301–312. [Google Scholar] [CrossRef] [PubMed]
  32. Orozco, A.F.; Lewis, D.E. Flow cytometric analysis of circulating microparticles in plasma. Cytometry A 2010, 77, 502–514. [Google Scholar] [CrossRef] [PubMed] [Green Version]
  33. Gonzales, P.A.; Pisitkun, T.; Hoffert, J.D.; Tchapyjnikov, D.; Star, R.A.; Kleta, R.; Wang, N.S.; Knepper, M.A. Large-scale proteomics and phosphoproteomics of urinary exosomes. J. Am. Soc. Nephrol. 2009, 20, 363–379. [Google Scholar] [CrossRef] [Green Version]
  34. Sharma, S.; Gillespie, B.M.; Palanisamy, V.; Gimzewski, J.K. Quantitative nanostructural and single-molecule force spectroscopy biomolecular analysis of human-saliva-derived exosomes. Langmuir 2011, 27, 14394–14400. [Google Scholar] [CrossRef] [PubMed] [Green Version]
  35. Lane, R.E.; Korbie, D.; Trau, M.; Hill, M.M. Purification Protocols for Extracellular Vesicles. Methods Mol. Biol. 2017, 1660, 111–130. [Google Scholar]
  36. Lässer, C.; Eldh, M.; Lötvall, J. Isolation and characterization of RNA-containing exosomes. J. Vis. Exp. 2012, 59, e3037. [Google Scholar] [CrossRef] [PubMed]
  37. Théry, C.; Witwer, K.W.; Aikawa, E.; Alcaraz, M.J.; Anderson, J.D.; Andriantsitohaina, R.; Antoniou, A.; Arab, T.; Archer, F.; Atkin-Smith, G.K.; et al. Minimal information for studies of extracellular vesicles 2018 (MISEV2018): A position statement of the International Society for Extracellular Vesicles and update of the MISEV2014 guidelines. J. Extracell. Vesicles 2018, 7, 1535750. [Google Scholar] [CrossRef] [Green Version]
  38. Gardiner, C.; Di Vizio, D.; Sahoo, S.; Théry, C.; Witwer, K.W.; Wauben, M.; Hill, A.F. Techniques used for the isolation and characterization of extracellular vesicles: Results of a worldwide survey. J. Extracell. Vesicles 2016, 5, 32945. [Google Scholar] [CrossRef]
  39. Peinado, H.; Alečković, M.; Lavotshkin, S.; Matei, I.; Costa-Silva, B.; Moreno-Bueno, G.; Hergueta-Redondo, M.; Williams, C.; García-Santos, G.; Ghajar, C.; et al. Melanoma exosomes educate bone marrow progenitor cells toward a pro-metastatic phenotype through MET. Nat. Med. 2012, 18, 883–891. [Google Scholar] [CrossRef] [Green Version]
  40. Somasundaram, R.; Herlyn, M. Melanoma exosomes: Messengers of metastasis. Nat. Med. 2012, 18, 853–854. [Google Scholar] [CrossRef] [PubMed]
  41. Alderton, G.K. Metastasis. Exosomes drive premetastatic niche formation. Nat. Rev. Cancer 2012, 12, 447. [Google Scholar] [CrossRef]
  42. Hood, J.L.; San, R.S.; Wickline, S.A. Exosomes released by melanoma cells prepare sentinel lymph nodes for tumor metastasis. Cancer Res. 2011, 71, 3792–3801. [Google Scholar] [CrossRef] [Green Version]
  43. Costa-Silva, B.; Aiello, N.M.; Ocean, A.J.; Singh, S.; Zhang, H.; Thakur, B.K.; Becker, A.; Hoshino, A.; Mark, M.T.; Molina, H.; et al. Pancreatic cancer exosomes initiate pre-metastatic niche formation in the liver. Nat. Cell Biol. 2015, 17, 816–826. [Google Scholar] [CrossRef] [PubMed]
  44. Nogués, L.; Benito-Martin, A.; Hergueta-Redondo, M.; Peinado, H. The influence of tumour-derived extracellular vesicles on local and distal metastatic dissemination. Mol. Asp. Med. 2018, 60, 15–26. [Google Scholar] [CrossRef]
  45. Hendricks, M.R.; Lane, S.; Melvin, J.A.; Ouyang, Y.; Stolz, D.B.; Williams, J.V.; Sadovsky, Y.; Bomberger, J.M. Extracellular vesicles promote transkingdom nutrient transfer during viral-bacterial co-infection. Cell Rep. 2021, 34, 108672. [Google Scholar] [CrossRef]
  46. Maas SL, N.; Breakefield, X.O.; Weaver, A.M. Extracellular Vesicles: Unique Intercellular Delivery Vehicles. Trends Cell Biol. 2017, 27, 172–188. [Google Scholar] [CrossRef] [PubMed] [Green Version]
  47. Al-Nedawi, K.; Meehan, B.; Micallef, J.; Lhotak, V.; May, L.; Guha, A.; Rak, J. Intercellular transfer of the oncogenic receptor EGFRvIII by microvesicles derived from tumour cells. Nat Cell Biol 2008, 10, 619–624. [Google Scholar] [CrossRef]
  48. Andreola, G.; Rivoltini, L.; Castelli, C.; Huber, V.; Perego, P.; Deho, P.; Squarcina, P.; Accornero, P.; Lozupone, F.; Lugini, L.; et al. Induction of lymphocyte apoptosis by tumor cell secretion of FasL-bearing microvesicles. J. Exp. Med. 2002, 195, 1303–1316. [Google Scholar] [CrossRef]
  49. Huber, V.; Fais, S.; Iero, M.; Lugini, L.; Canese, P.; Squarcina, P.; Zaccheddu, A.; Colone, M.; Arancia, G.; Gentile, M.; et al. Human colorectal cancer cells induce T-cell death through release of proapoptotic microvesicles: Role in immune escape. Gastroenterology 2005, 128, 1796–1804. [Google Scholar] [CrossRef]
  50. Skog, J.; Würdinger, T.; van Rijn, S.; Meijer, D.H.; Gainche, L.; Sena-Esteves, M.; Curry, W.T.; Carter, B.S.; Krichevsky, A.M.; Breakefield, X.O. Glioblastoma microvesicles transport RNA and proteins that promote tumour growth and provide diagnostic biomarkers. Nat. Cell Biol. 2008, 10, 1470–1476. [Google Scholar] [CrossRef]
  51. Richards, K.E.; Zeleniak, A.E.; Fishel, M.L.; Wu, J.; Littlepage, L.E.; Hill, R. Cancer-associated fibroblast exosomes regulate survival and proliferation of pancreatic cancer cells. Oncogene 2017, 36, 1770–1778. [Google Scholar] [CrossRef] [Green Version]
  52. Au Yeung, C.L.; Co, N.N.; Tsuruga, T.; Yeung, T.L.; Kwan, S.Y.; Leung, C.S.; Li, Y.; Lu, E.S.; Kwan, K.; Wong, K.K.; et al. Exosomal transfer of stroma-derived miR21 confers paclitaxel resistance in ovarian cancer cells through targeting APAF. Nat. Commun. 2016, 7, 11150. [Google Scholar] [CrossRef] [PubMed] [Green Version]
  53. Leca, J.; Martinez, S.; Lac, S.; Nigri, J.; Secq, V.; Rubis, M.; Bressy, C.; Sergé, A.; Lavaut, M.N.; Dusetti, N.; et al. Cancer-associated fibroblast-derived annexin A6+ extracellular vesicles support pancreatic cancer aggressiveness. J. Clin. Investig. 2016, 126, 4140–4156. [Google Scholar] [CrossRef] [PubMed] [Green Version]
  54. Luga, V.; Zhang, L.; Viloria-Petit, A.M.; Ogunjimi, A.A.; Inanlou, M.R.; Chiu, E.; Buchanan, M.; Hosein, A.N.; Basik, M.; Wrana, J.L. Exosomes mediate stromal mobilization of autocrine Wnt-PCP signaling in breast cancer cell migration. Cell 2012, 151, 1542–1556. [Google Scholar] [CrossRef] [PubMed] [Green Version]
  55. Whiteside, T.L. Tumor-Derived Exosomes and Their Role in Tumor-Induced Immune Suppression. Vaccines 2016, 4, 4. [Google Scholar] [CrossRef]
  56. Lötvall, J.; Hill, A.F.; Hochberg, F.; Buzás, E.I.; Di Vizio, D.; Gardiner, C.; Gho, Y.S.; Kurochkin, I.V.; Mathivanan, S.; Quesenberry, P.; et al. Minimal experimental requirements for definition of extracellular vesicles and their functions: A position statement from the International Society for Extracellular Vesicles. J. Extracell. Vesicles 2014, 3, 26913. [Google Scholar] [CrossRef]
  57. Hessvik, N.P.; Llorente, A. Current knowledge on exosome biogenesis and release. Cell Mol. Life Sci. 2018, 75, 193–208. [Google Scholar] [CrossRef] [Green Version]
  58. Hartjes, T.A.; Mytnyk, S.; Jenster, G.W.; van Steijn, V.; van Royen, M.E. Extracellular Vesicle Quantification and Characterization: Common Methods and Emerging Approaches. Bioengineering 2019, 6, 1. [Google Scholar] [CrossRef] [Green Version]
  59. Filipe, V.; Hawe, A.; Jiskoot, W. Critical evaluation of Nanoparticle Tracking Analysis (NTA) by NanoSight for the measurement of nanoparticles and protein aggregates. Pharm. Res. 2010, 27, 796–810. [Google Scholar] [CrossRef] [Green Version]
  60. Daaboul, G.G.; Gagni, P.; Benussi, L.; Bettotti, P.; Ciani, M.; Cretich, M.; Freedman, D.S.; Ghidoni, R.; Ozkumur, A.Y.; Piotto, C.; et al. Digital Detection of Exosomes by Interferometric Imaging. Sci. Rep. 2016, 6, 37246. [Google Scholar] [CrossRef]
  61. Avci, O.; Ünlü, N.L.; Özkumur, A.Y.; Ünlü, M.S. Interferometric Reflectance Imaging Sensor (IRIS)—A Platform Technology for Multiplexed Diagnostics and Digital Detection. Sensors 2015, 15, 17649–17665. [Google Scholar] [CrossRef] [Green Version]
  62. Yang, Y.; Shen, G.; Wang, H.; Li, H.; Zhang, T.; Tao, N.; Ding, X.; Yu, H. Interferometric plasmonic imaging and detection of single exosomes. Proc. Natl. Acad. Sci. USA 2018, 115, 10275–10280. [Google Scholar] [CrossRef] [Green Version]
  63. Wise, P.M.; Neviani, P.; Riwaldt, S.; Corydon, T.J.; Wehland, M.; Braun, M.; Krüger, M.; Infanger, M.; Grimm, D. Changes in Exosome Release in Thyroid Cancer Cells after Prolonged Exposure to Real Microgravity in Space. Int. J. Mol. Sci. 2021, 22, 2132. [Google Scholar] [CrossRef] [PubMed]
  64. Bartel, D.P. Metazoan MicroRNAs. Cell 2018, 173, 20–51. [Google Scholar] [CrossRef] [PubMed] [Green Version]
  65. Lee, Y.; Kim, M.; Han, J.; Yeom, K.H.; Lee, S.; Baek, S.H.; Kim, V.N. MicroRNA genes are transcribed by RNA polymerase II. EMBO J. 2004, 23, 4051–4060. [Google Scholar] [CrossRef] [PubMed]
  66. Lee, R.C.; Feinbaum, R.L.; Ambros, V. The, C. elegans heterochronic gene lin-4 encodes small RNAs with antisense complementarity to lin-14. Cell 1993, 75, 843–854. [Google Scholar] [CrossRef]
  67. Lagos-Quintana, M.; Rauhut, R.; Lendeckel, W.; Tuschl, T. Identification of novel genes coding for small expressed RNAs. Science 2001, 294, 853–858. [Google Scholar] [CrossRef] [Green Version]
  68. Reinhart, B.J.; Slack, F.J.; Basson, M.; Pasquinelli, A.E.; Bettinger, J.C.; Rougvie, A.E.; Horvitz, H.R.; Ruvkun, G. The 21-nucleotide let-7 RNA regulates developmental timing in Caenorhabditis elegans. Nature 2000, 403, 901–906. [Google Scholar] [CrossRef]
  69. Pasquinelli, A.E.; Reinhart, B.J.; Slack, F.; Martindale, M.Q.; Kuroda, M.I.; Maller, B.; Hayward, D.C.; Ball, E.E.; Degnan, B.; Müller, P.; et al. Conservation of the sequence and temporal expression of let-7 heterochronic regulatory RNA. Nature 2000, 408, 86–89. [Google Scholar] [CrossRef]
  70. Lee, R.C.; Ambros, V. An extensive class of small RNAs in Caenorhabditis elegans. Science 2001, 294, 862–864. [Google Scholar] [CrossRef] [Green Version]
  71. Lee, Y.; Ahn, C.; Han, J.; Choi, H.; Kim, J.; Yim, J.; Lee, J.; Provost, P.; Rådmark, O.; Kim, S.; et al. The nuclear RNase III Drosha initiates microRNA processing. Nature 2003, 425, 415–419. [Google Scholar] [CrossRef] [PubMed]
  72. Kim, V.N. MicroRNA precursors in motion: Exportin-5 mediates their nuclear export. Trends Cell Biol. 2004, 14, 156–159. [Google Scholar] [CrossRef]
  73. Bernstein, E.; Caudy, A.A.; Hammond, S.M.; Hannon, G.J. Role for a bidentate ribonuclease in the initiation step of RNA interference. Nature 2001, 409, 363–366. [Google Scholar] [CrossRef] [PubMed]
  74. Ketting, R.F.; Fischer, S.E.; Bernstein, E.; Sijen, T.; Hannon, G.J.; Plasterk, R.H. Dicer functions in RNA interference and in synthesis of small RNA involved in developmental timing in C. elegans. Genes Dev. 2001, 15, 2654–2659. [Google Scholar] [CrossRef] [PubMed] [Green Version]
  75. Hutvágner, G.; McLachlan, J.; Pasquinelli, A.E.; Bálint, E.; Tuschl, T.; Zamore, P.D. A cellular function for the RNA-interference enzyme Dicer in the maturation of the let-7 small temporal RNA. Science 2001, 293, 834–838. [Google Scholar] [CrossRef] [PubMed] [Green Version]
  76. Wightman, B.; Ha, I.; Ruvkun, G. Posttranscriptional regulation of the heterochronic gene lin-14 by lin-4 mediates temporal pattern formation in C. elegans. Cell 1993, 75, 855–862. [Google Scholar] [CrossRef]
  77. McKenzie, A.J.; Hoshino, D.; Hong, N.H.; Cha, D.J.; Franklin, J.L.; Coffey, R.J.; Patton, J.G.; Weaver, A.M. KRAS-MEK Signaling Controls Ago2 Sorting into Exosomes. Cell Rep. 2016, 15, 978–987. [Google Scholar] [CrossRef] [Green Version]
  78. Filipowicz, W.; Bhattacharyya, S.N.; Sonenberg, N. Mechanisms of post-transcriptional regulation by microRNAs: Are the answers in sight? Nat. Rev. Genet. 2008, 9, 102–114. [Google Scholar] [CrossRef]
  79. Shu, S.; Yang, Y.; Allen, C.L.; Hurley, E.; Tung, K.H.; Minderman, H.; Wu, Y.; Ernstoff, M.S. Purity and yield of melanoma exosomes are dependent on isolation method. J. Extracell. Vesicles 2020, 9, 1692401. [Google Scholar] [CrossRef] [Green Version]
  80. Brown, P.N.; Yin, H. Polymer-Based Purification of Extracellular Vesicles. Methods Mol. Biol. 2017, 1660, 91–103. [Google Scholar] [PubMed]
  81. Cong, D.; He, M.; Chen, S.; Liu, X.; Liu, X.; Sun, H. Expression profiles of pivotal microRNAs and targets in thyroid papillary carcinoma: An analysis of The Cancer Genome Atlas. OncoTargets Ther. 2015, 8, 2271–2277. [Google Scholar]
  82. Rosignolo, F.; Sponziello, M.; Giacomelli, L.; Russo, D.; Pecce, V.; Biffoni, M.; Bellantone, R.; Lombardi, C.P.; Lamartina, L.; Grani, G.; et al. Identification of Thyroid-Associated Serum microRNA Profiles and Their Potential Use in Thyroid Cancer Follow-Up. J. Endocr. Soc. 2017, 1, 3–13. [Google Scholar] [PubMed] [Green Version]
  83. Shabani, N.; Razaviyan, J.; Paryan, M.; Tavangar, S.M.; Azizi, F.; Mohammadi-Yeganeh, S.; Hedayati, M. Evaluation of miRNAs expression in medullary thyroid carcinoma tissue samples: miR-34a and miR-144 as promising overexpressed markers in MTC. Hum. Pathol. 2018, 79, 212–221. [Google Scholar] [CrossRef] [PubMed]
  84. Ghafouri-Fard, S.; Shirvani-Farsani, Z.; Taheri, M. The role of microRNAs in the pathogenesis of thyroid cancer. Noncoding RNA Res. 2020, 5, 88–98. [Google Scholar] [CrossRef]
  85. Diao, Y.; Fu, H.; Wang, Q. MiR-221 Exacerbate Cell Proliferation and Invasion by Targeting TIMP3 in Papillary Thyroid Carcinoma. Am. J. Ther. 2017, 24, e317–e328. [Google Scholar] [CrossRef] [Green Version]
  86. Wei, Z.L.; Gao, A.B.; Wang, Q.; Lou, X.E.; Zhao, J.; Lu, Q.J. MicroRNA-221 promotes papillary thyroid carcinoma cell migration and invasion via targeting RECK and regulating epithelial-mesenchymal transition. OncoTargets Ther. 2019, 12, 2323–2333. [Google Scholar] [CrossRef] [Green Version]
  87. Sun, J.; Shi, R.; Zhao, S.; Li, X.; Lu, S.; Bu, H.; Ma, X.; Su, C. E2F8, a direct target of miR-144, promotes papillary thyroid cancer progression via regulating cell cycle. J. Exp. Clin. Cancer Res. 2017, 36, 40. [Google Scholar] [CrossRef] [Green Version]
  88. Wu, G.; Zheng, H.; Xu, J.; Guo, Y.; Zheng, G.; Ma, C.; Hao, S.; Liu, X.; Chen, H.; Wei, S.; et al. miR-429 suppresses cell growth and induces apoptosis of human thyroid cancer cell by targeting ZEB. Artif. Cells Nanomed. Biotechnol. 2019, 47, 548–554. [Google Scholar] [CrossRef]
  89. Cao, X.Z.; Bin, H.; Zang, Z.N. MiR-128 suppresses the growth of thyroid carcinoma by negatively regulating SPHK. Biomed. Pharmacother. 2019, 109, 1960–1966. [Google Scholar] [CrossRef]
  90. Liu, C.; Xing, M.; Wang, L.; Zhang, K. miR-199a-3p downregulation in thyroid tissues is associated with invasion and metastasis of papillary thyroid carcinoma. Br. J. Biomed. Sci. 2017, 74, 90–94. [Google Scholar] [CrossRef] [PubMed]
  91. Ma, S.; Jia, W.; Ni, S. miR-199a-5p inhibits the progression of papillary thyroid carcinoma by targeting SNAI. Biochem. Biophys. Res. Commun. 2018, 497, 181–186. [Google Scholar] [CrossRef]
  92. Lambrecht, G.; Petersen, N.; Weerts, G.; Pruett, C.; Evetts, S.; Stokes, M.; Hides, J. The role of physiotherapy in the European Space Agency strategy for preparation and reconditioning of astronauts before and after long duration space flight. Musculoskelet. Sci. Pract. 2017, 27 (Suppl. S1), S15–S22. [Google Scholar] [CrossRef] [Green Version]
  93. Barratt, M.R.; Baker, E.S.; Pool, S.L. Principles of Clinical Medicine for Space Flight, 1st ed.; Springer: New York, NY, USA, 2008; p. 596. [Google Scholar]
  94. Petersen, N.; Lambrecht, G.; Scott, J.; Hirsch, N.; Stokes, M.; Mester, J. Postflight reconditioning for European Astronauts—A case report of recovery after six months in space. Musculoskelet. Sci. Pract. 2017, 27 (Suppl. S1), S23–S31. [Google Scholar] [CrossRef] [Green Version]
  95. Grosse, J.; Wehland, M.; Pietsch, J.; Schulz, H.; Saar, K.; Hübner, N.; Eilles, C.; Bauer, J.; Abou-El-Ardat, K.; Baatout, S.; et al. Gravity-sensitive signaling drives 3-dimensional formation of multicellular thyroid cancer spheroids. FASEB J. 2012, 26, 5124–5140. [Google Scholar] [CrossRef] [PubMed] [Green Version]
  96. Ma, X.; Pietsch, J.; Wehland, M.; Schulz, H.; Saar, K.; Hübner, N.; Bauer, J.; Braun, M.; Schwarzwälder, A.; Segerer, J.; et al. Differential gene expression profile and altered cytokine secretion of thyroid cancer cells in space. FASEB J. 2014, 28, 813–835. [Google Scholar] [CrossRef]
  97. Cramer, J.D.; Fu, P.; Harth, K.C.; Margevicius, S.; Wilhelm, S.M. Analysis of the rising incidence of thyroid cancer using the Surveillance, Epidemiology and End Results national cancer data registry. Surgery 2010, 148, 1147–1152, discussion 1152–1153. [Google Scholar] [CrossRef] [PubMed]
  98. Rossi, E.D.; Pantanowitz, L.; Hornick, J.L. A worldwide journey of thyroid cancer incidence centred on tumour histology. Lancet Diabetes Endocrinol. 2021, 9, 193–194. [Google Scholar] [CrossRef]
  99. Claridge, B.; Kastaniegaard, K.; Stensballe, A.; Greening, D.W. Post-translational and transcriptional dynamics—Regulating extracellular vesicle biology. Expert Rev. Proteom. 2019, 16, 17–31. [Google Scholar] [CrossRef]
  100. Challagundla, K.B.; Fanini, F.; Vannini, I.; Wise, P.; Murtadha, M.; Malinconico, L.; Cimmino, A.; Fabbri, M. microRNAs in the tumor microenvironment: Solving the riddle for a better diagnostics. Expert Rev. Mol. Diagn. 2014, 14, 565–574. [Google Scholar] [CrossRef]
  101. Challagundla, K.; Wise, P.; Fabbri, M. Exosomic microRNAs and Drug Resistance in the Neuroblastoma Environment; Poster for Annual Symposium; The Saban Research Institute: Los Angeles, CA, USA, 2013. [Google Scholar]
  102. Barile, L.; Vassalli, G. Exosomes: Therapy delivery tools and biomarkers of diseases. Pharmacol. Ther. 2017, 174, 63–78. [Google Scholar] [CrossRef] [PubMed] [Green Version]
  103. Kopp, S.; Krüger, M.; Feldmann, S.; Oltmann, H.; Schütte, A.; Schmitz, B.; Bauer, J.; Schulz, H.; Saar, K.; Huebner, N.; et al. Thyroid cancer cells in space during the TEXUS-53 sounding rocket mission—The THYROID Project. Sci. Rep. 2018, 8, 10355. [Google Scholar] [CrossRef] [Green Version]
  104. Romano, G.; Veneziano, D.; Acunzo, M.; Croce, C.M. Small non-coding RNA and cancer. Carcinogenesis 2017, 38, 485–491. [Google Scholar] [CrossRef] [Green Version]
  105. Anastasiadou, E.; Jacob, L.S.; Slack, F.J. Non-coding RNA networks in cancer. Nat. Rev. Cancer 2018, 18, 5–18. [Google Scholar] [CrossRef] [PubMed]
  106. Slack, F.J.; Chinnaiyan, A.M. The Role of Non-coding RNAs in Oncology. Cell 2019, 179, 1033–1055. [Google Scholar] [CrossRef] [PubMed]
  107. Panni, S.; Lovering, R.C.; Porras, P.; Orchard, S. Non-coding RNA regulatory networks. Biochim. Biophys. Acta Gene Regul. Mech. 2020, 1863, 194417. [Google Scholar] [CrossRef]
  108. Cummins, J.M.; He, Y.; Leary, R.J.; Pagliarini, R.; Diaz LA, J.r.; Sjoblom, T.; Barad, O.; Bentwich, Z.; Szafranska, A.E.; Labourier, E.; et al. The colorectal microRNAome. Proc. Natl. Acad. Sci. USA 2006, 103, 3687–3692. [Google Scholar] [CrossRef] [Green Version]
  109. Liang, Y.; Song, X.; Li, Y.; Ma, T.; Su, P.; Guo, R.; Chen, B.; Zhang, H.; Sang, Y.; Liu, Y.; et al. Targeting the circBMPR2/miR-553/USP4 Axis as a Potent Therapeutic Approach for Breast Cancer. Mol. Ther. Nucleic Acids 2019, 17, 347–361. [Google Scholar] [CrossRef] [Green Version]
  110. Kopp, S.; Sahana, J.; Islam, T.; Petersen, A.G.; Bauer, J.; Corydon, T.J.; Schulz, H.; Saar, K.; Huebner, N.; Slumstrup, L.; et al. The role of NFκB in spheroid formation of human breast cancer cells cultured on the Random Positioning Machine. Sci. Rep. 2018, 8, 921. [Google Scholar] [CrossRef]
  111. Hu, X.; Macdonald, D.M.; Huettner, P.C.; Feng, Z.; El Naqa, I.M.; Schwarz, J.K.; Mutch, D.G.; Grigsby, P.W.; Powell, S.N.; Wang, X. A miR-200 microRNA cluster as prognostic marker in advanced ovarian cancer. Gynecol. Oncol. 2009, 114, 457–464. [Google Scholar] [CrossRef]
  112. Chen, J.; Wang, L.; Matyunina, L.V.; Hill, C.G.; McDonald, J.F. Overexpression of miR-429 induces mesenchymal-to-epithelial transition (MET) in metastatic ovarian cancer cells. Gynecol. Oncol. 2011, 121, 200–205. [Google Scholar] [CrossRef] [PubMed]
  113. Liu, X.; Liu, Y.; Wu, S.; Shi, X.; Li, L.; Zhao, J.; Xu, H. Tumor-suppressing effects of miR-429 on human osteosarcoma. Cell Biochem. Biophys. 2014, 70, 215–224. [Google Scholar] [CrossRef]
  114. Guo, C.; Zhao, D.; Zhang, Q.; Liu, S.; Sun, M.-Z. miR-429 suppresses tumor migration and invasion by targeting CRKL in hepatocellular carcinoma via inhibiting Raf/MEK/ERK pathway and epithelial-mesenchymal transition. Sci. Rep. 2018, 8, 2375. [Google Scholar] [CrossRef] [Green Version]
  115. Li, J.; Du, L.; Yang, Y.; Wang, C.; Liu, H.; Wang, L.; Zhang, X.; Li, W.; Zheng, G.; Dong, Z. MiR-429 is an independent prognostic factor in colorectal cancer and exerts its anti-apoptotic function by targeting SOX. Cancer Lett. 2013, 329, 84–90. [Google Scholar] [CrossRef] [PubMed]
  116. Snowdon, J.; Zhang, X.; Childs, T.; Tron, V.A.; Feilotter, H. The microRNA-200 family is upregulated in endometrial carcinoma. PLoS ONE 2011, 6, e22828. [Google Scholar] [CrossRef]
  117. Wu, C.L.; Ho, J.Y.; Chou, S.C.; Yu, D.S. MiR-429 reverses epithelial-mesenchymal transition by restoring E-cadherin expression in bladder cancer. Oncotarget 2016, 7, 26593–26603. [Google Scholar] [CrossRef] [PubMed]
  118. Guo, C.M.; Liu, S.Q.; Sun, M.Z. miR-429 as biomarker for diagnosis, treatment and prognosis of cancers and its potential action mechanisms: A systematic literature review. Neoplasma 2020, 67, 215–228. [Google Scholar] [CrossRef] [PubMed]
  119. Larsen, J.E.; Nathan, V.; Osborne, J.K.; Farrow, R.K.; Deb, D.; Sullivan, J.P.; Dospoy, P.D.; Augustyn, A.; Hight, S.K.; Sato, M.; et al. ZEB1 drives epithelial-to-mesenchymal transition in lung cancer. J. Clin. Investig. 2016, 126, 3219–3235. [Google Scholar] [CrossRef] [Green Version]
  120. Zhang, P.; Sun, Y.; Ma, L. ZEB1: At the crossroads of epithelial-mesenchymal transition, metastasis and therapy resistance. Cell Cycle 2015, 14, 481–487. [Google Scholar] [CrossRef] [PubMed] [Green Version]
  121. Wu, H.T.; Zhong, H.T.; Li, G.W.; Shen, J.X.; Ye, Q.Q.; Zhang, M.L.; Liu, J. Oncogenic functions of the EMT-related transcription factor ZEB1 in breast cancer. J. Transl. Med. 2020, 18, 51. [Google Scholar] [CrossRef] [PubMed]
  122. Cortés, M.; Sanchez-Moral, L.; de Barrios, O.; Fernández-Aceñero, M.J.; Martínez-Campanario, M.C.; Esteve-Codina, A.; Darling, D.S.; Győrffy, B.; Lawrence, T.; Dean, D.C.; et al. Tumor-associated macrophages (TAMs) depend on ZEB1 for their cancer-promoting roles. EMBO J. 2017, 36, 3336–3355. [Google Scholar] [CrossRef] [PubMed]
  123. Katsura, A.; Tamura, Y.; Hokari, S.; Harada, M.; Morikawa, M.; Sakurai, T.; Takahashi, K.; Mizutani, A.; Nishida, J.; Yokoyama, Y.; et al. ZEB1-regulated inflammatory phenotype in breast cancer cells. Mol. Oncol. 2017, 11, 1241–1262. [Google Scholar] [CrossRef] [PubMed] [Green Version]
  124. Xia, Z.; Meng, F.; Liu, Y.; Fang, Y.; Wu, X.; Zhang, C.; Liu, D.; Li, G. Decreased MiR-128–3p alleviates the progression of rheumatoid arthritis by up-regulating the expression of TNFAIP. Biosci. Rep. 2018, 38, 4. [Google Scholar] [CrossRef] [Green Version]
  125. Cao, F.; Li, Z.; Ding, W.M.; Yan, L.; Zhao, Q.Y. LncRNA PVT1 regulates atrial fibrosis via miR-128–3p-SP1-TGF-β1-Smad axis in atrial fibrillation. Mol. Med. 2019, 25, 7. [Google Scholar] [CrossRef] [Green Version]
  126. Xie, L.B.; Chen, B.; Liao, X.; Chen, Y.F.; Yang, R.; He, S.R.; Pei, L.J.; Jiang, R. LINC00963 targeting miR-128–3p promotes acute kidney injury process by activating JAK2/STAT1 pathway. J. Cell Mol. Med. 2020, 24, 5555–5564. [Google Scholar] [CrossRef]
  127. Xu, T.; Luo, Y.; Wang, J.; Zhang, N.; Gu, C.; Li, L.; Qian, D.; Cai, W.; Fan, J.; Yin, G. Exosomal miRNA-128–3p from mesenchymal stem cells of aged rats regulates osteogenesis and bone fracture healing by targeting Smad. J. Nanobiotechnol. 2020, 18, 47. [Google Scholar] [CrossRef] [Green Version]
  128. Farina, F.M.; Hall, I.F.; Serio, S.; Zani, S.; Climent, M.; Salvarani, N.; Carullo, P.; Civilini, E.; Condorelli, G.; Elia, L.; et al. miR-128–3p Is a Novel Regulator of Vascular Smooth Muscle Cell Phenotypic Switch and Vascular Diseases. Circ. Res. 2020, 126, e120–e135. [Google Scholar] [CrossRef]
  129. Zanoni, M.; Orlandi, E.; Rossetti, G.; Turatti, M.; Calabrese, M.; Gomez Lira, M.; Gajofatto, A. Upregulated serum miR-128–3p in progressive and relapse-free multiple sclerosis patients. Acta Neurol. Scand. 2020, 142, 511–516. [Google Scholar] [CrossRef]
  130. Hao, S.D.; Ma, J.X.; Liu, Y.; Liu, P.J.; Qin, Y. Long non-coding TUG1 accelerates prostate cancer progression through regulating miR-128–3p/YES1 axis. Eur. Rev. Med. Pharmacol. Sci. 2020, 24, 619–632. [Google Scholar]
  131. Zhu, L.; Wang, A.; Gao, M.; Duan, X.; Li, Z. LncRNA MIR4435–2HG triggers ovarian cancer progression by regulating miR-128–3p/CKD14 axis. Cancer Cell Int. 2020, 20, 145. [Google Scholar] [CrossRef] [PubMed]
  132. Zhao, J.; Li, D.; Fang, L. MiR-128–3p suppresses breast cancer cellular progression via targeting LIMK. Biomed. Pharmacother. 2019, 115, 108947. [Google Scholar] [CrossRef] [PubMed]
  133. Wang, B.; Hang, J.; Li, W.; Yuan, W. Knockdown of LncRNA DLEU2 Inhibits Cervical Cancer Progression via Targeting miR-128–3p. OncoTargets Ther. 2020, 13, 10173–10184. [Google Scholar] [CrossRef] [PubMed]
  134. Wang, R.; Liu, L.; Jiao, J.; Gao, D. Knockdown of MIR4435–2HG Suppresses the Proliferation, Migration and Invasion of Cervical Cancer Cells via Regulating the miR-128–3p/MSI2 Axis In Vitro. Cancer Manag. Res. 2020, 12, 8745–8756. [Google Scholar] [CrossRef]
  135. Feng, W.; Guo, R.; Zhang, D.; Zhang, R. Circ-ABCB10 knockdown inhibits the malignant progression of cervical cancer through microRNA-128–3p/ZEB1 axis. Biol. Proc. Online 2021, 23, 17. [Google Scholar] [CrossRef]
  136. Zhao, L.; Li, R.; Xu, S.; Li, Y.; Zhao, P.; Dong, W.; Liu, Z.; Zhao, Q.; Tan, B. Tumor suppressor miR-128–3p inhibits metastasis and epithelial-mesenchymal transition by targeting ZEB1 in esophageal squamous-cell cancer. Acta Biochim. Biophys. Sin. 2018, 50, 171–180. [Google Scholar] [CrossRef] [Green Version]
  137. Tian, L.; Chen, M.; He, Q.; Yan, Q.; Zhai, C. MicroRNA-199a-5p suppresses cell proliferation, migration and invasion by targeting ITGA3 in colorectal cancer. Mol. Med. Rep. 2020, 22, 2307–2317. [Google Scholar] [CrossRef]
  138. Zhu, Q.D.; Zhou, Q.Q.; Dong, L.; Huang, Z.; Wu, F.; Deng, X. MiR-199a-5p Inhibits the Growth and Metastasis of Colorectal Cancer Cells by Targeting ROCK. Technol. Cancer Res. Treat. 2018, 17, 1533034618775509. [Google Scholar] [CrossRef]
  139. Qu, D.; Yang, Y.; Huang, X. miR-199a-5p promotes proliferation and metastasis and epithelial-mesenchymal transition through targeting PIAS3 in cervical carcinoma. J. Cell Biochem. 2019, 120, 13562–13572. [Google Scholar] [CrossRef]
  140. Yagil, Z.; Nechushtan, H.; Kay, G.; Yang, C.M.; Kemeny, D.M.; Razin, E. The enigma of the role of protein inhibitor of activated STAT3 (PIAS3) in the immune response. Trends Immunol. 2010, 31, 199–204. [Google Scholar] [CrossRef]
  141. Ren, L.; Xu, Y.; Qin, G.; Liu, C.; Yan, Y.; Zhang, H. miR-199b-5p-Stonin 2 axis regulates metastases and epithelial-to-mesenchymal transition of papillary thyroid carcinoma. IUBMB Life 2019, 71, 28–40. [Google Scholar] [CrossRef] [Green Version]
  142. Wang, D.; Zheng, Y. Silencing long non-coding RNAs nicotinamide nucleotide transhydrogenase antisense RNA 1 inhibited papillary thyroid cancer cell proliferation, migration and invasion and promoted apoptosis via targeting miR-199a-5p. Endocr. J. 2021, 68, 583–597. [Google Scholar] [CrossRef]
  143. Wei, S.; Yun, X.; Ruan, X.; Wei, X.; Zheng, X.; Gao, M. Identification of potential pathogenic candidates or diagnostic biomarkers in papillary thyroid carcinoma using expression and methylation profiles. Oncol. Lett. 2019, 18, 6670–6678. [Google Scholar] [CrossRef] [PubMed] [Green Version]
  144. Sun, D.; Han, S.; Liu, C.; Zhou, R.; Sun, W.; Zhang, Z.; Qu, J. Microrna-199a-5p Functions as a Tumor Suppressor via Suppressing Connective Tissue Growth Factor (CTGF) in Follicular Thyroid Carcinoma. Med. Sci. Monit. 2016, 22, 1210–1217. [Google Scholar] [CrossRef] [PubMed]
  145. Taga, M.; Yamauchi, K.; Odle, J.; Furian, L.; Sundaresan, A.; Ramesh, G.T.; Pellis, N.R.; Andrassy, R.J.; Kulkarni, A.D. Melanoma growth and tumorigenicity in models of microgravity. Aviat. Space Environ. Med. 2006, 77, 1113–1116. [Google Scholar]
  146. Chen, J.; Shin, V.Y.; Siu, M.T.; Ho, J.C.; Cheuk, I.; Kwong, A. miR-199a-5p confers tumor-suppressive role in triple-negative breast cancer. BMC Cancer 2016, 16, 887. [Google Scholar] [CrossRef] [Green Version]
  147. Zhang, L.C.; Wei, Z.B.; Tang, S.F. Knockdown of the Long Noncoding RNA LUCAT1 Inhibits High-Glucose-Induced Epithelial-Mesenchymal Transition through the miR-199a-5p-ZEB1 Axis in Human Renal Tubular Epithelial Cells. Biomed. Res. Int. 2020, 2020, 8895003. [Google Scholar] [CrossRef]
  148. Liu, Y.; Lu, C.; Fan, L.; Wang, J.; Li, T.; Liu, Z.; Sheng, J.; Qian, R.; Duan, A.; Lu, D. MiR-199a-5p Targets ZEB1 to Inhibit the Epithelial-Mesenchymal Transition of Ovarian Ectopic Endometrial Stromal Cells Via PI3K/Akt/mTOR Signal Pathway In Vitro and In Vivo. Reprod. Sci. 2020, 27, 110–118. [Google Scholar] [CrossRef] [PubMed]
  149. Théry, C.; Amigorena, S.; Raposo, G.; Clayton, A. Isolation and characterization of exosomes from cell culture supernatants and biological fluids. Curr. Protoc. Cell Biol. 2006, 30, 3–22. [Google Scholar] [CrossRef] [PubMed]
  150. Dragovic, R.A.; Gardiner, C.; Brooks, A.S.; Tannetta, D.S.; Ferguson, D.J.; Hole, P.; Carr, B.; Redman, C.W.; Harris, A.L.; Dobson, P.J.; et al. Sizing and phenotyping of cellular vesicles using Nanoparticle Tracking Analysis. Nanomedicine 2011, 7, 780–788. [Google Scholar] [CrossRef] [PubMed] [Green Version]
Figure 1. (a) Schematic overview of exosome biogenesis, cargo loading, and release and miRNA maturation. (b) Typical molecular contents of an exosome. (c) Exosomal uptake and post-translational protein regulation via miRNAs. Parts of the figure are drawn using pictures from the Servier Medical Art (https://smart.servier.com), licensed under a Creative Commons Attribution 3.0 Unported License (https://creativecommons.org/licenses/by/3.0).
Ijms 22 12841 g001
Figure 2. Size and concentration graphs of one of two fractions per sample. On display is the fraction with the higher particle concentration.
Ijms 22 12841 g002
Figure 4. Results of the single assay analysis of hsa-miR-429, including Ct values, relative quantification, and the graphical representation of the results. Empty spots in the listed Ct values did not produce any measurable amplification.
Ijms 22 12841 g004
Figure 5. Results of the single assay analysis of hsa-miR-128-3p, including Ct values, relative quantification, and the graphical representation of the results. Empty spots in the listed Ct values did not produce any measurable amplification.
Ijms 22 12841 g005
Figure 6. Results of the single assay analysis of hsa-miR-199a-3p_hsa-miR-199b-3p, including Ct values, relative quantification, and the graphical representation of the results. Empty spots in the listed Ct values did not produce any measurable amplification.
Ijms 22 12841 g006
Table 3. TaqMan™ Advanced Single-tube miRNA Assay Thermal Protocol.
StepTemperatureTimeCycles
Enzyme activation 95 °C20 s1
Denature95 °C3 s40
Anneal/Extend60 °C30 s
Publisher’s Note: MDPI stays neutral with regard to jurisdictional claims in published maps and institutional affiliations.

