Article

Interleukin-6 Trans-Signaling Mediated Regulation of Paracellular Permeability in Human Retinal Endothelial Cells

1
Center for Biotechnology & Genomic Medicine, Medical College of Georgia, Augusta University, Augusta, GA 30912, USA
2
Department of Ophthalmology, Medical College of Georgia, Augusta University, Augusta, GA 30912, USA
3
Department of Population Health Sciences, Medical College of Georgia, Augusta University, Augusta, GA 30912, USA
4
Culver Vision Discovery Institute, Medical College of Georgia, Augusta University, Augusta, GA 30912, USA
*
Author to whom correspondence should be addressed.
Int. J. Transl. Med. 2021, 1(2), 137-153; https://0-doi-org.brum.beds.ac.uk/10.3390/ijtm1020010
Submission received: 29 June 2021 / Revised: 1 September 2021 / Accepted: 7 September 2021 / Published: 16 September 2021
(This article belongs to the Special Issue Diabetic Retinopathy)

Abstract

:
Long-term hyperglycemia-mediated oxidative stress and inflammation lead to the blood-retinal barrier (BRB) dysfunction and increased vascular permeability associated with diabetic retinopathy (DR). Interleukin-6 (IL-6) is one of the primary mediators of retinal vascular inflammation. IL-6 signaling through its membrane-bound IL-6 receptor is known as classical signaling, and through a soluble IL-6 receptor (sIL-6R) is known as trans-signaling. Increasing evidence suggests that classical signaling is primarily anti-inflammatory, whereas trans-signaling induces the pro-inflammatory effects of IL-6. The purpose of this study was to compare the effects of these two pathways on paracellular permeability and expression of genes involved in inter-endothelial junctions in human retinal endothelial cells (HRECs). IL-6 trans-signaling activation caused significant disruption to paracellular integrity, with increased paracellular permeability, and was associated with significant changes in gene expression related to adherens, tight, and gap junctions. IL-6 classical signaling did not alter paracellular resistance in HRECs and had no distinct effects on gene expression. In conclusion, IL-6 trans-signaling, but not classical signaling, is a major mediator of the increased paracellular permeability characteristic of inner BRB breakdown in diabetic retinopathy. This study also identified potential inter-endothelial junction genes involved in the IL-6 trans-signaling mediated regulation of paracellular permeability in HRECs.

1. Introduction

Diabetic retinopathy (DR) remains the primary cause of adult-onset blindness in working-age Americans [1,2,3,4]. Long-term hyperglycemia-mediated oxidative stress and inflammation lead to blood-retinal barrier (BRB) dysfunction and increased vascular permeability, allowing extravasation of plasma proteins into the interstitium [1,5]. This dysfunction leads to edema, deposition of hard exudates in the retina, microaneurysms, and retinal hemorrhage [1,6,7,8,9]. BRB breakdown and subsequent macular edema are the main pathologies associated with blindness in DR [1,10,11,12].
The flow of molecules across the BRB is primarily controlled by the regulation of paracellular permeability, which involves intercellular connections that allow for the selective movement of water and small water-soluble molecules between adjacent endothelial cells [13,14]. Inter-endothelial cell junctions primarily consist of three types: adherens junctions, tight junctions, and gap junctions [1,15]. Adherens junctions initiate and mediate the initial cell-to-cell contact required for tight junction formation, and major components include VE-cadherin and β-catenin [16]. Tight junctions are made up of zona occludens (ZO), occludin, claudins, and junctional adhesion molecules (JAMs) that restrict and regulate transport through the paracellular space of adjacent vascular endothelial cells [14,17]. Gap junctions are formed by members of the connexin protein family and allow intercellular movement of small molecules and electron coupling [18,19]. In the blood–brain barrier, reduced expression of occludin and ZO-1 are associated with increased permeability at inter-endothelial junctions [1,20,21,22]. Similarly, recent studies implicate changes in adherens and tight junction integrity in the pathology of various ocular diseases [4,15,17,23]. Exposure to VEGF or advanced glycation end-products (AGEs) has been associated with VE-cadherin degradation and increased permeability [1,17].
Interleukin 6 (IL-6) plays a role in initiating BRB breakdown in DR [24,25,26]. This pleiotropic cytokine has diverse biological functions and acts via two distinct mechanisms, known as IL-6 classical and trans-signaling [27,28,29,30]. While classical signaling is limited to cells expressing the membrane-bound IL-6 receptor, trans-signaling occurs through the soluble receptor (sIL-6R) and functions ubiquitously [27]. Recent evidence suggests that IL-6 decreases ZO-1 and occludin levels in human retinal microvascular endothelial cells [31,32]. It has also been shown that both IL-6 and sIL6R were required for the loss of monolayer barrier function in human umbilical vein endothelial cells and that IL-6 alone does not affect barrier permeability [33].
Previous studies have shown the importance of IL-6 in BRB dysfunction associated with DR, however the distinct effects of IL-6 classical and trans-signaling on the paracellular permeability and inner BRB are unknown [1,25]. The purpose of this study was to compare the precise gene expression changes caused by IL-6 classical and trans-signaling that can affect inter-endothelial cell junctions, including adherens junctions, tight junctions, gap junctions, and the subsequent effects on paracellular permeability.

2. Materials and Methods

2.1. Cell Culture

Human retinal endothelial cells (HRECs, Cell Systems, Kirkland, WA, USA) were cultured in a humidified 37 °C incubator with 5% CO2. Cells were plated in gelatin-coated cell culture flasks and grown to confluency in Endothelial Cell Medium (Cell Biologics, Chicago, IL, USA) supplemented with 5% fetal bovine serum (FBS), 1% L-glutamine, 1% penicillin-streptomycin, and growth factors provided in the Medium Supplement Kit (VEGF, EGF, FGF, heparin, and hydrocortisone) (Cell Biologics). Fresh media was replaced every alternate day until confluent. Cells were serum-starved (1% FBS) for 4 h before treatments. To activate IL-6, classical signaling cells were treated with IL-6 (50 ng/mL; PeproTech, Rocky Hill, NJ, USA) overnight, and to activate IL-6 trans-signaling, cells were treated with IL-6 (50 ng/mL) and sIL-6 R (150 ng/mL, PeproTech) overnight as previously established in our lab [24,34]. Cells were harvested the following day and centrifuged at 300× g for 5 min to isolate cell pellets.

2.2. Measurement of Trans-Endothelial Resistance in HRECs

Normalized trans-endothelial electrical resistance (TER) was measured in HREC monolayers by electric cell impedance sensing (ECIS) using an ECIS Z-Theta instrument (Applied Biophysics, Inc., Troy, NY, USA) with 8W10E + arrays (Applied Biophysics). To stabilize resistance readings, arrays were coated with L-cysteine (10 uM, Alfa Aesar, Haverhill, MA, USA) followed by fibronectin (10 ug/mL, Thermofisher, Waltham, MA, USA), and cell-free baseline resistance readings were recorded with cell culture media. HRECs (50,000 cells/well) were seeded and allowed to reach confluence overnight. Readings were continuously recorded at multiple frequencies (62.5, 125, 250, 500, 1000, 2000, 4000, 8000, 16,000, 32,000, and 64,000 Hz), and cells were considered confluent monolayers when capacitance (C) measurements < 10 nF at 64,000 Hz. Resistance measurements at 4000 Hz were collected to assess endothelial barrier function, and resistance values were normalized relative to initial resistance at the time of treatment and plotted as a function of time. Multiple frequency readings were used to model paracellular barrier function (Rb), membrane capacitance (Cm), and flow beneath cells (α) using ECIS software as previously described [35].

2.3. RNA Isolation, Library Preparation, and Sequencing

Frozen cell pellets were submitted to the Emory Integrated Genomics Core (EIGC, Atlanta, GA, USA) to isolate and analyze RNA within the samples. RNA quality was assessed using a 2100 Bioanalyzer (Agilent Technologies; Santa Clara, CA, USA), and all samples had an integrity number > 8.0. Sample enrichment was performed prior to sequencing using the NEBNext® Ultra™ RNA Library Prep Kit (Illumina; San Diego, CA, USA) to prepare cDNA libraries. Library quality was subsequently determined using the 2100 Bioanalyzer. RNA Sequencing was performed using a 150 bp paired reads protocol of the NovaSeq 6000 (Illumina). Quality control analyses were performed using the bioinformatics tool, FastQC (http://www.bioinformatics.babraham.ac.uk/projects/fastqc, accessed on 20 July 2020) [36]. The total read counts were more than 50 million in all 15 samples. Mapping was performed using rsubread package [37], from which more than 97% of reads were mapped to the transcripts in the UCSC human genome hg19.

2.4. qRT-PCR

qRT-PCR was performed to validate seven selected genes (CLDN1, CLDN3, CLDN11, CDH12, CDH24, CTNNAL1, and GJA1) with significant differential expression from the RNA-Seq data. RNA was isolated from HRECs using phenol–chloroform extraction with TRIzol reagent (Invitrogen, Carlsbad, CA, USA) [38]. cDNA synthesis was performed using High-Capacity cDNA Reverse Transcriptase Kit (Applied Biosystems, Foster City, CA, USA). Primers were designed using the NCBI Primer-BLAST tool and were purchased from Integrated Device Technology (San Jose, CA, USA) (Table 1). RT-PCR reactions were performed using SsoAdvanced Universal SYBR Green Supermix, and Bio-Rad CFX Connect Thermocycler (Bio-Rad Laboratories, Hercules, CA, USA). Gene expression was normalized to expression of housekeeping gene glyceraldehyde 3-phosphate dehydrogenase (GAPDH), and relative mRNA expression values were calculated as 2ΔΔCt.

2.5. Western Blot Analyses

HRECs were lysed in RIPA buffer and proteins were separated using 4–20% SDS-PAGE gels (25–30 µg protein per sample). Proteins were transferred to a nitrocellulose membrane, blocked in 5% milk buffer in tris-buffered saline with 0.1% tween (TBST), and probed for CDH12 (A10206, ABclonal, Woburn, MA, USA), CLDN3 (A2946, ABclonal), and GJA1 (A11752, ABclonal) overnight at 4 °C. Blots were developed with electrochemiluminescence (ECL) substrate (32209, Thermo Scientific, Waltham, MA, USA), exposed to X-ray film, scanned, and quantified using ImageJ software (NIH). Protein levels were normalized to the expression of β-actin (AC028, ABclonal), and results were expressed as fold changes relative to untreated HRECs.

2.6. Statistical Analyses

For RNA-Seq data, read counts were normalized based on median of ratios. DESeq2 R package was used for differential expression analyses using negative binomial regression model [39,40]. Genes with a false discovery rate (FDR) < 0.05 were considered differentially expressed. Principal component analysis (PCA) was performed using “prcomp” function in R to investigate overall differences in gene expression profiles between treatment groups. Further, the differentially expressed genes were clustered into four groups using unsupervised hierarchical clustering. Expression patterns of these genes were visualized through heatmap using gplots package in R [41]. Gene ontology (GO) analyses were performed to associate the differentially expressed genes with biological processes, cellular components, and molecular functions. The GOFIG software package (https://github.com/adidevara/GOFIG, accessed on 29 July 2021) was used to perform gene ontology enrichment analysis and visualization [42]. All of these statistical analyses were performed using R version 4.0.3 [39].
Statistical analyses of qRT-PCR and Western blot data were performed using GraphPad Prism software 8.0 (GraphPad Software, Inc., San Diego, CA, USA). One-way ANOVA with Tukey’s multiple comparisons test was performed to identify differences between experimental groups. The threshold for significance was set at p-value < 0.05.

3. Results

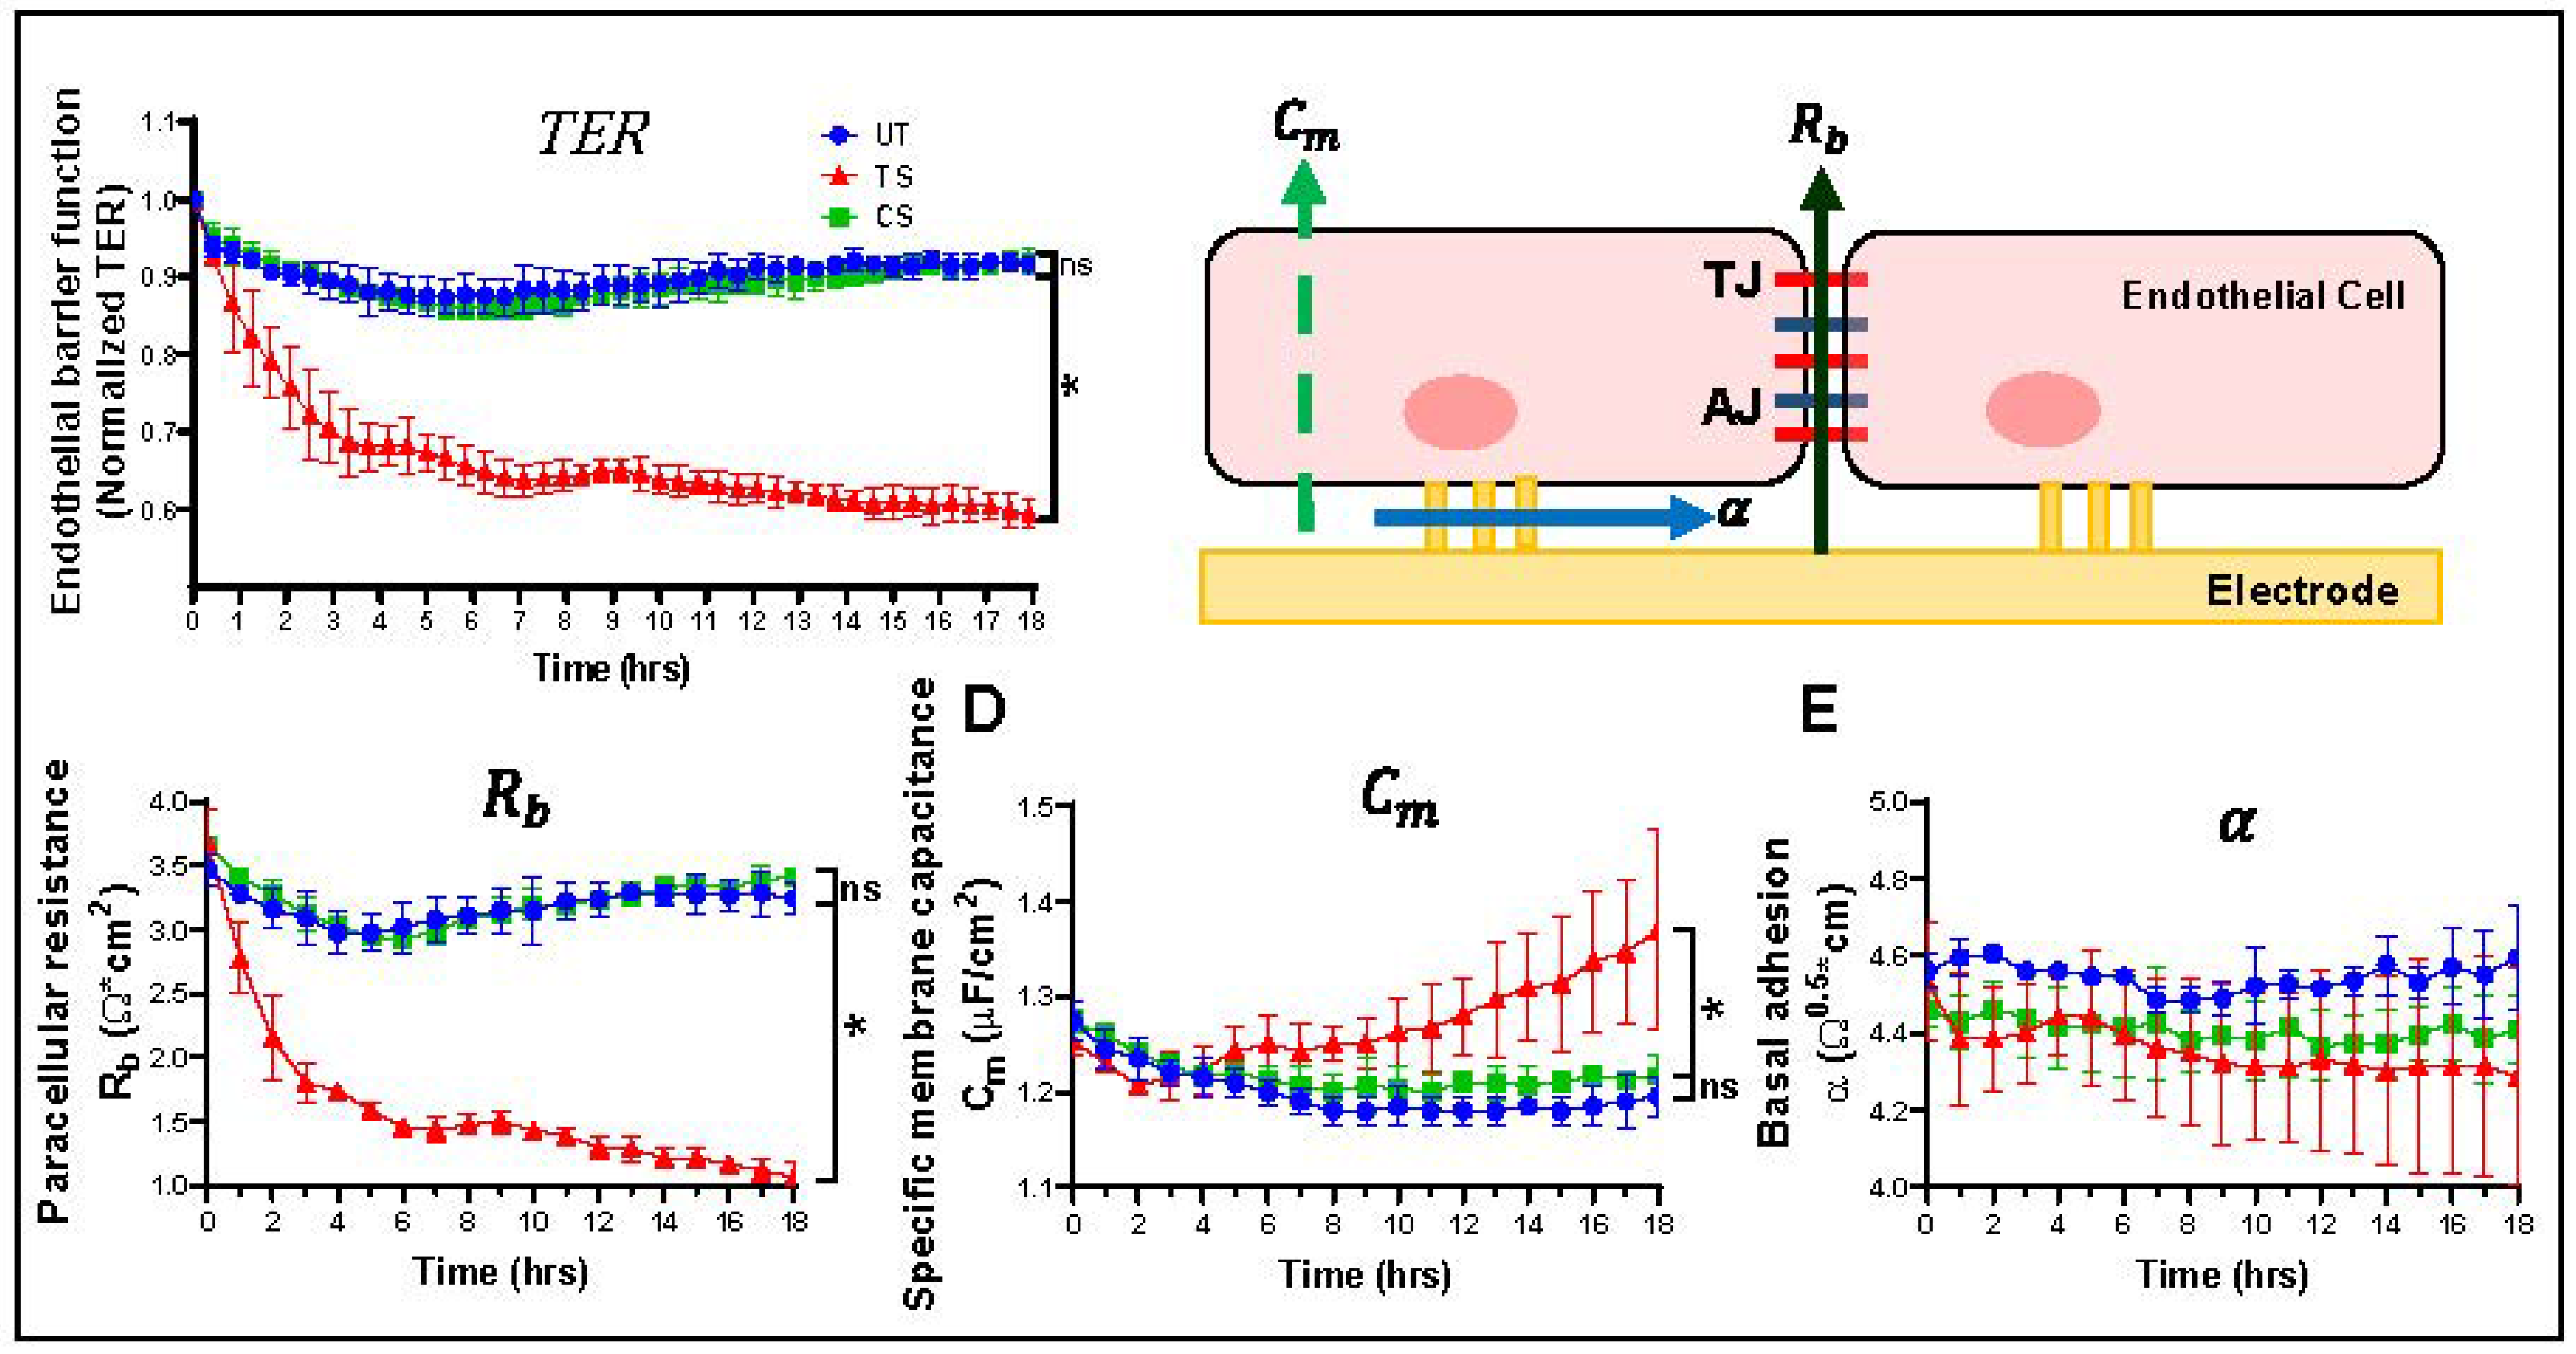
3.1. Differential Effects of IL-6 Classical and Trans-Signaling on Endothelial Barrier Function

Trans-endothelial electrical resistance (TER) was measured using ECIS in HRECs after activation of IL-6 classical and trans-signaling. IL-6 trans-signaling caused a significant drop in TER, while IL-6 classical signaling had no effect (Figure 1A). Overall barrier resistance formed by the endothelial cells is composed of three different parameters independently, including the paracellular resistance (Rb), basal adhesion (α), and cell membrane capacitance (Cm) (Figure 1B). Similar to the TER, average paracellular resistance (Rb) values were significantly decreased by IL-6 trans-signaling, while classical signaling had no significant effect (Figure 1C). Inversely, membrane capacitance (Cm) was significantly increased by IL-6 trans-signaling (Figure 1D). None of the treatments significantly changed basal adhesion (α) values (Figure 1E). These data revealed that the decrease in overall barrier resistance after IL-6 trans-signaling activation is due to changes in the paracellular resistance (Rb) and not due to changes in either the basal adhesion of the cells (α) or the physical capacitive properties of the cell membrane (Cm). The paracellular resistance is regulated by inter-endothelial junctions, including tight junctions, adherens junctions, and gap junctions.

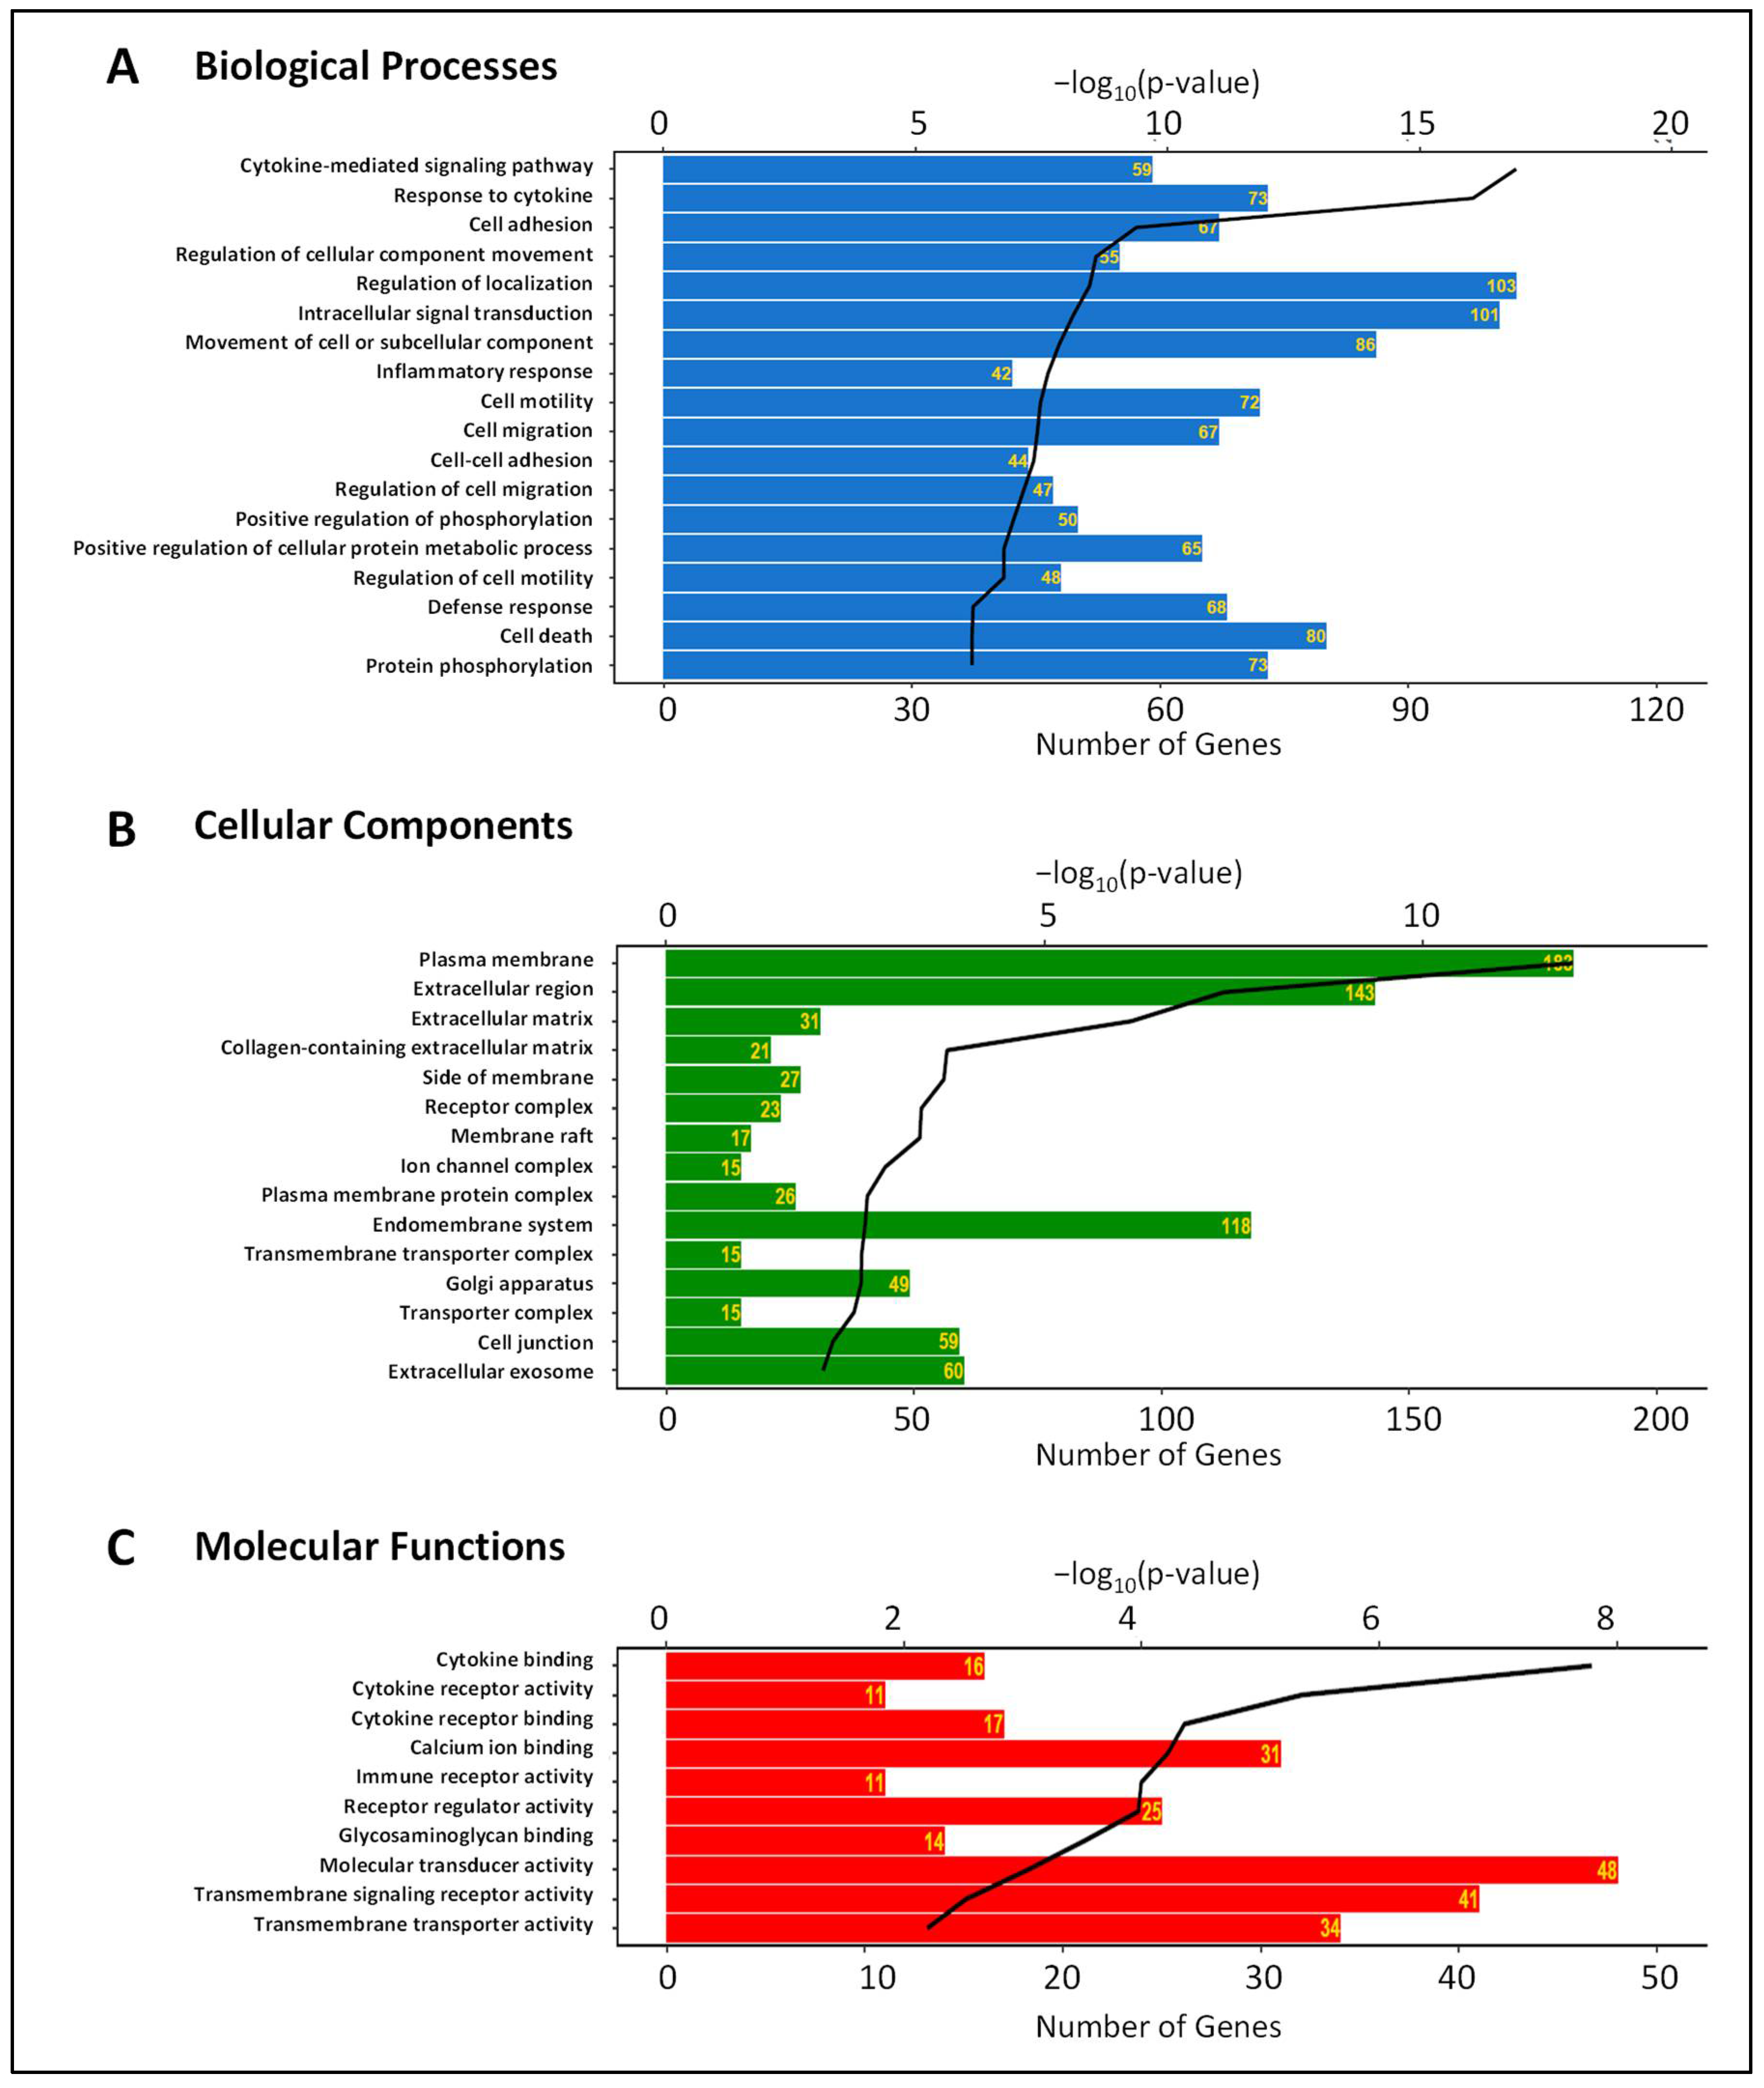
3.2. Gene Expression Changes Induced by IL-6 Classical and Trans-Signaling Activation in HRECs

RNA-Seq gene expression profiling was performed after IL-6 classical and trans-signaling activation in HRECs. Differential expression analysis revealed that 343 genes were upregulated and 141 were downregulated in trans-signaling as compared to classical signaling (Figure 2A). Principle component analysis (PCA), which identifies distinguishing features between groups in a large dataset, shows a clear distinction between untreated, classical, and trans-signaling gene expression data (Figure 2B). Unsupervised clustering of 484 differentially expressed genes revealed four distinct clusters (Figure 2C). Cluster-1 (53 genes) consists of genes downregulated only in trans-signaling relative to untreated and classical signaling. Cluster-2 (86 genes) and cluster-3 (21 genes) contain genes that are upregulated and downregulated, respectively, only in classical signaling relative to the other two groups. Cluster-4 (324 genes) consists of genes upregulated by IL-6 trans-signaling but not by classical signaling.
Gene ontology (GO) analyses were performed to discover enriched biological processes, cellular components, and molecular functions associated with 484 differentially expressed genes (Figure 3). The top enriched biological processes are cytokine-mediated signaling pathway (59 genes), response to cytokine (73 genes), cell adhesion (67 genes), and regulation of cellular component movement (55 genes). The most enriched cellular components are plasma membrane (183 genes), extracellular region (143 genes), extracellular matrix (31 genes), and collagen-containing extracellular matrix (21 genes). Cytokine binding (16 genes), cytokine receptor activity (11 genes), cytokine receptor binding (17 genes), and calcium ion binding (31 genes) are the most enriched molecular functions in the differentially expressed genes (Figure 3). While this analysis identified numerous GO terms associated with cytokine signaling as expected, many of the GO terms identified are linked to the regulation of paracellular permeability, including cell adhesion, plasma membrane, extracellular region, and calcium ion binding.

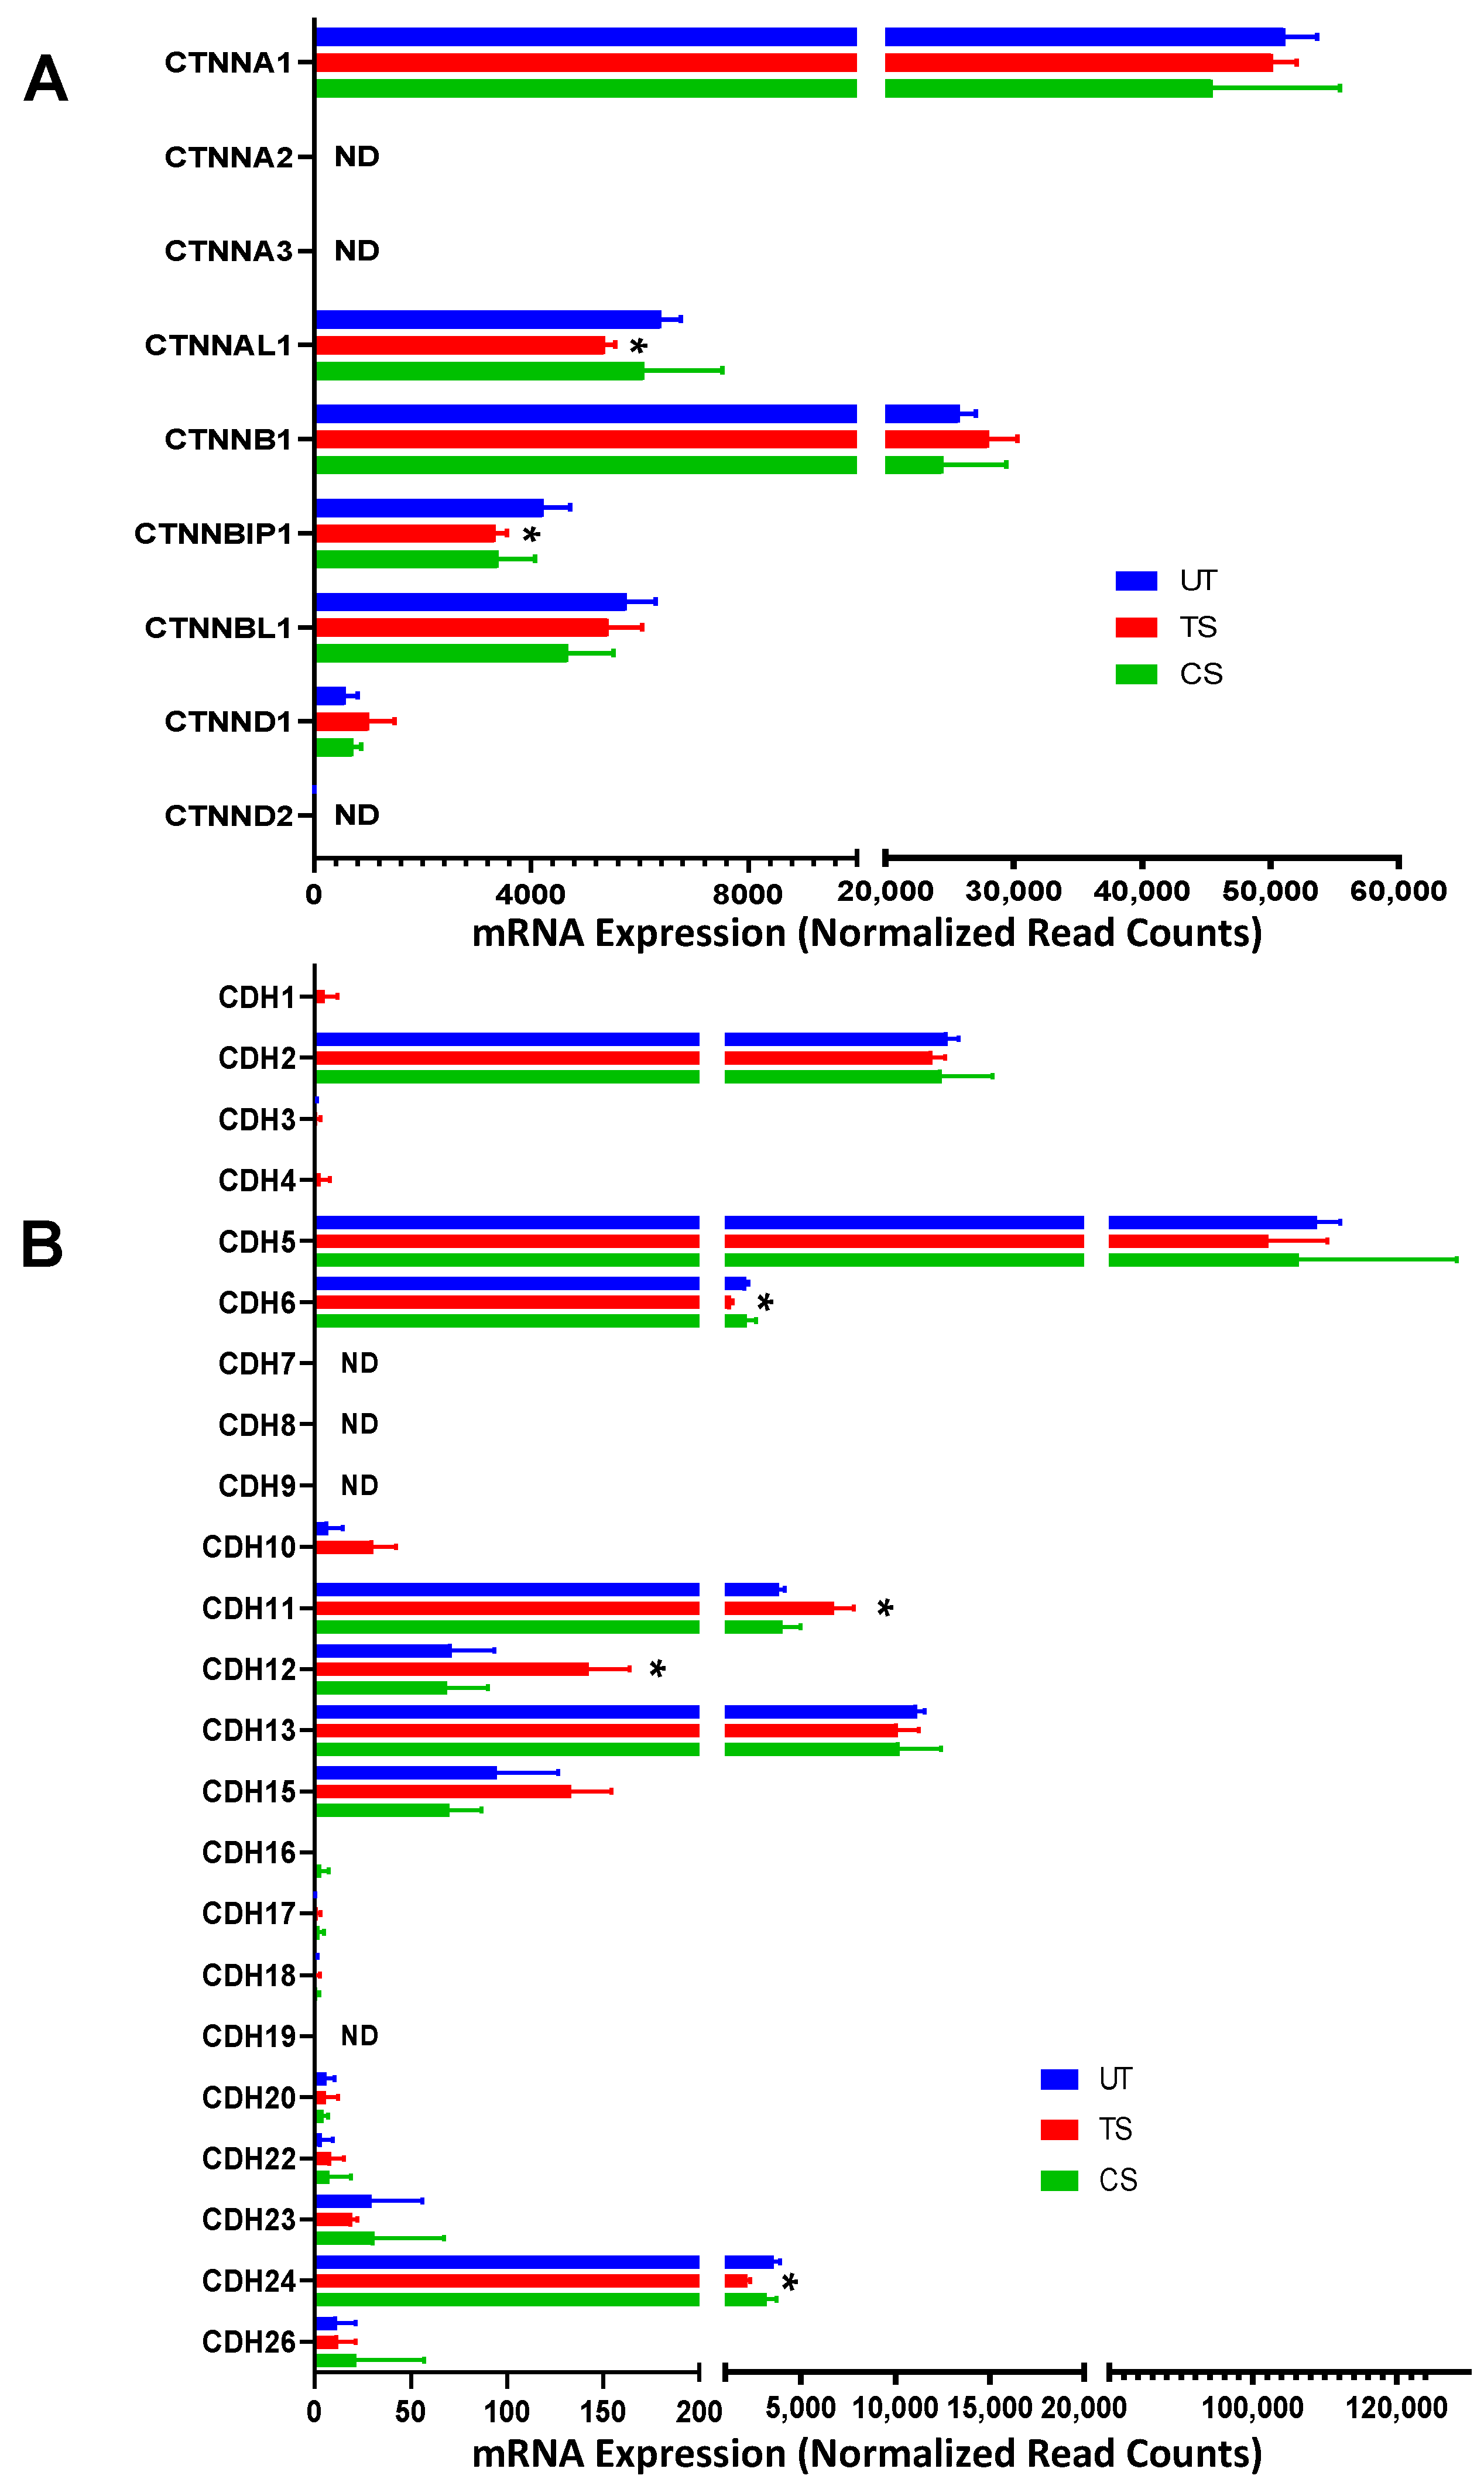
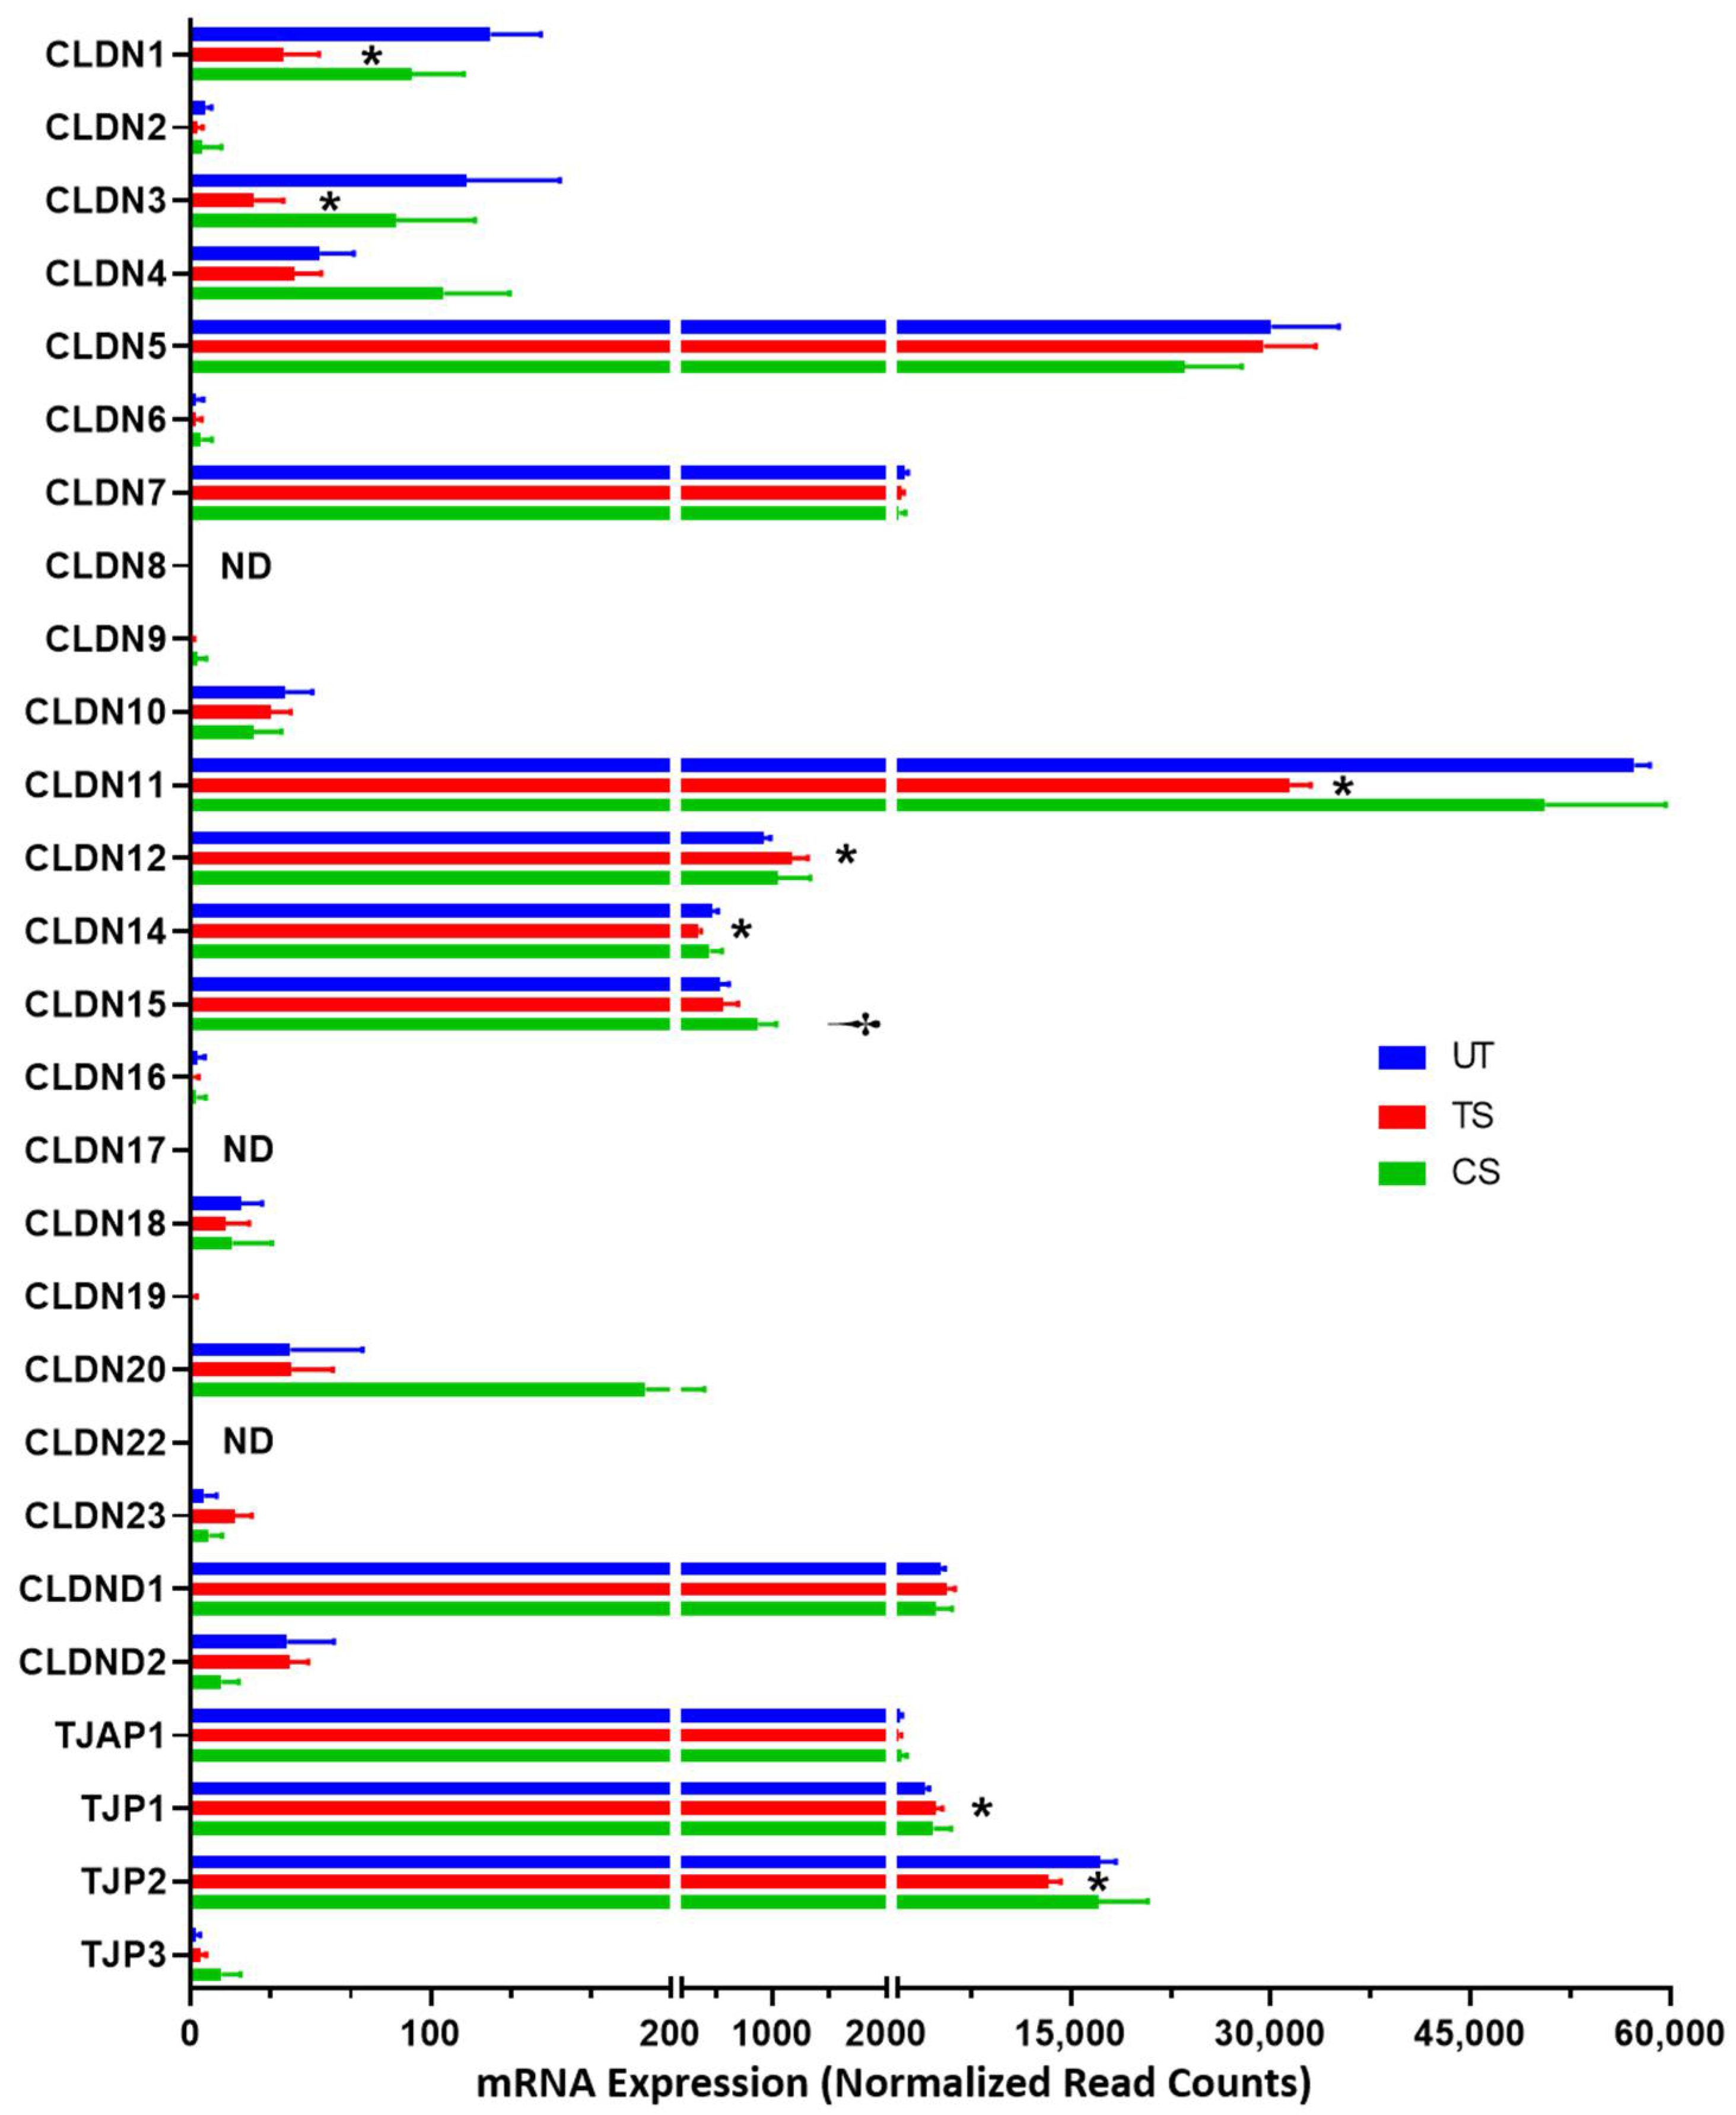
3.3. Differential Expression of Adherens Junction, Tight Junction, and Gap Junction Genes Induced by IL-6 Classical and Trans-Signaling Activation

From RNA-Seq analyses, 79 genes were identified as inter-endothelial molecules that form adherens junctions, tight junctions, and gap junctions (Supplementary Tables S1 and S2). IL-6 trans-signaling caused significant alterations in the expression of 16 out of 79 inter-endothelial genes (5 upregulated and 11 downregulated), whereas only one gene was significantly upregulated by IL-6 classical signaling (Table 2).

3.3.1. Adherens Junctions

A total of 32 adherens junction genes, including nine catenins (CTNN) and 23 cadherins (CDH)) were detected in HRECs (Figure 4). Among catenins, CTNNA1, CTNNB1, and CTNNAL1 featured the highest overall expression (Figure 4A); for the cadherin-encoding genes, CDH2, CDH5, and CDH13 showed the highest expression (Figure 4B). A total of 6 adherens junction genes were altered in response to IL-6 trans-signaling activation: CDH12 (1.97-fold), CDH11 (1.74-fold), CDH24 (−1.67-fold), CDH6 (−1.66-fold), CTNNBIP1 (−1.29-fold), and CTNNAL1 (−1.21-fold). No significant alterations were observed in the adherens junction genes after IL-6 classical activation.

3.3.2. Tight Junctions

A total of 27 genes were identified as encoding tight junction proteins, including 23 claudins (CLDN) and 4 tight junction proteins (TJP or TJAP) (Figure 5). Three genes, CLDN5, CLDN11, and TJP2, showed the highest level of expression in HRECs. IL-6 trans-signaling altered the expression of seven tight junction genes (two upregulated, five downregulated), including CLDN3 (−4.44-fold), CLDN1 (−3.27-fold), CLDN11 (−1.85-fold), CLDN14 (−1.36-fold), TJP2 (−1.31-fold), CLDN12 (1.25-fold) and TJP1 (1.17-fold). Only one tight junction gene, CLDN15 (1.48-fold) was upregulated in response to IL-6 classical activation.

3.3.3. Gap Junctions

A total of 20 genes involved in gap junctions were detected through RNA-Seq analysis, with GJA1, GJC1, and GJD3 being the three genes with the highest expression (Figure 6). Three genes were differentially expressed in HRECs after IL-6 trans-signaling activation: GJA4 (−2.41-fold), GJA1 (1.49-fold), and GJC1 (−1.19-fold). No significant effects in the expression of gap junctions were observed after IL-6 classical signaling activation.

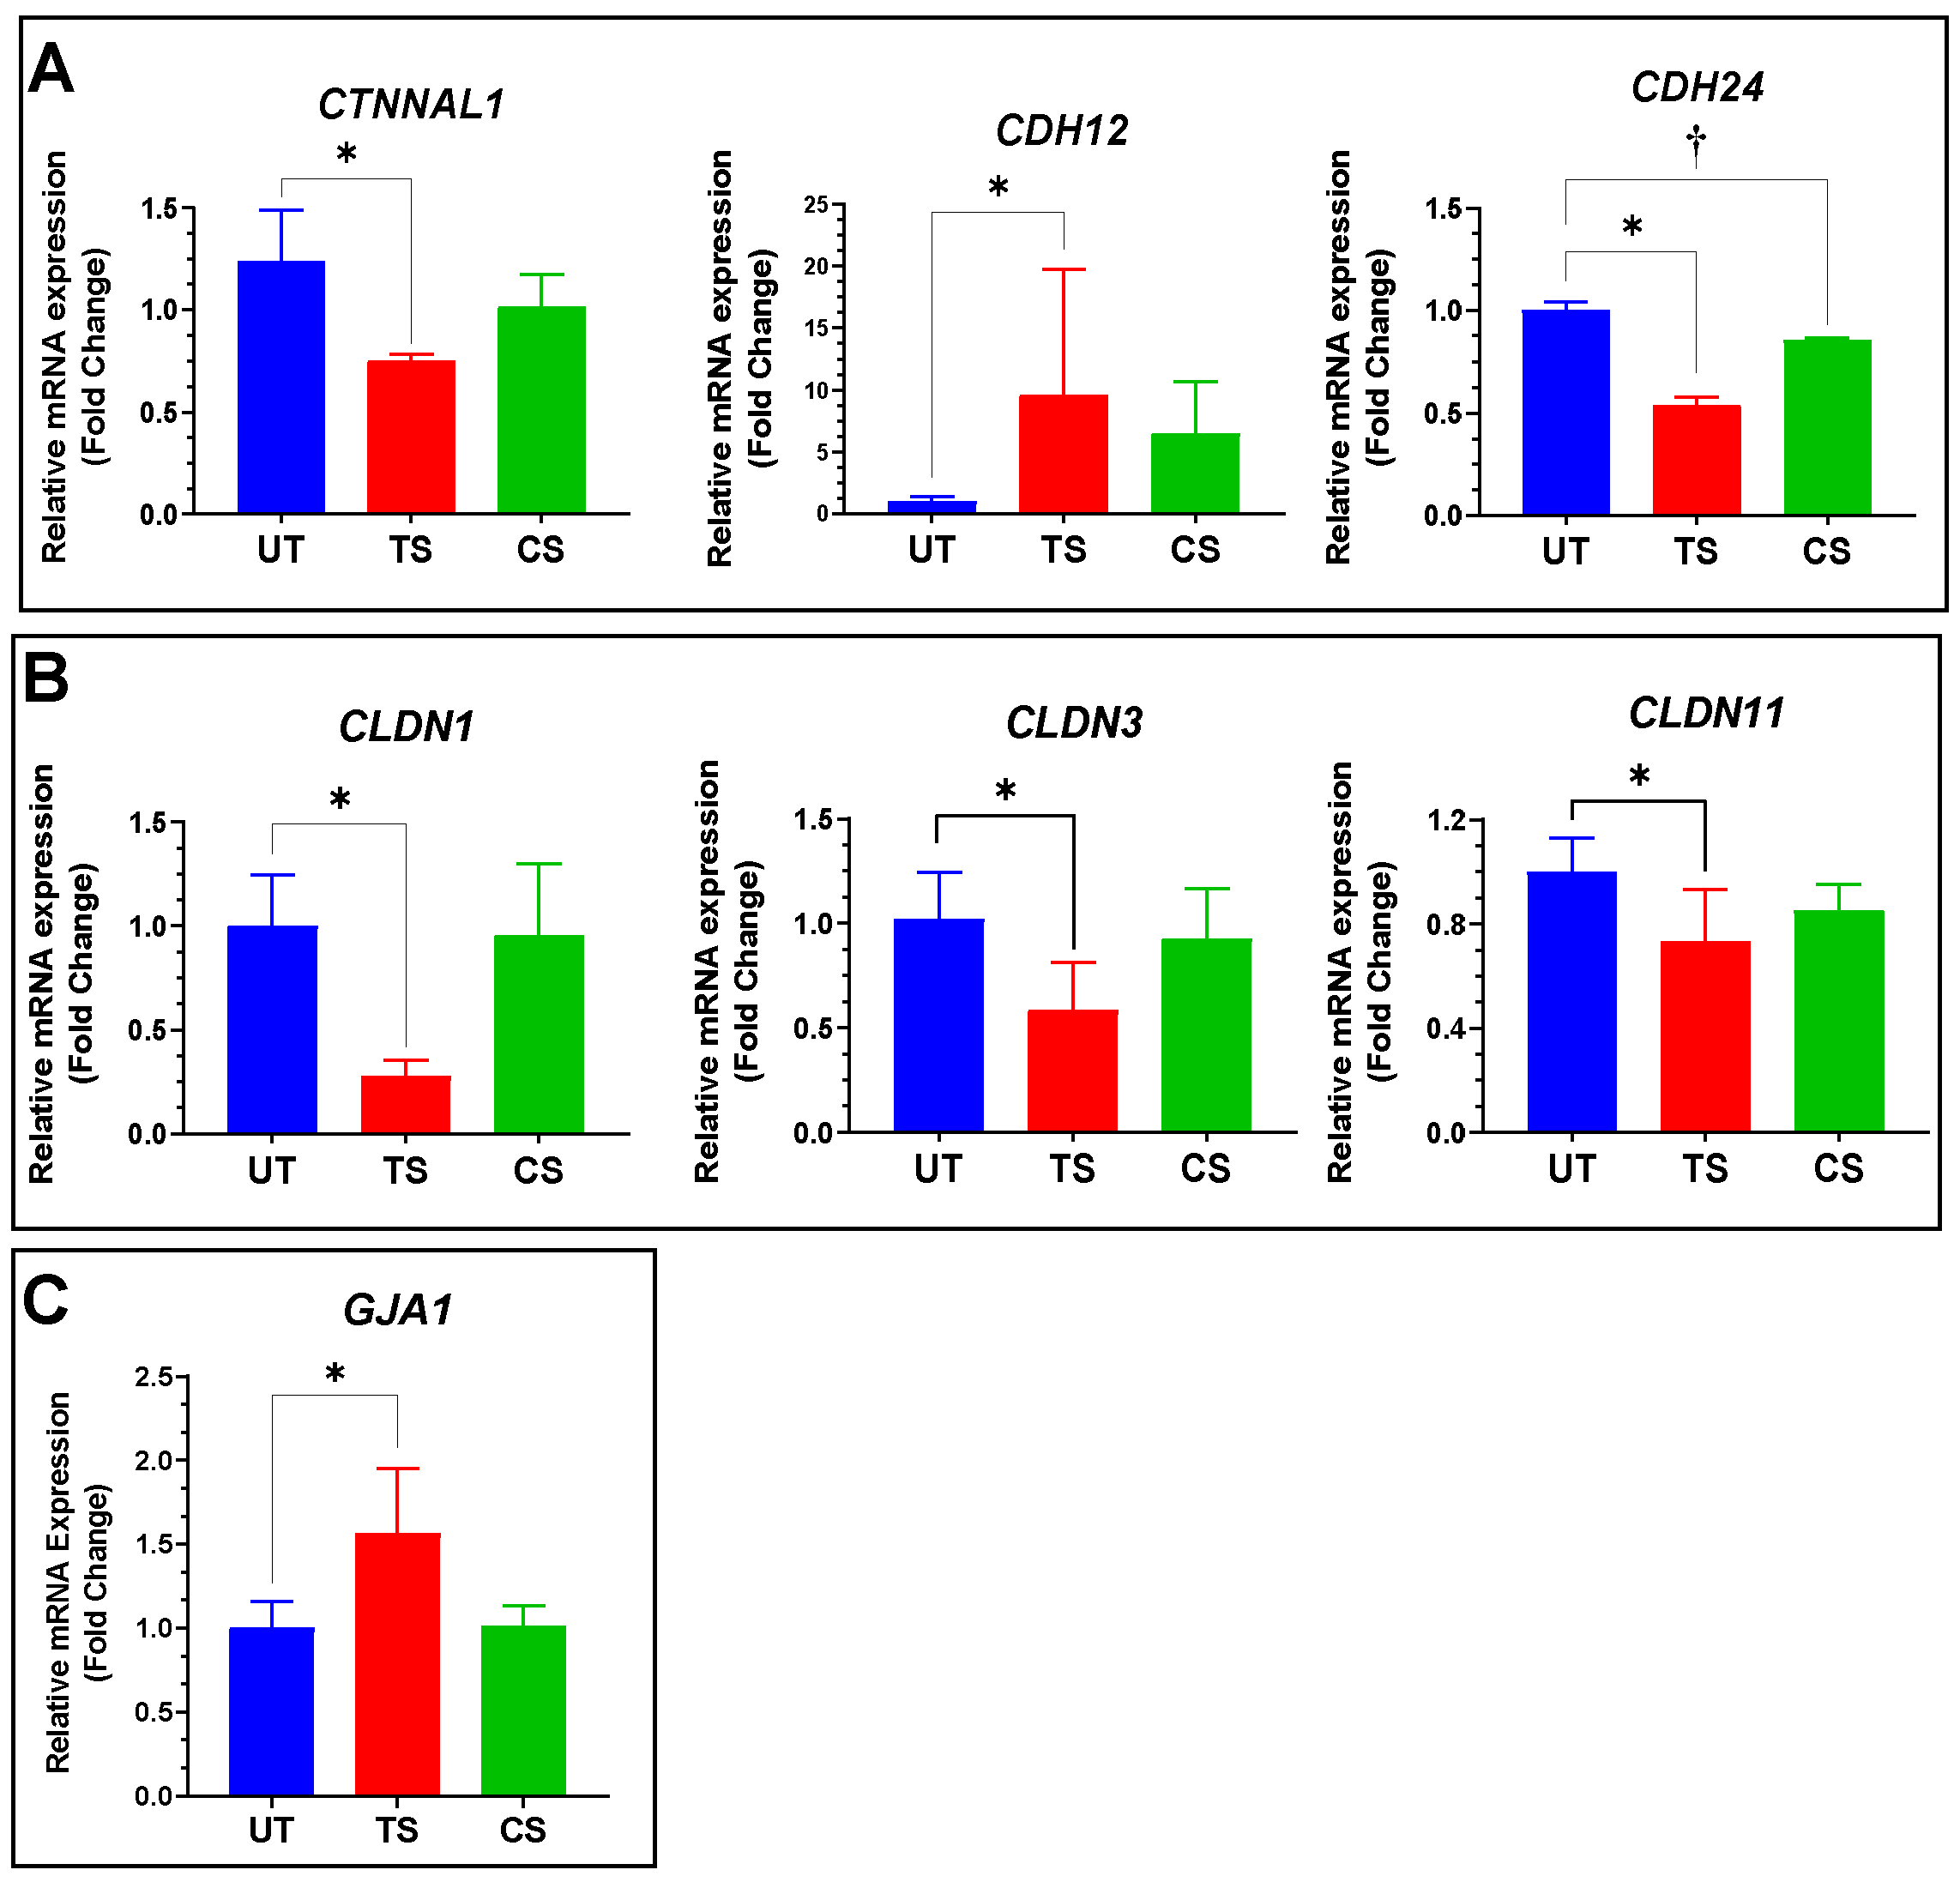
3.4. Validation of Selected Genes Using Quantitative RT-PCR

A total of seven differentially expressed genes, including three adherens (CTNNAL1, CDH12 and CDH24), three tight junctions (CLDN1, CLDN3, and CLDN11), and one gap junction gene (GJA1) were confirmed using qRT-PCR. Among adherens junctions, IL-6 trans-signaling induced the upregulation of CDH12 (9.65-fold), and downregulation of CDH24 (0.54-fold) and CTNNAL1 (0.76-fold), confirming the findings of RNA-Seq analysis (Figure 7A). Similar to RNA-Seq analysis, three members of the tight junction family showed a significant decrease in relative mRNA expression in response to trans-signaling but no change after classical signaling activation: CLDN1 (0.28-fold), CLDN3 (0.58-fold), and CLDN11 (0.73-fold) (Figure 7B). The expression levels of GJA1 increased in response to IL-6 trans-signaling activation (1.57-fold), though not classical, in both RNA-Seq and qRT-PCR analyses (Figure 7C).

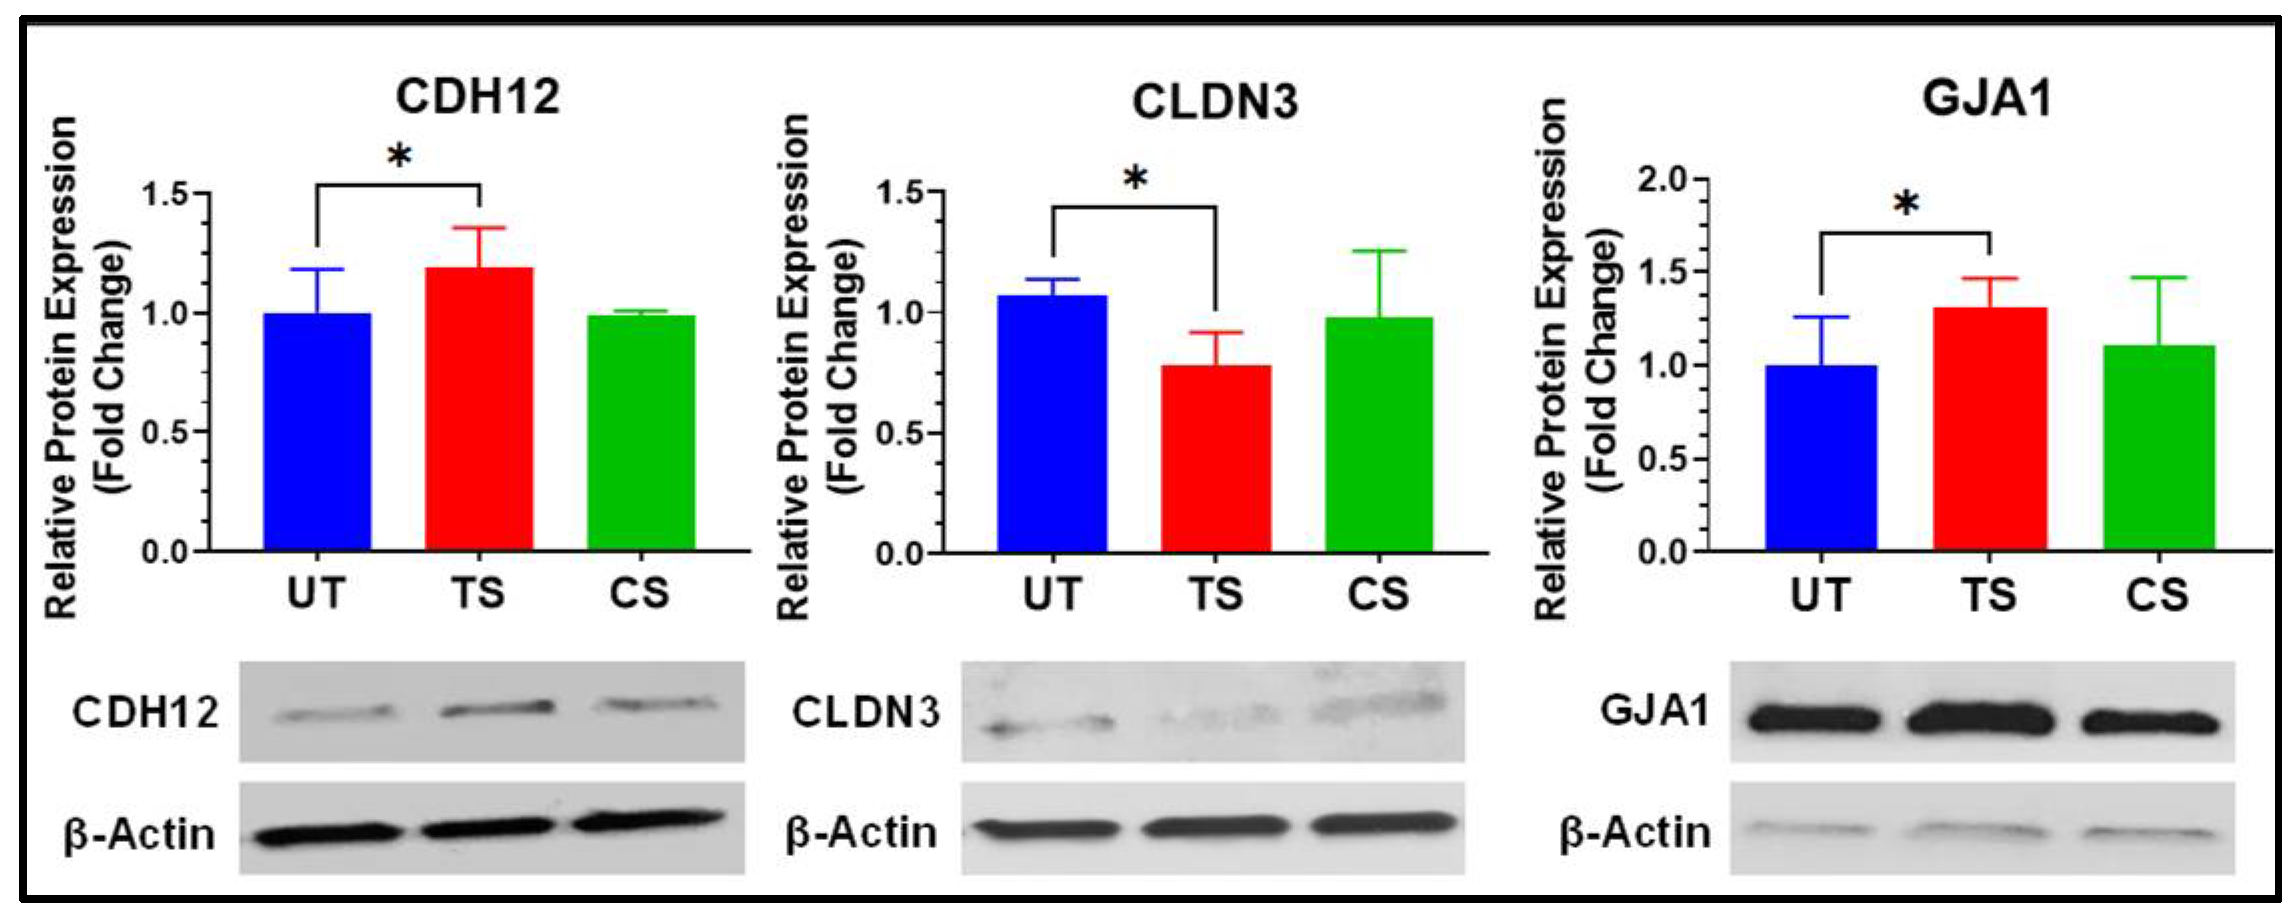
3.5. Confirmation Using Western Blot Analyses

Protein levels were assessed using Western blotting for three proteins (cadherin 12, CDH12; claudin 3, CLDN3; and gap junction protein alpha 1, GJA1) to represent the adherens, tight, and gap junctions, respectively (Figure 8). Activation of IL-6 trans-signaling showed significant upregulation of CDH12 (1.19-fold) and GJA1 (1.32-fold) relative to untreated HRECs. CLDN3 expression was significantly downregulated (0.73-fold) in response to IL-6 trans-signaling alone. Activation of IL-6 classical signaling showed no significant effect on the expression of these proteins in HRECs. These trends for CDH12, CLDN3, and GJA1 were observed across RNA-Seq, qRT-PCR, and Western blot analyses, showing transcriptional and translational changes to adherens, tight, and gap junctions in response to IL-6 trans-signaling in HRECs.

4. Discussion

Inter-endothelial junctions are composed of many repetitive molecular connections that ensure proper barrier function and regulate transport through the paracellular space [43]. Increased endothelial paracellular permeability has been linked to the BRB breakdown, a known characteristic of several retinal diseases [24,44]. We have previously shown that activation of IL-6 trans-signaling significantly disrupts endothelial barrier function [24], and the present study compares the effects of IL-6 classical and trans-signaling on paracellular permeability and expression of inter-endothelial junction genes in human retinal endothelial cells. GO analysis of differentially expressed genes in RNA-Seq showed significant alterations for transcripts related to cell adhesion, calcium ion binding, and the extracellular region. IL-6 trans-signaling activation, but not classical signaling, caused a significant disruption to the paracellular permeability in HREC, and gene expression profiling revealed transcriptional alterations in several adherens junction, tight junction, and gap junction genes following IL-6 trans-signaling activation. A summary of differential gene expression induced by IL-6 trans-signaling in HRECs is shown in Figure 9.
Adherens junctions comprise complexes of transmembrane cadherins and cytoplasmic catenins that initiate contact between cells, facilitate tight junction formation, and mediate paracellular transport and permeability [13,16]. In this study, IL-6 trans-signaling significantly downregulated mRNA expression of two cadherin genes (CDH6, CDH24) and two catenin-related genes (CTNNAL1, CTNNBIP1). Various studies in cancer, diabetic nephropathy, and DR indicate a decrease in expression of cadherins and catenins at cell-to-cell junctions following exposure to pro-inflammatory stimuli [1,45,46,47]. However, previous studies on adherens junctions in HRECs are primarily focused only on expression of VE-cadherin, N-cadherin, and β-catenin [1]. Downregulation of α-catulin (Catenin alpha like 1, CTNNAL1), which interacts with both β-catenin and α-catenin at the plasma membrane, has been previously reported as a consequence of inflammation in breast cancer studies and in ApoCIII-treated porcine vascular endothelial cells [45,46]. β-catenin–interacting protein 1 (CTNNBIP1) participates in inhibition of the Wnt/β-catenin signaling pathway to maintain barrier permeability and integrity [47,48]. Downregulation of CTNNBIP1 is reported to disrupt its inhibitory function, thereby stimulating Wnt/β-catenin activity and subsequent vascular leakage [47,48].
We found a significant decrease in the expression of five tight junction transcripts, including CLDN1, CLDN3, CLDN11, CLDN14, and TJP2, following IL-6 trans-signaling activation. CLDN12 and TJP1, however, were significantly upregulated by trans-signaling in HRECs. Abundant CLDN1 and CLDN3 expression is characteristic of normal endothelial barrier integrity in both the blood–brain barrier and the inner BRB [4,49,50]. Expression of CLDN1, CLDN11, and CLDN14 has been correlated with the strength of paracellular junctions in epithelial cells [51,52]. The downregulation of these claudins by IL-6 trans-signaling may account for part of the significant decrease in paracellular resistance that was observed using ECIS, but further studies are needed to determine additional effects of IL-6 trans-signaling on endothelial tight junctions beyond the level of transcriptional regulation.
Gap junctions consist of connexins that participate in intercellular transport and promote the formation of tight junctions and adherens junctions [1,53,54,55]. These junctional molecules are transient between cells, lasting only a few hours, allowing rapid cellular response to the extracellular environment [56]. Previous studies suggest that IL-6 signaling has significant effects on gap junction formation [57,58]. In this study, IL-6 trans-signaling caused significant downregulation of GJA4 and GJC1 and upregulation of GJA1, while classical signaling exhibited no significant effect on expression of gap junction genes.

5. Conclusions

This study is the first attempt to compare the distinct effects of IL-6 classical and trans-signaling on paracellular permeability in HRECs. Our results demonstrate that IL-6 trans-signaling activation, but not IL-6 classical signaling, causes significant barrier disruption in HREC monolayers via increased paracellular permeability at inter-endothelial junctions. We also identified several adherens junction, tight junction, and gap junction genes that were significantly altered with IL-6 trans-signaling activation, which may be of interest in future mechanistic studies on IL-6 trans-signaling mediated regulation of paracellular permeability in HRECs.

Supplementary Materials

The following are available online at https://0-www-mdpi-com.brum.beds.ac.uk/article/10.3390/ijtm1020010/s1, Table S1: A complete list of 79 genes identified as inter-endothelial molecules that form tight junctions, adherens junctions, and gap junctions, including fold changes and adjusted p-values. Table S2: Complete read counts for all 79 genes identified from RNA-Seq as inter-endothelial molecules, showing gene read counts for each each sample (untreated, IL-6 trans-signaling, or IL-6 classical signaling).

Author Contributions

Conceptualization, S.S., R.R. and A.S.; methodology, J.G., R.R.; statistical analysis, T.-J.L.; resources, S.S.; writing—original draft preparation, J.G., R.R.; writing—review and editing, S.S., A.S.; visualization, T.-J.L., A.S.; supervision, S.S.; project administration, S.S.; funding acquisition, S.S. All authors have read and agreed to the published version of the manuscript.

Funding

This research was funded by the National Institutes of Health, National Eye Institute (Bethesda, MD, USA) grant # R01-EY026936 awarded to Shruti Sharma, PhD and grant # P30-EY031631 Center Core Grant for Vision Research.

Institutional Review Board Statement

Not applicable.

Informed Consent Statement

Not applicable.

Data Availability Statement

The datasets used in the current study are available as Supplementary Tables S1 and S2.

Conflicts of Interest

The authors declare no conflict of interest. The funders had no role in the design of the study; in the collection, analyses, or interpretation of data; in the writing of the manuscript, or in the decision to publish the results.

References

  1. Klaassen, I.; Van Noorden, C.J.; Schlingemann, R.O. Molecular basis of the inner blood-retinal barrier and its breakdown in diabetic macular edema and other pathological conditions. Prog. Retin. Eye Res. 2013, 34, 19–48. [Google Scholar] [CrossRef] [PubMed]
  2. Antonetti, D.A.; Klein, R.; Gardner, T.W. Diabetic retinopathy. N. Engl. J. Med. 2012, 366, 1227–1239. [Google Scholar] [CrossRef] [Green Version]
  3. Kempen, J.H.; O’Colmain, B.J.; Leske, M.C.; Haffner, S.M.; Klein, R.; Moss, S.E.; Taylor, H.R.; Hamman, R.F.; West, S.K.; Wang, J.J. The prevalence of diabetic retinopathy among adults in the United States. Arch. Ophthalmol. 2004, 122, 552–563. [Google Scholar]
  4. Erickson, K.K.; Sundstrom, J.M.; Antonetti, D.A. Vascular permeability in ocular disease and the role of tight junctions. Angiogenesis 2007, 10, 103–117. [Google Scholar] [CrossRef]
  5. Frey, T.; Antonetti, D.A. Alterations to the blood-retinal barrier in diabetes: Cytokines and reactive oxygen species. Antioxid. Redox. Signal 2011, 15, 1271–1284. [Google Scholar] [CrossRef] [Green Version]
  6. Cheung, N.; Mitchell, P.; Wong, T.Y. Diabetic retinopathy. Lancet 2010, 376, 124–136. [Google Scholar] [CrossRef]
  7. Cunha-Vaz, J.; Bernardes, R.; Lobo, C. Blood-retinal barrier. Eur. J. Ophthalmol. 2011, 21 (Suppl. 6), S3–S9. [Google Scholar] [CrossRef]
  8. Eshaq, R.S.; Aldalati, A.M.Z.; Alexander, J.S.; Harris, N.R. Diabetic retinopathy: Breaking the barrier. Pathophysiology 2017, 24, 229–241. [Google Scholar] [CrossRef]
  9. Rangasamy, S.; McGuire, P.G.; Franco Nitta, C.; Monickaraj, F.; Oruganti, S.R.; Das, A. Chemokine mediated monocyte trafficking into the retina: Role of inflammation in alteration of the blood-retinal barrier in diabetic retinopathy. PLoS ONE 2014, 9, e108508. [Google Scholar] [CrossRef] [PubMed]
  10. Joussen, A.M.; Smyth, N.; Niessen, C. Pathophysiology of diabetic macular edema. In Diabetic Retinopathy; Karger Publishers: Basel, Switzerland, 2007; Volume 39, pp. 1–12. [Google Scholar]
  11. Sugimoto, M.; Cutler, A.; Shen, B.; Moss, S.E.; Iyengar, S.K.; Klein, R.; Folkman, J.; Anand-Apte, B. Inhibition of EGF signaling protects the diabetic retina from insulin-induced vascular leakage. Am. J. Pathol. 2013, 183, 987–995. [Google Scholar] [CrossRef] [Green Version]
  12. Gardner, T.W.; Larsen, M.; Girach, A.; Zhi, X.; Protein Kinase C Diabetic Retinopathy Study (PKC-DRS2) Study Group. Diabetic macular oedema and visual loss: Relationship to location, severity and duration. Acta Ophthalmol. 2009, 87, 709–713. [Google Scholar] [CrossRef] [PubMed]
  13. Diaz-Coranguez, M.; Ramos, C.; Antonetti, D.A. The inner blood-retinal barrier: Cellular basis and development. Vis. Res. 2017, 139, 123–137. [Google Scholar] [CrossRef] [PubMed]
  14. Yang, X.; Yu, X.-W.; Zhang, D.-D.; Fan, Z.-G. Blood-retinal barrier as a converging pivot in understanding the initiation and development of retinal diseases. Chin. Med. J. 2020, 133, 2586. [Google Scholar] [CrossRef] [PubMed]
  15. Kong, Y.; Naggert, J.K.; Nishina, P.M. The Impact of Adherens and Tight Junctions on Physiological Function and Pathological Changes in the Retina. Adv. Exp. Med. Biol. 2018, 1074, 545–551. [Google Scholar] [CrossRef] [PubMed]
  16. Hartsock, A.; Nelson, W.J. Adherens and tight junctions: Structure, function and connections to the actin cytoskeleton. Biochim. Biophys. Acta 2008, 1778, 660–669. [Google Scholar] [CrossRef] [Green Version]
  17. Rudraraju, M.; Narayanan, S.P.; Somanath, P.R. Regulation of blood-retinal barrier cell-junctions in diabetic retinopathy. Pharmacol. Res. 2020, 161, 105115. [Google Scholar] [CrossRef] [PubMed]
  18. de Wit, C.; Hoepfl, B.; Wölfle, S.E. Endothelial mediators and communication through vascular gap junctions. Biol. Chem. 2006, 387, 3–9. [Google Scholar] [CrossRef] [PubMed]
  19. Okamoto, T.; Usuda, H.; Tanaka, T.; Wada, K.; Shimaoka, M. The functional implications of endothelial gap junctions and cellular mechanics in vascular angiogenesis. Cancers 2019, 11, 237. [Google Scholar] [CrossRef] [PubMed] [Green Version]
  20. Tai, L.; Holloway, K.; Male, D.; Loughlin, A.; Romero, I. Amyloid-β-induced occludin down-regulation and increased permeability in human brain endothelial cells is mediated by MAPK activation. J. Cell. Mol. Med. 2010, 14, 1101–1112. [Google Scholar] [CrossRef] [Green Version]
  21. Hawkins, B.T.; Davis, T.P. The blood-brain barrier/neurovascular unit in health and disease. Pharmacol. Rev. 2005, 57, 173–185. [Google Scholar] [CrossRef]
  22. Luo, P.-L.; Wang, Y.-J.; Yang, Y.-Y.; Yang, J.-J. Hypoxia-induced hyperpermeability of rat glomerular endothelial cells involves HIF-2α mediated changes in the expression of occludin and ZO-1. Braz. J. Med. Biol. Res. 2018, 51, 1–7. [Google Scholar] [CrossRef] [Green Version]
  23. Campbell, M.; Cassidy, P.S.; O’Callaghan, J.; Crosbie, D.E.; Humphries, P. Manipulating ocular endothelial tight junctions: Applications in treatment of retinal disease pathology and ocular hypertension. Prog. Retin. Eye Res. 2018, 62, 120–133. [Google Scholar] [CrossRef]
  24. Valle, M.L.; Dworshak, J.; Sharma, A.; Ibrahim, A.S.; Al-Shabrawey, M.; Sharma, S. Inhibition of interleukin-6 trans-signaling prevents inflammation and endothelial barrier disruption in retinal endothelial cells. Exp. Eye Res. 2019, 178, 27–36. [Google Scholar] [CrossRef]
  25. Mesquida, M.; Drawnel, F.; Lait, P.J.; Copland, D.A.; Stimpson, M.L.; Llorenc, V.; Sainz de la Maza, M.; Adan, A.; Widmer, G.; Strassburger, P.; et al. Modelling Macular Edema: The Effect of IL-6 and IL-6R Blockade on Human Blood-Retinal Barrier Integrity In Vitro. Transl. Vis. Sci. Technol. 2019, 8, 32. [Google Scholar] [CrossRef] [Green Version]
  26. Tonade, D.; Liu, H.; Palczewski, K.; Kern, T.S. Photoreceptor cells produce inflammatory products that contribute to retinal vascular permeability in a mouse model of diabetes. Diabetologia 2017, 60, 2111–2120. [Google Scholar] [CrossRef] [PubMed] [Green Version]
  27. Rose-John, S. IL-6 trans-signaling via the soluble IL-6 receptor: Importance for the pro-inflammatory activities of IL-6. Int. J. Biol. Sci. 2012, 8, 1237. [Google Scholar] [CrossRef]
  28. Rabe, B.; Chalaris, A.; May, U.; Waetzig, G.H.; Seegert, D.; Williams, A.S.; Jones, S.A.; Rose-John, S.; Scheller, J. Transgenic blockade of interleukin 6 transsignaling abrogates inflammation. Blood J. Am. Soc. Hematol. 2008, 111, 1021–1028. [Google Scholar] [CrossRef]
  29. Kang, S.; Tanaka, T.; Narazaki, M.; Kishimoto, T. Targeting interleukin-6 signaling in clinic. Immunity 2019, 50, 1007–1023. [Google Scholar] [CrossRef] [PubMed]
  30. Rose-John, S.; Heinrich, P.C. Soluble receptors for cytokines and growth factors: Generation and biological function. Biochem. J. 1994, 300, 281–290. [Google Scholar] [CrossRef]
  31. Yun, J.H.; Park, S.W.; Kim, K.J.; Bae, J.S.; Lee, E.H.; Paek, S.H.; Kim, S.U.; Ye, S.; Kim, J.H.; Cho, C.H. Endothelial STAT3 Activation Increases Vascular Leakage Through Downregulating Tight Junction Proteins: Implications for Diabetic Retinopathy. J. Cell Physiol. 2017, 232, 1123–1134. [Google Scholar] [CrossRef]
  32. Yun, J.H.; Han, M.H.; Jeong, H.S.; Lee, D.H.; Cho, C.H. Angiopoietin 1 attenuates interleukin-6-induced endothelial cell permeability through SHP-1. Biochem. Biophys. Res. Commun. 2019, 518, 286–293. [Google Scholar] [CrossRef] [PubMed]
  33. Alsaffar, H.; Martino, N.; Garrett, J.P.; Adam, A.P. Interleukin-6 promotes a sustained loss of endothelial barrier function via Janus kinase-mediated STAT3 phosphorylation and de novo protein synthesis. Am. J. Physiol. Cell Physiol. 2018, 314, C589–C602. [Google Scholar] [CrossRef] [PubMed] [Green Version]
  34. Robinson, R.; Brown, D.; Churchwell, L.; Lee, T.-J.; Kodeboyina, S.K.; Bloom, J.; Sharma, A.; Sharma, S. RNA-Seq analysis reveals gene expression changes induced by IL-6 trans-signaling activation in retinal endothelial cells. Cytokine 2021, 139, 155375. [Google Scholar] [CrossRef] [PubMed]
  35. Szulcek, R.; Bogaard, H.J.; van Nieuw Amerongen, G.P. Electric cell-substrate impedance sensing for the quantification of endothelial proliferation, barrier function, and motility. J. Vis. Exp. 2014, 28, 51300. [Google Scholar] [CrossRef] [Green Version]
  36. Andrews, S. FastQC: A Quality Control Tool for High Throughput Sequence Data. 2010. Available online: https://www.bioinformatics.babraham.ac.uk/projects/fastqc/ (accessed on 20 July 2020).
  37. Liao, Y.; Smyth, G.K.; Shi, W. The R package Rsubread is easier, faster, cheaper and better for alignment and quantification of RNA sequencing reads. Nucleic Acids Res. 2019, 47, e47. [Google Scholar] [CrossRef] [Green Version]
  38. Rio, D.C.; Ares, M., Jr.; Hannon, G.J.; Nilsen, T.W. Purification of RNA using TRIzol (TRI reagent). Cold Spring Harb. Protoc. 2010, 2010. [Google Scholar] [CrossRef]
  39. Team, R.C. R: A Language and Environment for Statistical Computing; R Foundation for Statistical Computing: Vienna, Austria, 2013; Available online: http://www.R-project.org (accessed on 20 July 2020).
  40. Love, M.I.; Huber, W.; Anders, S. Moderated estimation of fold change and dispersion for RNA-seq data with DESeq2. Genome Biol. 2014, 15, 550. [Google Scholar] [CrossRef] [Green Version]
  41. Warnes, G.R.; Bolker, B.; Bonebakker, L.; Gentleman, R.; Huber, W.; Liaw, A.; Lumley, T.; Maechler, M.; Magnusson, A.; Moeller, S.; et al. Gplots: Various R Programming Tools for Plotting Data. Available online: https://rdrr.io/cran/gplots/ (accessed on 20 July 2020).
  42. Devarakonda, A.K.; Rafalovsky, E.G.; Lee, T.J.; Sharma, A. GOFIG: A tool for Gene Ontology Enrichment Analysis and Visualization. 2020. Available online: https://github.com/adidevara/GOFIG (accessed on 20 July 2020).
  43. Matsuda, M.; Kubo, A.; Furuse, M.; Tsukita, S. A peculiar internalization of claudins, tight junction-specific adhesion molecules, during the intercellular movement of epithelial cells. J. Cell Sci. 2004, 117, 1247–1257. [Google Scholar] [CrossRef] [PubMed] [Green Version]
  44. Antonetti, D.A.; Barber, A.J.; Khin, S.; Lieth, E.; Tarbell, J.M.; Gardner, T.W. Vascular permeability in experimental diabetes is associated with reduced endothelial occludin content: Vascular endothelial growth factor decreases occludin in retinal endothelial cells. Penn State Retina Research Group. Diabetes 1998, 47, 1953–1959. [Google Scholar] [CrossRef] [PubMed]
  45. Yue, Y.; Jiang, H.; Yan, S.; Fu, Y.; Liu, C.; Sun, X.; Chai, M.; Gao, Y.; Yuan, B.; Chen, C. RNA-seq analysis provide new insights into mapk signaling of apolipoproteinciii-induced inflammation in porcine vascular endothelial cells. Cell Cycle 2017, 16, 2230–2238. [Google Scholar] [CrossRef] [Green Version]
  46. Tőkés, A.-M.; Szász, A.M.; Juhász, É.; Schaff, Z.; Harsányi, L.; Molnár, I.A.; Baranyai, Z.; Besznyák, I.; Zaránd, A.; Salamon, F. Expression of tight junction molecules in breast carcinomas analysed by array PCR and immunohistochemistry. Pathol. Oncol. Res. 2012, 18, 593–606. [Google Scholar] [CrossRef]
  47. Xiao, L.; Wang, M.; Yang, S.; Liu, F.; Sun, L. A glimpse of the pathogenetic mechanisms of Wnt/β-catenin signaling in diabetic nephropathy. BioMed Res. Int. 2013, 2013, 987064. [Google Scholar] [CrossRef] [Green Version]
  48. Lee, K.; Hu, Y.; Ding, L.; Chen, Y.; Takahashi, Y.; Mott, R.; Ma, J.-x. Therapeutic potential of a monoclonal antibody blocking the Wnt pathway in diabetic retinopathy. Diabetes 2012, 61, 2948–2957. [Google Scholar] [CrossRef] [Green Version]
  49. Morcos, Y.; Hosie, M.J.; Bauer, H.C.; Chan-Ling, T. Immunolocalization of occludin and claudin-1 to tight junctions in intact CNS vessels of mammalian retina. J. Neurocytol. 2001, 30, 107–123. [Google Scholar] [CrossRef]
  50. Liebner, S.; Kniesel, U.; Kalbacher, H.; Wolburg, H. Correlation of tight junction morphology with the expression of tight junction proteins in blood-brain barrier endothelial cells. Eur. J. Cell Biol. 2000, 79, 707–717. [Google Scholar] [CrossRef] [PubMed]
  51. Anderson, J.M.; Van Itallie, C.M. Physiology and function of the tight junction. Cold Spring Harb. Perspect. Biol. 2009, 1, a002584. [Google Scholar] [CrossRef] [PubMed]
  52. Furuse, M.; Hata, M.; Furuse, K.; Yoshida, Y.; Haratake, A.; Sugitani, Y.; Noda, T.; Kubo, A.; Tsukita, S. Claudin-based tight junctions are crucial for the mammalian epidermal barrier a lesson from claudin-1–deficient mice. J. Cell Biol. 2002, 156, 1099–1111. [Google Scholar] [CrossRef] [PubMed]
  53. Morita, H.; Katsuno, T.; Hoshimoto, A.; Hirano, N.; Saito, Y.; Suzuki, Y. Connexin 26-mediated gap junctional intercellular communication suppresses paracellular permeability of human intestinal epithelial cell monolayers. Exp. Cell Res. 2004, 298, 1–8. [Google Scholar] [CrossRef]
  54. Kojima, T.; Sawada, N.; Chiba, H.; Kokai, Y.; Yamamoto, M.; Urban, M.; Lee, G.-H.; Hertzberg, E.L.; Mochizuki, Y.; Spray, D.C. Induction of tight junctions in human connexin 32 (hCx32)-transfected mouse hepatocytes: Connexin 32 interacts with occludin. Biochem. Biophys. Res. Commun. 1999, 266, 222–229. [Google Scholar] [CrossRef] [PubMed]
  55. Kojima, T.; Spray, D.C.; Kokai, Y.; Chiba, H.; Mochizuki, Y.; Sawada, N. Cx32 formation and/or Cx32-mediated intercellular communication induces expression and function of tight junctions in hepatocytic cell line. Exp. Cell Res. 2002, 276, 40–51. [Google Scholar] [CrossRef]
  56. Meşe, G.; Richard, G.; White, T.W. Gap junctions: Basic structure and function. J. Investig. Dermatol. 2007, 127, 2516–2524. [Google Scholar] [CrossRef] [PubMed] [Green Version]
  57. Maruo, N.; Morita, I.; Shirao, M.; Murota, S. IL-6 increases endothelial permeability in vitro. Endocrinology 1992, 131, 710–714. [Google Scholar] [PubMed]
  58. Bao, B.; Jiang, J.; Yanase, T.; Nishi, Y.; Morgan, J.R. Connexon-mediated cell adhesion drives microtissue self-assembly. FASEB J. 2011, 25, 255–264. [Google Scholar] [CrossRef] [PubMed] [Green Version]
Figure 1. IL-6 trans-signaling, but not classical signaling, disrupts endothelial barrier function in human retinal endothelial cells (HRECs). Electric cell impedance sensing (ECIS) apparatus was used to measure changes in barrier function. (A) IL-6 trans-signaling (TS) significantly disrupted trans-endothelial resistance (TER) in HRECs relative to untreated (UT), whereas there was no significant effect of IL-6 classical signaling (CS); (B) schematic representation of the impedance parameters for barrier integrity as measured by ECIS: paracellular resistance (Rb), indicative of the distance of intercellular junctions; cell membrane capacitance (Cm), a measure of cell membrane integrity, and basal adhesion (α), detailing subcellular attraction to the substrate; (C) IL-6 trans-signaling caused a drastic reduction in paracellular resistance (Rb) of intercellular junctions, and (D) a significant increase in cell membrane capacitance (Cm); (E) no change in basal adhesion (α) occurred. IL-6 classical signaling had no effect on all these parameters. Results are expressed as means ± SD; n = 3–5 biological replicates per group, * p-value < 0.05 vs. untreated (TS vs. UT); ns = not significant.
Ijtm 01 00010 g001
Figure 2. Global gene expression changes induced by IL-6 classical and trans-signaling in human retinal endothelial cells (HRECs). Gene expression levels were measured by RNA-Seq following IL-6 classical (CS) and trans-signaling (TS) activation, and differential expression analyses were performed using DESeq2 R package. (A) Volcano plot of differentially expressed genes induced by IL-6 trans-signaling relative to classical signaling (343 genes are upregulated, shown in red, and 141 genes are downregulated, shown in blue); (B) principle component analysis (PCA) of gene expression data depicting separation of 3 treatment groups; (C) unsupervised clustering revealed four clusters with distinct patterns of differential expression. Heat map colors represent row z-scores. Bar plots depict the average gene expression across treatment groups for cluster-1, -2, -3, and -4. Results are expressed as means ± SD; n = 5 per group. UT: Untreated group (blue), CS: IL-6 classical signaling group (green), TS: IL-6 trans-signaling group (red).
Ijtm 01 00010 g002
Figure 3. Biological processes (A); cellular components (B), and molecular functions (C) associated with differentially expressed genes in HRECs after activation of IL-6 classical and trans-signaling. Bioinformatics analysis was performed to determine significantly enriched Gene Ontology (GO) terms. The horizontal bars represent the number of genes annotated to each GO term and the black lines represent the p-value of enrichment.
Ijtm 01 00010 g003
Figure 4. Differential expression of genes encoding adherens junctions following IL-6 classical and trans-signaling activation in human retinal endothelial cells (HRECs). Relative mRNA expression levels of 9 catenin-related genes (A) and 23 cadherin-related genes (B). Results are expressed as means ± SD; n = 5 per group. UT: Untreated group (blue), CS: IL-6 classical signaling group (green), TS: IL-6 trans-signaling group (red). * p-value < 0.05 vs. untreated (TS vs. UT); ND = not detected.
Ijtm 01 00010 g004
Figure 5. The effects of IL-6 classical and trans-signaling on the genes involved in encoding tight junction proteins in human retinal endothelial cells (HRECs). The relative mRNA expression from RNA-Seq identified 27 genes that form or regulate tight junctions. Results are expressed as means ± SD; n = 5 per group, * p-value < 0.05 vs. untreated (TS vs. UT); † p-value < 0.05 vs. untreated (CS vs. UT); ND = not detected.
Ijtm 01 00010 g005
Figure 6. Differentially expressed genes encoding gap junctions following activation of IL-6 classical and trans-signaling in human retinal endothelial cells (HRECs). RNA-Seq analysis detected 20 gap junction-related genes and revealed significant changes in 3 genes due to IL-6 trans-signaling (TS) activation compared to untreated (UT). Results are expressed as means ± SD; n = 5 per group, * p-value < 0.05 vs. untreated (TS vs. UT); ND = not detected.
Ijtm 01 00010 g006
Figure 7. Confirmation of differentially expressed genes in inter-endothelial junctions of HRECs by qRT-PCR analysis. (A) Relative expression for three adherens junctions, including CDH12, CDH24, and CTNNAL1; (B) CLDN1, CLDN3, and CLDN11 genes were significantly downregulated in IL-6 trans-signaling group, with no significant effect observed from classical signaling; (C) GJA1 mRNA levels were measured, and RT-PCR confirmed its upregulation after IL-6 trans-signaling activation with no effect due to classical signaling. Results are expressed as means ± SD; n = 3–16, * p-value < 0.05 vs. untreated (TS vs. UT);  p-value < 0.05 vs. untreated (CS vs. UT).
Ijtm 01 00010 g007
Figure 8. Validation of differential expression of inter-endothelial junctional proteins following activation of IL-6 trans-signaling in HRECs. Protein expressions are normalized to β-actin and reported as fold changes relative to untreated. Results are expressed as means ± SD; n = 3–13, * p-value < 0.05 vs. untreated (TS vs. UT).
Ijtm 01 00010 g008
Figure 9. Summary of gene expression alterations to inter-endothelial junctions by IL-6 trans-signaling in HRECs. Significant changes in mRNA expression for (A) adherens junctions, (B) tight junctions, and (C) gap junctions are summarized as fold changes, showing upregulated genes (red) and downregulated genes (blue) relative to untreated (UT).
Ijtm 01 00010 g009
Table 1. Primers used for qRT-PCR confirmation of selected genes.
Gene NameGene SymbolDesigned qRT-PCR Primers
Forward Primer (5′→3′)Reverse Primer (5′→3′)
Cadherin 12CDH12GGACAGTCGTCAGCTTTCTCTCTTTCTGCCACTGACCACCT
Cadherin 24CDH24AGAGCTCGACAGTTCTGCACGTATCGTAGGGCTCAGCCAG
Catenin alpha like 1CTNNAL1TCTGACGCTGACTGCGAAATACCCTCTGCAGCAAAAACCT
Claudin 1CLDN1CCCAGTCAATGCCAGGTACGCAAAGTAGGGCACCTCCCAG
Claudin 3CLDN3GTCTAAGGGACAGACGCAGGAAGTATTGGCGGTCACCCAG
Claudin 11CLDN11TTGACTGCCTGCTTTGTGCTACCTCACGATGGTGGTCTCACG
Gap junction protein alpha 1GJA1CTGAGTGCCTGAACTTGCCTCTGGGCACCACTCTTTTGC
Glyceraldeyhde 3-phosphate dehydrogenaseGAPDHAATGAAGGGGTCATTGATGGAAGGTGAAGGTCGGAGTCAA
Table 2. Gene expression changes in adherens junctions, tight junctions, and gap junctions after activation of IL-6 classical and trans-signaling in human retinal endothelial cells (HRECs).
SymbolDescriptionFC (TS vs. UT)Adj. p-Value
(TS vs. UT)
FC (CS vs. UT)Adj. p-Value
(CS vs. UT)
Adherens Junctions
CTNNA1Catenin alpha 1−1.040.525−1.240.213
CTNNAL1Catenin alpha-like 1−1.21 *4.36 × 10−5−1.160.404
CTNNB1Catenin beta 11.070.235−1.170.380
CTNNBIP1Catenin beta interacting protein 1−1.29 *6.05 × 10−4−1.370.086
CTNNBL1Catenin beta-like 1−1.080.352−1.350.078
CTNND1Catenin delta 11.720.0891.060.889
CDH2Cadherin 2−1.090.112−1.130.474
CDH5Cadherin 5−1.080.138−1.140.467
CDH6Cadherin 6−1.66 *5.96 × 10−20−1.100.637
CDH11Cadherin 111.74 *3.08 × 10−14−1.060.774
CDH12Cadherin 121.97 *2.35 × 10−4−1.11NA
CDH13Cadherin 13−1.120.076−1.210.290
CDH15Cadherin 151.380.108−1.48NA
CDH24Cadherin 24−1.67 *8.42 × 10−15−1.210.202
Tight Junctions
CLDN1Claudin 1−3.27 *6.91 × 10−10−1.52NA
CLDN3Claudin 3−4.44 *3.91 × 10−8−1.45NA
CLDN4Claudin 4−1.260.3681.75NA
CLDN5Claudin 5−1.040.723−1.390.052
CLDN7Claudin 7−1.130.131−1.300.155
CLDN11Claudin 11−1.85 *2.79 × 10−52−1.250.181
CLDN12Claudin 121.25 *0.0031.020.936
CLDN14Claudin 14−1.36 *2.17 × 10−4−1.15NA
CLDN15Claudin 151.040.8231.48 *0.048
CLDND1Claudin domain containing 11.080.217−1.190.373
TJAP1Tight junction associated protein 1−1.060.473−1.060.732
TJP1Tight junction protein 11.17 *0.0131.040.866
TJP2Tight junction protein 2−1.31 *9.83 × 10−8−1.120.548
Gap Junctions
GJA1Gap junction protein alpha 11.49 *1.75 × 10−18−1.180.366
GJA4Gap junction protein alpha 4−2.41 *2.36 × 10−9−1.89NA
GJC1Gap junction protein gamma 1−1.19 *0.002−1.090.661
GJC2Gap junction protein gamma 2−1.190.438−1.33NA
GJD3Gap junction protein delta 31.160.056−1.240.207
FC: Fold Change; TS vs. UT: IL-6 trans-signaling vs. untreated; CS vs. UT: IL-6 classical signaling vs. untreated; Adj. p-value: FDR adjusted p-value; NA: adj. p-values were not calculated due to smaller read counts. Data represents UT (n = 5), TS (n = 5), and CS (n = 5). * p-value < 0.05.
Publisher’s Note: MDPI stays neutral with regard to jurisdictional claims in published maps and institutional affiliations.

