
Review of OCT Angiography Findings in Diabetic Retinopathy: Insights and Perspectives


1
Pritzker School of Medicine, University of Chicago, Chicago, IL 60637, USA
2
Department of Ophthalmology and Visual Science, University of Chicago Medical Center, Chicago, IL 60637, USA
3
J. Terry Ernest Ocular Imaging Center, University of Chicago Medical Center, Chicago, IL 60637, USA
*
Author to whom correspondence should be addressed.
Int. J. Transl. Med. 2021, 1(3), 286-305; https://0-doi-org.brum.beds.ac.uk/10.3390/ijtm1030017
Submission received: 27 October 2021
/
Revised: 11 November 2021
/
Accepted: 15 November 2021
/
Published: 16 November 2021
(This article belongs to the Special Issue Diabetic Retinopathy)
Abstract
:Diabetes mellitus (DM), a disorder rapidly growing in prevalence, is linked to the retinal microvasculature complication diabetic retinopathy (DR). As one of the leading global causes of vision impairment and loss, imaging techniques to detect and monitor DR must continue to improve in order to address this growing burden. Optical coherence tomography angiography (OCTA) is a nascent imaging modality that generates three-dimensional visualizations of the retinal and choroidal microvasculature. Compared to fluorescein angiography, the gold-standard imaging modality for retinal vessels, OCTA offers the advantages of being non-invasive, quick, and able to resolve the multiple plexuses within the retina. Quantitative OCTA studies have explored parameters such as vessel density (VD), foveal avascular zone (FAZ), acircularity index, vessel tortuosity (VT), and fractal dimension (FD) amongst DR patients. This review synthesizes the main trends emerging from quantitative OCTA-based studies of DR and interrogates them within the context of DR pathophysiology. We offer a glimpse into how analysis techniques have shifted in the years since OCTA came into existence, while speculating on its future role in clinical practice.
1. Introduction
Diabetes mellitus (DM) is a substantial public health crisis that is projected to rise in prevalence, mortality, and burden throughout the next century. Current studies estimate that anywhere from 463 to 476 million individuals live with DM today, representing over 6% of the global population [1,2,3]. Forecasts from the International Diabetes Federation predict that global DM prevalence will grow to nearly 700 million individuals by the year 2045 [4]. DM is a major cause of morbidity and mortality, coming in as the 15th leading cause of years of life lost in 2015, demonstrating an increase of 25.4% from 2005 [5]. Costs of DM also represent a significant economic burden at 1.8% of the global gross domestic product (GDP) in 2015, with projections for DM-related costs reaching an estimated 2.2% of global GDP by the year 2030 [6,7]. With the global DM landscape becoming increasingly dire, so too are DM-related complications.
Poor glycemic control amongst individuals with DM results in damage to the systemic macro- and micro-vasculature, including the condition diabetic retinopathy (DR). DR can be divided into non-proliferative (NPDR) and proliferative (PDR) stages. Characteristic features of NPDR include intraretinal hemorrhages, hard exudates, microaneurysms, and capillary non-perfusion [8]. Hypoxic changes can cause progression to PDR, an advanced stage of the disease hallmarked by neovascularization, which is the abnormal growth of new vessels [9]. Neovascularization precipitates severe vision impairments when new vessels cause retinal detachment or vitreous hemorrhage [10]. DR affected 103 million adults in 2020, a number that is expected to grow to 160 million by the year 2045 [11]. Worldwide, DR was the 5th leading cause of moderate to severe vision impairment and the 5th leading cause of blindness in 2020 [12]. Diabetic macular edema, which can occur at any stage of DR, is characterized by fluid accumulation due to the occurrence of blood-retinal barrier breakdown and represents the leading cause of blindness amongst the diabetic population [13]. Given the rising prevalence of DM and DR and that vision impairment and blindness stemming from DR can be prevented with early detection and treatment in a vast majority of patients, the development of an efficient and cost-effective DR screening program represents a promising opportunity in the years to come.
Optical coherence tomography angiography (OCTA) has, in just a few short years, revolutionized the field of ophthalmic imaging. OCTA offers a quick, non-invasive, and depth-resolved method of imaging the retinal and choroidal micro-circulation. OCTA is an extension of optical coherence tomography (OCT), which is built on the principle of light interference [14]. A beam of light is applied to the retina and subjected to backscattering, reflection, or absorption by structures within the posterior segment of the eye. A reference beam of light is compared to a beam of light that “samples” the retina, with differences between these two light paths yielding a depth profile of the retina [15]. In OCTA imaging, a series of B-scans are captured at the same position within the retina, and differences in these successive B-scans are analyzed. Given that the retina is a static tissue, any differences between B-scans are expected to arise from the movement of red blood cells within the circulation only. These differences are termed the decorrelation signal, and a map of the decorrelation signal represents the vascular anatomy of the retina [16]. A complete three-dimensional view of the vasculature is captured by performing B-scans in a raster pattern that fully covers the retina. Since their introduction into the commercial market in 2016, OCTA instruments have been used in numerous studies that have furthered our understanding of a wide range of chorioretinal diseases [17,18]. Its application in the study of DR holds particular promise.
In this review, we evaluate the clinical utility of OCTA quantitative metrics as they relate to the diagnosis, staging, and the pathophysiology of diabetic retinopathy.
2. OCT Angiography and Fluorescein Angiography
2.1. General Comparison of OCT Angiography and Fluorescein Angiography
Fluorescein angiography is considered the gold standard in evaluating the retinal microvasculature in cases of DR [19]. However, one of the main drawbacks of fluorescein angiography is that it requires the intravenous injection of dye, which causes anaphylactic reactions in rare cases [20,21]. OCTA, on the other hand, is completely non-invasive and acquires angiograms of the retinal and choroidal vasculature within seconds. This makes OCTA an appealing option to longitudinally track the progression of DR and its response to treatment. OCTA is also depth-resolved, giving it the ability to visualize the vasculature of the middle (MCP) and deep capillary plexuses (DCP) (Figure 1), while fluorescein angiography is mainly limited to the superficial capillary plexus (SCP) [22]. The SCP supplies the ganglion cell layer and inner plexiform layer, while the MCP is located at the border of the inner plexiform layer and inner nuclear layer, and the DCP is found between the border of the inner nuclear layer and outer plexiform layers [23,24]. Commercial OCTA machines utilize both spectral domain (SD-OCTA) and swept source (SS-OCTA), with the latter enabling better visualization of the choroidal circulation. Hence, OCTA is able to precisely locate changes occurring at each of the capillary plexuses as well as the choriocapillaris due to DR.
One of the limitations of OCTA is its comparably smaller field of view. Several studies have demonstrated the use of SS-OCTA, which has faster scanning speeds compared to SD-OCTA, to capture 12 × 12 mm single scan sizes with up to a 100-degree field of view [25,26,27]. However, this does not compare to the 200-degree field of view that can be captured with ultra-widefield fluorescein angiography [28,29]. This is an important limitation of OCTA devices, as it confines their applicability to diseases primarily affecting the macula. For these reasons, fluorescein angiography will likely remain the superior choice for evaluating changes in the peripheral microvasculature in DR.
2.2. OCT Angiography Artifacts
OCTA is also susceptible to a variety of artifacts. Motion artifacts stem from the movement of a patient’s eye, head, or body during the image acquisition process. These movements create a false decorrelation signal that is not representative of moving erythrocytes. While programs exist to correct for these movements, they too can generate artifacts that stretch or double vessels, which presumably artificially inflates quantitative OCTA metrics [30].
Segmentation artifacts, a consequence of errors in separating the vascular layers, have also been reported to occur in higher rates amongst patients with DM, NPDR, or PDR compared to healthy controls, representing another potential source of confounding [31,32]. These artifacts likely arise from the distorted or abnormal retinal architecture that can arise in states of ocular disease. While these segmentation artifacts can be corrected manually, this is an intensely time-consuming process [33].
Projection artifacts describe the appearance of superficially situated vessels in the deeper vascular layers of the retina. A variety of programs have been implemented to remove these projections occurring in the deeper capillary plexuses [34,35]. One would presume that the removal of projection artifacts would consistently decrease measurements of vessel density (VD) at the DCP. However, projection removal has had a varying effect on VD measurements at the DCP depending on the severity of DR, suggesting a likely interplay with the pathophysiology of the disease state [36].
2.3. Comparison of Morphological Characteristics of Diabetic Retinopathy Seen by OCT and Fluorescein Angiography
In general, morphological features of DR that had been previously visualized by fluorescein angiography have been replicated by OCTA imaging. Microaneurysms are detected as focally dilated capillaries that appear as pinpoint hyperfluorescent lesions in fluorescein angiography and as saccular, pedunculated, or fusiform in OCTA imaging (Figure 2A,B) [37]. Multiple studies comparing the two imaging modalities have observed that fluorescein angiography detects a greater number of microaneurysms compared to OCTA [37,38,39,40,41]. Histopathological studies have identified subtypes of microaneurysms lacking blood flow [42]. Furthermore, measurements of relative blood speeds revealed slower flow in microaneurysms [43]. Given that OCTA relies on moving blood flow, these findings provide possible explanations for the lower detection rate of microaneurysms. An advantage of OCTA is that it enables the precise localization of microaneurysms. A custom algorithm has been developed that provides three-dimensional visualizations of microaneurysms, elaborating on their architecture and orientation [44].
Neovascularization of the retina (NVE) or optic disc (NVD) are hallmarks of the proliferative stage of DR. In the later phases of fluorescein angiography, these vessels will demonstrate characteristic leakage of circulating dye [45]. However, leakage can mask clear resolution of neovascular complexes. OCTA’s quick scan time prevents this effect from occurring, offering enhanced visualization of neovascularization. In OCTA, neovascularization appears as abnormally tangled vessels with flow above the optic disc (NVD) or above the internal limiting membrane in the retinal area (NVE) [46]. Numerous studies have demonstrated the effectiveness of OCTA to image both NVD and NVE [47,48,49,50,51,52,53,54]. Other studies have extended the use of OCTA as a tool to longitudinally track the therapeutic benefit of anti-VEGF agents or panretinal photocoagulation (PRP) in treating neovascularization in PDR [55,56,57,58,59]. Compared to ultra-widefield fluorescein angiography, a wide-angle OCTA device demonstrated 100% sensitivity and 97% specificity in the detection of neovascularization, albeit in a limited number of eyes [26]. In a separate study of 37 eyes, widefield-OCTA was found to have 79% sensitivity and 96% specificity for neovascularization detection compared to fluorescein angiography [60]. Collectively, these studies suggest that OCTA is a viable alternative to fluorescein angiography for identifying and tracking neovascularization during PDR. In fact, it may be preferentially indicated in circumstances of repeated use due to its advantages in the fields of comfort and image acquisition speed.
3. Quantitative OCT Angiography Biomarkers in Diabetic Retinopathy
A wealth of quantitative OCTA metrics have been described as possible biomarkers for the detection and progression of both DM and DR. These parameters include measurements of vessel density (VD) or vessel length density (VLD); the area, perimeter, and acircularity of the foveal avascular zone (FAZ); fractal dimension (FD); vessel tortuosity (VT); and flow deficits and areas of non-perfusion within the choriocapillaris. While measurements of VD and FAZ parameters are built into some commercially available OCTA devices, they are inconsistently used in the literature, with some groups opting to use custom software packages in their analysis [61,62,63,64]. These biomarkers show immense promise for detecting DR, monitoring disease severity, and tracking response to treatment. Both thoroughly reported and emerging OCTA findings in the settings of DM and DR are discussed below.
3.1. Perfusion and Vessel Density
Perfusion (PD) or vessel density (VD) measurements are some of the most widely reported OCTA parameters in the literature. VD relies upon a binarization algorithm, whereby the total area of pixels corresponding to blood vessels is calculated. This value is then divided by the total area of the scanned area of interest. Measures of skeletonized VD or vessel length density (VLD) binarize the image and perform an additional skeletonizing process that reduces the width of each blood vessel to 1 pixel. The skeletonized VD then quantifies the proportion of cumulative vessel length within the area of interest. This process has several advantages and limitations compared to the VD measurement. Skeletonized VD equally weighs the contribution of large vessels and smaller capillaries to density measurements and may, thus, better capture changes that are occurring in the retinal microvasculature compared to a VD measurement [65]. Given that DR manifests primarily as a disease of the microvasculature, this could be especially advantageous for detecting changes occurring at the capillary level [66]. Without additional information, VD measurements may prove difficult for interpreting changes in the vasculature correctly. Compensatory vasodilation can be observed with capillary drop-out, failing to noticeably alter VD. However, the skeletonizing process loses information about the size of blood vessels, so it does not capture the full picture either. An underreported parameter in the literature that may solve this dilemma is vessel diameter index (VDI), which is calculated by dividing the area occupied by blood vessels in the binarized image by the length of blood vessels in the skeletonized image. This parameter is, thus, a measure of the vessel caliber and can be easily localized to pinpoint areas of vascular abnormalities [65]. Vessel caliber could be used to track a number of physiologic processes, such as the release of vasoactive substances, metabolic and pressure autoregulation, and hypoxia [67,68,69]. Furthermore, this measurement may be uniquely primed to detect regional disparities between the central macula and peripheral retina when it comes to arteriolar diameter responses to ischemia [70]. With this in mind, the trio of OCTA-based VD, skeletonized VD, and VDI measurements collectively provide robust insights into the vasculature changes occurring in DR.
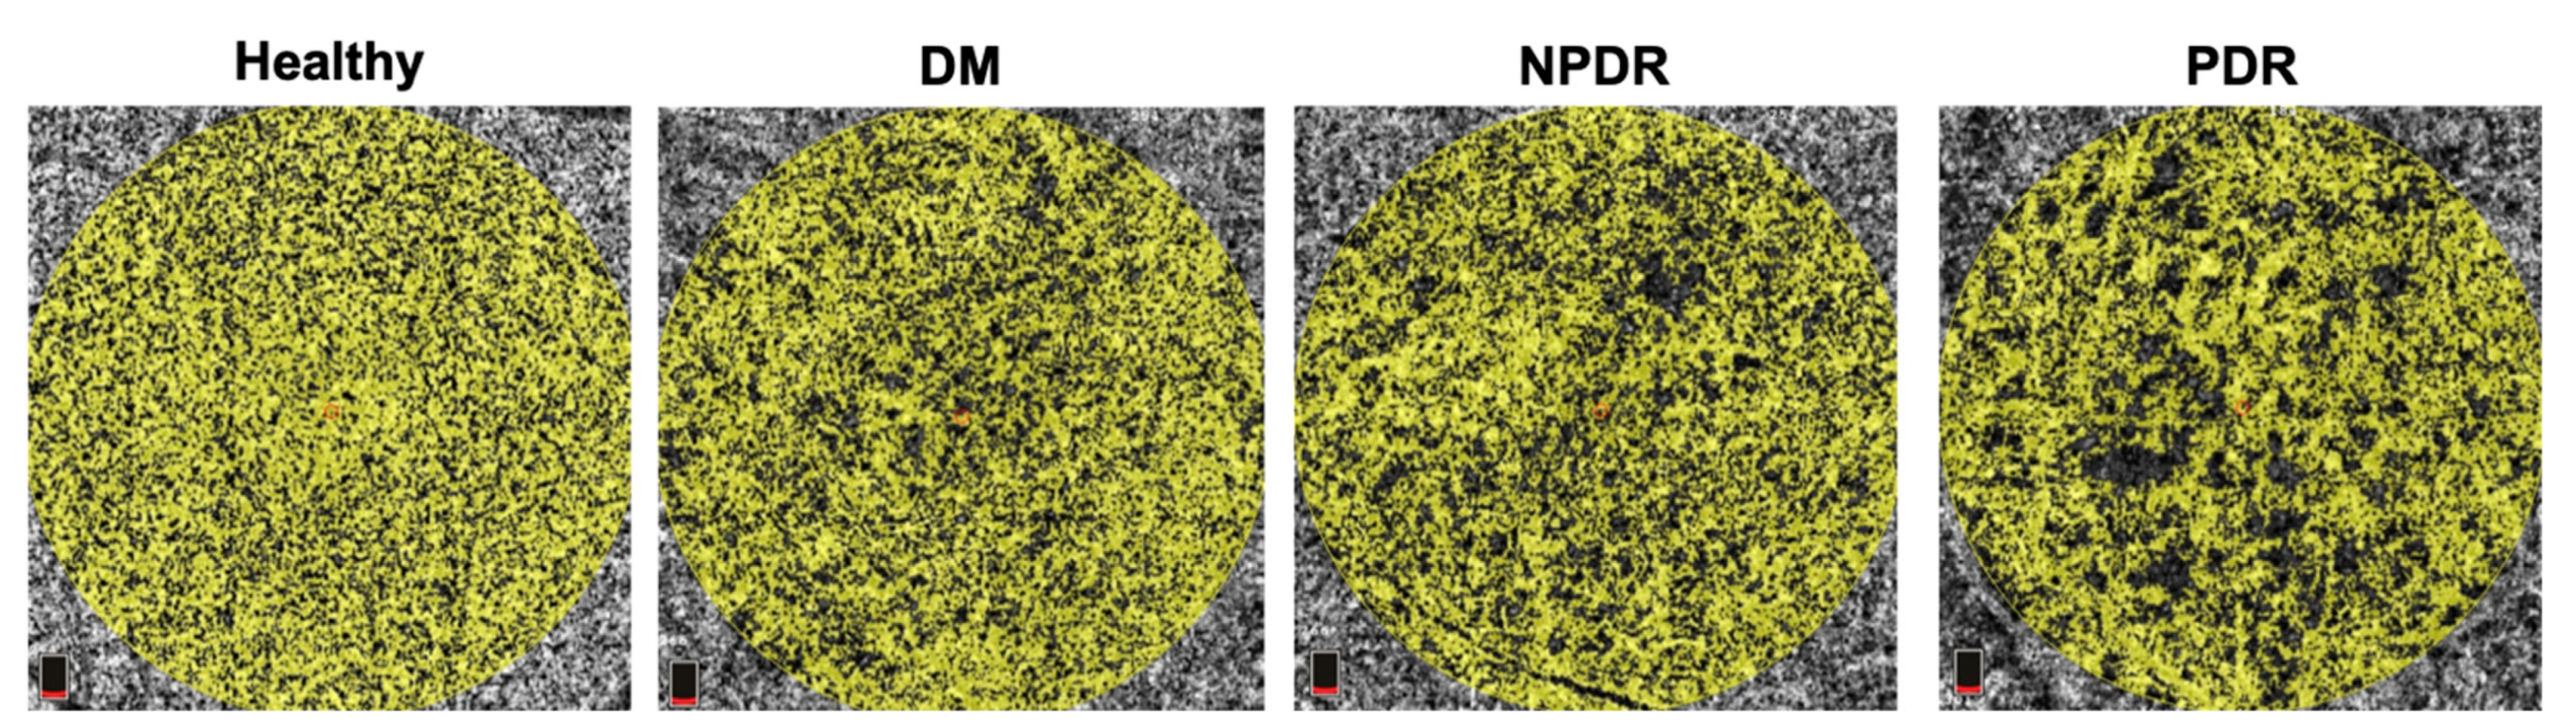
In all three capillary plexuses (SCP, MCP, and DCP), decreasing VD and VLD have both been found to be associated with increasing severity of DR (Figure 3) [71,72,73,74,75,76,77,78]. Furthermore, diminishing VD has been linked to poorer visual acuity in patients with DR, heightening the functional significance these parameters may bear out [79,80]. Studies of OCTA metrics utilize a variety of analysis techniques and devices (including SD-OCTA, SS-OCTA, and Widefield-OCTA); segmentation boundaries of the capillary plexuses; and patient populations. Initial studies focused on the SCP and DCP as sites of interest, as manual segmentation techniques were not well-described at the time, nor was projection-artifact software fully optimized and implemented. Following SS-OCTA imaging of a 3x3mm area centered on the fovea, Tang et al. used an automated customized program to analyze the VD and VDI at the SCP of 434 eyes from 286 patients with diabetes [71]. They found decreasing VD and increasing VDI were associated with worsening severity of DR, suggesting capillary drop-out accompanied by vasodilation [71]. Similarly, Nesper et al. and Li et al. found decreasing VD at the parafovea (defined as the area between an inner 1 mm ring and outer 2.5 mm or 3 mm ring centered on the fovea) of the SCP and DCP as DR staging advanced with the use of a SD-OCTA device [73,74]. Nesper et al. also identified that VD at the DCP correlated most strongly with DR severity [74]. In the segmentation scheme used by both groups, the DCP supplies the outer plexiform layer, a site of communication between horizontal cells and the inner segments of photoreceptors [24,73,74]. In studies using rat and macaque models, the outer plexiform layer was identified as having some of the highest oxygen demands in the retina, rendering this area especially susceptible to the effects of ischemic damage [81,82]. In humans, areas of photoreceptor dysfunction and disorganization closely align with areas of non-perfusion within the DCP, leading to diminished retinal sensitivity [83,84]. Hence, changes in perfusion at the DCP, as detected by OCTA, may show the first signs and predict the development of DR.
Studies employing widefield SS-OCTA demonstrated that individuals with DR have lower VLD in the SCP and DCP compared to non-DM controls [72,75]. Mastropasqua et al. analyzed a wide field of view (15 × 15 mm scan area) for changes in VLD at an inner 5.5 mm macular region and in 4.5 mm circles peripheral to the macula [72]. Patients with advanced DR, classified as a moderate/severe NPDR group and a PDR group, had significantly lower VLD in the 5.5 mm macular area of the SCP and DCP when compared to respective non-DM and DM groups without retinopathy [72]. Significantly lower VLD persisted in the peripheral area temporal to the macula in groups classified as having advanced DR compared to non-DM and DM subjects without retinopathy [72]. Similarly, Hirano et al. used a widefield SS-OCTA system to measure VLD in a 12 × 12 mm scan area, finding decreasing VLD in the SCP and DCP as DR severity worsened across subject groupings [75]. Hence, widefield OCTA is a valuable tool for evaluating changes in the peripheral retina.
Innovation of projection artifact removal software and the introduction of novel segmentation schemes have enabled the visualization and the subsequent quantification of the MCP (Figure 1B) [35,85,86,87]. Previously, most automatic segmentation by commercial OCTA devices incorporated the MCP into the SCP. Analysis of the MCP as a distinct vascular layer opened a window of opportunity to understand how DR may have spatially unique impacts. In general, studies have found that trends within the MCP mirrored those occurring at the SCP and DCP; as DR severity increased, VD and VLD both decreased [76,77,78]. Interestingly though, DR severity had different effects on the vascular layers. Onishi et al. studied the adjusted flow index (AFI), an approximation of blow flow, at the three capillary plexuses of the retina [76]. They noted that while AFI failed to decline substantially at the SCP as DR severity progressed amongst the study groups, it did decrease steeply at the MCP and DCP; significant differences between the slope of the SCP AFI regression line and the slopes of both the MCP and DCP AFI regression lines were confirmed with linear mixed-effects regression models [76]. Ashraf et al. used OCTA to analyze the VD and VLD of all three capillary plexuses, observing that early DR manifested in changes primarily affecting the MCP and DCP, while advanced DR impacted the SCP more dramatically [77]. Collectively, these studies support segmentation schemes that analyze the SCP, MCP, and DCP separately across the spectrum of DR severity.
Some OCTA studies found diminished VD in the eyes of DM patients without DR compared to the eyes of healthy controls in the SCP, MCP, or DCP [76,88,89,90]. Others, however, have not found significant differences in VD between non-DM and DM subjects without DR at the SCP or DCP [74,91,92]. These varying results likely stem from differences in one or more of study demographics, correction for co-variates, segmentation boundaries, and OCTA devices across studies. A unique study observed an increase in perfusion density at the full-retinal slab in the eyes of DM subjects without DR compared to healthy controls after the removal of non-capillaries from image analysis [93]. Rosen et al. subtracted larger, non-capillaries from angiograms and analyzed the area perfused by capillaries (PCD) at seven 200 µm wide annuli starting at the margin of the FAZ; in each of these seven annuli, PCD was significantly higher in the DM group without DR than in the non-DM group [93]. This finding may be explained by compensatory vasodilation occurring in capillaries, a hypothesis consistent with other studies that found an increase in vessel caliber with worsening DR [71,94]. Whether OCTA measures of perfusion can distinguish between non-DM and DM groups remains unclear. Further prospective and longitudinal studies may help to understand microvascular changes occurring in those that develop DM.
3.2. FAZ Area and FAZ-Related Measurements
The foveal avascular zone (FAZ) is the central area of the macula devoid of retinal capillaries. Early studies that sought to quantify the area (mm2) of the FAZ relied upon fundus fluorescein angiography. The use of fluorescein angiography revealed significantly larger FAZ circumference and diameter in DM subjects compared to controls, as well as increasing FAZ size and irregularity with worsening retinopathy [95,96]. The area and perimeter of the FAZ are readily measured using OCTA, oftentimes through built-in software. In general, there is strong agreement between OCTA and fluorescein angiography when it comes to the assessment of the FAZ area in patients with DR [38,97]. FAZ area may also be an important biomarker for visual functioning and prognosis in the setting of disease. In patients with DR, a positive correlation between best-corrected visual acuity (LogMAR) and FAZ area has been found by several studies [80,98,99]. In other words, enlarged FAZ areas are associated with poorer vision.
As corroborated extensively in the literature, FAZ size increases with the progression of DR (Figure 4) [71,74,78,100,101,102,103]. Several of these studies evaluated the FAZ of the SCP and DCP separately. This approach may be erroneous, as Campbell et al. demonstrated that the three capillary plexuses coalesce to define the perimeter of the FAZ [24]. Measuring the FAZ from a full-thickness slab with all retinal microvasculature visualized could better approximate its area. This is not the only issue that arises when using FAZ-based metrics. Within normal eyes, the size of the FAZ is highly variable, influenced by patient age, sex, race, central foveal thickness, and axial length [104,105,106,107,108,109]. Foremost among these factors is axial length, a measure of the length of the eyeball from the corneal surface to the retinal pigment epithelium. Longer axial lengths are associated with myopia and can affect the size of the FAZ. Those with longer axial lengths (e.g., high myopes) will have a seemingly smaller FAZ, while those with shorter axial lengths will have a larger appearing FAZ. Both Linderman et al. and Sampson et al. have demonstrated a need to correct for magnification effects stemming from axial length [104,110]. After correction, Sampson et al. found up to a 51% increase in the FAZ area for those with myopia and up to a 20% decrease in the FAZ area for those with hyperopia [110]. Studies that don’t implement correction protocols could be confounded by control and experimental groups with different axial length distributions.
While axial length can be readily measured using optical biometry, this is not a built-in feature for commercial OCTA devices. Alternative parameters to FAZ area do exist, however, and include FAZ circularity and acircularity indices. These values are unitless quotients, meaning that they are not subject to the magnification effects that can stem from axial length, and they do not require correction. Acircularity index is the ratio of the perimeter of the FAZ to the perimeter of a circle with equal area; an acircularity index of 1 represents a perfect circle, while more irregular FAZ perimeters have a higher acircularity index. Circularity index is a similar measurement of the ratio of the FAZ area to the area of a circle with equal perimeter; a circularity index of 1 corresponds to a perfect circle, and more irregularity is found with decreasing circularity index. A positive correlation between FAZ acircularity index and DR severity has been found by multiple studies (Figure 4) [93,111,112,113], and a negative correlation between FAZ circularity and DR severity has also been identified [71,113,114,115]. Krawitz et al. measured the FAZ acircularity index and FAZ axis ratio in type 2 DM subjects without retinopathy, with NPDR, and with PDR [111]. They defined axis ratio as the ratio between the major and minor axis of an ellipse fit with second-order moments; an elongated FAZ outline had greater eccentricity and, hence, a greater axis ratio [111]. After classifying the NPDR group into mild, moderate, and severe stages, Krawitz et al. used a generalized linear model to show a significantly increasing FAZ acircularity index and axis ratio with increasing disease severity from non-DM to PDR groups [111]. The researchers did not find significant differences in acircularity index or axis ratio between non-DM and DM subjects without DR, which is in agreement with other studies of its kind [93,111,113]. When axial length correction is not possible or feasible, FAZ acircularity or circularity parameters serve as comparable substitutes for assessing DR severity through OCTA.
3.3. Fractal Dimension Analysis
The complexity of vessel branching in the retina has been studied using fractal dimension (FD). Early studies of FD in DR primarily utilized color fundus photographs. These studies reached conflicting conclusions, with some finding no association between FD and DR risk and/or severity [116], others finding increased FD to be associated with DR risk and/or severity [117,118,119], and others yet finding decreased FD to be associated with DR risk and/or severity [120,121]. These mixed results warranted further study, and OCTA has been used to add some clarity to the literature, with studies yielding more consistent findings of FD across the spectrum of DR severity.
FD at the SCP and DCP has been well characterized as negatively correlated with worsening DR severity, implying that branching patterns become less complex due to vessel dropout associated with DR progression [71,75,94,122,123]. In the setting of diabetic macular edema, lower FD was also correlated with poorer visual acuity, suggesting a possible use as a biomarker for visual functioning in DR [124]. Zahid et al. generated a measurement for FD at the SCP and DCP using the box-counting method, finding that DM eyes with DR had significantly lower FD compared to control eyes [122]. Kim et al. uncovered similar findings at the SCP, noting that mild NPDR, severe NPDR (a combination of moderate and severe NPDR subjects), and PDR groups all had significantly lower FD relative to controls [94]. At the DCP, though, significant differences in FD emerged only when comparing the PDR group to the healthy group [94]. Zahid et al. grouped five eyes with mild NPDR and eight eyes with PDR together, which prevented the comparison of different NPDR stages [122]. Due to the modest number of eyes included in both studies, larger sample sizes may be needed to detect the point in time at which significant differences in FD arise throughout the pathophysiological process of DR. FD may also have value in monitoring response to treatment. Fayed et al. compared the FD of perifoveal vessels in quiescent PDR eyes to PDR eyes also receiving PRP (PDR+PRP) [123]. Focusing on the SCP, the PDR+PRP group had a higher FD value than the PDR group, suggesting that this morphological change may be at least somewhat reversible [123]. FD may be a useful adjunct to other OCTA parameters in assessing DR severity, progression, and treatment response. However, analysis of FD at each of the three capillary plexuses represents a logical next step, as to our knowledge, this is not documented in the literature.
3.4. Emerging Insight into Vessel Tortuosity
Relatively few studies have used OCTA to examine vessel tortuosity (VT), a measure of retinal geometry that compares the length of a vessel’s flow path to a straight line between the starting and ending points of the vessel’s path. Studies using fundus photographs found VT to be increased among DR subjects compared to healthy controls or to DM subjects without DR [125,126], and longer diabetes duration was also associated with greater tortuosity of retinal arteriolar vessels [127]. These studies imaged the large vessels proximal to the optic disc, which left an opportunity for OCTA imaging to investigate changes occurring in the capillaries of the macula. Using SD-OCTA, Lee et al. noted a trend of increasing VT for all vessels in the SCP and DCP with worsening NPDR; progression from moderate-severe NPDR to PDR was marked by a significant decrease in VT [128]. Fayed et al. also investigated VT, focusing only on large perifoveal vessels of the SCP, while excluding capillaries from their measurements of VT [123]. They also found significantly increasing VT with DR severity, but did not find a significant decrease in VT amongst PDR patients compared to NPDR patients [123]. The discrepancy in this last finding likely stems from the pattern of vasculature analysis used by the two groups. The method employed by Lee et al. included capillaries, while that employed by Fayed et al. did not [123,128]. Profound capillary dropout in PDR could artificially deflate measurements of VT and account for the contrasting conclusions reached by the groups. A study of the cerebral cortex, which found vessels closer to the capillary bed to be more tortuous, supports this interpretation [129]. OCTA is a valuable and effective tool for monitoring VT, yet future studies are required to fully characterize the use of VT as a biomarker for DR.
Several theories may explain changes occurring to VT and fit within the pathophysiological process of DR. In a rat model deprived of oxygen, vascular endothelial growth factor (VEGF) signaling increased arteriolar tortuosity [130]. Furthermore, in eyes with central retinal vein occlusion, concentrations of aqueous VEGF were significantly correlated with the observed degree of venous tortuosity [131]. A similar model may be followed in DR, where VEGF is released in response to ischemia, promoting tortuous alterations to the microvasculature. A computational model found that tortuosity also improves responses to ischemic changes by increasing tissue oxygenation, especially in concert with anastomoses [132]. Alternatively, impaired autoregulatory responses mediated by endothelial cell and pericyte dysfunction, which are hallmarks of DR, could lead to mechanically unstable vessel walls susceptible to tortuous changes [133,134].
3.5. OCTA Findings at the Choriocapillaris
OCTA has also been used as a tool to study the choroidal vasculature, which is the primary blood supply to the highly metabolically active photoreceptors [135]. Indocyanine green angiography (ICGA) is the current gold standard for visualizing the choriocapillaris [136]. However, OCTA holds an advantage over ICGA in that it offers non-invasive, depth-resolved, and non-obscured imaging of the choriocapillaris. Furthermore, recent advances with SS-OCTA have enabled better visualization of the choroid. Compared to SD-OCTA, which uses a light source of approximately 850 nm, SS-OCTA uses a longer wavelength near 1050 nm that offers better penetration into the choroid [137,138]. Hence, OCTA wields the power to image both the retinal and choroidal circulation in a completely non-invasive manner.
Several parameters have been described to measure choriocapillaris perfusion or the lack thereof, including perfusion or vessel density, percent area of non-perfusion (PAN), and flow deficit percentage. Commercial OCTA machines, which can automatically quantify vessel density at the choriocapillaris, may not be able to resolve the distinctive capillaries at this layer. While the average intercapillary area of the choriocapillaris is 5–20 µm, the lateral resolution of commercial SD-OCTA instruments is only 15–20 µm [139,140]. Hence, measurements of flow voids or flow deficits may better represent the vascular changes occurring at the choriocapillaris due to DM and DR. Studies analyzing perfusion density at the choriocapillaris have revealed differences between DM and DR patients and non-DM patients. Using SS-OCTA, Mastropasqua et al. measured the perfusion density of the choriocapillaris at a central 5.5 mm region [72]. They observed significantly lower perfusion density amongst the PDR group compared to non-DM controls and to DM patients without DR [72]. Conti et al. found decreased choriocapillaris flow at the area overlying the parafovea amongst PDR and NPDR patients compared to non-DM controls, but they did not find any changes in the flow at the choriocapillaris amongst patients with DM without DR [91]. On the contrary, Li et al. did find significantly lower flow at the fovea of the choriocapillaris in DM subjects without DR compared to non-DM controls [73]. However, given the aforementioned weaknesses of measuring flow or perfusion density, the findings from these studies are likely not as rigorous as those which analyzed flow deficits.
Increased flow deficits in the presence of DM or DR have been reported by multiple SS-OCTA studies (Figure 5) [92,140,141]. In two separate studies, Dai et al. calculated choriocapillaris flow from OCTA en-face images using a global thresholding algorithm that segmented flow deficits larger than 24 µm and consequently above spacing between individual capillaries [92,140,142]. Compared to non-DM patients, DM patients had a larger percentage of the image centered on the macula that corresponded to flow deficits [92]. In an extension of their earlier study, Dai et al. investigated flow deficits in patients with NPDR and PDR, finding that both groups had a significantly higher percentage area occupied by flow deficits compared to controls [140]. Gendelman et al. corroborated these results, reporting a positive association between flow deficit percentage and DR severity [141]. These studies are in agreement with histologic analysis, which has revealed choriocapillaris dropout and ischemia in DM eyes with and without DR [143,144,145]. A further OCTA study found an association between visual functioning in DR eyes and impaired choriocapillaris flow, as measured by flow deficits [146]. Given that the blood supply of photoreceptors is highly reliant upon the choriocapillaris circulation, visual changes in patients with DR may be linked with ischemia to these regions with high metabolic demands. SS-OCTA is a valuable tool to assess the retinal and choroidal vasculature at the same time. Further quantitative studies have the opportunity to shed light on the impact of DR on the choriocapillaris.
4. Limitations and Shortcomings of OCT Angiography in Quantitative Analysis
The majority of quantitative OCTA data in the literature is cross sectional, limiting its predictive value for the progression of DR. However, a study by Sun et al. over a median follow-up time of 27 months identified that larger FAZ area, lower VD, and lower FD were all significantly associated with DR progression [147]. An additional study with a one-year follow-up by You et al. used OCTA to detect avascular areas within the parafovea, noting that eyes with progression in DR severity had significantly larger avascular areas in the SCP at baseline compared to eyes without DR progression [148]. Also over a one-year follow-up period, Greig et al. reported that a larger FAZ area and reduced VD in the temporal region at baseline can predict the risk of progression [149] Hence, a variety of quantitative OCTA metrics do hold immense promise as DR biomarkers. Longitudinal studies with longer follow-up periods and increased patient enrollment will provide further validation of these OCTA biomarkers in tracking DR.
Another drawback of comparing OCTA metrics from multiple studies is the lack of interchangeability across quantitation algorithms [150], OCTA devices [151], and scan sizes [152]. This precludes the formation of singular normative databases. Instead, a plethora of normative values is likely needed given the wide array of custom analysis techniques reported in the literature.
Numerous studies have made evident that OCTA measurements of the microvasculature may differ based on age [153,154,155], sex [156,157], HbA1c levels [102,158,159], and a variety of other systemic or metabolic vascular risk factors [160,161,162,163]. Additionally, previous work by Chun et al. illuminated differences in OCTA quantitative parameters between healthy, young Black and White patients [164]. Compared to White patients, Black patients were found to have lower vessel density at the parafovea of the DCP, a larger foveal avascular zone at the SCP and DCP, and lower blood flow at the choriocapillaris in the area underlying the macula [164]. These findings support the need to match study and control groups by race when analyzing OCTA quantitative parameters, while also creating diverse normative databases. Race, along with the aforementioned potential confounding variates, are oftentimes left unaddressed or unreported in OCTA studies of DR. It is important to account for any differences in these categories across the studied population, such that the relationship between DR and OCTA parameters is precisely interrogated.
5. Future Directions
One of the most obvious extensions of OCTA is in artificial intelligence and automated diagnosis of DR. Expanding the use of artificial intelligence and deep learning techniques in diabetic eye screenings would improve efficiency and drive down costs, which jointly have the potential to improve patient outcomes amid the diabetes epidemic [165]. This may be especially true with regards to rural areas, where eye care providers are found in lower numbers [166]. Using an ordinary least squares modeling method, Cano et al. correctly classified 94% of PDR from non-DM subjects with a 0.99 area under receiver operating characteristic curve (AUROC); the same model classified 91% of mild NPDR subjects from non-DM subjects with a 0.93 AUROC [167]. Alam et al. trained a support vector machine using six OCTA quantitative features and achieved a 93% accuracy in distinguishing non-DM and mild NPDR eyes [168]. A computer-aided diagnosis system from Sandhu et al. reached accuracies of 94% and 92% AUROC using features from the SCP and DCP to distinguish between mild NPDR and non-DM eyes [169]. In these automated diagnostic systems, it is equally important to distinguish between DR and other retinopathies. Alam et al. demonstrated 92% specificity in distinguishing DR from sickle cell retinopathy [170]. Machine learning has proven to be a valuable tool for classifying both early and late stages of DR. Applying these models to larger and more diverse test sets will clarify their potential to be implemented on large scales.
Numerous groups have begun to investigate handheld OCTA systems that offer greater portability and flexibility for imaging patients that would otherwise prove difficult [171,172,173,174]. These handheld probes offer greater ease of imaging to pediatric patient populations or to those who must remain supine. It is easy to see the reach these systems bring, as they are not faced with the same constraints as traditional OCTA devices, namely being mounted to a tabletop. In conjunction with automated diagnosis programs, handheld OCTA devices could very well be used to efficiently and accurately screen for DR in areas underserved by eye care providers. Rank et al. recently reported their progress towards OCT and OCTA on a photonic integrated chip, which would drastically reduce both the size and costs of these imaging devices [175]. Collectively, these innovations across a variety of different sectors will continue to drive the feasibility of OCTA as a screening tool for DR.
6. Conclusions
OCTA has come a long way within a short period, enhancing our understanding of the pathophysiology and progression of DR. Given the myriad of microvasculature changes that can be detected and quantified using OCTA, there is every reason to believe that OCTA can be effectively implemented as a valuable imaging tool for DR. Challenges ahead include establishing normative databases, given the complexity and breadth of image analysis techniques in existence, as well as longitudinal analysis of quantitative trends in patients with DR.
Author Contributions
Conceptualization, J.M., S.K. and D.S.; methodology, J.M.; writing—original draft preparation, J.M.; writing—review and editing, J.M., S.K. and D.S.; visualization, J.M., S.K. and D.S.; supervision, D.S.; project administration, D.S. All authors have read and agreed to the published version of the manuscript.
Funding
This research was supported by a grant from the Illinois Society for the Prevention of Blindness (ISPB).
Institutional Review Board Statement
Not applicable.
Informed Consent Statement
Not applicable.
Conflicts of Interest
The authors declare no conflict of interest.
References
- Lin, X.; Xu, Y.; Pan, X.; Xu, J.; Ding, Y.; Sun, X.; Song, X.; Ren, Y.; Shan, P.-F. Global, regional, and national burden and trend of diabetes in 195 countries and territories: An analysis from 1990 to 2025. Sci. Rep. 2020, 10, 14790. [Google Scholar] [CrossRef]
- Saeedi, P.; Petersohn, I.; Salpea, P.; Malanda, B.; Karuranga, S.; Unwin, N.; Colagiuri, S.; Guariguata, L.; Motala, A.A.; Ogurtsova, K.; et al. Global and regional diabetes prevalence estimates for 2019 and projections for 2030 and 2045: Results from the International Diabetes Federation Diabetes Atlas, 9th edition. Diabetes Res. Clin. Pract. 2019, 157, 107843. [Google Scholar] [CrossRef] [Green Version]
- Khan, M.A.B.; Hashim, M.J.; King, J.K.; Govender, R.D.; Mustafa, H.; Al Kaabi, J. Epidemiology of Type 2 Diabetes–Global Burden of Disease and Forecasted Trends. J. Epidemiol. Glob. Health 2020, 10, 107–111. [Google Scholar] [CrossRef] [PubMed] [Green Version]
- Cho, N.H.; Shaw, J.E.; Karuranga, S.; Huang, Y.; da Rocha Fernandes, J.D.; Ohlrogge, A.W.; Malanda, B. IDF Diabetes Atlas: Global estimates of diabetes prevalence for 2017 and projections for 2045. Diabetes Res. Clin. Pract. 2018, 138, 271–281. [Google Scholar] [CrossRef] [PubMed]
- Wang, H.; Naghavi, M.; Allen, C.; Barber, R.M.; Bhutta, Z.A.; Carter, A.; Casey, D.C.; Charlson, F.J.; Chen, A.Z.; Coates, M.M.; et al. Global, regional, and national life expectancy, all-cause mortality, and cause-specific mortality for 249 causes of death, 1980–2015: A systematic analysis for the Global Burden of Disease Study 2015. Lancet 2016, 388, 1459–1544. [Google Scholar] [CrossRef] [Green Version]
- Bommer, C.; Heesemann, E.; Sagalova, V.; Manne-Goehler, J.; Atun, R.; Bärnighausen, T.; Vollmer, S. The global economic burden of diabetes in adults aged 20–79 years: A cost-of-illness study. Lancet Diabetes Endocrinol. 2017, 5, 423–430. [Google Scholar] [CrossRef]
- Bommer, C.; Sagalova, V.; Heesemann, E.; Manne-Goehler, J.; Atun, R.; Bärnighausen, T.; Davies, J.; Vollmer, S. Global Economic Burden of Diabetes in Adults: Projections From 2015 to 2030. Diabetes Care 2018, 41, 963–970. [Google Scholar] [CrossRef] [Green Version]
- Duh, E.J.; Sun, J.; Stitt, A.W. Diabetic retinopathy: Current understanding, mechanisms, and treatment strategies. JCI Insight 2017, 2, e937512. [Google Scholar] [CrossRef]
- Wang, W.; Lo, A.C.Y. Diabetic Retinopathy: Pathophysiology and Treatments. Int. J. Mol. Sci. 2018, 19, 1816. [Google Scholar] [CrossRef] [Green Version]
- Nentwich, M.M. Diabetic retinopathy—Ocular complications of diabetes mellitus. World J. Diabetes 2015, 6, 489–499. [Google Scholar] [CrossRef]
- Teo, Z.L.; Tham, Y.-C.; Yu, M.; Chee, M.L.; Rim, T.H.; Cheung, N.; Bikbov, M.M.; Wang, Y.X.; Tang, Y.; Lu, Y.; et al. Global Prevalence of Diabetic Retinopathy and Projection of Burden through 2045: Systematic Review and Meta-Analysis. Ophthalmology 2021, 128, 1580–1591. [Google Scholar] [CrossRef]
- GBD 2019 Blindness and Vision Impairment Collaborators; Vision Loss Expert Group of the Global Burden of Disease Study; Steinmetz, J.; Bourne, R.R.A.; Briant, P.S.; Flaxman, S.R.; Taylor, H.R.B.; Jonas, J.B.; Abdoli, A.A.; Abrha, W.A.; et al. Causes of blindness and vision impairment in 2020 and trends over 30 years, and prevalence of avoidable blindness in relation to VISION 2020: The Right to Sight: An analysis for the Global Burden of Disease Study. Lancet Glob. Health 2021, 9, e144–e160. [Google Scholar] [CrossRef]
- Romero-Aroca, P. Managing diabetic macular edema: The leading cause of diabetes blindness. World J. Diabetes 2011, 2, 98–104. [Google Scholar] [CrossRef] [PubMed]
- Huang, D.; Swanson, E.A.; Lin, C.P.; Schuman, J.S.; Stinson, W.G.; Chang, W.; Hee, M.R.; Flotte, T.; Gregory, K.; Puliafito, C.A.; et al. Optical Coherence Tomography. Science 1991, 254, 1178–1181. [Google Scholar] [CrossRef] [Green Version]
- Fujimoto, J.G.; Pitris, C.; Boppart, S.; Brezinski, M.E. Optical Coherence Tomography: An Emerging Technology for Biomedical Imaging and Optical Biopsy. Neoplasia 2000, 2, 9–25. [Google Scholar] [CrossRef] [PubMed] [Green Version]
- Greig, E.C.; Duker, J.S.; Waheed, N.K. A practical guide to optical coherence tomography angiography interpretation. Int. J. Retin. Vitr. 2020, 6, 1–17. [Google Scholar] [CrossRef]
- Borrelli, E.; Sarraf, D.; Freund, K.B.; Sadda, S.R. OCT angiography and evaluation of the choroid and choroidal vascular disorders. Prog. Retin. Eye Res. 2018, 67, 30–55. [Google Scholar] [CrossRef]
- Kashani, A.H.; Chen, C.-L.; Gahm, J.K.; Zheng, F.; Richter, G.M.; Rosenfeld, P.J.; Shi, Y.; Wang, R. Optical coherence tomography angiography: A comprehensive review of current methods and clinical applications. Prog. Retin. Eye Res. 2017, 60, 66–100. [Google Scholar] [CrossRef] [PubMed]
- Novotny, H.R.; Alvis, D.L. A Method of Photographing Fluorescence in Circulating Blood in the Human Retina. Circulation 1961, 24, 82–86. [Google Scholar] [CrossRef] [Green Version]
- Yannuzzi, L.A.; Rohrer, K.T.; Tindel, L.J.; Sobel, R.S.; Costanza, M.A.; Shields, W.; Zang, E. Fluorescein Angiography Complication Survey. Ophthalmology 1986, 93, 611–617. [Google Scholar] [CrossRef]
- Bearelly, S.; Rao, S.; Fekrat, S. Anaphylaxis following intravenous fluorescein angiography in a vitreoretinal clinic: Report of 4 cases. Can. J. Ophthalmol. 2009, 44, 444–445. [Google Scholar] [CrossRef] [PubMed]
- Spaide, R.F.; Klancnik, J.M.; Cooney, M.J. Retinal Vascular Layers Imaged by Fluorescein Angiography and Optical Coherence Tomography Angiography. JAMA Ophthalmol. 2015, 133, 45–50. [Google Scholar] [CrossRef] [PubMed]
- Nesper, P.L.; Fawzi, A.A. Human Parafoveal Capillary Vascular Anatomy and Connectivity Revealed by Optical Coherence Tomography Angiography. Investig. Opthalmology Vis. Sci. 2018, 59, 3858–3867. [Google Scholar] [CrossRef] [Green Version]
- Campbell, J.P.; Zhang, M.; Hwang, T.; Bailey, S.T.; Wilson, D.J.; Jia, Y.; Huang, D. Detailed Vascular Anatomy of the Human Retina by Projection-Resolved Optical Coherence Tomography Angiography. Sci. Rep. 2017, 7, srep42201. [Google Scholar] [CrossRef] [PubMed] [Green Version]
- Tan, B.; Chua, J.; Lin, E.; Cheng, J.; Gan, A.; Yao, X.; Wong, D.W.K.; Sabanayagam, C.; Wong, D.; Chan, C.M.; et al. Quantitative Microvascular Analysis with Wide-Field Optical Coherence Tomography Angiography in Eyes with Diabetic Retinopathy. JAMA Netw. Open 2020, 3, e1919469. [Google Scholar] [CrossRef]
- Sawada, O.; Ichiyama, Y.; Obata, S.; Ito, Y.; Kakinoki, M.; Sawada, T.; Saishin, Y.; Ohji, M. Comparison between wide-angle OCT angiography and ultra-wide field fluorescein angiography for detecting non-perfusion areas and retinal neovascularization in eyes with diabetic retinopathy. Graefe’s Arch. Clin. Exp. Ophthalmol. 2018, 256, 1275–1280. [Google Scholar] [CrossRef]
- Yang, J.; Zhang, B.; Wang, E.; Xia, S.; Chen, Y. Ultra-wide field swept-source optical coherence tomography angiography in patients with diabetes without clinically detectable retinopathy. BMC Ophthalmol. 2021, 21, 1–8. [Google Scholar] [CrossRef]
- Rabiolo, A.; Parravano, M.; Querques, L.; Cicinelli, M.V.; Carnevali, A.; Sacconi, R.; Centoducati, T.; Vujosevic, S.; Bandello, F.; Querques, G. Ultra-wide-field fluorescein angiography in diabetic retinopathy: A narrative review. Clin. Ophthalmol. 2017, 11, 803–807. [Google Scholar] [CrossRef] [Green Version]
- Manivannan, A.; Plskova, J.; Farrow, A.; Mckay, S.; Sharp, P.F.; Forrester, J.V. Ultra-Wide-Field Fluorescein Angiography of the Ocular Fundus. Am. J. Ophthalmol. 2005, 140, 525–527. [Google Scholar] [CrossRef]
- Spaide, R.F.; Fujimoto, J.G.; Waheed, N.K. Image artifacts in optical coherence tomography angiography. Retina 2015, 35, 2163–2180. [Google Scholar] [CrossRef]
- Cui, Y.; Zhu, Y.; Wang, J.C.; Lu, Y.; Zeng, R.; Katz, R.; Wu, D.M.; Vavvas, D.G.; Husain, D.; Miller, J.W.; et al. Imaging Artifacts and Segmentation Errors with Wide-Field Swept-Source Optical Coherence Tomography Angiography in Diabetic Retinopathy. Transl. Vis. Sci. Technol. 2019, 8, 18. [Google Scholar] [CrossRef] [PubMed] [Green Version]
- Enders, C.; Lang, G.E.; Dreyhaupt, J.; Loidl, M.; Lang, G.K.; Werner, J.U. Quantity and quality of image artifacts in optical coherence tomography angiography. PLoS ONE 2019, 14, e0210505. [Google Scholar] [CrossRef]
- Spaide, R.F.; Fujimoto, J.G.; Waheed, N.K.; Sadda, S.R.; Staurenghi, G. Optical coherence tomography angiography. Prog. Retin. Eye Res. 2017, 64, 1–55. [Google Scholar] [CrossRef] [PubMed]
- Garrity, S.T.; Iafe, N.A.; Phasukkijwatana, N.; Chen, X.; Sarraf, D. Quantitative Analysis of Three Distinct Retinal Capillary Plexuses in Healthy Eyes Using Optical Coherence Tomography Angiography. Investig. Opthalmology Vis. Sci. 2017, 58, 5548–5555. [Google Scholar] [CrossRef] [PubMed] [Green Version]
- Zhang, M.; Hwang, T.; Campbell, J.P.; Bailey, S.T.; Wilson, D.J.; Huang, D.; Jia, Y. Projection-resolved optical coherence tomographic angiography. Biomed. Opt. Express 2016, 7, 816–828. [Google Scholar] [CrossRef] [Green Version]
- Ashraf, M.; Sampani, K.; Abu-Qamar, O.; Cavallerano, J.; Silva, P.S.; Aiello, L.P.; Sun, J.K. Optical Coherence Tomography Angiography Projection Artifact Removal: Impact on Capillary Density and Interaction with Diabetic Retinopathy Severity. Transl. Vis. Sci. Technol. 2020, 9, 10. [Google Scholar] [CrossRef]
- Schreur, V.; Domanian, A.; Liefers, B.; Venhuizen, F.G.; Klevering, B.J.; Hoyng, C.B.; De Jong, E.K.; Theelen, T. Morphological and topographical appearance of microaneurysms on optical coherence tomography angiography. Br. J. Ophthalmol. 2018, 103, 630–635. [Google Scholar] [CrossRef] [PubMed]
- La Mantia, A.; Kurt, R.A.; Mejor, S.; Egan, C.; Tufail, A.; Keane, P.A.; Sim, D.A. Comparing Fundus Fluorescein angiography and swept-source optical coherence tomography angiography in the evaluation of diabetic macular perfusion. Retina 2019, 39, 926–937. [Google Scholar] [CrossRef]
- Couturier, A.; Mané, V.; Bonnin, S.; Erginay, A.; Massin, P.; Gaudric, A.; Tadayoni, R. Capillary Plexus Anomalies in diabetic retinopathy on optical coherence tomography angiography. Retina 2015, 35, 2384–2391. [Google Scholar] [CrossRef]
- Salz, D.A.; De Carlo, T.E.; Adhi, M.; Moult, E.M.; Choi, W.; Baumal, C.R.; Witkin, A.J.; Duker, J.S.; Fujimoto, J.G.; Waheed, N.K. Select Features of Diabetic Retinopathy on Swept-Source Optical Coherence Tomographic Angiography Compared with Fluorescein Angiography and Normal Eyes. JAMA Ophthalmol. 2016, 134, 644–650. [Google Scholar] [CrossRef]
- Parrulli, S.; Corvi, F.; Cozzi, M.; Monteduro, D.; Zicarelli, F.; Staurenghi, G. Microaneurysms visualisation using five different optical coherence tomography angiography devices compared to fluorescein angiography. Br. J. Ophthalmol. 2020, 105, 526–530. [Google Scholar] [CrossRef]
- Stitt, A.W.; Gardiner, T.A.; Archer, D.B. Histological and ultrastructural investigation of retinal microaneurysm development in diabetic patients. Br. J. Ophthalmol. 1995, 79, 362–367. [Google Scholar] [CrossRef] [Green Version]
- Arya, M.; Filho, M.B.; Rebhun, C.B.; Moult, E.M.; Lee, B.; Alibhai, Y.; Witkin, A.J.; Baumal, C.R.; Duker, J.S.; Fujimoto, J.G.; et al. Analyzing Relative Flow Speeds in Diabetic Retinopathy Using Variable Interscan Time Analysis OCT Angiography. Ophthalmol. Retin. 2020, 5, 49–59. [Google Scholar] [CrossRef]
- Borrelli, E.; Sacconi, R.; Brambati, M.; Bandello, F.; Querques, G. In vivo rotational three-dimensional OCTA analysis of microaneurysms in the human diabetic retina. Sci. Rep. 2019, 9, 1–8. [Google Scholar] [CrossRef]
- Norton, E.W.; Gutman, F. Diabetic retinopathy studied by fluorescein angiography. Trans. Am. Ophthalmol. Soc. 1965, 63, 108–128. [Google Scholar] [CrossRef] [PubMed] [Green Version]
- Vaz-Pereira, S.; Morais-Sarmento, T.; Marques, R.E. Optical coherence tomography features of neovascularization in proliferative diabetic retinopathy: A systematic review. Int. J. Retin. Vitr. 2020, 6, 1–12. [Google Scholar] [CrossRef] [PubMed]
- Hwang, T.; Jia, Y.; Gao, S.; Bailey, S.T.; Lauer, A.K.; Flaxel, C.J.; Wilson, D.J.; Huang, D. OPTICAL COHERENCE TOMOGRAPHY ANGIOGRAPHY FEATURES OF DIABETIC RETINOPATHY. Retina 2015, 35, 2371–2376. [Google Scholar] [CrossRef] [PubMed] [Green Version]
- Ishibazawa, A.; Nagaoka, T.; Takahashi, A.; Omae, T.; Tani, T.; Sogawa, K.; Yokota, H.; Yoshida, A. Optical Coherence Tomography Angiography in Diabetic Retinopathy: A Prospective Pilot Study. Am. J. Ophthalmol. 2015, 160, 35–44. [Google Scholar] [CrossRef] [PubMed] [Green Version]
- Ishibazawa, A.; Nagaoka, T.; Yokota, H.; Takahashi, A.; Omae, T.; Song, Y.; Takahashi, T.; Yoshida, A. Characteristics of Retinal Neovascularization in Proliferative Diabetic Retinopathy Imaged by Optical Coherence Tomography Angiography. Investig. Opthalmology Vis. Sci. 2016, 57, 6247–6255. [Google Scholar] [CrossRef] [Green Version]
- Elbendary, A.M.; Abouelkheir, H.Y. Bimodal imaging of proliferative diabetic retinopathy vascular features using swept source optical coherence tomography angiography. Int. J. Ophthalmol. 2018, 11, 1528–1533. [Google Scholar] [CrossRef]
- Matsunaga, D.R.; Yi, J.J.; De Koo, L.O.; Ameri, H.; Puliafito, C.A.; Kashani, A.H. Optical Coherence Tomography Angiography of Diabetic Retinopathy in Human Subjects. Ophthalmic Surgery, Lasers Imaging Retin. 2015, 46, 796–805. [Google Scholar] [CrossRef]
- Jia, Y.; Bailey, S.T.; Hwang, T.S.; McClintic, S.M.; Gao, S.S.; Pennesi, M.E.; Flaxel, C.J.; Lauer, A.K.; Wilson, D.J.; Hornegger, J.; et al. Quantitative optical coherence tomography angiography of vascular abnormalities in the living human eye. Proc. Natl. Acad. Sci. USA 2015, 112, E2395–E2402. [Google Scholar] [CrossRef] [PubMed] [Green Version]
- Pan, J.; Chen, D.; Yang, X.; Zou, R.; Zhao, K.; Cheng, D.; Huang, S.; Zhou, T.; Yang, Y.; Chen, F. Characteristics of Neovascularization in Early Stages of Proliferative Diabetic Retinopathy by Optical Coherence Tomography Angiography. Am. J. Ophthalmol. 2018, 192, 146–156. [Google Scholar] [CrossRef] [PubMed]
- de Carlo, T.E.; Filho, M.A.B.; Baumal, C.R.; Reichel, E.; Rogers, A.; Witkin, A.J.; Duker, J.S.; Waheed, N.K. Evaluation of Preretinal Neovascularization in Proliferative Diabetic Retinopathy Using Optical Coherence Tomography Angiography. Ophthalmic Surgery, Lasers Imaging Retin. 2016, 47, 115–119. [Google Scholar] [CrossRef] [PubMed]
- He, F.; Yu, W. Longitudinal neovascular changes on optical coherence tomography angiography in proliferative diabetic retinopathy treated with panretinal photocoagulation alone versus with intravitreal conbercept plus panretinal photocoagulation: A pilot study. Eye 2019, 34, 1413–1418. [Google Scholar] [CrossRef] [Green Version]
- Russell, J.F.; Shi, Y.; Hinkle, J.W.; Scott, N.L.; Fan, K.C.; Lyu, C.; Gregori, G.; Rosenfeld, P.J. Longitudinal Wide-Field Swept-Source OCT Angiography of Neovascularization in Proliferative Diabetic Retinopathy after Panretinal Photocoagulation. Ophthalmol. Retin. 2018, 3, 350–361. [Google Scholar] [CrossRef] [PubMed]
- Falavarjani, K.G.; Habibi, A.; Khorasani, M.A.; Anvari, P.; Sadda, S.R. Time course of changes in optic disk neovascularization after a single intravitreal bevacizumab injection. Retina 2019, 39, 1149–1153. [Google Scholar] [CrossRef]
- Zhang, X.; Wu, C.; Zhou, L.-J.; Dai, R.-P. Observation of optic disc neovascularization using OCT angiography in proliferative diabetic retinopathy after intravitreal conbercept injections. Sci. Rep. 2018, 8, 1–8. [Google Scholar] [CrossRef] [PubMed] [Green Version]
- Hu, Z.; Su, Y.; Xie, P.; Chen, L.; Ji, J.; Feng, T.; Wu, S.; Liang, K.; Liu, Q. OCT angiography-based monitoring of neovascular regression on fibrovascular membrane after preoperative intravitreal conbercept injection. Graefe’s Arch. Clin. Exp. Ophthalmol. 2019, 257, 1611–1619. [Google Scholar] [CrossRef] [PubMed]
- Hirano, T.; Kakihara, S.; Toriyama, Y.; Nittala, M.G.; Murata, T.; Sadda, S. Wide-field en face swept-source optical coherence tomography angiography using extended field imaging in diabetic retinopathy. Br. J. Ophthalmol. 2017, 102, 1199–1203. [Google Scholar] [CrossRef] [PubMed]
- Sousa, D.C.; Leal, I.; Moreira, S.; Vale, S.D.; Silva-Herdade, A.S.; Aguiar, P.; Dionísio, P.; Pinto, L.A.; Castanho, M.A.R.B.; Marques-Neves, C. Retinal Vascular Reactivity in Type 1 Diabetes Patients Without Retinopathy Using Optical Coherence Tomography Angiography. Investig. Opthalmology Vis. Sci. 2020, 61, 49. [Google Scholar] [CrossRef] [PubMed]
- Lavia, C.; Couturier, A.; Erginay, A.; Dupas, B.; Tadayoni, R.; Gaudric, A. Reduced vessel density in the superficial and deep plexuses in diabetic retinopathy is associated with structural changes in corresponding retinal layers. PLoS ONE 2019, 14, e0219164. [Google Scholar] [CrossRef] [PubMed] [Green Version]
- Alibhai, A.Y.; De Pretto, L.R.; Moult, E.M.; Or, C.; Arya, M.; McGowan, M.; Carrasco-Zevallos, O.; Lee, B.; Chen, S.; Baumal, C.R.; et al. Quantification of retinal capillary nonperfusion in diabetics using wide-field optical coherence tomography angiography. Retina 2020, 40, 412–420. [Google Scholar] [CrossRef]
- Kaizu, Y.; Nakao, S.; Arima, M.; Hayami, T.; Wada, I.; Yamaguchi, M.; Sekiryu, H.; Ishikawa, K.; Ikeda, Y.; Sonoda, K.-H. Flow Density in Optical Coherence Tomography Angiography is Useful for Retinopathy Diagnosis in Diabetic Patients. Sci. Rep. 2019, 9, 1–7. [Google Scholar] [CrossRef] [Green Version]
- Chu, Z.; Lin, J.; Gao, C.; Xin, C.; Zhang, Q.; Chen, C.-L.; Roisman, L.; Gregori, G.; Rosenfeld, P.J.; Wang, R. Quantitative assessment of the retinal microvasculature using optical coherence tomography angiography. J. Biomed. Opt. 2016, 21, 066008. [Google Scholar] [CrossRef] [Green Version]
- Durham, J.T.; Herman, I.M. Microvascular Modifications in Diabetic Retinopathy. Curr. Diabetes Rep. 2011, 11, 253–264. [Google Scholar] [CrossRef]
- Meehan, R.T.; Taylor, G.R.; Rock, P.; Mader, T.H.; Hunter, N.; Cymerman, A. An Automated Method of Quantifying Retinal Vascular Responses during Exposure to Novel Environmental Conditions. Ophthalmology 1990, 97, 875–881. [Google Scholar] [CrossRef]
- Bek, T. Diameter Changes of Retinal Vessels in Diabetic Retinopathy. Curr. Diabetes Rep. 2017, 17, 82. [Google Scholar] [CrossRef]
- Pemp, B.; Schmetterer, L. Ocular blood flow in diabetes and age-related macular degeneration. Can. J. Ophthalmol. 2008, 43, 295–301. [Google Scholar] [CrossRef]
- Jensen, P.S.; Jeppesen, P.; Bek, T. Differential diameter responses in macular and peripheral retinal arterioles may contribute to the regional distribution of diabetic retinopathy lesions. Graefe’s Arch. Clin. Exp. Ophthalmol. 2010, 249, 407–412. [Google Scholar] [CrossRef]
- Tang, F.Y.; Ng, D.S.; Lam, A.; Luk, F.; Wong, R.; Chan, C.; Mohamed, S.; Fong, A.; Lok, J.; Tso, T.; et al. Determinants of Quantitative Optical Coherence Tomography Angiography Metrics in Patients with Diabetes. Sci. Rep. 2017, 7, 1–10. [Google Scholar] [CrossRef] [Green Version]
- Mastropasqua, R.; D’Aloisio, R.; Di Antonio, L.; Erroi, E.; Borrelli, E.; Evangelista, F.; D’Onofrio, G.; Di Nicola, M.; Di Martino, G.; Toto, L. Widefield optical coherence tomography angiography in diabetic retinopathy. Acta Diabetol. 2019, 56, 1293–1303. [Google Scholar] [CrossRef] [PubMed]
- Li, L.; Almansoob, S.; Zhang, P.; Zhou, Y.-D.; Tan, Y.; Gao, L. Quantitative analysis of retinal and choroid capillary ischaemia using optical coherence tomography angiography in type 2 diabetes. Acta Ophthalmol. 2019, 97, 240–246. [Google Scholar] [CrossRef]
- Nesper, P.L.; Roberts, P.K.; Onishi, A.C.; Chai, H.; Liu, L.; Jampol, L.M.; Fawzi, A.A. Quantifying Microvascular Abnormalities with Increasing Severity of Diabetic Retinopathy Using Optical Coherence Tomography Angiography. Investig. Opthalmology Vis. Sci. 2017, 58, BIO307–BIO315. [Google Scholar] [CrossRef]
- Hirano, T.; Kitahara, J.; Toriyama, Y.; Kasamatsu, H.; Murata, T.; Sadda, S. Quantifying vascular density and morphology using different swept-source optical coherence tomography angiographic scan patterns in diabetic retinopathy. Br. J. Ophthalmol. 2018, 103, 216–221. [Google Scholar] [CrossRef] [PubMed]
- Onishi, A.C.; Nesper, P.L.; Roberts, P.K.; Moharram, G.A.; Chai, H.; Liu, L.; Jampol, L.M.; Fawzi, A.A. Importance of Considering the Middle Capillary Plexus on OCT Angiography in Diabetic Retinopathy. Investig. Opthalmology Vis. Sci. 2018, 59, 2167–2176. [Google Scholar] [CrossRef] [Green Version]
- Ashraf, M.; Sampani, K.; Clermont, A.; Abu-Qamar, O.; Rhee, J.; Silva, P.S.; Aiello, L.P.; Sun, J.K. Vascular Density of Deep, Intermediate and Superficial Vascular Plexuses Are Differentially Affected by Diabetic Retinopathy Severity. Investig. Opthalmology Vis. Sci. 2020, 61, 53. [Google Scholar] [CrossRef]
- Ong, J.X.; Kwan, C.C.; Cicinelli, M.V.; Fawzi, A.A. Superficial capillary perfusion on optical coherence tomography angiography differentiates moderate and severe nonproliferative diabetic retinopathy. PLoS ONE 2020, 15, e0240064. [Google Scholar] [CrossRef]
- Dupas, B.; Minvielle, W.; Bonnin, S.; Couturier, A.; Erginay, A.; Massin, P.; Gaudric, A.; Tadayoni, R. Association Between Vessel Density and Visual Acuity in Patients with Diabetic Retinopathy and Poorly Controlled Type 1 Diabetes. JAMA Ophthalmol. 2018, 136, 721–728. [Google Scholar] [CrossRef]
- Samara, W.A.; Shahlaee, A.; Adam, M.; Khan, M.A.; Chiang, A.; Maguire, J.I.; Hsu, J.; Ho, A.C. Quantification of Diabetic Macular Ischemia Using Optical Coherence Tomography Angiography and Its Relationship with Visual Acuity. Ophthalmology 2016, 124, 235–244. [Google Scholar] [CrossRef]
- Yu, D.-Y.; Cringle, S.J.; Yu, P.K.; Su, E.-N. Intraretinal Oxygen Distribution and Consumption during Retinal Artery Occlusion and Graded Hyperoxic Ventilation in the Rat. Investig. Opthalmology Vis. Sci. 2007, 48, 2290–2296. [Google Scholar] [CrossRef] [Green Version]
- Birol, G.; Wang, S.; Budzynski, E.; Wangsa-Wirawan, N.D.; Linsenmeier, R.A. Oxygen distribution and consumption in the macaque retina. Am. J. Physiol. Circ. Physiol. 2007, 293, H1696–H1704. [Google Scholar] [CrossRef]
- Scarinci, F.; Nesper, P.L.; Fawzi, A.A. Deep Retinal Capillary Nonperfusion Is Associated with Photoreceptor Disruption in Diabetic Macular Ischemia. Am. J. Ophthalmol. 2016, 168, 129–138. [Google Scholar] [CrossRef] [PubMed] [Green Version]
- Scarinci, F.; Varano, M.; Parravano, M. Retinal Sensitivity Loss Correlates with Deep Capillary Plexus Impairment in Diabetic Macular Ischemia. J. Ophthalmol. 2019, 2019, 1–8. [Google Scholar] [CrossRef] [Green Version]
- Hwang, T.; Zhang, M.; Bhavsar, K.; Zhang, X.; Campbell, J.P.; Lin, P.; Bailey, S.T.; Flaxel, C.J.; Lauer, A.K.; Wilson, D.J.; et al. Visualization of 3 Distinct Retinal Plexuses by Projection-Resolved Optical Coherence Tomography Angiography in Diabetic Retinopathy. JAMA Ophthalmol. 2016, 134, 1411–1419. [Google Scholar] [CrossRef] [Green Version]
- Park, J.J.; Soetikno, B.T.; Fawzi, A.A. Characterization of the middle capillary plexus using optical coherence tomography angiography in healthy and diabetic eyes. Retina 2016, 36, 2039–2050. [Google Scholar] [CrossRef] [PubMed] [Green Version]
- Binotti, W.W.; Romano, A.C. Projection-Resolved Optical Coherence Tomography Angiography Parameters to Determine Severity in Diabetic Retinopathy. Investig. Opthalmology Vis. Sci. 2019, 60, 1321–1327. [Google Scholar] [CrossRef] [PubMed] [Green Version]
- Dimitrova, G.; Chihara, E.; Takahashi, H.; Amano, H.; Okazaki, K. Quantitative Retinal Optical Coherence Tomography Angiography in Patients with Diabetes Without Diabetic Retinopathy. Investig. Opthalmology Vis. Sci. 2017, 58, 190–196. [Google Scholar] [CrossRef]
- Cao, D.; Yang, D.; Huang, Z.; Zeng, Y.; Wang, J.; Hu, Y.; Zhang, L. Optical coherence tomography angiography discerns preclinical diabetic retinopathy in eyes of patients with type 2 diabetes without clinical diabetic retinopathy. Acta Diabetol. 2018, 55, 469–477. [Google Scholar] [CrossRef]
- Li, X.; Yu, Y.; Liu, X.; Shi, Y.; Jin, X.; Zhang, Y.; Xu, S.; Zhang, N.; Dong, L.; Zhou, S.; et al. Quantitative analysis of retinal vessel density and thickness changes in diabetes mellitus evaluated using optical coherence tomography angiography: A cross-sectional study. BMC Ophthalmol. 2021, 21, 1–12. [Google Scholar] [CrossRef]
- Conti, F.F.; Qin, V.L.; Rodrigues, E.B.; Sharma, S.; Rachitskaya, A.V.; Ehlers, J.P.; Singh, R.P. Choriocapillaris and retinal vascular plexus density of diabetic eyes using split-spectrum amplitude decorrelation spectral-domain optical coherence tomography angiography. Br. J. Ophthalmol. 2018, 103, 452–456. [Google Scholar] [CrossRef] [PubMed]
- Dai, Y.; Zhou, H.; Chu, Z.; Zhang, Q.; Chao, J.R.; Rezaei, K.A.; Wang, R.K. Microvascular Changes in the Choriocapillaris of Diabetic Patients Without Retinopathy Investigated by Swept-Source OCT Angiography. Investig. Opthalmology Vis. Sci. 2020, 61, 50. [Google Scholar] [CrossRef] [PubMed] [Green Version]
- Rosen, R.B.; Romo, J.A.; Krawitz, B.D.; Mo, S.; Fawzi, A.; Linderman, R.; Carroll, J.; Pinhas, A.; Chui, T.Y. Earliest Evidence of Preclinical Diabetic Retinopathy Revealed Using Optical Coherence Tomography Angiography Perfused Capillary Density. Am. J. Ophthalmol. 2019, 203, 103–115. [Google Scholar] [CrossRef] [PubMed]
- Kim, A.Y.; Chu, Z.; Shahidzadeh, A.; Wang, R.; Puliafito, C.A.; Kashani, A.H. Quantifying Microvascular Density and Morphology in Diabetic Retinopathy Using Spectral-Domain Optical Coherence Tomography Angiography. Investig. Opthalmology Vis. Sci. 2016, 57, OCT362–OCT370. [Google Scholar] [CrossRef]
- Bresnick, G.H.; Condit, R.; Syrjala, S.; Palta, M.; Groo, A.; Korth, K. Abnormalities of the Foveal Avascular Zone in Diabetic Retinopathy. Arch. Ophthalmol. 1984, 102, 1286–1293. [Google Scholar] [CrossRef]
- Conrath, J.; Giorgi, R.; Raccah, D.; Ridings, B. Foveal avascular zone in diabetic retinopathy: Quantitative vs qualitative assessment. Eye 2004, 19, 322–326. [Google Scholar] [CrossRef] [Green Version]
- Enders, C.; Baeuerle, F.; Lang, G.E.; Dreyhaupt, J.; Lang, G.K.; Loidl, M.; Werner, J.U. Comparison between Findings in Optical Coherence Tomography Angiography and in Fluorescein Angiography in Patients with Diabetic Retinopathy. Ophthalmologica 2019, 243, 21–26. [Google Scholar] [CrossRef]
- Abdelshafy, M.; Abdelshafy, A. Correlations Between Optical Coherence Tomography Angiography Parameters and the Visual Acuity in Patients with Diabetic Retinopathy. Clin. Ophthalmol. 2020, 14, 1107–1115. [Google Scholar] [CrossRef] [Green Version]
- Balaratnasingam, C.; Inoue, M.; Ahn, S.; McCann, J.; Dhrami-Gavazi, E.; Yannuzzi, L.A.; Freund, K.B. Visual Acuity Is Correlated with the Area of the Foveal Avascular Zone in Diabetic Retinopathy and Retinal Vein Occlusion. Ophthalmology 2016, 123, 2352–2367. [Google Scholar] [CrossRef]
- Mastropasqua, R.; Toto, L.; Mastropasqua, A.; Aloia, R.; De Nicola, C.; Mattei, P.A.; Di Marzio, G.; Di Nicola, M.; Di Antonio, L. Foveal avascular zone area and parafoveal vessel density measurements in different stages of diabetic retinopathy by optical coherence tomography angiography. Int. J. Ophthalmol. 2017, 10, 1545–1551. [Google Scholar] [CrossRef]
- Takase, N.; Nozaki, M.; Kato, A.; Ozeki, H.; Yoshida, M.; Ogura, Y. Enlargement of foveal avascular zone in diabetic eyes evaluated by en face optical coherence tomography angiography. Retina 2015, 35, 2377–2383. [Google Scholar] [CrossRef]
- Bhanushali, D.; Anegondi, N.; Gadde, S.G.K.; Srinivasan, P.; Chidambara, L.; Yadav, N.K.; Roy, A.S. Linking Retinal Microvasculature Features with Severity of Diabetic Retinopathy Using Optical Coherence Tomography Angiography. Investig. Opthalmology Vis. Sci. 2016, 57, OCT519–OCT525. [Google Scholar] [CrossRef]
- Di, G.; Weihong, Y.; Xiao, Z.; Zhikun, Y.; Xuan, Z.; Yi, Q.; Fangtian, D. A morphological study of the foveal avascular zone in patients with diabetes mellitus using optical coherence tomography angiography. Graefe’s Arch. Clin. Exp. Ophthalmol. 2015, 254, 873–879. [Google Scholar] [CrossRef]
- Linderman, R.; Salmon, A.E.; Strampe, M.; Russillo, M.; Khan, J.; Carroll, J. Assessing the Accuracy of Foveal Avascular Zone Measurements Using Optical Coherence Tomography Angiography: Segmentation and Scaling. Transl. Vis. Sci. Technol. 2017, 6, 16. [Google Scholar] [CrossRef] [PubMed] [Green Version]
- Linderman, R.; Muthiah, M.N.; Omoba, S.B.; Litts, K.; Tarima, S.; Visotcky, A.; Kim, J.E.; Carroll, J. Variability of Foveal Avascular Zone Metrics Derived from Optical Coherence Tomography Angiography Images. Transl. Vis. Sci. Technol. 2018, 7, 20. [Google Scholar] [CrossRef] [PubMed] [Green Version]
- Ghassemi, F.; Mirshahi, R.; Bazvand, F.; Fadakar, K.; Faghihi, H.; Sabour, S. The quantitative measurements of foveal avascular zone using optical coherence tomography angiography in normal volunteers. J. Curr. Ophthalmol. 2017, 29, 293–299. [Google Scholar] [CrossRef] [PubMed]
- Fujiwara, A.; Morizane, Y.; Hosokawa, M.; Kimura, S.; Shiode, Y.; Hirano, M.; Doi, S.; Toshima, S.; Takahashi, K.; Hosogi, M.; et al. Factors affecting foveal avascular zone in healthy eyes: An examination using swept-source optical coherence tomography angiography. PLoS ONE 2017, 12, e0188572. [Google Scholar] [CrossRef] [Green Version]
- Iafe, N.A.; Phasukkijwatana, N.; Chen, X.; Sarraf, D. Retinal Capillary Density and Foveal Avascular Zone Area Are Age-Dependent: Quantitative Analysis Using Optical Coherence Tomography Angiography. Investig. Opthalmology Vis. Sci. 2016, 57, 5780–5787. [Google Scholar] [CrossRef] [Green Version]
- Zouache, M.A.; Silvestri, G.; Amoaku, W.M.; Silvestri, V.; Hubbard, W.C.; Pappas, C.; Akafo, S.; Lartey, S.; Mastey, R.R.; Carroll, J.; et al. Comparison of the Morphology of the Foveal Pit Between African and Caucasian Populations. Transl. Vis. Sci. Technol. 2020, 9, 24. [Google Scholar] [CrossRef]
- Sampson, D.M.; Gong, P.; An, D.; Menghini, M.; Hansen, A.; Mackey, D.A.; Sampson, D.; Chen, F.K. Axial Length Variation Impacts on Superficial Retinal Vessel Density and Foveal Avascular Zone Area Measurements Using Optical Coherence Tomography Angiography. Investig. Opthalmology Vis. Sci. 2017, 58, 3065–3072. [Google Scholar] [CrossRef]
- Krawitz, B.D.; Mo, S.; Geyman, L.S.; Agemy, S.A.; Scripsema, N.K.; Garcia, P.M.; Chui, T.Y.; Rosen, R.B. Acircularity index and axis ratio of the foveal avascular zone in diabetic eyes and healthy controls measured by optical coherence tomography angiography. Vis. Res. 2017, 139, 177–186. [Google Scholar] [CrossRef] [PubMed]
- Liu, L.; Gao, J.; Bao, W.; Hu, C.; Xu, Y.; Zhao, B.; Zheng, J.; Fan, L.; Sun, Y. Analysis of Foveal Microvascular Abnormalities in Diabetic Retinopathy Using Optical Coherence Tomography Angiography with Projection Artifact Removal. J. Ophthalmol. 2018, 2018, 1–9. [Google Scholar] [CrossRef] [PubMed]
- Laotaweerungsawat, S.; Psaras, C.; Liu, X.; Stewart, J.M. OCT Angiography Assessment of Retinal Microvascular Changes in Diabetic Eyes in an Urban Safety-Net Hospital. Ophthalmol. Retin. 2019, 4, 425–432. [Google Scholar] [CrossRef] [PubMed]
- Kim, K.; Kim, E.S.; Yu, S.-Y. Optical coherence tomography angiography analysis of foveal microvascular changes and inner retinal layer thinning in patients with diabetes. Br. J. Ophthalmol. 2017, 102, 1226–1231. [Google Scholar] [CrossRef]
- Kim, K.; Kim, E.S.; Kim, D.G.; Yu, S.-Y. Progressive retinal neurodegeneration and microvascular change in diabetic retinopathy: Longitudinal study using OCT angiography. Acta Diabetol. 2019, 56, 1275–1282. [Google Scholar] [CrossRef]
- Lim, S.W.; Cheung, N.; Wang, J.J.; Donaghue, K.C.; Liew, G.; Islam, F.M.A.; Jenkins, A.J.; Wong, T.Y. Retinal Vascular Fractal Dimension and Risk of Early Diabetic Retinopathy: A prospective study of children and adolescents with type 1 diabetes. Diabetes Care 2009, 32, 2081–2083. [Google Scholar] [CrossRef] [Green Version]
- Popovic, N.; Lipovac, M.; Radunovic, M.; Ugarte, J.; Isusquiza, E.; Beristain, A.; Moreno, R.; Aranjuelo, N.; Popovic, T. Fractal characterization of retinal microvascular network morphology during diabetic retinopathy progression. Microcirculation 2019, 26, e12531. [Google Scholar] [CrossRef]
- Cheung, N.; Donaghue, K.C.; Liew, G.; Rogers, S.L.; Wang, J.J.; Lim, S.-W.; Jenkins, A.J.; Hsu, W.; Lee, M.L.; Wong, T.Y. Quantitative Assessment of Early Diabetic Retinopathy Using Fractal Analysis. Diabetes Care 2008, 32, 106–110. [Google Scholar] [CrossRef] [Green Version]
- Lim, L.S.; Chee, M.L.; Cheung, C.; Wong, T.Y. Retinal Vessel Geometry and the Incidence and Progression of Diabetic Retinopathy. Investig. Opthalmology Vis. Sci. 2017, 58, BIO200–BIO205. [Google Scholar] [CrossRef]
- Grauslund, J.; Green, A.; Kawasaki, R.; Hodgson, L.; Sjølie, A.K.; Wong, T.Y. Retinal Vascular Fractals and Microvascular and Macrovascular Complications in Type 1 Diabetes. Ophthalmology 2010, 117, 1400–1405. [Google Scholar] [CrossRef]
- Forster, R.B.; Garcia, E.S.; Sluiman, A.J.; Grecian, S.M.; McLachlan, S.; MacGillivray, T.J.; Strachan, M.W.J.; Price, J.F. Retinal venular tortuosity and fractal dimension predict incident retinopathy in adults with type 2 diabetes: The Edinburgh Type 2 Diabetes Study. Diabetologia 2021, 64, 1103–1112. [Google Scholar] [CrossRef]
- Zahid, S.; Dolz-Marco, R.; Freund, K.B.; Balaratnasingam, C.; Dansingani, K.; Gilani, F.; Mehta, N.; Young, E.; Klifto, M.R.; Chae, B.; et al. Fractal Dimensional Analysis of Optical Coherence Tomography Angiography in Eyes with Diabetic Retinopathy. Investig. Opthalmology Vis. Sci. 2016, 57, 4940–4947. [Google Scholar] [CrossRef] [PubMed]
- Fayed, A.E.; AbdelBaki, A.M.; El Zawahry, O.M.; Fawzi, A.A. Optical coherence tomography angiography reveals progressive worsening of retinal vascular geometry in diabetic retinopathy and improved geometry after panretinal photocoagulation. PLoS ONE 2019, 14, e0226629. [Google Scholar] [CrossRef] [Green Version]
- Hsiao, C.-C.; Yang, C.-M.; Yang, C.-H.; Ho, T.-C.; Lai, T.-T.; Hsieh, Y.-T. Correlations between visual acuity and macular microvasculature quantified with optical coherence tomography angiography in diabetic macular oedema. Eye 2019, 34, 544–552. [Google Scholar] [CrossRef] [PubMed]
- Sasongko, M.B.; Wong, T.Y.; Nguyen, T.T.; Cheung, C.; Shaw, J.E.; Wang, J.J. Retinal vascular tortuosity in persons with diabetes and diabetic retinopathy. Diabetologia 2011, 54, 2409–2416. [Google Scholar] [CrossRef]
- Cheung, C.Y.-L.; Lamoureux, E.; Ikram, M.K.; Sasongko, M.B.; Ding, J.; Zheng, Y.; Mitchell, P.; Wang, J.J.; Wong, T.Y. Retinal Vascular Geometry in Asian Persons with Diabetes and Retinopathy. J. Diabetes Sci. Technol. 2012, 6, 595–605. [Google Scholar] [CrossRef] [Green Version]
- Sasongko, M.B.; Wong, T.Y.; Nguyen, T.T.; Cheung, C.Y.; Shaw, J.E.; Kawasaki, R.; Lamoureux, E.L.; Wang, J.J. Retinal Vessel Tortuosity and Its Relation to Traditional and Novel Vascular Risk Markers in Persons with Diabetes. Curr. Eye Res. 2016, 41, 551–557. [Google Scholar] [CrossRef]
- Lee, H.; Lee, M.; Chung, H.; Kim, H.C. QUANTIFICATION OF RETINAL VESSEL TORTUOSITY IN DIABETIC RETINOPATHY USING OPTICAL COHERENCE TOMOGRAPHY ANGIOGRAPHY. Retina 2018, 38, 976–985. [Google Scholar] [CrossRef]
- Lorthois, S.; Lauwers, F.; Cassot, F. Tortuosity and other vessel attributes for arterioles and venules of the human cerebral cortex. Microvasc. Res. 2014, 91, 99–109. [Google Scholar] [CrossRef] [Green Version]
- Hartnett, M.E.; Martiniuk, D.; Byfield, G.; Geisen, P.; Zeng, G.; Bautch, V.L. Neutralizing VEGF Decreases Tortuosity and Alters Endothelial Cell Division Orientation in Arterioles and Veins in a Rat Model of ROP: Relevance to Plus Disease. Investig. Opthalmology Vis. Sci. 2008, 49, 3107–3114. [Google Scholar] [CrossRef]
- Yasuda, S.; Kachi, S.; Kondo, M.; Ueno, S.; Kaneko, H.; Terasaki, H. Significant Correlation between Retinal Venous Tortuosity and Aqueous Vascular Endothelial Growth Factor Concentration in Eyes with Central Retinal Vein Occlusion. PLoS ONE 2015, 10, e0134267. [Google Scholar] [CrossRef] [PubMed]
- Goldman, D.; Popel, A. A Computational Study of the Effect of Capillary Network Anastomoses and Tortuosity on Oxygen Transport. J. Theor. Biol. 2000, 206, 181–194. [Google Scholar] [CrossRef] [PubMed] [Green Version]
- Sorrentino, F.S.; Matteini, S.; Bonifazzi, C.; Sebastiani, A.; Parmeggiani, F. Diabetic retinopathy and endothelin system: Microangiopathy versus endothelial dysfunction. Eye 2018, 32, 1157–1163. [Google Scholar] [CrossRef] [PubMed] [Green Version]
- Han, H.-C. Twisted Blood Vessels: Symptoms, Etiology and Biomechanical Mechanisms. J. Vasc. Res. 2012, 49, 185–197. [Google Scholar] [CrossRef] [Green Version]
- Wangsa-Wirawan, N.D. Retinal Oxygen: Fundamental and Clinical Aspects. Arch. Ophthalmol. 2003, 121, 547–557. [Google Scholar] [CrossRef] [PubMed]
- Flower, R.W.; Hochheimer, B.F. A clinical technique and apparatus for simultaneous angiography of the separate retinal and choroidal circulations. Investig. Ophthalmol. 1973, 12. [Google Scholar]
- De Bruin, D.M.; Burnes, D.L.; Loewenstein, J.; Chen, Y.; Chang, S.; Chen, T.C.; Esmaili, D.D.; de Boer, J. In Vivo Three-Dimensional Imaging of Neovascular Age-Related Macular Degeneration Using Optical Frequency Domain Imaging at 1050 nm. Investig. Opthalmology Vis. Sci. 2008, 49, 4545–4552. [Google Scholar] [CrossRef] [Green Version]
- Unterhuber, A.; Povazay, B.; Hermann, B.; Sattmann, H.; Chavez-Pirson, A.; Drexler, W. In vivo retinal optical coherence tomography at 1040 nm—Enhanced penetration into the choroid. Opt. Express 2005, 13, 3252–3258. [Google Scholar] [CrossRef]
- Olver, J.M. Functional anatomy of the choroidal circulation: Methyl methacrylate casting of human choroid. Eye 1990, 4, 262–272. [Google Scholar] [CrossRef]
- Dai, Y.; Zhou, H.; Zhang, Q.; Chu, Z.; De Koo, L.C.O.; Chao, J.R.; Rezaei, K.A.; Saraf, S.S.; Wang, R.K. Quantitative assessment of choriocapillaris flow deficits in diabetic retinopathy: A swept-source optical coherence tomography angiography study. PLoS ONE 2020, 15, e0243830. [Google Scholar] [CrossRef]
- Gendelman, I.; Alibhai, A.Y.; Moult, E.M.; Levine, E.S.; Braun, P.X.; Mehta, N.; Zhao, Y.; Ishibazawa, A.; Sorour, O.; Baumal, C.R.; et al. Topographic analysis of macular choriocapillaris flow deficits in diabetic retinopathy using swept–source optical coherence tomography angiography. Int. J. Retin. Vitr. 2020, 6, 6–8. [Google Scholar] [CrossRef] [PubMed]
- Zhang, Q.; Zheng, F.; Motulsky, E.H.; Gregori, G.; Chu, Z.; Chen, C.-L.; Li, C.; De Sisternes, L.; Durbin, M.; Rosenfeld, P.J.; et al. A Novel Strategy for Quantifying Choriocapillaris Flow Voids Using Swept-Source OCT Angiography. Investig. Opthalmol. Vis. Sci. 2018, 59, 203–211. [Google Scholar] [CrossRef] [Green Version]
- Lutty, G.A.; Cao, J.; McLeod, D.S. Relationship of polymorphonuclear leukocytes to capillary dropout in the human diabetic choroid. Am. J. Pathol. 1997, 151, 707–714. [Google Scholar] [PubMed]
- Hidayat, A.A.; Fine, B.S. Diabetic Choroidopathy: Light and Electron Microscopic Observations of Seven Cases. Ophthalmology 1985, 92, 512–522. [Google Scholar] [CrossRef]
- McLeod, D.S.; Lutty, A.G. High-resolution histologic analysis of the human choroidal vasculature. Investig. Ophthalmol. Vis. Sci. 1994, 35, 3799–3811. [Google Scholar]
- Ro-Mase, T.; Ishiko, S.; Omae, T.; Ishibazawa, A.; Shimouchi, A.; Yoshida, A. Association Between Alterations of the Choriocapillaris Microcirculation and Visual Function and Cone Photoreceptors in Patients with Diabetes. Investig. Opthalmology Vis. Sci. 2020, 61, 1. [Google Scholar] [CrossRef] [PubMed]
- Sun, Z.; Tang, F.; Wong, R.; Lok, J.; Szeto, S.K.; Chan, J.C.; Chan, C.K.; Tham, C.Y.C.; Ng, D.S.; Cheung, C.Y. OCT Angiography Metrics Predict Progression of Diabetic Retinopathy and Development of Diabetic Macular Edema: A Prospective Study. Ophthalmology 2019, 126, 1675–1684. [Google Scholar] [CrossRef] [PubMed]
- You, Q.S.; Wang, J.; Guo, Y.; Pi, S.; Flaxel, C.J.; Bailey, S.T.; Huang, D.; Jia, Y.; Hwang, T.S. Optical Coherence Tomography Angiography Avascular Area Association with One-Year Treatment Requirement and Disease Progression in Diabetic Retinopathy. Am. J. Ophthalmol. 2020, 217, 268–277. [Google Scholar] [CrossRef]
- Greig, E.C.; Brigell, M.; Cao, F.; Levine, E.S.; Peters, K.; Moult, E.M.; Fujimoto, J.G.; Waheed, N.K. Macular and Peripapillary Optical Coherence Tomography Angiography Metrics Predict Progression in Diabetic Retinopathy: A Sub-analysis of TIME-2b Study Data. Am. J. Ophthalmol. 2020, 219, 66–76. [Google Scholar] [CrossRef]
- Rabiolo, A.; Gelormini, F.; Sacconi, R.; Cicinelli, M.V.; Triolo, G.; Bettin, P.; Nouri-Mahdavi, K.; Bandello, F.; Querques, G. Comparison of methods to quantify macular and peripapillary vessel density in optical coherence tomography angiography. PLoS ONE 2018, 13, e0205773. [Google Scholar] [CrossRef] [PubMed]
- Corvi, F.; Pellegrini, M.; Erba, S.; Cozzi, M.; Staurenghi, G.; Giani, A. Reproducibility of Vessel Density, Fractal Dimension, and Foveal Avascular Zone Using 7 Different Optical Coherence Tomography Angiography Devices. Am. J. Ophthalmol. 2018, 186, 25–31. [Google Scholar] [CrossRef]
- Rabiolo, A.; Gelormini, F.; Marchese, A.; Cicinelli, M.V.; Triolo, G.; Sacconi, R.; Querques, L.; Bandello, F.; Querques, G. Macular Perfusion Parameters in Different Angiocube Sizes: Does The Size Matter in Quantitative Optical Coherence Tomography Angiography? Investig. Opthalmology Vis. Sci. 2018, 59, 231–237. [Google Scholar] [CrossRef] [PubMed] [Green Version]
- Wei, Y.; Jiang, H.; Shi, Y.; Qu, D.; Gregori, G.; Zheng, F.; Rundek, T.; Wang, J. Age-Related Alterations in the Retinal Microvasculature, Microcirculation, and Microstructure. Investig. Opthalmology Vis. Sci. 2017, 58, 3804–3817. [Google Scholar] [CrossRef] [PubMed] [Green Version]
- Park, S.H.; Cho, H.; Hwang, S.J.; Jeon, B.; Seong, M.; Yeom, H.; Kang, M.H.; Lim, H.W.; Shin, Y.U. Changes in the Retinal Microvasculature Measured Using Optical Coherence Tomography Angiography According to Age. J. Clin. Med. 2020, 9, 883. [Google Scholar] [CrossRef] [PubMed] [Green Version]
- Jo, Y.H.; Sung, K.R.; Shin, J.W. Effects of Age on Peripapillary and Macular Vessel Density Determined Using Optical Coherence Tomography Angiography in Healthy Eyes. Investig. Opthalmology Vis. Sci. 2019, 60, 3492–3498. [Google Scholar] [CrossRef] [Green Version]
- Borrelli, E.; Lonngi, M.; Balasubramanian, S.; Tepelus, T.C.; Baghdasaryan, E.; Iafe, N.A.; Pineles, S.L.; Velez, F.G.; Sarraf, D.; Sadda, S.R.; et al. Macular microvascular networks in healthy pediatric subjects. Retina 2019, 39, 1216–1224. [Google Scholar] [CrossRef]
- Tan, C.S.; Lim, L.W.; Chow, V.S.; Chay, I.W.; Tan, S.; Cheong, K.X.; Tan, G.T.; Sadda, S.R. Optical Coherence Tomography Angiography Evaluation of the Parafoveal Vasculature and Its Relationship with Ocular Factors. Investig. Opthalmology Vis. Sci. 2016, 57, OCT224–OCT234. [Google Scholar] [CrossRef]
- Bernal-Morales, C.; Alé-Chilet, A.; Martín-Pinardel, R.; Barraso, M.; Hernández, T.; Oliva, C.; Vinagre, I.; Ortega, E.; Figueras-Roca, M.; Sala-Puigdollers, A.; et al. Optical Coherence Tomography Angiography in Type 1 Diabetes Mellitus. Report 4: Glycated Haemoglobin. Diagnostics 2021, 11, 1537. [Google Scholar] [CrossRef]
- Gołębiewska, J.; Olechowski, A.; Wysocka-Mincewicz, M.; Odrobina, D.; Baszyńska-Wilk, M.; Groszek, A.; Szalecki, M.; Hautz, W. Optical coherence tomography angiography vessel density in children with type 1 diabetes. PLoS ONE 2017, 12, e0186479. [Google Scholar] [CrossRef]
- Ting, D.S.W.; Tan, G.S.W.; Agrawal, R.; Yanagi, Y.; Sie, N.M.; Wong, C.W.; San Yeo, I.Y.; Lee, S.Y.; Cheung, C.M.G.; Wong, T.Y. Optical Coherence Tomographic Angiography in Type 2 Diabetes and Diabetic Retinopathy. JAMA Ophthalmol. 2017, 135, 306–312. [Google Scholar] [CrossRef]
- Sato, R.; Kunikata, H.; Asano, T.; Aizawa, N.; Kiyota, N.; Shiga, Y.; Nishiguchi, K.M.; Kato, K.; Nakazawa, T. Quantitative analysis of the macula with optical coherence tomography angiography in normal Japanese subjects: The Taiwa Study. Sci. Rep. 2019, 9, 1–11. [Google Scholar] [CrossRef] [Green Version]
- Hannappe, M.-A.; Arnould, L.; Méloux, A.; Mouhat, B.; Bichat, F.; Zeller, M.; Cottin, Y.; Binquet, C.; Vergely, C.; Creuzot-Garcher, C.; et al. Vascular density with optical coherence tomography angiography and systemic biomarkers in low and high cardiovascular risk patients. Sci. Rep. 2020, 10, 1–9. [Google Scholar] [CrossRef]
- Shaw, L.; Khanna, S.; Chun, L.; Dimitroyannis, R.; Rodriguez, S.; Massamba, N.; Hariprasad, S.; Skondra, D. Quantitative Optical Coherence Tomography Angiography (OCTA) Parameters in a Black Diabetic Population and Correlations with Systemic Diseases. Cells 2021, 10, 551. [Google Scholar] [CrossRef] [PubMed]
- Chun, L.Y.; Silas, M.R.; Dimitroyannis, R.C.; Ho, K.; Skondra, D. Differences in macular capillary parameters between healthy black and white subjects with Optical Coherence Tomography Angiography (OCTA). PLoS ONE 2019, 14, e0223142. [Google Scholar] [CrossRef] [Green Version]
- Cheung, C.Y.; Tang, F.; Ting, D.S.W.; Tan, G.S.W.; Wong, T.Y. Artificial Intelligence in Diabetic Eye Disease Screening. Asia-Pacific J. Ophthalmol. 2019, 8, 158–164. [Google Scholar] [CrossRef]
- Feng, P.W.; Ahluwalia, A.; Feng, H.; Adelman, R.A. National Trends in the United States Eye Care Workforce from 1995 to 2017. Am. J. Ophthalmol. 2020, 218, 128–135. [Google Scholar] [CrossRef]
- Cano, J.; O’Neill, W.D.; Penn, R.D.; Blair, N.P.; Kashani, A.H.; Ameri, H.; Kaloostian, C.L.; Shahidi, M. Classification of advanced and early stages ofdiabetic retinopathy from nondiabetic subjects by an ordinary least squaresmodeling method applied to OCTA images. Biomed. Opt. Express 2020, 11, 4666–4678. [Google Scholar] [CrossRef]
- Alam, M.; Zhang, Y.; Lim, J.I.; Chan, R.V.P.; Yang, M.; Yao, X. Quantitative OCT Angiography Features for Objective Classification and Staging of Diabetic Retinopathy. Retina 2018, 40, 322–332. [Google Scholar] [CrossRef]
- Sandhu, H.S.; Eladawi, N.; Elmogy, M.; Keynton, R.; Helmy, O.; Schaal, S.; El-Baz, A. Automated diabetic retinopathy detection using optical coherence tomography angiography: A pilot study. Br. J. Ophthalmol. 2018, 102, 1564–1569. [Google Scholar] [CrossRef]
- Alam, M.; Le, D.; Lim, J.I.; Chan, R.V.; Yao, X. Supervised Machine Learning Based Multi-Task Artificial Intelligence Classification of Retinopathies. J. Clin. Med. 2019, 8, 872. [Google Scholar] [CrossRef] [Green Version]
- Malone, J.D.; El-Haddad, M.T.; Yerramreddy, S.S.; Oguz, I.; Tao, Y.K.K. Handheld spectrally encoded coherence tomography and reflectometry for motion-corrected ophthalmic optical coherence tomography and optical coherence tomography angiography. Neurophotonics 2019, 6, 041102. [Google Scholar] [CrossRef] [PubMed] [Green Version]
- Yang, J.; Liu, L.; Campbell, J.P.; Huang, D.; Liu, G. Handheld optical coherence tomography angiography. Biomed. Opt. Express 2017, 8, 2287–2300. [Google Scholar] [CrossRef] [PubMed]
- Viehland, C.; Chen, X.; Tran-Viet, D.; Jackson-Atogi, M.; Ortiz, P.; Waterman, G.; Vajzovic, L.; Toth, C.A.; Izatt, J.A. Ergonomic handheld OCT angiography probe optimized for pediatric and supine imaging. Biomed. Opt. Express 2019, 10, 2623–2638. [Google Scholar] [CrossRef]
- Ni, S.; Wei, X.; Ng, R.; Ostmo, S.; Chiang, M.F.; Huang, D.; Jia, Y.; Campbell, J.P.; Jian, Y. High-speed and widefield handheld swept-source OCT angiography with a VCSEL light source. Biomed. Opt. Express 2021, 12, 3553–3570. [Google Scholar] [CrossRef]
- Rank, E.A.; Sentosa, R.; Harper, D.J.; Salas, M.; Gaugutz, A.; Seyringer, D.; Nevlacsil, S.; Maese-Novo, A.; Eggeling, M.; Muellner, P.; et al. Toward optical coherence tomography on a chip: In vivo three-dimensional human retinal imaging using photonic integrated circuit-based arrayed waveguide gratings. Light. Sci. Appl. 2021, 10, 6. [Google Scholar] [CrossRef] [PubMed]
Figure 1.
Optical coherence tomography angiography (OCTA) custom segmentation of the three capillary plexuses as seen by 3 × 3 mm en-face angiograms (top row) and cross sectional B-scans (bottom row). Green and red lines on B-scans correspond to segmentation boundaries used. (A) The superficial capillary plexus (SCP) was segmented from the internal limiting membrane to 10 µm above the inner plexiform layer; (B) The middle capillary plexus (MCP) was segmented from 10 µm above to 30 µm below the inner plexiform layer; (C) The deep capillary plexus (DCP) was segmented from 30 µm below the inner plexiform layer to 10 µm below the outer plexiform layer.

Figure 2.
Representative morphological features of diabetic retinopathy visualized by 3 × 3 mm OCTA. (A) Selected microaneurysms shown with yellow arrows in the SCP of a patient with non-proliferative diabetic retinopathy (NPDR); (B) Selected microaneurysms shown with yellow arrows in the DCP of the same NPDR patient.

Figure 3.
Representative examples of quantitative vessel density (VD) trends at the 3 × 3 mm area of the SCP across the spectrum of DR severity. Vessel density measurements under each image were generated from built-in Optovue RTVue XR Avanti software with AngioAnalytics (Optovue Inc., Fremont, CA, USA, Version 2018.1.8.60). As DR severity worsens, vessel density measurements decrease. Areas of non-perfusion are readily visualized in severe NPDR and PDR eyes.

Figure 4.
Representative quantitative examples of foveal avascular zone (FAZ) area and acircularity index (AI) with worsening DR severity. FAZ area and AI measurements under each image were generated from built-in Optovue RTVue XR Avanti software with AngioAnalytics (Optovue Inc., Fremont, CA, USA, Version 2018.1.8.60). As DR severity worsens, the area of the FAZ enlarges and the FAZ becomes increasingly acircular.

Figure 5.
Visualization of flow at the choriocapillaris by OCTA. The yellow circle is 3 mm in diameter and centered on the fovea. Black areas within the circle correspond to non-flow, while yellow areas measure blood flow. Built in Optovue RTVue XR Avanti software with AngioAnalytics (Optovue Inc., Fremont, CA, USA, Version 2018.1.8.60) cannot resolve the individual capillaries at the choriocapillaris, preventing quantitative analysis from being performed. In this representative example, however, it is qualitatively apparent that flow deficits are increased in NPDR and PDR eyes.

Publisher’s Note: MDPI stays neutral with regard to jurisdictional claims in published maps and institutional affiliations. |
© 2021 by the authors. Licensee MDPI, Basel, Switzerland. This article is an open access article distributed under the terms and conditions of the Creative Commons Attribution (CC BY) license (https://creativecommons.org/licenses/by/4.0/).
Share and Cite
MDPI and ACS Style
Moir, J.; Khanna, S.; Skondra, D. Review of OCT Angiography Findings in Diabetic Retinopathy: Insights and Perspectives. Int. J. Transl. Med. 2021, 1, 286-305. https://0-doi-org.brum.beds.ac.uk/10.3390/ijtm1030017
AMA Style
Moir J, Khanna S, Skondra D. Review of OCT Angiography Findings in Diabetic Retinopathy: Insights and Perspectives. International Journal of Translational Medicine. 2021; 1(3):286-305. https://0-doi-org.brum.beds.ac.uk/10.3390/ijtm1030017
Chicago/Turabian StyleMoir, John, Saira Khanna, and Dimitra Skondra. 2021. "Review of OCT Angiography Findings in Diabetic Retinopathy: Insights and Perspectives" International Journal of Translational Medicine 1, no. 3: 286-305. https://0-doi-org.brum.beds.ac.uk/10.3390/ijtm1030017