
Python Programming in PyPI for Translational Medicine


Data Science Department, Musashino University, Tokyo 1358181, Japan
Int. J. Transl. Med. 2021, 1(3), 323-331; https://0-doi-org.brum.beds.ac.uk/10.3390/ijtm1030019
Submission received: 20 October 2021
/
Revised: 13 November 2021
/
Accepted: 23 November 2021
/
Published: 24 November 2021
(This article belongs to the Special Issue Translational Aspects of Infectious Diseases: From Bench to Bedside)
Abstract
:This is the world’s first tutorial article on Python Packaging for beginners and practitioners for translational medicine or medicine in general. This tutorial will allow researchers to demonstrate and showcase their tools on PyPI packages around the world. Nowadays, for translational medicine, researchers need to deal with big data. This paper describes how to build an executable Python Package Index (PyPI) code and package. PyPI is a repository of software for the Python programming language with 5,019,737 files and 544,359 users (programmers) as of 19 October 2021. First, programmers must understand how to scrape a dataset over the Internet; second, they must read the dataset file in csv format; third, build a program to compute the target values; fourth, convert the Python program to the PyPI package.; and fifth, upload the PyPI package. This paper depicts a covidlag executable package as an example for calculating the accurate case fatality rate (CFR) and the lag time from infection to death. You can install the covidlag by pip terminal command and test it. This paper also introduces deathdaily and scorecovid packages on PyPI Stats, which can inform how many users have downloaded the specified PyPI package. The usefulness and applicability of a developed tool can be verified by PyPI Stats with the number of downloaded users.
1. Introduction
With the rapid progress of open-source software [1,2,3], many researchers have used a Python language for not only translational medicine but also other medical applications in general [4,5,6]. Python Package Index (PyPI) is an open-source repository of software for the Python programming language with 5,019,737 files and 544,359 users (programmers) as of 19 October 2021. The useful libraries and packages are available in public and can be installed by a simple pip terminal-line command.
It is important for researchers to share useful and applicable libraries with others. The pip terminal command allows us to install any PyPI library on your system with the following line command: pip install [xxx] where [xxx] is one of the PyPI libraries.
For example, OpenCV [6,7] is an image processing package where [xxx] should be replaced with opencv-python for installation by pip command. scikit-learn [4] is a collection of ensemble machine learning packages. Tensorflow [8] is a symbolic math library based on dataflow and differentiable programming on training and inference of deep neural networks. Keras [9] acts as an interface for the TensorFlow. PyTorch [10] is a machine learning library used for applications such as computer vision and natural language. Recently, PyTorch subsumed You Only Look Once [11] (YOLO-v5), which is an object detection library for computer vision and image processing that deals with detecting instances of semantic objects (humans, cars, dogs, and so on). MediaPipe is a library to offer cross-platform, customizable machine learning solutions for live and streaming media.
Four points play a key role in creating a new tool or a PyPI package: (1) data collection, (2) feature engineering tool, (3) data visualization method, and (4) data analysis functions.
The following two tools (scorecovid, deathdaily) were detailed.
Scorecovid:
- (1)
- Scraping the data from the following site on country and population: https://www.worldometers.info/world-population/population-by-country/ (accessed on 23 November 2021).Scraping the data from the following site on total deaths: https://github.com/owid/covid-19-data/raw/master/public/data/jhu/total_deaths.csv (accessed on 23 November 2021)
- (2)
- Using pandas library to extract country, population, and total deaths.
- (3)
- matplotlib library for visualization.
- (4)
- pandas.DataFrame function to compute the number of deaths per population (millions).
Deathdaily:
- (1)
- Scraping the data from the following site on daily deaths:https://raw.githubusercontent.com/owid/covid-19-data/master/public/data/jhu/new_deaths.csv (accessed on 23 November 2021)
- (2)
- Using pandas library to extract daily deaths.
- (3)
- matplotlib library for visualization.
- (4)
- Using numpy.poly1d of numpy library for curve-fitting function to predict the number of daily deaths.
This paper shows how a covidlag libray in PyPI package was built; it is an example of executable PyPI code [12]. The covidlag is a Python library and is executable on Linux, Windows, and MacOS for calculating the accurate case fatality rate and the lag time from infection to death. It should be noted that the covidlag tool has not yet been peer-reviewed.
In order to build a PyPI package, you must understand basic shell commands (bash or zsh) and be familiar with them [13]. For example, popular line commands are “ls”, “cd”, “pwd”, “grep”, “echo”, “sed”, “cut”, “awk”, “sort”, “uniq”, “less”, “wc”, “df”, “cat”, “which”, “>”, “|”, and so on. You should be familiar with a tree structure of files and directories (folders) and a concept of PATH. PATH variable plays a key role in command execution. The directories in the PATH variable are searched in the order they are given. In other words, PATH variable determines the order of command executions.
In the covidlag program, the following libraries are used: pandas, numpy, matplotlib, sys, subprocess, sklearn (scikit-learn), and scipy. A programming code is a collection of math expressions (functions) without any ambiguity.
In order to use a Python language, you must choose a proper installation package, such as miniconda, depending on your operating system from the following site: https://docs.conda.io/en/latest/miniconda.html (accessed on 23 November 2021).
For Windows users, you have two options of miniconda: one on Windows 10 and the other on Windows Subsystem for Linux (WSL). WSL is a compatibility layer for running Linux binary executables (in ELF format) natively on Windows 10 and Windows 11. WSL has not been completed yet, but you are allowed to use binary executables on Windows from WSL command line.
“$” sign is the shell prompt, which is not the user’s input command.
You should be familiar with conda and pip command with options:
First, start a terminal command and update the miniconda environment by the following command:
$ conda update conda
Second, update pip installation command. “-U” stands for update.
$ pip install -U pip
or
$ python -m pip install -U pip
In order to install scikit-learn for example, run the following command.
$ pip install -U scikit-learn
or
$ conda install scikit-learn
In order to know the Python version number,
- $ python -V
- Python 3.8.3
- “which” command can inform the location of Python.
- $ which python
- /home/takefuji/miniconda3/bin/python
If the library is not Python related, install it by apt command on WSL or brew on MacOS.
First, apt should be updated and upgraded.
- $ sudo apt update
- $ sudo apt upgrade
Then, you can install the necessary library. For example, “wget” is a library name. “sudo” is a superuser command.
- $ sudo apt install wget
- $ brew install xxx
In WSL and MacOS, you must install X-Window. For Windows users, you should download VcXsrv Windows X Server exe file and install it. For Mac users, you should install XQuartz. Before running Python, you should start X Server.
VcXserv Windows X Server can be downloaded from the following site: https://sourceforge.net/projects/vcxsrv/ (accessed on 23 November 2021).
XQuartz MacOS X Server can be downloaded from the following site: https://www.xquartz.org/ (accessed on 23 November 2021).
On WSL installed by Microsoft Store (Ubuntu 20.04), run Linux bash command. Or on Windows 10, install Cygwin and click the Cygwin to open the bash command terminal: https://www.cygwin.com/ (accessed on 23 November 2021).
On MacOS and Linux OS, click the terminal icon or open the terminal.
The entire open-source is available from the bash-shell or zsh-shell terminal. The open-source visualization is generally based on X Windows.
In covidlag, wget command is needed.
covidlag was selected for this tutorial because the current computation methods on case fatality rate (CFR) have problems. CFR is computed by dividing the number of deaths due to COVID-19 by the number of cases or infected individuals for retrospective observational study. In other words, CFR is the ratio of the number of deaths divided by the number of confirmed cases of disease.
In the conventional methods, the number of sampled days and its range (start and end dates) have to be manually determined in order to calculate a value of the CFR. The covidlag in this tutorial automatically calculates the CFR by exploiting maxima and minima points with strong correlation between infection and death. To generate maxima and minima points, scipy library is used.
In open-source programming, new programs are simply glued together, combining existing libraries.
In other words, skills in open-source programming lie in selecting good libraries from a variety of the existing libraries. The more examples that are available in open-source libraries, the easier it is for users to create the desired code.
This tutorial was written from the experience of nine PyPI projects: https://pypi.org/user/takefuji/ (accessed on 23 November 2021).
2. Installation
This Section includes testing Python environment, PyPI package (setup.py, README.md, covidlag.py, __main__.py, __init__.py), and how to upload a PyPI package.
2.1. Testing Python Environment
It is assumed that Python is ready to run on the terminal. We must make sure that the system has a pip command in the PATH variable by the following command.
$ which pip
Type the following command to install covidlag.
$ pip install covidlag
You may have several errors from the installation. Remember that pip command is not a fully automated command so you may need to install the following libraries: pandas, numpy, matplotlib, scikit-learn, and scipy before installing covidlag. Error messages can inform you what libraries are missing in the current Python environment.
If you are ready to run covidag, make sure you are running X-Server and type the following command:
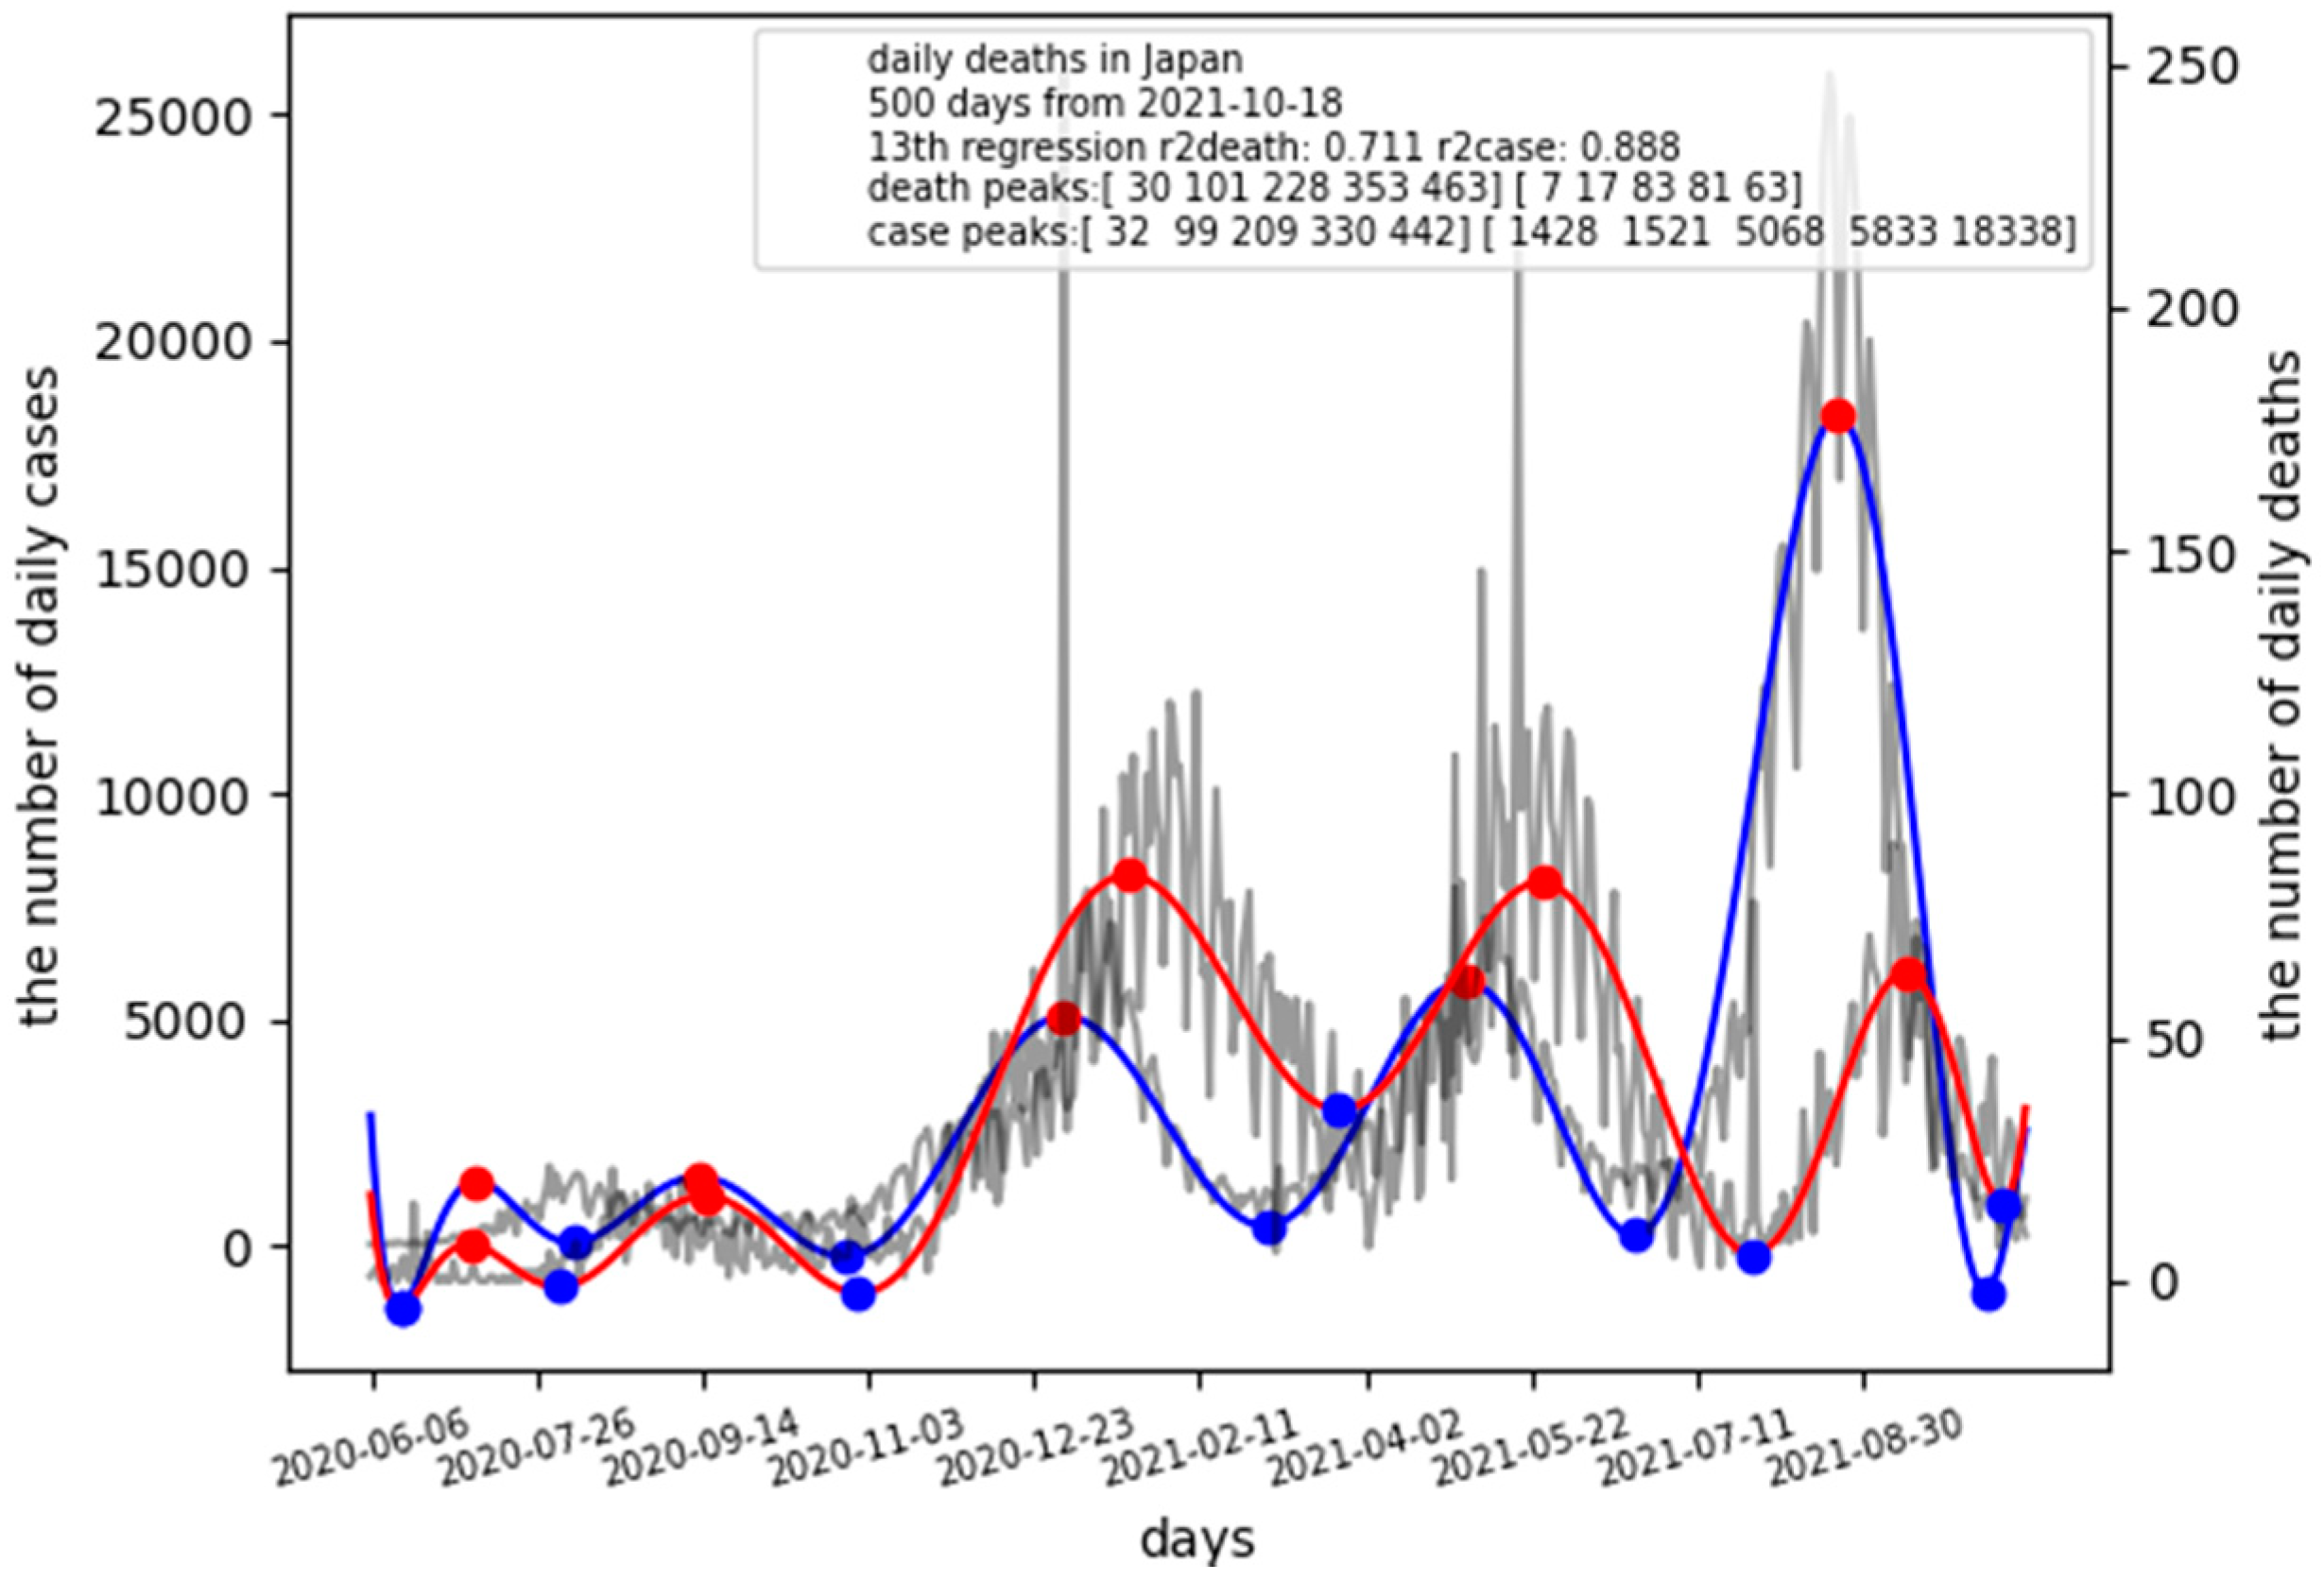
- $ covidlag Japan 500 13
This is for calculating the case fatality rate (CFR) and the lag time in Japan using 500 days from 18 October 2021 with 13th degree polynomial regression curve-fitting. The single graph should pop up on the screen as shown in Figure 1. Figure 1 shows the number of daily cases (infected) and the number of daily deaths by dimmed black colored lines. The graph has the number of daily cases on the left Y-axis and the number of daily deaths on the right Y-axis. The horizontal axis is 500 days from 18 October 2021. A blue-colored line indicates daily cases while red line indicates daily deaths. Red points show maxima, blue points for minima. The legend contains the values for calculating the CFR and the lag time from infection to death using maxima.
In addition to the graph, the following information is generated on terminal for maxima and minima:
maxima information
death peak: 2020-07-06
death peak: 2020-09-15
death peak: 2021-01-20
death peak: 2021-05-25
death peak: 2021-09-12
case peak: 2020-07-08
case peak: 2020-09-13
case peak: 2021-01-01
case peak: 2021-05-02
case peak: 2021-08-22
maxiddeath (array([30, 101, 228, 353, 463], dtype=int64),)
maxidcase (array([32, 99, 209, 330, 442], dtype=int64),)
ydeath[maxiddeath] [7 17 83 81 63]
ycase[maxidcase] [1428 1521 5068 5833 18338]
==================================
minima information
death minima: 2020-06-15
death minima: 2020-08-02
death minima: 2020-10-31
death minima: 2021-03-25
death minima: 2021-07-28
death minima: 2021-10-11
case minima: 2020-06-15
case minima: 2020-08-06
case minima: 2020-10-27
case minima: 2021-03-03
case minima: 2021-06-22
case minima: 2021-10-06
miniddeath (array([ 9, 57, 147, 292, 417, 492], dtype=int64),)
minidcase (array([ 9, 61, 143, 270, 381, 487], dtype=int64),)
ydeath[miniddeath] [−5 −1 −2 35 5 16]
ycase[minidcase] [−1386 72 −233 443 232 −988]
These values are used for calculating CFRs and lag times in several pandemic waves. For example, in the latest wave, the lag time is 463 − 442 = 21 days at the peak. CFR is calculated by CFR = 63/18,338 = 0.0034.
The current CFR is used for retrospective studies. For CFR computation, the length of days and the start and end dates are required in the conventional methods. The covidlag can automatically generate values for CFRs and lag times from a raw dataset.
2.2. PyPI Package
A PyPI package needs five files at least including README.md, setup.py, covidlag.py, __main__.py, and __init__.py, respectively.
2.2.1. README.md
README.md file can be easily prepared by using github site. You need to have an account on github site. When creating a new Repository, select “add a README file”. README.md will be created when you enter the necessary content of a new PyPI package. Remember that the image in Github should be linked to the global site image address instead of the local address. Unless the image is linked to the global address link, the image will not be displayed on the PyPI site.
2.2.2. setup.py
The following is a template of setup.py file for creating an executable code. Shaded texts should be changed for your PyPI package.
import setuptools
with open(“README.md”, “r”, encoding=“utf-8”) as fh:
long_description = fh.read()
setuptools.setup(
name=“covidlag”,
version=“0.0.7”,
author=“yoshiyasu takefuji”,
author_email=“[email protected]”,
description=“lag time and case fatality rate (CFR)”,
long_description=long_description,
long_description_content_type=“text/markdown”,
project_urls={
“Bug Tracker”: “https://github.com/ytakefuji/covidlag”,
},
classifiers=[
“Programming Language::Python::3”,
“License::OSI Approved::MIT License”,
“Operating System::OS Independent”,
],
package_dir={““: “src”},
py_modules=[‘covidlag’],
packages=setuptools.find_packages(where=“src”),
python_requires=“>=3.7”,
entry_points = {
‘console_scripts’: [
‘covidlag = covidlag:main’
]
},
)
2.2.3. convidlag.py, __main__.py, __init__.py
covidlag.py is to compute the accurate case infection rate and the lag time from infection to death. covidlag.py accepts three parameters (country, the number of days, and the degree of curve-fitting polynomial) from the console terminal.
covidlag.py is available at the following site: https://github.com/ytakefuji/covidlag/raw/main/covidlag.py (accessed on 23 November 2021).
import pandas as pd
…
class main:
def main(self,country=“Japan”,samples=400,degree=7):
…
m=main()
m.main(country,samples,degree)
__main__.py is a single line:
import covidlag
__init__.py is composed of two lines:
import covidlag
import __main__
The following codes can scrape the latest dataset over the Internet and correct some minus numbers in the dataset and save the corrected csv file. subprocess library is aliased as sp in the program. Bash shell line commands in the Python program include “wget”, “cat”, “sed”, “|”, “>”, “mv”, and “rm”. See the details of these commands at the following site: https://github.com/ytakefuji/bash-shell (accessed on 23 November 2021).
import subprocess as sp
sp.call(“wget https://raw.githubusercontent.com/owid/covid-19-data/master/public/data/owid-covid-data.csv”,shell=True)
sp.call(“cat owid-covid-data.csv|sed ‘2,$s/,-/,/g’ >new”,shell=True)
sp.call(“mv new owid-covid-data.csv”,shell=True)
d=pd.read_csv(“owid-covid-data.csv”)
sp.call(“rm owid-covid-data.csv”,shell=True).
2.3. How to Upload a PyPI Package
You need to generate three files (.whl file, .egg file, and .tar.gz file). Type the following commands:
$ python setup.py install
$ python setup.py sdist bdist_wheel
In order to upload three files (covidlag-0.0.7-py3-none-any.whl covidlag-0.0.7-py3.8.egg covidlag-0.0.7.tar.gz), you need to install twine:
$ pip install twine
Before uploading three files to PyPI site, you need to register at the following site: https://pypi.org/ (accessed on 23 November 2021).
The directory and files are as follows:

The following command can upload three files. The system will ask for user name and password.
$ twine upload dist/*
When you want to update the package, you must delete all files and directories in dist/* and build/* by the following command.
$ rm -rf dist/* build/*.
3. PyPI Package
PyPI Stats aims to provide aggregate download information on python packages available from the Python Package Index in lieu of having to execute queries against raw download records in Google BigQuery.
In order to use PyPI Stats, you have to install it.
$ pip install -U pypistats
To run it, type the following command:
$ pypistats overall covidlag
| category | percent | downloads |
| --------------- | ------: | --------: |
| with_mirrors | 100.00% | 3739 |
| without_mirrors | 14.98% | 560|
| Total | | 3739 |
The result shows covidlag was downloaded by 4263 users worldwide as of 23 November 2021.
The author created deathdaily for predicting the number of deaths in the next 7 days and scorecovid [14] for scoring individual policies against COVID-19.
The deathdaily is based on curve-fitting function. In scorecovid, score is based on the number of deaths per population (millions). Policymakers should use the deathdaily tool as a good indicator whether their polices should be strengthened or mitigated.
The scorecovid allows policymakers to learn good strategies from countries with excellent scores. Digital fences play a key role in mitigating the pandemic [15].
deathdaily has been downloaded by 12454 users worldwide while scorecovid with 7659 users as of 23 November 2021.
The described covidlag, deathdaily, and scorecovid are useful tools for analyzing the COVID-19 pandemic.
3.1. Discussion
This tutorial allows researchers to submit a new PyPI package and to showcase their tools on PyPI packages around the world. All we need to do is to create five files including xxx.py, setup.py, README.md, __main__.py, and __init__.py by following instructions in Materials and Methods Section. Before submitting the new package, you should test it on your local machine.
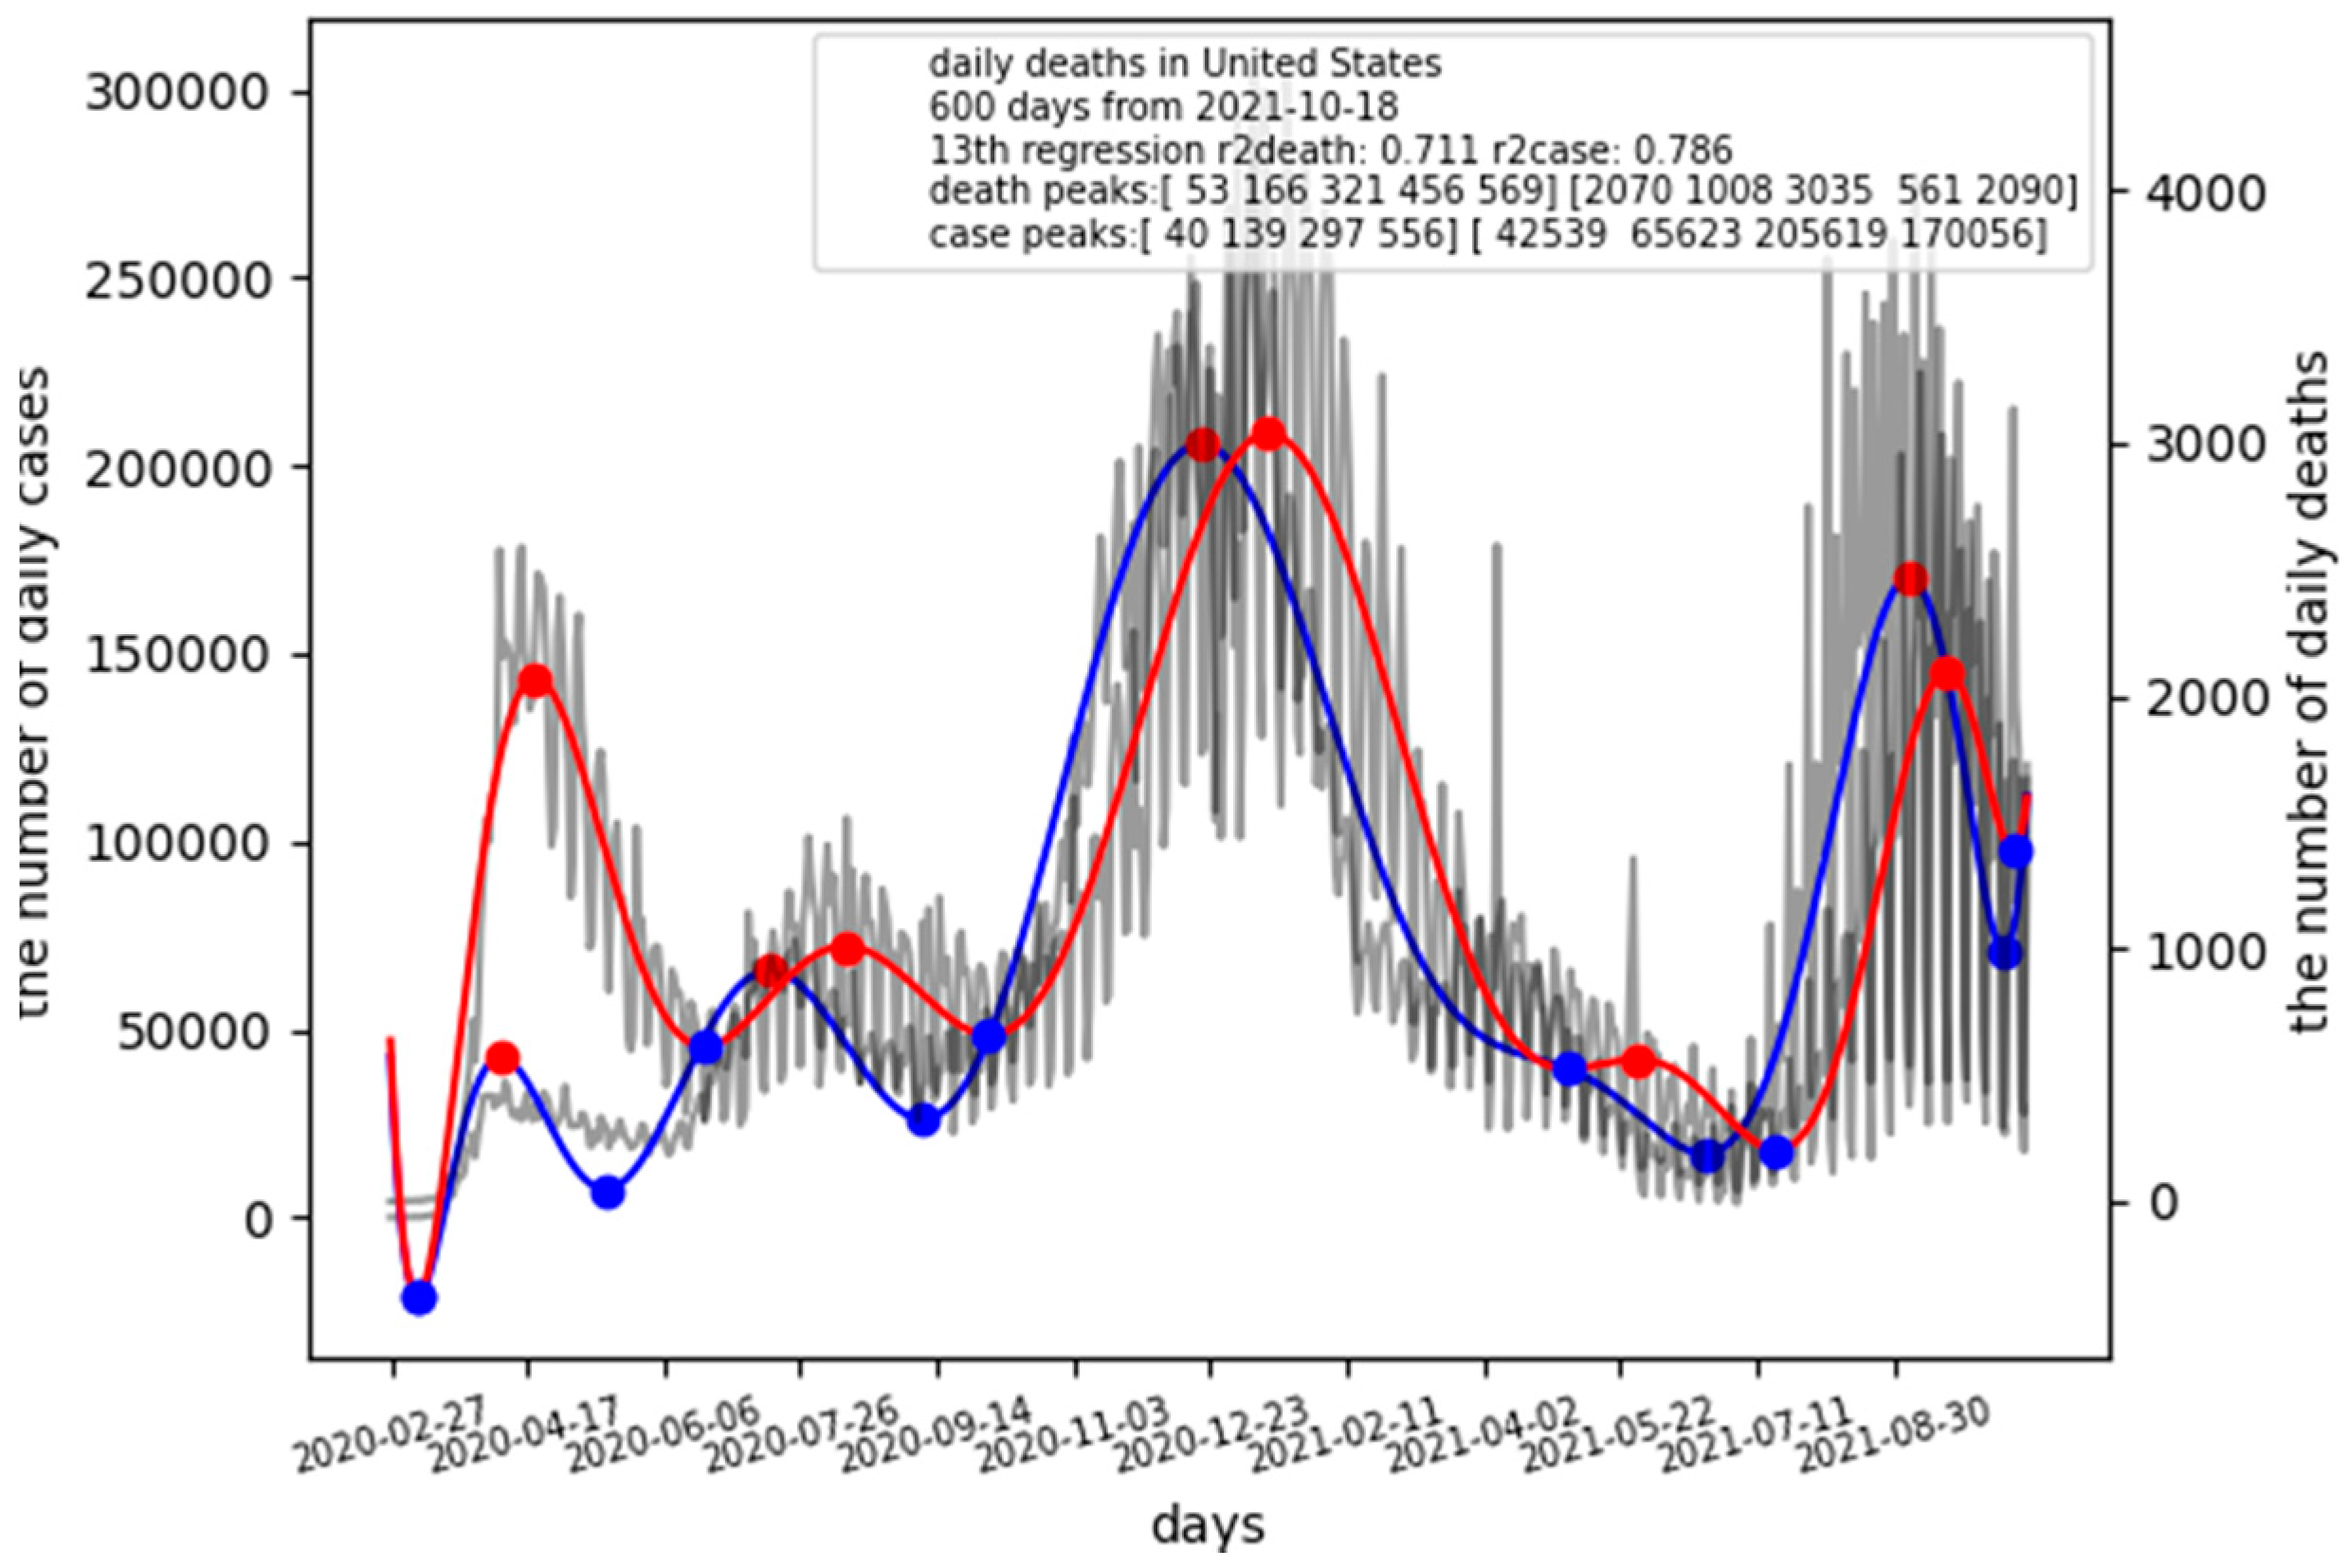
When comparing the result of Japan with that of the United States (Figure 2), it is clear to the observer the difference between Japan and the US on CFR.
$ covidlag ‘United States’ 600 13
The latest CFR of the US is CFR = 2090/170056 = 0.0123, which is four times higher than that in Japan. The lag time of the US is 13 days, which is shorter than that in Japan.
3.2. Deathdaily.py and Scorecovid.py
This is the world’s first tutorial on PyPI packaging for translational medicine or medicine in general. This tutorial allows researchers to build a new PyPI package and to showcase their tools on PyPI packages around the world. covidlag.py, setup.py, and README.md were detailed in this paper. deathdaily and scorecovid were also introduced where their source codes are available at the following sites: https://github.com/ytakefuji/score-covid-19-policy/raw/main/scorecovid.py (accessed on 23 November 2021); https://github.com/ytakefuji/covid-19_daily_death_prediction/raw/main/deathdaily.py (accessed on 23 November 2021).
Funding
This research received no external funding.
Institutional Review Board Statement
Not Applicable.
Informed Consent Statement
Not Applicable.
Data Availability Statement
Not Applicable.
Conflicts of Interest
The authors declare no conflict of interest.
References
- Nowogrodzki, A. How to support open-source software and stay sane. Nat. Cell Biol. 2019, 571, 133–134. [Google Scholar] [CrossRef] [PubMed]
- Schindelin, J.; Arganda-Carreras, I.; Frise, E.; Kaynig, V.; Longair, M.; Pietzsch, T.; Preibisch, S.; Rueden, C.; Saalfeld, S.; Schmid, B.; et al. Fiji: An open-source platform for biological-image analysis. Nat. Methods 2012, 9, 676–682. [Google Scholar] [CrossRef] [PubMed] [Green Version]
- Pintacuda, G.; Lassen, F.H.; Hsu, Y.-H.H.; Kim, A.; Martin, J.; Malolepsza, E.; Lim, J.K.; Fornelos, N.; Eggan, K.C.; Lage, K. Genoppi is an open-source software for robust and standardized integration of proteomic and genetic data. Nat. Commun. 2021, 12, 2580. [Google Scholar] [CrossRef] [PubMed]
- Virtanen, P.; Gommers, R.; Oliphant, T.E.; Haberland, M.; Reddy, T.; Cournapeau, D.; Burovski, E.; Peterson, P.; Weckesser, W.; Bright, J.; et al. SciPy 1.0: Fundamental algorithms for scientific computing in Python. Nat. Methods 2020, 17, 261–272. [Google Scholar] [CrossRef] [PubMed] [Green Version]
- Harris, C.R.; Millman, K.J.; van der Walt, S.J.; Gommers, R.; Virtanen, P.; Cournapeau, D.; Wieser, E.; Taylor, J.; Berg, S.; Smith, N.J.; et al. Array programming with NumPy. Nature 2020, 585, 357–362. [Google Scholar] [CrossRef] [PubMed]
- Bankhead, P.; Loughrey, M.B.; Fernández, J.A.; Dombrowski, Y.; McArt, D.G.; Dunne, P.D.; McQuaid, S.; Gray, R.T.; Murray, L.J.; Coleman, H.G.; et al. QuPath: Open source software for digital pathology image analysis. Sci. Rep. 2017, 7, 16878. [Google Scholar] [CrossRef] [Green Version]
- Pennington, Z.T.; Dong, Z.; Feng, Y.; Vetere, L.M.; Page-Harley, L.; Shuman, T.; Cai, D.J. ezTrack: An open-source video analysis pipeline for the investigation of animal behavior. Sci. Rep. 2019, 9, 19979. [Google Scholar] [CrossRef] [PubMed] [Green Version]
- Webb, S. Deep learning for biology. Nat. Cell Biol. 2018, 554, 555–557. [Google Scholar] [CrossRef] [PubMed] [Green Version]
- McCallum, C.; Riordon, J.; Wang, Y.; Kong, T.; You, J.B.; Sanner, S.; Lagunov, A.; Hannam, T.G.; Jarvi, K.; Sinton, D. Deep learning-based selection of human sperm with high DNA integrity. Commun. Biol. 2019, 2, 250. [Google Scholar] [CrossRef] [PubMed] [Green Version]
- Chen, K.M.; Cofer, E.M.; Zhou, J.; Troyanskaya, O.G. Selene: A PyTorch-based deep learning library for sequence data. Nat. Methods 2019, 16, 315–318. [Google Scholar] [CrossRef] [PubMed]
- Lawal, M.O. Tomato detection based on modified YOLOv3 framework. Sci. Rep. 2021, 11, 1447. [Google Scholar] [CrossRef] [PubMed]
- Covidlag, Lag Time and Case Fatality Rate (CFR). Available online: https://pypi.org/project/covidlag/ (accessed on 23 November 2021).
- Perkel, J.M. Five reasons why researchers should learn to love the command line. Nat. Cell Biol. 2021, 590, 173–174. [Google Scholar] [CrossRef] [PubMed]
- Takefuji, Y. SCORECOVID: A Python Package Index for scoring the individual policies against COVID-19. Health Anal. 2021, 1, 100005. [Google Scholar] [CrossRef]
- Takefuji, Y. Analysis of digital fences against COVID-19. Health Technol. 2021, 11, 1383–1386. [Google Scholar] [CrossRef] [PubMed]
Figure 1.
Case fatality rate and lag time in Japan as of 18 October 2021.

Figure 2.
Case fatality rate and lag time in the United States as of 18 October 2021.

Publisher’s Note: MDPI stays neutral with regard to jurisdictional claims in published maps and institutional affiliations. |
© 2021 by the author. Licensee MDPI, Basel, Switzerland. This article is an open access article distributed under the terms and conditions of the Creative Commons Attribution (CC BY) license (https://creativecommons.org/licenses/by/4.0/).
Share and Cite
MDPI and ACS Style
Takefuji, Y. Python Programming in PyPI for Translational Medicine. Int. J. Transl. Med. 2021, 1, 323-331. https://0-doi-org.brum.beds.ac.uk/10.3390/ijtm1030019
AMA Style
Takefuji Y. Python Programming in PyPI for Translational Medicine. International Journal of Translational Medicine. 2021; 1(3):323-331. https://0-doi-org.brum.beds.ac.uk/10.3390/ijtm1030019
Chicago/Turabian StyleTakefuji, Yoshiyasu. 2021. "Python Programming in PyPI for Translational Medicine" International Journal of Translational Medicine 1, no. 3: 323-331. https://0-doi-org.brum.beds.ac.uk/10.3390/ijtm1030019