
A Low Order Flow Network Model for Double-Wall Effusion Cooling Systems †


Department of Engineering Science, University of Oxford, Oxford OX1 3PJ, UK
*
Author to whom correspondence should be addressed.
†
This paper is an extended version of our paper published in Proceedings of the European Turbomachinery Conference ETC14 2021, Paper No. 666, Gdansk, Poland, 12–16 April 2021.
Int. J. Turbomach. Propuls. Power 2022, 7(1), 5; https://0-doi-org.brum.beds.ac.uk/10.3390/ijtpp7010005
Submission received: 9 December 2021
/
Revised: 23 December 2021
/
Accepted: 31 January 2022
/
Published: 2 February 2022
Abstract
:The high pressure turbine nozzle guide vane of a modern aeroengine experiences large heat loads and thus requires both highly effective internal and external cooling. This can be accomplished with double-wall effusion cooling, which combines impingement, pin-fin and effusion cooling. The combination of three cooling mechanisms causes high pressure losses, increasing potential for the migration of coolant towards low pressure regions, subsequently starving effusion holes on the leading edge of coolant supply. This paper presents a low order flow network model to rapidly assess the pressure and mass flow distributions through such cooling schemes for a flexible set of geometric and flow conditions. The model is subsequently validated by a series of experiments with varying mainstream pressure gradients. Results from the model are used to indicate design parameters to reduce the effect of coolant migration, and to minimise the risk of destructive hot gas ingestion.
1. Introduction
Studies into the thermal efficiency of gas turbines have come to the consensus that the specific fuel consumption can be improved by increasing the turbine entry temperature. To maximise this benefit, modern aeroengines use TETs well in excess of the turbine components’ melting temperatures. Cooling systems are required to prevent component failure, but these reduce power output by reducing the air available for combustion and causing mixing losses in the turbine, which reduce aerodynamic efficiency. Double-wall effusion cooling is viewed as a potential solution to these challenges—the high porosity make-up of the system brings it close to the goal of accomplishing micro-cooling. Bunker [1,2] noted that mirco-cooling has two goals—“spread[ing] out the cooling network in a series of smaller and highly distributed channels” and “bringing the cooling fluid closer to the outer surface of the airfoil”. This is accomplished by combining three commonly used cooling techniques—impingement cooling, pin-fin cooling and effusion (or film) cooling, with features densely packed to spread out the coolant, and double-walled to allow coolant to sit close to the outer surface.
Figure 1 shows an example of double-wall effusion cooling being employed in a modern commercial engine turbine blade. This combination of cooling techniques leads to high convection cooling efficiency (1) and overall cooling effectiveness (2), but also produces high pressure losses.
The high pressure losses caused by combining three cooling schemes can make double-wall effusion cooling systems vulnerable to coolant migration—the movement of coolant in the pedestal cavity toward low pressure regions under the influence of an external pressure gradient. Coolant migration can be particularly concerning in components where the coolant supply to mainstream stagnation pressure ratio is low—the main example of this being the Turbine’s High Pressure NGV, where the mainstream stagnation pressure is only ~3% less than that of the coolant supplied from the HP Compressor. In a configuration such as that shown in Figure 1, where the cavity between the walls is continuous along both surfaces, the streamwise pressure gradient will lead to coolant in the cavity migrating away from the LE sections and toward film holes further along the PS and SS. Spanwise pressure gradients can have similar effects, causing cooling coolant to move from the hub to the tip. Results produced by Holgate et al. [4] showed that for an engine representative NGV, the external static pressure coefficient (3) could fall from −0.2 to −1.2 along the early suction surface alone—given the small pressure margin at the leading edge, this provides a major driving force for coolant migration.
To combat coolant migration, recent patented designs using this cooling scheme (e.g., [5,6]) use walls across the span of the cavity to create separate cooling zones for the PS, LE and SS, but this reduces the effectiveness of pin-fin cooling due to reduced throughflow and turbulence generation.
Coolant migration can have severely detrimental impacts on the film cooling effectiveness in both the region the coolant migrates away from and the region it migrates to. If coolant migration is high enough, the region losing coolant can essentially be starved, leading to destructive hot gas ingestion, which will eventually cause component failure. In the region that the coolant migrates to, a high pressure margin across the outer skin causes film hole flows to be ejected into the mainstream with high velocity, potentially leading to jet-lift off. In both regions, film cooling effectiveness would be significantly reduced, so the component would experience much greater heat loads and would likely have a much shorter operating life. Predicting and controlling coolant migration is key to ensuring the proper development of a coolant film for external cooling.
This paper summarizes work done to model coolant migration within double-wall effusion cooling systems under the influence of mainstream pressure gradients, done through the use of low order flow network models (LOMs). The LOM developed is a high speed, iterative solver that produces mass flow and pressure distributions throughout cooling arrays for given boundary conditions. This allowed assessment of a high number of design possibilities that would’ve been too computationally expensive to do in a time-efficient manner using CFD.
2. Related Work
2.1. Double-Wall Effusion Cooling Systems
Research has been conducted into the application of double-wall effusion cooling systems since the 1970s, but their application in modern engines is limited due to issues of manufacturing difficulty and high thermomechanical stresses. As transpiration cooling research is becoming more prevalent, double-wall effusion cooling has become a topic of increased interest—the high manufactured porosity, complex internal flow field, and low film hole blowing ratio lead to such schemes being dubbed as “quasi-transpiration” cooling by Murray et al. [3], who conducted a series of computational tests to find the effects of various geometric parameters on the thermomechanical stresses developed. Increases of the passage height, pedestal diameter and hole diameters were shown to reduce the average thermomechanical stress, as did reducing the pedestal spacing.
Flow travelling through arrays of pedestals can undergo high pressure loss due to the wakes generated behind the pedestals. Research by Chyu et al. [7] and Siw et al. [8] showed that staggered arrays of pedestals caused much greater pressure drops than in-line arrays. The pedestal shape can also have a large influence—cylindrical pedestals produce less pressure loss than those of square or diamond (square rotated by 45°) shapes [7], but also produce lower HTCs.
Bamba et al. [9] found experimentally that in regions where pin-fins did not significantly obstruct the passage of flow from impingement to film hole entry, such as at the LE, the contribution of the pin-fins to the pressure loss was negligible. In these regions, pedestals enhance cooling only by increasing the surface area over which heat transfer can take place.
The dominant form of pressure loss in these systems, however, is from impingement cooling. Andrews et al. [10] stated that “for impingement/effusion applications it is … valid to assume that all the pressure loss would occur at the impingement plate”. Greater pressure losses generally equate to increased cooling performance, as is the case for pin-fin arrays.
Murray et al. [11] conducted a comprehensive study of the effect of the cooling scheme’s porosity on its performance. Higher porosity geometries (particularly those with high porosity in the walls) required less coolant mass flow for a given pressure drop and exhibited “relatively high cooling effectiveness” at low coolant flow rates. The authors suggested cooling around the blade could be optimised by varying the porosity as required—high pressure drop regions (i.e., the SS) should use low porosity cooling geometries to minimise aerodynamic losses, whilst areas such as the PS should use higher porosity geometries for increased coolant flow and better effusion cooling performance.
Wambersie et al. [12] conducted experimental tests using high-porosity panels, inspired by transpiration-cooling designs. Whilst these panels gave exceptionally high film effectiveness levels at standard blowing rates, at low flow rates the low pressure margin made the panels susceptible to mainstream flow ingestion, localised to certain regions as a result of high streamwise and spanwise pressure gradients.
2.2. Flow Networks
The models developed for this paper were based on flow network solvers developed by Rose [13], and later by Kutz and Speer [14]. In these systems, flow networks were produced by creating lists of nodes, each representing a specific point in the cooling system. Nodes are connected by links, along which fluid is allowed to flow, forming a network of connected nodes. Boundary nodes form the inlet and outlet of flow within a network. In order to solve for the flow through a network, the law of mass conservation is applied at each internal node—for a node connected to nodes , the governing equation is given by (4) The mass flow rate along a link connecting nodes and is determined by Equation (5) where the function is used to model the three-dimensional flow as one-dimensional. Kutz and Speer [14] expanded from solving for continuity to account for the heat transfer along each link by making use of the energy equation, adding another governing Equation (6) at each node. This network approach was applied to a full secondary air system, and results for the rear sealing chamber air pressure were in good agreement with engine test results.
Using a similar methodology, Ebenhoch and Speer [15] produced a network solver that was applied to three test cases; isothermal flow in a multipass blade cooling system, coolant flow undergoing high heat transfer in a hypersonic vehicle nozzle, and coolant flow in a rotating HP blade. This flexible network solver was deemed to have “sufficient accuracy in predicting coolant mass flow, regional coolant side heat transfer coefficients, and local coolant temperatures”.
Gouws et al. [16] created a network solver for a modern combustor that, once calibrated with experimental data, predicted the mass flow splits through cooling holes with high accuracy. Heat transfer elements within the network allowed a prediction of the outlet temperature distribution. It was found that in a cooling system with large numbers of cooling holes, discharge coefficients had a high influence on one-dimensional flow and pressure drop predictions.
Jin et al. [17] used a compressible flow network analysis to find the mass flow distribution for the various positions around the trailing edge of an HP turbine blade, as part of an investigation into blade oxidation. This investigation revealed that an inlet metering plate at the blade root reduced the coolant internal pressure, raising the risk of hot gas ingestion, particularly in “off-design or transient conditions”. The network allowed testing and recommendation of changes to reduce this risk.
3. Modelling Methodology
3.1. Flow Network Construction
The LOM presented focused only on mass flow continuity and was based on test cases without heat transfer and in incompressible conditions. This allowed the temperature of each node to be neglected, with the model solving only for the pressures at each node. Newton’s method (see [18]) was used to iteratively solve for the internal pressure distribution. Static pressures at each node served as the list of unknowns, which could then be used to calculate mass flows through the network. In these conditions, the mass flow along a link between nodes and becomes a function only of the link’s compliance, , and the pressure difference between the nodes, such that:
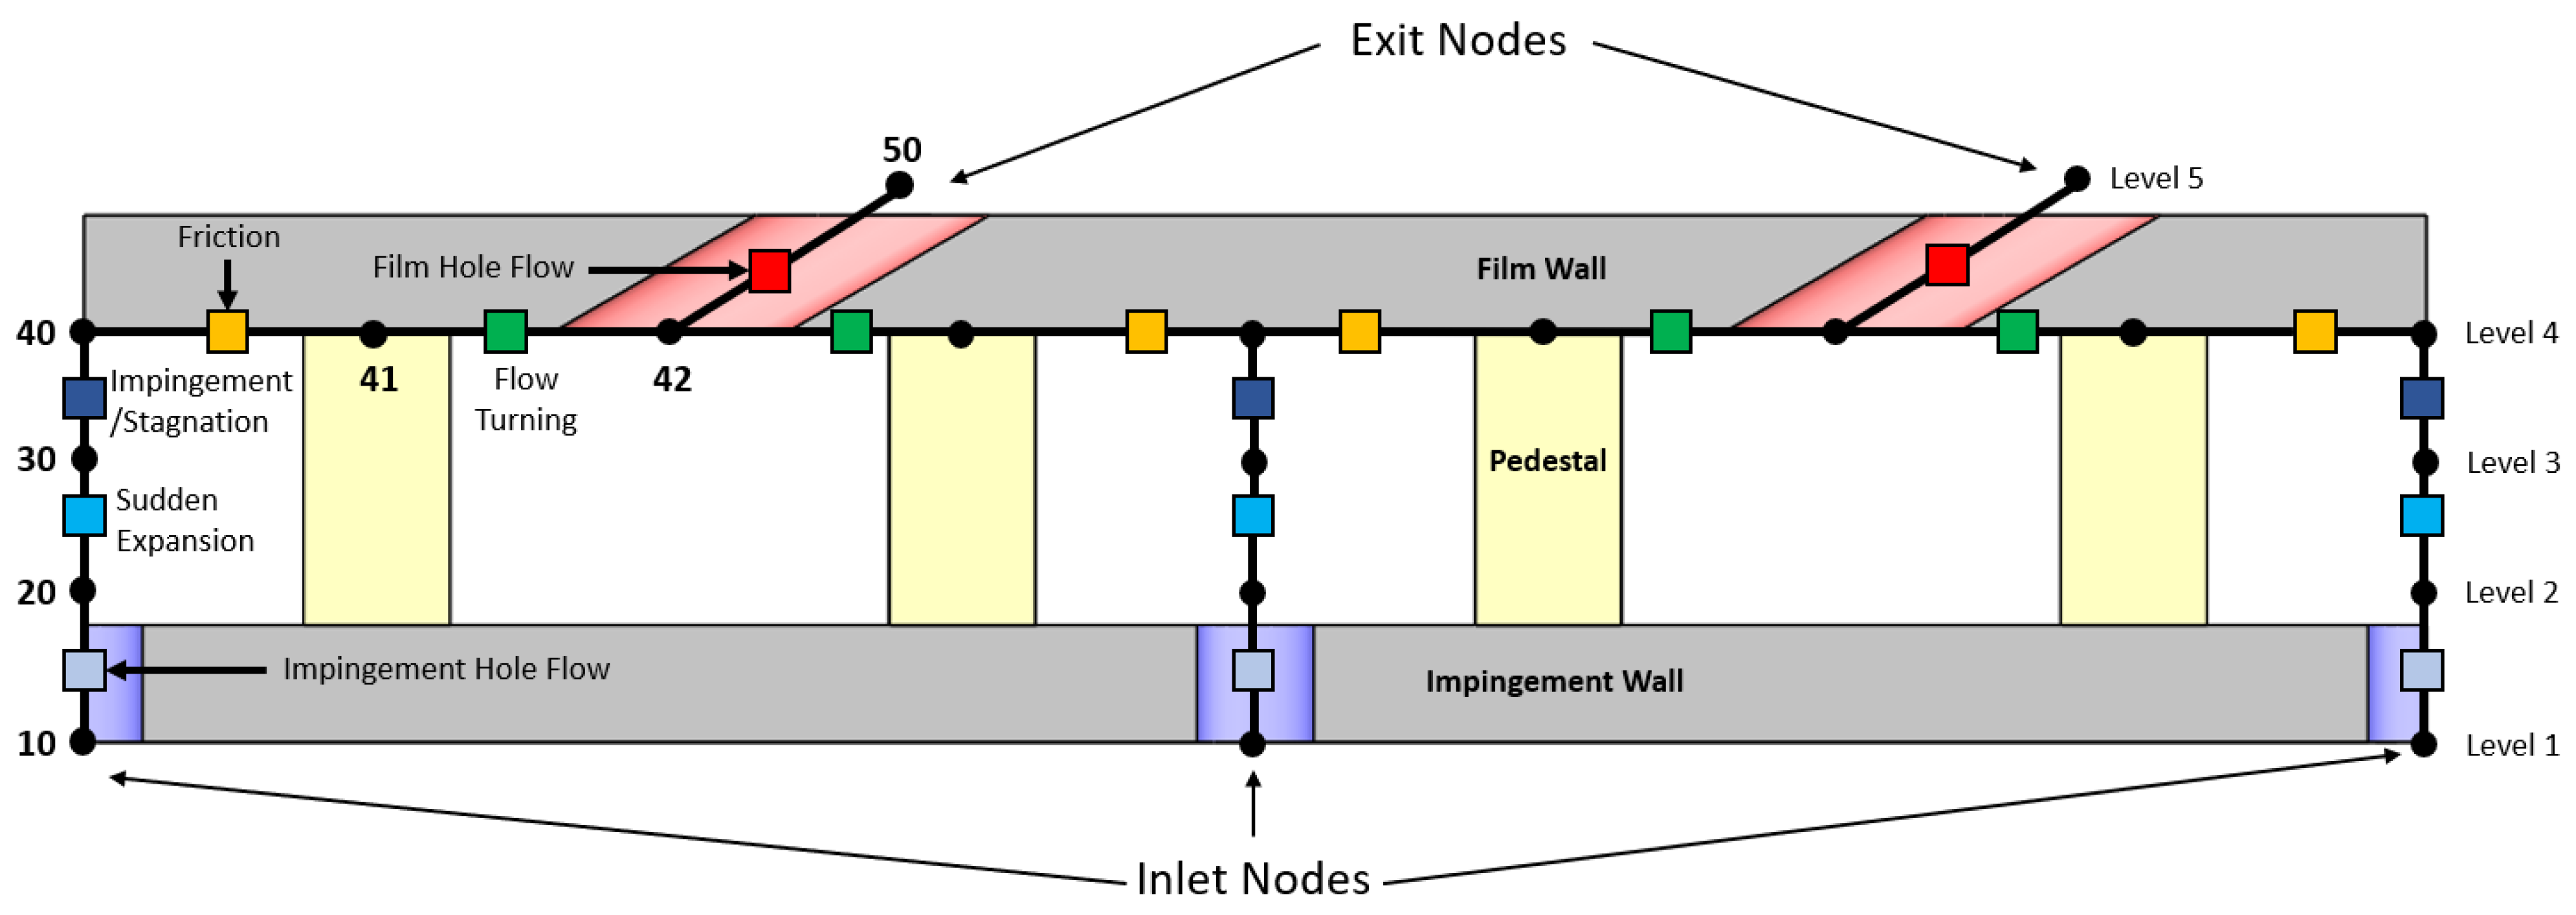
The geometries discussed in this paper used a staggered arrangement of film holes and impingement holes, such that no holes of the same type were located next to one another—this layout is the same as shown in Figure 1. The standard flow network layout is shown for a single row of holes and pedestals in Figure 2—in the case of there being multiple rows, further nodes would be located into the page, with impingement and film holes alternating left/right positions. The position of each node has three components: position in the streamwise direction, level in the cooling system (1 at the bottom, 5 at the top), and spanwise row number. Other than for nodes on the pedestal layer (Level 4), all nodes on the same layer are of the same type. Links are created based on the physical flow paths available from each node’s position, so flow is allowed to transfer to nodes on the same level only on Level 4—the other levels only have links to nodes directly above or below.
The number label for each node determines its type:
- 10: Impingement Hole Entry/Inlet Nodes. Boundary nodes with fixed pressure.
- 20: Impingement Hole Exit Nodes. Node pressure is representative of the flow as it leaves the hole.
- 30: Impingement Point Nodes. Nodes represent the point at which flow stagnates on the inner surface of the outer wall as the jet flow from the hole impinges.
- 40: Expansion from Impingement Nodes. Represents flow as it accelerates away from the impingement points, but before it interacts with any pedestals. In the diagram, this point is represented as being above the impingement point for ease of display.
- 41: Post Pedestal Nodes. Frictional pressure losses due to pedestals are modelled in the link between nodes 40 and 41.
- 42: Film Entry Hole Nodes. As noted in Figure 2, these nodes are only used in the case when the film hole inclination is not 90°—when film holes are perpendicular, the 42 nodes are merged with linked 41 nodes. When holes are inclined, flow from one direction turns by a different angle than flow from the opposite direction, requiring the use of a different dynamic head loss coefficient.
- 50: Film Hole Exit Nodes. Boundary nodes with fixed pressure.
The mass flow functions and compliances are dependent on the type of link. Flow through a hole, occurring for impingement holes between Levels 1 and 2, and occurring for film holes between Levels 4 and 5, allows the discharge Equation (8) to be used—all holes of both types are cylindrical in this geometry. In cases where high coolant migration and thus an uneven outlet flow distribution is expected, it is unreasonable to assume that all film holes will have similar discharge coefficients. To account for this, the discharge coefficient for each hole was updated in each iteration. The two pressure values from the previous iteration were used to calculate the area-averaged velocity through the hole. This velocity, the pressure ratio across the hole and geometric properties were used to calculate an updated discharge coefficient using a correlation developed by Mazzei et al. [19]. This was applied to both impingement and film holes. The area ratios and use a square inlet area with a side length of half the hole pitch, and the expansibility factor is taken as unity as the air is assumed to be incompressible.
The connection between Levels 2 and 3 represents the sudden expansion of flow area, when flow leaves the impingement hole and enters the inter-wall cavity. At Level 3, flow is expected to stagnate as it impinges on the outer wall, allowing the form of the Bernoulli equation shown in (9). to be used—this features a loss coefficient to account for sudden expansion pressure loss.
To account for the total pressure loss produced by a jet impinging on a wall, a similar loss equation is used for the link between Levels 3 and 4. A single node is used in this position at Level 4, as it assumed that there is no circumferential variation in total pressure loss due to impingement.
Equation (11) accounts for flow around pedestals on Level 4 between nodes 40 and 41. The friction factor for flow around pedestals is determined by the correlation developed by Wang [20].
When turning flows are employed, the mass flow between nodes 41 and 42 is given by (12). For turning flows, loss coefficients were selected from studies by Miller [21]. In cases with close packed pedestals, (11). is replaced by a flow coefficient in the same form as (12), as pressure losses become functions of impingement onto pedestals and turning between them, rather than by friction. This equation uses the assumption that is larger than .
3.2. Computational Implementation
The LOM was produced in MATLAB (MathWorks—Natick, MA, USA), using summations for the mass flows out of nodes described in the equations above, as in (4). The initial guess of pressures through the network was selected to ensure that pressure drops and rises occurred along the links that were expected. To enhance the stability of the model, changes between iterations were damped. The value of the damping factor used was 0.5 in simpler models, such as the geometry featured in Figure 3, but more complex geometries or high mainstream pressure gradients often required to be reduced further. This slowed convergence of the model, though the solving time remained on the order of seconds, a huge reduction from CFD cases. Convergence of the LOM was attained when the maximum absolute value of mass flow imbalance at any node was less than 10−12 kg/s. An additional mass flow check was performed by comparing the inlet and outlet total mass flows.
3.3. Example Results
Figure 3 shows a set of example results for the LOM. Flow paths are contoured by their mass flow rate. In this test case, all film holes are ejecting to the same outlet pressure, and all impingement holes have the same inlet pressure. Despite this, the film holes in the central row (2nd spanwise position) clearly have larger outlet flows than those in the outer rows. The position of the impingement holes leads to film holes at the right end (highest streamwise distance) of the array each having ~75% of the coolant flow that each film hole in the centre receives. The unevenness in the outlet flow distribution is not matched at the inlet—the two impingement holes at the left end of the array (lowest streamwise distance) are the most poorly fed, but receive only 5% less flow than those in the centre of the array. The size of this array and the inclination angle of the film holes are flexible—this particular test case size is ‘6 × 3’, with six hole positions in streamwise direction and three in the spanwise direction. The film hole angle of inclination is 30°.
4. Computational Methodology
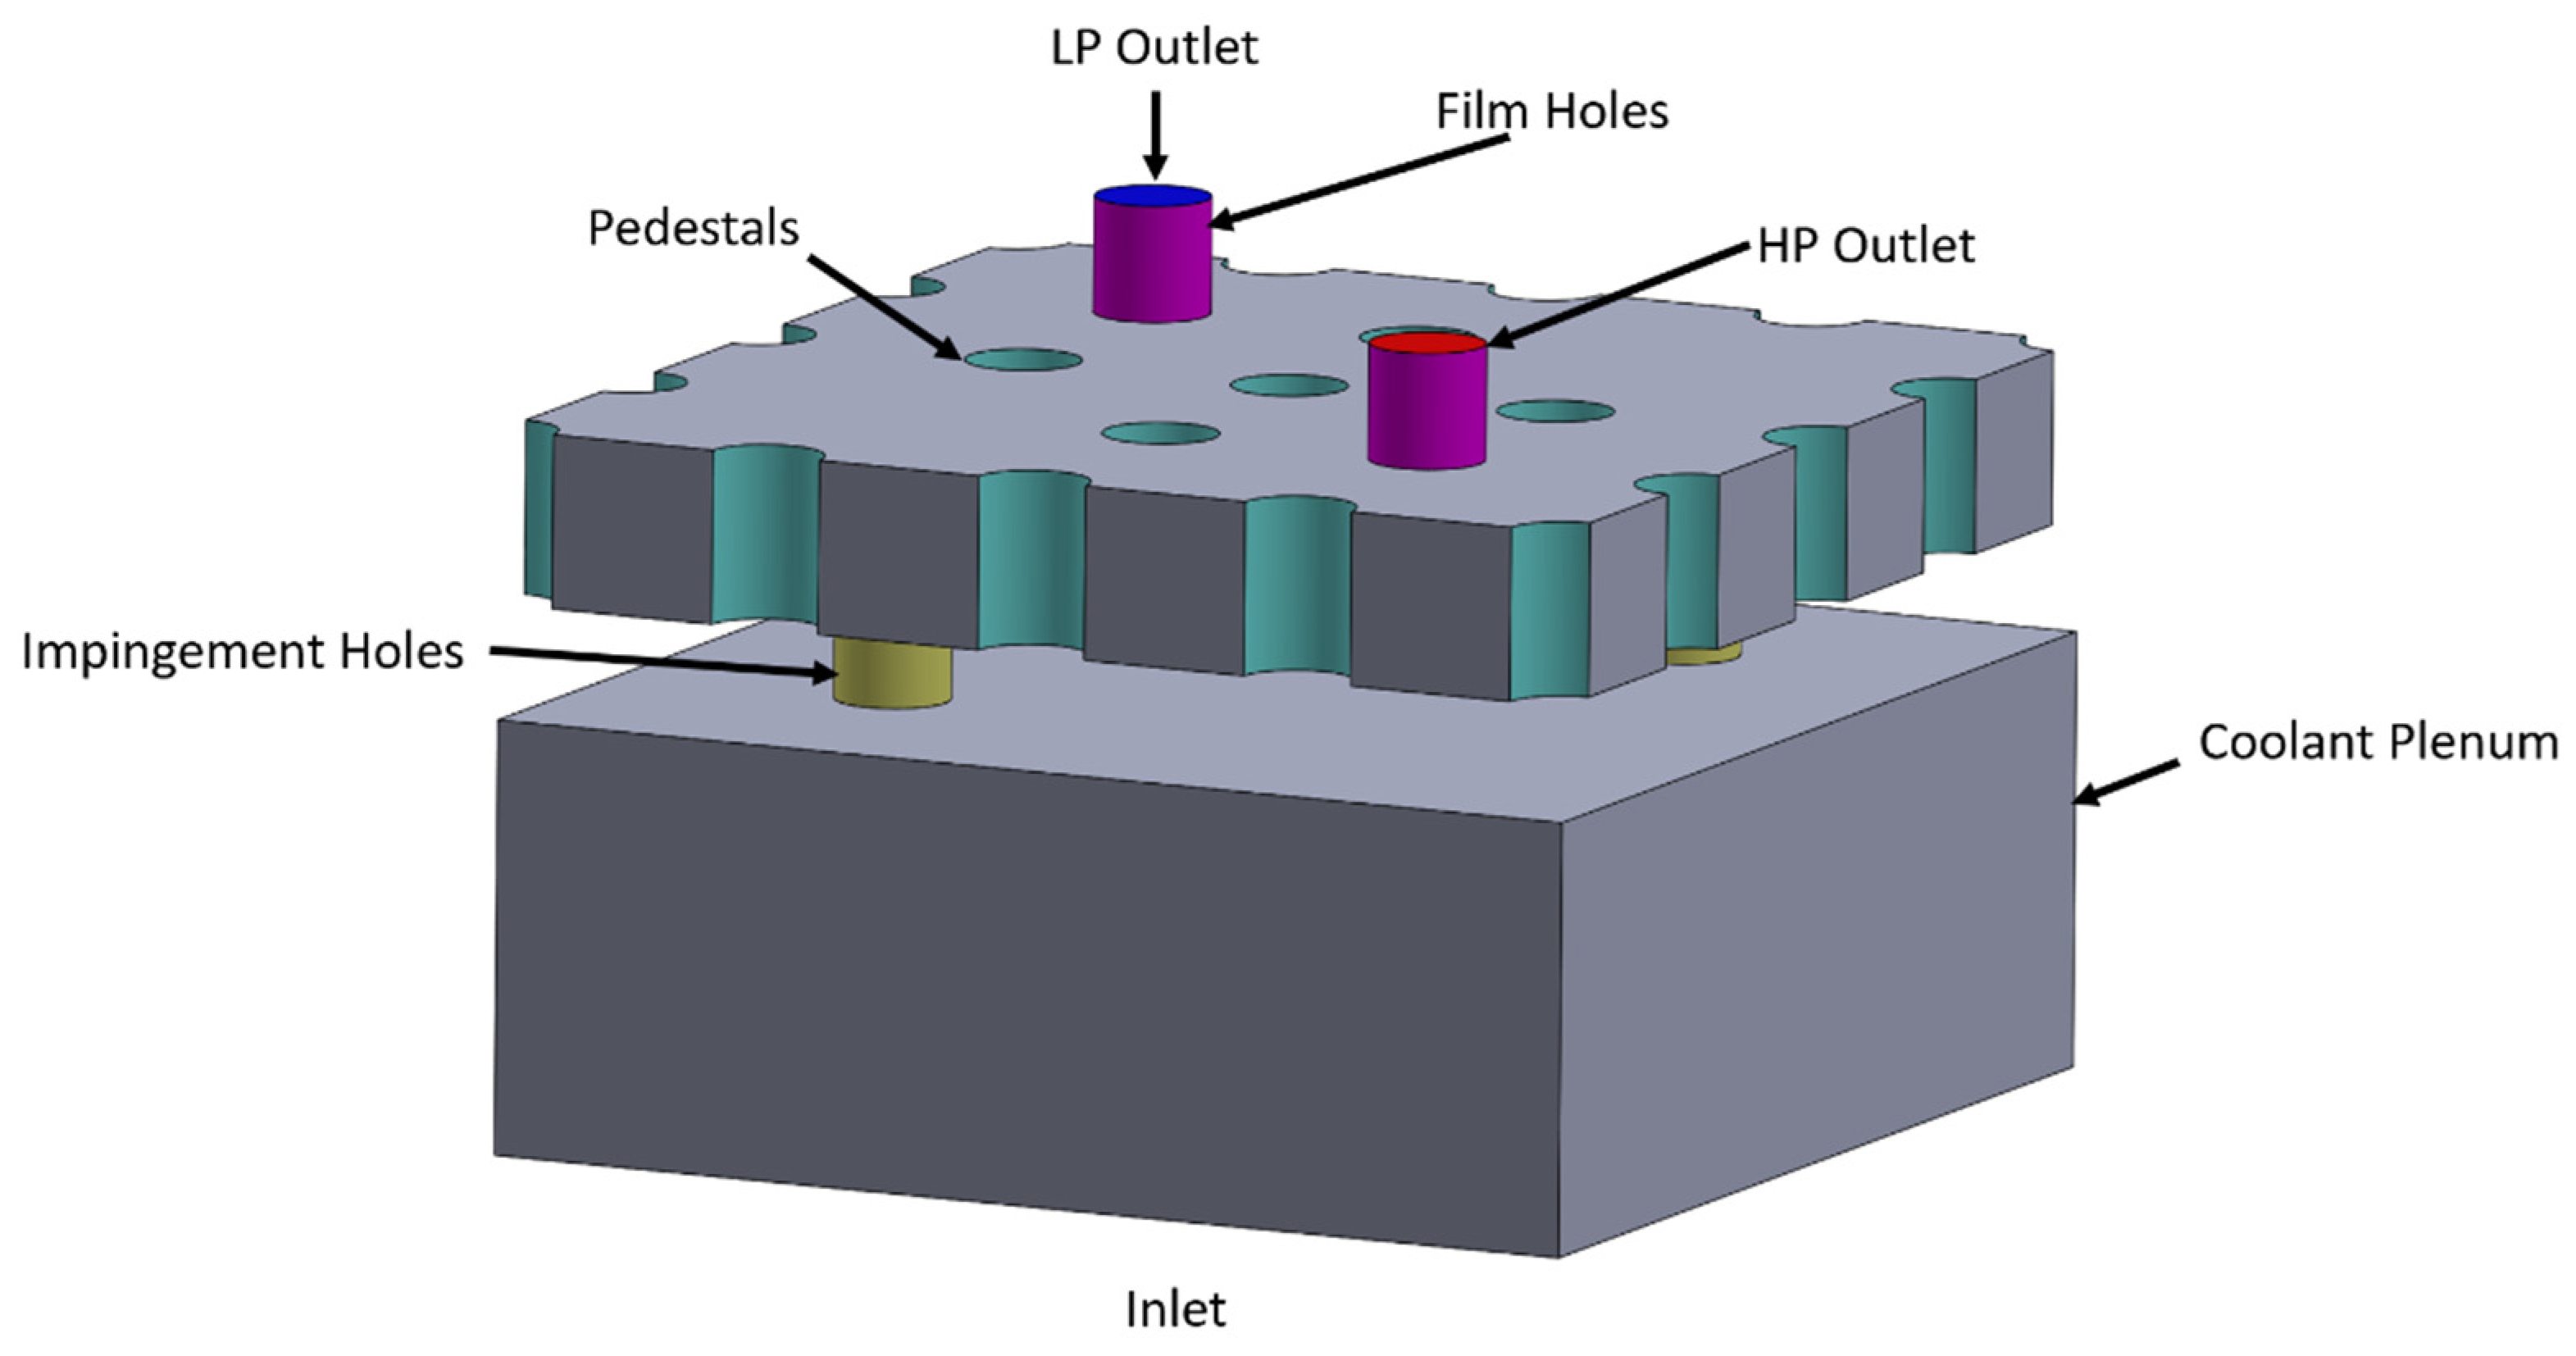
CFD simulations in ANSYS Fluent (Ansys—Canonsburg, PA, USA) were used alongside the development of the model for early tests of performance, and to produce some loss correlations where the literature was unable to provide. These tests were run largely in a ‘2 × 2’ test case size, featuring only two impingement holes, two film holes (inclined at 90°), and the pedestals that would feature in the flow paths between these positions. An example fluid domain for use in CFD is shown in Figure 4.
Based on previous studies, the realizable model was chosen for turbulence modelling. Fluid density was made to vary according to the ideal gas law, thermal conductivity by kinetic theory, and viscosity by the Sutherland model. Simulations were run such that all flow velocities were well below a Mach Number of 0.3, allowing results from the incompressible LOM solver to be compared. To ensure a y+ of close to unity on all surfaces, inflation prism layers were used along all walls. Each inflation had 15 layers and a growth rate of 1.2, with a maximum total thickness of 10% of the hole diameter used.
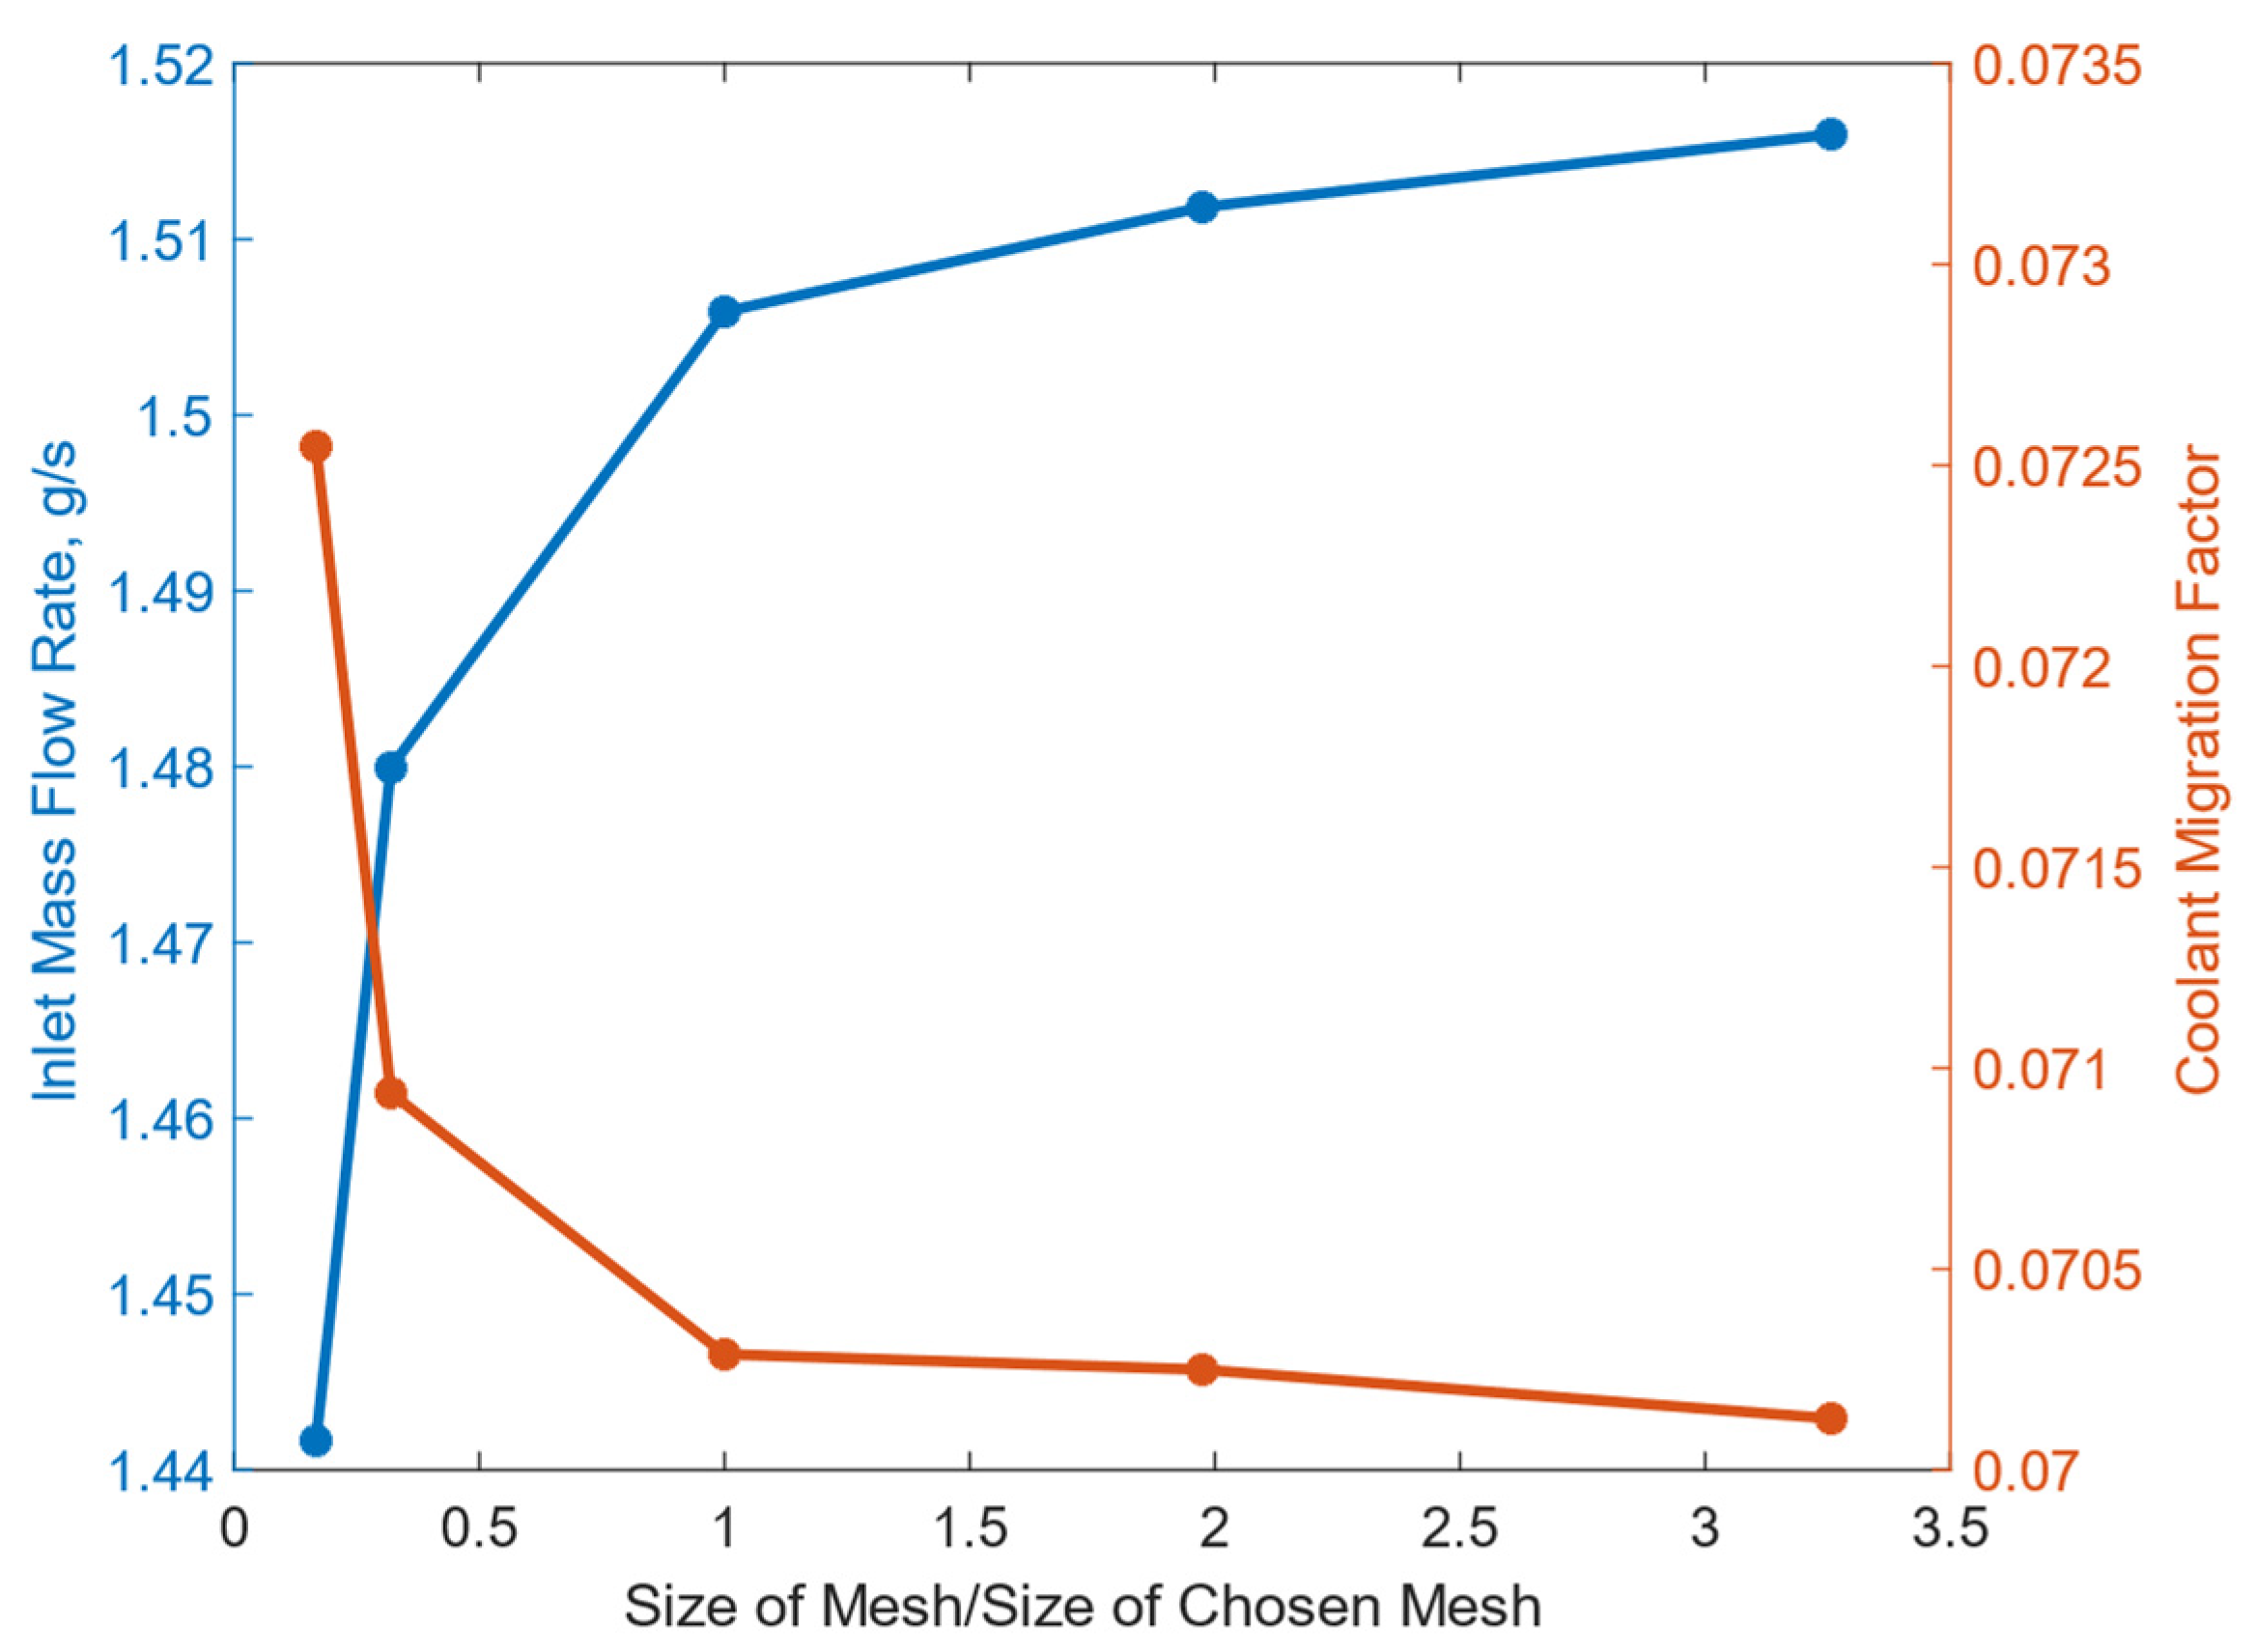
To ensure sufficient mesh refinement, a mesh independence study was performed. The two quantities used to judge mesh independence were the total mass flow through the system and the coolant migration factor (13), the derivation of which is discussed further in Section 6.2. For the study conducted, the inlet pressure was set at 1.03 bar, the HP Outlet at 1.0 bar, and the LP Outlet at 0.99 bar. The inlet temperature was 300 K, and all walls were set as adiabatic. Results of the mesh independence study are shown in Figure 5 giving a mesh size of approximately 3.5 million elements.
5. Experimental Methodology
5.1. Experimental Set-Up
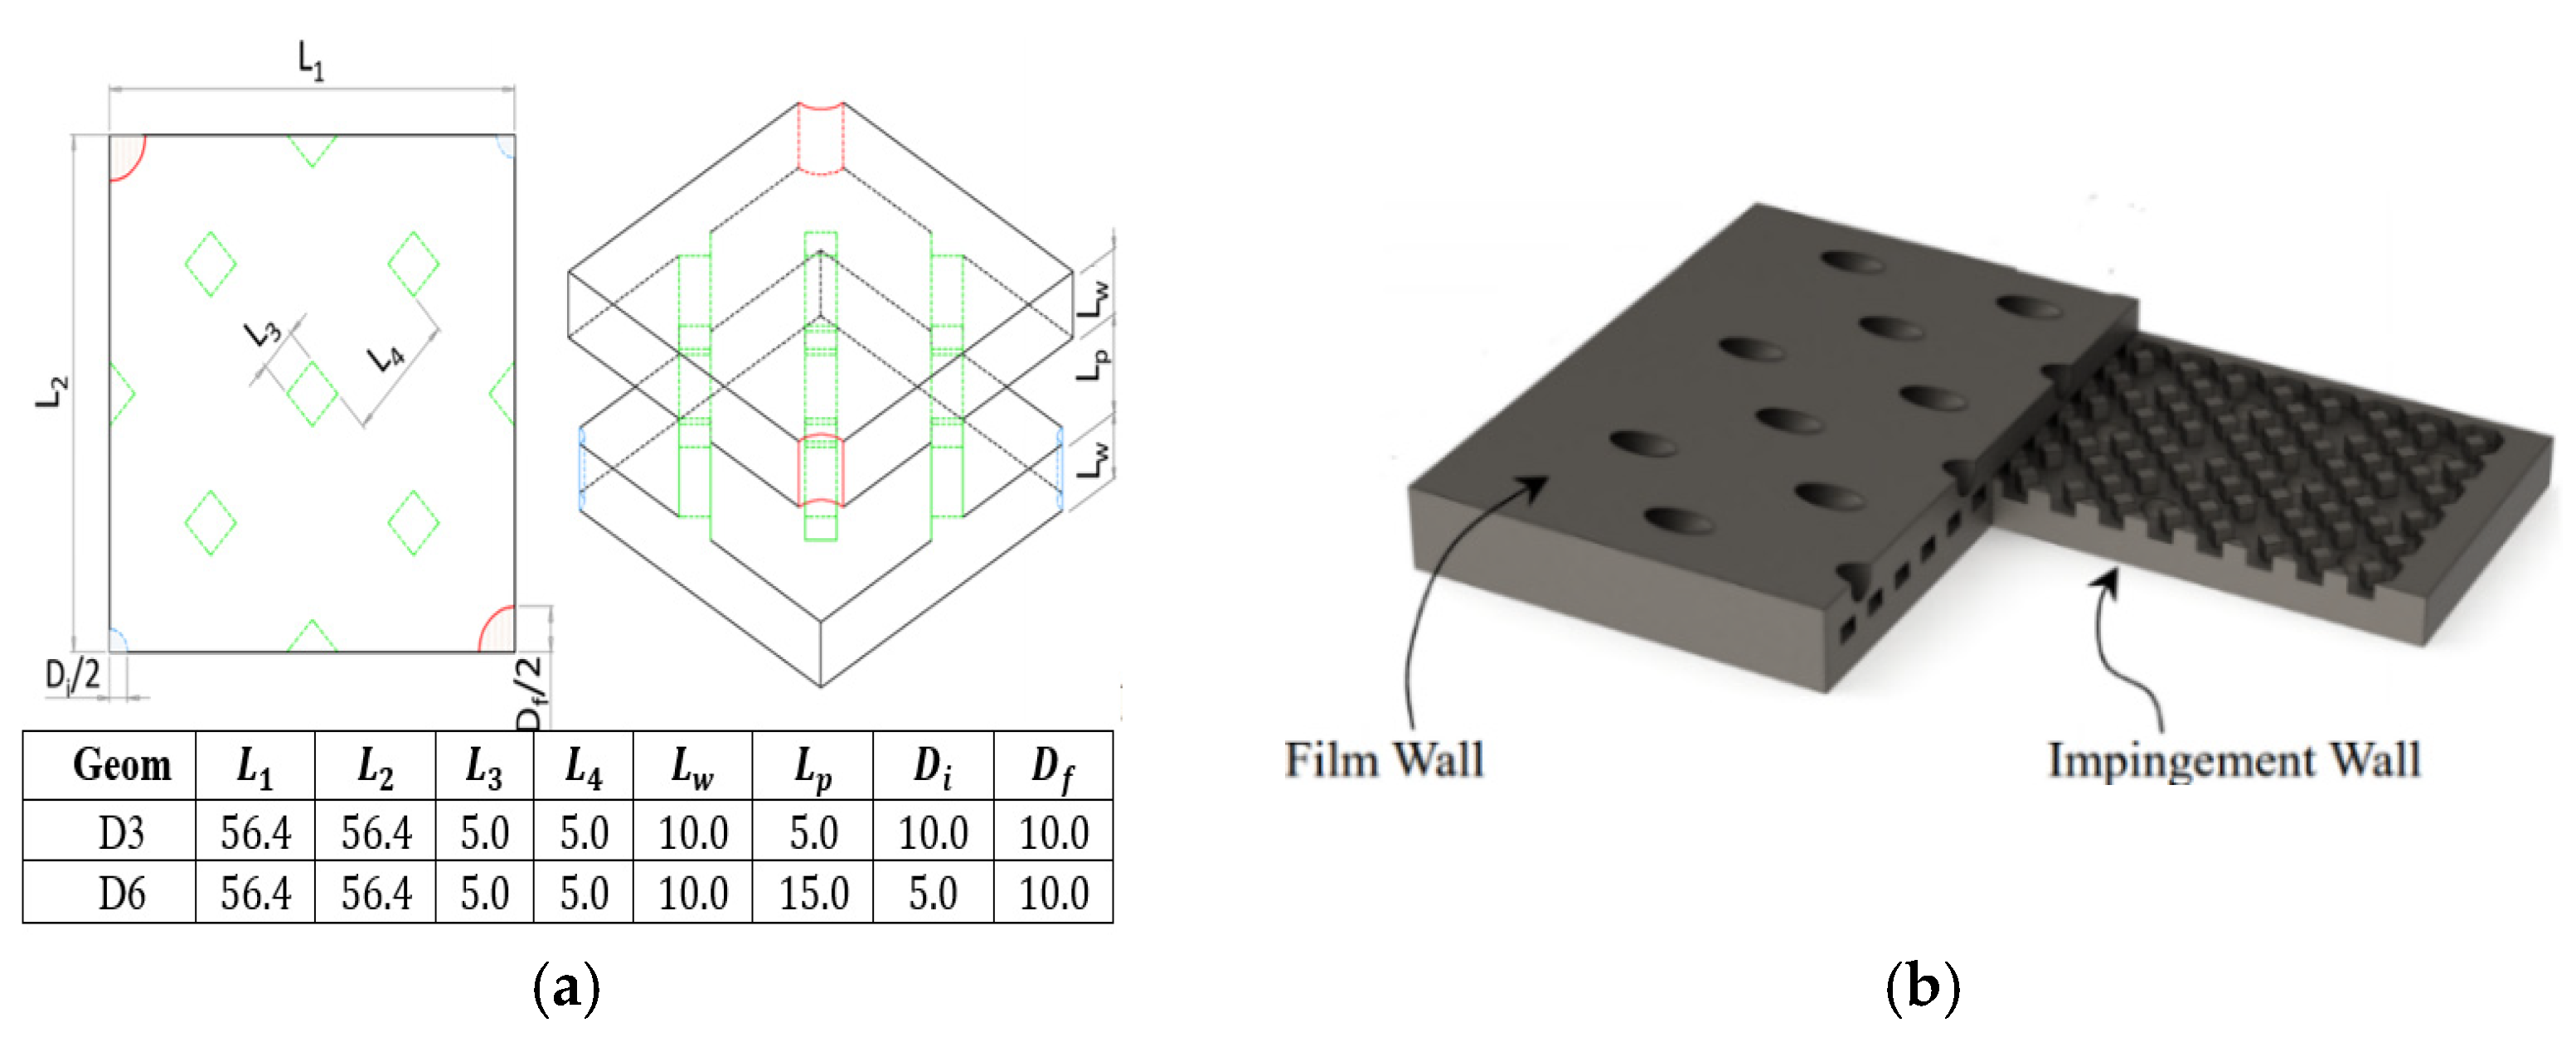
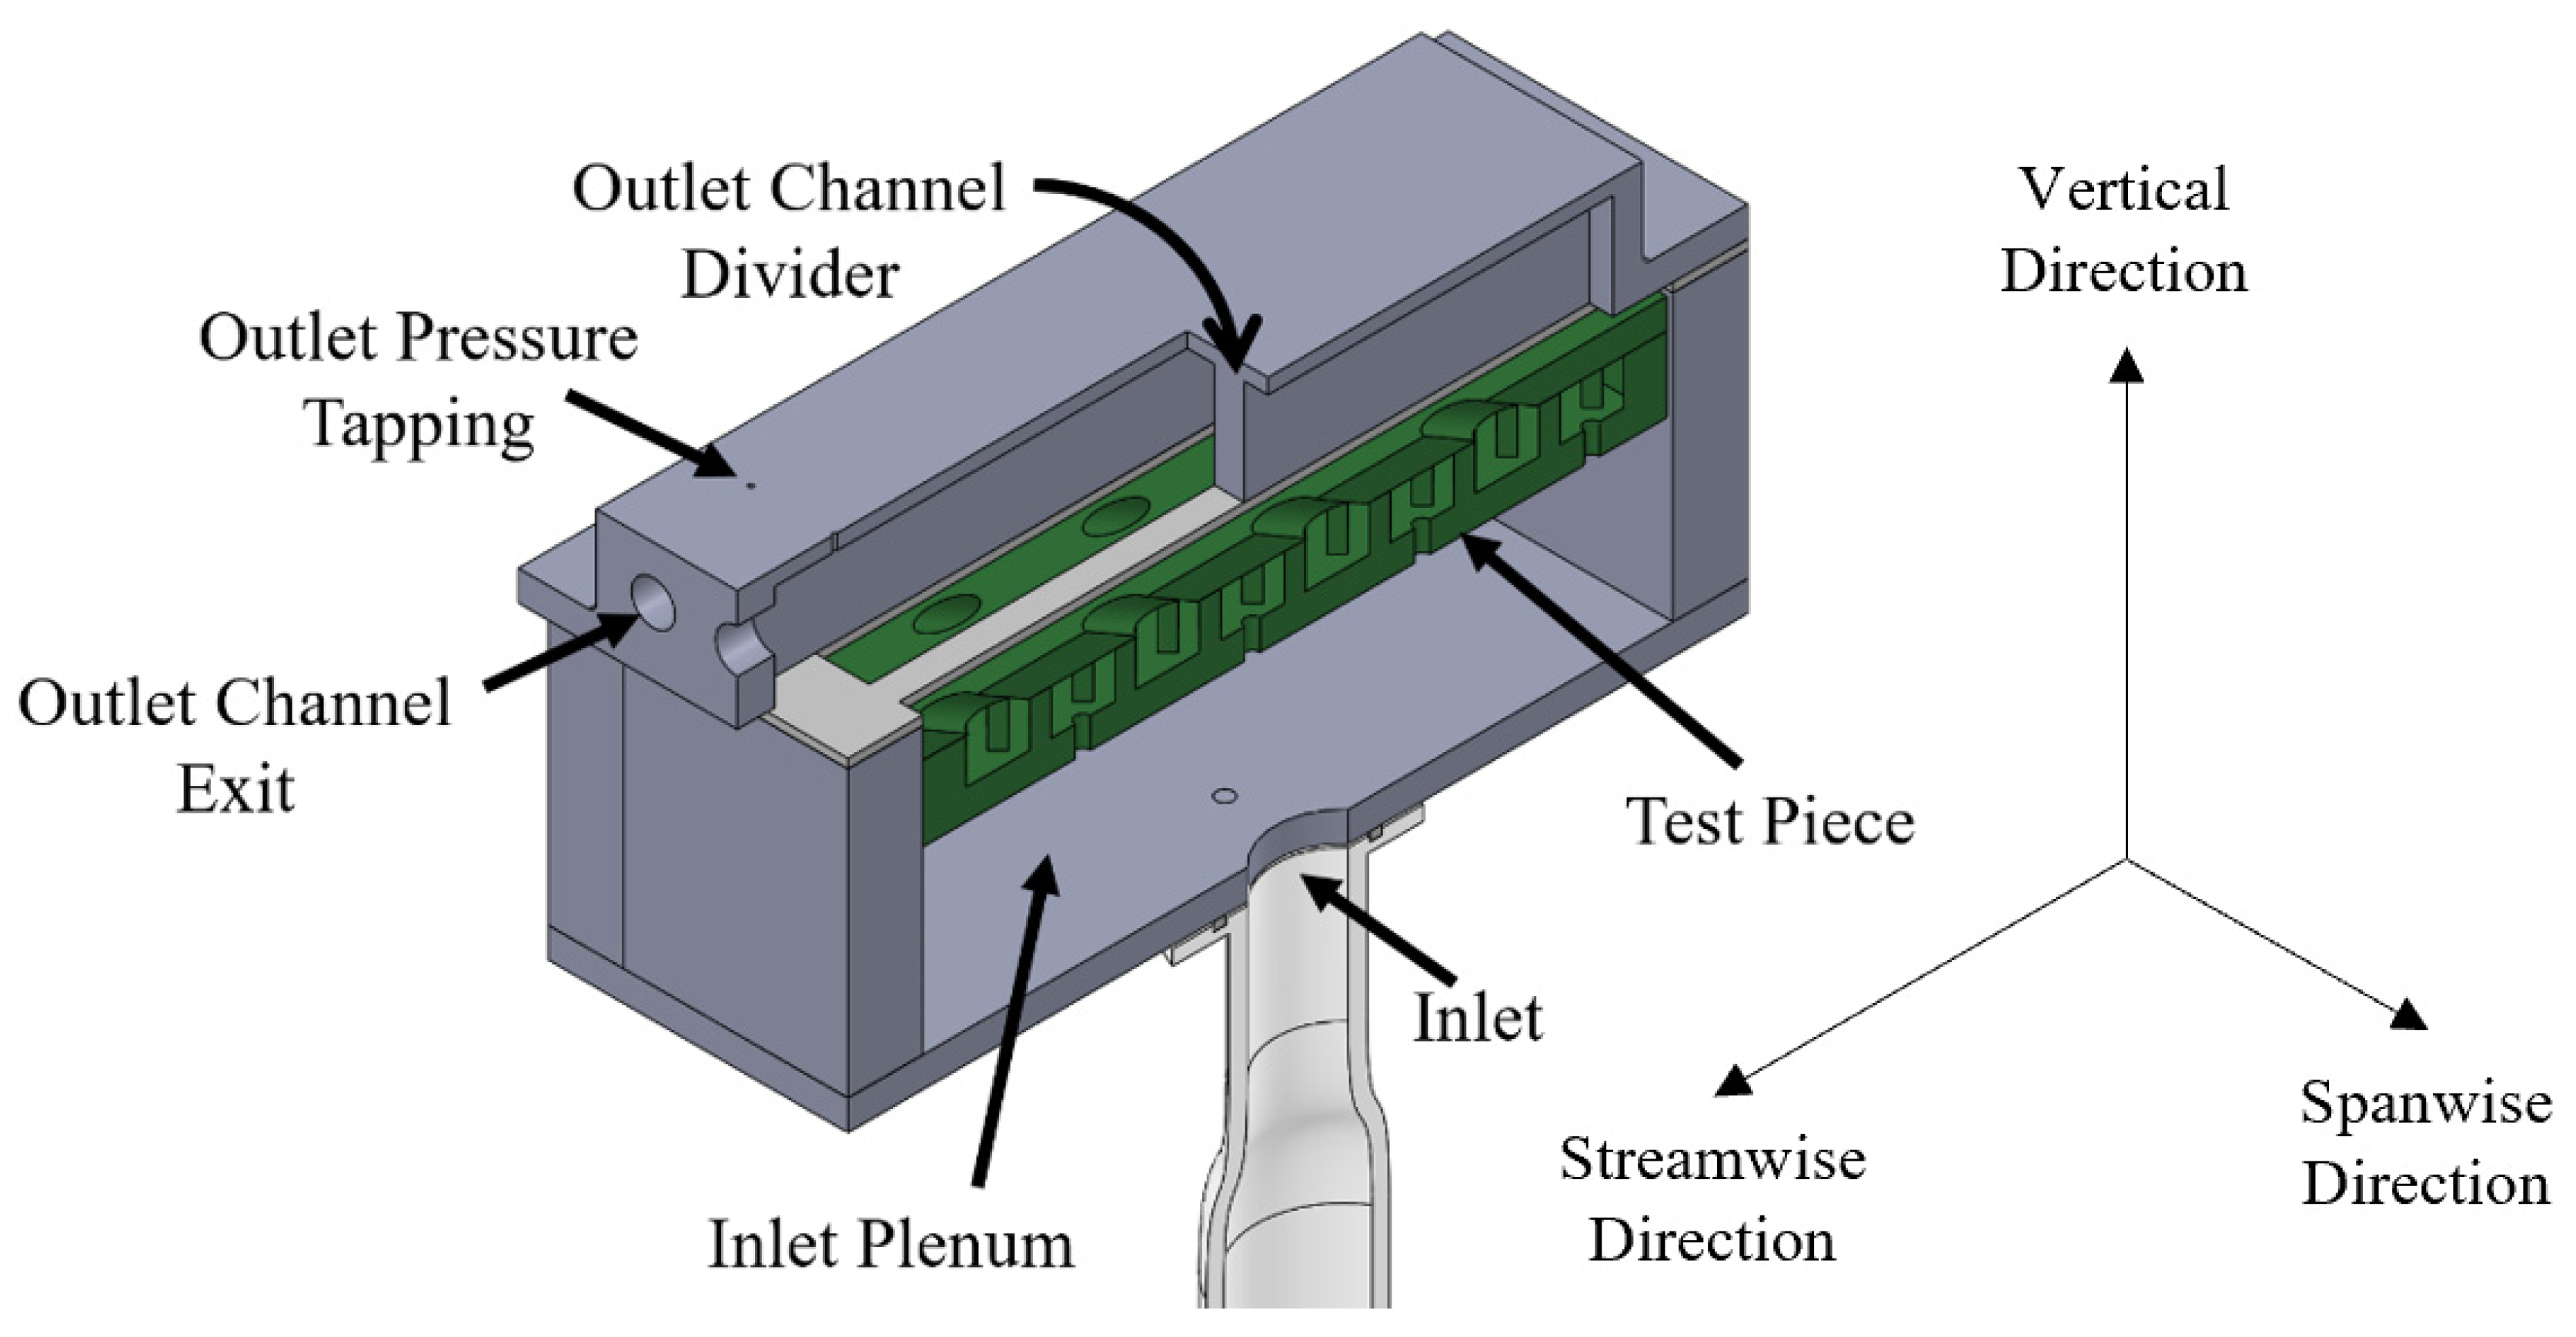
To validate the results of the LOM, a simple experimental rig consisting of a Bosch ALS 25 Blower/Vacuum [22], test piece, and six outlet pipes with orifice plates was constructed—this rig was named the ‘Blower Rig’. For these experiments, two test pieces were used, D3 and D6. A cut-out diagram of these is shown in Figure 6b. Figure 6a shows the diagram of a unit block of both test pieces—many of these combined to give a ‘wall block’ with six rows of holes, each with four impingement holes and four effusion holes in a staggered formation (a size of ‘8 × 6’). Total lengths were 248 mm in the streamwise direction and 178 mm in the spanwise direction (both including edge walls). A CAD diagram of the test section is shown in Figure 7. Flow from the blower enters the inlet plenum, contained behind the test piece, and is then forced through the test piece to one of six outlet channels, which are connected by hoses to pipes with orifice plates. Each outlet channel corresponds to one spanwise hole pitch and covers the whole streamwise extent of the test piece. At the entrance to said pipes, valves are used to restrict the flow, creating a spanwise pressure gradient. Mass flow rates from each channel are calculated using pressure measurements taken at either side of the orifice plates. Additional pressure tappings are located at the inlet and in the plenum, and at the end of each outlet channel. For this validation, the LOM was expanded to add links for flow leaving the film holes to collect at the channel exit—the point at the end of the channel serves as the new pressure boundary condition for the LOM.
5.2. Experimental Uncertainty Analysis
Pressure measurements were made using First Sensor HCE Series pressure transducers [23] and recorded using a PicoLog ADC-24 High Resolution Data Logger [24]. Measurements were recorded at 5 Hz for 30 s. In the tests conducted, uncertainties for each pressure reading peaked at approximately ±250 Pa. Mass flow values across each orifice plate, computed using the pressure drops across the orifice plates, had a maximum uncertainty of ±0.48 g/s and a minimum of ±0.45 g/s, giving an uncertainty on the total mass flow rate of up to ±1.2 g/s. Test cases where the relative uncertainty of any individual mass flow was over 25% were not used for LOM comparison.
6. Results and Discussion
6.1. Experimental Validation
The blower rig was run for many separate tests, between which the valve positions for each channel were varied to produce a new outlet pressure distribution. The pressure readings recorded from each test were averaged and used as the input boundary conditions to the LOM. Figure 8 compares the total inlet mass flow for each test case, for both experiments and the LOM. Within the range of cases investigated, the results were in good agreement, with a maximum deviation of 10.9% from the experiment results. Agreement for D6 results was hampered by some manufacturing damage that affected film hole size and quality.
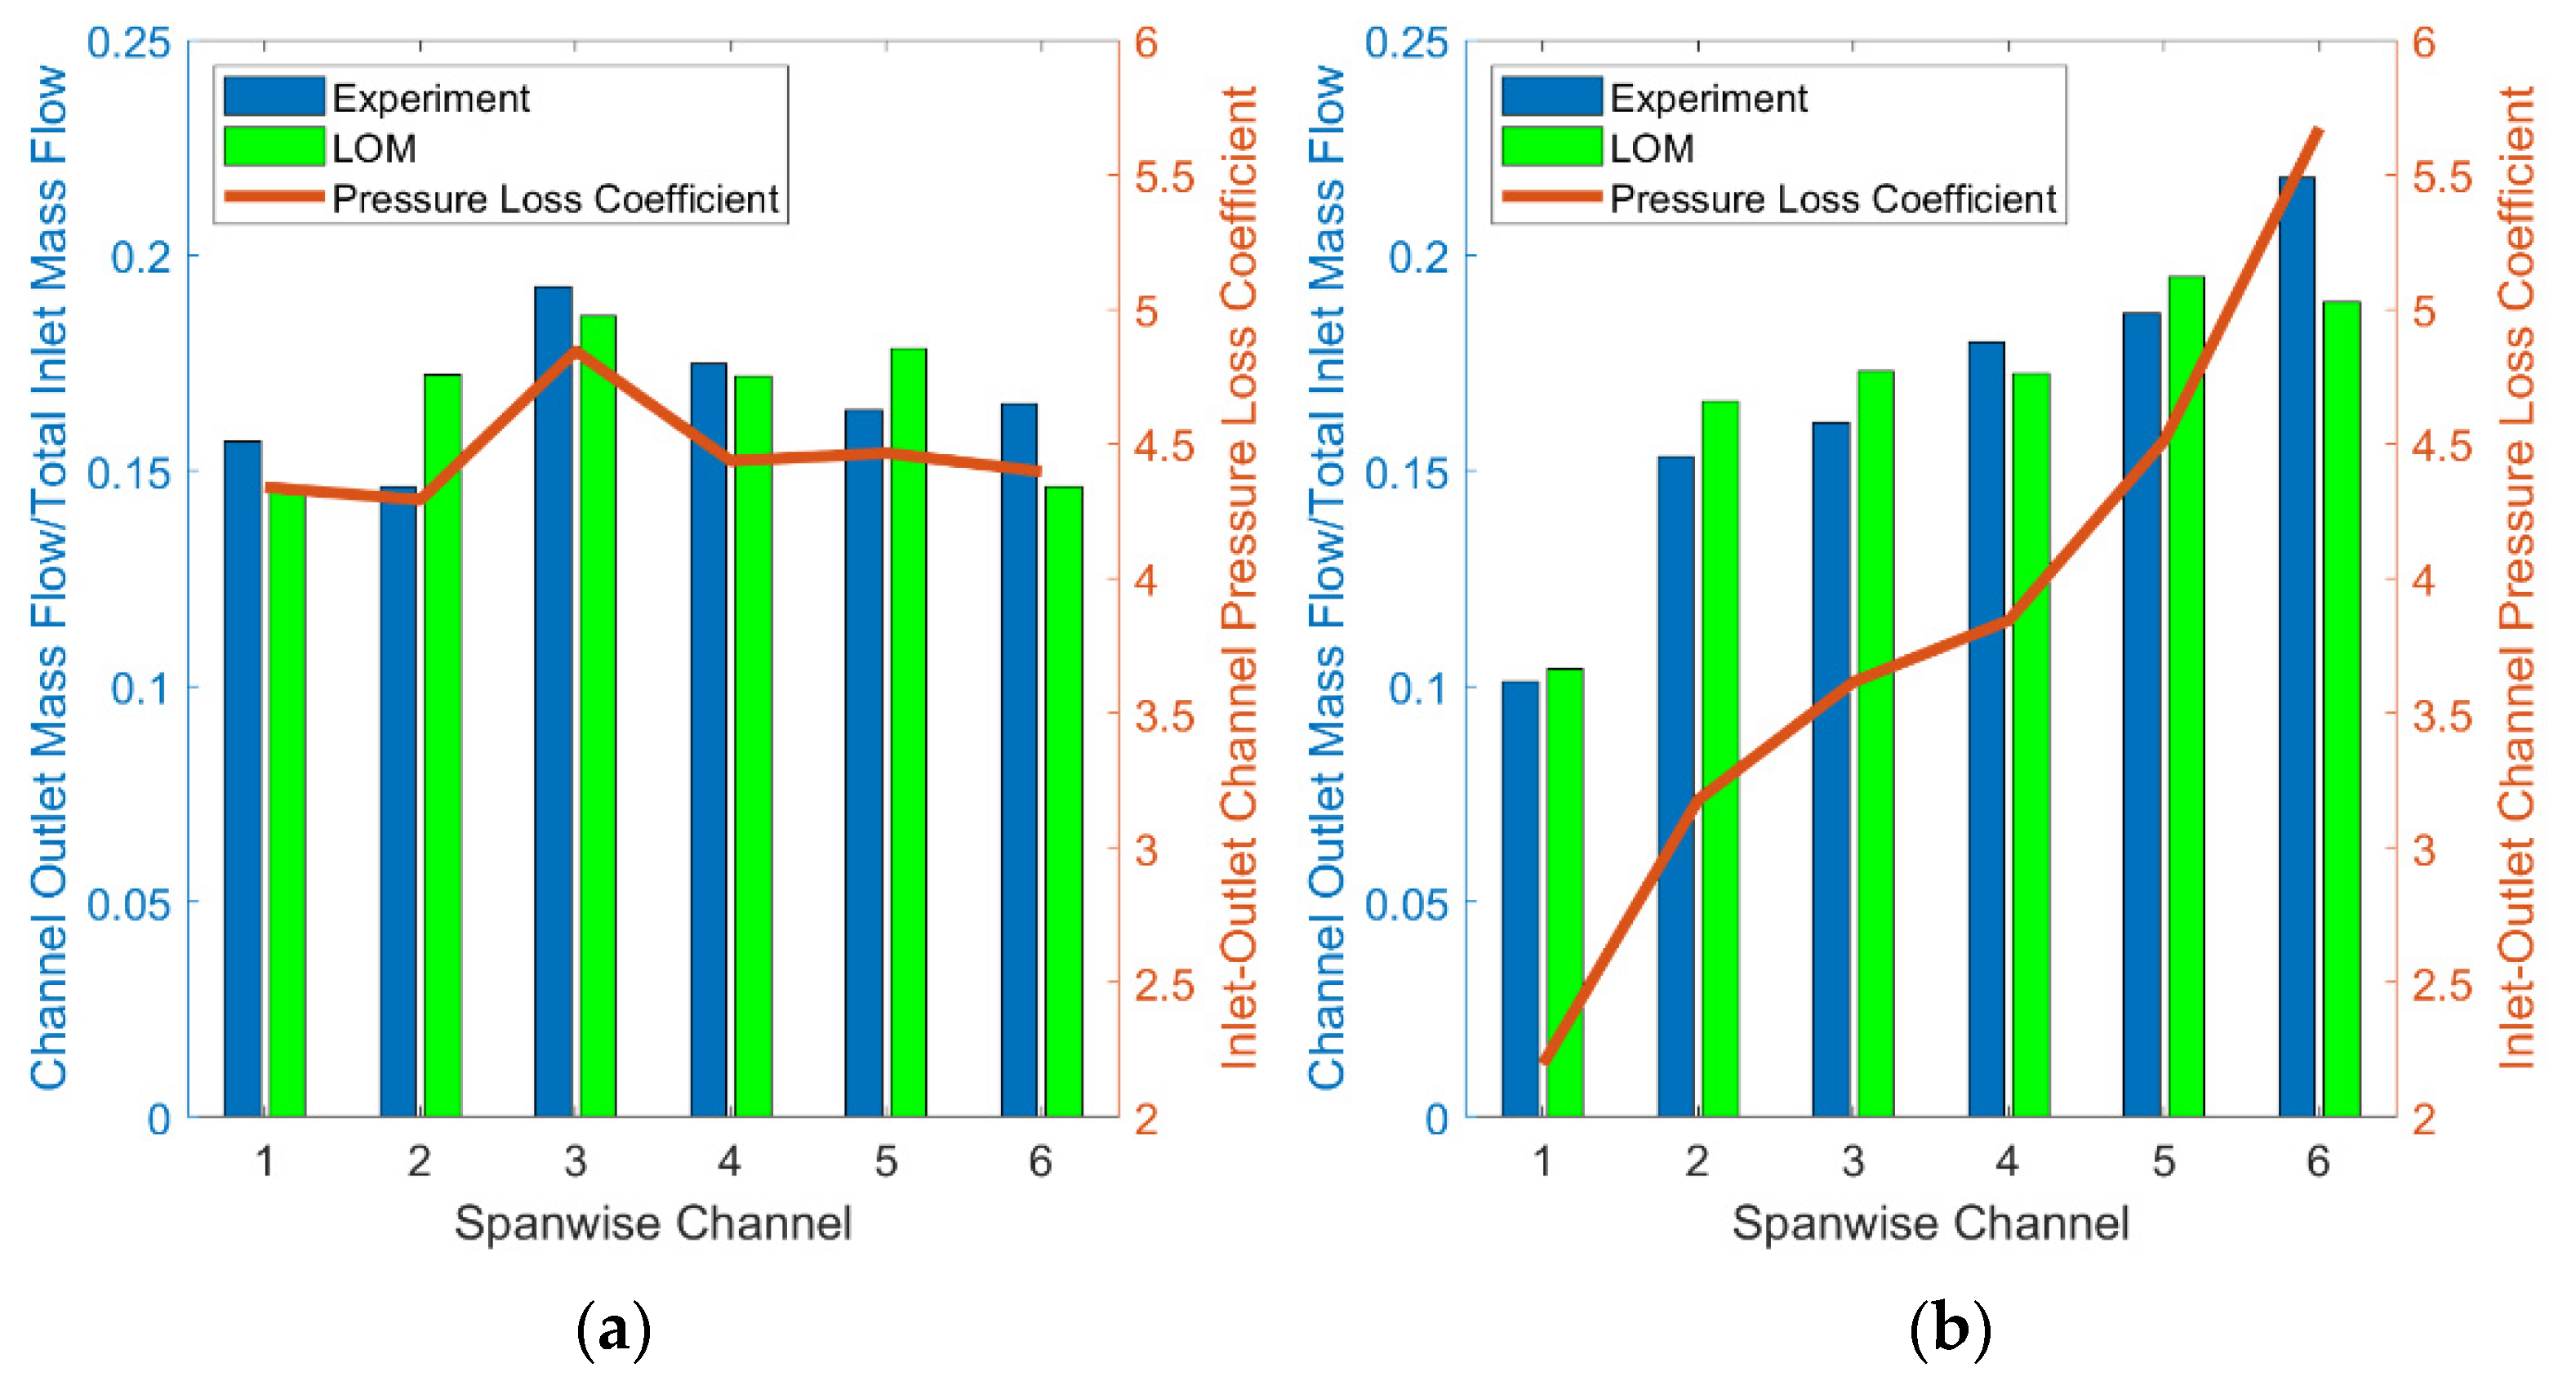
Figure 9 shows how experimental results from two individual D3 test cases compared with those produced by the LOM. The pressure distribution is assessed using the Inlet-Outlet Channel Pressure Loss Coefficient (14) —the pressure loss from inlet to channel outlet, normalized by the dynamic head of the total experimental mass flow passing through the total impingement hole area. The outlet mass flow in each case is assessed as a proportion of that method’s total mass flow. Across the range of test cases conducted, individual channel outlet flow shares of the LOM generally fell within 20% of experimental results, rising only in extreme cases. The high spanwise pressure gradient imposed in the test case of Figure 9b clearly leads to a more uneven outlet mass flow distribution, as row 1 receives ~10% of the total inlet mass flow, whilst rows 5 and 6 receive close to 20% each—in the near-uniform outlet pressure case of Figure 9a the flow distribution is more even.
6.2. Effects of Geometric Parameters
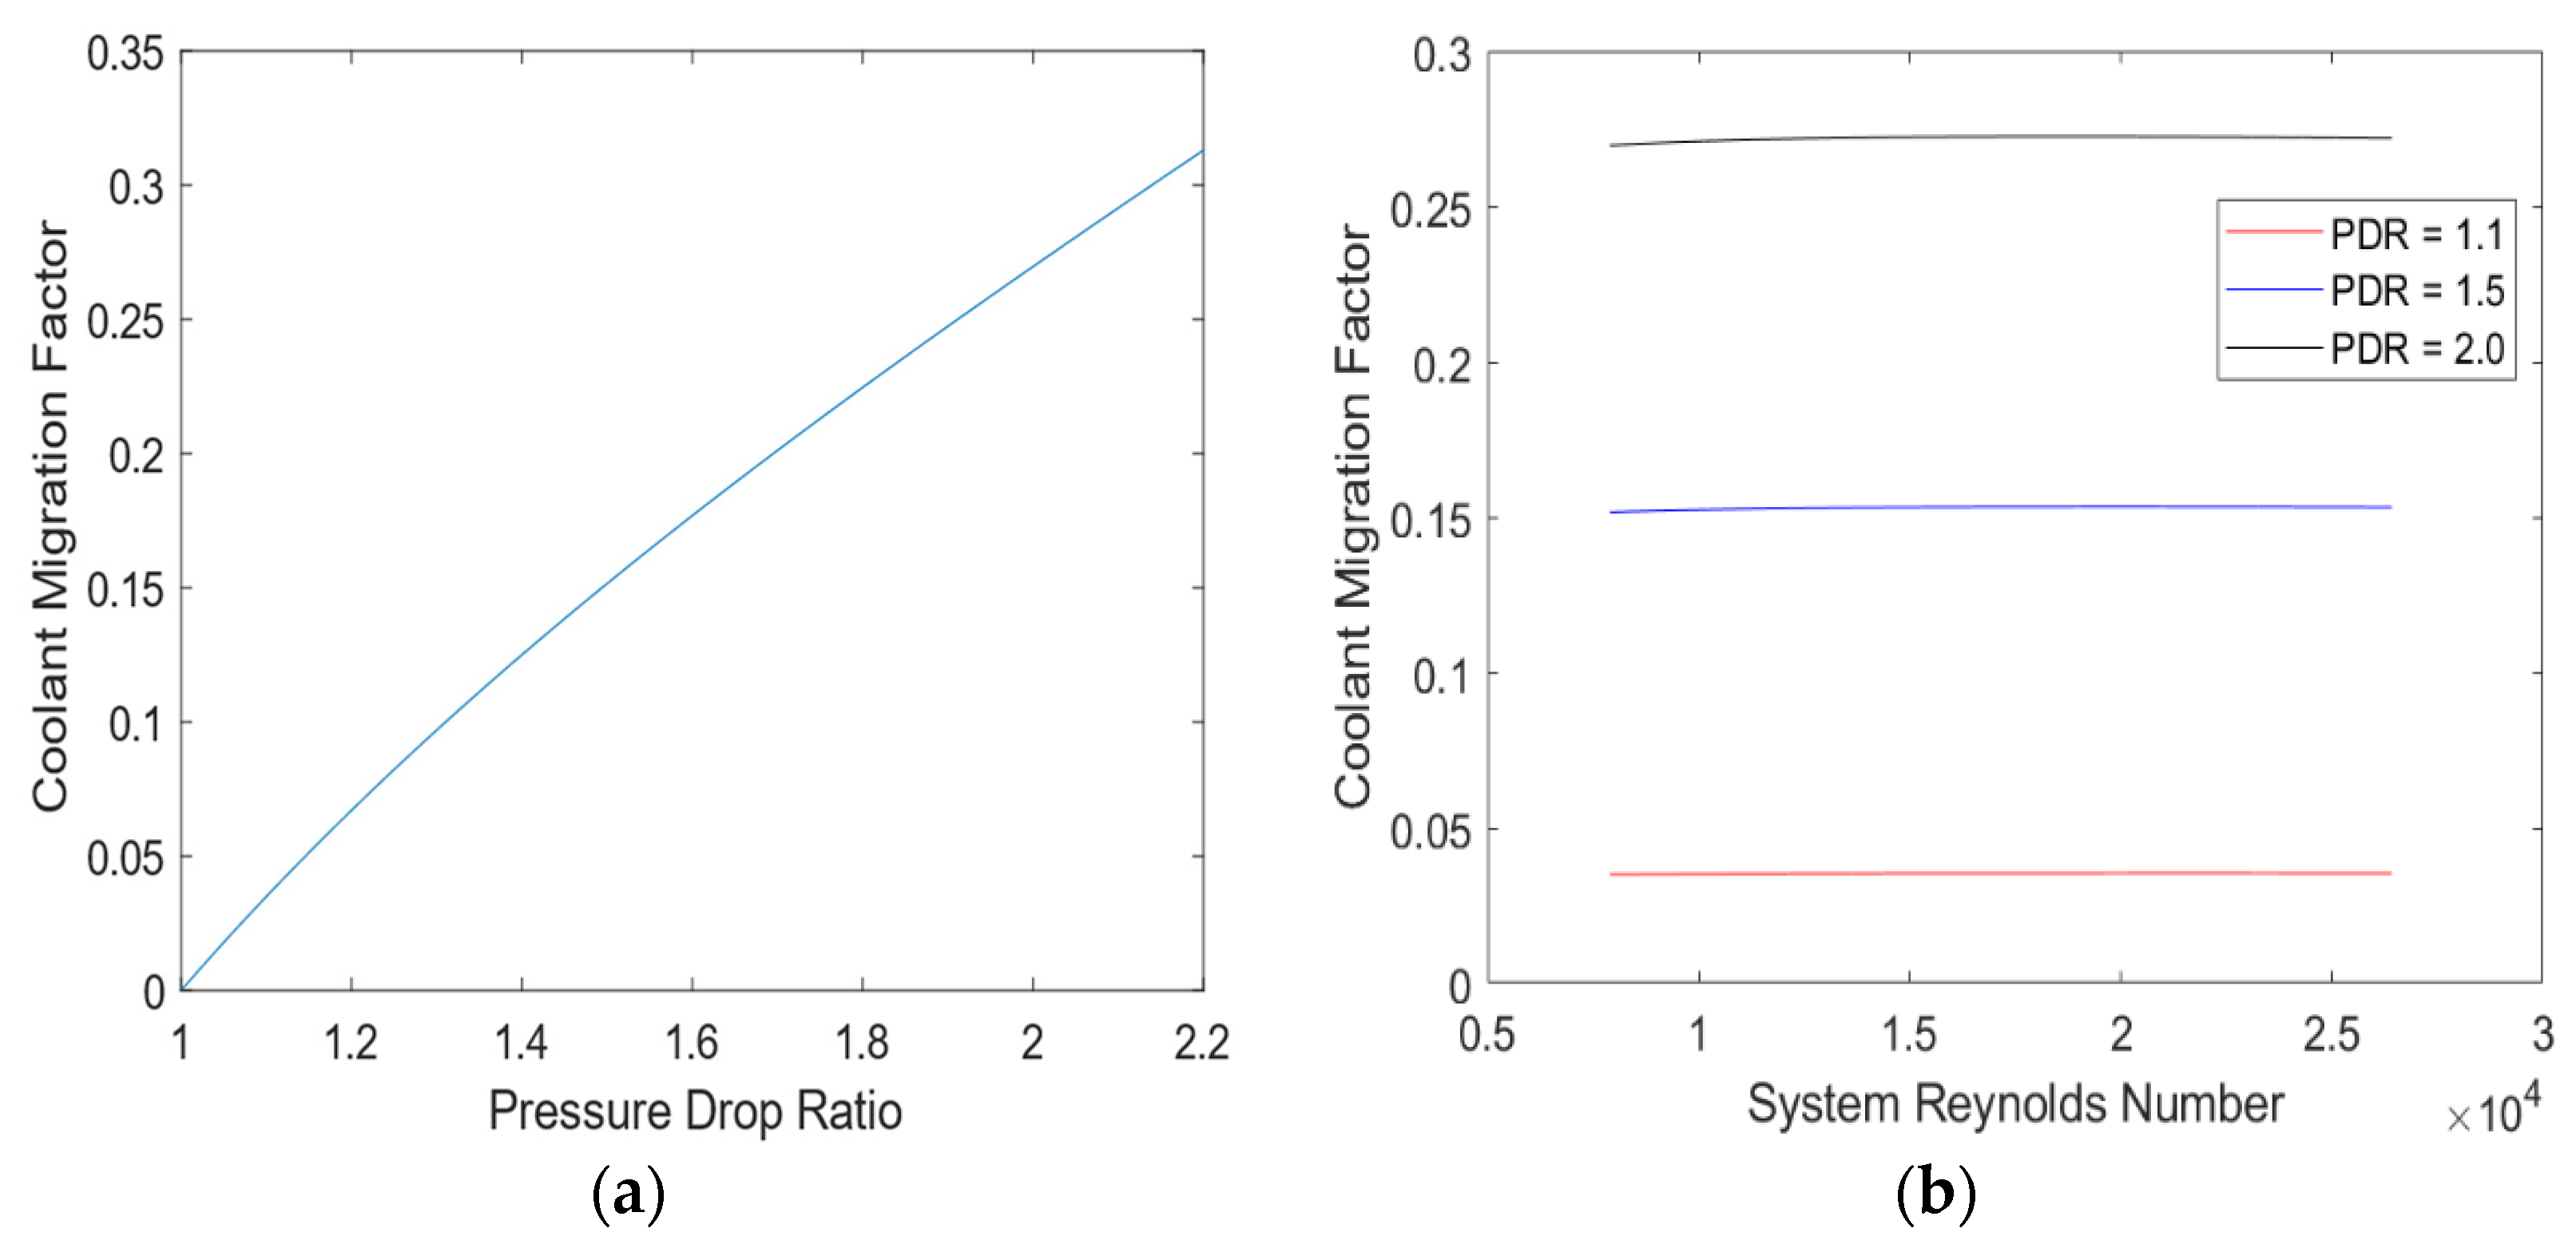
Following validation of the LOM using the blower rig, it was used to analyse the effect of selected geometric parameters on coolant migration. To simplify analysis, the investigated domain was reduced to a ‘2 × 2’ size, as used for CFD simulations in Section 4. In such a set-up, the proportion of total coolant that migrates, , ( being the difference between the two outlet mass flows) is a function only of the pressure drops from the coolant supply (inlet pressure ) to the two outlets with exit pressures and , the density, the viscosity, and the length scales , , , , and . In non-dimensional terms, the Coolant Migration Factor is a function of the Pressure Drop Ratio , the system Reynolds number (15), and the ratio of the impingement hole diameter to the other geometric parameters (, , and ).
To give context to these parameters, the serves as a measure of how much flow is being ‘stolen’ from one film hole by the other. A value of 0 means that the outlet flow distribution is uniform. Any value between 0 and 0.5 means that some migration is occurring, with a value of 0.5 indicating that the low pressure film hole is the outlet for all coolant in the system. If the > 0.5, the High Pressure film hole is ingesting mainstream flow. The quantifies the external pressure gradient relative to the coolant supply—a of unity means the external pressure gradient is flat.
Multiple series of simulations with the model were run to determine each geometric factor’s effect on the relationship, which sets the level of coolant migration across a range of operating conditions. In a 2 × 2 set-up where all features maintain constant size (i.e., film holes are of the same diameter, etc.), a pressure drop ratio of 1 causes no coolant migration. As the grows, coolant migration increases, as shown in Figure 10a. This was found to be repeatable if all geometric ratios were kept constant, as the system Reynolds number was found to have a minimal effect—this is shown in Figure 10b, where the proportion of migrating coolant hardly changes for wide ranges of .
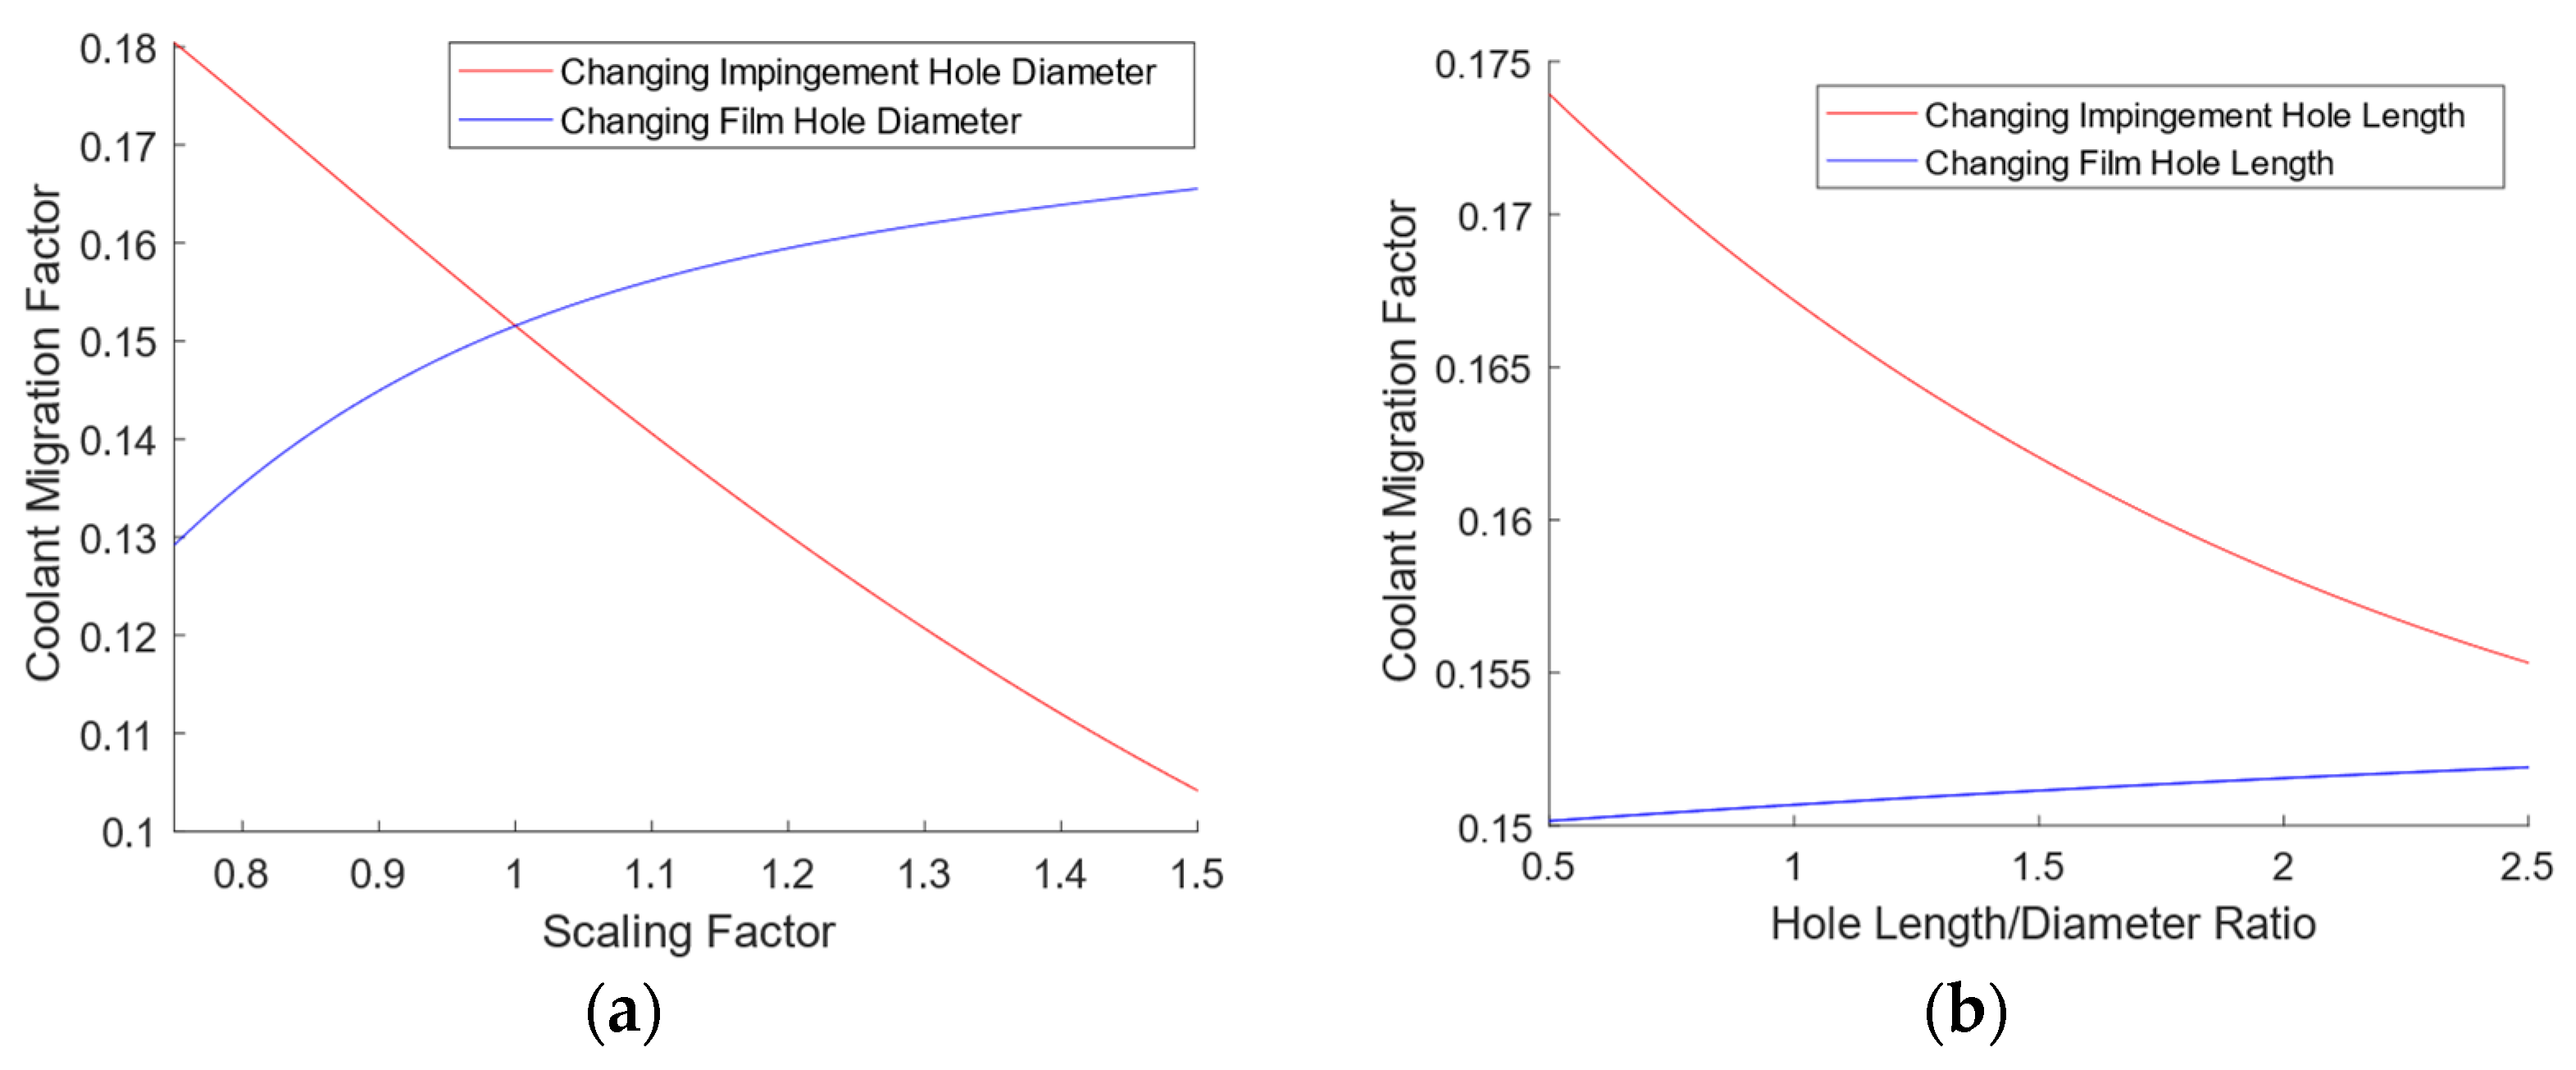
Figure 11a shows the effects of scaling the impingement hole and film hole diameters independently. Scaling each hole diameter has opposite effects—increasing the impingement hole diameter reduces the proportion of coolant migrating, whereas increasing the film hole diameter leads to greater migration. These effects are a product of how the pressure losses through each skin affect the average pressure in the internal cavity. As noted in the related work [10], the impingement process dominates pressure losses in double-wall effusion cooling systems, so even in cases with high external pressure gradients, the impingement hole mass flows remain close to equal and the flow expanding from impingement points is largely at the same pressure. Only after the impingement process does the external pressure gradient influence the flow distribution, unless the array features a variation in pedestal row constrictions, such as in Figure 3. Increasing the impingement hole diameter reduces the pressure drop across the inner skin, creating a larger pressure margin across all film hole positions. The pressure drop ratio across the outer skin is thus reduced, limiting coolant migration. In contrast, increasing the film hole diameter reduces pressure drops across the outer skin and shifts more pressure loss to the impingement process, increasing the pressure drop ratio across the outer skin and increasing coolant migration. This implies that a low porosity outer skin is much less vulnerable to coolant migration than a high porosity one, though coolant migration effects must be considered alongside the likely reduction of film cooling effectiveness caused by reduced outer skin porosity. If the external pressure distribution is known, it can be beneficial to reduce the diameter of film holes in low pressure regions whilst maintaining high hole diameters in high pressure ones—holes at the SS would have a greater pressure drop per unit mass, compensating for the imbalance in outer skin pressure drop ratio and limiting coolant migration.
The effect of scaling the hole lengths is shown in Figure 11b. In the range investigated, increasing the length of the impingement hole reduced coolant migration, whereas increasing the length of film holes increased it. Changing the length of each hole alters its discharge coefficient—for a length/diameter ratio below 2, increases with the hole length as a longer hole length allows secondary flows to be suppressed. begins to decrease as the length to diameter ratio exceeds 2.5 due to excess friction. Therefore, in the range investigated, discharge coefficients are increasing, leading to similar trends as those seen for scaling the hole diameters. A high reduces pressure losses due to impingement and reduces the pressure drop ratio across the outer skin, and a high has the opposite effect. As significant heat transfer takes place on the internal surfaces of the holes, cooling performance would need to be considered alongside migration in optimising the wall thicknesses for overall cooling performance.
In the context of an engine vane, multiple s would need to be considered when investigating any given hole position. Positions partway along the chord would both gain coolant from higher pressure positions and lose coolant to lower pressure ones.
Figure 12 shows the effect of changing the pedestal width on the coolant migration. As the pedestal width to impingement hole diameter ratio goes to two, the available flow area goes to zero. In this region, the flow velocity through the pedestal array is high, leading to high pressure losses in the region—this has a similar effect to reducing the film hole diameter, as less of the system pressure losses occur in the impingement process, leading to a higher pressure margin across the outer skin and less coolant migration. When the pedestal width is less than 1.5 times the impingement hole diameter, the effect of the pedestal width on coolant migration is much weaker, as pressure losses are distinctly less than those occurring through either set of holes.
6.3. Full-Vane Analysis
In order to demonstrate the issue of coolant migration within a double-wall effusion cooled nozzle guide vane, the LOM was adapted to fit a modern engine NGV, using flow properties found experimentally by Holgate et al. [4]. A network diagram of this application is shown in Figure 13. Due to the very high pressure gradient around the early Suction Surface, the LOM was unable to resolve the internal flow-field for a continuous cavity, so results shown are for a test case where the LE’s internal cavity has been separated from both the PS and SS. This shows a series of zero mass flows through the pedestal array. In this configuration, the maximum film hole coolant flows are observed at the early SS, whilst film holes around the LE produce little flow due to the much lower overall pressure margin for that section. In order to achieve a more even outlet coolant flow around the vane, it would be necessary to increase hole sizes at the LE to allow more flow through, or to reduce hole sizes around the SS to restrict coolant flow. This presents a significant advantage of the LOM, which can be used to rapidly assess the effects of many minor design changes in an attempt to optimize the outlet flow distribution.
CFD was used to review the effect of walls across the span on the outlet mass flow distribution, the results of which are shown in Figure 14. This figure compares the average outlet mass flow per row of holes, normalized by the value seen at the stagnation line, for three different set-ups; a continuous cavity (no walls), separated sections (LE, PS and SS separate, as in Figure 13 and completely separated (walls between every row of holes). It is immediately clear from these results that without walls through the cavity, there is massive migration of coolant to the early suction surface, resulting in a significant imbalance in the outlet coolant distribution. In this particular case, the use of walls across the span is imperative to maintaining any sort of adequate film cooling at the LE.
Even in the cases where the LE, PS and SS were separated from one another, the average per-hole coolant outlet mass flows were significantly greater for the SS than for other sections. To demonstrate potential methods of evening the outlet flow distribution, the LOM was used to scale up the diameters of film holes around the PS and LE, whilst scaling down the diameters of all film holes on the SS by the same proportion. Results of these tests are shown in Figure 15, which indicates that the hole diameters would need to be scaled by around 80% if the designer were pursuing a more uniform outlet flow. This scaling gives a maximum deviation in the per-hole average coolant mass flow of 19% from the stagnation row value, compared to 118% when no scaling is used. In an engine case, greater heat loads around the SS would lead to a greater demand for film cooling there, but maintaining adequate film cooling to the LE presents more of a challenge.
6.4. Future Work
Future work will address the effect of heat transfer on coolant migration, combining the Flow Network Model with a Low Order Thermal Network through the solid based on that developed by Murray et al. [25]. Given the high rise in coolant temperature as it passes through an engine vane’s double-wall cooling system, it is expected that coolant migration would be affected by heat transfer. Significant increases in the coolant temperature in the cavity would lead a reduction in the density of the coolant. A lower density would produce smaller outlet mass flows for the same pressure drops, leading to a reduction in the coolant migration factor. As noted previously, geometric changes made to combat coolant migration will have knock-on effects on the cooling performance of the geometry—it is important for these concerns to be considered alongside one another, as either could lead to catastrophic failure of the engine component.
7. Conclusions
A low order flow network model was created to assess mass flow and pressure distributions through double-wall effusion cooling systems. The LOM has been developed to use empirical loss coefficients and discharge coefficient correlations to solve mass flows in and out of nodes in a network, solving for the pressures at internal nodes within the cooling system. This allows assessment of the vulnerability of a cooling scheme’s geometry to coolant migration under the influence of an external static pressure gradient. Reducing the coolant migration from high to low pressure regions is key to preventing localized areas of poor external film cooling effectiveness. The results of the LOM were validated using the Blower Rig, whereby a blower forced flow through a Double-Wall Effusion Cooling test piece, through which the flow was divided into six outlet channels and mass flows were measured independently. This allowed evaluation of the effect of an imposed spanwise pressure gradient on the outlet flow distribution. Results compared favourably with those of the LOM.
The LOM performed a series of scaling simulations to show the effect of different geometric parameters on coolant migration. These tests showed that the effective method in reducing the Coolant Migration Factor was to minimise the Pressure Drop Ratio across the outer wall. This was done by reducing the share of the overall pressure losses caused by impingement—the geometric changes that caused this included increasing the diameter and length of the impingement holes, and reducing the diameter and length of the film holes. Large pedestal diameters, and thus low-inter pedestal spacing, produced the same results as small film hole diameters, but only at very high values.
It has been suggested that a non-uniform distribution of hole diameters could be used to compensate for the effects of high external static pressure gradients on coolant migration. This was tested for a full vane example, where increasing the diameters of holes at the LE and SS whilst reducing those on the SS gave a far more uniform outlet mass flow distribution.
Author Contributions
M.v.d.N. and P.I. established the goals of the work and the design of experiments. M.v.d.N. developed the Low Order Flow Network Model and performed CFD work and experiments under the supervision of P.I. All authors have read and agreed to the published version of the manuscript.
Funding
This work is funded by Rolls Royce plc. and the EPSRC, under the CDT in Gas Turbine Aerodynamics (No. EP/L015943/1) and the Transpiration Cooling Systems for Jet Engine Turbines and Hypersonic Flight Programme Grant (No. EP/P000878/1).
Data Availability Statement
Not Applicable.
Acknowledgments
The authors wish to thank of Alexander Murray and the technicians at the Oxford Thermofluids Institute for their contributions to setting up experiments, and Luca Di Mare for help with numerical work. Additional thanks go to Ignacio Mayo, formerly of Rolls Royce plc., for his oversight of this study.
Conflicts of Interest
The funders had no role in the design of the study; in the collection, analyses, or interpretation of data; in the writing of the manuscript, or in the decision to publish the results.
Nomenclature
| Area | |
| Discharge Coefficient | |
| Pressure Coefficient | |
| Coolant Migration Factor | |
| Diameter | |
| Friction Factor | |
| Specific Enthalpy | |
| Heat Transfer Coefficient | |
| Loss Coefficient | |
| Length | |
| Leading Edge | |
| Mass Flow Rate | |
| Nozzle Guide Vane | |
| Pressure | |
| Pressure Difference Ratio | |
| Pressure Surface | |
| Reynolds Number | |
| Spacing | |
| Specific Fuel Consumption | |
| Temperature | |
| Turbine Entry Temperature | |
| Velocity | |
| Area Ratio | |
| Expansibility Factor | |
| Viscosity | |
| Density | |
| Subscripts | |
| Total | |
| Coolant | |
| Exterior | |
| Film/Effusion Hole | |
| Hydraulic | |
| Impingement Hole | |
| Inlet | |
| Outlet | |
| Pedestal | |
| System | |
| Turning | |
| Throat | |
| Wall | |
| Mainstream |
References
- Van de Noort, M.; Ireland, P.T. A Low Order Flow Network Model for Double-Wall Effusion Cooling Systems. In Proceedings of the European Turbomachinery Conference ETC14 2021, Paper No. 666, Gdansk, Poland, 12–16 April 2021. [Google Scholar]
- Bunker, R.S. Gas Turbine Heat Transfer: 10 Remaining Hot Gas Path Challenges. In Proceedings of the ASME Turbo Expo 2006: Power for Land, Sea, and Air, Barcelona, Spain, 8–11 May 2006. [Google Scholar]
- Murray, A.V.; Ireland, P.T.; Rawlinson, A.J. An Integrated Conjugate Computational Approach for Evaluating the Aerothermal and Thermomechanical Performance of Double-Wall Effusion Cooled Systems. In Proceedings of the ASME Turbo Expo 2017: Turbomachinery Technical Conference and Exposition, Charlotte, NC, USA, 26–30 June 2017. [Google Scholar]
- Holgate, N.; Cresci, I.; Ireland, P.; Rawlinson, A. Prediction and augmentation of nozzle guide vane film cooling hole pressure margin. In Proceedings of the 12th European Conference on Turbomachinery Fluid dynamics & Thermodynamics, Stockholm, Sweden, 3–7 April 2017. [Google Scholar]
- Campbell, C.X.; Morrison, J.A. Turbine Airfoil With a Compliant Outer Wall. U.S. Patent 8,147,196 B2, 3 April 2012. [Google Scholar]
- Devore, M.A.; Paauwe, C.S. Turbine Airfoil with Improved Cooling. U.S. Patent 7,600,966 B2, 13 October 2009. [Google Scholar]
- Chyu, M.K.; Hsing, Y.C.; Natarajan, V. Convective Heat Transfer of Cubic Fin Arrays in a Narrow Channel. J. Turbomach. 1998, 120, 363–367. [Google Scholar] [CrossRef]
- Siw, S.C.; Fradeneck, A.D.; Chyu, M.K.; Alvin, M.A. The Effects of Different Pin-Fin Arrays on Heat Transfer and Pressure Loss in a Narrow Channel. In Proceedings of the ASME Turbo Expo 2015: Turbine Technical Conference and Exposition, Montreal, QC, Canada, 15–19 June 2015. [Google Scholar]
- Bamba, T.; Kumagai, T.; Mimura, F.; Yamane, T.; Fukuyama, Y.; Usui, T.; Yoshida, T. Leading Edge Cooling Performance of an Integrated Cooling Configuration. In Proceedings of the ASME Turbo Expo 2008: Power for Land, Sea, and Air, Berlin, Germany, 9–13 June 2008. [Google Scholar]
- Andrews, G.E.; Asere, A.A.; Husain, C.I.; Mkpadi, M.C. Full Coverage Impingement Heat Transfer: The Variation in Pitch to Diameter Ratio at a Constant Gap. In AGARD Heat Transfer and Cooling in Gas Turbines; AGARD: Bergen, Norway, 1985. [Google Scholar]
- Murray, A.V.; Ireland, P.T.; Romero, E. Experimental and Computational Methods for the Evaluation of Double-Wall, Effusion Cooling Systems. In Proceedings of the ASME Turbo Expo 2019: Turbomachinery Technical Conference and Exposition, Phoenix, AZ, USA, 17–21 June 2019. [Google Scholar]
- Wambersie, A.; Wong, H.; Ireland, P.; Mayo, I. Experiments of Transpiration Cooling Inspired Panel Cooling on a Turbine Blade Yielding Film Effectiveness Levels over 95%. Int. J. Turbomach. Propuls. Power 2021, 6, 16. [Google Scholar] [CrossRef]
- Rose, J.R. NASA TM-73774: FLOWNET: A Computer Program for Calculating Secondary Flow Conditions in a Network of Turbomachinery; NASA: Cleveland, OH, USA, 1978.
- Kutz, K.J.; Speer, T.M. Simulation of the Secondary Air System of Aero Engines. In Proceedings of the ASME 1992 International Gas Turbine and Aeroengine Congress and Exposition, Cologne, Germany, 1–4 June 1992. [Google Scholar]
- Ebenhoch, G.; Speer, T.M. Simulation of Cooling Systems in Gas Turbines. In Proceedings of the ASME 1994 International Gas Turbine and Aeroengine Congress and Exposition, The Hague, The Netherlands, 13–16 June 1994. [Google Scholar]
- Gouws, J.; Morris, R.; Visser, J. Modelling of a gas turbine combustor using a network solver. S. Afr. J. Sci. 2006, 102, 533–536. [Google Scholar]
- Jin, H.; Riddle, A.; Cooke, L. A Compressible Flow Network Analysis for Design Upgrade of Industrial Aeroderivative High Pressure Turbine Blades. In Proceedings of the ASME Turbo Expo 2008: Power for Land, Sea, and Air, Berlin, Germany, 9–13 June 2008. [Google Scholar]
- Remani, C. Numerical Methods for Solving Systems of Non-Linear Equations; Lakehead University: Ontario, QC, Canada, 2013. [Google Scholar]
- Mazzei, L.; Winchler, L.; Andreini, A. Development of a numerical correlation for the discharge coefficient of round inclined holes with low crossflow. Comput. Fluids 2017, 152, 182–192. [Google Scholar] [CrossRef]
- Wang, Z. The Application of Thermochromic Liquid Crystals to Detailed Turbine Blade Cooling Measurements. Ph.D. Thesis, University of Oxford, Oxford, UK, 1991. [Google Scholar]
- Miller, D.S. Internal Flow Systems, 2nd ed.; Miller Innovations: Bedford, UK, 2009. [Google Scholar]
- Robert Bosch Power Tools GmbH. ALS 2400|25|2500|28|30; Robert Bosch Power Tools GmbH: Stuttgart, Germany, 2017. [Google Scholar]
- First Sensor. HCE Series: Miniature Amplified Pressure Sensors Datasheet; First Sensor: Berlin, Germany, 2020. [Google Scholar]
- Pico Technology. ADC-20 and ADC-24: High Resolution Data Logger Datasheet; Pico Technology: St Neots, UK, 2019. [Google Scholar]
- Murray, A.V.; Ireland, P.T.; Romero, E. An Experimentally Validated Low Order Model of the Thermal Response of Double-Wall Effusion Cooling Systems for HP Turbine Blades. In Proceedings of the ASME Turbo Expo 2020: Turbomachinery Technical Conference and Exposition, Online, 21–25 September 2020. [Google Scholar]
Figure 1.
Turbine blade using double-wall effusion cooling scheme—From Murray et al., 2017 [3]. Used with Permission.
Figure 1.
Turbine blade using double-wall effusion cooling scheme—From Murray et al., 2017 [3]. Used with Permission.

Figure 2.
Flow network diagram for a single row.

Figure 3.
Example results from the LOM.

Figure 4.
Fluid domain for CFD fluid domain.

Figure 5.
Mesh independence study results.

Figure 6.
Test piece diagrams from Murray et al. [11]: (a) Unit block layout with dimensions. (b) Sectioned 3D model. Used with Permission.
Figure 6.
Test piece diagrams from Murray et al. [11]: (a) Unit block layout with dimensions. (b) Sectioned 3D model. Used with Permission.

Figure 7.
CAD model (Section Diagram) of the blower rig test section.

Figure 8.
Test case mass flows, experiment result vs. LOM results.

Figure 9.
Experiment vs. LOM flow distribution for: (a) near-uniform spanwise pressure and (b) high spanwise pressure gradient in 2 D3 blower rig tests.
Figure 9.
Experiment vs. LOM flow distribution for: (a) near-uniform spanwise pressure and (b) high spanwise pressure gradient in 2 D3 blower rig tests.

Figure 10.
Non-Dimensional Relations for : (a) vs. for 2 × 2 Model, (b) vs. for 2 × 2 Model at multiple PDRs.
Figure 10.
Non-Dimensional Relations for : (a) vs. for 2 × 2 Model, (b) vs. for 2 × 2 Model at multiple PDRs.

Figure 11.
Effect of scaling factors on : (a) vs. scaling factors for hole diameters at 1.5 ; (b) vs. hole length/diameter ratios at 1.5 .
Figure 11.
Effect of scaling factors on : (a) vs. scaling factors for hole diameters at 1.5 ; (b) vs. hole length/diameter ratios at 1.5 .

Figure 12.
vs. pedestal width/impingement hole diameter at 1.5 .

Figure 13.
Flow network for a double-wall effusion cooled NGV.

Figure 14.
CFD results for outlet mass flow distribution for different internal cavities.

Figure 15.
LOM results for outlet mass flow distributions in an NGV for scaling hole diameters.

Publisher’s Note: MDPI stays neutral with regard to jurisdictional claims in published maps and institutional affiliations. |
© 2022 by the authors. Licensee MDPI, Basel, Switzerland. This article is an open access article distributed under the terms and conditions of the Creative Commons Attribution (CC BY-NC-ND) license (https://creativecommons.org/licenses/by-nc-nd/4.0/).
Share and Cite
MDPI and ACS Style
van de Noort, M.; Ireland, P. A Low Order Flow Network Model for Double-Wall Effusion Cooling Systems. Int. J. Turbomach. Propuls. Power 2022, 7, 5. https://0-doi-org.brum.beds.ac.uk/10.3390/ijtpp7010005
AMA Style
van de Noort M, Ireland P. A Low Order Flow Network Model for Double-Wall Effusion Cooling Systems. International Journal of Turbomachinery, Propulsion and Power. 2022; 7(1):5. https://0-doi-org.brum.beds.ac.uk/10.3390/ijtpp7010005
Chicago/Turabian Stylevan de Noort, Michael, and Peter Ireland. 2022. "A Low Order Flow Network Model for Double-Wall Effusion Cooling Systems" International Journal of Turbomachinery, Propulsion and Power 7, no. 1: 5. https://0-doi-org.brum.beds.ac.uk/10.3390/ijtpp7010005