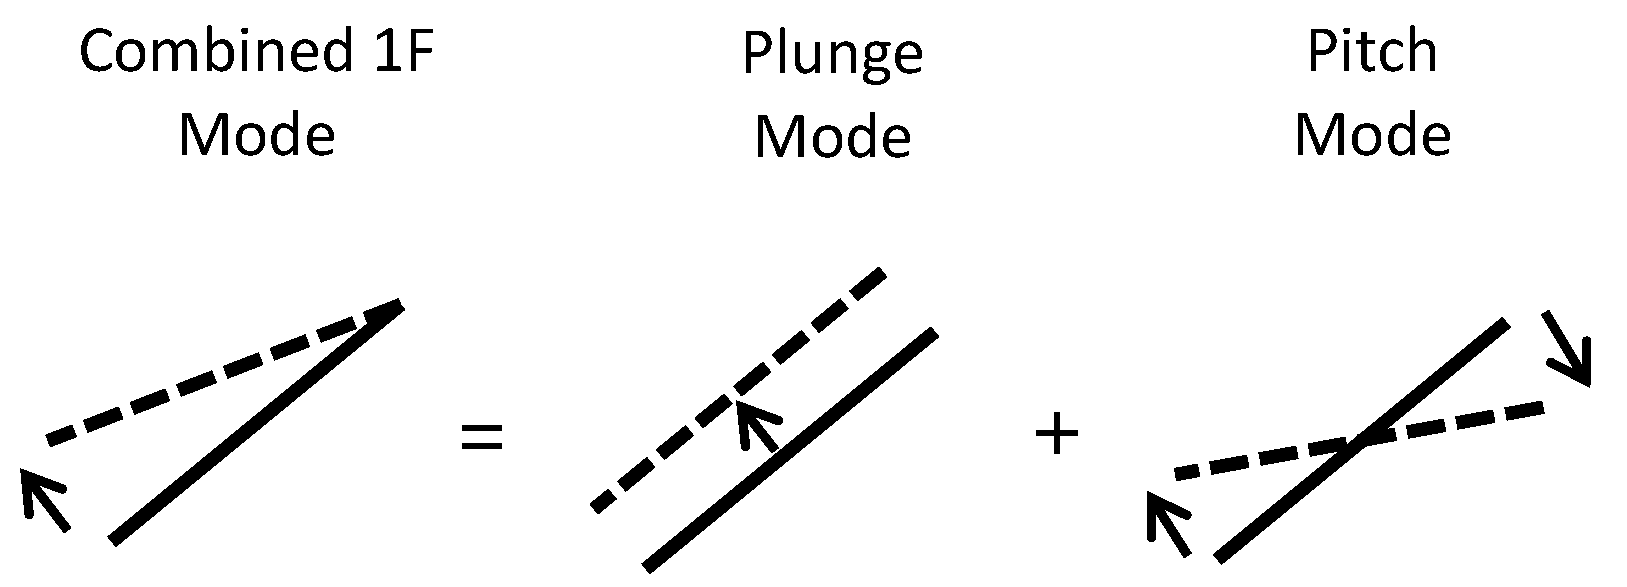
Aeroelastic Stability of Combined Plunge-Pitch Mode Shapes in a Linear Compressor Cascade †


Abstract
:1. Introduction
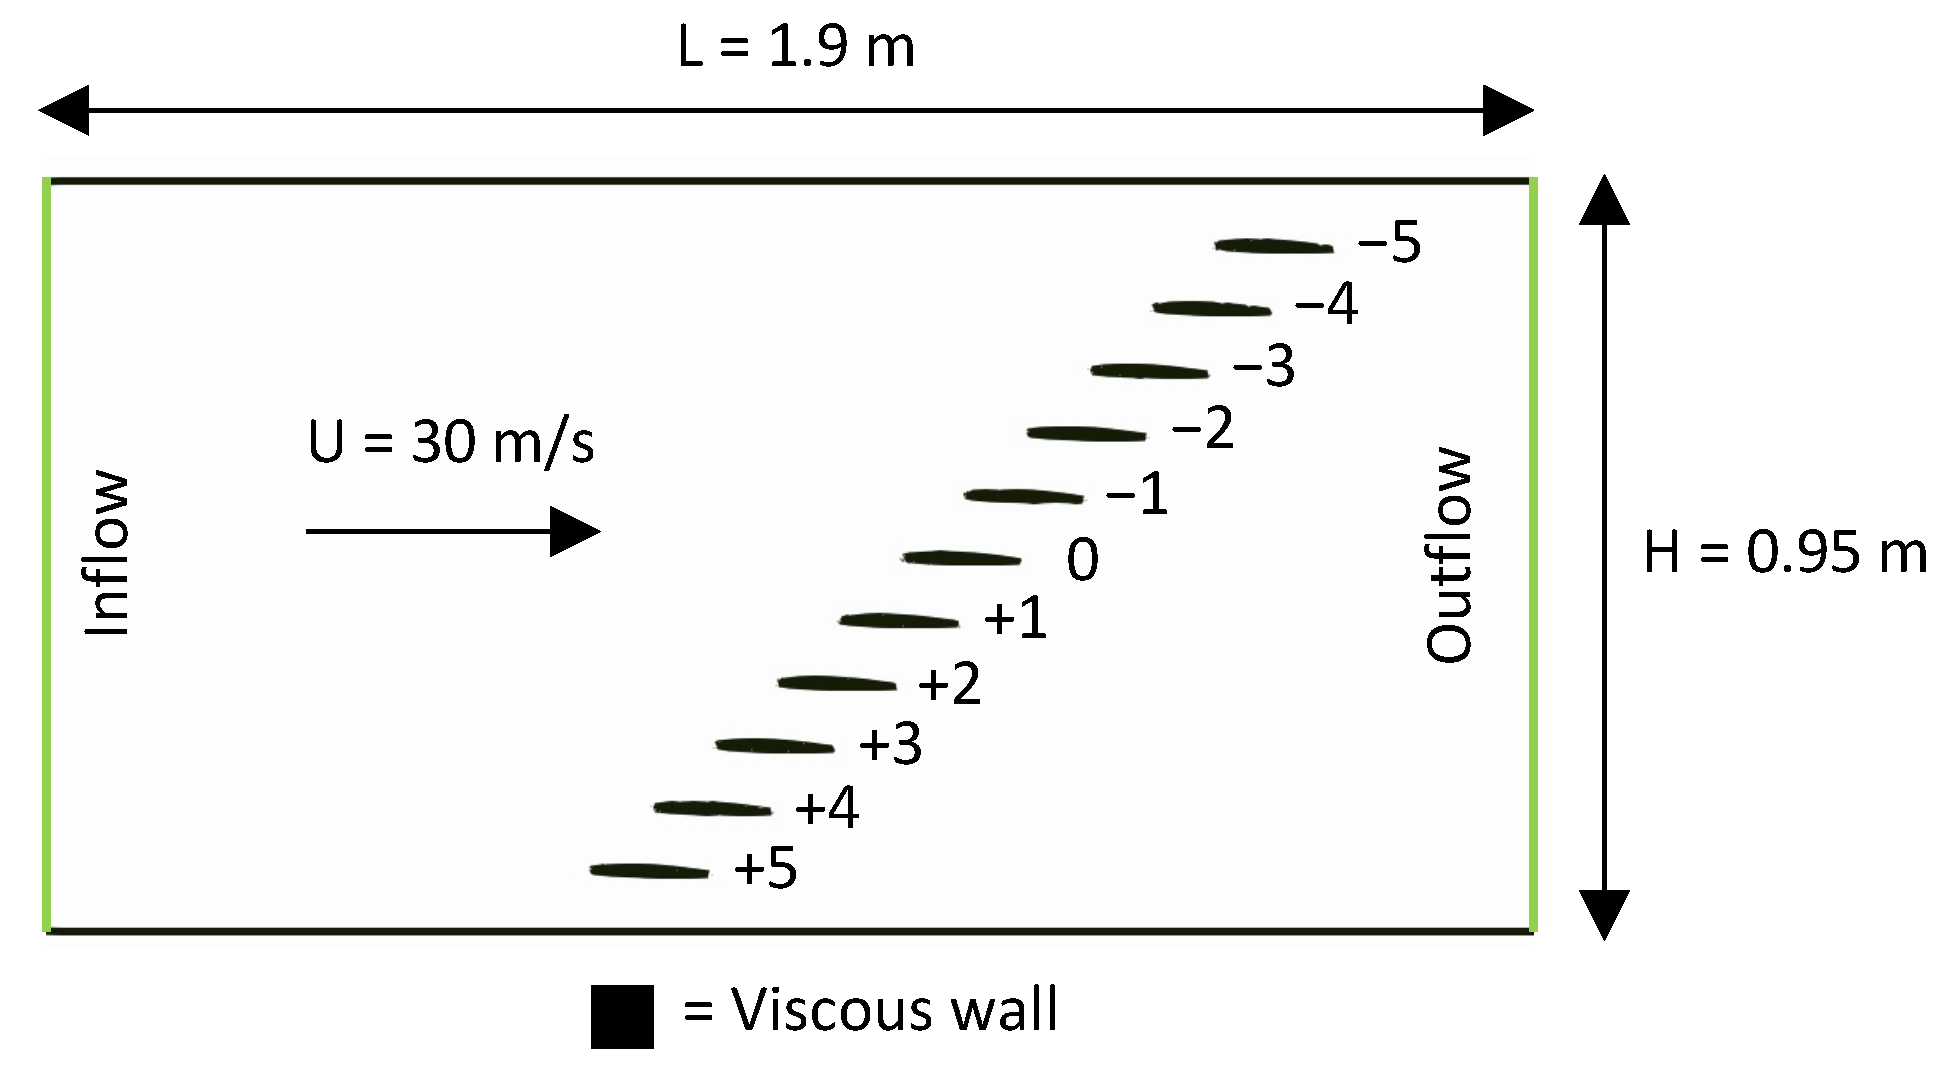
2. Test Case
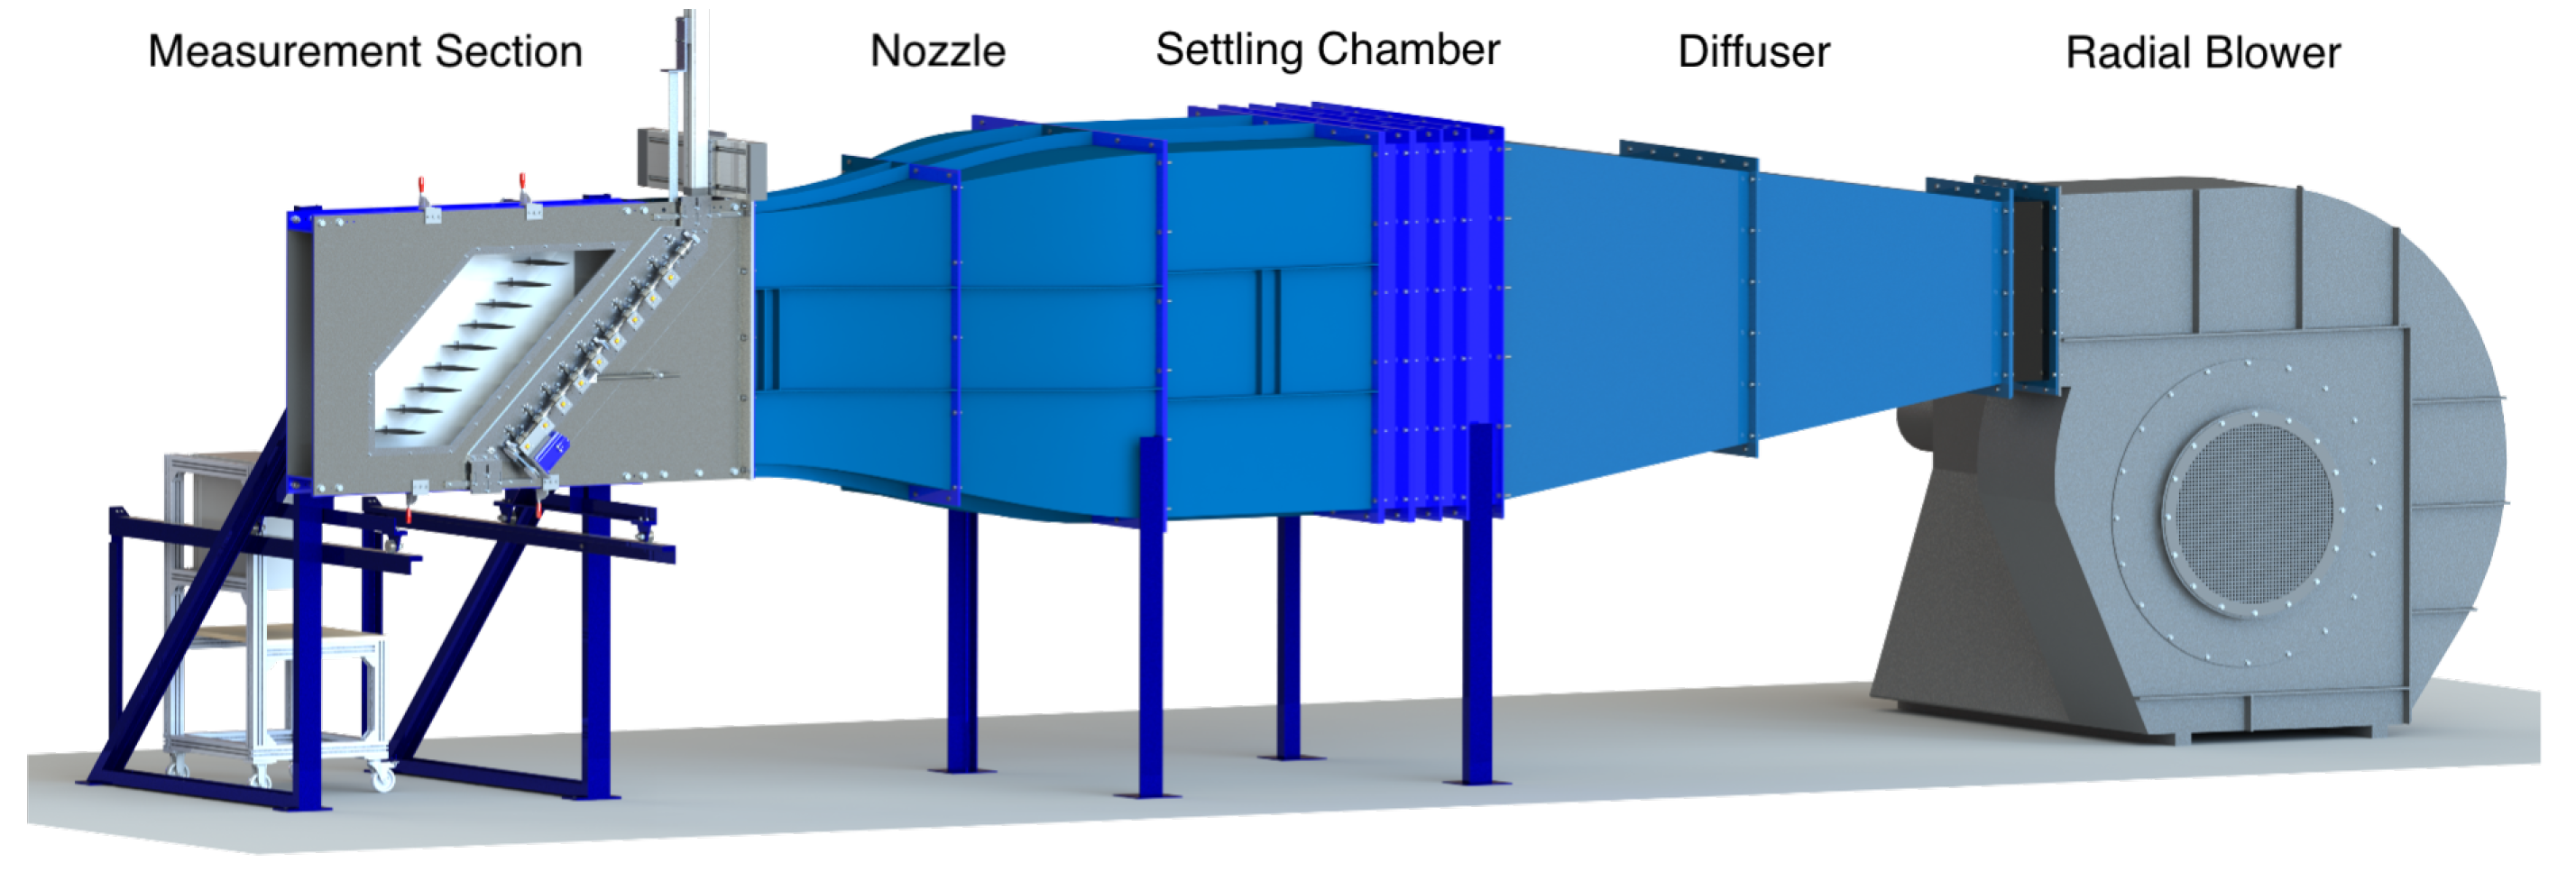
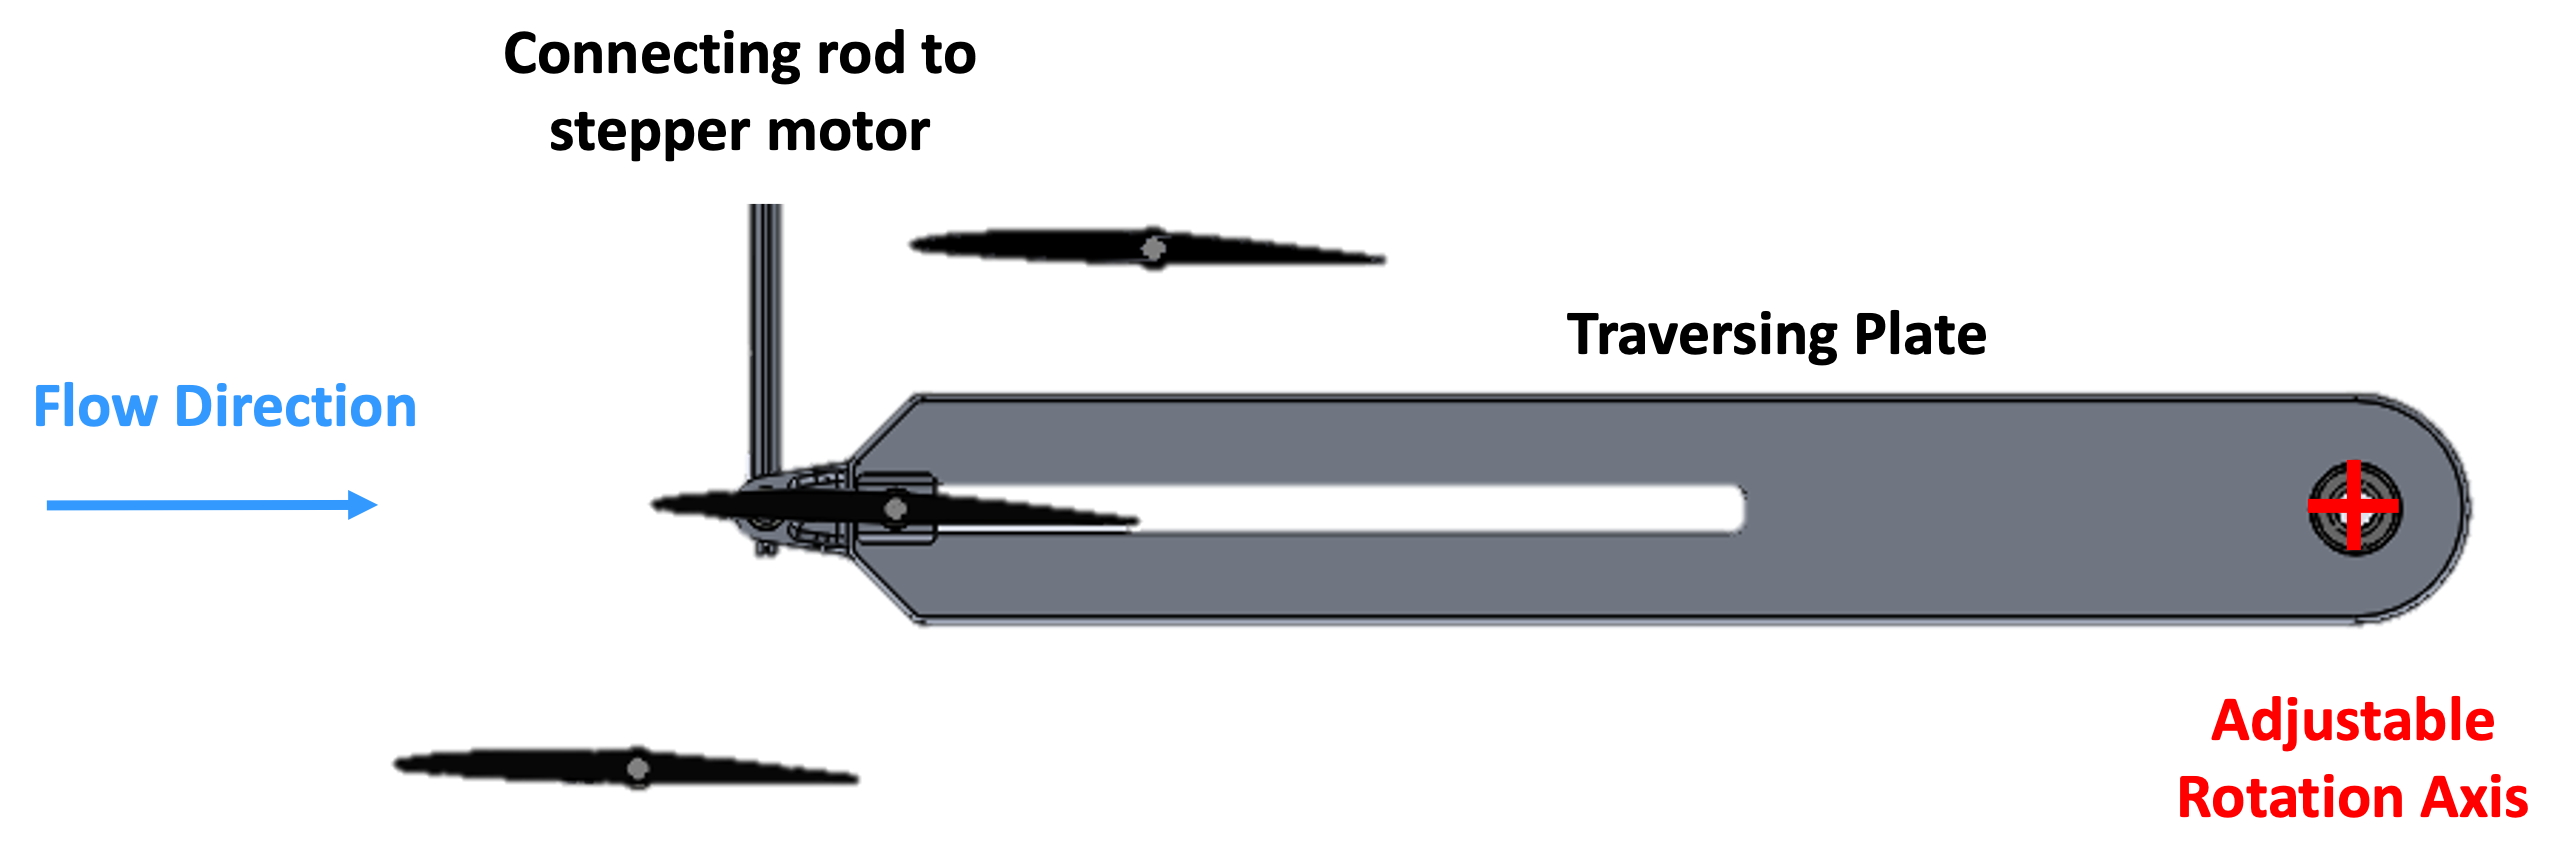
3. Test Rig
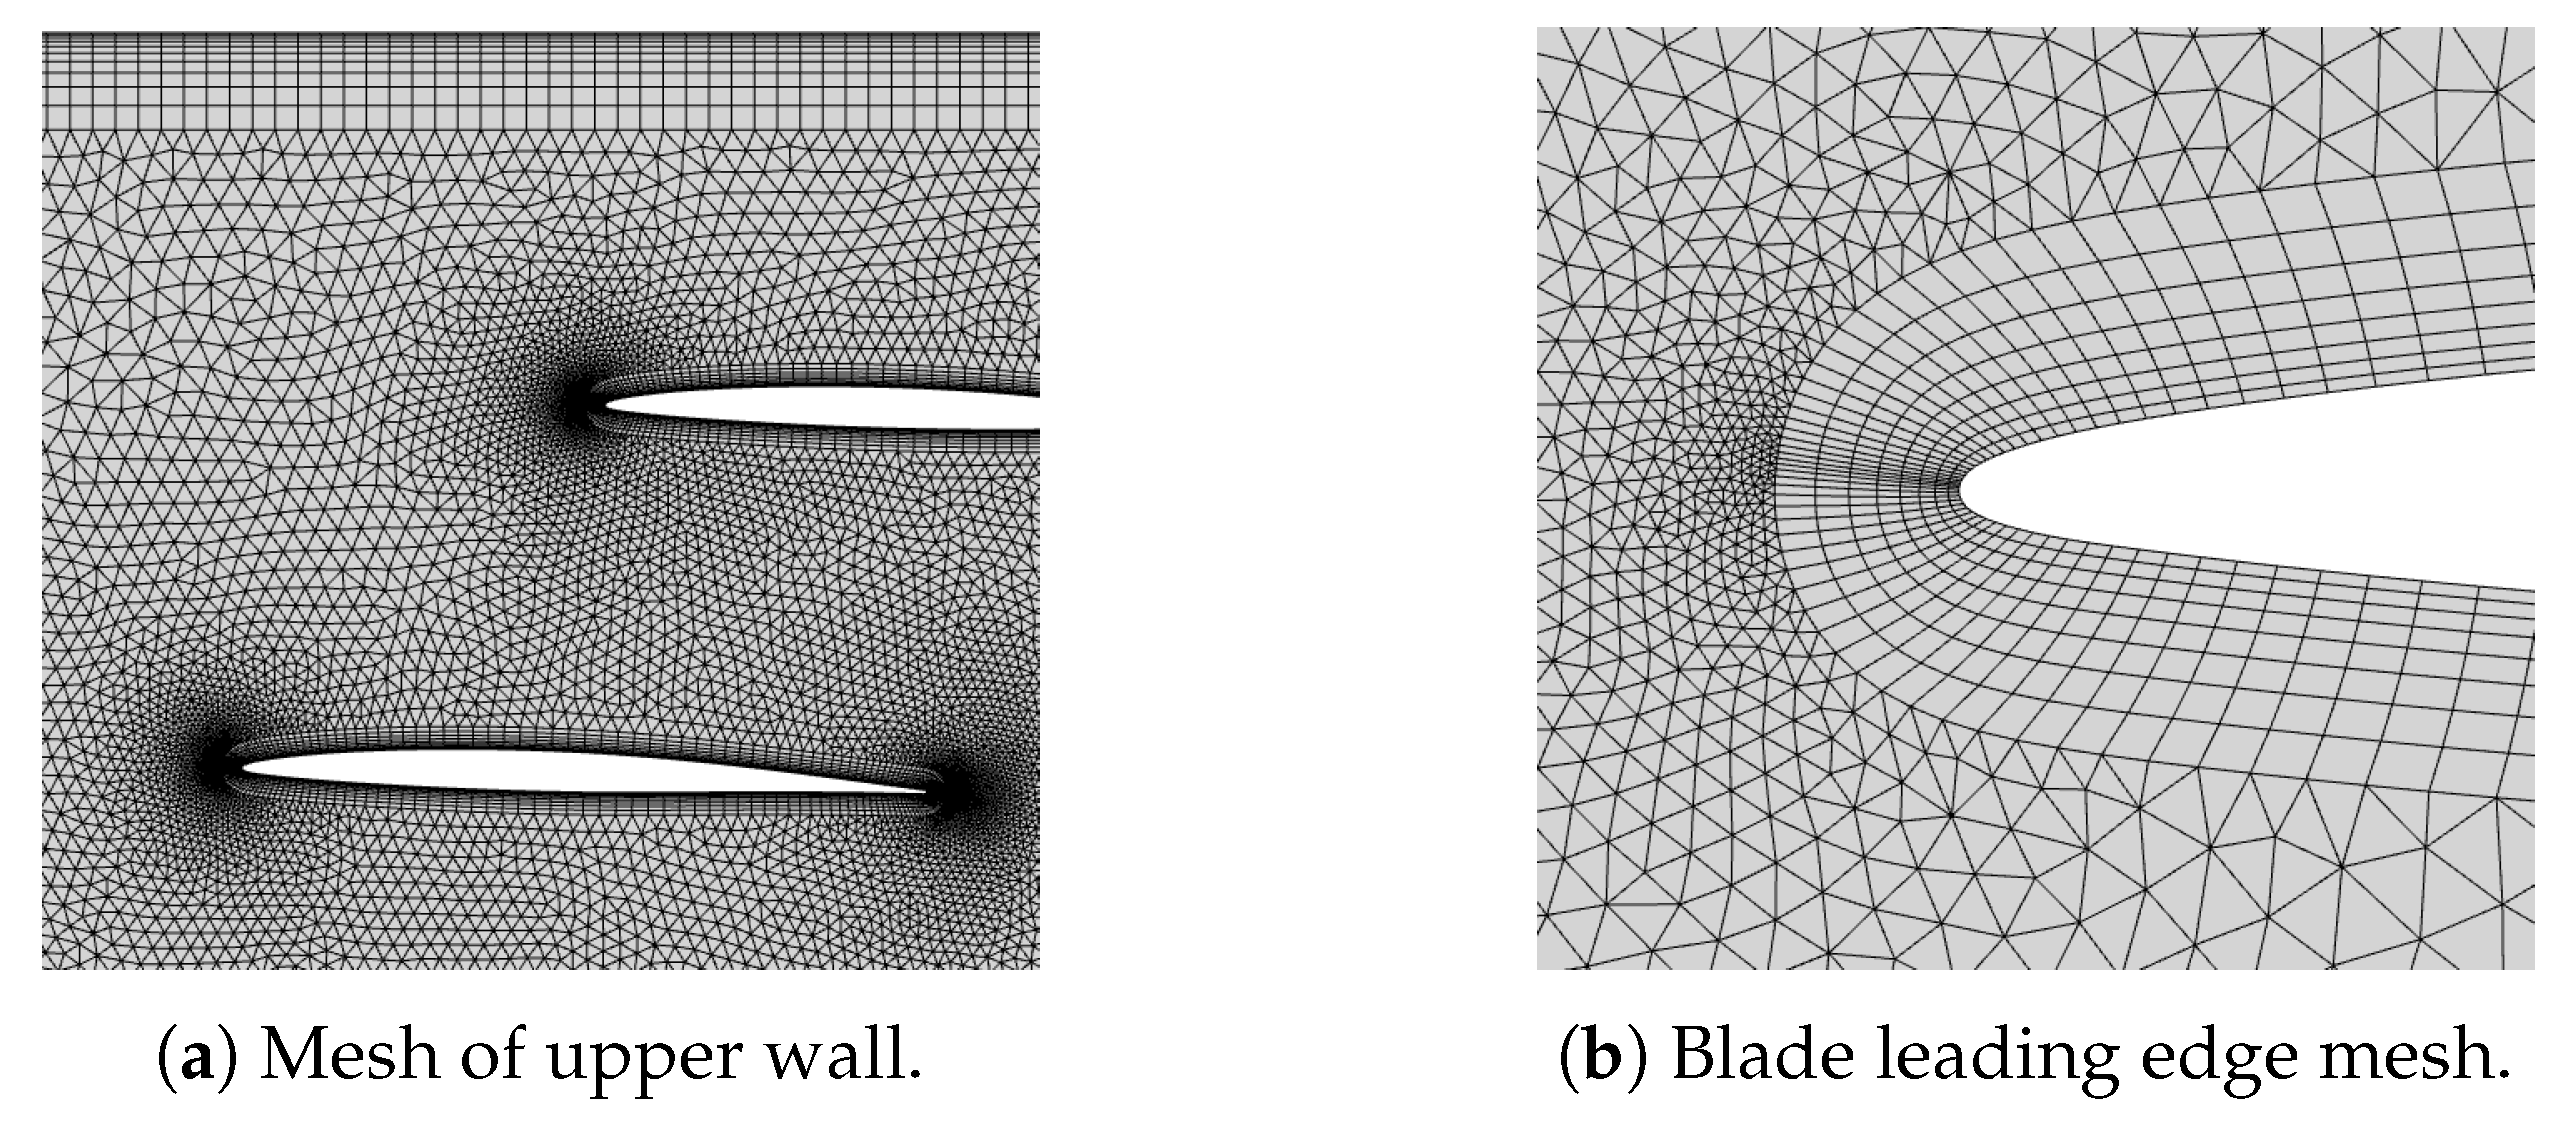
4. Numerical Method
4.1. Flow Solver
4.2. Computational Implementation
5. Aero-Damping Evaluation Method
6. Validation of CFD
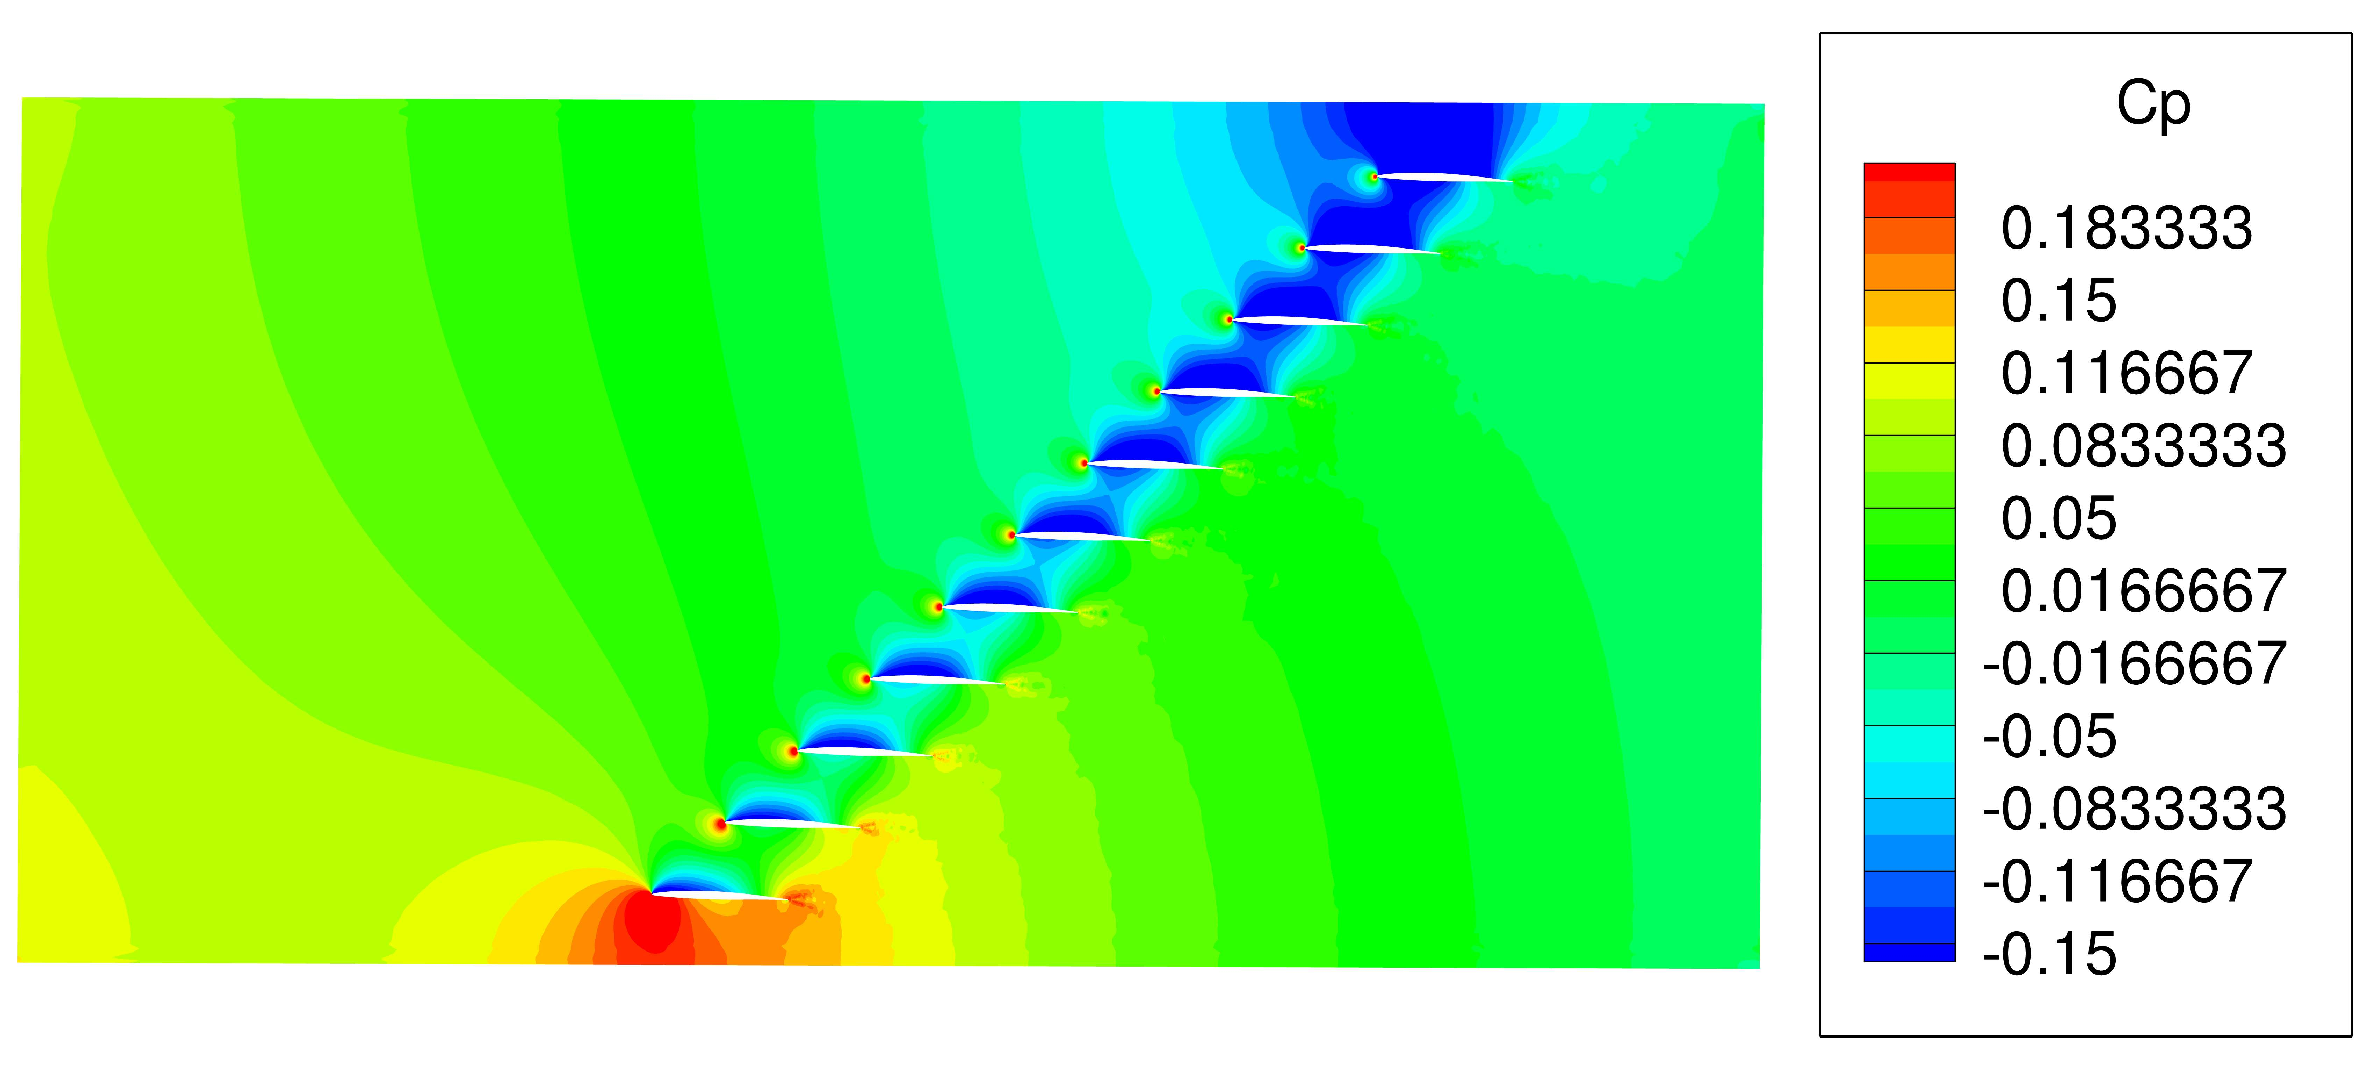
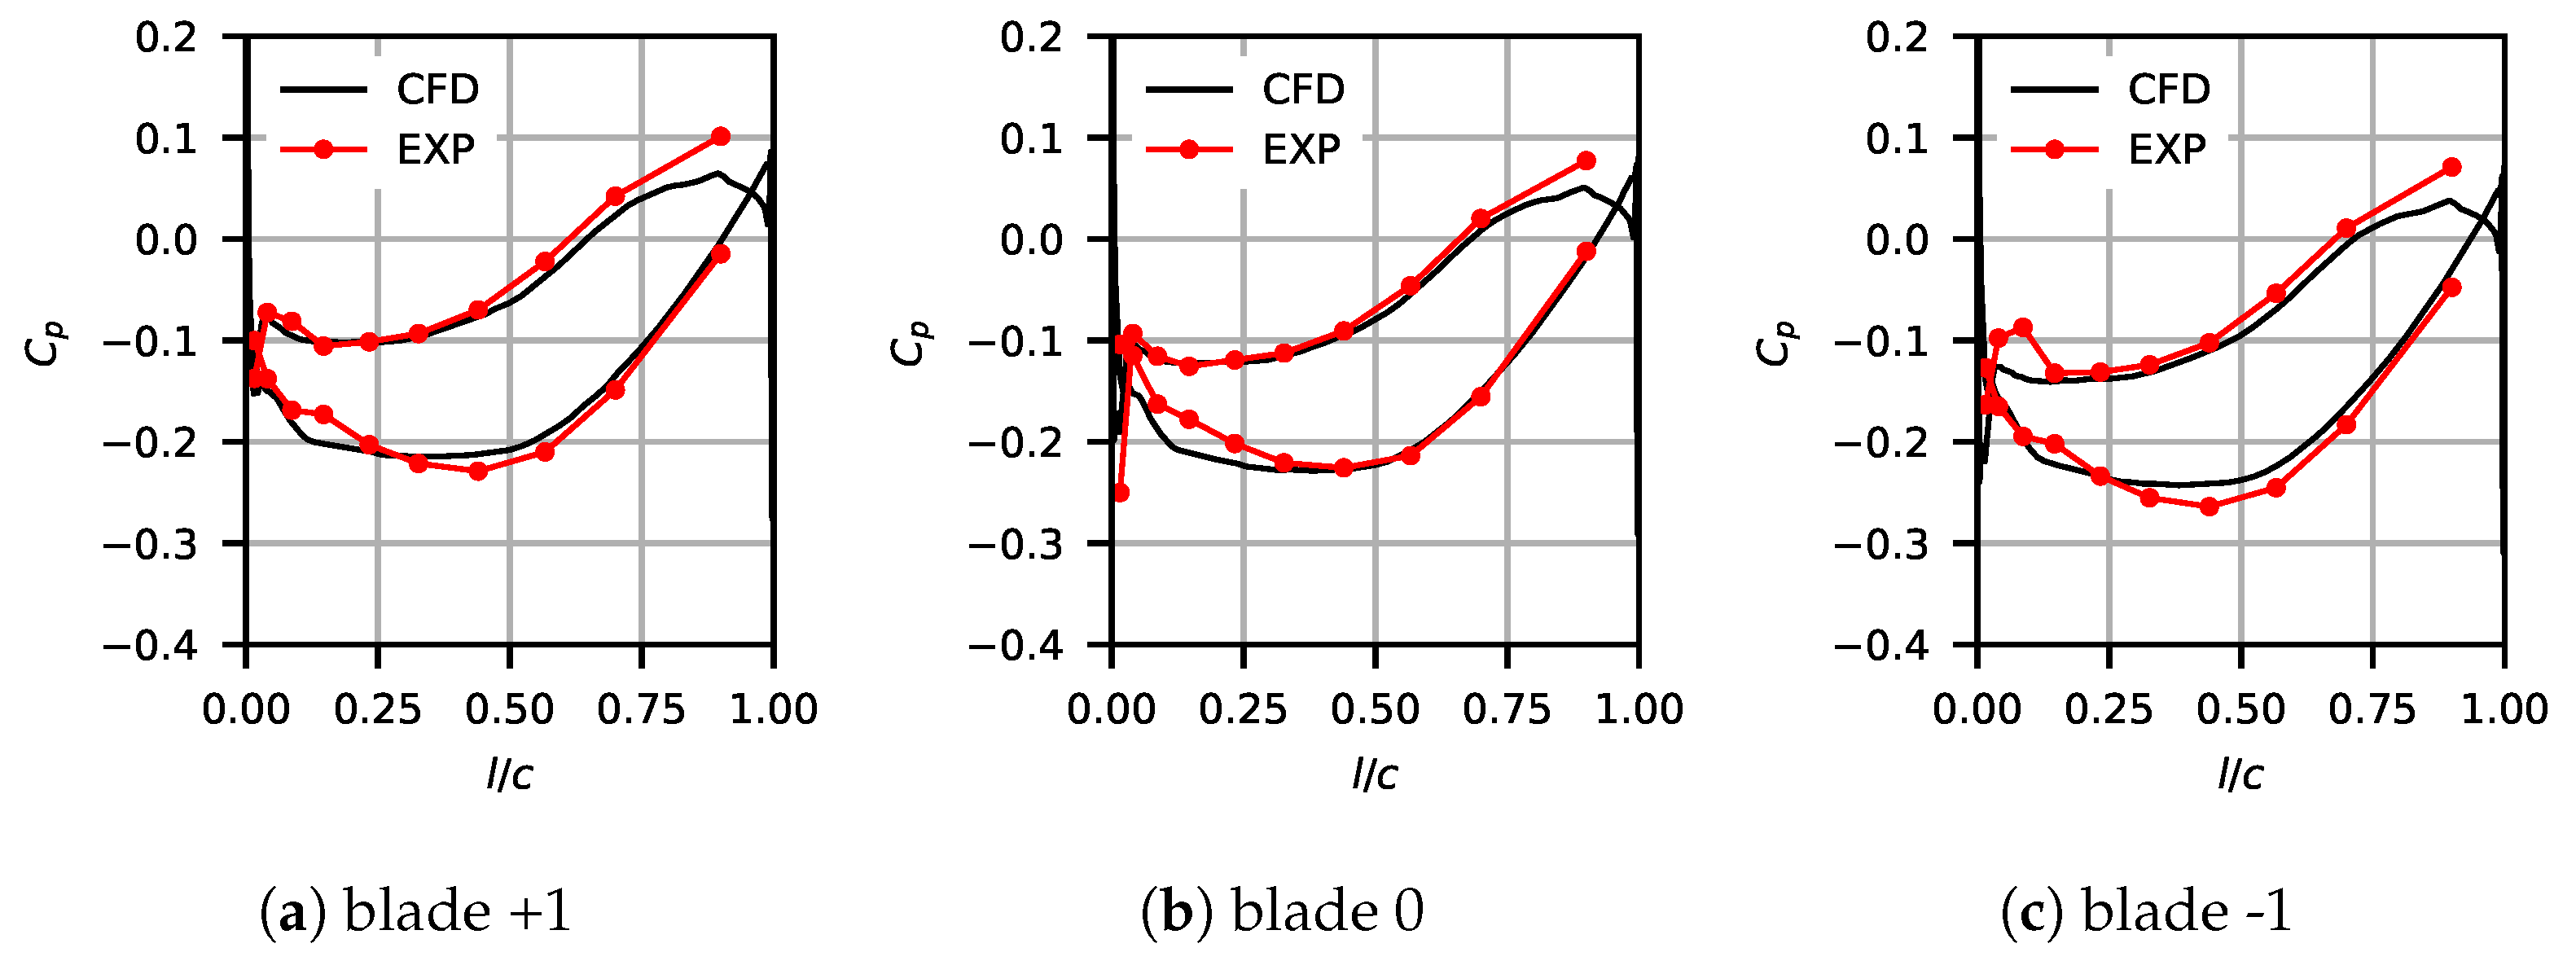
6.1. Steady State Flow
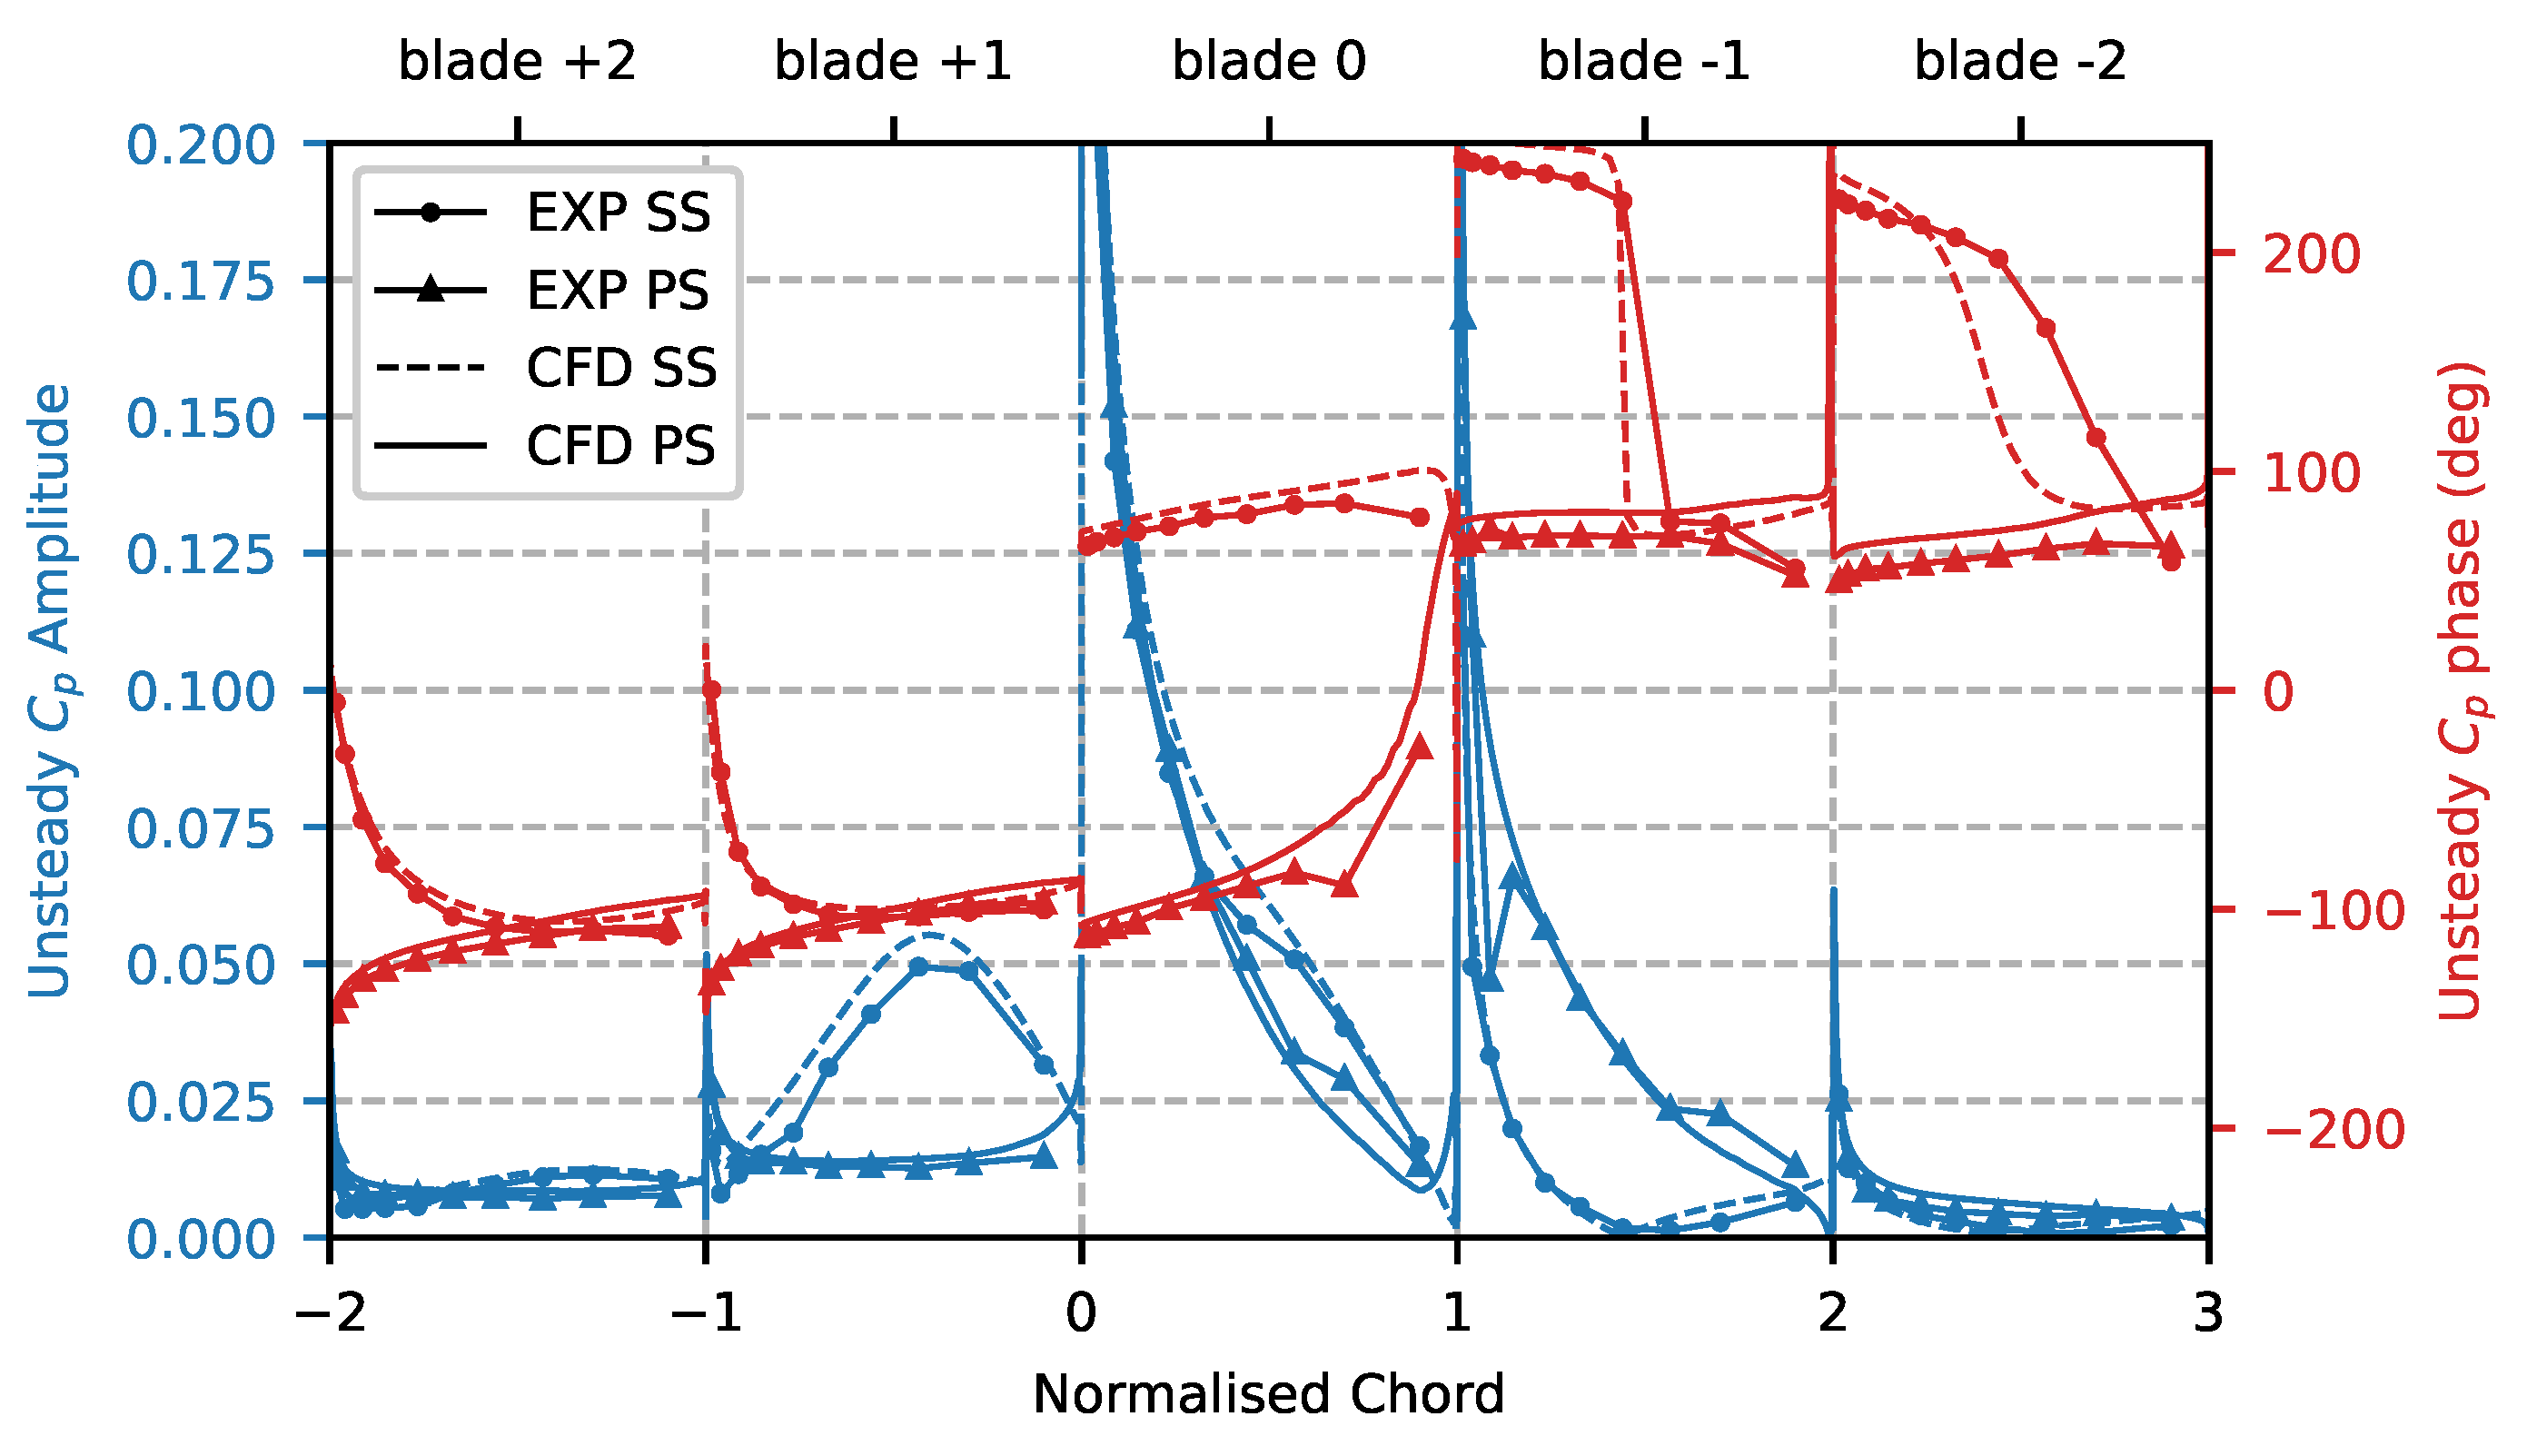
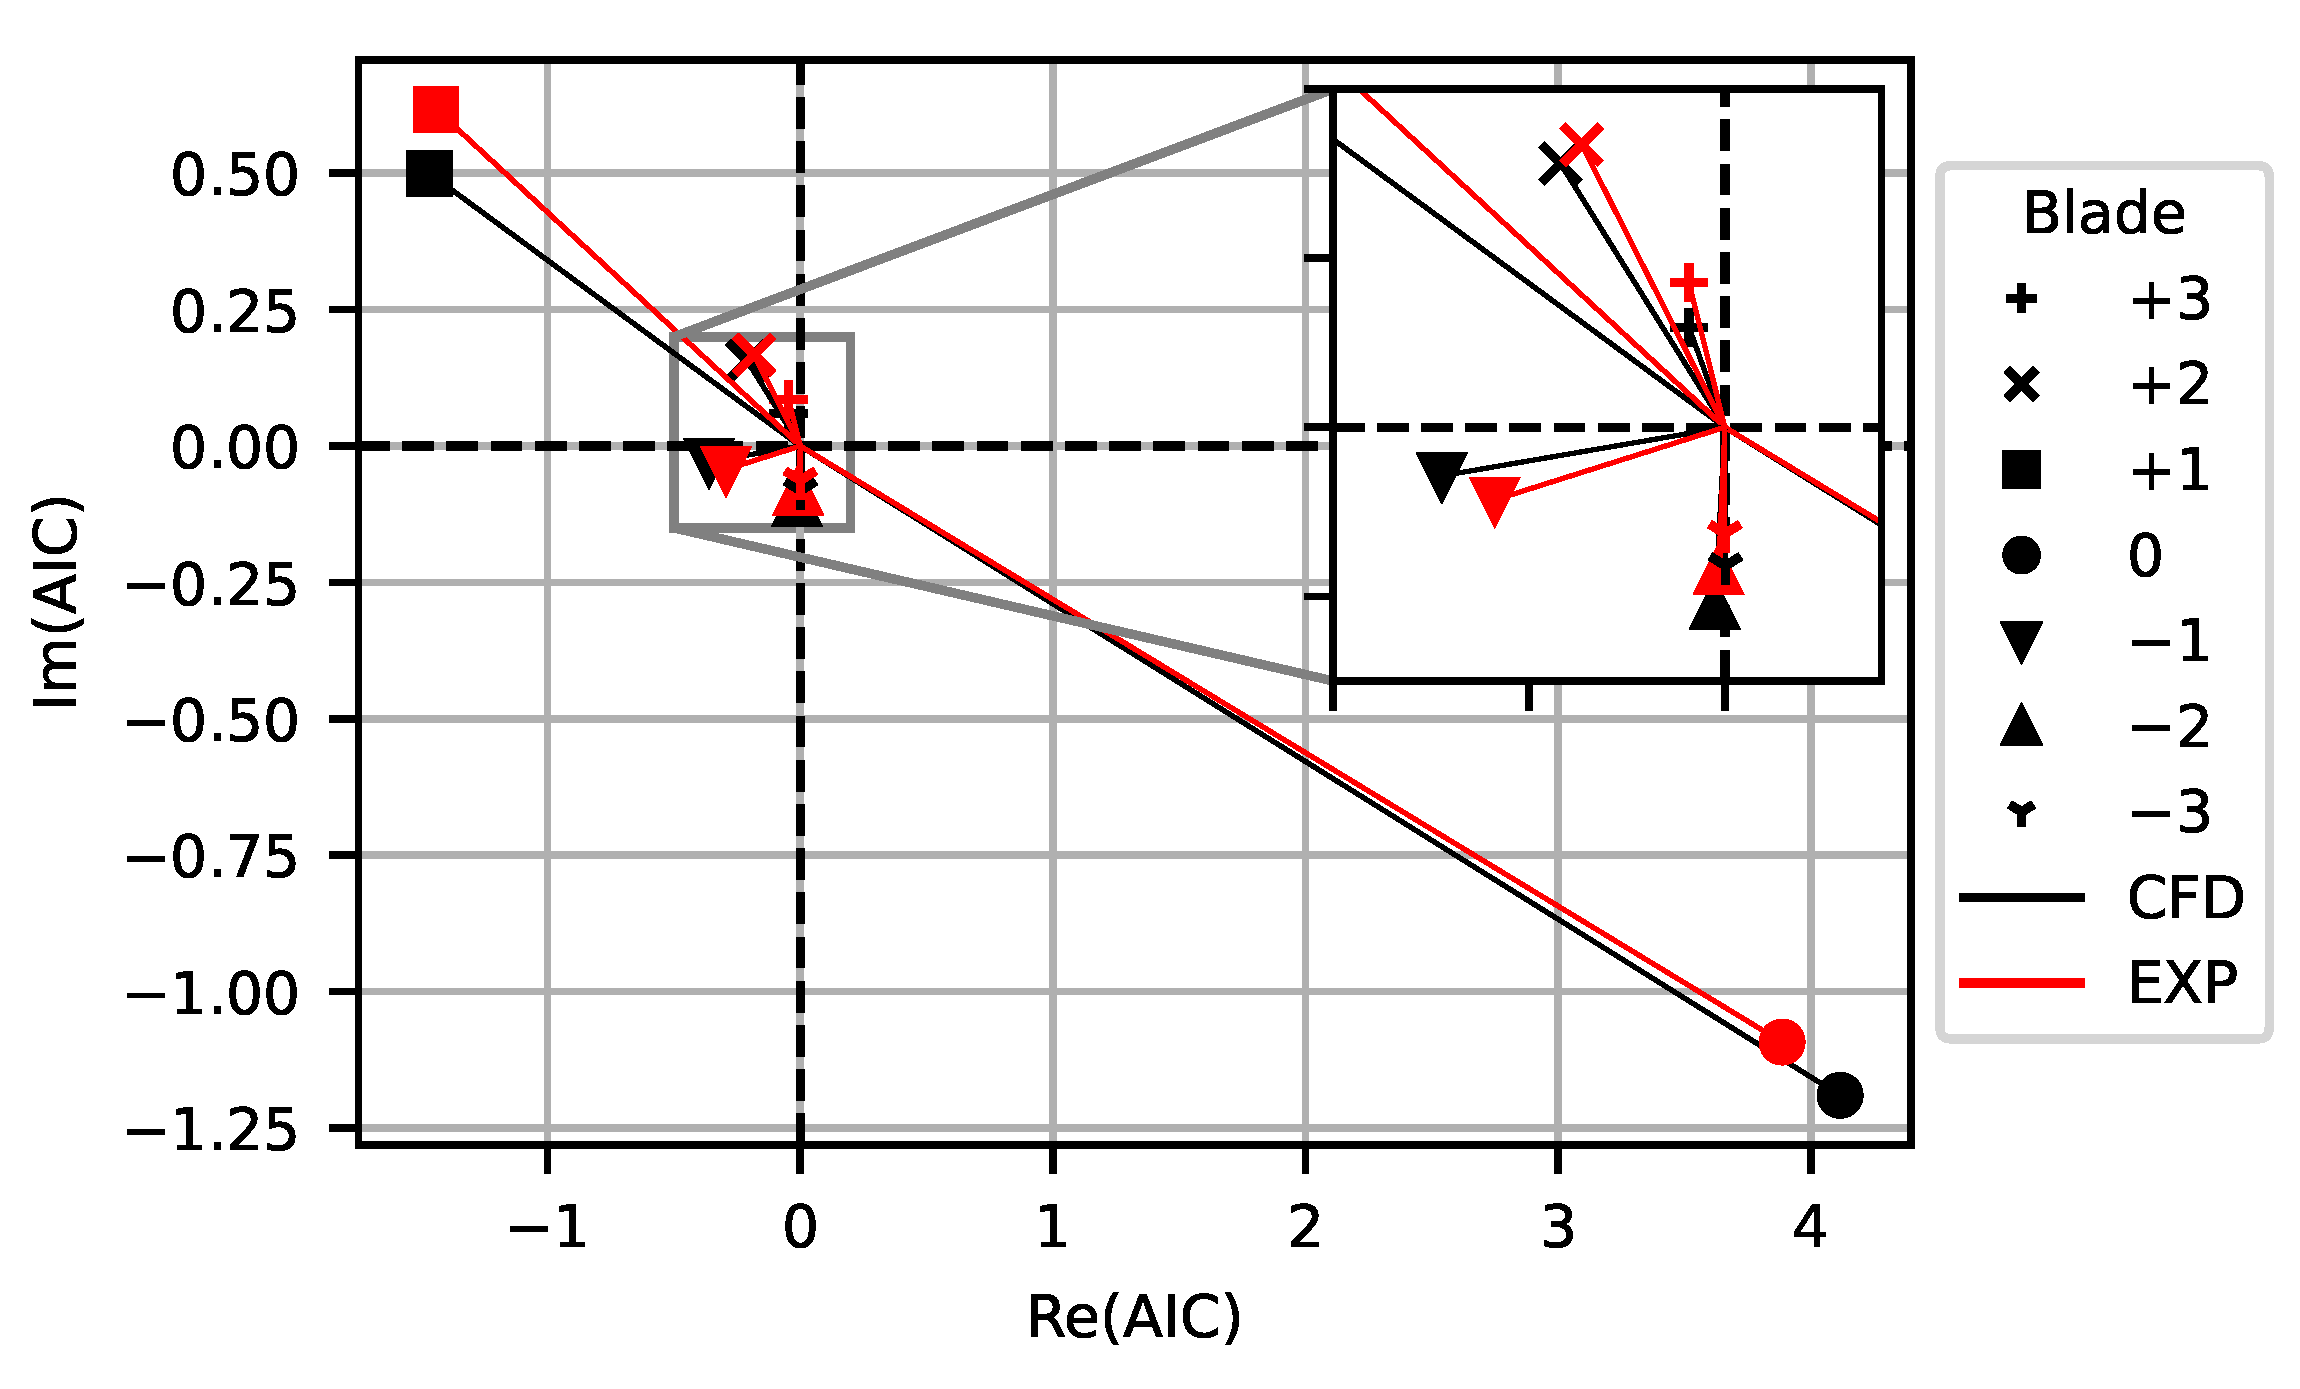
6.2. Unsteady Flow
7. Stability Analysis
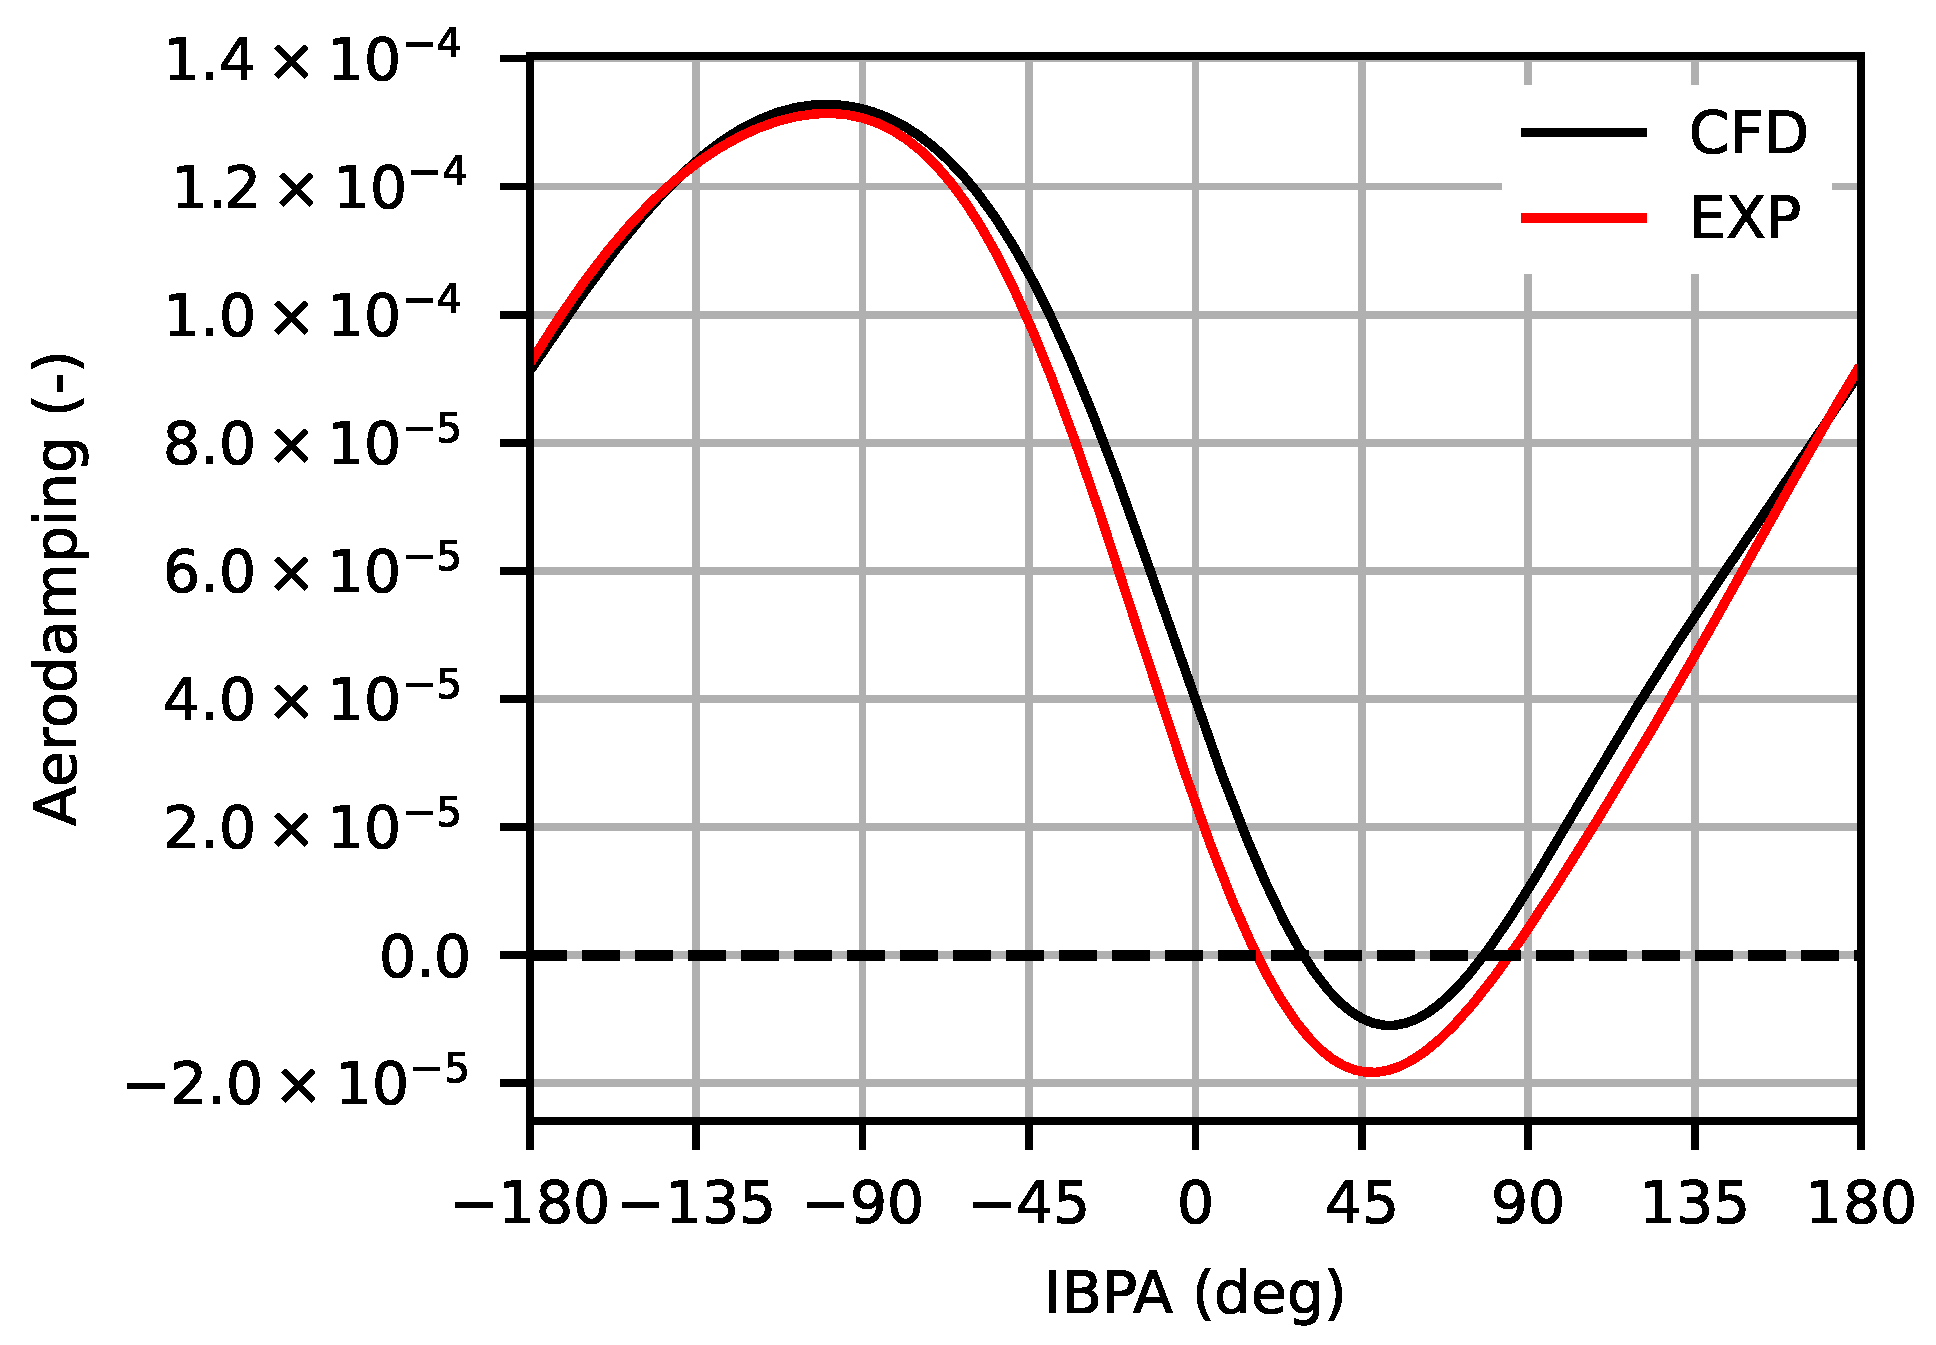
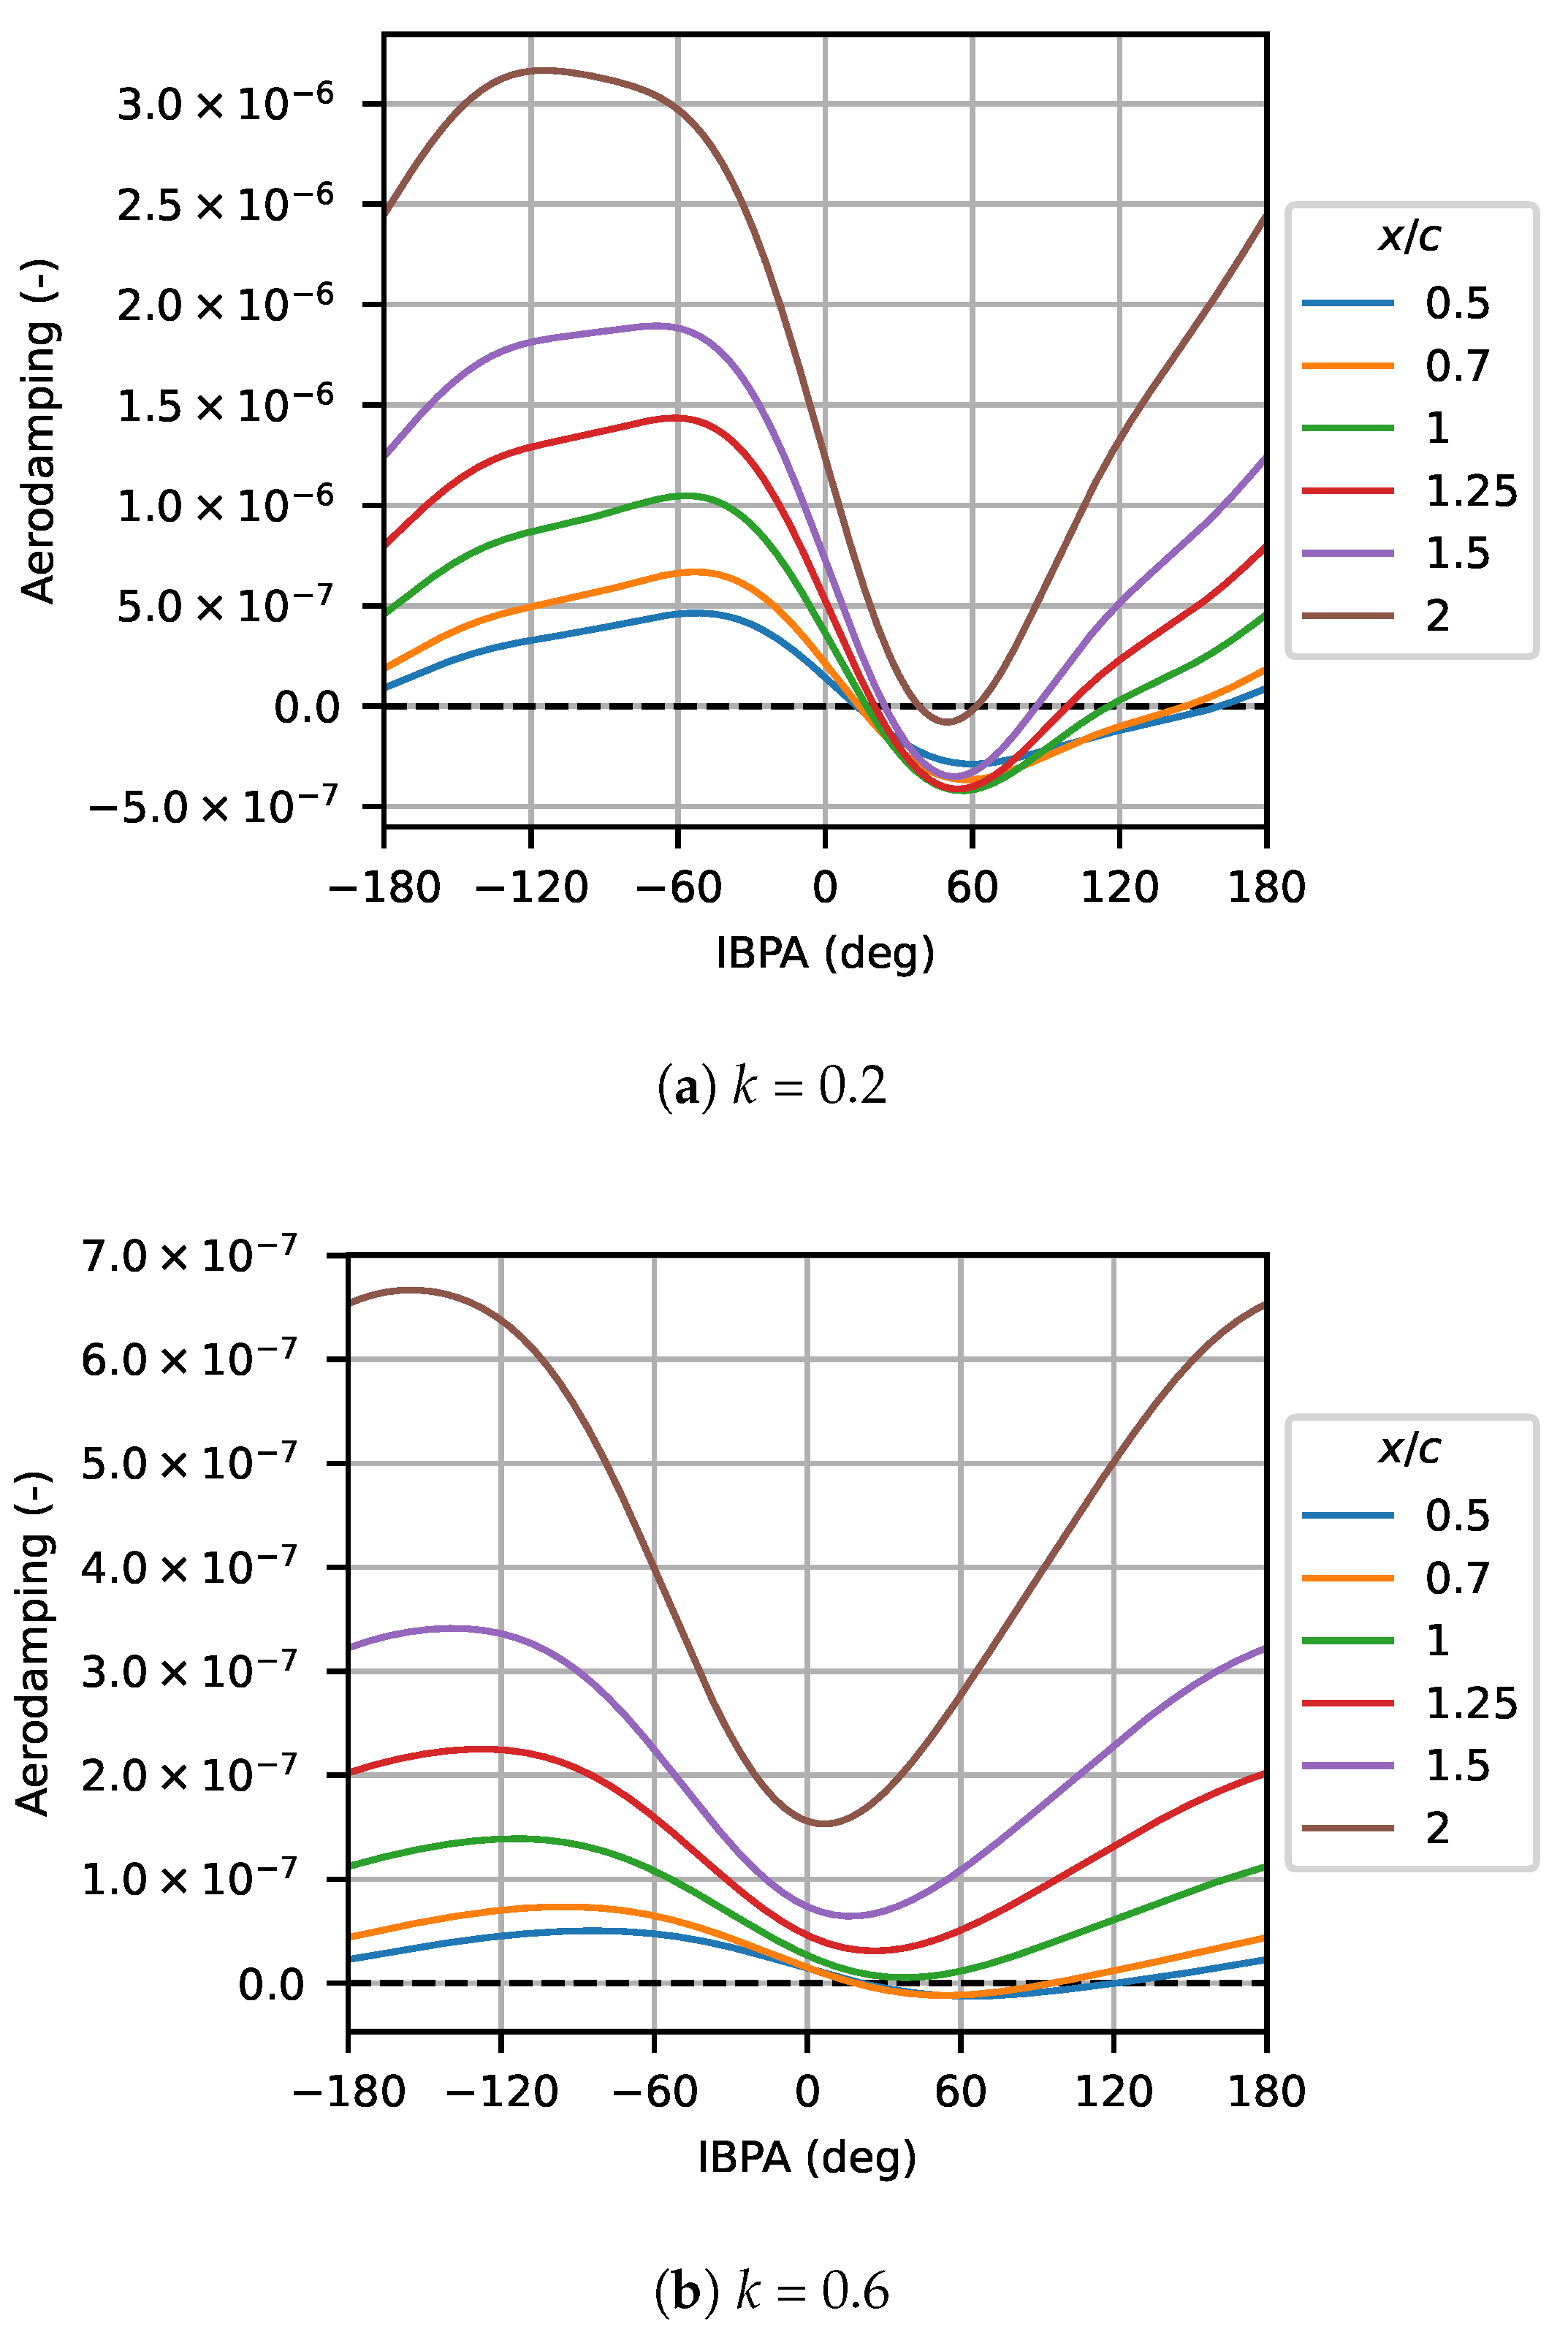
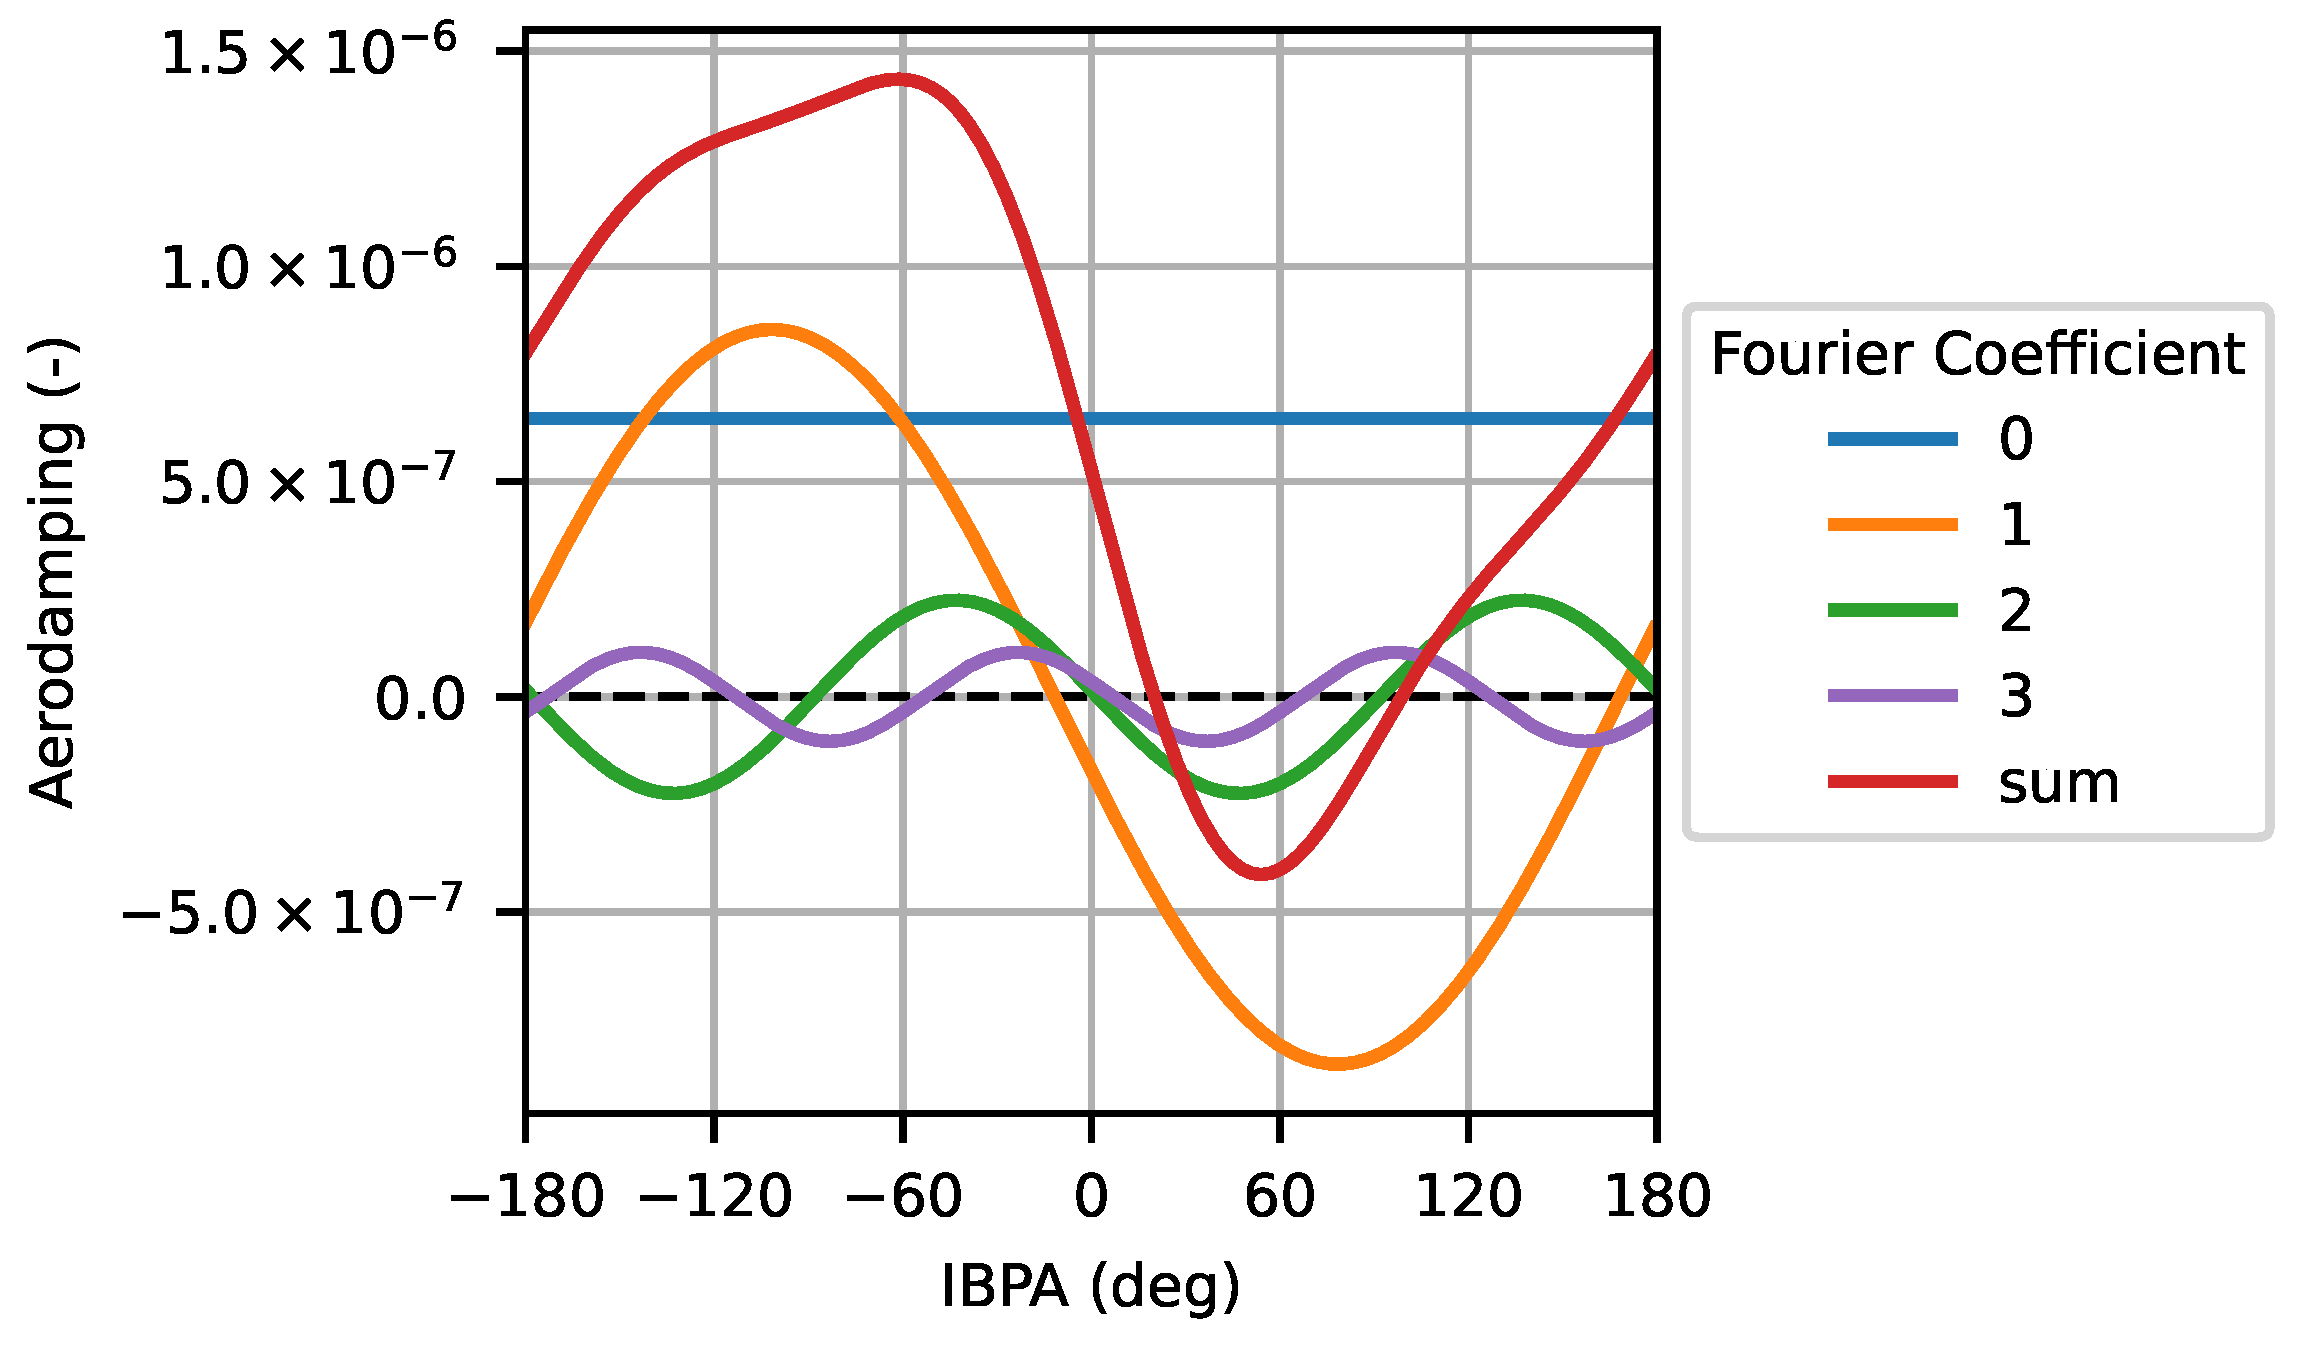
7.1. Influence of Inter-Blade Phase Angle
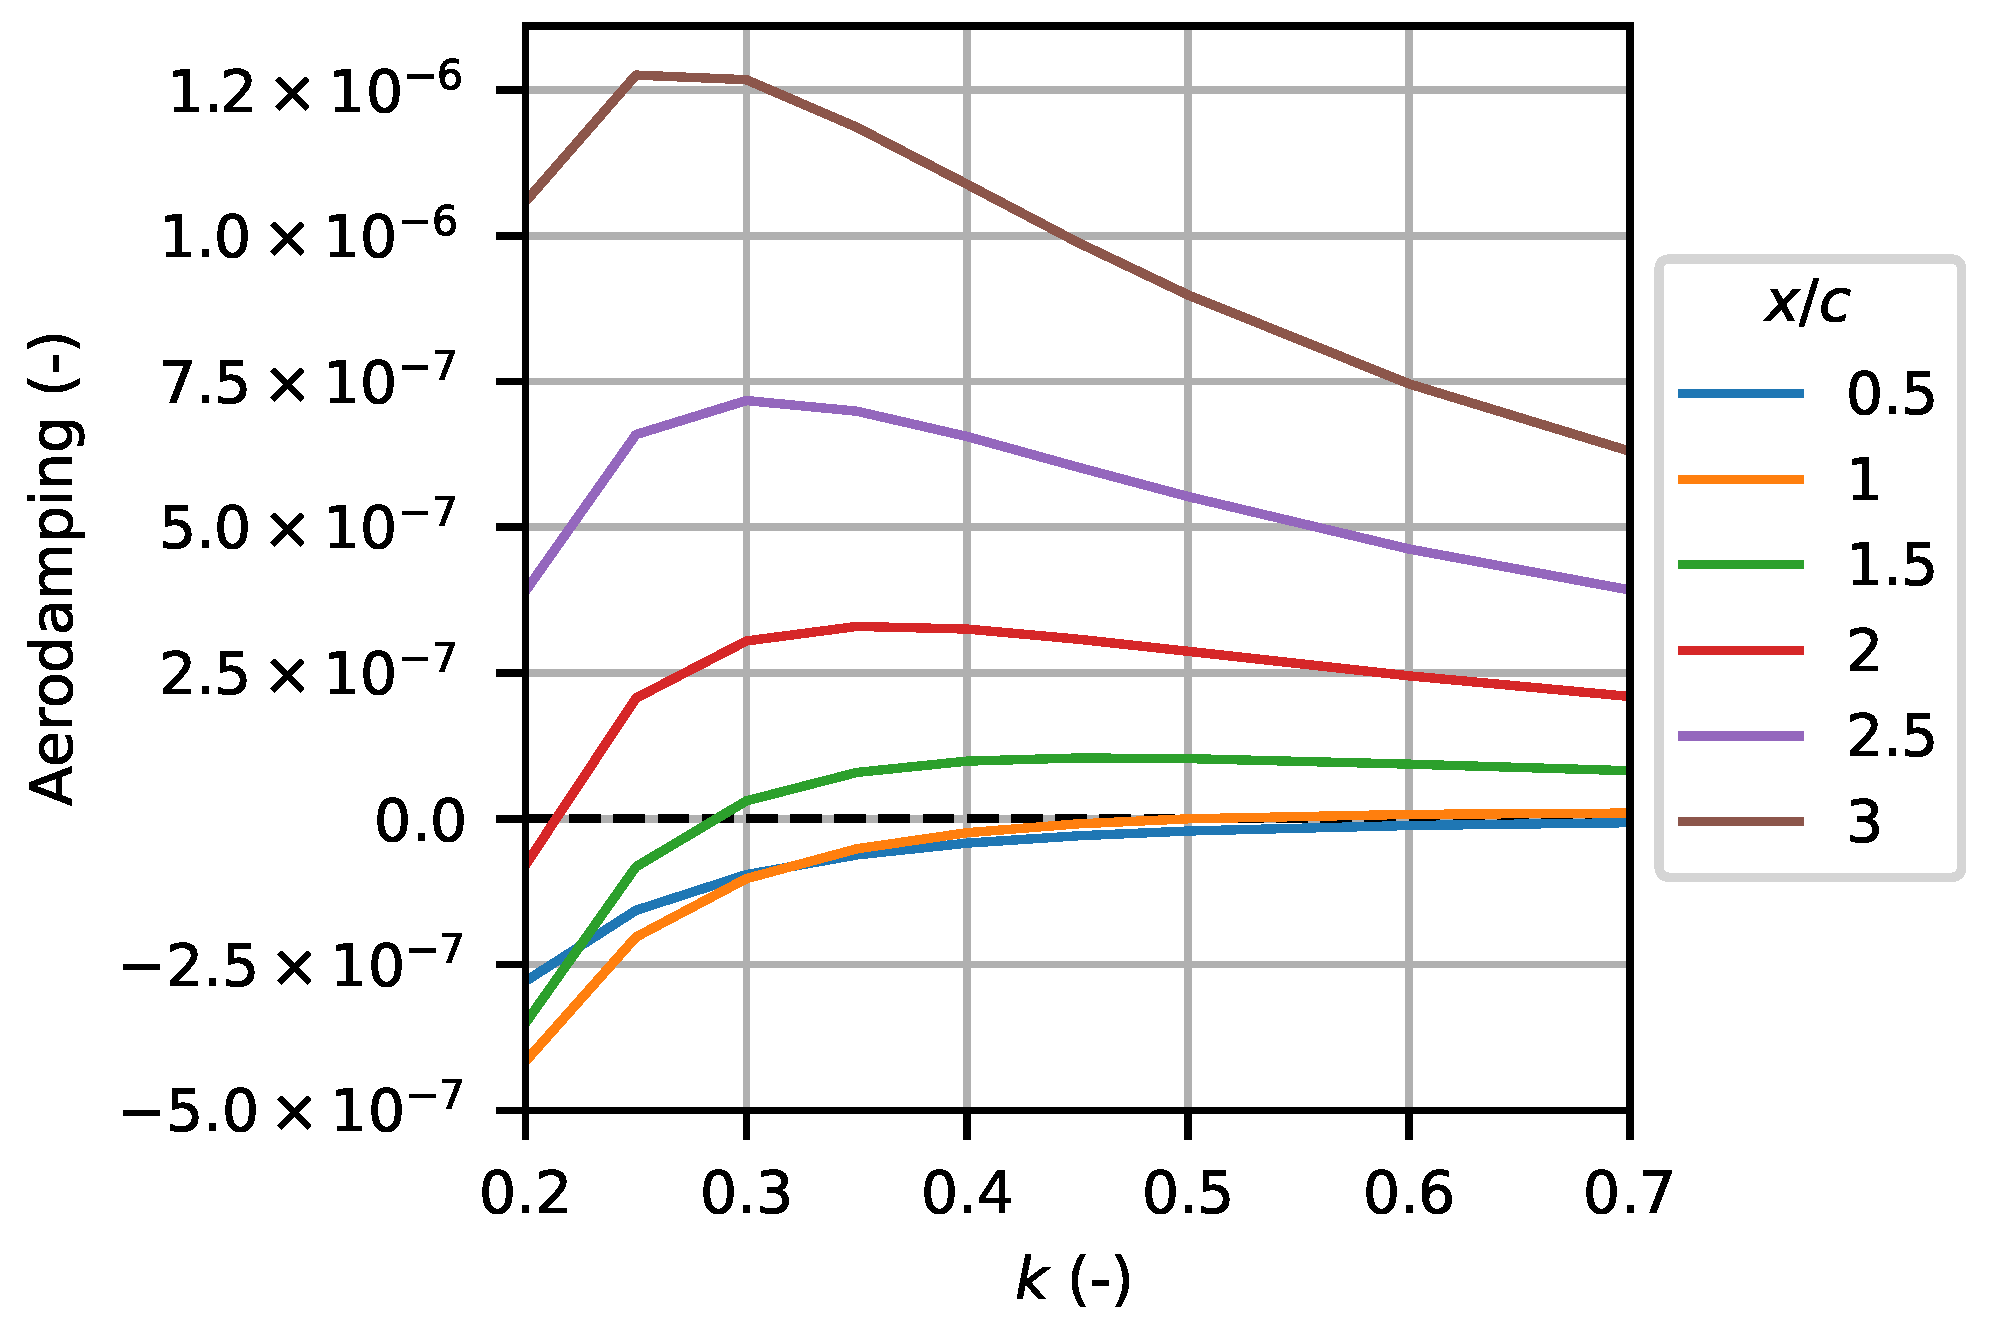
7.2. Influence of Reduced Frequency
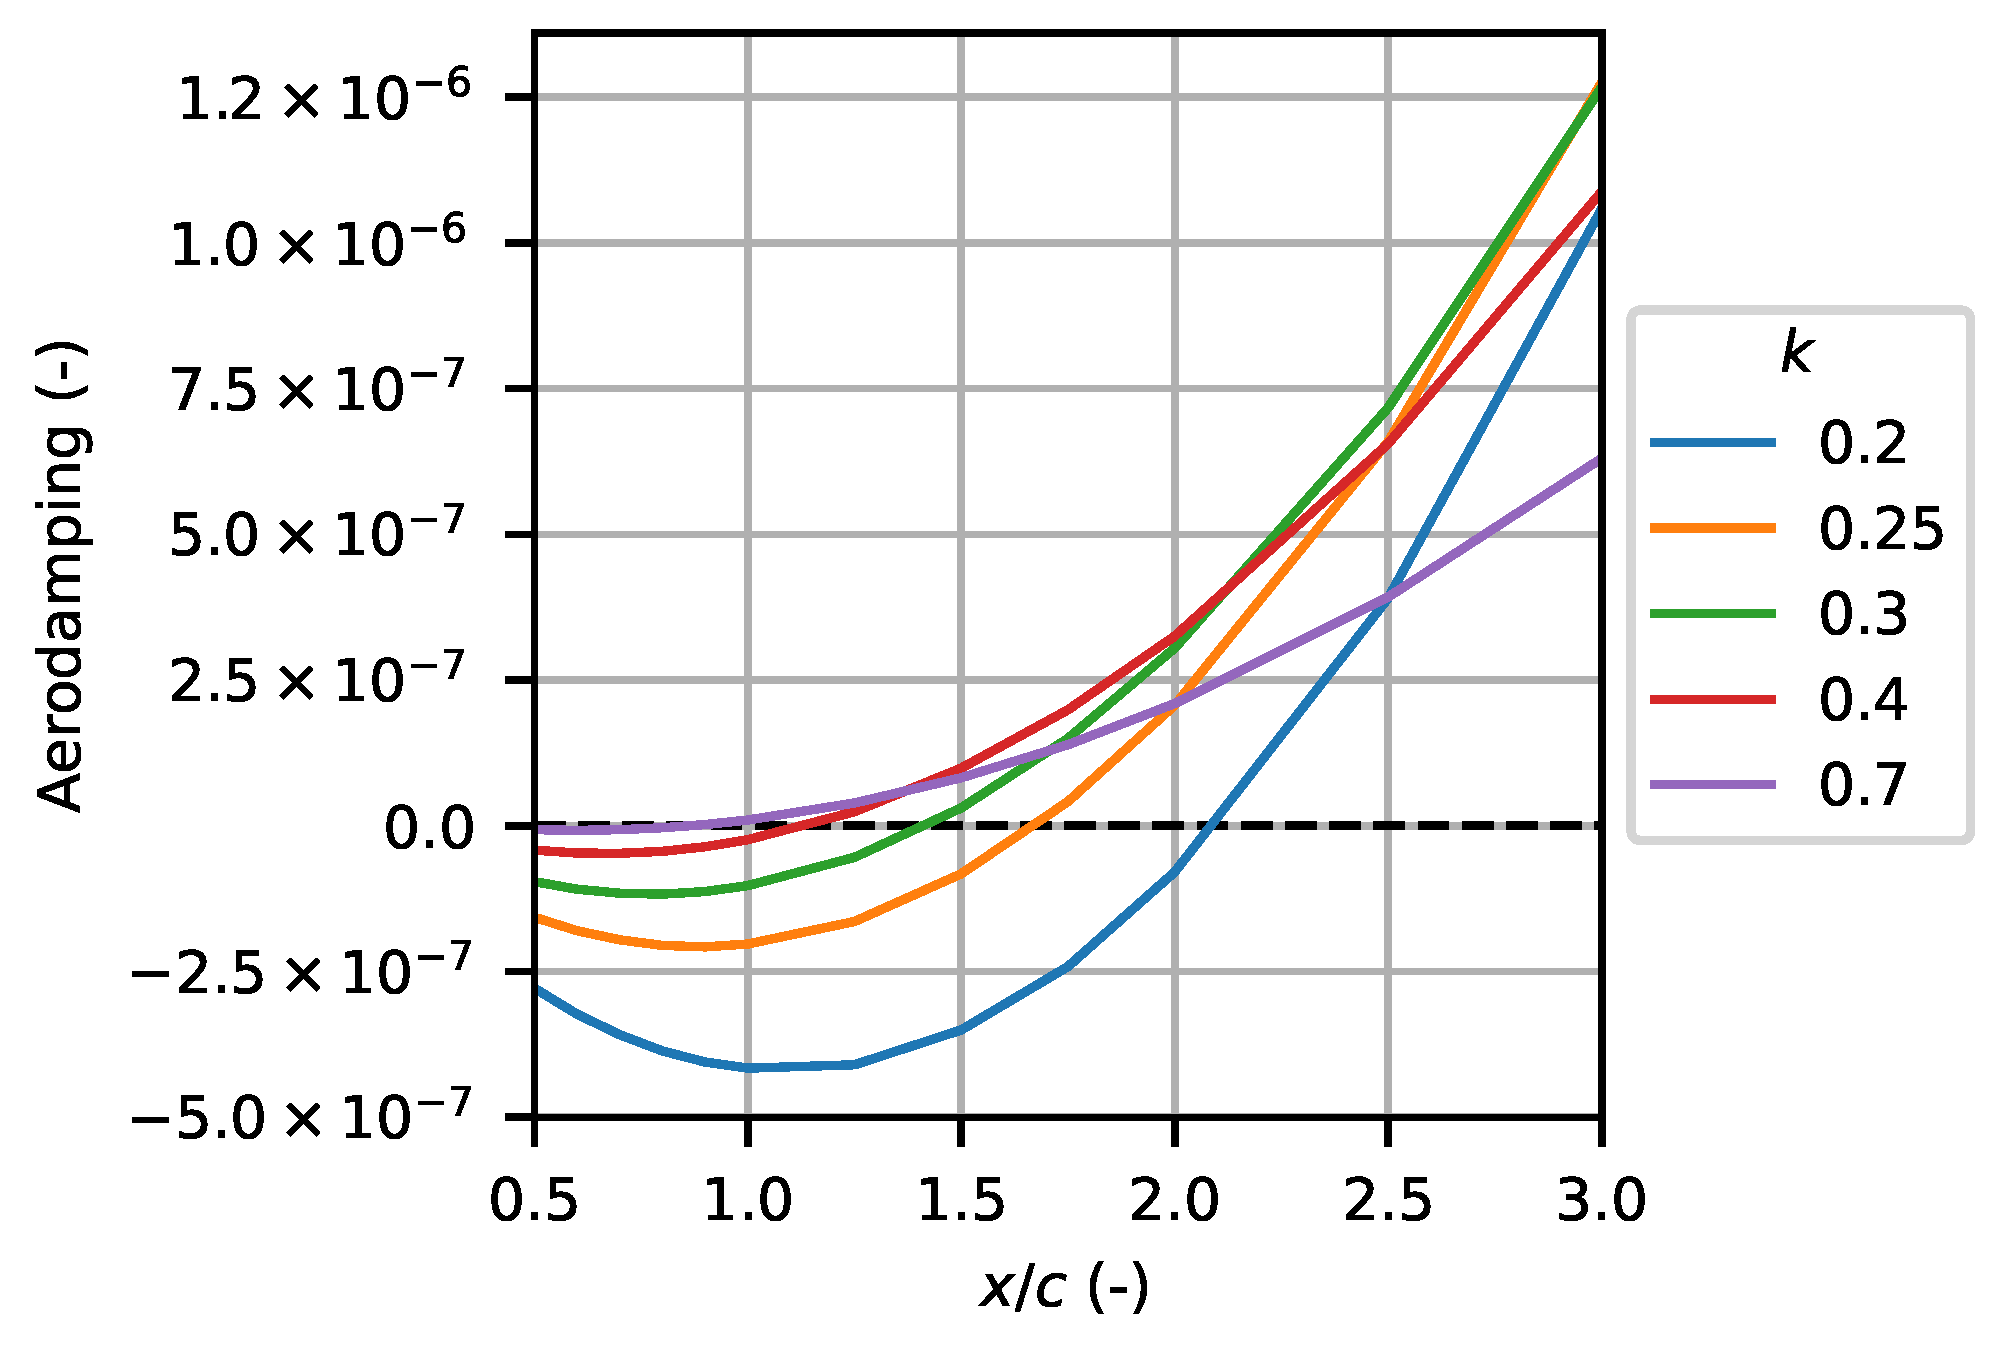
7.3. Influence of Torsion Axis Location
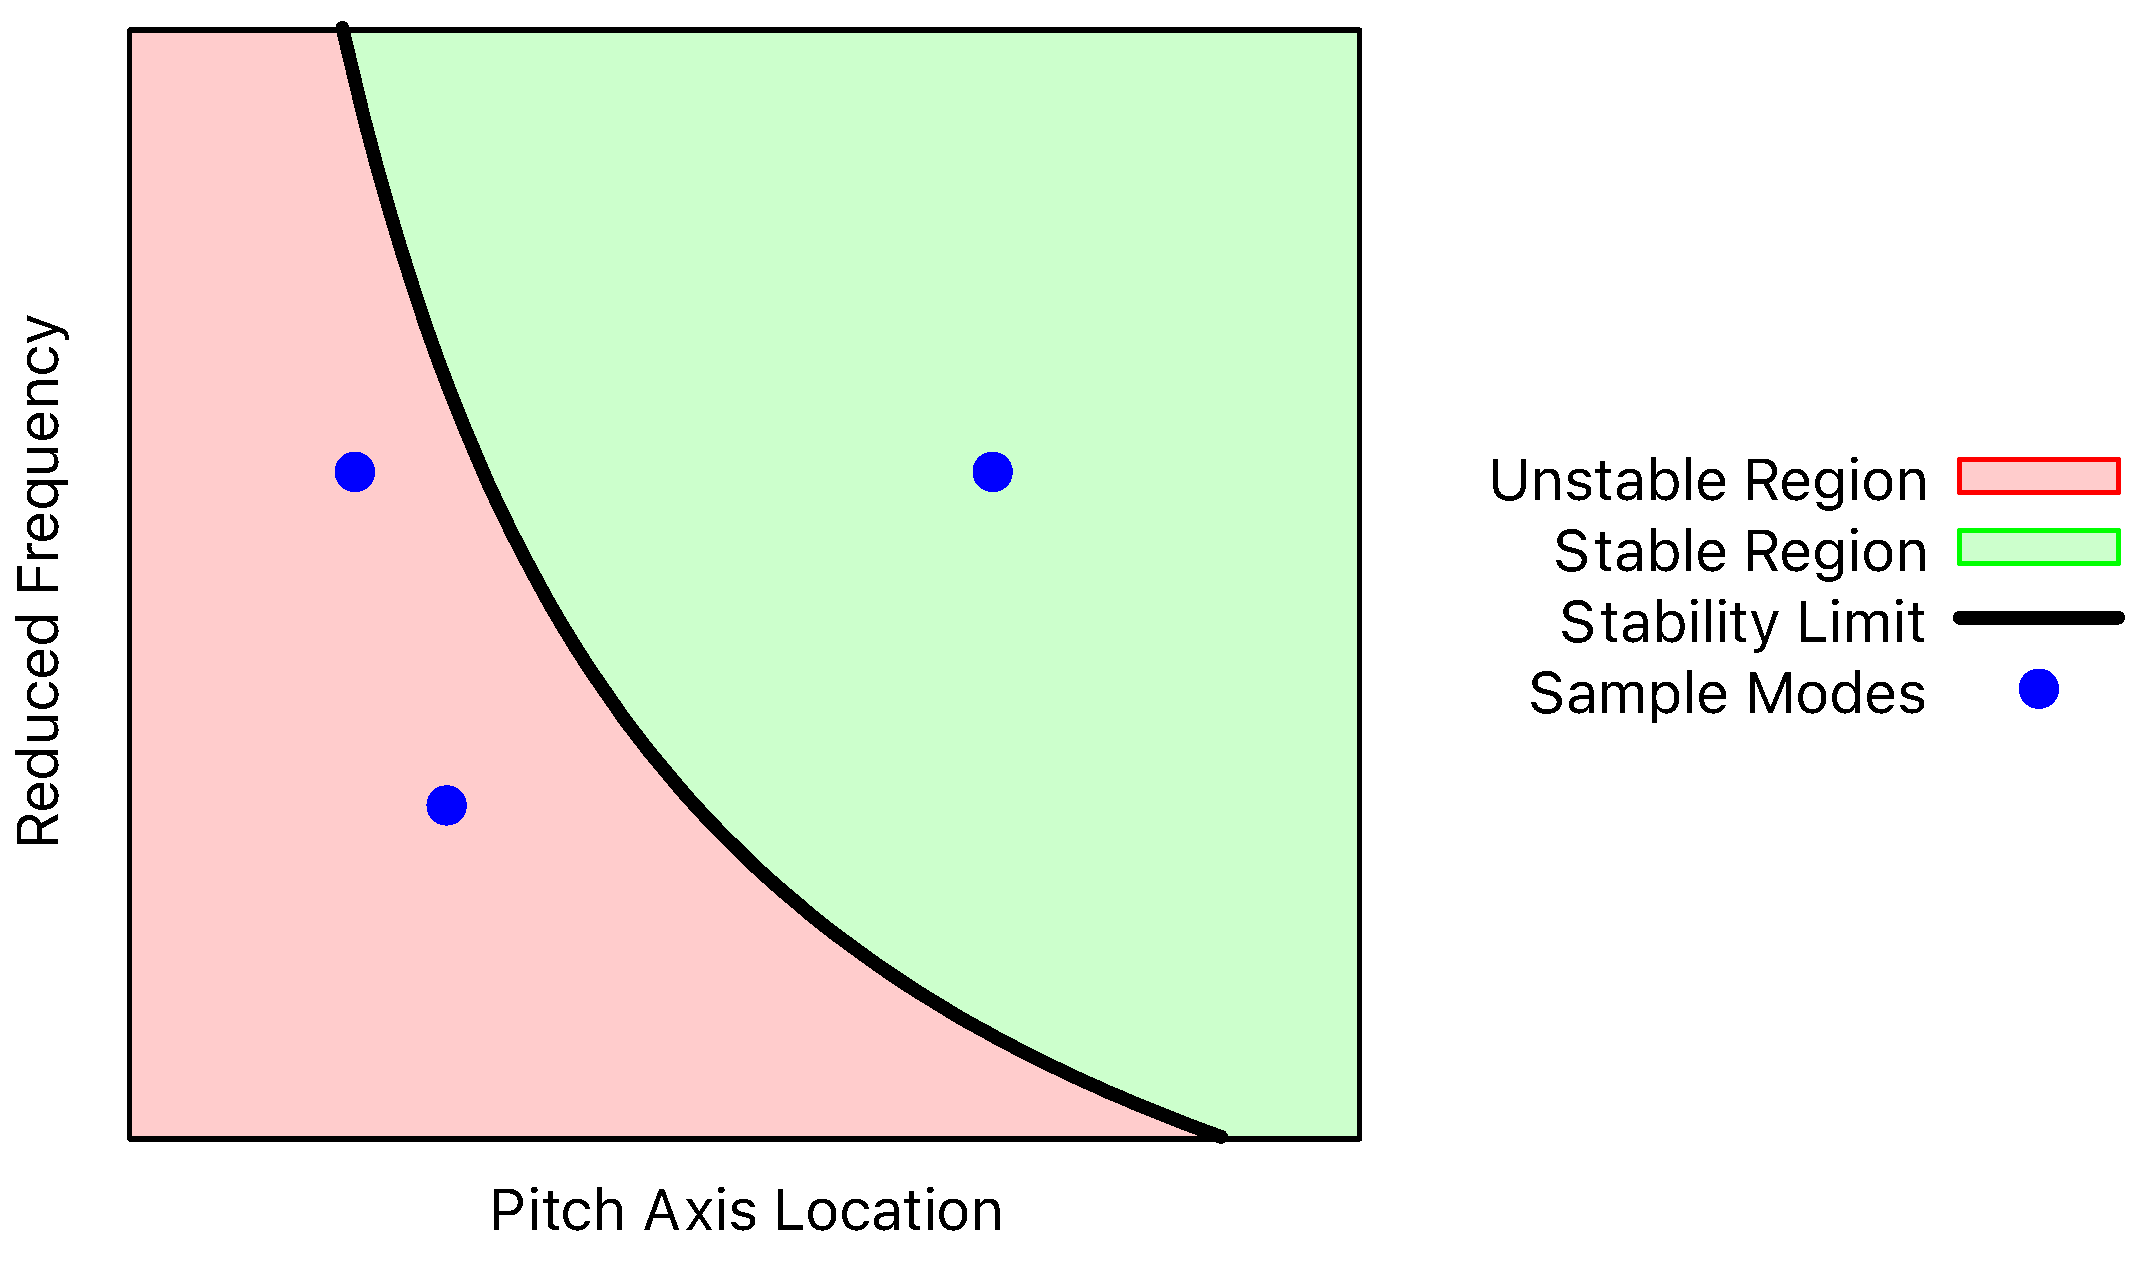
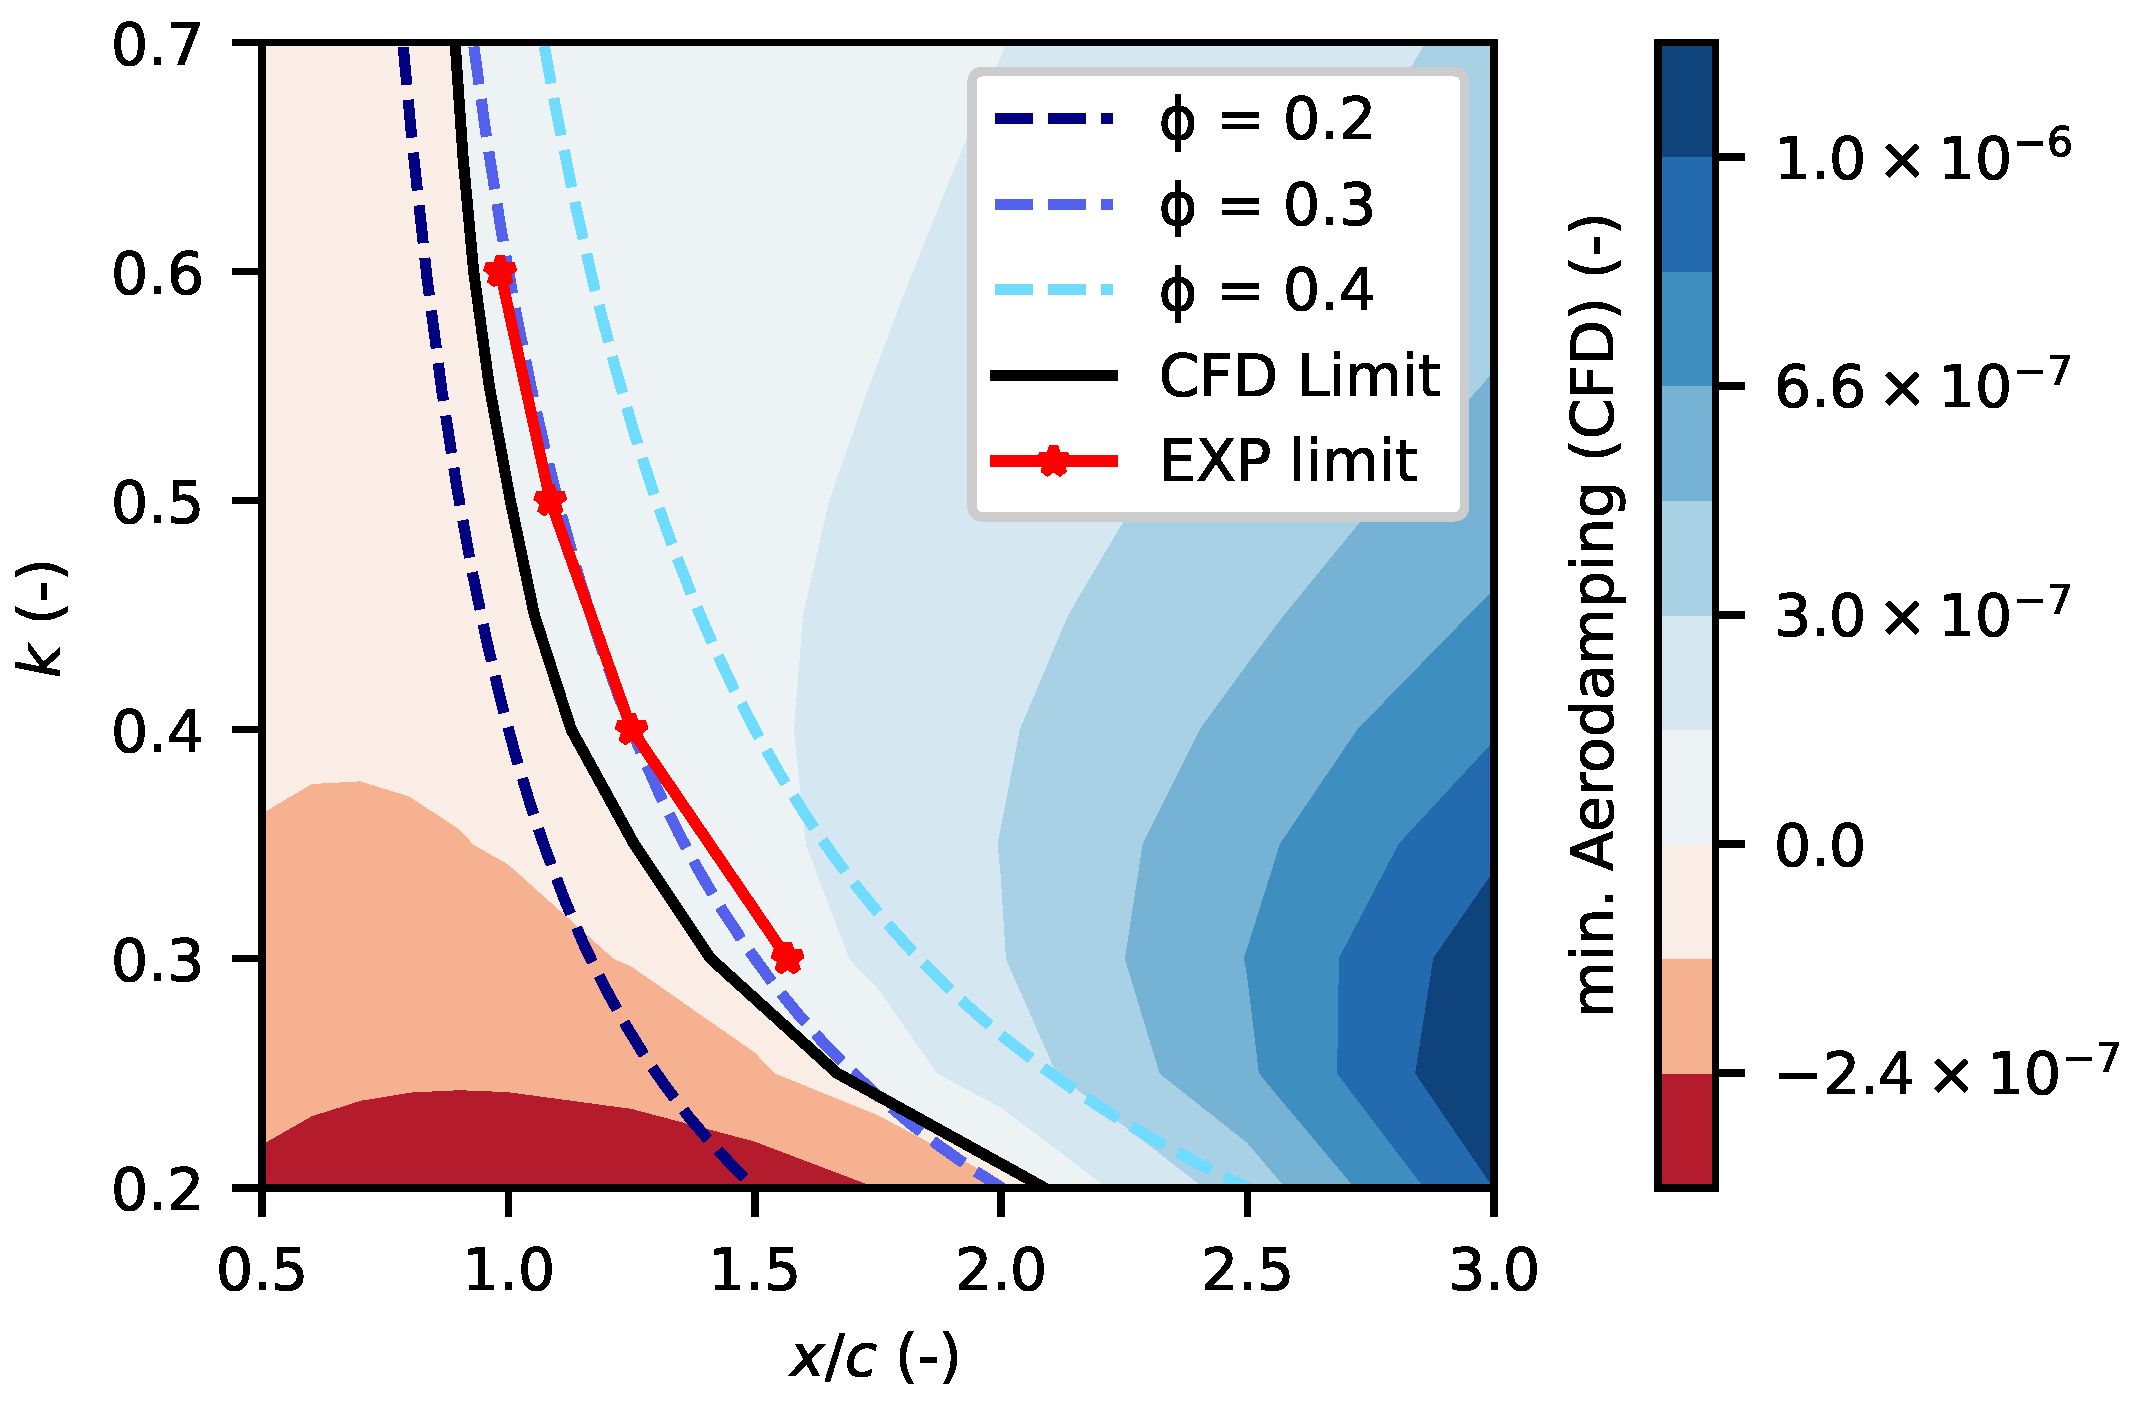
7.4. Stability Map
7.5. Discussion
8. Conclusions
Author Contributions
Funding
Institutional Review Board Statement
Informed Consent Statement
Data Availability Statement
Acknowledgments
Conflicts of Interest
Nomenclature
| 1F | First Flap Blade Mode |
| AIC | Aerodynamic Influence Coefficient |
| IBPA | Inter Blade Phase Angle |
| ND | Nodal Diameter |
| RANS | Reynolds Averaged Navier-Stokes |
| SDOF | Single Degree of Freedom |
| PS | Pressure Side |
| SS | Suction Side |
| VBM | Vibrating Blade Module |
| Aerodynamic Damping Ratio | |
| Plunge Incidence Amplitude | |
| Pitch Incidence Amplitude | |
| Stagger Angle | |
| Plunge-to-Pitch Incidence Ratio | |
| c | Chord |
| f | Vibration Frequency |
| k | Reduced frequency, |
| M | Mach Number |
| s | Pitch |
| u | Inlet Flow Velocity |
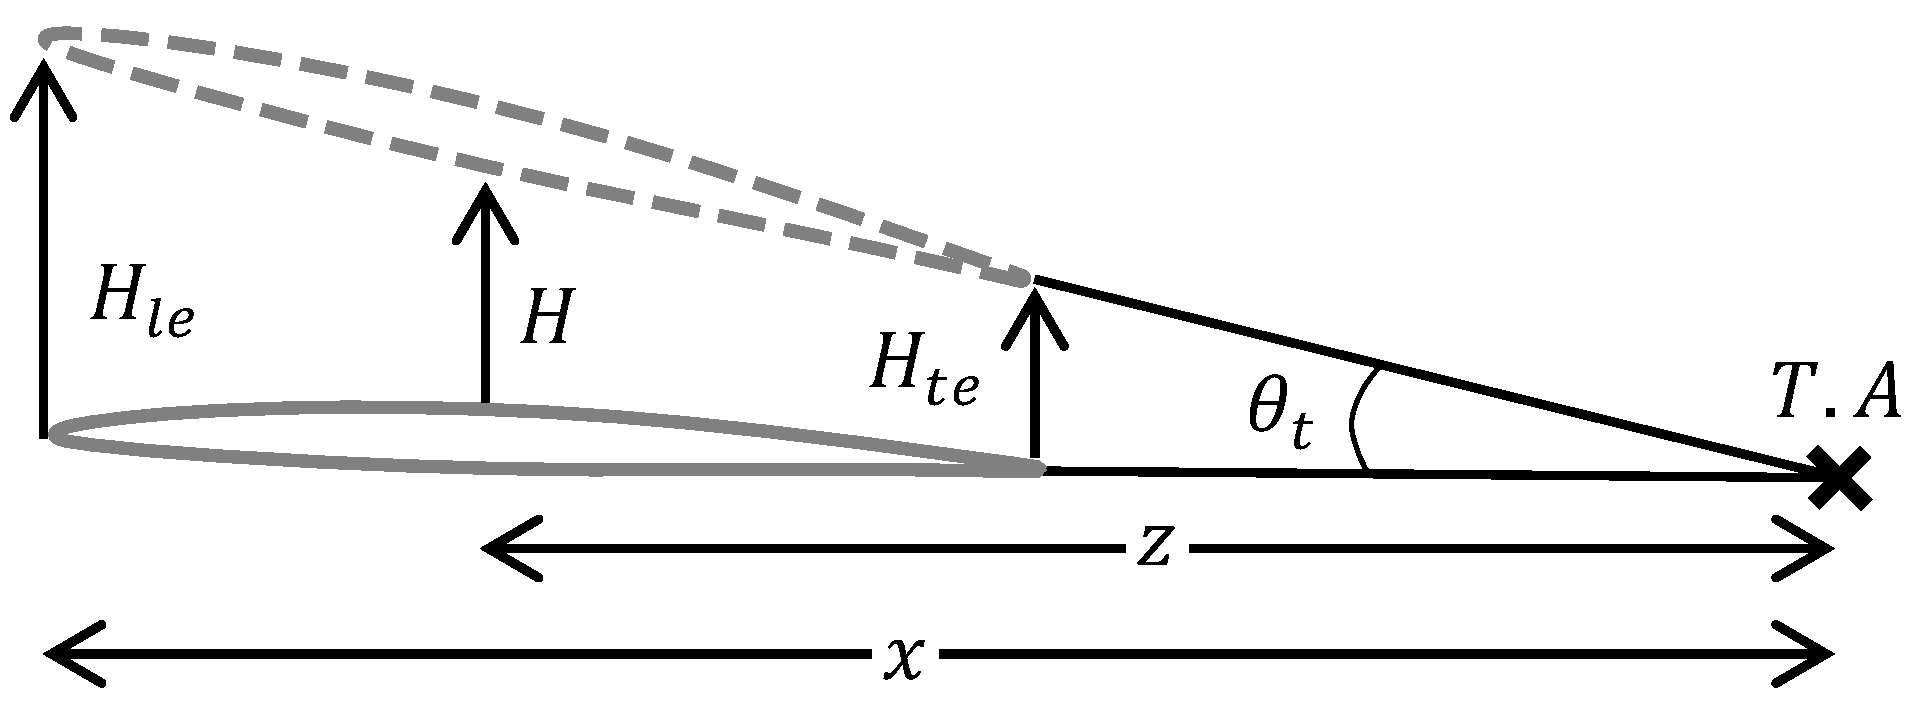
| x | Pitch Axis Location |
| z | Lever Length |
References
- Whitehead, D.S. The Effect of Compressibility on Unstalled Torsional Flutter. Aeronautical Research Council Reports & Memoranda. 1974, Volume 3754. Available online: https://reports.aerade.cranfield.ac.uk/handle/1826.2/3032 (accessed on 10 November 2021).
- Halliwell, D. Fan Supersonic Futter: Prediction and Test Analysis. Aeronautical Research Council Reports & Memoranda. 1975, Volume 3789. Available online: https://reports.aerade.cranfield.ac.uk/handle/1826.2/3068 (accessed on 5 November 2021).
- Vahdati, M.; Cumpsty, N. Aeroelastic Instability in Transonic Fans. J. Eng. Gas Turbines Power 2015, 138, 022604. [Google Scholar] [CrossRef]
- Panovsky, J.; Kielb, R.E. A Design Method to Prevent Low Pressure Turbine Blade Flutter. J. Eng. Gas Turbines Power 2000, 122, 89–98. [Google Scholar] [CrossRef]
- Zhao, F. Impact of mode shape and acoustic gust on blade flutter stability. In Proceedings of the 15th International Symposium on Unsteady Aerodynamics, Aeroacoustics & Aeroelasticity of Turbomachines, ISUAAAT, Oxford, UK, 24–27 September 2018; pp. 1–10. [Google Scholar]
- Whitehead, D.S. Force and Moment Coefficients for Vibrating Aerofoils in Cascade. Aeronautical Research Council Reports & Memoranda. 1962, Volume 3254. Available online: https://reports.aerade.cranfield.ac.uk/handle/1826.2/3828 (accessed on 20 November 2021).
- Nipkau, J.; Power, B.; Jordan, M. Aeromechanical design and test of a modern highly loaded fan. In Proceedings of the ASME Turbo Expo 2017: Turbomachinery Technical Conference and Exposition, Charlotte, NC, USA, 26–30 June 2017; Volume 2, pp. 1–11. [Google Scholar] [CrossRef]
- Lee, K.B.; Wilson, M.; Vahdati, M. Numerical study on aeroelastic instability for a low-speed fan. J. Turbomach. 2017, 139, 071004. [Google Scholar] [CrossRef]
- Carta, F.O. Unsteady Gapwise Periodicity of Oscillating Cascaded Airfoils. In Proceedings of the ASME 1982 International Gas Turbine Conference and Exhibit. American Society of Mechanical Engineers, London, UK, 18–22 April 1982; pp. 1–15. [Google Scholar] [CrossRef] [Green Version]
- Malzacher, L.; Geist, S.; Peitsch, D.; Hennings, H. A Low Speed Compressor Test Rig for Flutter Investigations. In Proceedings of the Volume 7B: Structures and Dynamics, American Society of Mechanical Engineers, Seoul, Korea, 13–17 June 2016; pp. 1–12. [Google Scholar] [CrossRef]
- Sayma, A.; Vahdati, M.; Imregun, M. An Integrated Nonlinear Approach for Turbomachinery Forced Response Prediction. Part 1: Formulation. J. Fluids Struct. 2000, 14, 87–101. [Google Scholar] [CrossRef] [Green Version]
- Vahdati, M.; Simpson, G.; Imregun, M. Mechanisms for wide-chord fan blade flutter. J. Turbomach. 2011, 133, 041029. [Google Scholar] [CrossRef]
- Stapelfeldt, S.; Vahdati, M. On the importance of engine- representative models for fan flutter predictions. J. Turbomach. 2018, 140, 081005. [Google Scholar] [CrossRef]
- Lee, K.B.; Wilson, M.; Vahdati, M. Validation of a numerical model for predicting stalled flows in a low-speed fan-Part I: Modification of Spalart-Allmaras turbulence model. J. Turbomach. 2018, 140, 051008. [Google Scholar] [CrossRef]
- Hanamura, Y.; Tanaka, H.; Yamaguchi, K. A Simplified Method to Measure Unsteady Forces Acting on the Vibrating Blades in Cascade. Bull. JSME 1980, 23, 880–887. [Google Scholar] [CrossRef] [Green Version]
- Crawley, E.F.; Hall, K.C. Optimization and mechanisms of mistuning in cascades. J. Eng. Gas Turbines Power 1985, 107, 418–426. [Google Scholar] [CrossRef]


| Mach number (-) | 0.087 |
| Reynolds number (-) | 300,000 |
| Incidence angle (deg) | 2 |
| Reduced frequency range (-) | 0.2–0.7 |
| Normalised torsion axis location (-) | 0.5–3 |
Publisher’s Note: MDPI stays neutral with regard to jurisdictional claims in published maps and institutional affiliations. |
© 2022 by the authors. Licensee MDPI, Basel, Switzerland. This article is an open access article distributed under the terms and conditions of the Creative Commons Attribution (CC BY-NC-ND) license (https://creativecommons.org/licenses/by-nc-nd/4.0/).
Share and Cite
Hill, G.; Gambel, J.; Schneider, S.; Peitsch, D.; Stapelfeldt, S. Aeroelastic Stability of Combined Plunge-Pitch Mode Shapes in a Linear Compressor Cascade. Int. J. Turbomach. Propuls. Power 2022, 7, 7. https://0-doi-org.brum.beds.ac.uk/10.3390/ijtpp7010007
Hill G, Gambel J, Schneider S, Peitsch D, Stapelfeldt S. Aeroelastic Stability of Combined Plunge-Pitch Mode Shapes in a Linear Compressor Cascade. International Journal of Turbomachinery, Propulsion and Power. 2022; 7(1):7. https://0-doi-org.brum.beds.ac.uk/10.3390/ijtpp7010007
Chicago/Turabian StyleHill, George, Julian Gambel, Sabine Schneider, Dieter Peitsch, and Sina Stapelfeldt. 2022. "Aeroelastic Stability of Combined Plunge-Pitch Mode Shapes in a Linear Compressor Cascade" International Journal of Turbomachinery, Propulsion and Power 7, no. 1: 7. https://0-doi-org.brum.beds.ac.uk/10.3390/ijtpp7010007