Evaluation of Content Dissemination Strategies in Urban Vehicular Networks
by
 , , and
Gonçalo Pessoa
1,2, 
Lucas Guardalben
1,
Miguel Luís
1,3,*,
Carlos Senna
1 and
and
Susana Sargento
1,2 1
Instituto de Telecomunicações, 3810-193 Aveiro, Portugal
2
Departamento de Eletrónica, Telecomunicações e Informática, University of Aveiro, 3810-193 Aveiro, Portugal
3
ISEL-Instituto Superior de Engenharia de Lisboa, Instituto Politécnico de Lisboa, 1959-007 Lisboa, Portugal
*
Author to whom correspondence should be addressed.
Information 2020, 11(3), 163; https://0-doi-org.brum.beds.ac.uk/10.3390/info11030163
Submission received: 14 February 2020
/
Revised: 6 March 2020
/
Accepted: 16 March 2020
/
Published: 19 March 2020
(This article belongs to the Special Issue Vehicle-To-Everything (V2X) Communication)
Abstract
:The main drivers for the continuous development of Vehicular ad-hoc Networks (VANETs) are safety applications and services. However, in recent years, new interests have emerged regarding the introduction of new applications and services for non-urgent content (e.g., videos, ads, sensing and touristic information) dissemination. However, there is a lack of real studies considering content dissemination strategies to understand when and to whom the content should be disseminated using real vehicular traces gathered from real vehicular networks. This work presents a realistic study of strategies for dissemination of non-urgent content with the main goal of improving content delivery as well as minimizing network congestion and resource usage. First, we perform an exhaustive network characterization. Then, several content strategies are specified and evaluated in different scenarios (city center and parking lot). All the obtained results show that there are two content distribution strategies that clearly set themselves apart due to their superior performance: Local Rarest Bundle First and Local Rarest Generation First.
1. Introduction
The last couple of decades have been the stage for the introduction of new telecommunication networks. It is expected that in the future, all types of vehicles, such as cars, buses and trucks, will have the ability to form a network of connected vehicles. A practical example of this near future is a global-level vehicular communication platform which comprises more than 600 vehicles (taxis, trucks and buses) and fixed stations located in the city of Porto, Portugal [1,2,3].
The concept of content distribution is an older trend and a well-established service in the wired networks. In this type of networks several client-server schemes have been proposed and successfully implemented. The next step will be to apply the same functionalities in a vehicular environment for software updates, ads and tourism videos distribution, as examples. However, vehicular networks display special characteristics when compared to other networks due to their continuous node mobility and their wide geographical dispersion. Therefore, the main challenges are the intermittent connectivity and the long and variable delay in information delivery due to permanent network fragmentation and node mobility. These challenges limit the spectrum of possible vehicular network services and applications. Services that involve low transmission latencies and a stable path between the sender and the receiver face many challenges and need to resort to different technologies (e.g., cellular networks) that typically imply a higher service price.
A concept that aims to provide an end-to-end connectivity between network nodes in harsh environments such as the vehicular one is the Delay-Tolerant Network (DTN). A vehicular network applying the DTN concept to carry-and-forward data expands the portfolio of applications, introducing new services such as content distribution of non-urgent information. By studying and designing how data can be efficiently disseminated on vehicular networks, through the vehicles as content distribution nodes in the network, it is crucial to have tools that reproduce exactly the environment and the vehicles movements to further provide an efficient transition to a real network context. In this paper, we contribute to the endeavor of studying dissemination strategies for non-urgent content through a vehicular network to improve content delivery as well as minimizing network congestion and resource usage. Three dissemination strategies are implemented and evaluated in different scenarios, e.g., city center and parking lot, and they include: (1) a strategy that replicates the content that has traversed the least number of hops, LNHF; (2) a strategy that replicates the rarest content in the vehicle’s neighborhood, LRBF; and (3) a strategy that combines the concept of network coding and content distribution, replicating the rarest code generation in the vehicle’s neighborhood, LRGF. To support this realistic study, we use mOVERS [4], an emulator capable of recreating scalable vehicular scenarios of content distribution in vehicular networks, which replicates the same software of the vehicular On-Board Units (OBUs), and integrates real vehicular network data such as mobility of vehicles and connectivity. This emulator works with mOVE (mobile Opportunistic VEhicular) DTN platform, and it contains a base opportunistic approach for data dissemination that can be used to develop, test and evaluate routing mechanisms and data delivery strategies for both data gathering through vehicles, and content distribution strategies from the infrastructure to the vehicles, using vehicles as content delivery nodes. The results show that there are two content distribution strategies that clearly set themselves apart due to their superior performance: LRBF and LRGF. These strategies have delivery rates that are much higher than LNHF strategy, and lead to less network congestion. However, these strategies require additional control information to perform their dissemination decisions, which increases the network overhead. In terms of delivery rate and delay, the overall best strategy is LRBF, making this strategy a safe choice for the content distribution in a vehicular environment. The evaluated strategies show greater potential in situations where the dissemination of a specific content to all vehicles is reasonable. One of them is the dissemination of vehicular contents related with the transportation services implementing the vehicular network. Another example is the dissemination of news during rush hours that cause high consumption of the bandwidth. The other scenario might be related with the dissemination of over-the-air updates regarding the software or firmware’s equipment. Even though not all nodes want such information, our strategies work under the worst-case scenario, where we must attend to all vehicles. Although some nodes are excluded, we are decreasing the latency, and possibly, increasing the delivery rate over time. The main findings and contributions of this paper are emphasized as follows:
- the design of dissemination strategies to choose forwarding information over urban and parking lot scenarios that (i) replicates the content that has travelled the least number of hops; (ii) replicates the rarest content in the vehicle’s vicinity; and (iii) combines the concept of network coding and content distribution, replicating the rarest code generation in the vehicle’s vicinity;
- the evaluation, using real traces of mobility and network connectivity of a 24-h periods obtained from a vehicular network with more than 600 vehicles, in Porto city (public buses, garbage trucks, and municipality vehicles), of three dissemination strategies;
- the evaluation and analysis of the three dissemination strategies following two distinct mobile scenarios with different mobility and connectivity patterns.
The remaining of the paper is organized as follows. Section 2 overviews the related literature about content dissemination strategies. Section 3 details the evaluated dissemination strategies. In Section 4 we assess the performance of the dissemination strategies using real traces of an urban vehicular over two distinct time periods and network characteristics. Finally, conclusions are drawn in Section 5.
2. Related Work
In a vehicular network, the IEEE 802.11p protocol is standardized as an amendment to the IEEE 802.11 to support WAVE communications. However, it is still an open research topic and challenges on mobility, link stability and network density are identified as critical factors for disseminating content in vehicular networks, which can lead to link’s disruption and intermittent connectivity, as well-explained in [5,6,7]. At first glance, a feasible solution for content dissemination in vehicular environments is a P2P file sharing mechanism, where multiple vehicles might be able to download parts of the content through the VANET fixed infrastructure and exchange those pieces to other vehicles in order to complete the file download [8,9].
Coast et al. [10] presents an analysis of the dissemination protocol based on complex networks’ metrics for urban VANET scenarios, called DDRX. In DDRX each vehicle must build a subgraph to identify the relay node to continue the dissemination process. To build this graph vehicles must have topology knowledge of a set of nearby vehicles, e.g., 1 and 2-hops neighbors, to improve the performance for data dissemination. Based on this local graph, the relay nodes are selected based on complex networks’ metrics. Li et al. [11] proposed a connectivity-aware data dissemination protocol based on node forwarding capacity estimation for partially connected VANETs. CADD, the proposed protocol, has as its strong point the metric that is constructed by the integration of the throughput function estimation with the active connection time estimation. It is an interesting solution but evaluated only through simulation and not verified in real conditions. Sospeter et al. [12] present an adaptive probability data dissemination protocol (EEAPD) that comprises a delay scheme and probabilistic approach. The redundancy ratio metric is used to explain the correlation between road segments and vehicles’ density in rebroadcast probability decisions. The EEAPD takes into account the number of road segments to decide which nodes are suitable for rebroadcasting the emergency message. However, it is directed only to emergency messages, and it requires updated knowledge. Zhang et al. [13] have conducted a simulation study about collaborative content distribution uses V2V communication to distribute large files across the vehicular networks, which the main objective was to verify the feasibility of a hybrid cellular and V2V collaborative content distribution network. Reference [14] uses RSUs to support a cooperative caching for content dissemination in vehicular networks. By allocating the suitable subset of contents in each RSU cache can maximizes the hit ratio of vehicles requests. A single hop cooperative content dissemination protocol that takes advantage of Vehicle-to-Vehicle (V2V) communication links to distribute data across a network with reduced costs is presented in [15], where the dissemination always starts from RSUs (V2I).
Unlike prior strategies, our focus is to guarantee that vehicles are aware of their vicinity storage content to select the least available packet. However, the strategies here evaluated use only information from the immediate neighbors (1-hop) causing less network overhead and addressing some challenges related with the broadcast storm [16]. Some of the works proposed in the literature rely also on random linear network coding to overcome the peer and piece selection challenge [17]. In this work, we too evaluate a dissemination strategy based on network coding, where the focus is not to exchange all the vehicles content storage, but to advertise the percentage of packets delivered in a generation, and send only a sufficient number of coded packets instead of the specific missing packets.
On the other hand, content dissemination with special focus on next-generation 5G automotive [18] has high availability and considerably high throughput, and these networks have been studied as a mean to disseminate information using a -vehicular network infrastructures [19]. However, the use of cellular networks brings additional challenges and drawbacks that must be considered in the design of content dissemination schemes. Gerla et al. [8] identified three main challenges, which rely on the (i) the fact that cellular networks use point-to-point dedicated channels which may be noisy and lossy leading to problems related with the TCP window; (ii) the spectrum associated with those networks is limited and its expansion is very expensive; and (iii) the most relevant drawback is the high connection cost when compared to the WAVE technology or even with WiFi. The high cost associated with those technologies does not justify their use for non-urgent content download. However, as a future insight it is important to understand that these technologies may support the introduction of new emergent services and applications, with its associated challenges; for example, in car overtaking scenarios, the instant information (e.g., GPS current position, traffic signals, vehicles front/rear video streaming, …) will make all the difference in order to support a safe car overtaking decision.
There has been some research work that considered vehicular content dissemination through real mobility traces [20,21]. However, due to the lack of real datasets especially using IEEE802.11p/WAVE as vehicular communication standard, these works evaluate the performance of several dissemination schemes on a micro-mobility traces, for example, the Madrid Highway vehicular mobility trace [22]. The delivered results show that a carry-and-forward version of farthest node dissemination strategy is a very promising scheme under realistic highway traffic conditions, because this scheme increases the number of receivers and distance covered by the packet at a very low cost in terms of traffic overhead and algorithmic complexity. Besides the low granularity of this dataset, the information is gathered from sensors placed along the highway. In our case, the dataset was gathered from the vehicle itself, enabling analysis of real mobility patterns, taking advantage of V2V and V2I communications in urban and parking lot scenarios [4].
3. Content Dissemination Strategies
A content dissemination strategy aims to achieve the highest delivery rate as possible, reaching many vehicles, as well as minimizing network resources consumption during the period in which the content is being disseminated. Therefore, a strategy to implement this service must be carefully designed and implemented to achieve such objectives. These goals are addressed when sender nodes (fixed and mobile) are performing routing decisions. The sender nodes must be able to decide the information to be transmitted, to which nodes, the time at which it should be sent, the goal of such content, and any other important parameters or characteristics associated with the content under dissemination and the network.
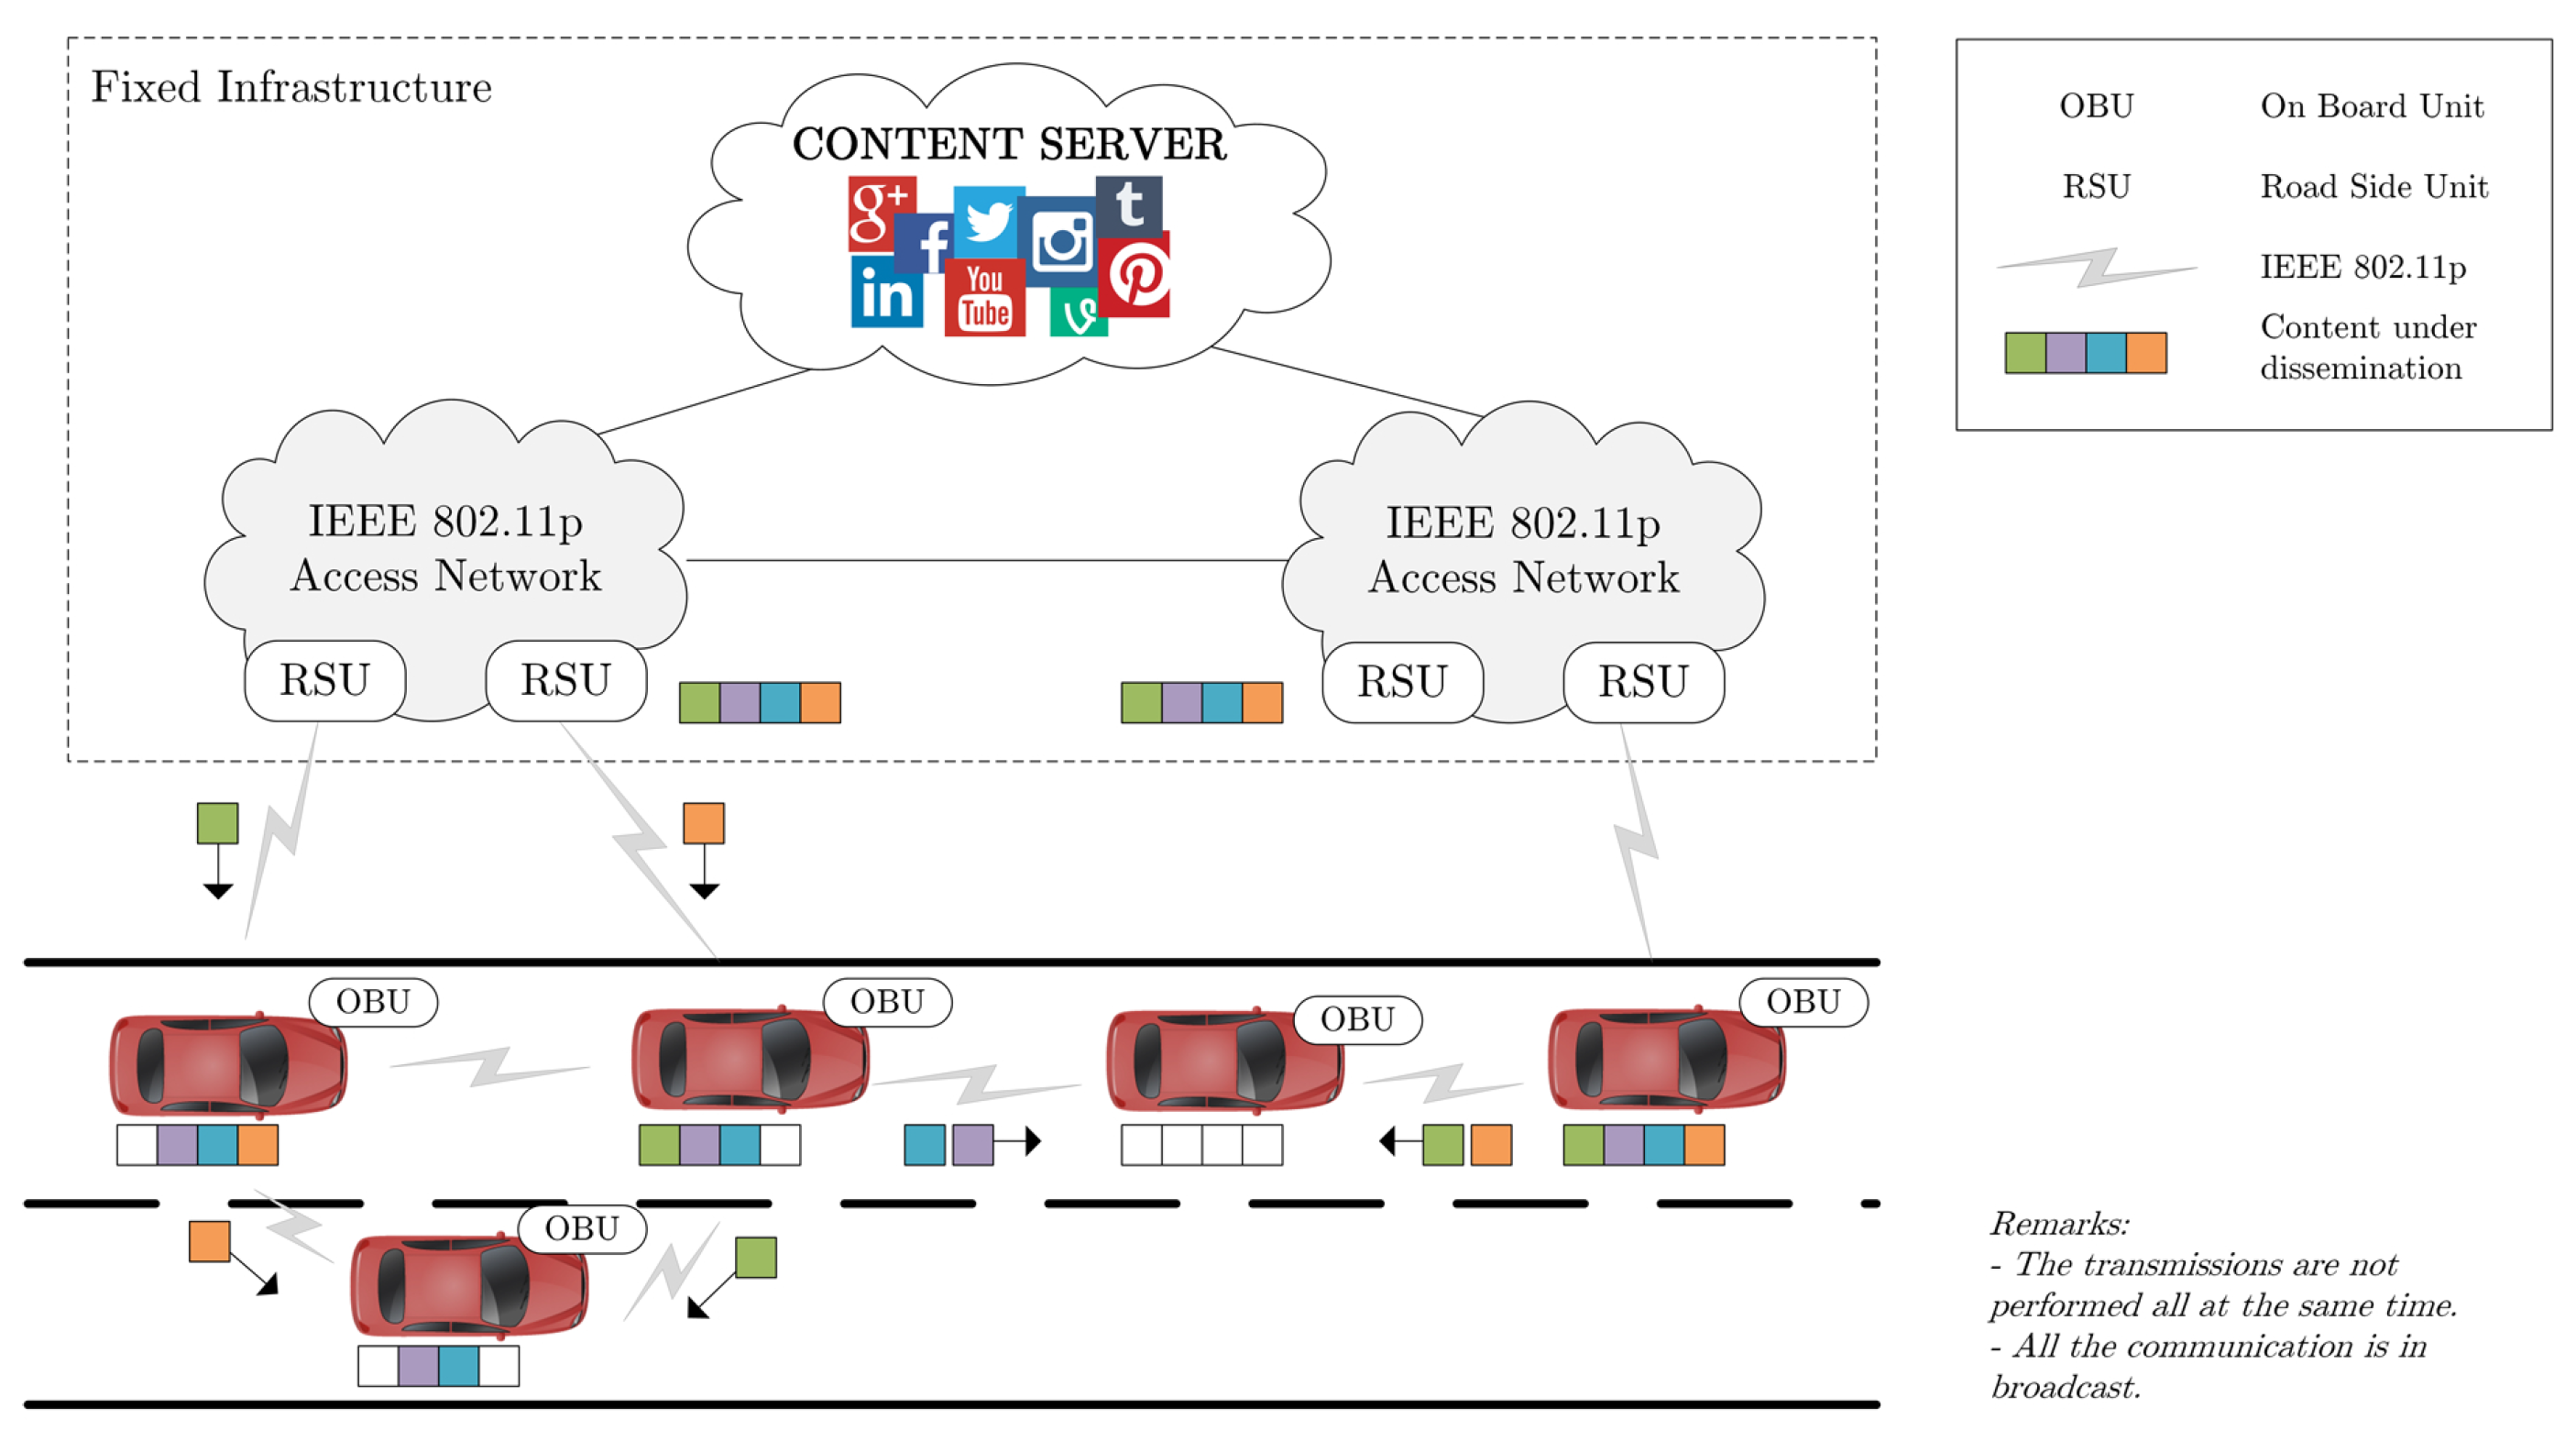
Figure 1 illustrates a dissemination process in which the content is located on remote content servers located in the fixed infrastructure, and it must be disseminated to all of the network vehicles. The permanent availability of the content is assured by the Road-Side Units (RSUs) which are directly connected to those remote servers which have the content under dissemination stored. The process of carrying, storing, and forwarding the content is under the responsibility of the vehicles, spreading it along the network using broadcast communication to reach the highest delivery rate as possible. Within this context, this work aims to deploy a non-urgent content dissemination service (e.g., advertisements, videos, and tourism-related information) distributing contents from remote servers to the network vehicles using delay-tolerant communications. As such, this study focuses on two issues: (i) which strategy should be used in order to select the packets to be sent by broadcast, and (ii) how to minimize the impact of broadcasting on network congestion and take advantage of mobility profiles in order to improve delivery.
In this work three dissemination strategies are evaluated:
- Least Number of Hops First (LNHF);
- Local Rarest Bundle First (LRBF);
- Local Rarest Generation First (LRGF).
3.1. Least Number of Hops First (LNHF)
This strategy is based on one of two specific characteristics of a packet: (i) the number of transmissions, and (ii) the number of hops. Moreover, the forwarding decision is performed according to the type of sender node (OBU or RSU).
The store, carry-and-forward mechanism is the basic concept of spreading a non-urgent content in the network using vehicles as data mules. When a node receives a useful data packet (it is from the content under dissemination and the receiver node does not have it yet), it stores it and carries this data packet until it contacts with other vehicles. When this happens, a copy of the packet is created and sent (in broadcast) to the node’s vicinity. When the neighbors receive the packet, they update its internal information about the packet number of hops. Therefore, the content dissemination procedure is based on a multi-hop transfer of data among the network vehicles, whereby the number of hops of a packet is directly related to the number of nodes which already have a specific packet. This parameter can be easily used by an OBU to decide which packet should be sent, without introducing a high network overhead (a couple of extra bytes in the data packet header should be enough to implement it).
Another important factor is the number of transmissions of a packet. As mentioned before, in a content dissemination process, the sender node forwards a copy of its locally stored data, whereby it can count how many times it creates a copy of the same data packet to be forwarded to its neighbors. The higher the number of copies (or transmissions), the higher is the probability of this packet already being stored by other nodes when compared to other packets which have a lower number of copies. Regarding this consideration, this parameter can be used as a metric in a content dissemination strategy to perform the decision of which packet should be sent.
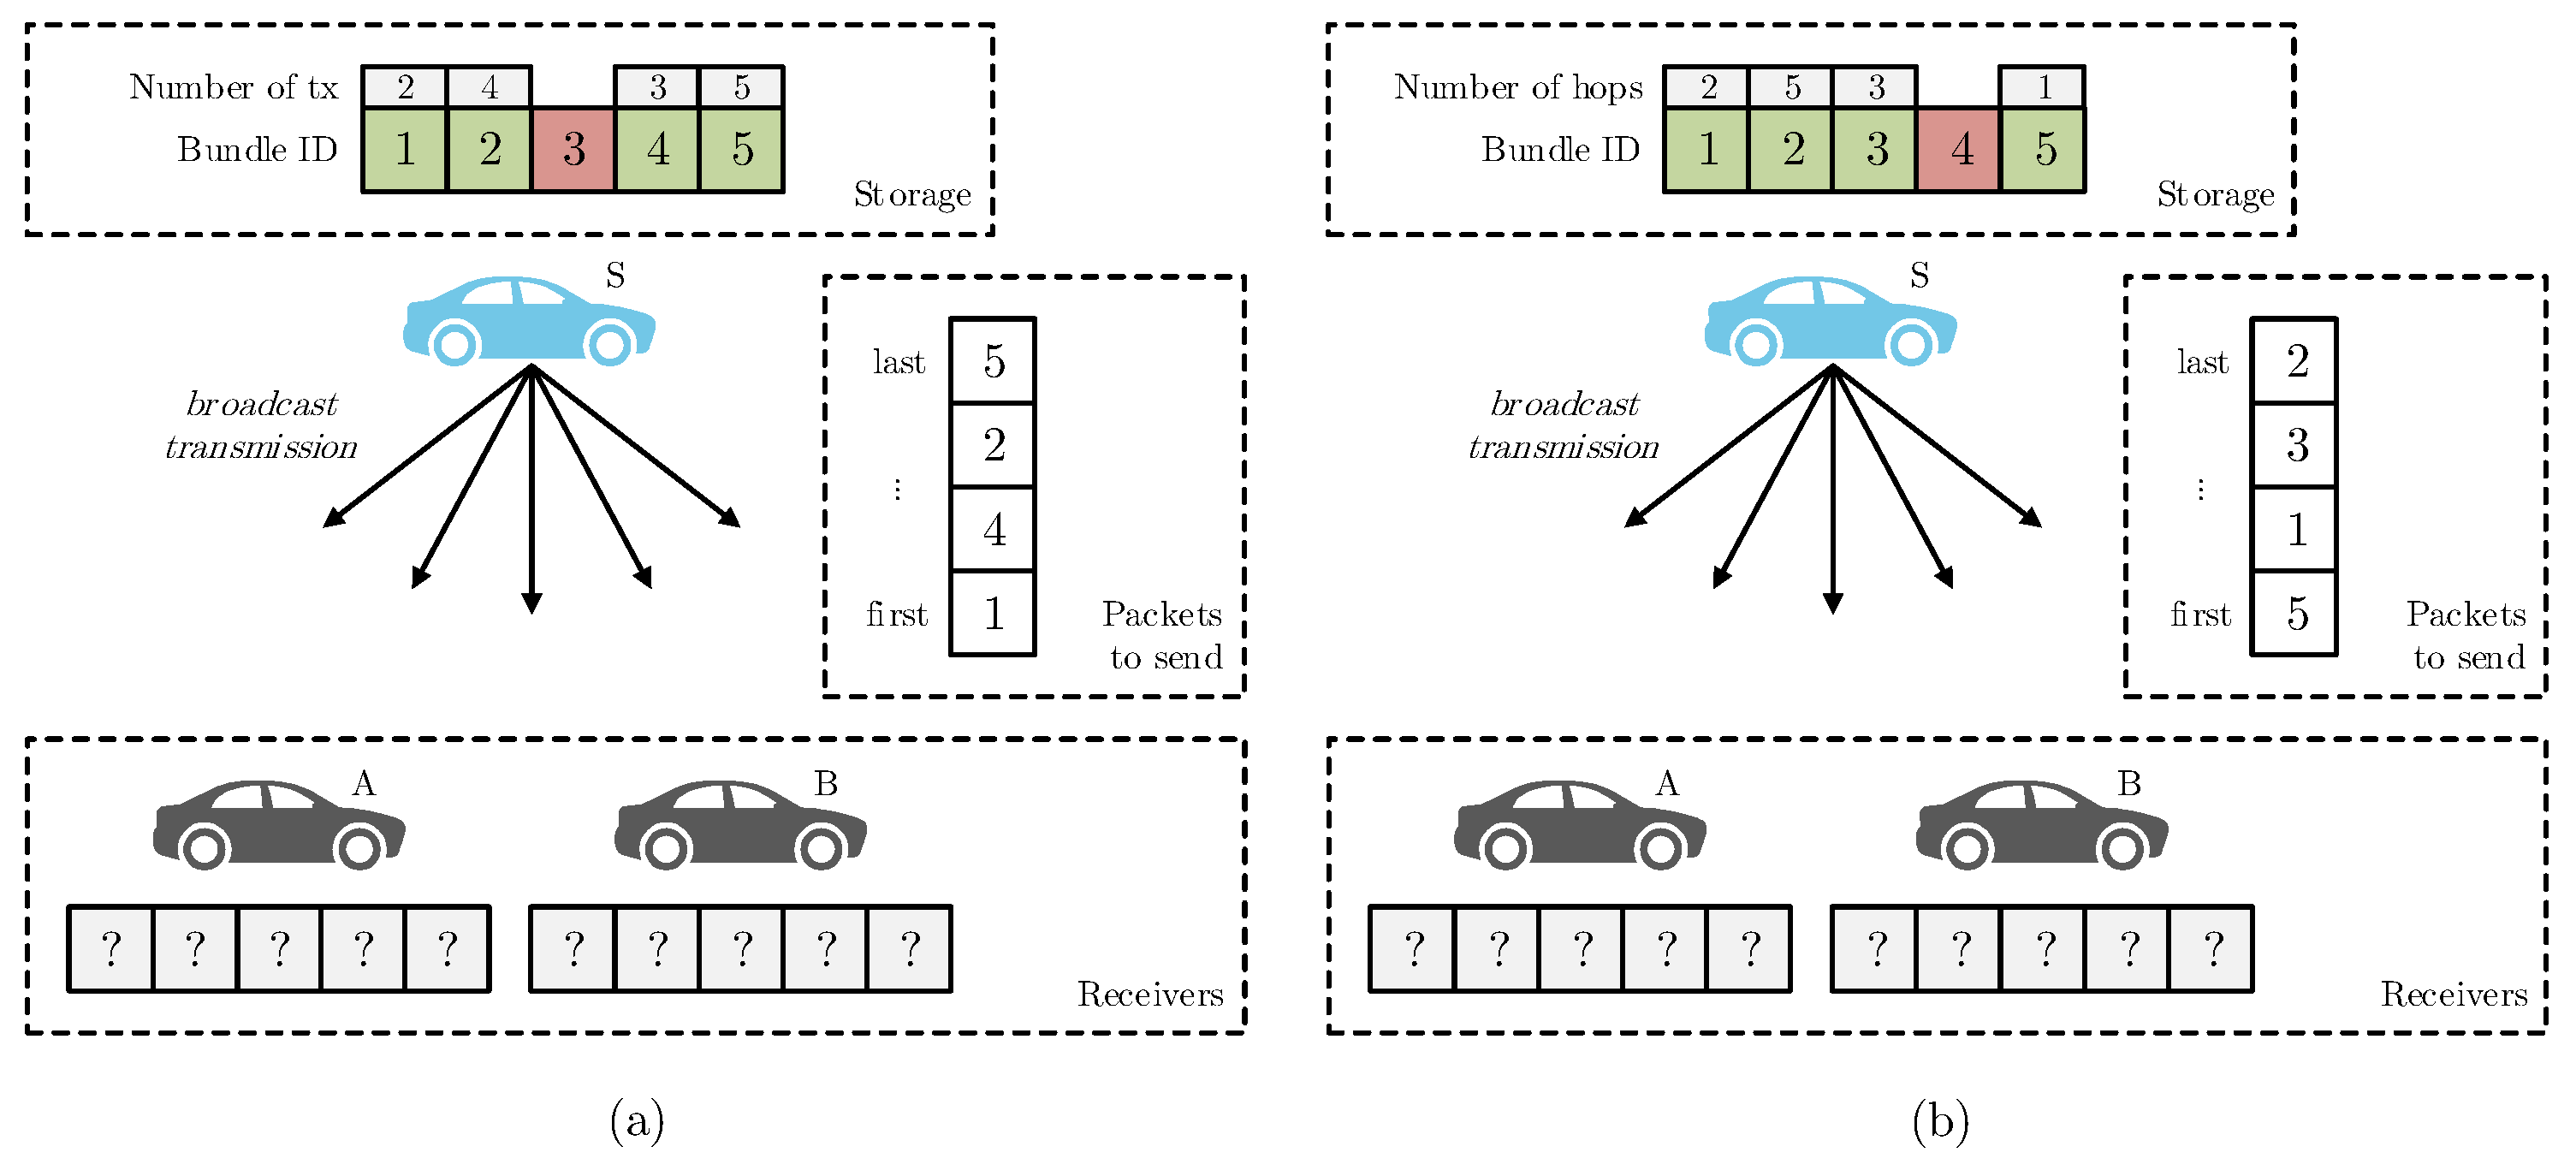
Figure 2 illustrates an example of the forwarding decision of LNHF strategy (the green color is used to represent available packets.). The sender node does not have any information about its neighbors’ storage content. Therefore, if the sender node is an RSU (Figure 2a), the packets are selected according to the number of previous transmissions, and the packets with a lower number of transmissions are forwarded first, whereby packet number 1 is sent first. On the other hand, if the sender is an OBU, the criteria is the number of previous hops. Thus, as illustrated in Figure 2b, the first packet being sent by node S is the number 5, since it is the one with fewer hops, followed by 1, 3, and 2. When a node receives a certain packet that already was stored, it updates the number of hops if the received packet has a higher number of hops than the currently stored one.
This strategy requires the addition of two new fields to store the number of hops and number of transmissions. Due to this, an increase in the network overhead is expected.
3.2. Local Rarest Bundle First (LRBF)
The design of this strategy assumes a local rarest packet first policy: the least available packet, measured in terms of the number of neighboring nodes with the packet, is selected for transmission. Thus, each sender node needs to be aware of its vicinity storage content to select the least available packet.
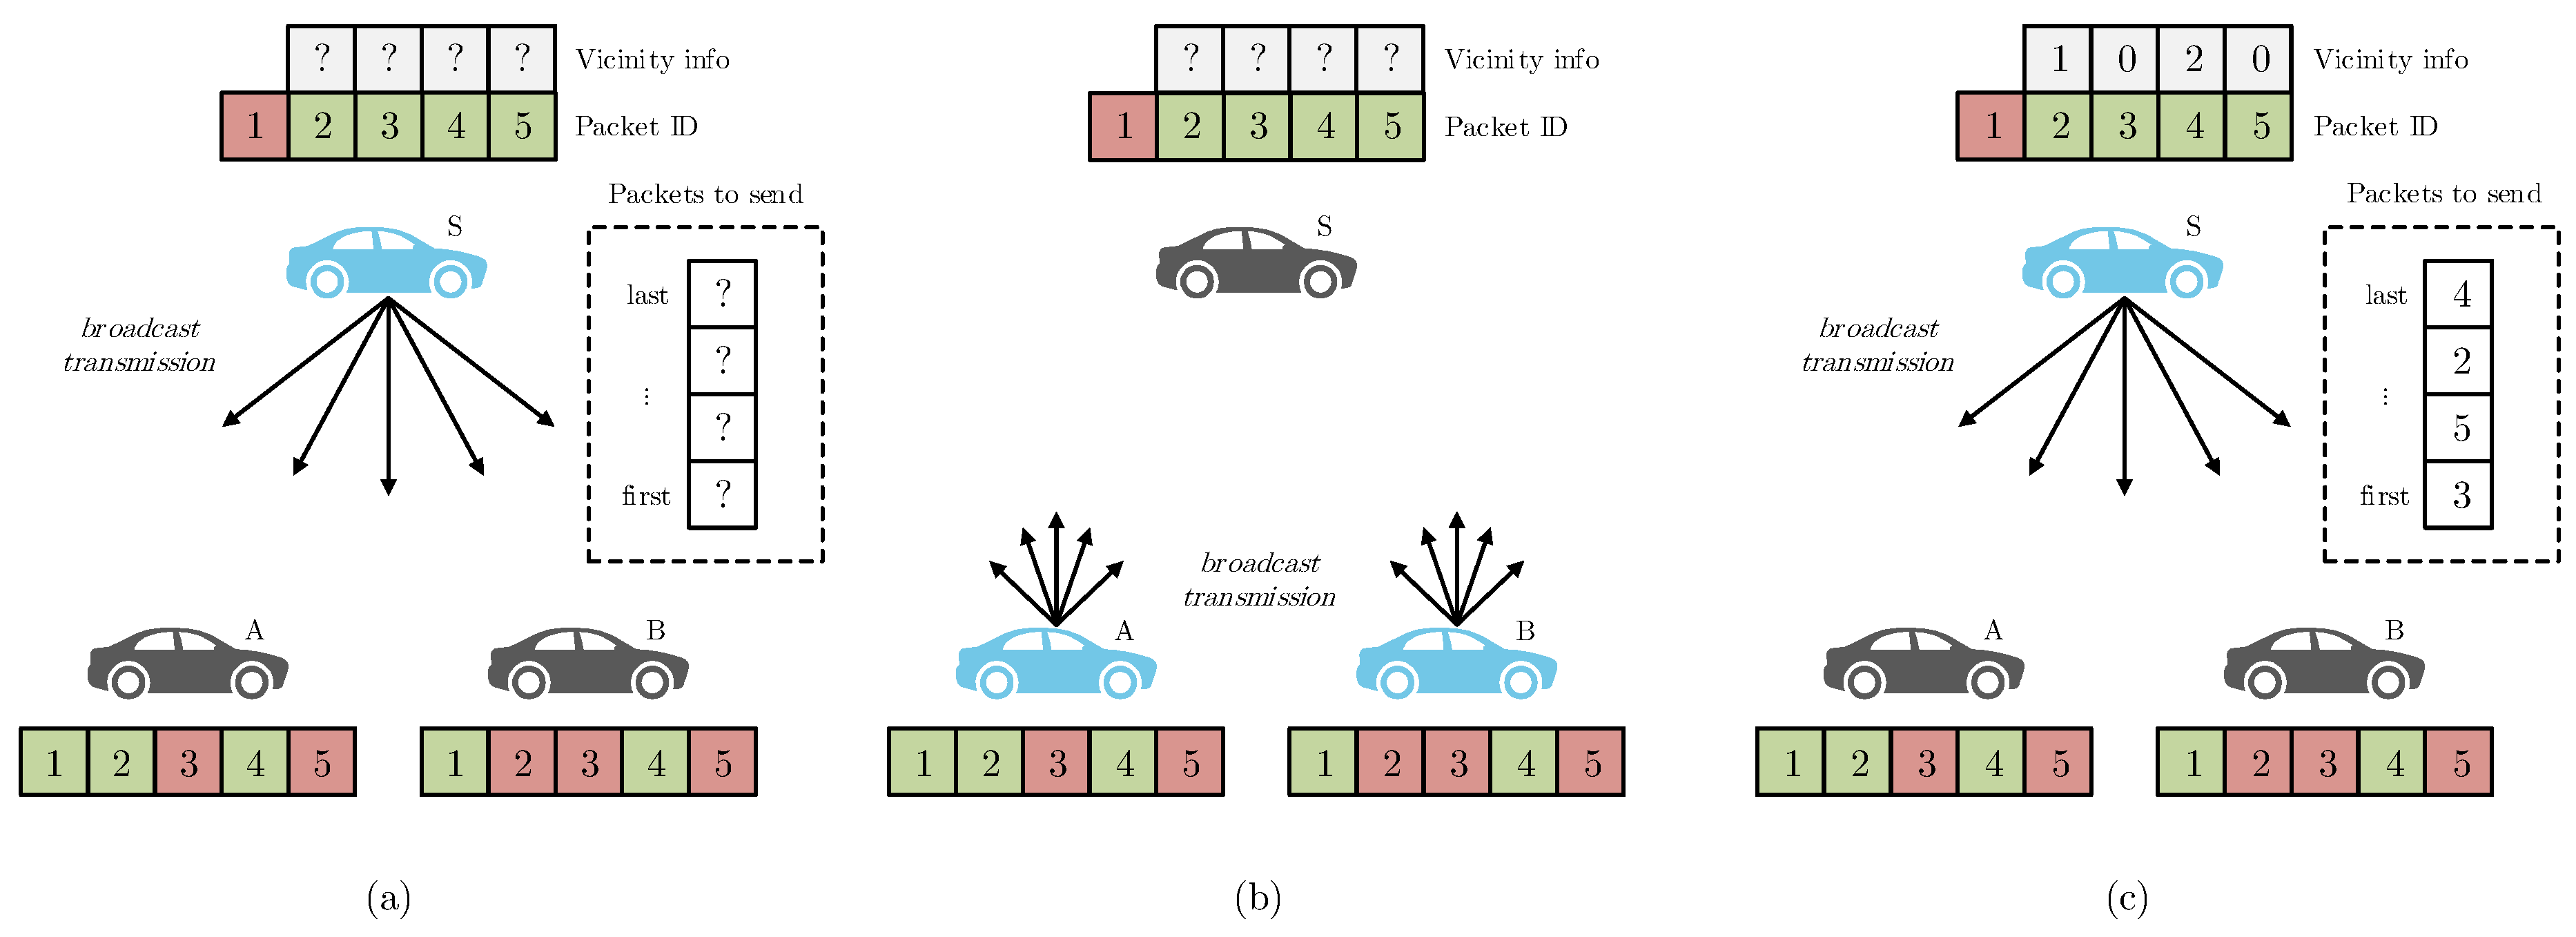
Figure 3 aims to represent the As-Is and the To-Be situations. The first one represents a situation where the sender node does not know which packets should be sent since it does not have any content distribution strategy implemented. As an evolution of this scenario and a way to implement the proposed strategy, the nodes A and B can periodically send control packets advertising their storage content. In an ideal situation, the sender node knows the exact content of its neighbors’ storage. Regarding the example in Figure 3b, vehicle A advertises that it has the packets 1, 2 and 4 from a specific content, and node B advertises that it has packets 1 and 4. Through these advertisements, the sender node (S) knows which are the packets that it needs to broadcast in order to send the most useful information for its neighbors. Thus, given that the most lacking packets are the packets 3 and 5, these are first ones to be broadcast by node S, followed by packets 2 and 4, respectively, as illustrated in Figure 3c. The tiebreak criterion will be the number of hops (if the sender node is an OBU), or the number of packets transmission (in an RSU).
3.3. Local Rarest Generation First (LRGF)
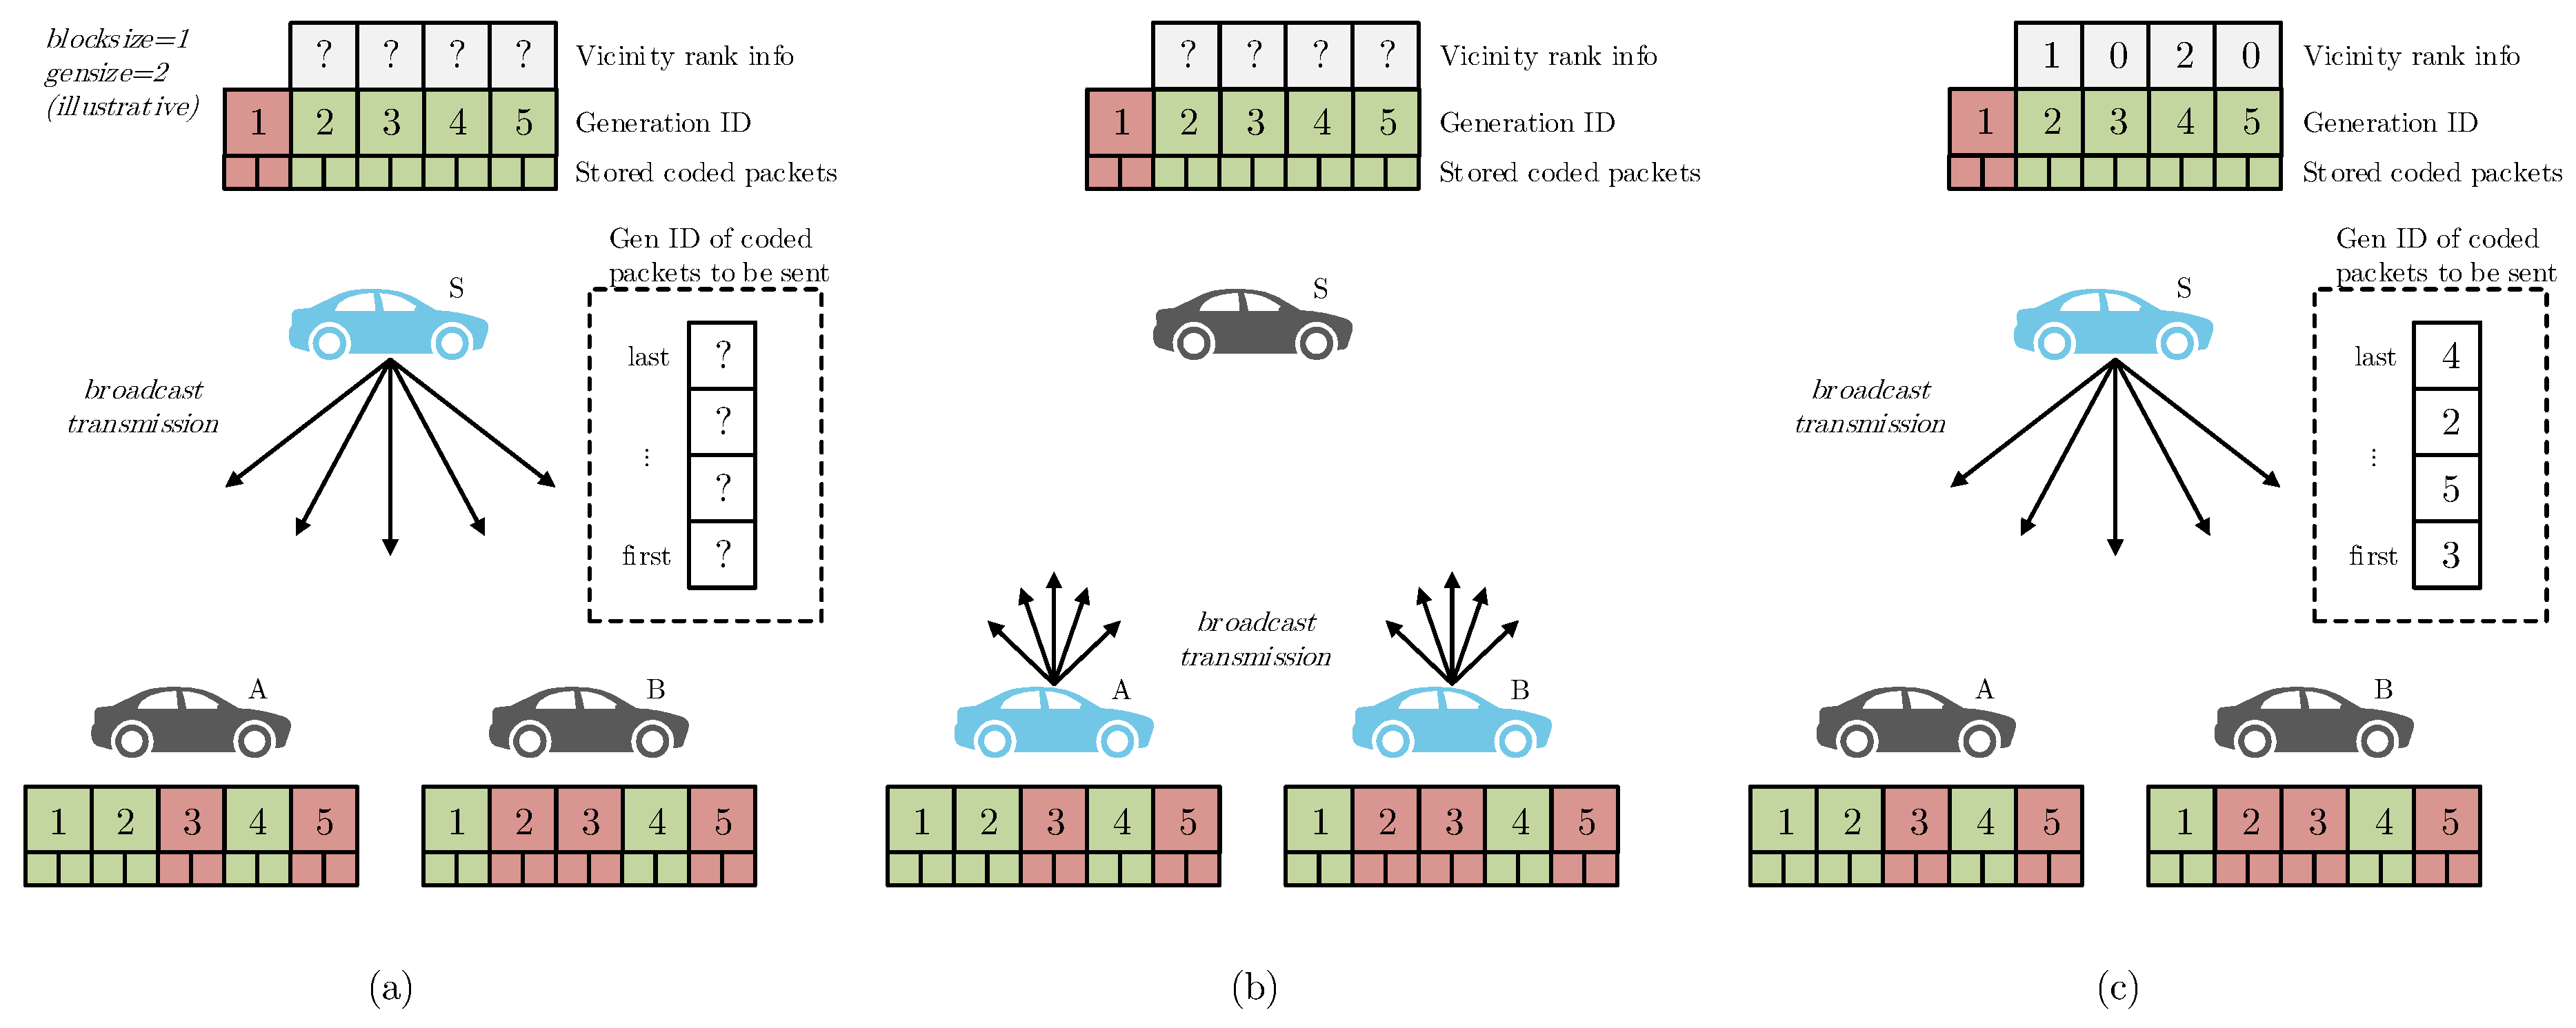
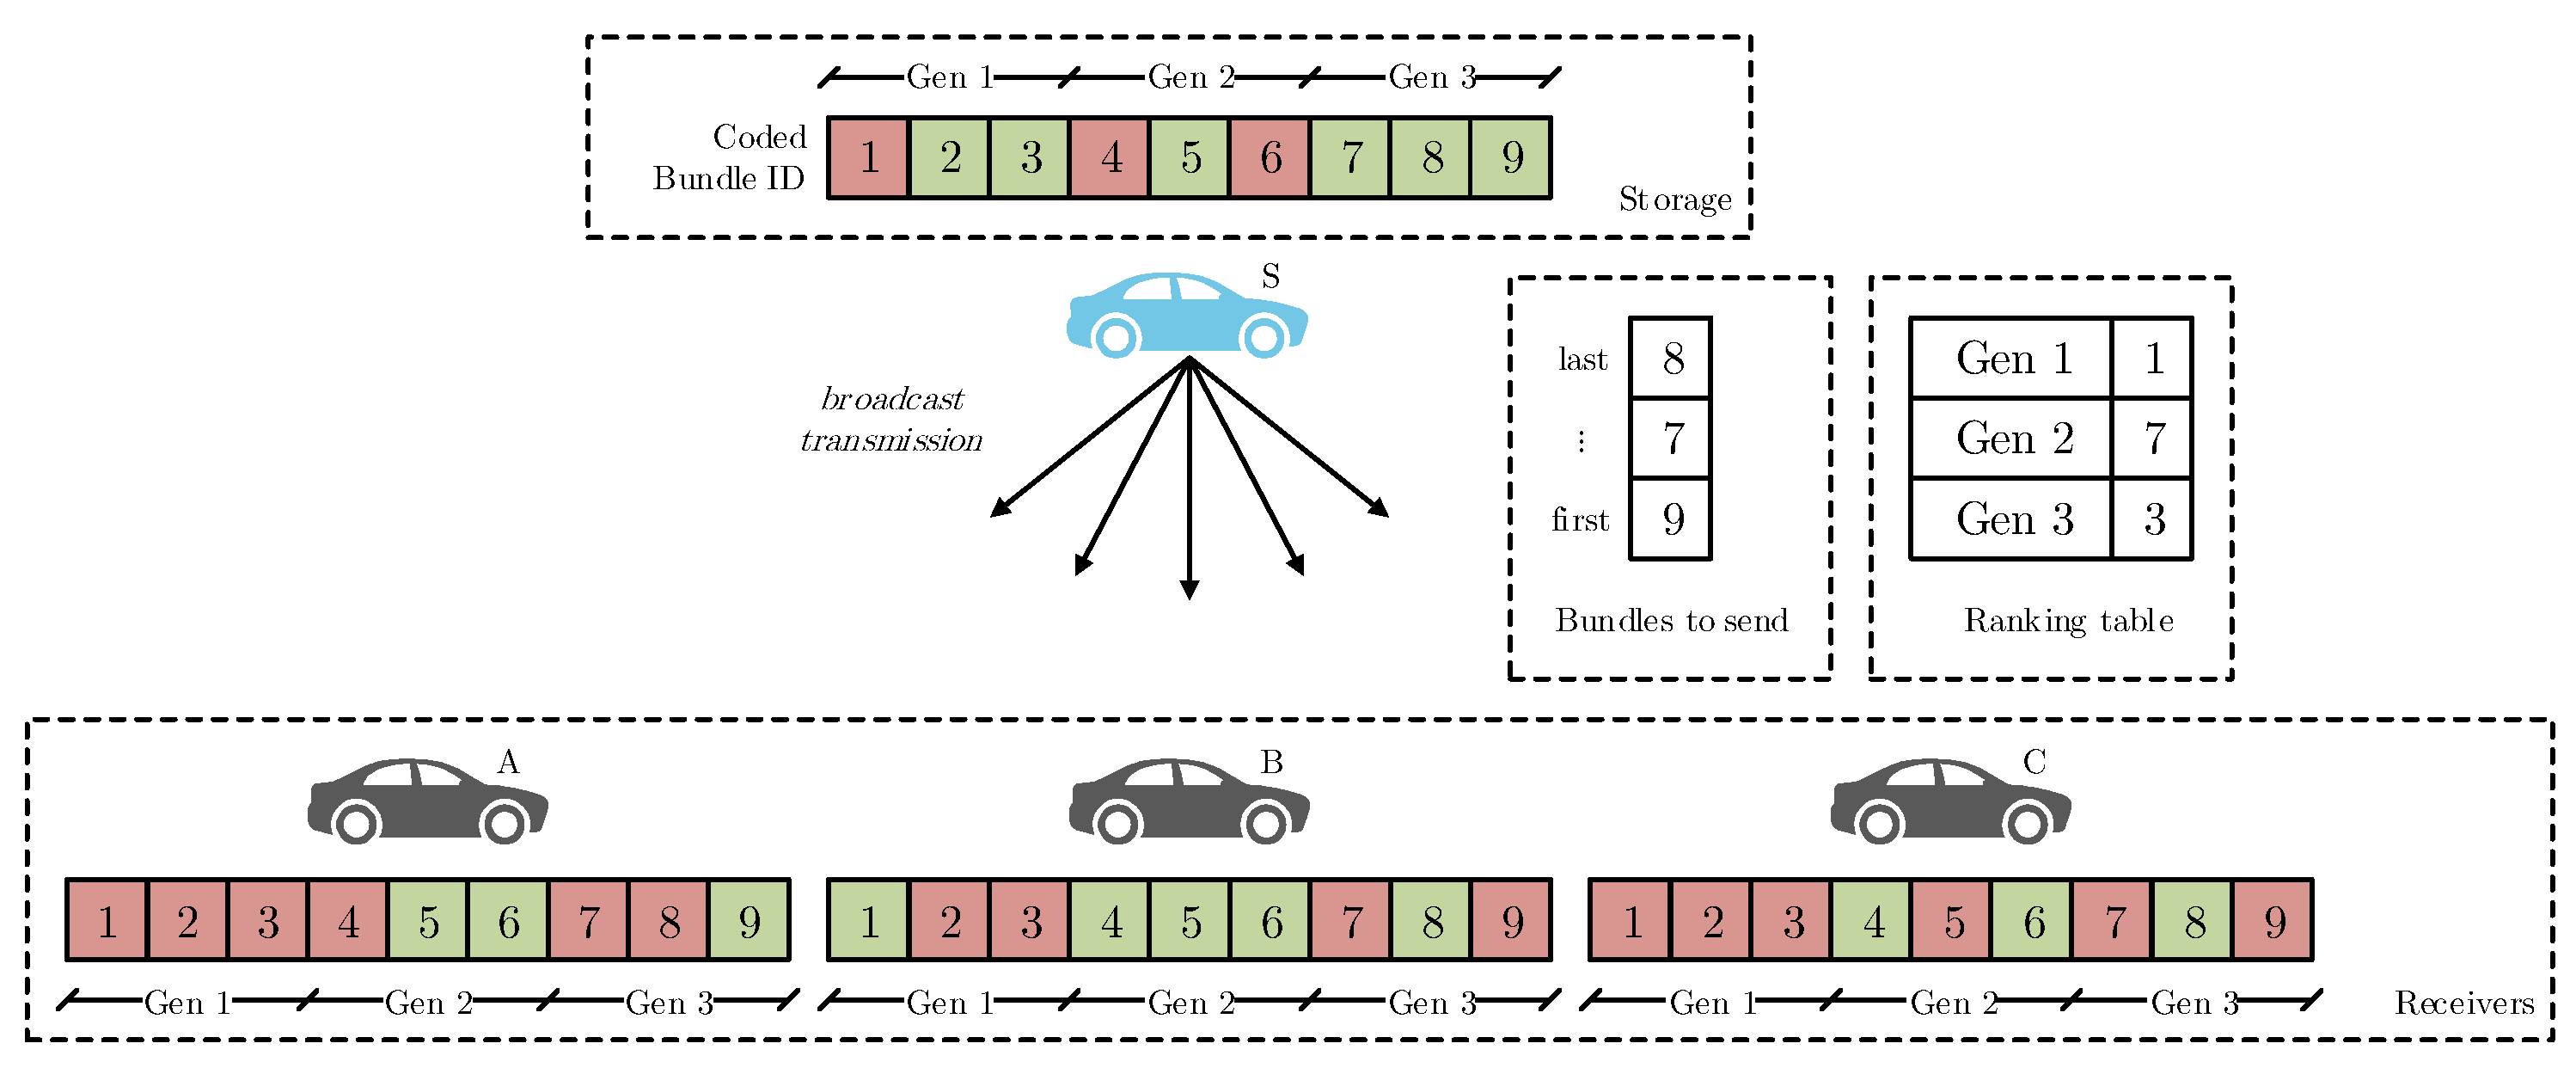
The practical implementation of this strategy is similar to the LRBF. An overview is illustrated in Figure 4, which represents the current situation to select a packet to send (a), the future moment of the forwarding decision (c), using (b) as an intermediate step to achieve the proposed packet selection strategy. As with the previous strategy, in the first one the sender node does not know which coded packet should be forwarded since no forwarding decision is implemented. To implement the proposed strategy, nodes A and B should periodically disseminate an advertisement packet with their ranking. As mentioned before, the ranking is a metric of how many coded packets, associated with a specific block/generation, a node has within its storage. Through these advertisements, the sender node S can evaluate which is the generation of coded packets that is most lacking in its vicinity and randomly choose coded packets from this generation to be broadcasted: the sender does not need to send a specific set of packets, but just the sufficient number of coded packets to get the overall generation. In the Figure 4 example, vehicle A advertises that it has a rank of 2 from generations 1, 2, and 3, and a rank of zero regarding the generations 3 and 5. On the other hand, vehicle B has a rank of 0 from generations 2, 3, and 5, and a rank of 2 from generations 1 and 4. Thus, using the advertised data, sender node S selects and broadcasts the most useful information to its vicinity. Thus, the most lacking generations are the ones identified by numbers 3 and 5, followed by generation 2. As with the LRBF, in order to perform this forwarding decision as fast as possible, the node should have an auxiliary internal structure to map the generation which the sender node already has (completed or not completed) with the ranking criteria collected from its vicinity. Regarding the previously discussed LNHF strategy, when two generations are equally lacking in the sender node’s vicinity, the tie-breaking criteria could be the number of transmissions associated with these generations (being equal for OBUs and RSUs).
As with the LRBF strategy, the sender node must have an internal structure where the collected ranking information is mapped with the generations stored (completed or not completed). This map must be sorted to improve the forwarding decision, since through this approach the sender node immediately identifies the generation to be spread (the most lacking generation). Moreover, two situations can be considered: (i) this structure only includes completed generations (with gensize coded packets available to be sent), or (ii) uncompleted generations (with less than gensize coded packets available). However, the information of this map cannot be perpetual, whereby it must have a maximum validity time, to prevent the forwarding of data based on outdated control information.
Even though the node always sends the rarest generation, the forwarding decision can be performed in one of two ways. The first one, illustrated in Figure 5, the sender node can only send coded packets from a generation associated with an already decoded block. In the example illustrated in Figure 5, the most lacking generation is the generation number 1 with a total of 1 coded packet among all the neighboring nodes (A, B, and C). Thus, the selected generation to send coded packets is number one. However, the sender node did not decode the block associated with this generation yet. Due to this, coded packets of generation number three will be sent, since it is the second most lacking generation and the sender node already decoded the block associated with it. Once the generation to send is identified, the coded packets are randomly selected among them.
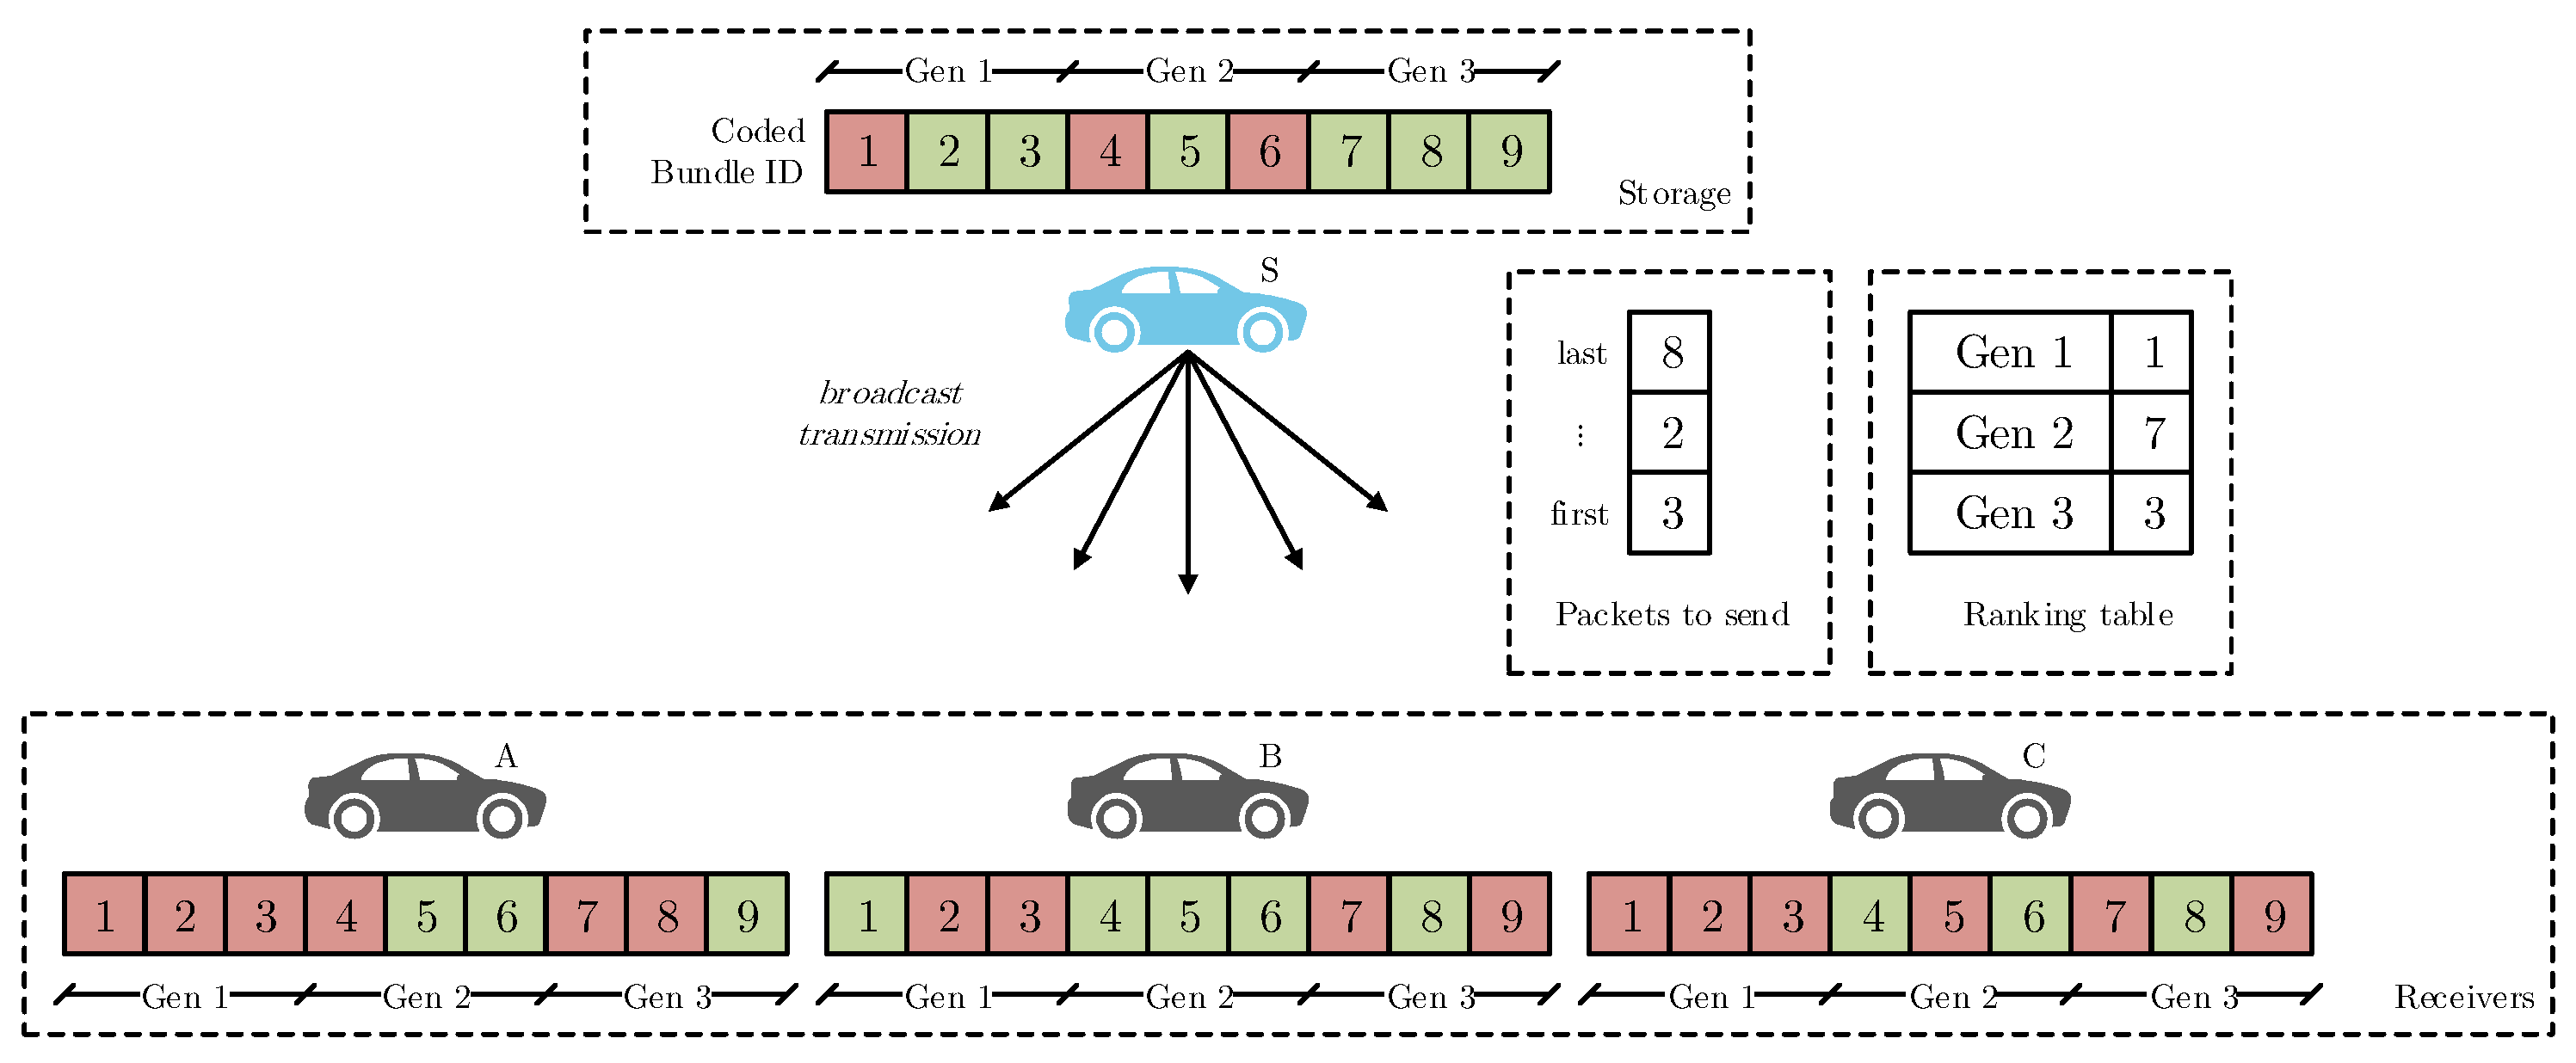
The second situation is similar to the first one and is illustrated in Figure 6. However, in this case the sender node can forward coded packets which were coded by another node. Thus, the sender node first sends the coded packets associated with the most lacking generation (which it already has), whereby coded packets 3 and 2 are sent first.
4. Evaluation and Results
A real vehicular network has been deployed in Porto city [1] and is supported by a fiber infrastructure network of the Porto Digital (http://www.portodigital.pt). This testbed interconnects hundreds of vehicles (public buses, garbage trucks, and municipality vehicles) in order to provide a set of services regarding Internet access to users inside the buses, and delay-tolerant communications to transport non-urgent information (sensors and logs). All vehicles have a WAVE communication interface set to 6 Mbps sharing the medium by using the same channel. Information about the vehicles’ location, speed, direction of movement, its neighbors (connectivity map) and the corresponding RSSI is stored in datasets. Thus, the collected information can be used as an input of real mobility model and connectivity.
The dataset used in the evaluation of the proposed strategies was collected during a 24-h period, from 6 p.m. of 12 February 2015 to 6 p.m. of the following day. During this period 446 nodes (396 OBUs and 50 RSUs) were present in the network during the collection period and the sampling period of the log data (2 s).
4.1. Evaluated Scenarios
The datasets are composed by data collected from all the network nodes being filtered based on their geographical position or time period. Thus, several scenarios for content distribution can be deployed and evaluated during the 24-h period where information was gathered. To enrich the analysis about the performance of the evaluated dissemination strategies, we have decided to divide the dataset into two distinct periods: a Rush Hour period, extracted from the city center, and a Parking period, from the public transportation parking lot.
4.1.1. City Center
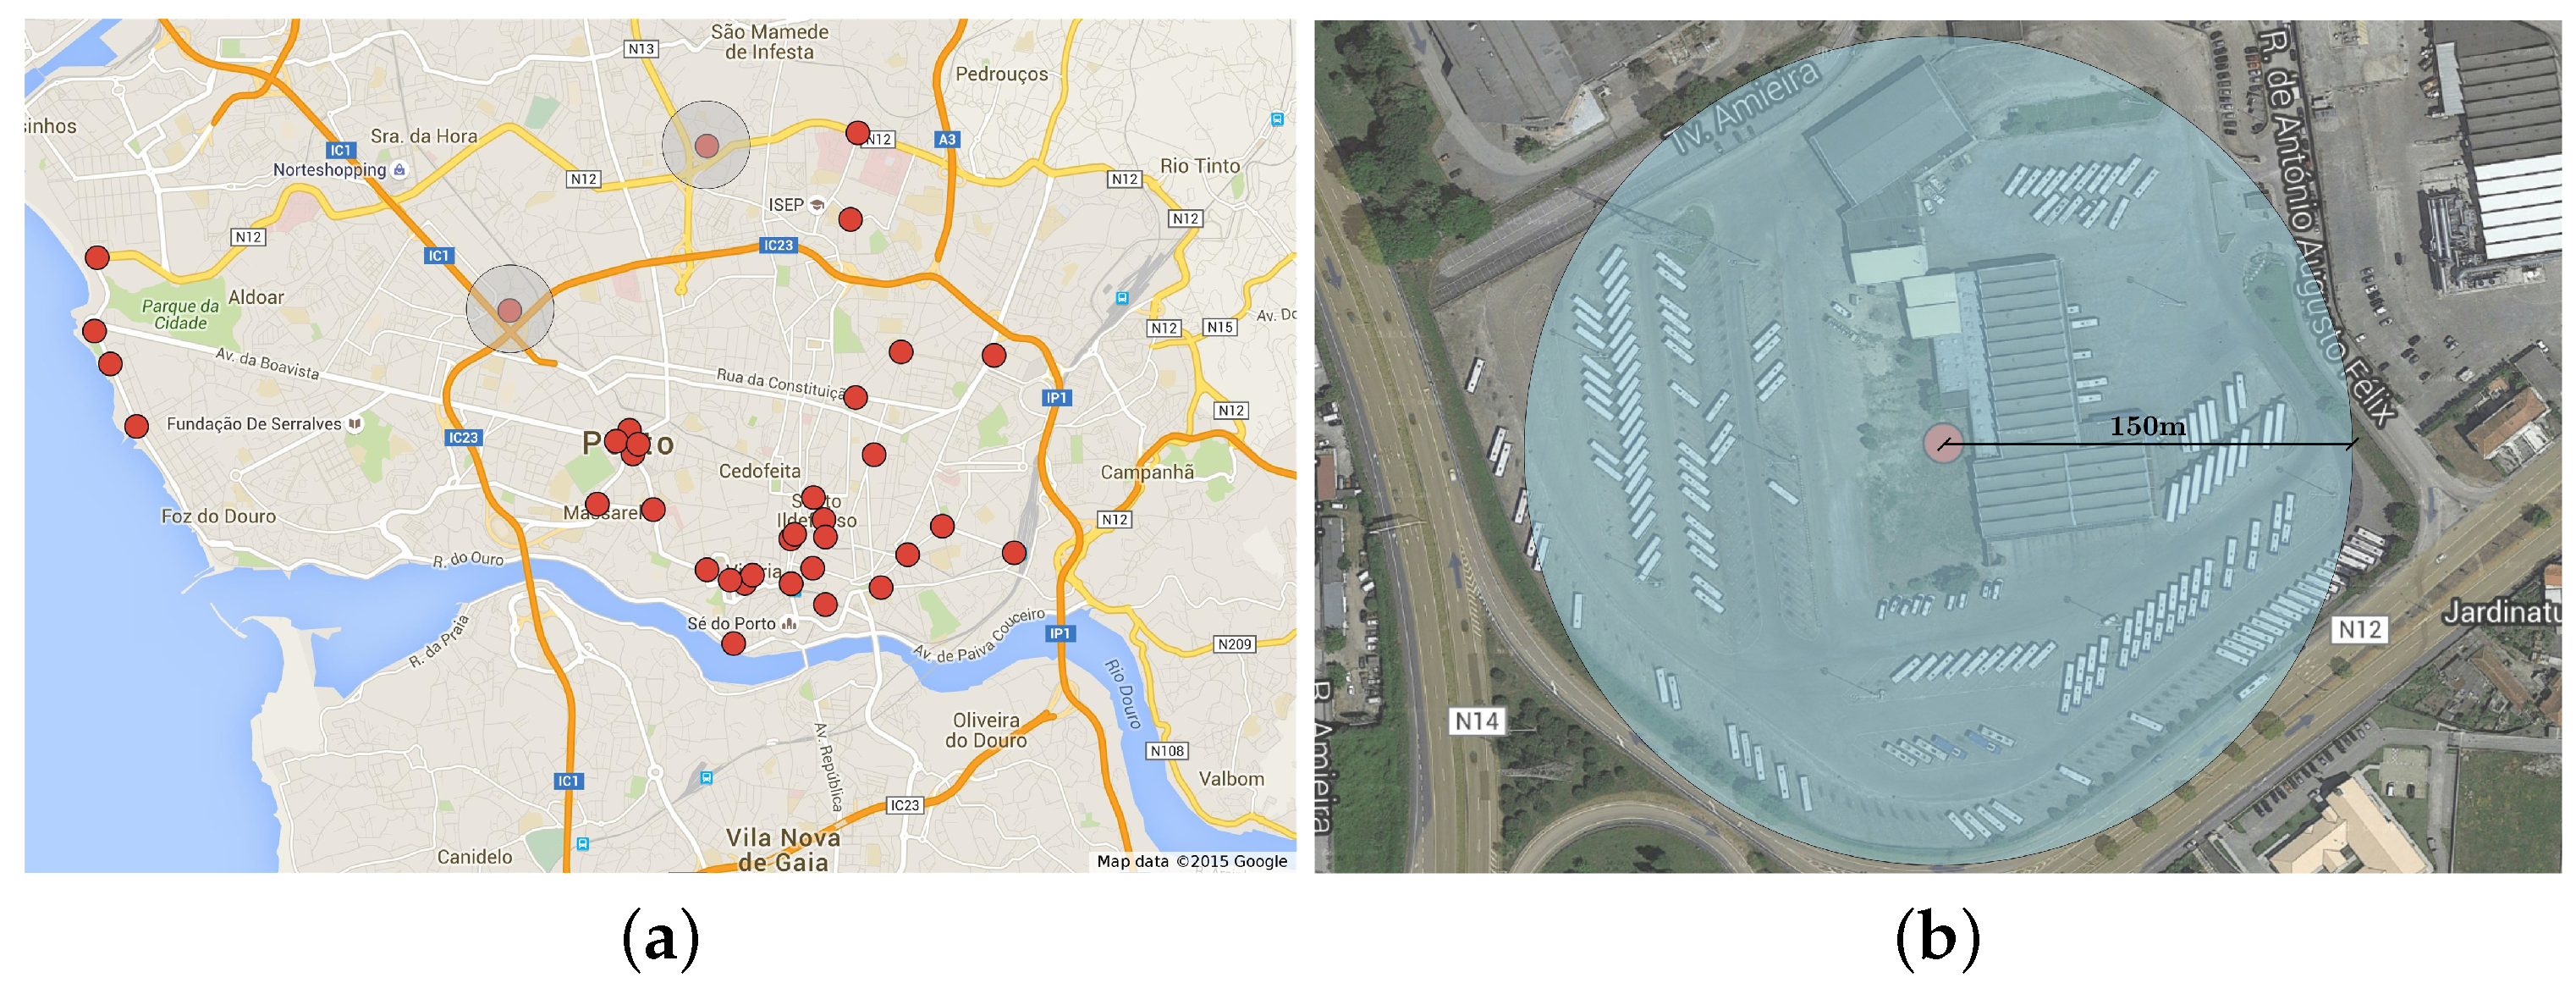
As illustrated by the gray circle in Figure 7, the first geographical region selected is the Oporto city center. This circle is centered in Aliados and has a radius of 1 km. This region is selected due to the high density and mobility of the OBUs, and due to the great number of deployed fixed infrastructures (represented by the red dots in Figure 7). Thus, the dataset considered all the vehicles and RSUs that are within this geographical area during (at least) a sampling time interval.
For the evaluation of the dissemination strategies, we have decided to consider a Rush Hour period, observed from 6am to 10am. During this period, the number of nodes is quite high, since the number of vehicles travelling to the city center is high. The dataset representing this period contains mobile logs and network information about 161 vehicles and 18 fixed stations.
4.1.2. Parking Lot
The second period considered for evaluation corresponds to a different geographical location and it is represented in Figure 8. This scenario aims to evaluate the behavior of the content distribution strategies within a parking lot. Among the two existing ones, we have selected the one more to the left of the map, which is the biggest parking lot of a public transportation company in the Oporto city, and can be mapped as a circle with 150 m radius. This parking lot has an RSU located in its center, which is the RSU number 447 (Throughout the remaining of this paper, RSUs located in parking lots will be denoted as STAs.). This geographical area is mainly characterized by a high density of nodes and a very low mobility since most of the time the vehicles are parked. Thus, it is a potential good environment for content distribution due to its high density of nodes. However, the network congestion problem is expected.
The time period selected for this scenario is comprised between 8 p.m. and 12 p.m., since this is the period with more traffic in the parking lot. Table 1 summarizes the characteristics of both datasets used for evaluation.
4.2. Software Description
A vehicular network emulator, entitled mOVERS [4], developed in Institute of Telecommunications (IT), Aveiro, was the platform used in the evaluation of the content distribution strategies. This emulator runs a Delay-Tolerant Network (DTN), which allows the creation of multiple processes that run DTN software, and is capable of scaling for larger networks with the same software as the one that is running in the OBUs/RSUs in the real Oporto vehicular network [1]. The emulator uses the extracted datasets, described at the beginning of Section 4, with real traces from vehicle’s behavior and real connectivity maps, reproducing exactly real events from vehicular networks.
The mOVERS is the opportunistic DTN-based architecture called mOVE (mobile Opportunistic VEhicular) [4] adapted to work as an emulator. mOVE is a highly modular and extensible architecture implemented in C++ and it supports standard IEEE 8012.11p, WAVE protocols, IEEE 802.11a/b/g, and WiFi technology at the same time. It has several modules, such as neighboring, socket, Application Programming Interface (API) management, storage, reception, and routing. Each module has different DTN tasks to execute and it is working with other modules through Inter-Process Communication (IPC) sockets. A node in the network can exchange packets with other nodes using User Datagram Protocol (UDP) transport protocol. The emulator version is generated by a compilation option that replaces the communication from the wireless interface with the information previously collected from the real vehicular network.
4.3. Evaluated Metrics
The characterization and evaluation metrics used throughout this work can be divided into two groups: (i) network overview and (ii) content distribution.
Regarding the network overview, we will characterize the tested scenarios using the following parameters:
- Active time: the amount of time that an OBU remains operational, and it is evaluated assuming that each log received (in the collected dataset) represents an increase of seconds (sampling period of the data collection) to this metric;
- Number of (valid) contacts: the number of times that a certain node can establish a contact with a neighbor. Thus, as an example, when a node A at a specific time instant has a vicinity comprising 5 nodes, the total number of contacts registered at this time is 5. However, if among these five, 2 of them have a link connection below 15 dBm and another is an RSU, the number of valid contacts is reduced to 2, since only connections equal or above 15 dBm can establish downstream (from an RSU to an OBU, or among OBUs). This metric can also be represented normalized according to the number of different nodes (OBU or RSU) which collected the information about the number of contacts;
- The OBU’s mobility: measured using the number of collected contacts between an OBU and other nodes divided according to their type (OBU, RSU, and STA). Thus, if an OBU has a higher number of contacts with an RSU than with a STA, it indicates that it has been travelling more in the city center than parked in the parking lot.
With respect to the content distribution, the dissemination strategies were evaluated based on the following metrics:
- Delivery rate: the percentage of OBUs that successfully downloaded the content under dissemination. This metric is evaluated on an hour-by-hour basis;
- Cumulative percentage of file distributed in the network (all the OBUs) throughout the experiment;
- End-to-end (E2E) delay: the elapsed time to receive the complete file in an OBU since the beginning of the dissemination process. In the plot only the nodes that received all the packets are considered;
- Number of listened packets by the network per hour: evaluated through the cumulative sum of all the packets listened by OBUs, and it can be interpreted as a channel congestion metric.
4.4. Network Characterization
Regarding the correct understanding of the network, its behavior and characteristics, an initial study allows a more accurate routing decision and development of protocols to disseminate information through the whole network in a real context.
4.4.1. Active Time of OBUs
Figure 9 illustrates the total active time of all OBUs during a 24-h period. Each bar represents the total active time of all OBUs in one hour of collection data. The active time is evaluated by multiplying the number of times that a node generates a log information file by the sampling period (). After analyzing this data, it is possible to conclude that there are periods with a higher number of active OBUs than others.
The active time is more uniform during the day being nearly constant between 7 a.m. and 10 p.m. Moreover, a constant decrease of active time is registered between 12 p.m. and 6 a.m. since most of the vehicles are parked. Another important characteristic is the fact that when a vehicle parks (or stops for any reason), the OBU continues to communicate during a period of approximately one to two hours. This last fact justifies the still high number of active nodes after midnight.
4.4.2. Number of Contacts
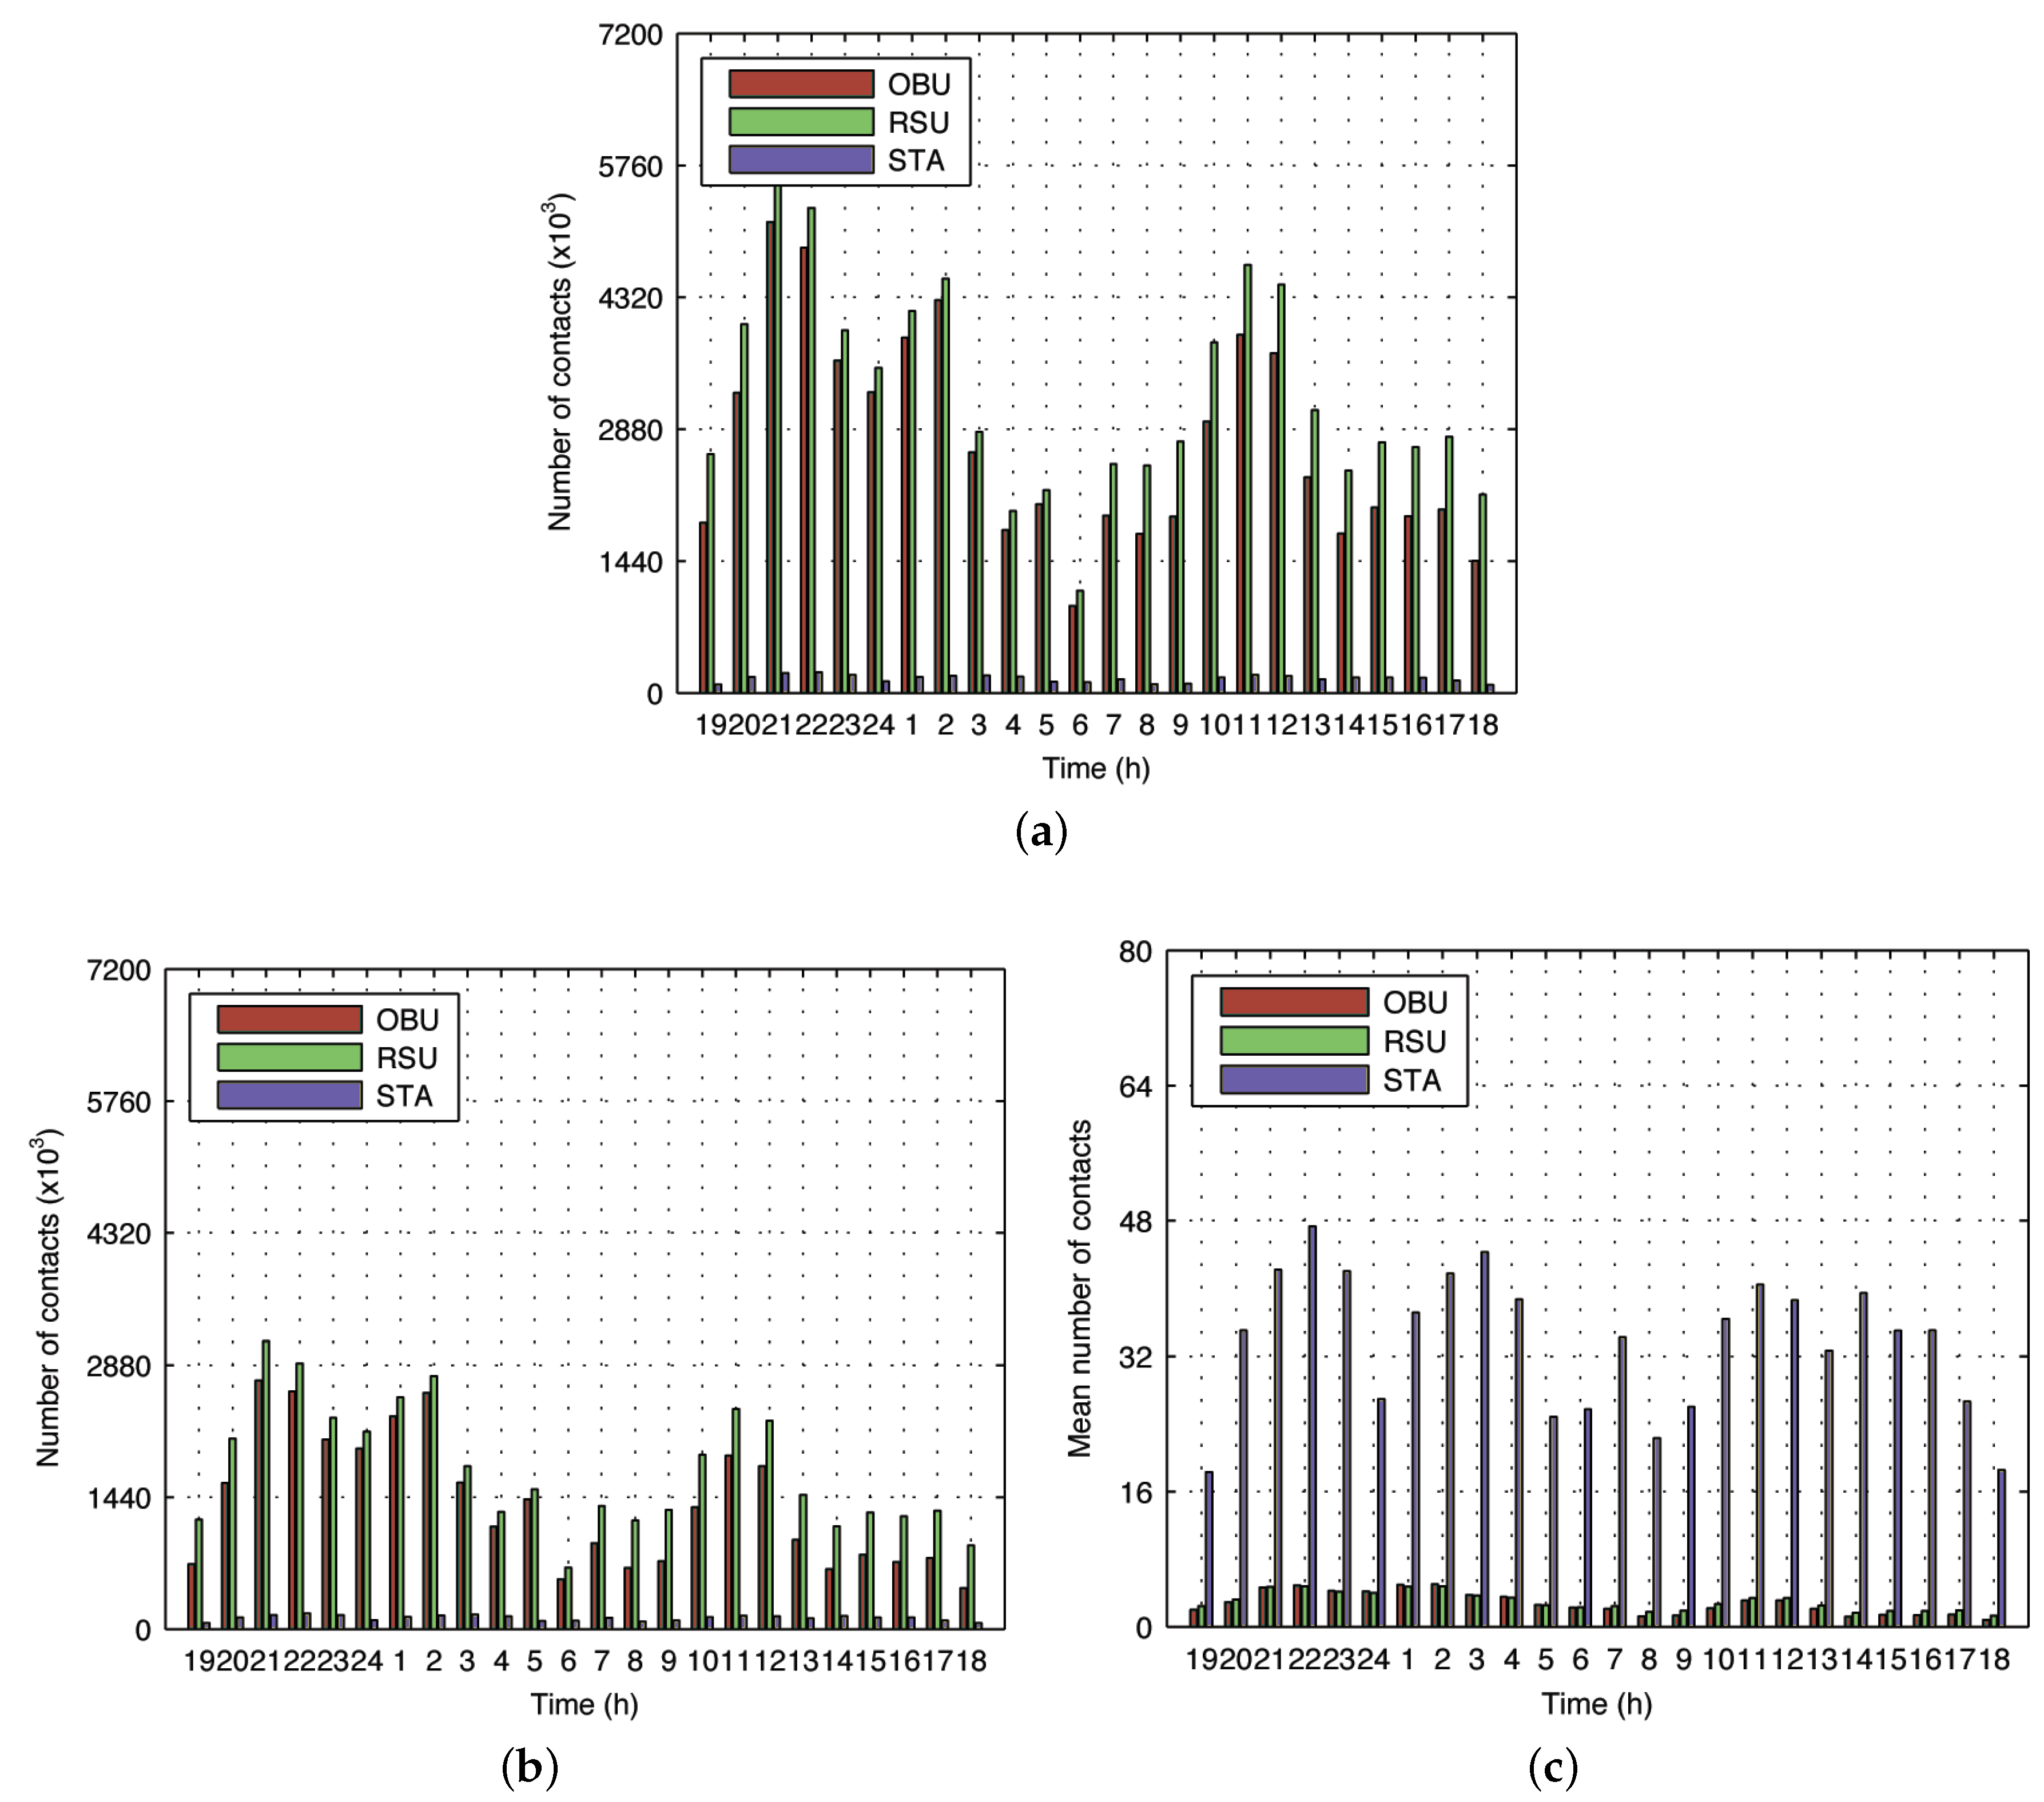
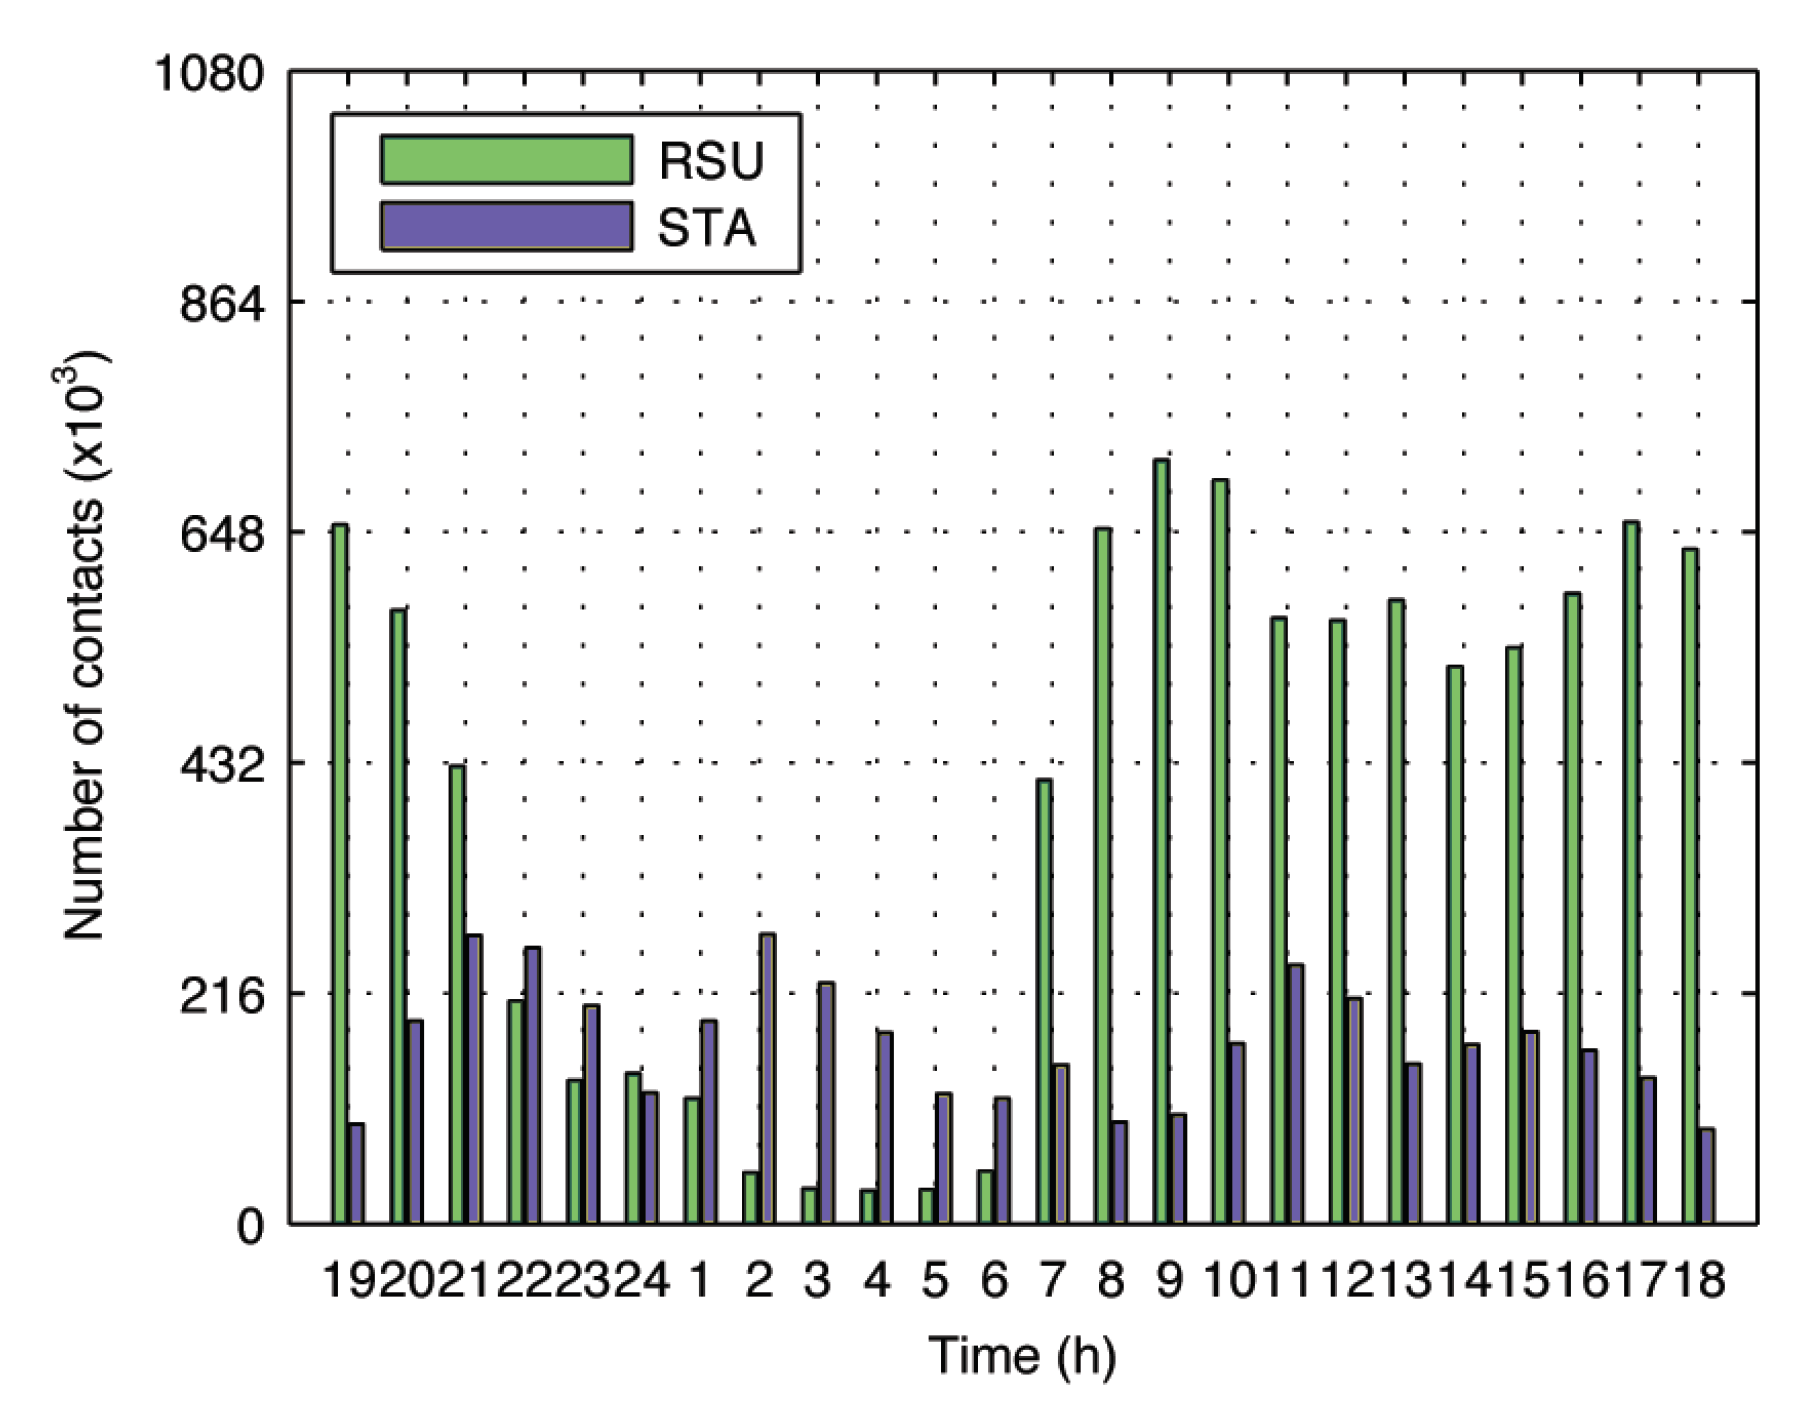
Figure 10a illustrates the total number of contacts (with OBUs and RSUs) registered by an OBU per hour. The number of contacts is evaluated by counting the number of time that an OBU has connection to other nodes (OBUs and/or RSUs). As an example, if node A has a connection with node B during 10 sampling intervals, the number of contacts will be 10. Thus, the number of contacts is also directly related with the duration of the connection. The results are organized according to the node’s type, which means that each bar in an hour period represents a specific node type. The count may contain duplicated values since, if node A registered a contact with node B, both node’s counters will be incremented. As expected, the periods with a higher number of contacts are nearly similar to the ones where nodes remain most of the time active. Nevertheless, the peaks are more pronounced during the periods around the midday and the beginning of the night. This can result from the simultaneous arrival of multiple vehicles to the same place (parking lots).
However, not all the contacts are valid to perform a constant dissemination, whereby the previous results must be analyzed excluding the non-valid contacts. In Figure 10b all the contacts with a link’s RSSI below 15 dBm are not suitable to perform a downstream transmission of data and are excluded, due to the fact that the link quality is decreased and the number of lost packets is significant. This filtering process results in a decrease in the number of registered contacts compared to the previous analysis.
On the other hand, the absolute number of contacts is not enough to fully understand what the types of nodes with a higher number of contacts per hour are. Thus, in Figure 10c, the normalized value of valid contacts per hour is illustrated. The normalization allows for a better understanding of the network behavior, since it provides an approximate metric of where the nodes stay for a long period of time. Therefore, as illustrated, the STAs have always a higher number of valid contacts because they are in the parking lots where nodes tend to be stopped for a long period of time.
4.4.3. Mobility of OBUs
The information about the established contacts can also be useful to better understand the OBUs mobility behavior. When the type of contacts (valid or non-valid) of an OBU with RSUs and STAs are individually analyzed, it is possible to “recreate” their path along the day. Thus, if most contacts are established with a STA, it means that the OBU is mostly parked in a parking lot. On the other hand, if most of them are with RSUs, the probability that the OBUs have been travelling in the city is quite high. Figure 11 illustrates the previously described metric, where can be clearly identified: OBUs located mostly (i) in the city, and (ii) in the parking lots. The OBUs start to have more contacts with STAs approximately after 9 p.m. and remain parked until 6 p.m. After 6 a.m. the OBUs start travelling through the city and, at midday, some of them returned to the parking lots where they remained for a period of one or two hours and then returned to the city.
4.5. Performance Evaluation of Dissemination Strategies
The experimentation is characterized by the dissemination of a 75 MB file, divided in 2256 packets of 32 KB each. The advertisement packets are broadcasted with a periodicity between 5 and 10 s, and the refreshing of the internal structures between 15 and 30 s. The valid time of an internal structure information, received from an advertisement packet, is restricted to 22 s, and the bandwidth is limited to 1 Mbps, which is the behavior for this type of service in the real vehicular network. Finally, in the LRGF strategy a block is composed by 8 packets and, when coded, it results in a generation of 12 coded packets.
4.5.1. Rush Hour in City Center
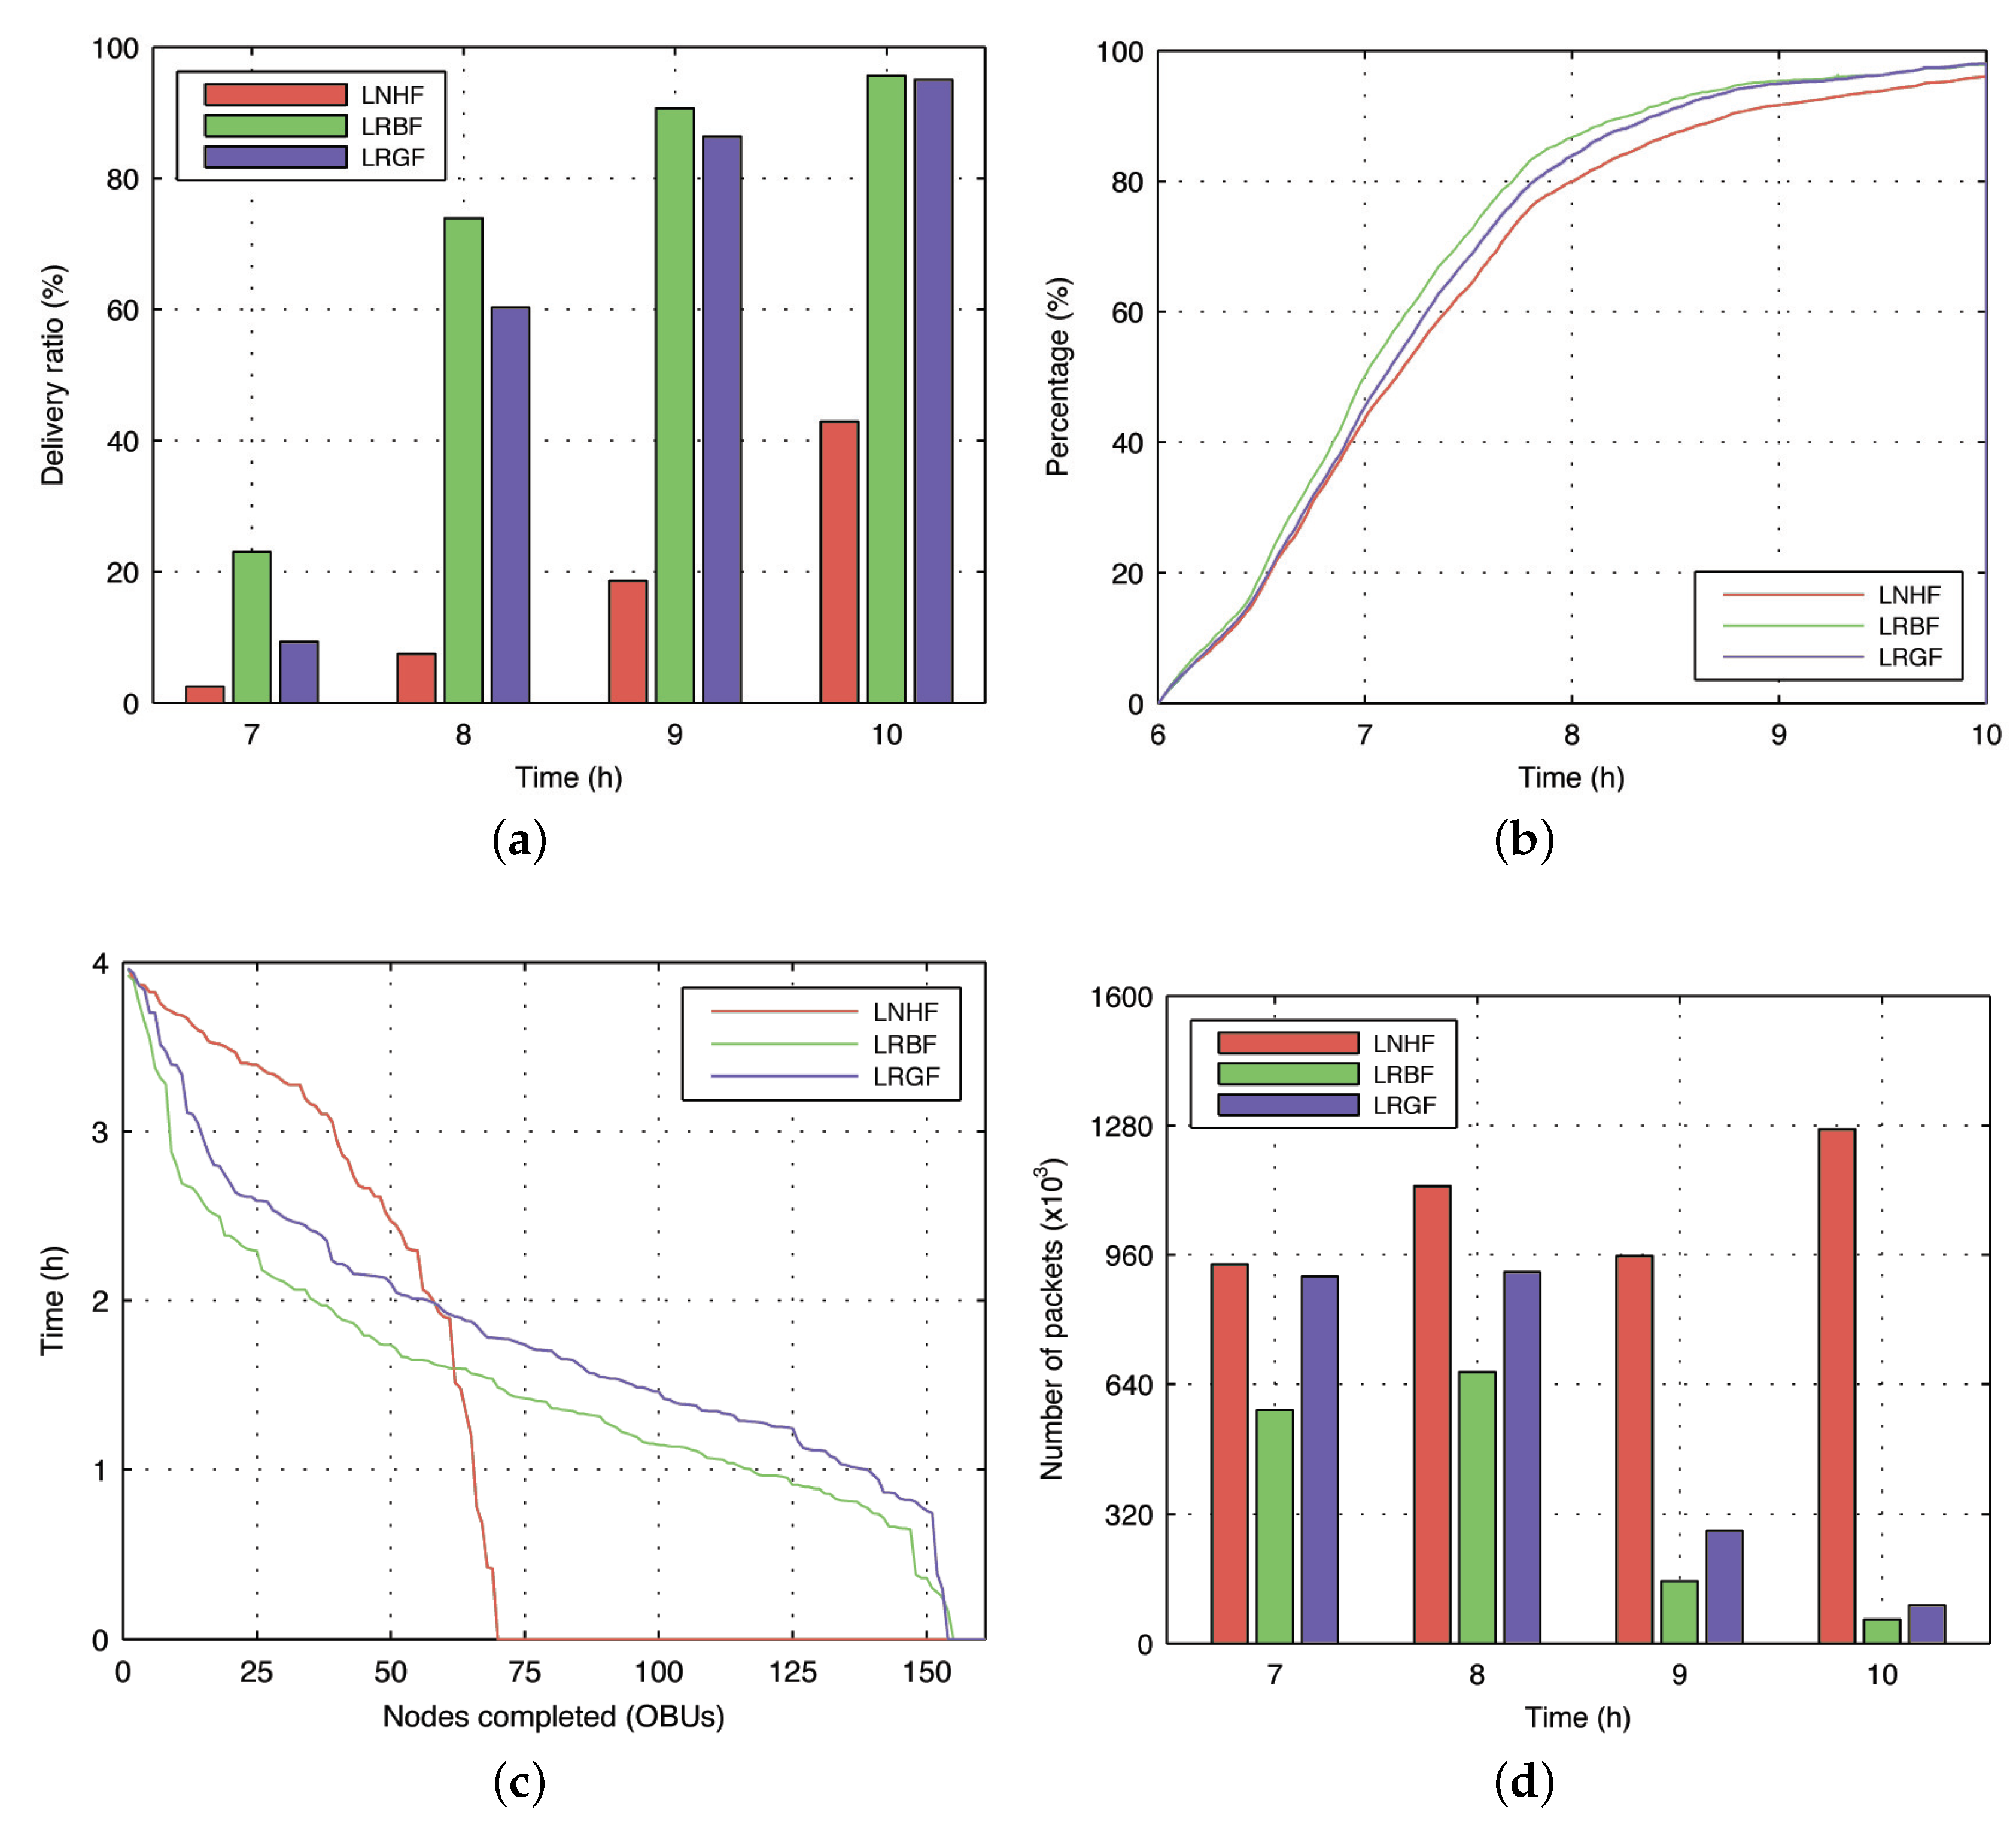
Figure 12a,b illustrate the evolution of metrics associated with the percentage of the delivery throughout the experiment in the Rush Hour period. In the first one only the nodes which completely receive the file are taken into account, and the other one is related to the percentage of file downloaded in the network (even if the content is not completed). The results clearly show that LRBF and LRGF have the best behavior in terms of delivery, although the LRGF takes more time than LRBF to achieve the same delivery rate. Contrarily, the LNHF strategy cannot completely deliver the file, whereby it presents a lower efficiency compared to the other two. This occurs mainly because both LRBF and LRGF strategies make use of control packets to better select which packets should be transmitted, without introducing too much overhead in the network. In terms of the percentage of file download by the network nodes, illustrated in Figure 12b, all strategies converge to a high percentage. However, the LNHF strategy takes more time than the other two strategies to achieve the same percentage.
Figure 12c represents the time that each node takes to download the complete content, whereby only information about nodes which completely downloaded the file are displayed. According to Figure 12c and analyzing the results, it is possible to conclude that the LRBF and LRGF strategies have the best performance since, in mean, the download of the content is faster than in the LNHF strategy. In addition to that, as the progress rate shows, in the two best strategies (LRBF and LRGF), the great majority of downloads finish in the first two hours. Furthermore, in the LNHF strategy this occurs during the last half of the experiment. Once again this performance is justified by the intelligence introduced by the advertisement packets and the information they contain.
The metric illustrated in Figure 12d regards the analysis of the network congestion. When an OBU hears a packet, a counter is incremented. Thus, if this value is higher in a certain strategy than in another, it means that the medium is more congested. The number of listened packets in the LNHF are approximately equal and constant throughout the experiment. The sudden increase is only verified in the LNHF strategy due to its lack of intelligence, since if it has more valid contacts (opportunities to transmit packets), it sends a higher number of packets. The transmission of packets decreases when the majority of a node’s neighbors have successfully downloaded the content. In this case, a node does not send any data packet once no one in its vicinity needs it. The LRBF has the lowest number of listened packets, since it has the highest delivery ratio and lowest end-to-end delay.
4.5.2. Parking Period in Parking Lot
This period has several specificities quite different from the previous one. This is the time period where most of the vehicles (buses) arrive into the parking lot to be parked until the morning of the next day. Thus, as seen in the initial network study, this period presents a higher number of contacts, since the vehicles are parked in the same geographical region and remain active for (at least) one hour after the engine stops. As in the previous period, the analysis of the parking period is divided in three aspects: delivery ratio, delay in the delivery, and network congestion.
As Figure 13a illustrates, in the first two hours the delivery ratio of LRGF increases fast, and the number of completed files in the LNHF strategy has a small increase. Once again, this different behavior is justified by the lack of intelligence of the LNHF strategy, which reveals its inability to successful completely deliver a high number of files even when the overall percentage of the file distributed in the network is quite high. The strategy with the best delivery ratio is the LRBF, followed by the LRGF and LNHF.
The major difference regarding the previous period is the fact that the difference between the LRBF and the LRGF increased significantly. This change of behavior is mainly justified by two aspects. The first one is related to the latency of the strategies. The LRGF needs to collect blocksize coded packets to decode the associated block, whereby the process is slower. The second one is due to the high concentration of nodes (this period has a higher number of contacts) which enhances the performance of the LRBF since the ideal advertisement procedure is assumed. Thus, a node knows exactly which is the storage content of its vicinity, and could send (in broadcast) the most lacking packets.
Despite the lower delivery ratio, the LNHF strategy presents a lower delay in the delivery when compared to the LRGF, since it delivers mostly in the first period of the experiment. Once again, the LRBF strategy has the lowest delivery end-to-end delay of the evaluated approaches. Compared to the other evaluated periods, in general, the file is delivered with a lower end-to-end delay due to the high concentration of nodes within the same geographical area. Moreover, the frequent contact with the RSU deployed in the parking lot helps in the decrease of this metric.
5. Conclusions
This work evaluated a set of non-urgent content dissemination strategies for urban vehicular networks based on real mobility and connectivity traces. As such, three strategies were implemented and evaluated: Least Number of Hops First, Local Rarest Bundle First, Local Rarest Generation First. The performance results showed that both dissemination strategies with information exchange, the LRBF and the LRGF, were able to obtain better results when compared with a stateless dissemination strategy, the LNHF, even with an additional overhead introduces by advertisement packets. The results also showed that in several situations, a longer delivery delay was achieved justified by the network topology, and also by the fact that a single communication technology was considered, namely IEEE 802.11p/WAVE, which limits the network connectivity.
As future work, both the emulator and the strategies will be evolved. From the strategies side, it will be extended to test new approaches that will provide implicit knowledge of the information to transmit without incurring in a large advertisement overhead. From the emulator side, it will be extended to address other types of delivery approaches, such as emergency advertisements and data gathering from sensors to the infrastructure. Furthermore, additional communication technologies, such as cellular, will be considered.
Author Contributions
Conceptualization, G.P.; methodology, G.P.; investigation, G.P., L.G. and S.S.; validation, L.G., M.L., C.S. and S.S.; visualization, G.P., M.L. and C.S.; writing—original draft preparation, G.P.; writing—review and editing, L.G., M.L., C.S. and S.S.; supervision, L.G. and S.S.; funding acquisition, S.S. All authors have read and agreed to the published version of the manuscript.
Funding
This workwas funded by FCT/MEC through national funds and when applicable by the European Regional Development Fund (FEDER), through the Competitiveness and Internationalization Operational Programme (COMPETE 2020) of the Portugal 2020 framework, project MobiWise, POCI-01-0145-FEDER-016426 and project S2MovingCity, CMUP-ERI/TIC/0010/2014.
Conflicts of Interest
The authors declare no conflict of interest.
References
- Santos, P.M.; Rodrigues, J.G.P.; Cruz, S.B.; Lourenço, T.; d’Orey, P.M.; Luis, Y.; Rocha, C.; Sousa, S.; Crisóstomo, S.; Queirós, C.; et al. PortoLivingLab: An IoT-Based Sensing Platform for Smart Cities. IEEE Internet Things J. 2018, 5, 523–532. [Google Scholar] [CrossRef]
- Ameixieira, C.; Cardote, A.; Neves, F.; Meireles, R.; Sargento, S.; Coelho, L.; Afonso, J.; Areias, B.; Mota, E.; Costa, R.; et al. Harbornet: A real-world testbed for vehicular networks. IEEE Commun. Mag. 2014, 52, 108–114. [Google Scholar] [CrossRef] [Green Version]
- Monteiro, R.; Guedes, L.; Condeixa, T.; Neves, F.; Sargento, S.; Guardalben, L.; Steenkiste, P. Lessons learned from a real vehicular network deployment of delay-tolerant networking. In Proceedings of the 2015 IEEE International Conference on Communication Workshop (ICCW), London, UK, 8–12 June 2015; pp. 2489–2494. [Google Scholar] [CrossRef]
- Pessoa, G.; Dias, R.; Condeixa, T.; Azevedo, J.; Guardalben, L.; Sargento, S. Content distribution emulation for vehicular networks. In Proceedings of the WD 2017: Wireless Days 2017, Porto, Portugal, 29–31 March 2017; pp. 208–211. [Google Scholar] [CrossRef]
- Silva, F.A.; Boukerche, A.; Silva, T.R.M.B.; Ruiz, L.B.; Cerqueira, E.; Loureiro, A.A.F. Vehicular Networks: A New Challenge for Content-Delivery-Based Applications. ACM Comput. Surv. 2016, 49, 1–29. [Google Scholar] [CrossRef]
- Dinh, N.T.; Kim, Y. Information-centric dissemination protocol for safety information in vehicular ad-hoc networks. Wirel. Netw. 2017, 23, 1359–1371. [Google Scholar] [CrossRef]
- Chaqfeh, M.; Lakas, A.; Jawhar, I. A survey on data dissemination in vehicular ad hoc networks. Veh. Commun. 2014, 1, 214–225. [Google Scholar] [CrossRef]
- Gerla, M.; Wu, C.; Pau, G.; Zhu, X. Content distribution in VANETs. Veh. Commun. 2014, 1, 3–12. [Google Scholar] [CrossRef]
- Yu, B.; Bai, F. PYRAMID: Informed content reconciliation for vehicular peer-to-peer systems. In Proceedings of the 2015 IEEE Vehicular Networking Conference (VNC), Kyoto, Japan, 16–18 December 2015; pp. 212–219. [Google Scholar] [CrossRef]
- Da Costa, J.B.D.; de Souza, A.M.; Rosário, D.; Cerqueira, E.; Villas, L.A. Efficient data dissemination protocol based on complex networks’ metrics for urban vehicular networks. J. Internet Serv. Appl. 2019, 10, 15. [Google Scholar] [CrossRef] [Green Version]
- Li, Z.; Song, Y.; Bi, J. CADD: Connectivity-aware data dissemination using node forwarding capability estimation in partially connected VANETs. Wirel. Netw. 2019, 25, 379–398. [Google Scholar] [CrossRef]
- Sospeter, J.; Wu, D.; Hussain, S.; Tesfa, T. An Effective and Efficient Adaptive Probability Data Dissemination Protocol in VANET. Data 2018, 4, 1. [Google Scholar] [CrossRef] [Green Version]
- Zhang, R.; Yu, B.; Krishnan, H. Simulation Study on Collaborative Content Distribution in Delay Tolerant Vehicular Networks. In Proceedings of the 2018 IEEE 88th Vehicular Technology Conference (VTC-Fall), Chicago, IL, USA, 27–30 August 2018; pp. 1–5. [Google Scholar] [CrossRef] [Green Version]
- Bitaghsir, S.A.; Khonsari, A. Cooperative caching for content dissemination in vehicular networks. Int. J. Commun. Syst. 2018. [Google Scholar] [CrossRef]
- Recharte, D.; Aguiar, A.; Cabral, H. Cooperative Content Dissemination on Vehicular Networks. In Proceedings of the 2018 IEEE Vehicular Networking Conference (VNC), Taipei, Taiwan, 5–7 December 2018; pp. 1–8. [Google Scholar] [CrossRef]
- Basheer, H.S.; Bassil, C. A review of broadcasting safety data in V2V: Weaknesses and requirements. Ad Hoc Netw. 2017, 65, 13–25. [Google Scholar] [CrossRef]
- Jamil, F.; Javaid, A.; Umer, T.; Rehmani, M.H. A comprehensive survey of network coding in vehicular ad-hoc networks. Wirel. Netw. 2016. [Google Scholar] [CrossRef]
- SAFESPOT. The Case for Cellular V2X for Safety and Cooperative Driving. 2017. Available online: https://5gaa.org/wp-content/uploads/2017/10/5GAA-whitepaper-23-Nov-2016.pdf (accessed on 17 March 2020).
- Araniti, G.; Campolo, C.; Condoluci, M.; Iera, A.; Molinaro, A. LTE for vehicular networking: A survey. IEEE Commun. Mag. 2013, 51, 148–157. [Google Scholar] [CrossRef]
- Silva, F.A.; Celes, C.; Boukerche, A.; Ruiz, L.B.; Loureiro, A.A. Filling the Gaps of Vehicular Mobility Traces. In Proceedings of the 18th ACM International Conference on Modeling, Analysis and Simulation of Wireless and Mobile Systems, Cancun, Mexico, 2–6 Noverbem 2015; pp. 47–54. [Google Scholar] [CrossRef]
- Uppoor, S.; Trullols-Cruces, O.; Fiore, M.; Barcelo-Ordinas, J.M. Generation and Analysis of a Large-Scale Urban Vehicular Mobility Dataset. IEEE Trans. Mob. Comput. 2014, 13, 1061–1075. [Google Scholar] [CrossRef] [Green Version]
- Gramaglia, M.; Trullols-Cruces, O.; Naboulsi, D.; Fiore, M.; Calderon, M. Mobility and connectivity in highway vehicular networks: A case study in Madrid. Comput. Commun. 2016, 78, 28–44. [Google Scholar] [CrossRef] [Green Version]
Figure 1.
Content distribution to-be scenario (illustrative).

Figure 2.
Forwarding decision of LNHF strategy in a (a) RSU and (b) an OBU—example.

Figure 3.
LRBF strategy (a) As-Is, (b) intermediate, and (c) To-Be scenarios.

Figure 4.
LRGF strategy (a) As-Is, (b) intermediate, and (c) To-Be scenarios.

Figure 5.
Forwarding decision of LRGF strategy—1st situation—example.

Figure 6.
Forwarding decision of LRGF strategy—2nd situation—example.

Figure 7.
City center scenario.

Figure 8.
Parking lot scenario. (a) Overview; (b) Zoom in the parking lot around RSU 447.

Figure 9.
Total active time of OBUs.

Figure 10.
Contacts per hour. (a) Number of all type of contacts per hour; (b) Number of valid contacts per hour; (c) Normalized number of valid contacts per hour.
Figure 10.
Contacts per hour. (a) Number of all type of contacts per hour; (b) Number of valid contacts per hour; (c) Normalized number of valid contacts per hour.

Figure 11.
Mobility of OBUs.

Figure 12.
Performance of LNHF, LRBF and LRGF strategies for the Rush Hour period in City Center. (a) Delivery rate; (b) Percentage of file distribution; (c) E2E delay; (d) Number of listened packets.
Figure 12.
Performance of LNHF, LRBF and LRGF strategies for the Rush Hour period in City Center. (a) Delivery rate; (b) Percentage of file distribution; (c) E2E delay; (d) Number of listened packets.

Figure 13.
Performance of LNHF, LRBF and LRGF strategies for the Parking period. (a) Delivery rate; (b) Percentage of file distribution; (c) E2E delay; (d) Number of listened packets.
Figure 13.
Performance of LNHF, LRBF and LRGF strategies for the Parking period. (a) Delivery rate; (b) Percentage of file distribution; (c) E2E delay; (d) Number of listened packets.


Table 1.
Characteristics of the dataset for each evaluated scenario.
| Period | Region | OBUs | RSUs | |
|---|---|---|---|---|
| Rush Hour | 06 a.m.–10 a.m. | City center | 161 | 18 |
| Parking | 08 p.m.–12 p.m. | Parking lot | 120 | 1 |
© 2020 by the authors. Licensee MDPI, Basel, Switzerland. This article is an open access article distributed under the terms and conditions of the Creative Commons Attribution (CC BY) license (http://creativecommons.org/licenses/by/4.0/).
Share and Cite
MDPI and ACS Style
Pessoa, G.; Guardalben, L.; Luís, M.; Senna, C.; Sargento, S. Evaluation of Content Dissemination Strategies in Urban Vehicular Networks. Information 2020, 11, 163. https://0-doi-org.brum.beds.ac.uk/10.3390/info11030163
AMA Style
Pessoa G, Guardalben L, Luís M, Senna C, Sargento S. Evaluation of Content Dissemination Strategies in Urban Vehicular Networks. Information. 2020; 11(3):163. https://0-doi-org.brum.beds.ac.uk/10.3390/info11030163
Chicago/Turabian StylePessoa, Gonçalo, Lucas Guardalben, Miguel Luís, Carlos Senna, and Susana Sargento. 2020. "Evaluation of Content Dissemination Strategies in Urban Vehicular Networks" Information 11, no. 3: 163. https://0-doi-org.brum.beds.ac.uk/10.3390/info11030163
Note that from the first issue of 2016, this journal uses article numbers instead of page numbers. See further details here.