The Effect of Augmented Reality on Students’ Learning Performance in Stem Education

Institute of Information and Communication Technologies—Bulgarian Academy of Sciences, 1113 Sofia, Bulgaria
*
Author to whom correspondence should be addressed.
Information 2020, 11(4), 209; https://0-doi-org.brum.beds.ac.uk/10.3390/info11040209
Submission received: 2 March 2020
/
Revised: 6 April 2020
/
Accepted: 12 April 2020
/
Published: 15 April 2020
(This article belongs to the Special Issue Selected Papers from ESM 2019)
Abstract
:The effect of one of the most popular 3D visualization and modelling technologies with haptic and touch feedback possibilities—augmented reality (AR)—is analysed herein. That includes a specific solution, incorporating augmented reality. A case study for delivering STEM (science, technology, engineering, and mathematics) content using this tool at one secondary school in Sofia is presented. The experience gained in one school year of using facilities for a STEM enrichment program has been examined.
1. Introduction
We are living in a time of rapid advancement in terms of the capabilities and economic viability of augmented reality (AR), virtual reality (VR), multi-user virtual environments, and various forms of mixed reality (MR). These new media seem to open up extraordinary opportunities for the enhancement of motivation and learning across a range of subject areas, student developmental levels, and educational settings. With the development of practical and affordable virtual reality and mixed reality, people now have the chance to experience immersive learning both in classrooms and informally in homes, libraries, and community centres [1].
Virtual reality is an artificial environment which is experienced through sensory stimuli (such as sights and sounds) provided by a computer and in which one’s actions partially determine what happens in the environment [2]. This is the use of computer technology to create a simulated environment.
Virtual reality’s most often used component is the head-mounted display (HMD). Audio-visual information is most easily replicated in virtual reality, but a lot of research and development is being conducted with regard to the other senses. Tactile inputs allow users to feel as though they’re actually walking through a simulation, rather than sitting in a chair. Haptic technologies, also known as feedback tech, have progressed from simple spinning-weight motors to high quality ultrasound technology. It is now possible to hear and feel true-to-life sensations along with visual VR experiences.
A lot of educational technology companies are using virtual reality to bring true to life experiences to the classroom, while highlighting the technology’s ability to inspire and grab the attention of the students. In the area of science, technology, engineering, and mathematics (STEM) education, fully interactive virtual laboratory simulations are designed to engage and stimulate a student’s natural curiosity as they learn [3]. However, there are certain risks, too. Experts are still trying to understand the impact of VR on children’s learning. Research conducted by Bailenson and his team [4] at their Stanford lab in 2008 looked at the potential psychological effects on young children using VR. In some cases, children who experienced swimming with whales in a VR environment developed false memories of having visited SeaWorld in real life [4,5]. Bailenson believes that concerns about VR use can be addressed in two ways: moderation and supervision. VR is an engaging tool, but within a 40-min lesson plan, it should be used carefully—for two or three minutes.
While virtual reality offers the simulation of an entirely computer-generated perceptive experience, augmented reality is the integration of digital information with the user’s environment. Unlike virtual reality, which creates a totally artificial environment, augmented reality uses the existing environment and overlays new information on top of it. AR looks to augment the digital world with physical objects, allowing a real-world user to seamlessly interact with digital components. The purpose does not consist only of the quantitative enrichment of information [6]. A study which investigated the use of AR in art education confirms that, “The use of augmented reality has a key position in the latest developments related to learning with technology, which views the new technological devices as a means capable of promoting the learning process” [6]. Further on in the same research: “AR is now transforming human processes by accelerating skills development and empowering guidance.”
The popularity of AR is rising because it brings elements of the virtual world into the real world, thus enhancing the things we see, hear, and feel. It brings computer-generated objects into the real world, but they can be seen only by the user. When using augmented reality applications, the user sees a combination of synthetic and natural light. Overlaying images are projected on top of a pair of glasses, which allows the images and interactive virtual objects to be on top of the user’s view of the real world. Some of the things that can make AR accessible are AR applications. AR could be very suitable for simulations, especially in the area of STEM education.
With the rise in computing power and lowering of computer costs there has been an increase in the use of simulations. School laboratories and classrooms are starting to be widely equipped with suitable technological infrastructure. A simulation, for the purposes of this study, is a computer-based interactive environment with an underlying model. In the STEM area in particular, real equipment can be difficult to obtain, so simulations enable students to experience phenomena they normally would not be able to access first-hand. For example, simulations can take the place of laboratory equipment that might be too expensive or dangerous to have in a school. Simulations can also be used to explore phenomena that occur over long or extremely short time periods in a way that can easily fit into a class period. With simulations, students can also manipulate variables and see the results of multiple experiments without having to actually replicate them. Augmented reality has the potential to combine the real with the virtual world. AR is a technology that makes it possible to generate virtual environments that overlap a real environment in a direct or indirect way, allowing the interaction of reality with the visualization of virtual graphics [7]. As virtual information layered over a real environment, any type of information can be digitized; e.g., text, images, video, audio, web links, and three-dimensional (3D) models. This functionality is one of the main characteristics enabling this technique to be applied to a wide range of human activities, education being the most important among them [6]. Augmented reality is capable of being taken as a didactic tool which contributes to transforming modes of learning. The potential of AR in education was identified almost from its inception—“a system that allows the user in the classroom to manipulate 3D objects and receive information from a real environment is clearly of great relevance in the educational field” [7]. In view of these benefits, it is believed that using simulations based on AR in the classroom can help improve learning [8]. This technology “has made it possible for both teachers and students to see information in a real environment that would otherwise be impossible to show, allowing many scientific concepts to be visualized that until now have been impossible to illustrate clearly” [7].
Some recent studies focus on this technology and have summarised that the superposition of information on the real world is basically aimed at improving the perception that an individual has of the real world by initiating the creation of an interactive experience. Thus, the technology used in the classroom is going to be adaptable, responsive, immersive and engaging, individualized, and appropriate. It should provide the learner with a unique experience that is not easily reproduced or possible in a traditional classroom. Therefore, the fundamental objective of AR is to add more information that is more meaningful to real objects, thus improving students’ understanding of the world that they are observing [7].
This paper aims to explore the impact of an AR tool on students’ learning performance. The research estimated the effect of a learning environment mediated by augmented reality, implemented to strengthen the learning and understanding of the education material.
2. Materials and Methods
2.1. AR Tool
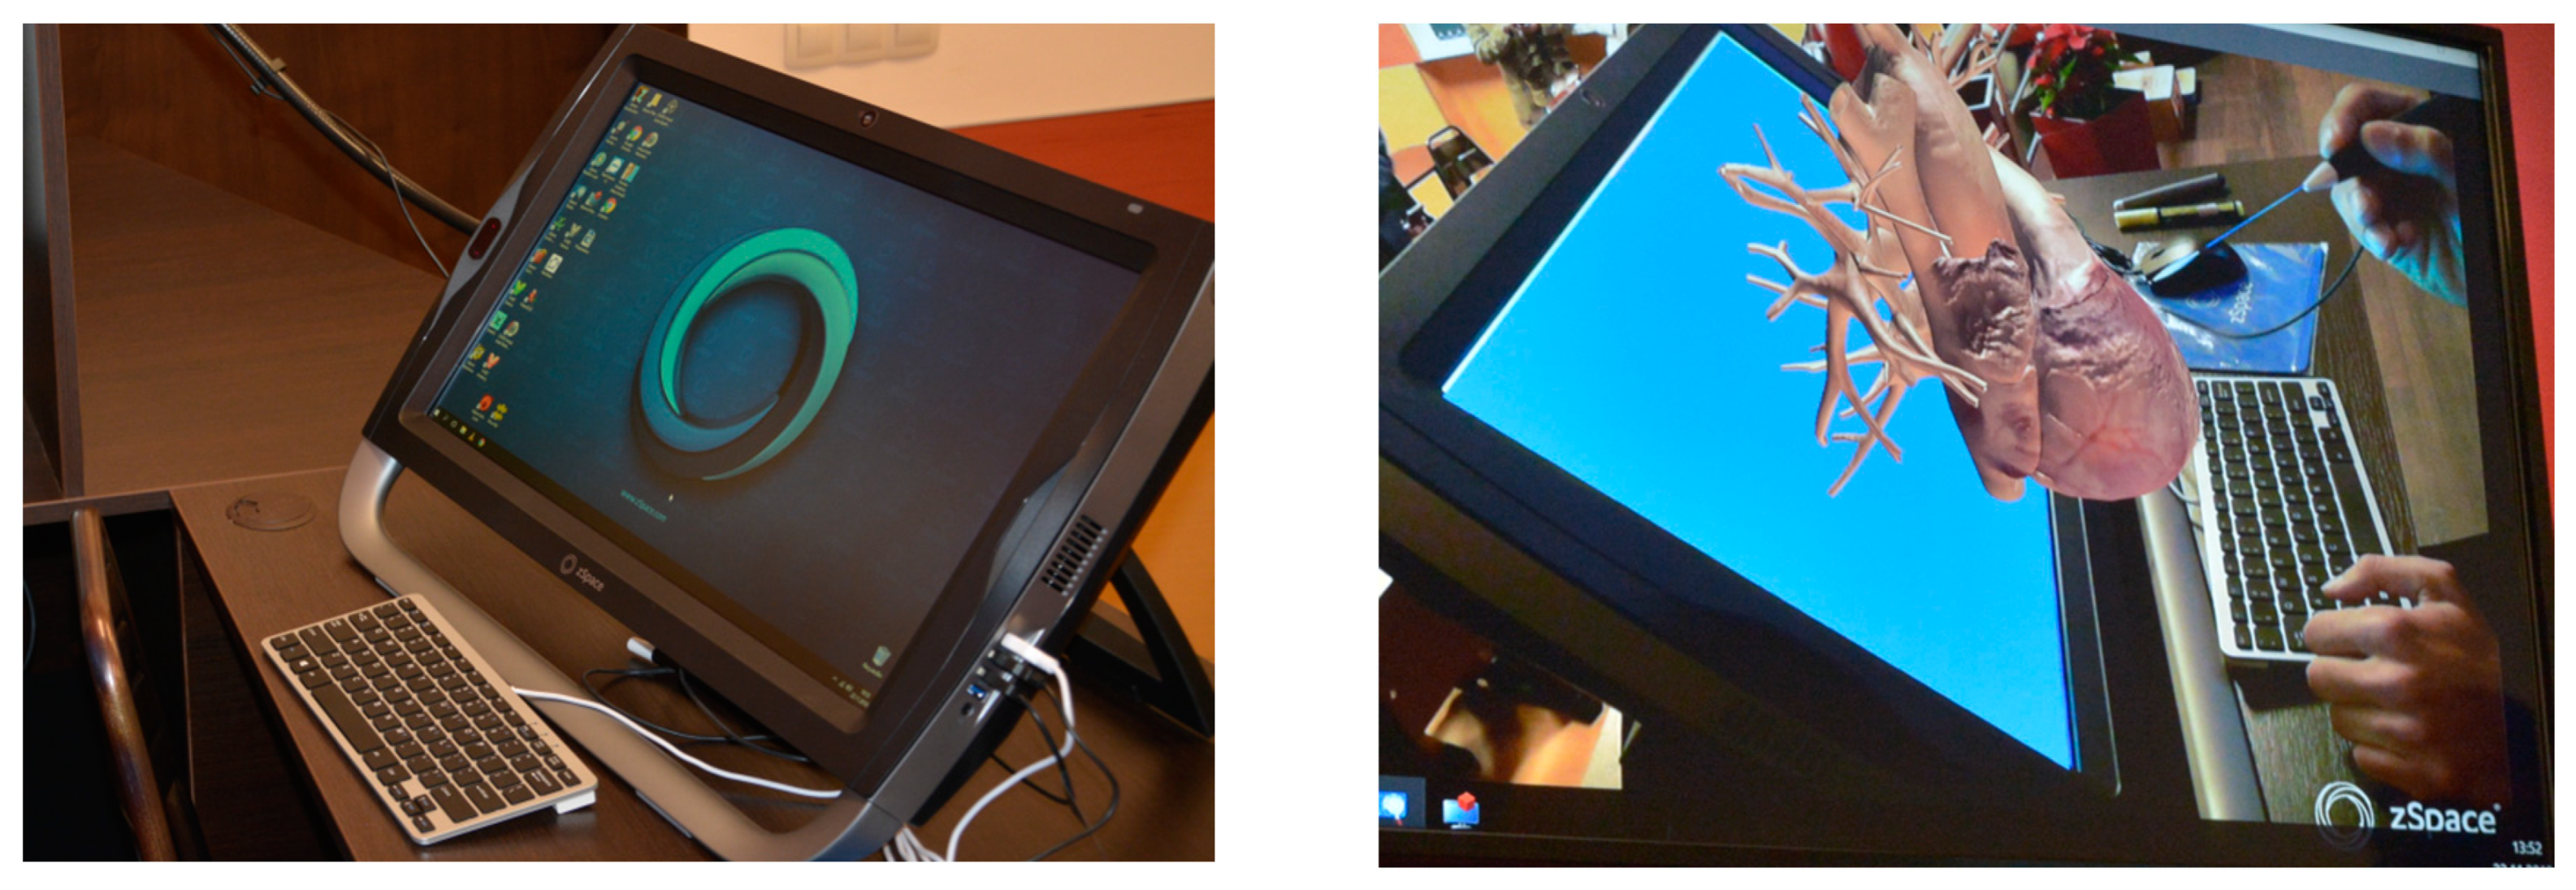
One of the most successful examples of an AR system is zSpace® [9]. In 2015, zSpace® Inc. released the all-in-one solution for education consisting of a virtual reality monitor and computer. The system provides students with a realistic learning environment that is aligned with the next generation science standards (NGSS), common core, and state standards. The virtual-holographic images can be lifted from the screen and manipulated with the accompanying stylus. The solution allows for group interaction, as participants only need 3D glasses, as opposed to VR headsets [10].
The zSpace® system uses a 1920 × 1080 pixel LCD screen, and the hardware switches between the left and right images through a circularly polarized light that enters the eye. The glasses contain small reflective tabs that the computer uses to track where users are looking. This software prevents nausea and headaches by keeping the image focused.
zSpace® combines elements of AR and VR to create lifelike experiences that are immersive and interactive. The system lets the students dissect animals and organs, manipulate compounds and structures in 3D, and run experiments without the need for costly lab equipment and supplies.
2.2. AR Tool Application
zSpace® consists of several learning and simulation applications. Some of them are: zSpace® Studio—a collection of models from various subject areas and a set of pre-made activities, available in different languages; Newton’s Park—a physics simulation environment, promoting discovery through experimentation and allowing data gathering and analysis; Human Anatomy Atlas—for independent student research on the human body, allowing self-assessment of learning at the same time.
The key factors in choosing the solution were:
- Scope—the technology can be used in many subjects and can address different problems;
- Collaboration—the possibility for working in small groups of 2 or 3 students; the technology itself encourages teamwork;
- Experimentation—opportunities to perform scientific procedures;
- Creativity—creativity is encouraged, and they can let their imaginations run riot and take risks without fear of failure;
- Critical thinking and evaluation—the technology supports complex problem solving and evaluative thinking, helping them to analyse and understand abstract concepts better.
2.3. Evaluation
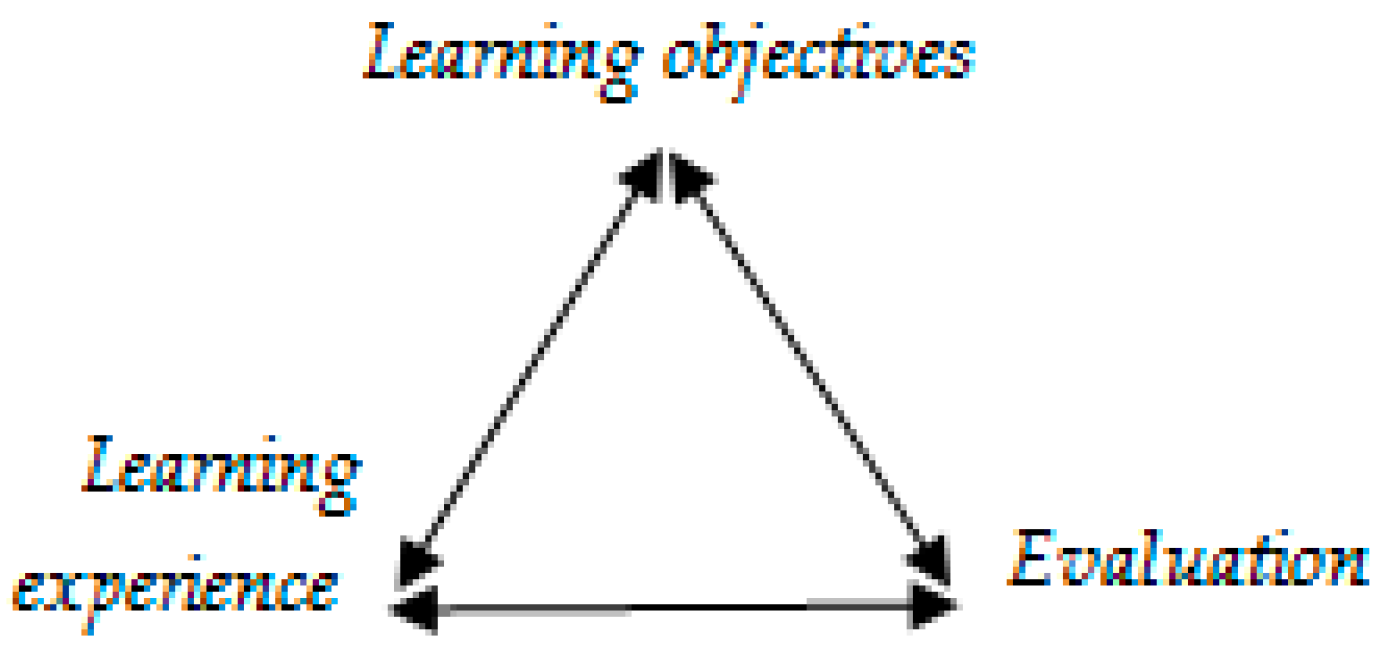
Some recent studies focused on the relationship between augmented reality and STEM education and its potential. The effectiveness of the educational paths carried out through augmented reality represents one of the most interesting issues [6]. This type of technology was new for the school and one of the aims of the teachers was to measure the system’s effectiveness. That is why the model that was used included three important elements (Figure 2):
- Well-defined learning objectives;
- Authentic learning experiences;
- Evaluation—students’ results and their learning experiences.
One approach to evaluating the value of making an effective simulation is to conduct comparative tests. The experience gained for one school year has shown that the virtual experiments led to much more advanced learning than would ever be possible in a typical classroom. These initial findings have shown that simulations are a promising way of improving students’ learning outcomes, especially in STEM subjects. In order to prove this, further analysis was done.
Evaluating whether learning objectives are being met, especially when a lot of investments in equipment have been made, is crucial for the effective usage of this equipment. This requires creating an evaluation strategy, collecting assessment data, and making recommendations for additional improvements.
3. Workflow for the Experiment
It has been observed in numerous studies that the educational needs and ways of perceiving information by modern students have changed over the last few years [13]. The New Media Consortium (NMC) Higher Education Horizon Reports specifically highlighted AR/VR as one of the key educational technologies and drivers for learner engagement [14]. The research [6] points out that, “Augmented reality plays a meaningful role in the relationship between technologies and didactic mediation; its applications are the prerequisite for augmented learning, through the reproduction of specific scenarios which go beyond the pure theoretical dimension.”
Starting from such assumptions, the present contribution is meant to reflect specifically on the relationship between augmented reality and STEM education. The learning environment must take advantage of the ICT ecosystem [15] that coexists with the school.
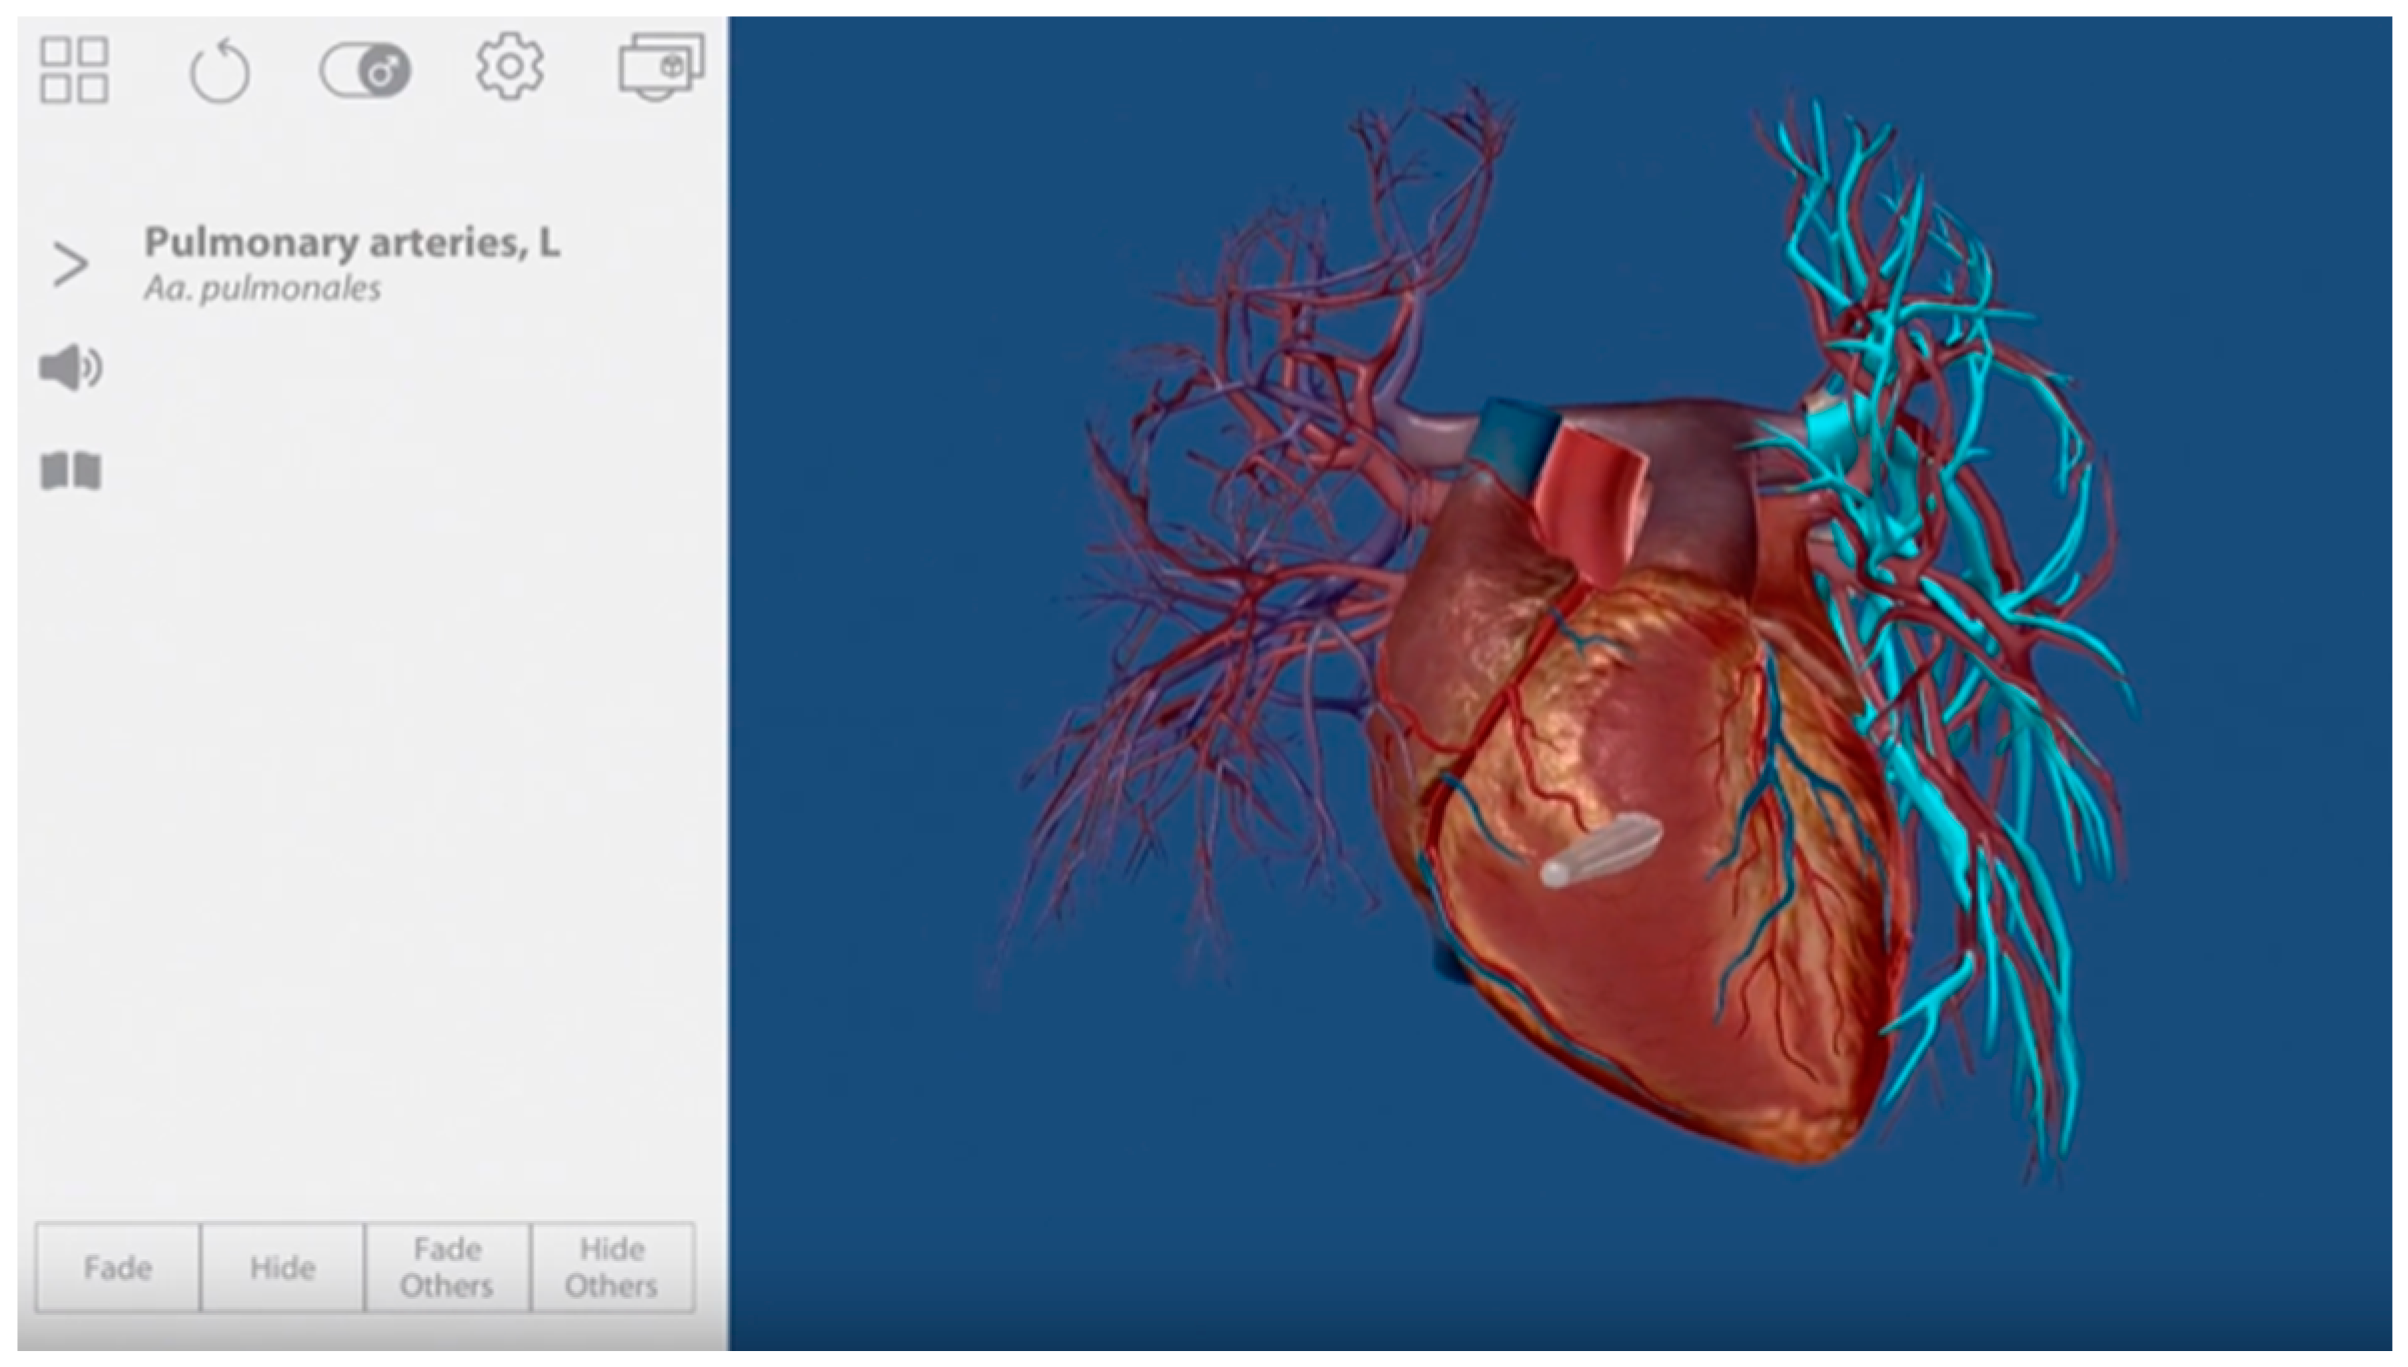
The target participants were high school students, divided into three groups according to their study tracks—humanitarian, STEM, and information technologies (IT). This means that these are 3 separated groups of students with specific interests, who had to study the same learning material in biology at this stage of their education. The target participants were taking an anatomy course during their obligatory biology lessons. The topics covered in the course included the heart and blood vessels; cardiac activity; blood; and a summarizing one—the circulatory system. The students had not used any AR tools prior to this study. The numbers of participants in the groups were as follows: 28, 28, and 24.
The impact on student learning performance was measured by comparing the results of the students before and after using an AR tool, using a pre-use and post-use tests as instruments for data collection. The AR educational tool (Figure 3) used was zSpace®.
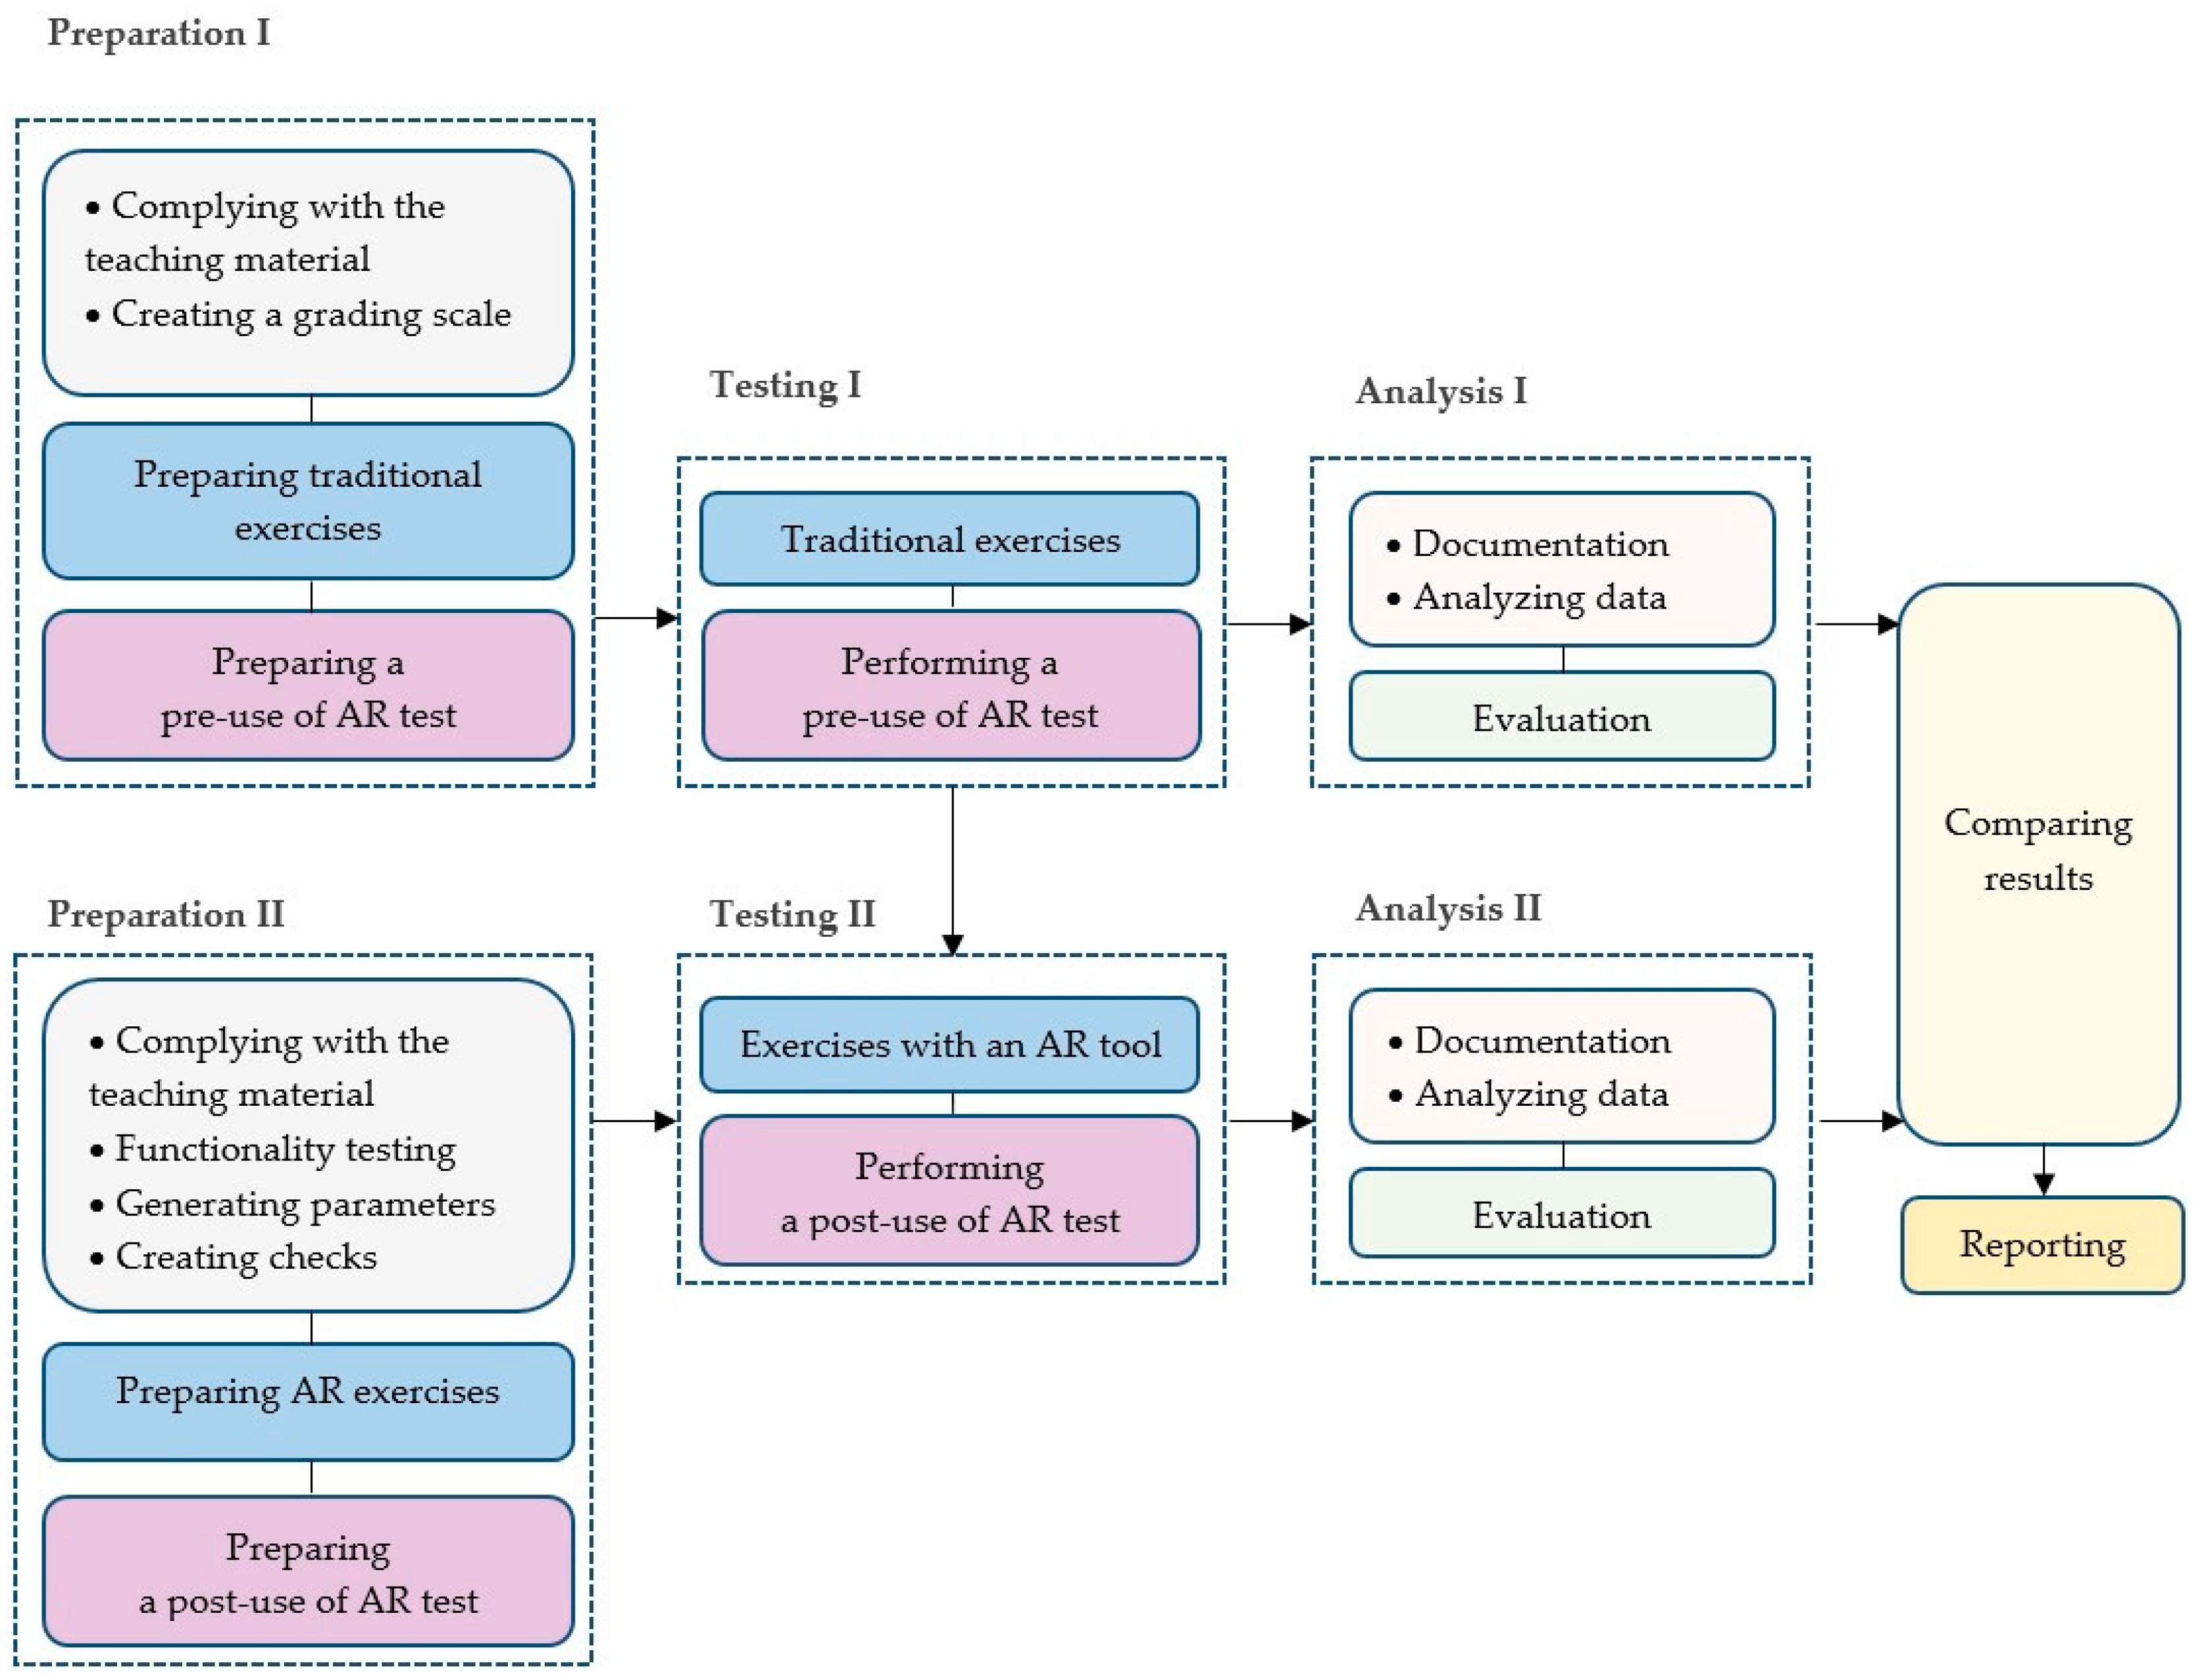
The workflow (Figure 4) for the experiment is the same for the 3 groups and the four topics taught.
- A topic is initially taught in a traditional way, using only basic tools—textbooks and some additional classroom teaching assets like 3D-models and a whiteboard.
- A set of preliminary prepared traditional exercises, consistent with the studied material, is performed.
- A pre-use of AR test for this topic is performed.
- The students’ pre-use of AR test results is documented, the data are analysed, and evaluations are done.
- A set of preliminary prepared AR enhanced exercises, consistent with the studied material, is performed. The students work in groups of 3.
- A post-use of AR test is performed.
- The students’ post-use of AR test results is documented, the data are analysed, and evaluations are done.
- The pre-use and post-use of AR test results are compared.
- These steps are repeated for each of the 4 topics taught, in every group.
This experiment is validated using a small sample size of 80 participants only. The research, however, can be expanded in the future. It began as an experimental study, with a small sample size. In the near future, we plan to evaluate the impact of the AR on the students’ learning performance using a large sample size of students from more grades and doing other subjects—physics and chemistry, for example.
It should be noted that the AR system used provides students with a visual and very realistic learning environment, which the traditional way of teaching cannot provide, and the post-use AR tests were done after every topic being had been practically explored twice—once before and once after using an AR tool.
4. Results
Microsoft Forms was used as an online tool for test creation, distribution, and data collection. The data collected from the questionnaires were exported and analysed using Microsoft Excel and its data analysis tools. Data from all tests performed with each group (before and after AR use) were summarized (Table 1).
- (1)
- Results of Group 1, Group 2, and Group 3 on Avarage
The post-use means increased (Table 2), but it is still necessary to determine whether the change in each mean value was significant. Significance indicates that the difference between mean values is greater than a value that would be expected by chance. The null hypothesis was that the AR post-use mean value would be equal to the AR pre-use mean value. A significance level of 0.05 was used. Thus, p values less than 0.05 were considered significant, while p values greater than 0.05 were considered insignificant.
In order to determine whether the mean difference between the two sets of observations was significant, a paired t-test was done.
The t-test was used to establish whether the correlation coefficient was significantly different from zero, and hence that there was evidence of an association between the two variables (Table 3).
Pearson’s correlation was calculated. Pearson’s correlation coefficient (1) is a statistical measure known as r value. It describes the degree of associative influence of the variables [16]. For each two variables, a value is displayed that shows the correlation strength. The coefficient is not affected by the magnitude changes of the variables.
where n—number of pairs of scores; ∑xy—sum of the products of paired scores; ∑x—sum of x scores; ∑y—sum of y scores; ∑x2—sum of squared x scores; ∑y2—sum of squared y scores. The two variables x and y are quantitative and continuous.
The value 0.84 of Pearson’s correlation coefficient shows a strong correlation between variables—as one variable increases, the other variable tends to increase as well.
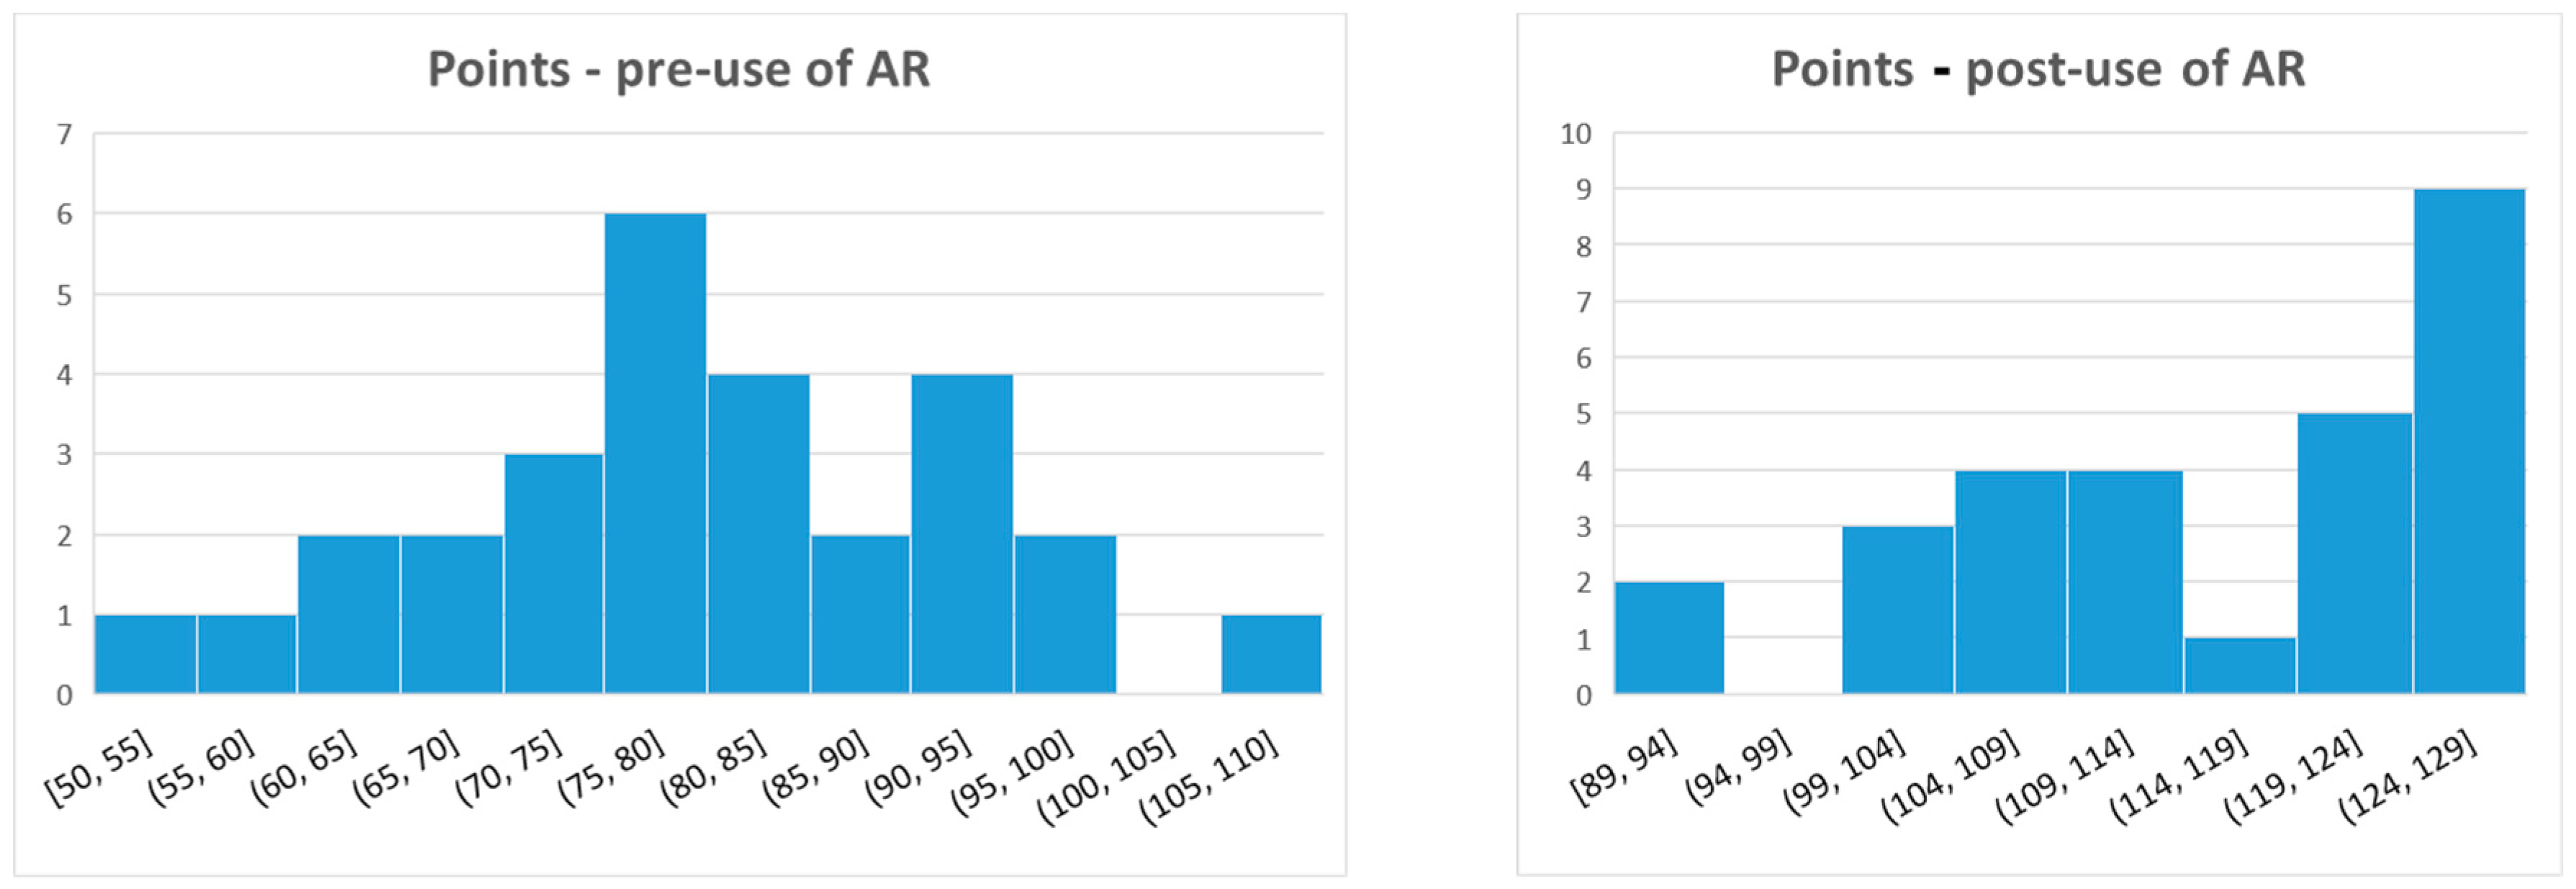
Based on the information provided in Table 3, significance of the change in mean value was determined. Histograms of the results of the Student Group 1 is shown on Figure 5.
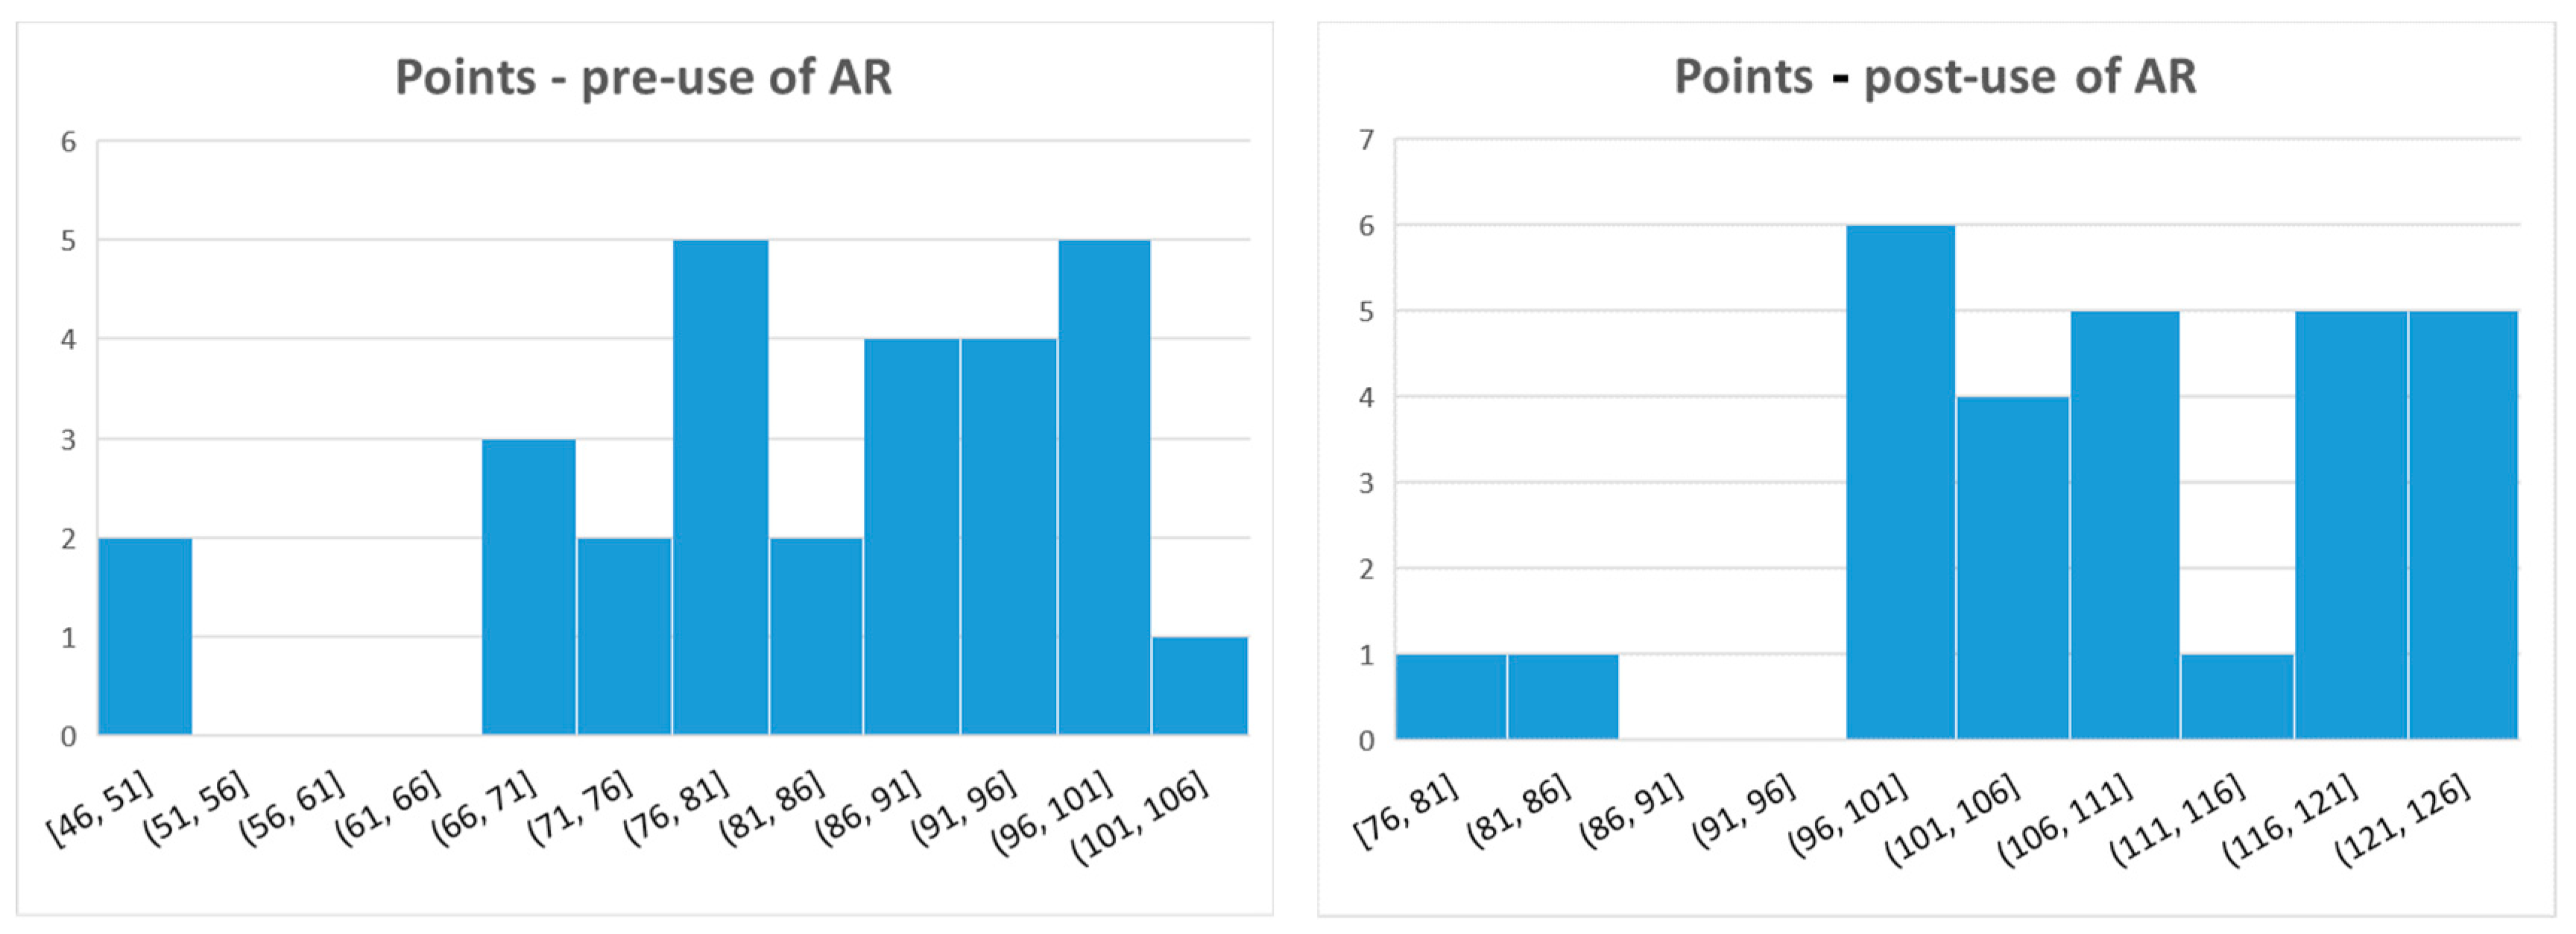
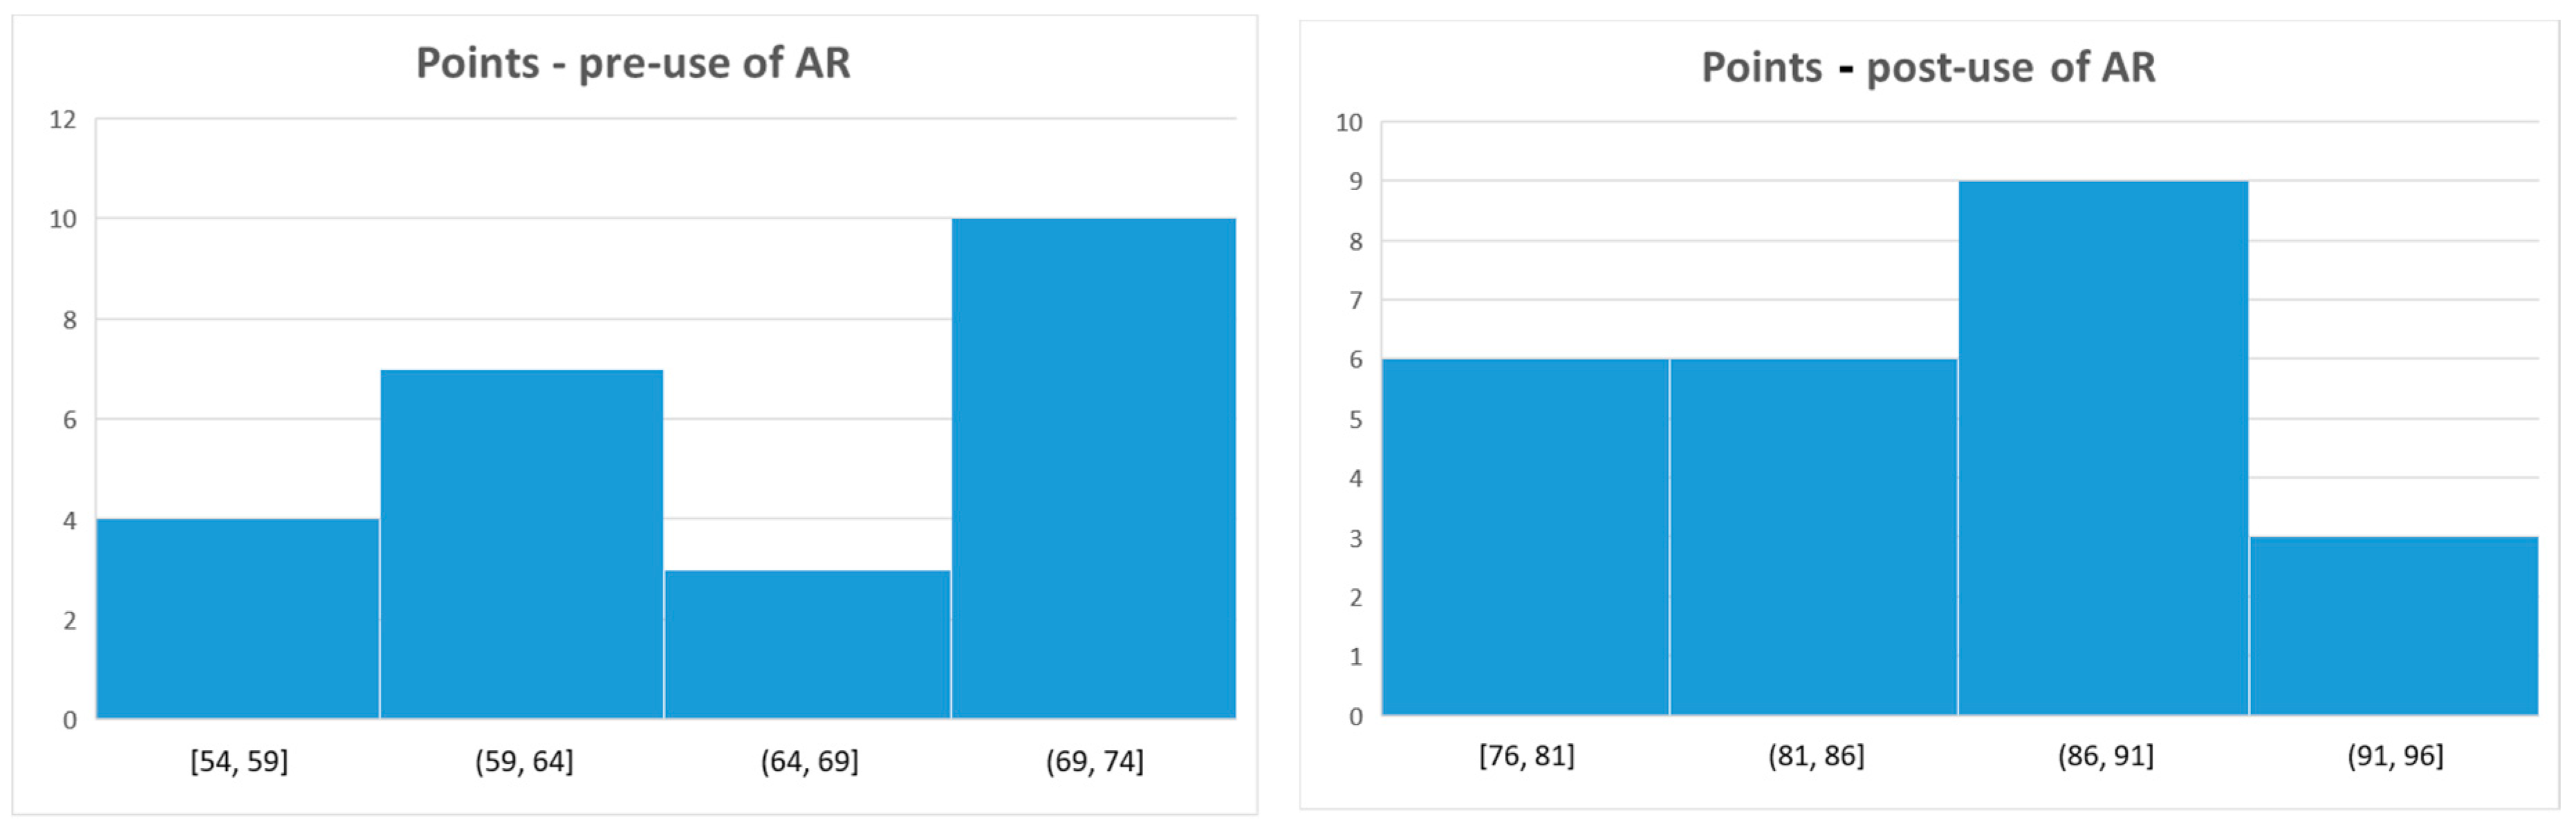
Similar paired t-tests were completed for Group 2 and Group 3. The results are summarised in Table 4 and Table 5. Table 6 shows Pearson’s Correlation coefficients for Groups 1, 2, and 3 after all paired t-tests. Histograms of the results of the Student Groups 2 and 3 are shown accordingly on Figure 6 and Figure 7.
- (2)
- Results of the Group 2 Data
- (3)
- Results of the Group 3 Data
It can be seen that in all three groups, the use of an AR tool and environment led to a statistically significant difference in the level of the students’ understanding of the study material, compared to the traditional text and graph-based tools for learning.
5. The Combination between the AR and Physical Facilities for a STEM Enrichment Program
The interior of the classroom should be considered conceptually as a teaching and educational tool that stimulates and supports the complete learning process, helps to establish rational, and values educational tasks through the various expressive means of art and design.
The misconception that the availability of top technology in the classroom eliminates the need for beauty and cosiness is widespread. Augmented reality is considered sufficient to give students a sense of completeness in both the environment and the learning process. Many modern classrooms, with their sterility, are reminiscent of the rigorous scientific space used by serious, experienced scientists. The interaction between the physical environment and technology is often overlooked; it is not taken into account that in addition to virtual augmented reality, there is also a material augmented reality, created by the human imagination that combines art, science, and interior design in a learning environment—a décor of the learning process. A quality learning process combines traditional with technological means. Similarly, a quality classroom has to combine comfort with the inspiring and motivating potential of design.
As acquisitions of different types of knowledge and skills require an appropriate environment and tools, acquisitions of different types of knowledge at school must incorporate all possible teaching and learning resources.
The arguments in this direction are from a study which compared the performances of students in traditional classrooms with modern technological equipment and the performances of students in design rooms with the same technological equipment. A recent study by the University of Salford [17] discovered that classroom design can impact learning by 25% (both positively and negatively).
6. Conclusions
The objective of this research was to explore the impact of an AR tool on students’ learning performance. The study has shown a substantial improvement in students’ understanding of the matter studied.
In accordance with other studies [7], not only does AR make the teaching and learning processes simpler, but it also makes them more interesting and motivating. Based on an analysis of the data on the effectiveness of learning through augmented environments and the written tests, it can be affirmed that the integration of AR in the above-mentioned learning unit had significant effects on the learning of the associated content.
During our research, we have found many benefits to using zSpace in teaching STEM subjects, especially biology. Among them are the ease of use, the high level of personalization, and the possibility to run many different applications, and thus zSpace® can be used for tailored learning for complex concepts in different subjects. AR technology like zSpace® offers an immersive experience that also allows for collaboration and this could be clearly seen during the AR exercises, wherein the students worked in groups of three. A study [18] conducted at North Carolina State University showed student improvements in understanding when mixed reality experiences were a part of the learning process.
Another advantage of the system is its durability. During a class, one of the systems was dropped inadvertently from 1.8 m height, without receiving any damage.
As a main disadvantage of the system, we note its price of around $7000.
This research shows that the AR technology, especially when used in STEM education, allows students to explore, practice and interact with STEM content without worrying about financial or ethical issues, such as costly consumables or animal injury. It provides opportunities for experiments and recovery from failure, while working in a safe environment. In general, the virtual, augmented, and mixed augmented reality tools provide this. At the same time, the experience has shown it is difficult for people to become more educated, regardless of the available applications and tools. It is clear that people and technology must go hand in hand, but the “golden ratio” between the them must be sought.
Author Contributions
Conceptualization and methodology, P.D.P. and T.V.A.; investigation, resources, data curation, P.D.P.; writing—original draft preparation, P.D.P.; writing—review and editing, T.V.A.; visualization, P.D.P. and T.V.A.; supervision, T.V.A.; funding acquisition, T.V.A. All authors have read and agreed to the published version of the manuscript.
Funding
This research was partially funded by the Bulgarian Ministry of Education and Science (contract D01–205/23.11.2018) under the NSP ICTinSES, approved by DCM number 577/17.08.2018.
Acknowledgments
Research described in this article was partially supported by the National Scientific Program “Information and Communication Technologies for a Single Digital Market in Science, Education and Security (ICTinSES),” financed by the Ministry of Education and Science. The collection of the data used in this study, and the design of the tests on which the results were based, were carried out by Nezabravka Treneva, a biology teacher at 134 Dimcho Debelyanov School, Sofia, Bulgaria.
Conflicts of Interest
The authors declare no conflict of interest. The funders had no role in the design of the study; in the collection, analyses, or interpretation of data; in the writing of the manuscript, or in the decision to publish the results.
References
- Liu, D.; Dede, C.; Huang, R.; Richards, J. (Eds.) Virtual, Augmented, and Mixed Realities in Education; Springer: Singapore, 2017. [Google Scholar]
- Virtual Reality (VR). Merriam-Webster.com Dictionary, Merriam-Webster. Available online: https://www.merriam-webster.com/dictionary/VR (accessed on 1 September 2019).
- Nersesian, E.; Spryszynski, A.; Lee, M.J. Integration of Virtual Reality in Secondary STEM Education. In Proceedings of the 2019 IEEE Integrated STEM Education Conference (ISEC), Princeton, NJ, USA, 16 March 2019; pp. 83–90. [Google Scholar] [CrossRef]
- Oh, S.Y.; Bailenson, J. Virtual and Augmented Reality; The International Encyclopaedia of Media Effects; John Wiley & Sons, Inc.: Hoboken, NY, USA, 2017; pp. 1–16. [Google Scholar]
- Kennedy, E. Can Virtual Reality Revolutionize Education? CNN. 1 November 2018. Available online: https://edition.cnn.com/2018/11/01/health/virtual-reality-education/index.html (accessed on 2 March 2020).
- Panciroli, C.; Macauda, A.; Russo, V. Educating about Art by Augmented Reality: New Didactic Mediation Perspectives at School and in Museums. Proceedings 2017, 1, 1107. [Google Scholar] [CrossRef] [Green Version]
- Del Cerro Velázquez, F.; Morales Méndez, G. Augmented Reality and Mobile Devices: A Binominal Methodological Resource for Inclusive Education (SDG 4). An Example in Secondary Education. Sustainability 2018, 10, 3446. [Google Scholar] [CrossRef] [Green Version]
- D’Angelo, C.; Rutstein, D.; Harris, C.; Bernard, R.; Borokhovski, E.; Haertel, G. Simulations for STEM Learning: Systematic Review and Meta-Analysis (Executive Summary); SRI International: Menlo Park, CA, USA, 2013. [Google Scholar]
- zSpace. Learning through AR/VR Experiences. Available online: Zspace.com (accessed on 29 February 2020).
- Do, K. 3d Technology at ISTE 2015. Cyber Science 3D. 2015. Available online: https://vivedlearning.com/3d-technology-at-iste-2015-3/ (accessed on 2 March 2020).
- Opening of New STEM Laboratories Gives Sofia Pupils Room for Inspiration. Available online: https://www.ort.org/en/news/opening-of-new-stem-laboratories-gives-sofia-pupils-room-for-inspiration/ (accessed on 20 January 2020).
- School Rooms of the Future—Center for Natural Sciences Opened in Our School. Available online: https://www.hebrewschool-bg.org/2018/11/27/opening-new-stem-laboratories-gives-sofia-pupils-room-inspiration/ (accessed on 20 January 2020).
- Lytridis, C.; Tsinakos, A.; Kazanidis, I. ARTutor—An Augmented Reality Platform for Interactive Distance Learning. Educ. Sci. 2018, 8, 6. [Google Scholar] [CrossRef] [Green Version]
- Birt, J.; Stromberga, Z.; Cowling, M.; Moro, C. Mobile Mixed Reality for Experiential Learning and Simulation in Medical and Health Sciences Education. Information 2018, 9, 31. [Google Scholar] [CrossRef] [Green Version]
- Hernández, C.; Duque, E. Creative Workshop Based on Augmented Reality for the Strengthening of Creativity through the Learning of the Design Thinking Methodology. Proceedings 2018, 2, 1359. [Google Scholar] [CrossRef] [Green Version]
- Dineva, K.; Atanasova, T. Regression Analysis on Data Received from Modular IoT System. In Proceedings of the European Simulation and Modelling Conference ESM’2019, EUROSIS-ETI, Palma de Mallorca, Spain, 28–30 October 2019; pp. 114–118. [Google Scholar]
- Barrett, P.; Barrett, L.; Zhang, Y. Teacher s’ Views of Their Primary School Class Rooms. 2016. Available online: https://usir.salford.ac.uk/id/eprint/36129/1/1-s2.0-S0360132315000700-main.pdf (accessed on 20 January 2020).
- Hite, R.L. Perceptions of Virtual Presence in 3-D, Haptic-Enabled, Virtual Reality Science Instruction. (Under the Direction of M. Gail Jones). 2016. Available online: https://repository.lib.ncsu.edu/bitstream/handle/1840.16/10986/etd.pdf?sequence=2&isAllowed=y (accessed on 20 January 2020).
Figure 1.
zSpace® all-in-one solution.

Figure 2.
Elements for measuring the system’s effectiveness.

Figure 3.
Heart and blood vessels augmented reality (AR) model screenshot.

Figure 4.
Workflow for the experiment.

Figure 5.
Histograms of the results of the Student Group 1.

Figure 6.
Histograms of the results of the Student Group 2.

Figure 7.
Histograms of the results of the Student Group 3.


Table 1.
Average results of the groups.
| Average Points before Using AR | Average Points after Using AR | ||||||||||
|---|---|---|---|---|---|---|---|---|---|---|---|
| Group | Test 1 | Test 2 | Test 3 | Test 4 | Average | Test 1 | Test 2 | Test 3 | Test 4 | Average | Change in % |
| Group 1 | 20 | 19 | 20 | 22 | 80 | 29 | 29 | 28 | 29 | 116 | 46% |
| Group 2 | 21 | 21 | 21 | 21 | 84 | 28 | 27 | 27 | 28 | 109 | 32% |
| Group 3 | 17 | 17 | 17 | 16 | 66 | 22 | 22 | 21 | 21 | 86 | 31% |
| Average | 19 | 19 | 19 | 20 | 77 | 26 | 26 | 26 | 26 | 104 | 36% |
Table 2.
Group 1 results—mean and standard deviation values.
| Pre-Use of AR | Post-Use of AR | |
|---|---|---|
| Mean Value | 80.14 | 115.50 |
| Standard Deviation | 12.81 | 10.89 |
Table 3.
Group 1—paired t-test results.
| Pre-Use of AR | Post-Use of AR | |
|---|---|---|
| Mean | 80.14285714 | 115.5 |
| Variance | 170.2010582 | 122.9259259 |
| Observations | 28 | 28 |
| Pearson Correlation | 0.84139693 | |
| Hypothesized Mean Difference | 0 | |
| Df | 27 | |
| t Stat | −26.53337332 | |
| P(T<=t) one-tail | 3.54139 × 10⁻²¹ | |
| t Critical one-tail | 1.703288446 | |
| P(T<=t) two-tail | 7.08278 × 10⁻²¹ | |
| t Critical two-tail | 2.051830516 |
Table 4.
Group 2 results—mean and standard deviation values.
| Pre-Use of AR | Post-Use of AR | |
|---|---|---|
| Mean value | 84.00 | 109.36 |
| Standard Deviation | 14.25 | 12.27 |
Table 5.
Group 3 results—mean and standard deviation values.
| Pre-Use of AR | Post-Use of AR | |
|---|---|---|
| Mean value | 65.92 | 86.08 |
| Standard Deviation | 5.84 | 4.92 |
Table 6.
Pearson correlations for Groups 1, 2, and 3 after paired t-tests.
| Group | Observations | t Stat | Pearson Correlation |
|---|---|---|---|
| Group 1 | 28 | −26.53337332 | 0.84139693 |
| Group 2 | 28 | −30.920481 | 0.959278606 |
| Group 3 | 24 | −37.30281491 | 0.898034854 |
© 2020 by the authors. Licensee MDPI, Basel, Switzerland. This article is an open access article distributed under the terms and conditions of the Creative Commons Attribution (CC BY) license (http://creativecommons.org/licenses/by/4.0/).
Share and Cite
MDPI and ACS Style
Petrov, P.D.; Atanasova, T.V. The Effect of Augmented Reality on Students’ Learning Performance in Stem Education. Information 2020, 11, 209. https://0-doi-org.brum.beds.ac.uk/10.3390/info11040209
AMA Style
Petrov PD, Atanasova TV. The Effect of Augmented Reality on Students’ Learning Performance in Stem Education. Information. 2020; 11(4):209. https://0-doi-org.brum.beds.ac.uk/10.3390/info11040209
Chicago/Turabian StylePetrov, Plamen D., and Tatiana V. Atanasova. 2020. "The Effect of Augmented Reality on Students’ Learning Performance in Stem Education" Information 11, no. 4: 209. https://0-doi-org.brum.beds.ac.uk/10.3390/info11040209
Note that from the first issue of 2016, this journal uses article numbers instead of page numbers. See further details here.