Improving Search Quality in Crowdsourced Bib Number Tagging Systems Using Data Fusion

St.Petersburg Institute for Informatics and Automation, Russian Academy of Sciences, St. Petersburg 199178, Russia
Information 2020, 11(8), 385; https://0-doi-org.brum.beds.ac.uk/10.3390/info11080385
Submission received: 11 July 2020
/
Revised: 25 July 2020
/
Accepted: 31 July 2020
/
Published: 5 August 2020
(This article belongs to the Section Information Systems)
Abstract
:Today, crowd computing is successfully applied for many information processing problems in a variety of domains. One of the most acute issues with crowd-powered systems is the quality of results (as humans can make errors). Therefore, a number of methods have been proposed to process the results obtained from the crowd in order to compensate human errors. Most of the existing methods of processing contributions are constructed based on a (natural) assumption that the only information available is unreliable data obtained from the crowd. However, in some cases, additional information is available, and it can be utilized in order to improve the overall quality of the result. The paper describes a crowd computing application for community tagging of running race photos. It presents a utility analysis to identify situations in which community photo tagging is a reasonable choice. It also proposes a data fusion model making use of runners’ location information recorded in their Global Positioning System (GPS) tracks. Field experiments with the applications show that community-based tagging can collect enough contributors to process photosets from medium-sized running events. Simulation results confirm, that the use of data fusion in processing the results of crowd computing is a promising technique, and the use of probabilistic graphical models (e.g., Bayesian networks) for data fusion allows one to smoothly increase the quality of the results with an increase of the available information.
1. Introduction
Despite the current advances in computer science and artificial intelligence, there are still some information processing problems that cannot be fully automated with obtaining results of the required quality. One of the ways to approach such problems provided by the development of global networks, is the use of the natural cognitive abilities of people, coordinated by modern information and communication technologies. This method is called crowd computing (or in a more general sense, crowdsourcing). Today, crowd computing is successfully applied to many information-processing problems in a variety of domains (see [1,2,3,4]).
However, involving a human in the information processing inevitably requires taking into account a number of factors: human’s limited productivity, the need for motivation and the possibility of error, or even purposeful distortion of information. These factors place specific requirements for crowd computing systems.
The most acute problem of crowd-driven systems is the quality of results [5,6,7]. Research on methods of improving the quality paves the way for wider adoption of crowd technologies and in a broader sense to the most efficient use of human potential on a global scale. As in many crowd computing applications the only information available to the requester (or, the platform designer) is the information provided by workers (contributors) only, most of the methods developed in this area are aimed on processing only unreliable information provided by humans [5,6,7]. In some cases, however, additional information is available that can also be utilized in order to improve the overall quality of the result. This information, in general, can have a form different from the one of the information provided by contributors, and there is a question about what formal basis and what techniques can be utilized to amalgamate (or, fuse) different kinds of available information to make the best use of them.
This is somewhat similar to the typical context of sensor data fusion when the true state of the observed object is deduced from a number of noisy sensor readings [8,9,10]; in both cases, by involving various data describing the same object/process, an attempt is made to improve the accuracy of its description.
This paper considers community tagging of running race photos. In particular, the paper presents three contributions. First, a crowd computing application for community image tagging is proposed. Second, a user utility model is developed, allowing to identify the situations, when the use of community-based image tagging is applicable. Finally, a data fusion model is proposed making use of the location information of runners recorded in their Global Positioning System (GPS) tracks, allowing to increase the accuracy (and utility) of any unreliable tagger (not necessarily a crowd-based one).
Non-professional long distance running races are a very popular pastime activity. The number of running races registered in Running in the USA website [11] exceeds 40,000. In Europe, there are about 10,000 running races organized annually [12] and 50 million people are estimated to run on a regular basis, some of them occasionally taking part in running events [13]. With today’s wide spread of digital photo equipment, most of these events are shot by many photographers, both professional and amateur. After the race, participants usually want to find photos they are in to save it as a souvenir. However, it is not an easy task, taking into account the number of photos from medium and big events (which may easily exceed 5000).
In general, the problem can be classified as an identity tagging (or identity labeling) problem, when for each photo identities of people depicted on the photo should be detected. At big races, this is usually done with a help of radio-frequency identification (RFID) tags attached to the runners, but for smaller races, it may not be the case; besides, RFID tags cannot be used to find photos in collections of amateur photographers not affiliated with the race administration.
Luckily, in most races runners wear bib numbers attached to their chests (see Figure 1), which allow transferring the task from a person who actually seeks his/her photos to anybody (or anything) who can detect numbers on photos. There are, of course, automated solutions leveraging computer vision and optical character recognition technologies (e.g., [14,15]), but as bib numbers are soft (and thus, can be distorted) and can be partially obscured by runners’ hands, fully automated solutions often do not allow achieving perfect results.
This paper explores a possibility to use voluntary crowdsourcing to tag race photos with bib numbers of runners depicted on them, allowing easy search of a photo by bib number. A crowd is formed (mostly) from the runners that took part in the event, usually through informing about this opportunity through social networks and official race event pages on the Internet. The incentive to take part in the tagging process is that it is significantly less time-consuming to tag a dozen photos than to wade through a thousand to find several of one’s photos.
Image labeling is probably one of the most used and studied applications of crowdsourcing, both in the commercial context (using Amazon Mechanical Turk or another platform) and non-commercial (e.g., [16,17,18,19]). However, the context of image labeling relevant to this paper is not quite the same as in popular crowdsourcing applications. First of all, the runners that actually took part in the event are more interested in watching event photos than random Amazon Mechanical Turk (AMT) workers and it creates additional motivation. Second, exploitation of one’s will to find his/her photos creates a non-monetary incentive that allows performing the tedious task at no cost (and that could be attractive to the race administration). To the best of the author’s knowledge, there are no published papers exploring this context and no such applications.
This paper presents a community-driven image tagging application and investigates the use of probabilistic graphical models (namely, Bayesian networks) to fuse different types of information about the image contents in the context of crowd-driven tagging and searching of running race photos.
Specifically, the paper presents:
- the design of crowd-driven application for photo tagging and search;
- statistics showing the participation in tagging and image tagging quality;
- formal model of user’s utility allowing to check if the use of the community-based system is reasonable and to analyze factors influencing the applicability;
- runner’s motion model that is used as additional information to improve search quality with noisy tags;
- Bayesian network-based fusion model to integrate crowd tagging with runner’s motion model;
- results of (simulated) experiments showing that the proposed model actually improves the quality of search.
2. Crowd-Driven Web-Application for Running Race Photo Tagging
The purpose of the application is to allow running race participants to find their photos (taken by various photographers, not necessarily affiliated with race organizers) with minimum effort. The simplest way to do it is by using bib numbers of the participants. As the bib numbers depicted in the photos are not known in advance, in order to enable the searching functionality a user has to tag some photos with the bib numbers depicted on them. This section describes the organization of the application, as well as basic quality management techniques.
2.1. Core Concepts
There are three actors in the system: race tagging manager, user (contributor), and trusted user (expert). Race tagging manager is responsible for administration of the process of tagging photos of the race. In particular, he/she can associate albums (stored in an external photo sharing service) with the race event, set values of thresholds activating race-related functions, decide about what information should be shown to users (show the list of top contributors or not), set the list of trusted users, and mark photos as “gold standard”. Different races are completely independent and may be managed by different people.
The user (contributor) has two main use cases: contribute, by tagging some photos selected by the service with bib numbers of runners depicted on that photo, and search for photos tagged by some bib number. The former use case is available to any user (anonymous or logged in) and the latter generally requires some contribution, the size of which is set by race tagging manager. The contribution is calculated as a difference between the number of tagged photos and the number of errors on “gold standard” photos (see Section 2.6 for more details).
A trusted user has the same use cases as an ordinary user (contributor); however, the output of trusted users is considered reliable and does not require verification. Trusted users are defined event-wise by the race tagging manager of the respective event.
2.2. User Interface
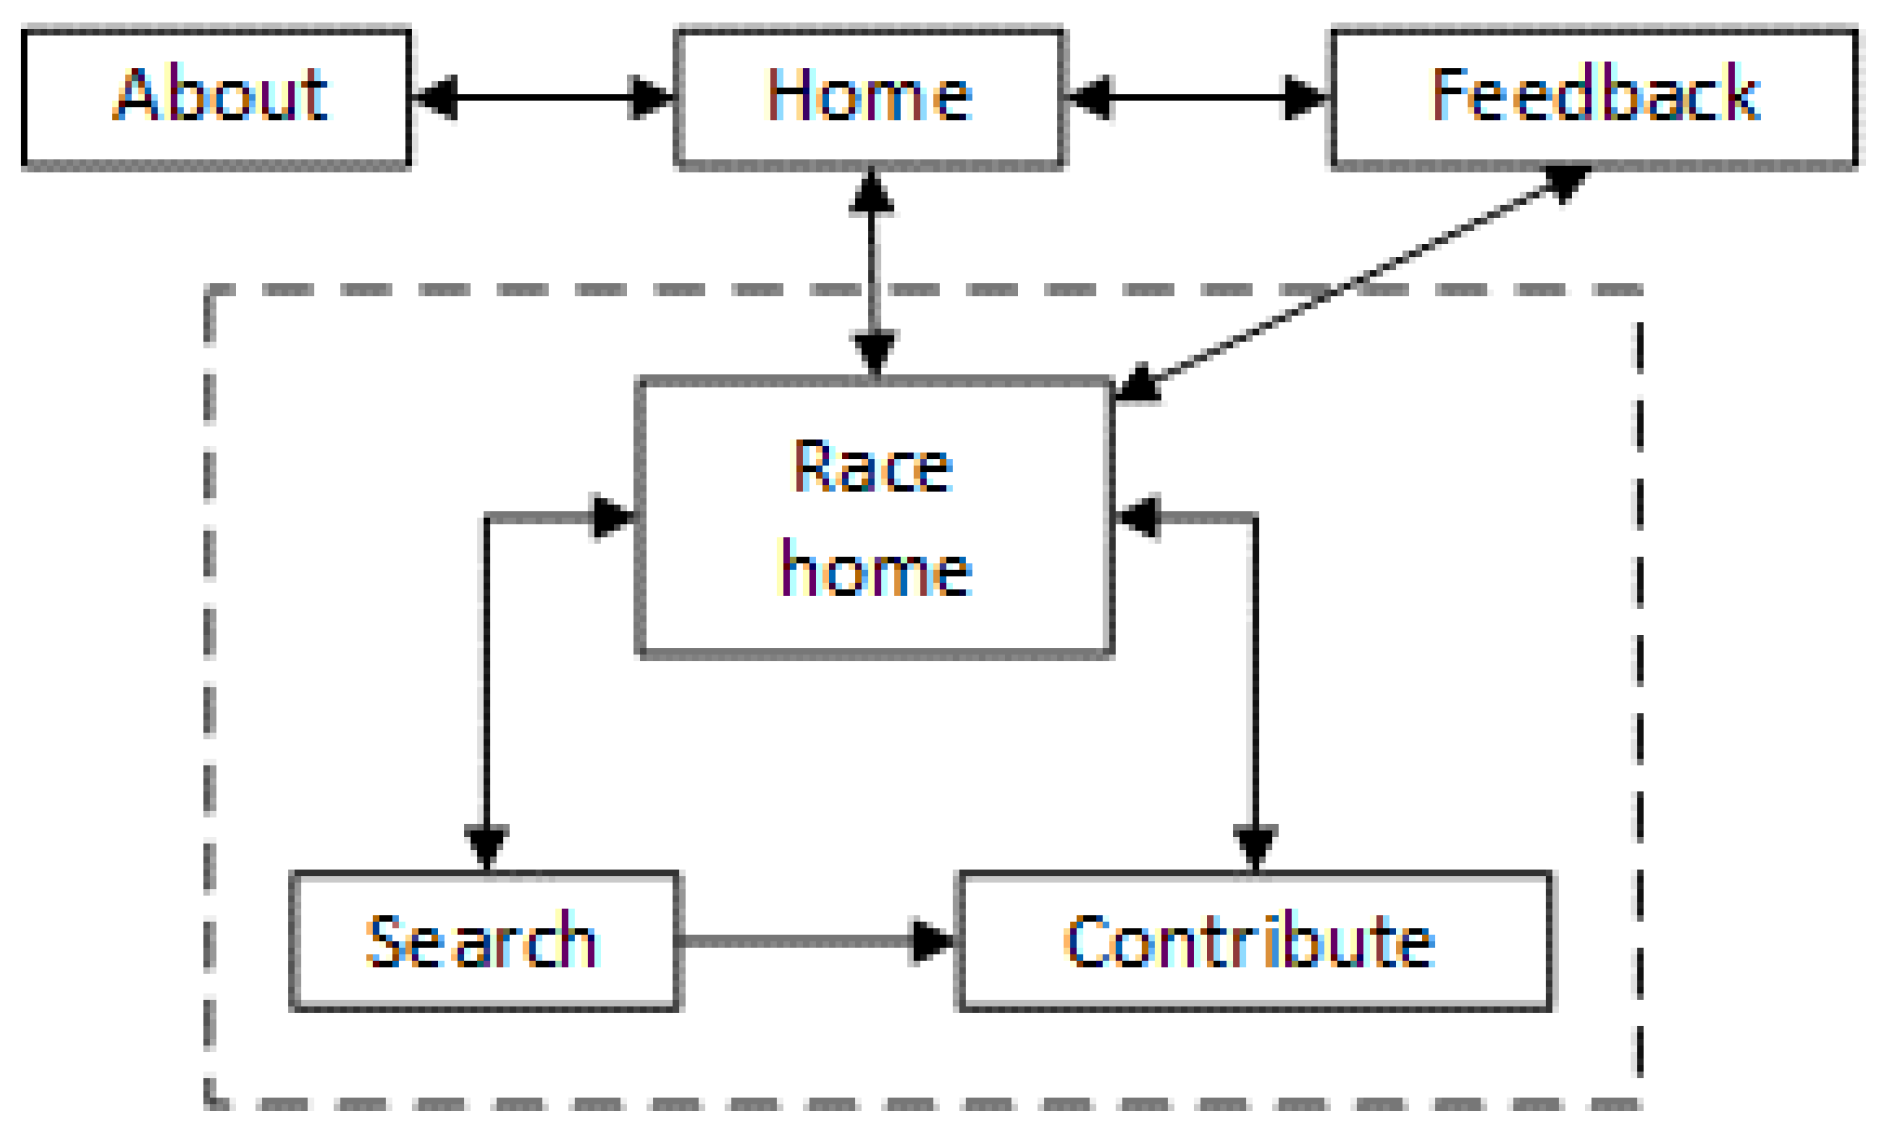
The interface consists of several web pages (Figure 2). The root (home) page of the application lists all the registered races sorted by the event (race) date with the most recent event on top. Race names (and thumbnails) at the home page are links referring to the respective race home pages.
The race home page is intended to serve as a main entry point for one race and its URL is shared in social networks and runner community sites to inform runners that photos of the event are available for tagging and searching by bib number. Therefore, the race home page contains prominent visual elements to perform both tasks. In addition to the button to move to the contribution page and search input field, the race home page displays the status of race-related functions, lists all the public albums with photos of the race indexed by the service, tagging progress status and (optionally) the list of top five best contributors. There are two race-related functions: the ability to search photos and the ability to follow the link to the full-size version of a found photo. The status (availability) of race-related functions for a user depends on the contribution of the user (by comparing the contribution with some thresholds). The progress status is displayed in terms of both the number of processed photos and the number of identified different bib numbers. The decision to show the list of best contributors is up to the race tagging manager. In practice, the decision to show this list is usually taken when there are at least three or four logged in contributors who tagged more photos than is necessary to enable the race-related functions.
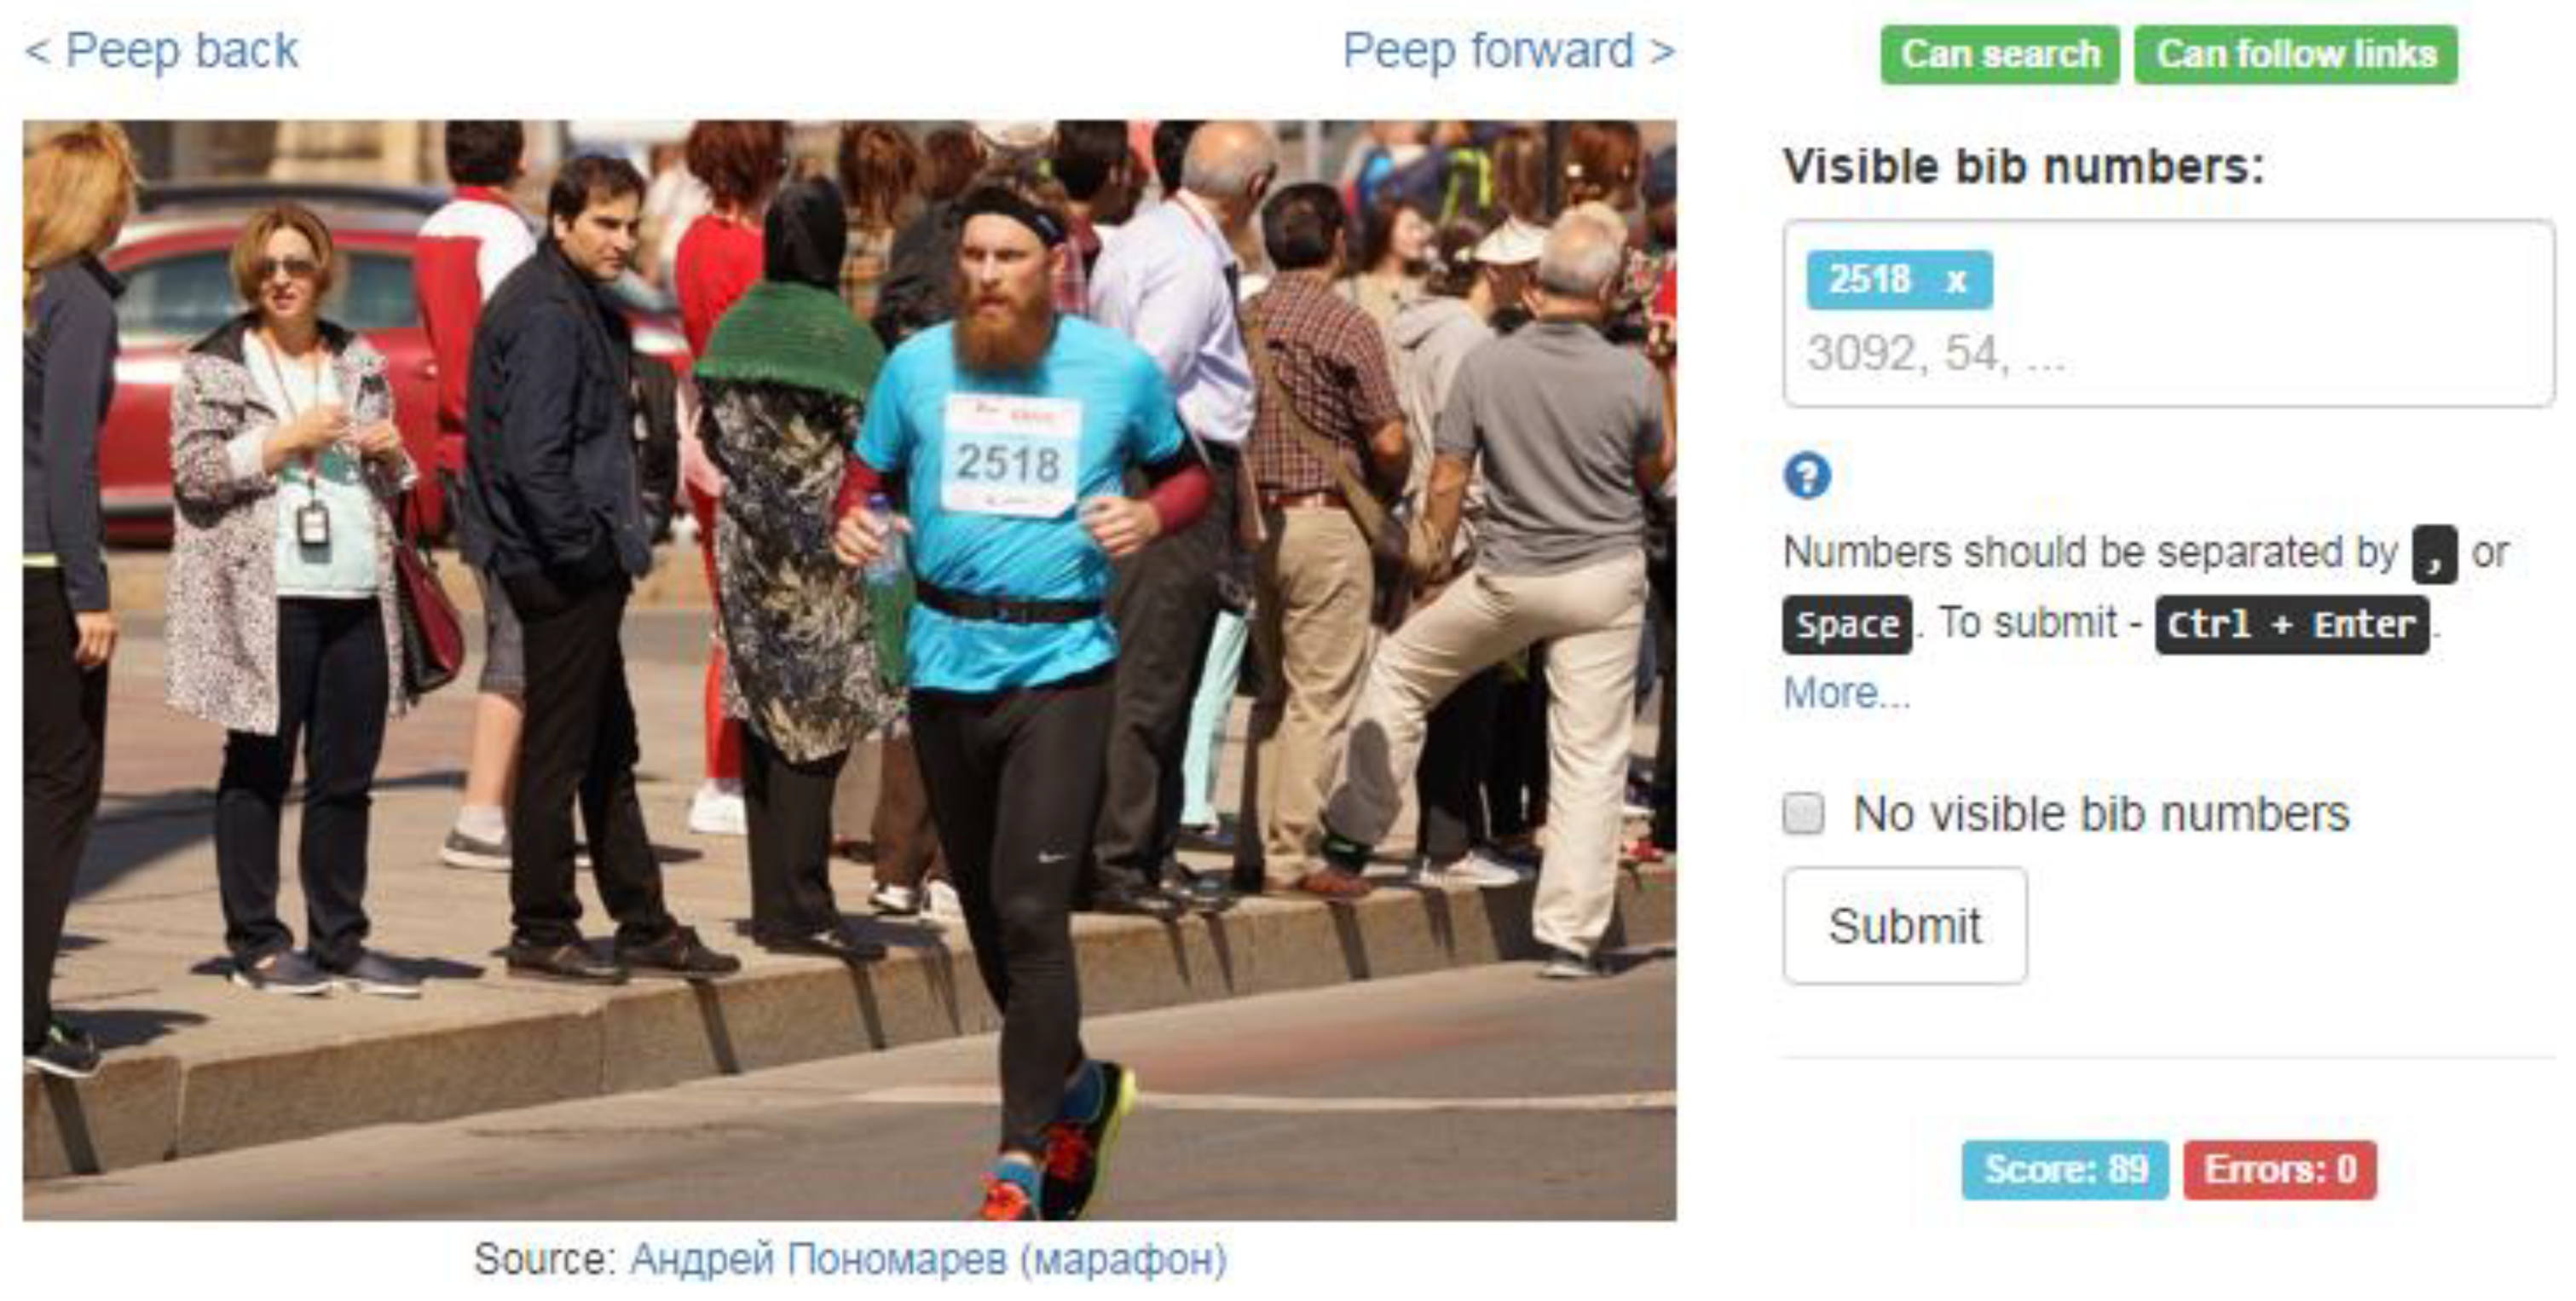
The contribution page (Figure 3) contains a photo to tag, links to show photos taken immediately before and after the current one, an input element to enter the list of bib numbers visible in the photo, a checkbox to indicate that there are no visible bib numbers in the displayed photo, a checkbox to mark the displayed photo as “gold” (this checkbox is displayed only to trusted users), and a submit button. The rationale behind having the dedicated checkbox for an image is some additional implicit consistency checking. This checkbox makes impossible quick and thoughtless submission of the unmodified contribution form, a user has to perform some action—either to enter something in the bib numbers input, or to set a mark in the checkbox. Despite this seemingly redundant operation, the contribution page is designed to be as convenient as possible; for example, a user can separate the tags by either space bar or comma and can use keyboard shortcuts to perform any possible action.
Search page displays thumbnails of photos tagged with the requested bib number. There are several variants of the search page driven by the tagging progress status. The contents are very similar, however, when not all photos are tagged yet, the search page attracts users’ attention to that fact and allows subscribing to receive an email when someone tags a photo by the requested bib number. The search page is displayed only if the user has tagged enough photos to activate the respected race-related function, or if there are no assignments available to that user. Thumbnails shown at this page can be either simple images or images linking to the full-sized photos, depending on the status of the respective race-related function.
2.3. Assignments
To improve the quality of tagging, the application implements a variant of redundancy-based quality control. In particular, it distinguishes between a task and an assignment. A task is to obtain bib numbers visible on one particular photo (for each photo, there is exactly one such task). An assignment is what is actually offered to a user and requires some effort from him/her. Each assignment is aimed on solving some task. Assignments related to the same task are offered to different users, leveraging the fact that different users are very unlikely to make the same errors. The result of an assignment is a set of bib numbers provided by the user during the completion of the assignment. After collecting the required number of assignments, the result of the task is inferred from the results of the respective assignments.
For example, there is a task of finding all the bib numbers present on a particular photo. To ensure tagging quality, two assignments based on this task are issued, one for user Alice, and another for user Bob (who happened to be online and ready to tag photos). Alice may find that the photo contains three bib numbers (e.g., «132», «4312», and «52») while Bob may find only two of them («132» and «4312»). Therefore, this task has now two completed assignments, the first (completed by Alice) has three bib numbers, the second (competed by Bob) has two. Based on the obtained sets, the application has to decide what is a reasonable set of bib numbers to associate with this image and whether it should ask more users to complete assignments related to this task.
The application distinguish two types of assignments: ordinary assignments and trusted assignments. Ordinary assignments can be processed by any user of the application, while trusted assignments can only be processed by trusted users (they are usually issued for the reconciliation of controversial results).
2.4. Scheduling
Scheduling is the process of both determining the result of a task based on accomplished assignments and, if it turns out to be not possible (e.g., the results are controversial), issuing more assignments (to collect more information). The implemented scheduling algorithm leverages redundancy-based quality assurance with relaxed consensus. That is, first of all, the results of two assignments are collected. If they are similar (the notion of similarity is clarified later), the task result is calculated as a union of assignment results; otherwise, the third assignment is issued. If among three assignment results, two are similar, the task result is calculated as a union of that two. If all the results are pairwise significantly different, a trusted assignment is issued, containing all the bib numbers from all the assignments with the respective number of assignments each bib tag is present. This allows highlighting rare (and therefore most “suspicious” tags) in the contribution page making the task easier for an expert.
The similarity between assignment results is calculated as Jaccard index, a popular measure to evaluate similarity and diversity of sets (in this case, sets of bib numbers listed by different users). The results are considered similar if Jaccard index value exceeds some threshold (usually, 0.6).
2.5. Selection
As it was noted earlier, there are two types of assignments: ordinary and trusted ones. There are usually few trusted users and although they are allowed to accomplish any assignment, it is reasonable to offer them trusted assignments first, as nobody else can resolve them. Another consideration (a more debatable one) is that selection algorithm prefers to offer assignments connected to the tasks that do not have any resolved assignments. Informally, it results in the process of “rough exploration” stage during which each photo is tagged by an unverified list of bib numbers followed by a “checking” stage during which these tags are verified, and contradictions are reconciled.
The rationale behind this algorithm is two-fold. First, to show a better progress (in terms of “started” photos and found bib numbers) and an impression that little work remains and therefore it is likely that all photos will be tagged. This impression seems to be important to incentivize the decision to contribute, however, there were no experiments performed to prove it. Second, to actually have at least non-verified tags for each photo in case there will not be enough contributors to verify them all and reconcile possible errors.
The problem of this approach to selection however is that for each user the time lag between assignment completion and verification can be quite long, which impedes calculation of performance measures (which are not yet calculated though, only planned) and in theory allows a user to achieve the activation of both race-related functions giving low quality output.
2.6. Fraud Prevention
By fraud we mean activating the race-related functions with low-quality (and low effort) output, like a user claiming some arbitrary (and probably easy to type) bib numbers present in photos in order to get the ability to search his/her photos as soon as possible. To restrict this kind of fraud, two well-known techniques are used: “gold standard” photos and time monitoring.
“Gold standard” photos are prepared by race tagging managers and several of them are shown to users in the beginning of a tagging session and later, during tagging, with some probability (initially 0.15, but depends on the number of correct and incorrect tags of “gold standard” photos). Incorrect tagging of a “gold standard” photo decreases the effective contribution of the user delaying the moment of reaching the function activation threshold. A user also receives a message saying that the answer is incorrect and is offered the same photo again. The “gold standard” photo can be passed only with the correct tagging. In the implementation, measures were taken to make it hard to tell whether the contribution page is showing a “real” or a “gold standard” assignment (even employing the analysis of HTML code and hidden form fields).
Time monitoring allows detecting too quick form submissions very unlikely containing thoughtful bib tags data. When an unreasonably quick submission is detected, a special page is shown to the user, asking to acknowledge that he/she is not a script.
These measures can be of help not only to deal with fraud in the sense above, but also to deal with intentional bib numbers misreporting. If a user systematically reports wrong tags and corrects him-/herself in case pointed out to do that by “gold standard” photo, the probability that he/she will be shown a “gold standard” photo (instead of a “real” assignment) is increasing and therefore lowering the impact the user can have on the results. However, there is usually a limited number of “gold standard” photos, so an adversary can actually learn them all and report correct results only for them. The solution to this problem is one of the directions of the future work.
2.7. Participation and Tagging Quality
The developed application has been used in nine running races with about 3000 photos per race on average. In general, the community accepted the application quite warmly and found it useful: photos from four races were tagged completely (with the largest completely tagged race having more than 7000 participants and 7126 photos). The ratio of runners who participated in photo tagging is usually 5–10%, which gives some estimate of how many runners value the photos (this information is useful to evaluate the applicability of the application, see Section 4). It is also interesting, that some of the contributors tagged significantly more photos than was required to enable photo search functionality. An online survey among them revealed that three main reasons of overperforming were: (a) gratitude to the photographers sharing the result of their labor for free; (b) feeling that the result of their work is useful to others; (c) addictive nature of the tasks.
To evaluate tagging quality, a dataset was prepared (the sets are available at http://bibtaggers.ru/static/datasets.html). Then, the results obtained by the users of the developed application (Bibtaggers) based on non-monetary incentive, the results obtained by paid workers from Amazon Mechanical Turk (AMT), and the results obtained by algorithmic approaches were compared (Table 1).
The results show that non-monetary incentivized crowd produces results with nearly the same quality. In addition, the results obtained also confirm that even with monetary crowdsourcing, the size of the reward in microtask markets does not influence quality [20,21].
The quality of results obtained via crowd computing (Bibtaggers and AMT) were also compared to the quality of results achieved by automated bib tagging software described elsewhere [15,22] (note, however, that the provided results were achieved on different datasets). It can be seen that crowd tagging allows achieving better results than automated tagging by all quality measures. It is clear, however, that in terms of scalability and performance computer vision-based approaches surpass crowd-based by a wide margin.
More detailed analysis of participation and tagging quality is available elsewhere [23].
3. Participant Utility Model and Its Analysis
Like any crowd-based system, running a race photo tagging system depends heavily on participation. It becomes useful if there are enough participants to tag all the photos, and it is useful only when tagging effort is actually ‘worth it’ in that it helps the participant to achieve some goals. This section describes a participant’s model based on von Neumann–Morgenstern utility, highlighting conditions when participation in tagging becomes reasonable. In practice, this model is important in two ways: first, it allows checking if it is reasonable to start a photo tagging project for a particular race; second, it can be used to estimate possible modifications in the crowd application to verify if these modifications are beneficial for users.
Let M be the number of running race participants, and N be the number of photos taken in the race. We will assume that each photo contains only one person (actually, it is not always the case, but in many photos one runner is the center of composition, and these photos look usually more attractive). A user spends tcheck seconds to glance through a photo (in some large collection) to check if he/she is depicted on it (usually it is about 0.5 s). A user spends ttag seconds to tag a photo with the bib numbers depicted on it. The value of ttag depends on the interface of the tagging system. In the developed application, tagging takes usually about 5 s. Note that the particular values used here are reasonable estimates, and they do not constrain the applicability of the model itself. If one gets another estimate for these parameters, the model itself will still be useful, however, it may lead to slightly different results.
Let us also assume that for each photo a participant is selected randomly with equal probability; therefore, there is a probability 1/M that a particular race participant is depicted in the given photo. Then the number of photos a particular race participant is depicted in follows Bernoulli distribution B(N, 1/M).
A value of the first found photo for a user is v. Then, the value decreases with each found photo with factor γ. Therefore, the value of x photos for a user is:
We consider the following strategies of a user:
- search through all the photos (not using the system);
- search through some subset s of the photos (not using the system). Clearly, this is a refinement of the previous strategy. It might make sense, since there are diminishing returns for each new photo;
- use the system, and tag the number of photos specified by the mechanism to be able to search by bib number;
- do not do anything (neither use the system, nor search by him-/herself).
The utility of these strategies is following.
The utility of searching through all the photos is:
The positive component is the utility from finding q photos of him-/herself, while the negative component is the effort required to check all the photos.
Utility of searching through a subset of photos:
Moreover, there is some optimal number of photos to examine , maximizing this utility:
Utility of using the system is:
Here R and P are recall and precision of the tagging system, respectively, while is the number of photos a user has to tag to be able to search by bib number. The positive component is related to the utility of the number of photos, however, it is multiplied by tagging system recall, because, compared to the previous cases even if the user is present on some number of photos, it is not guaranteed that he/she will receive these photos (as they might be mislabeled). There are also two negative components: effort to tag the specified number of photos and effort to look through the search results, depending on the tagging quality characteristics.
This model allows the answer to two questions:
- On what races it is reasonable to apply such a system?
- How does overall tagging quality influence the utility of using the system?
These two questions are addressed in the following subsections.
3.1. Applicability of the System
It is reasonable to apply the system if the utility of using the system for a participant is greater than not using it. Therefore, to answer this question one should compare the utility of all the considered strategies and find the one with the maximal expected utility. However, there are two important considerations in applying the model above. First, it is clear that if v of a user is zero (he or she does not value the photos from the race at all), then the dominant strategy is not to do anything. Second, the proposed method of estimating the utility of the system relies on the fact that the photos are labeled (with certain precision and recall). It means that if the system relies only on human tagging, each of the interested participants (Minterested) has to label at least 2*N/Minterested photos (multiplier 2 is necessary for quality assurance). This sets the minimum bound on the parameter. Real life experiments have shown that about 5–10% of participants actually value the photos. Therefore, further analysis considers only users valuing the photos, assuming that they are 10% of all race participants, and also assuming v = 600 (meaning that the user values the first photo approximately as ten minutes of his/her time).
Table 2 summarizes optimal strategies for various settings, given by the size of the running event (number of participants) and coverage (average number of photos per participant: low corresponds to one photo, medium to two photos, high to five photos). ‘All’ means that greater utility is associated with the strategy of looking through all the photos, and ‘Use system(X)’ means that one user is required to tag X photos, and still using the system corresponds to higher utility values. Both precision and recall are assumed to be 0.9.
It can be seen that for small races the usage of the proposed system is not reasonable, because it is rather easy to look through all the images. For medium races (500 and more participants) the system allows to reduce the effort with respect to manual search, however, in practice, very large races usually have more resources (including the access to RFID-based labeling) and using community tagging becomes less relevant. Therefore, the model shows that community tagging is reasonable mostly for races with 500 to 1000 participants.
Note that this table is based on the assumption that tags are received only from the users. If there is also some additional tagging algorithm (based on computer vision or on the location of the runner), the necessary work per one user decreases, therefore, utility increases, making the system reasonable in a wider range of situations. This observation is used for developing a location-based search technique.
3.2. Influence of Tagging Quality
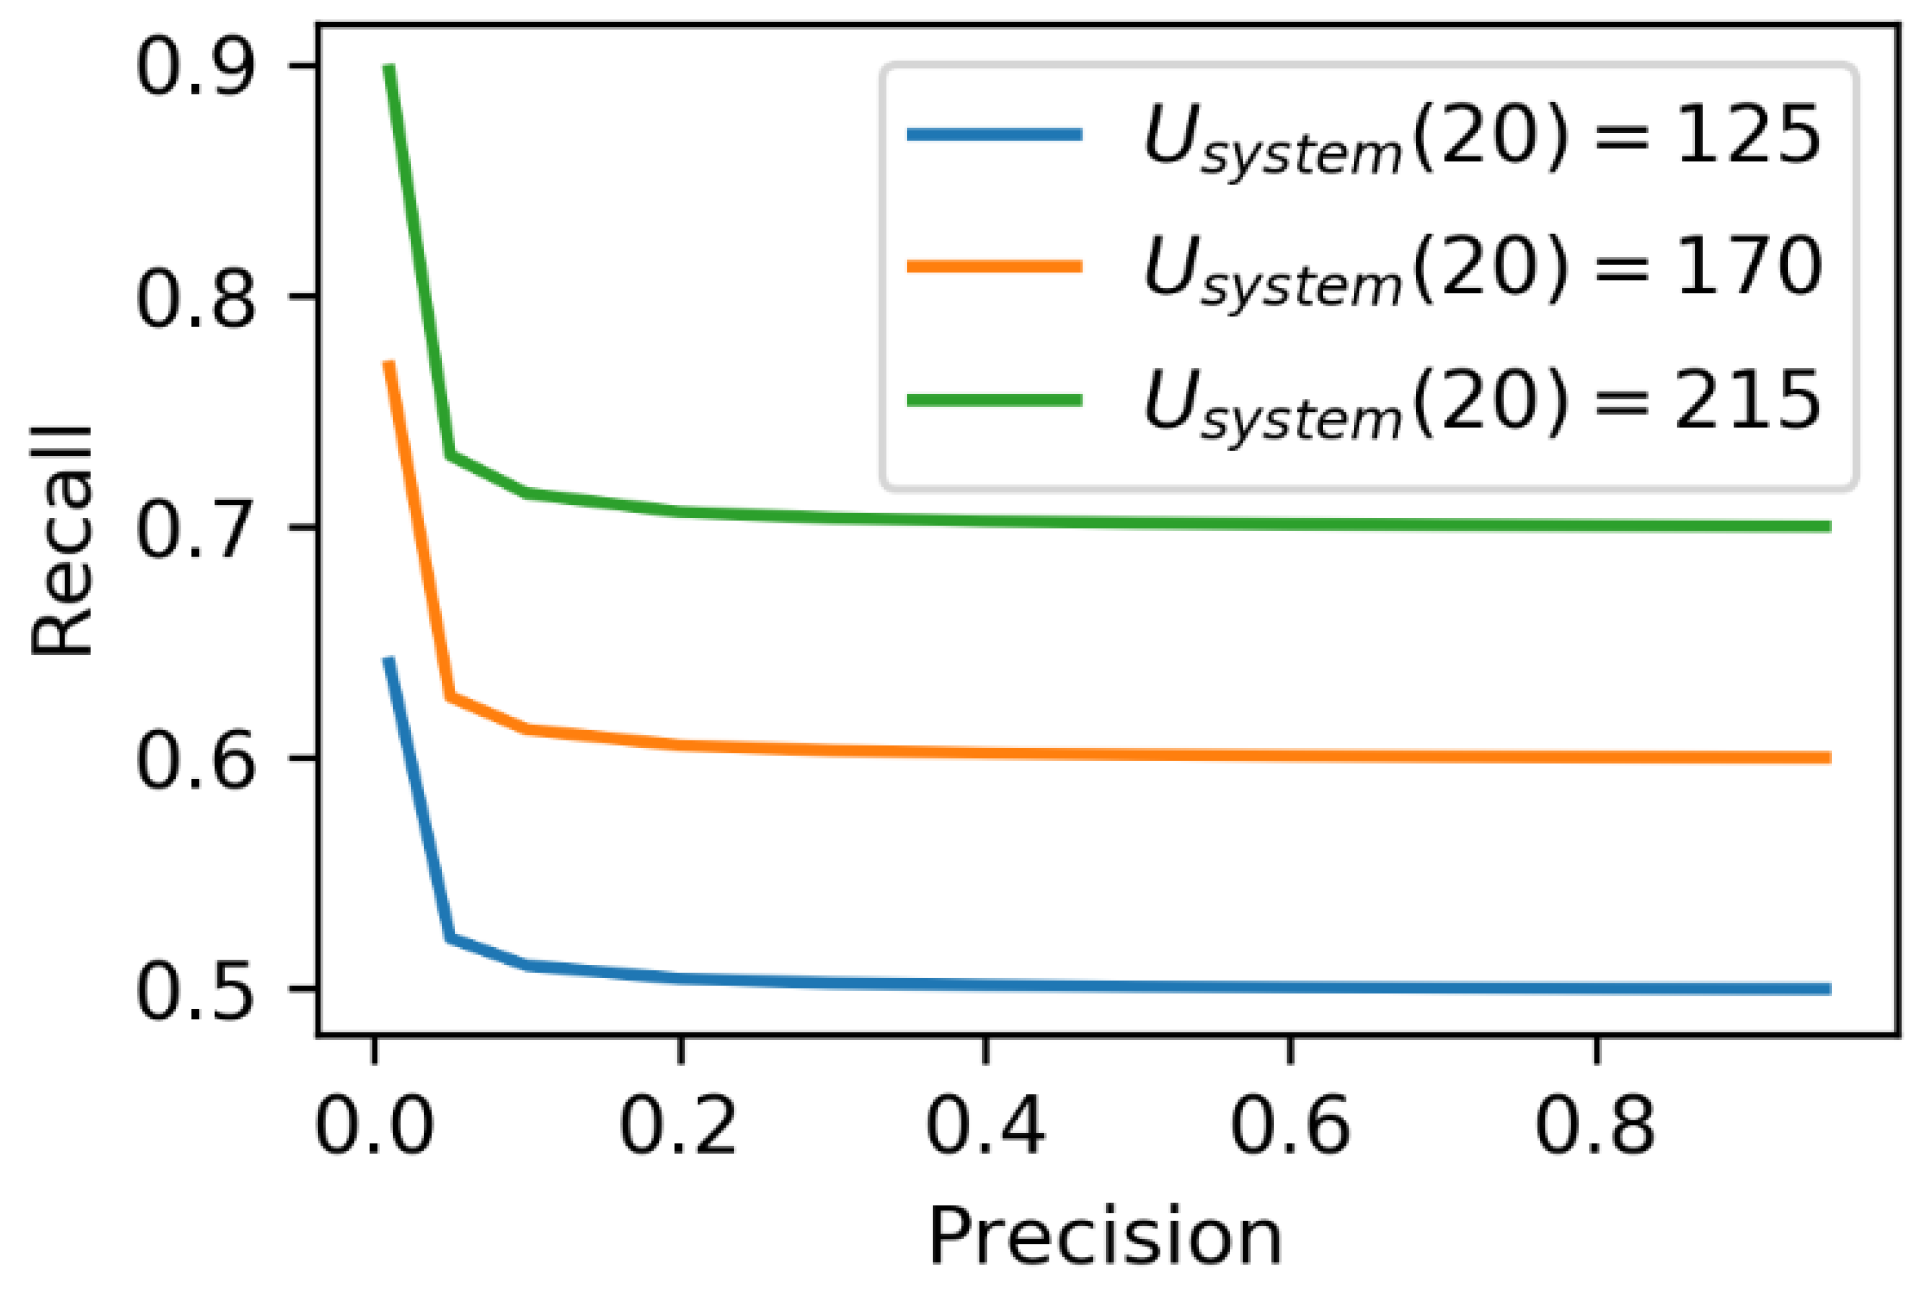
Obviously, the utility for the user increases with the tagging quality. However, do precision and recall have the same importance? What quality measure corresponds most to the utility for the user? To answer this question, Figure 4 shows the lines of equal utility in the precision/recall plane.
It can be seen that utility for a user depends mostly on the recall of the tagging, and in a very wide range of precision values (almost all ‘reasonable’ precisions) utility stays mostly the same. Therefore:
- Recall is more important to assess the quality of the tagging from the users’ utility perspective.
- Any measure (incentivization, quality control mechanism, or any other algorithm) that increases recall, while maintaining ‘reasonable’ precision (e.g., more than 0.5) will most likely increase users’ utility.
4. Model for Predicting Runner’s Location
Additional information that can be taken into account in the process of estimating the possibility that a runner is present in a particular photo is the location of the runner at the time the photo was taken. Normally, running races provide time measurements for the participants and the race protocol contains the finishing time of each participant (sometimes even times when the participant passed several checkpoints). Assuming that race participants move from start to finish along the known route with slightly varying speed, their location at a specific time can be predicted (with some uncertainty due to speed variation). Moreover, many participants use sports watches or smartphones with GPS trackers, therefore their position can be predicted with even greater precision. Information about the time and place of taking a photo is usually recorded in the attributes of the image file by most modern cameras. Therefore, the position of the photo (recorded by the camera) can be compared with the predicted runner’s location and if the runner was likely near the point the photo was taken the photo can be added to the result of the search query even without taking into consideration tags assigned to the photo. On the other hand, the information that the runner could not have been anywhere near the shooting point at the time the photo was taken can be used to detect tagging errors.
As mentioned earlier, the exact position of the race participant is known only at certain points in time (in the worst case there are two such moments: start and finish; at the best: if the participant uses a GPS tracker then his/her exact position at the distance is known at intervals of a minute or even a few seconds). Let be the moments of time at which the precise position of the participant is known, with , and corresponds to the finishing time. To denote the position of the participant at any time, we will use the functional notation . We also introduce the notation . Suppose that a participant moves only in one direction (from start to finish), with non-zero velocity, therefore, . To determine the position of the participant at times when the position is unknown (), we will use a probabilistic model based on the following assumptions:
- At each moment between and , the participant’s velocity is a normally distributed random variable with expectation and standard deviation . The particular value of standard deviation can either be estimated based on the data, or taken from the literature (e.g., see [24]).
- The velocity of the participant at some point in time does not depend on the velocity at other points in time.
Based on the second assumption, the position of the race participant at time t depends only on two of his/her known locations at times and , such that . A distance , traveled in time by a participant moving according to the assumptions above is a random variable distributed according to , and the density of this distribution is given by:
It can be shown that probability of the particular location of a race participant conditioned on his/her known locations is given by the following expression:
Notice, that is and is . Therefore, the probability density of the position in the route segment for is given by the following expression:
for , the probability density is 0.
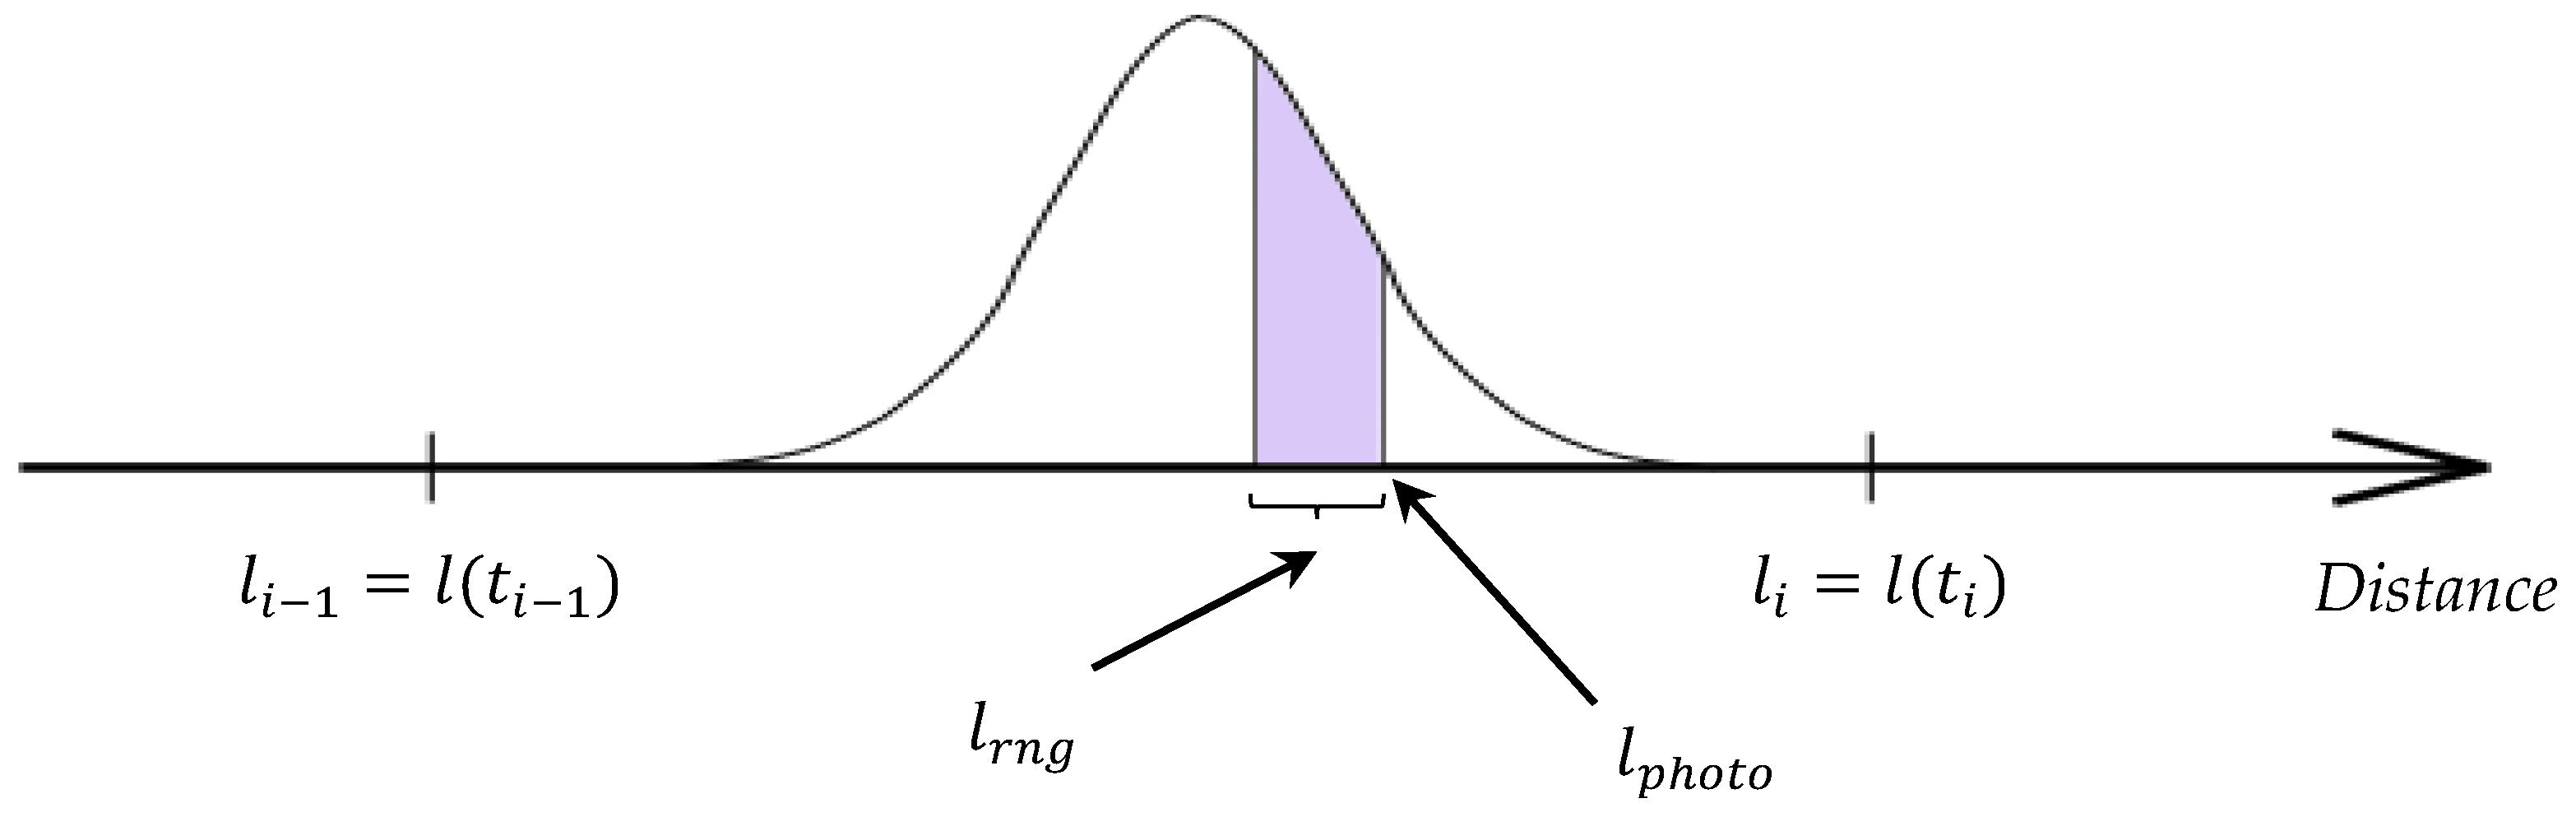
The obtained probability density is used to determine the probability that a participant is in the field of view of the camera at the time the picture was taken. Let the photo be made at the time by a camera located at , and the distance from the camera to the object within which a high-quality image can be obtained is . For simplicity, we also assume that . Then the probability that the participant will be in the field of view of the camera at the time :
Thus, the proposed algorithm for estimating the probability of finding a race participant near the location of the photographer at the time of taking the photo is as follows (see Figure 5):
- Check if the position of a race participant at the time of taking a photo is known exactly, i.e., if there exists an index , s.t., . If such index exists, then the position is known exactly, and the required probability is 1.0 if and 0.0 otherwise. If there is no such index, go to Step 2.
- Determine the segment of the route at which the participant is at the time of taking the photo, i.e., find an index , s.t. .
- Find the probability density function of the runner’s position on this segment according to Equation (1).
- Calculate the probability according to Equation (2).
5. Data Fusion Model
Probabilistic models of contributors are widely used for processing the results obtained from the crowd. These models numerically describe the propensity of contributors to make various kinds of errors (e.g., [25]). Specifically, during tagging photos with bib numbers two types of errors are possible: (1) the image is not tagged with a number actually present in the image, and (2) the image is tagged with a bib number that is not actually present in the image. The tagging quality analysis has shown that errors of type (1) are more popular. This is explained by the fact that missing a number is usually caused by a lack of diligence, which is natural for crowdsourcing environments, while adding non-existent numbers requires some additional effort which is non-typical. In fact, errors of type (2) are mostly associated, with incorrect reading of the (often distorted) number or its incorrect input.
Thus, it is proposed to describe participant u of the tagging process with two parameters: (“attentiveness” or “diligence”—the probability that the number present in the image will be found and included in the annotation) and (the probability that an image is tagged with some number that is not present on the image).
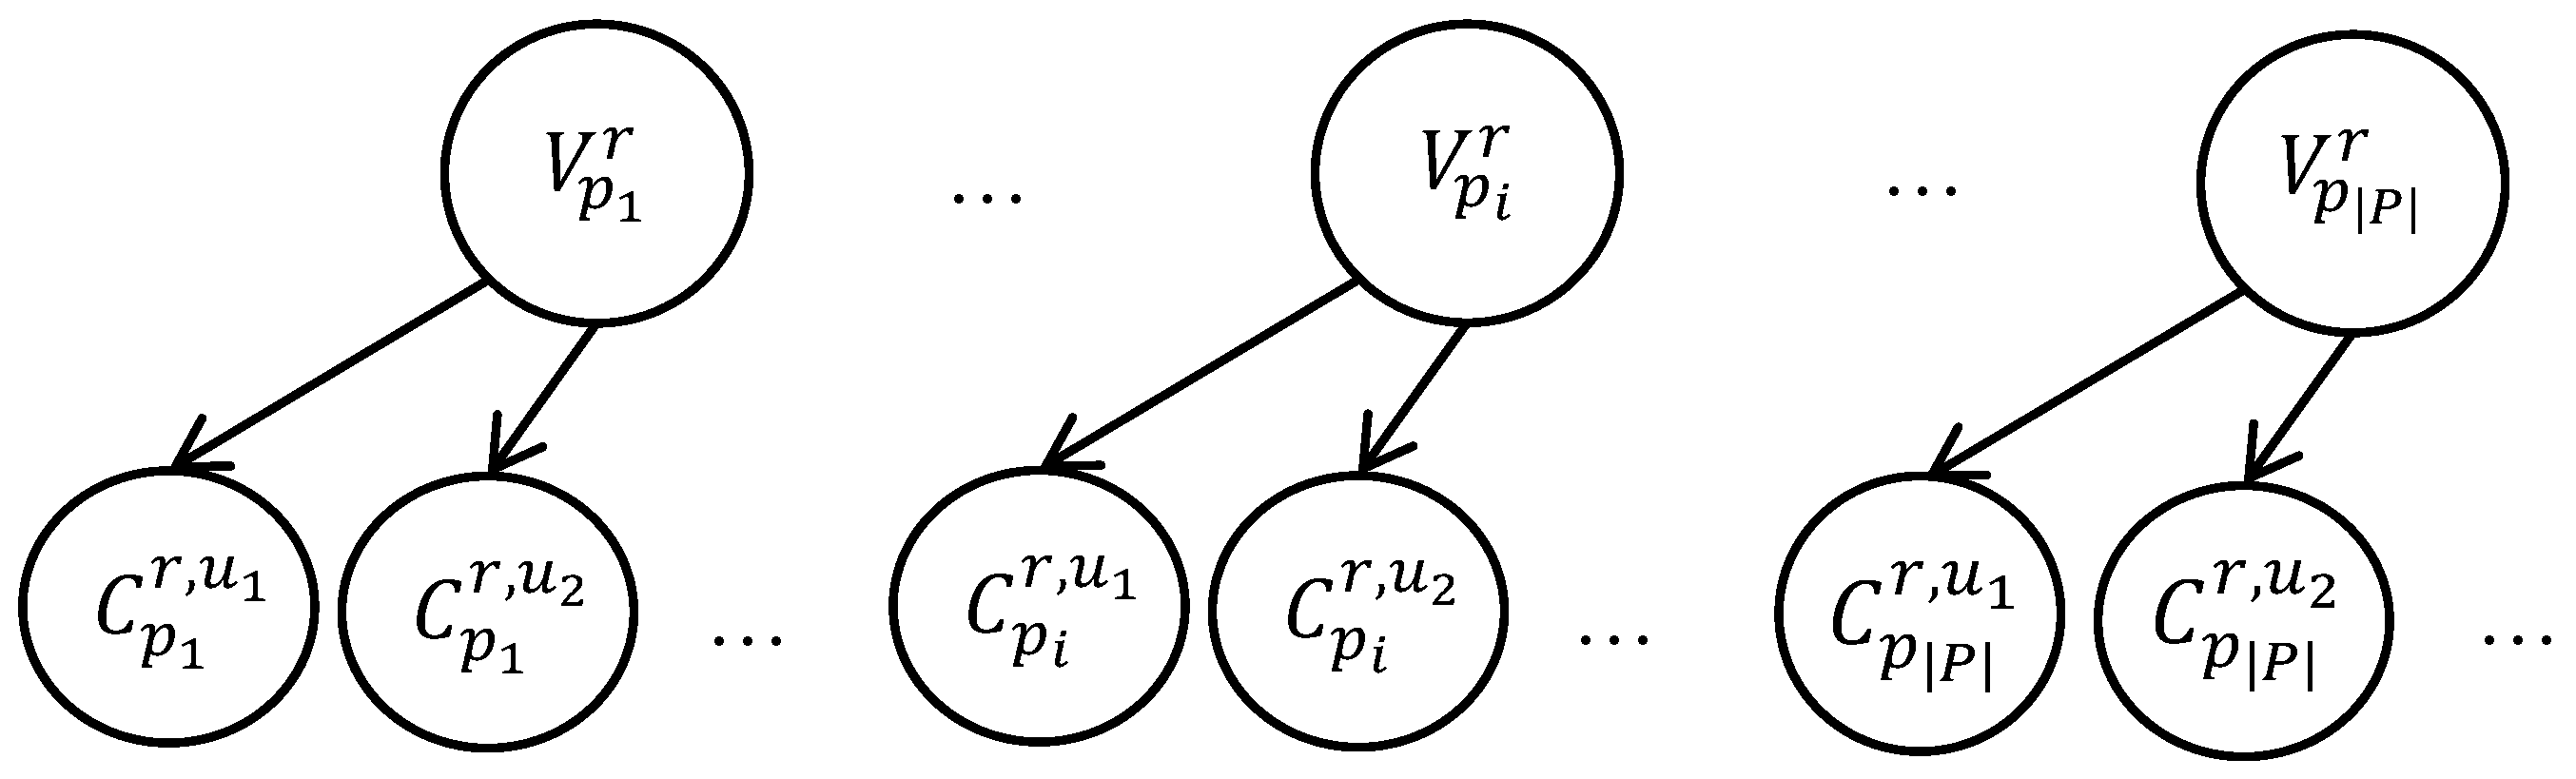
The unified representation of different types of uncertainty (uncertainty associated with the actions and errors of a contributor performing tagging, and uncertainty associated with the position of race participants on the track) using the probability allows to employ probabilistic inference to integrate (or, fuse) this information. The proposed fusion model can be visualized in the form of a Bayesian network, as shown in Figure 6.
A network of this layout is formed to search for images of each race participant r. The binary variables , are unobservable variables, each of which corresponds to the presence of a race participant r in the image pi. The a priori probability is determined by the probability of the presence of the participant in the camera’s field of view, calculated using Equation (2). The variables are observable and correspond to the results of the tagging; according to the tag contributor u the race participant with the bib number r is present on the image pi. Conditional distribution table for the variables is formed as follows. If r is indeed present in the image, the probability that it will be indicated by the contributor u is, by definition, equal to . If r is not in the image, but the contributor u indicated that r is present, it means that when reading or entering one of the numbers u made an error, replacing the correct number with r. The probability of making an error by definition , the probability of a particular error: , where is the set of bib numbers specified by u for the image pi and R is the set of valid bib numbers.
The process of searching photos containing certain bib numbers relies on estimating posterior probabilities with known tagging data, and forming a set of photos for which this a posterior probability exceeds a certain threshold value.
The advantage of using probabilistic graphical models for data integration is the modularity of the fusion scheme. Indeed, in the future, the proposed scheme may be expanded and supplemented with a more elaborate user error model, for example, one taking into account the fact that some types of errors (confusing digits 7 and 1, or 8 and 9) occur more frequently than others.
6. Experimental Evaluation
The influence of the proposed data fusion scheme on the quality of image search was evaluated during a series of experiments with simulation models. A data set was generated containing the trajectories of movement of 100 participants over a distance of 10 km. The trajectories were built taking into account that the typical time to finish such a distance during the amateur athletics run is 30–70 min, and the speed fluctuation during the movement is described by a normal law with a standard deviation of about 17% from the average speed [24]. Based on the known position of the participants, a reference set of 1250 photographs was generated. To generate a set of photos, three random points on the track were selected, and for each point several moments of taking a photo were randomly picked. To form the ground truth contents of the photo, a set of race participants being in front of the point where the photo is taken according to the generated trajectory was built. If this set contained just one race participant in was considered that a race participant was on this photo. Otherwise, it was considered that a random sample of the participants that are near the shooting point are in the photo. Therefore, each generated image was represented by the time and position of the shooting, and a list of participants shown in the picture.
6.1. Quality of Search Based on Location Model Only
First of all, the quality of the search on the basis of only a priori information (that is, the proposed probabilistic model of a participant’s location) was assessed. An important parameter here is the number of points where the exact position of the runner is known. In particular, the search efficiency was evaluated for various scenarios: when the exact position of the runner is known every 500 m, 1 km, 5 km, and 10 km. Here, the first option approximately corresponds to the search based on the GPS track data, and the last one based on the final protocol (in which only the finishing time is included).
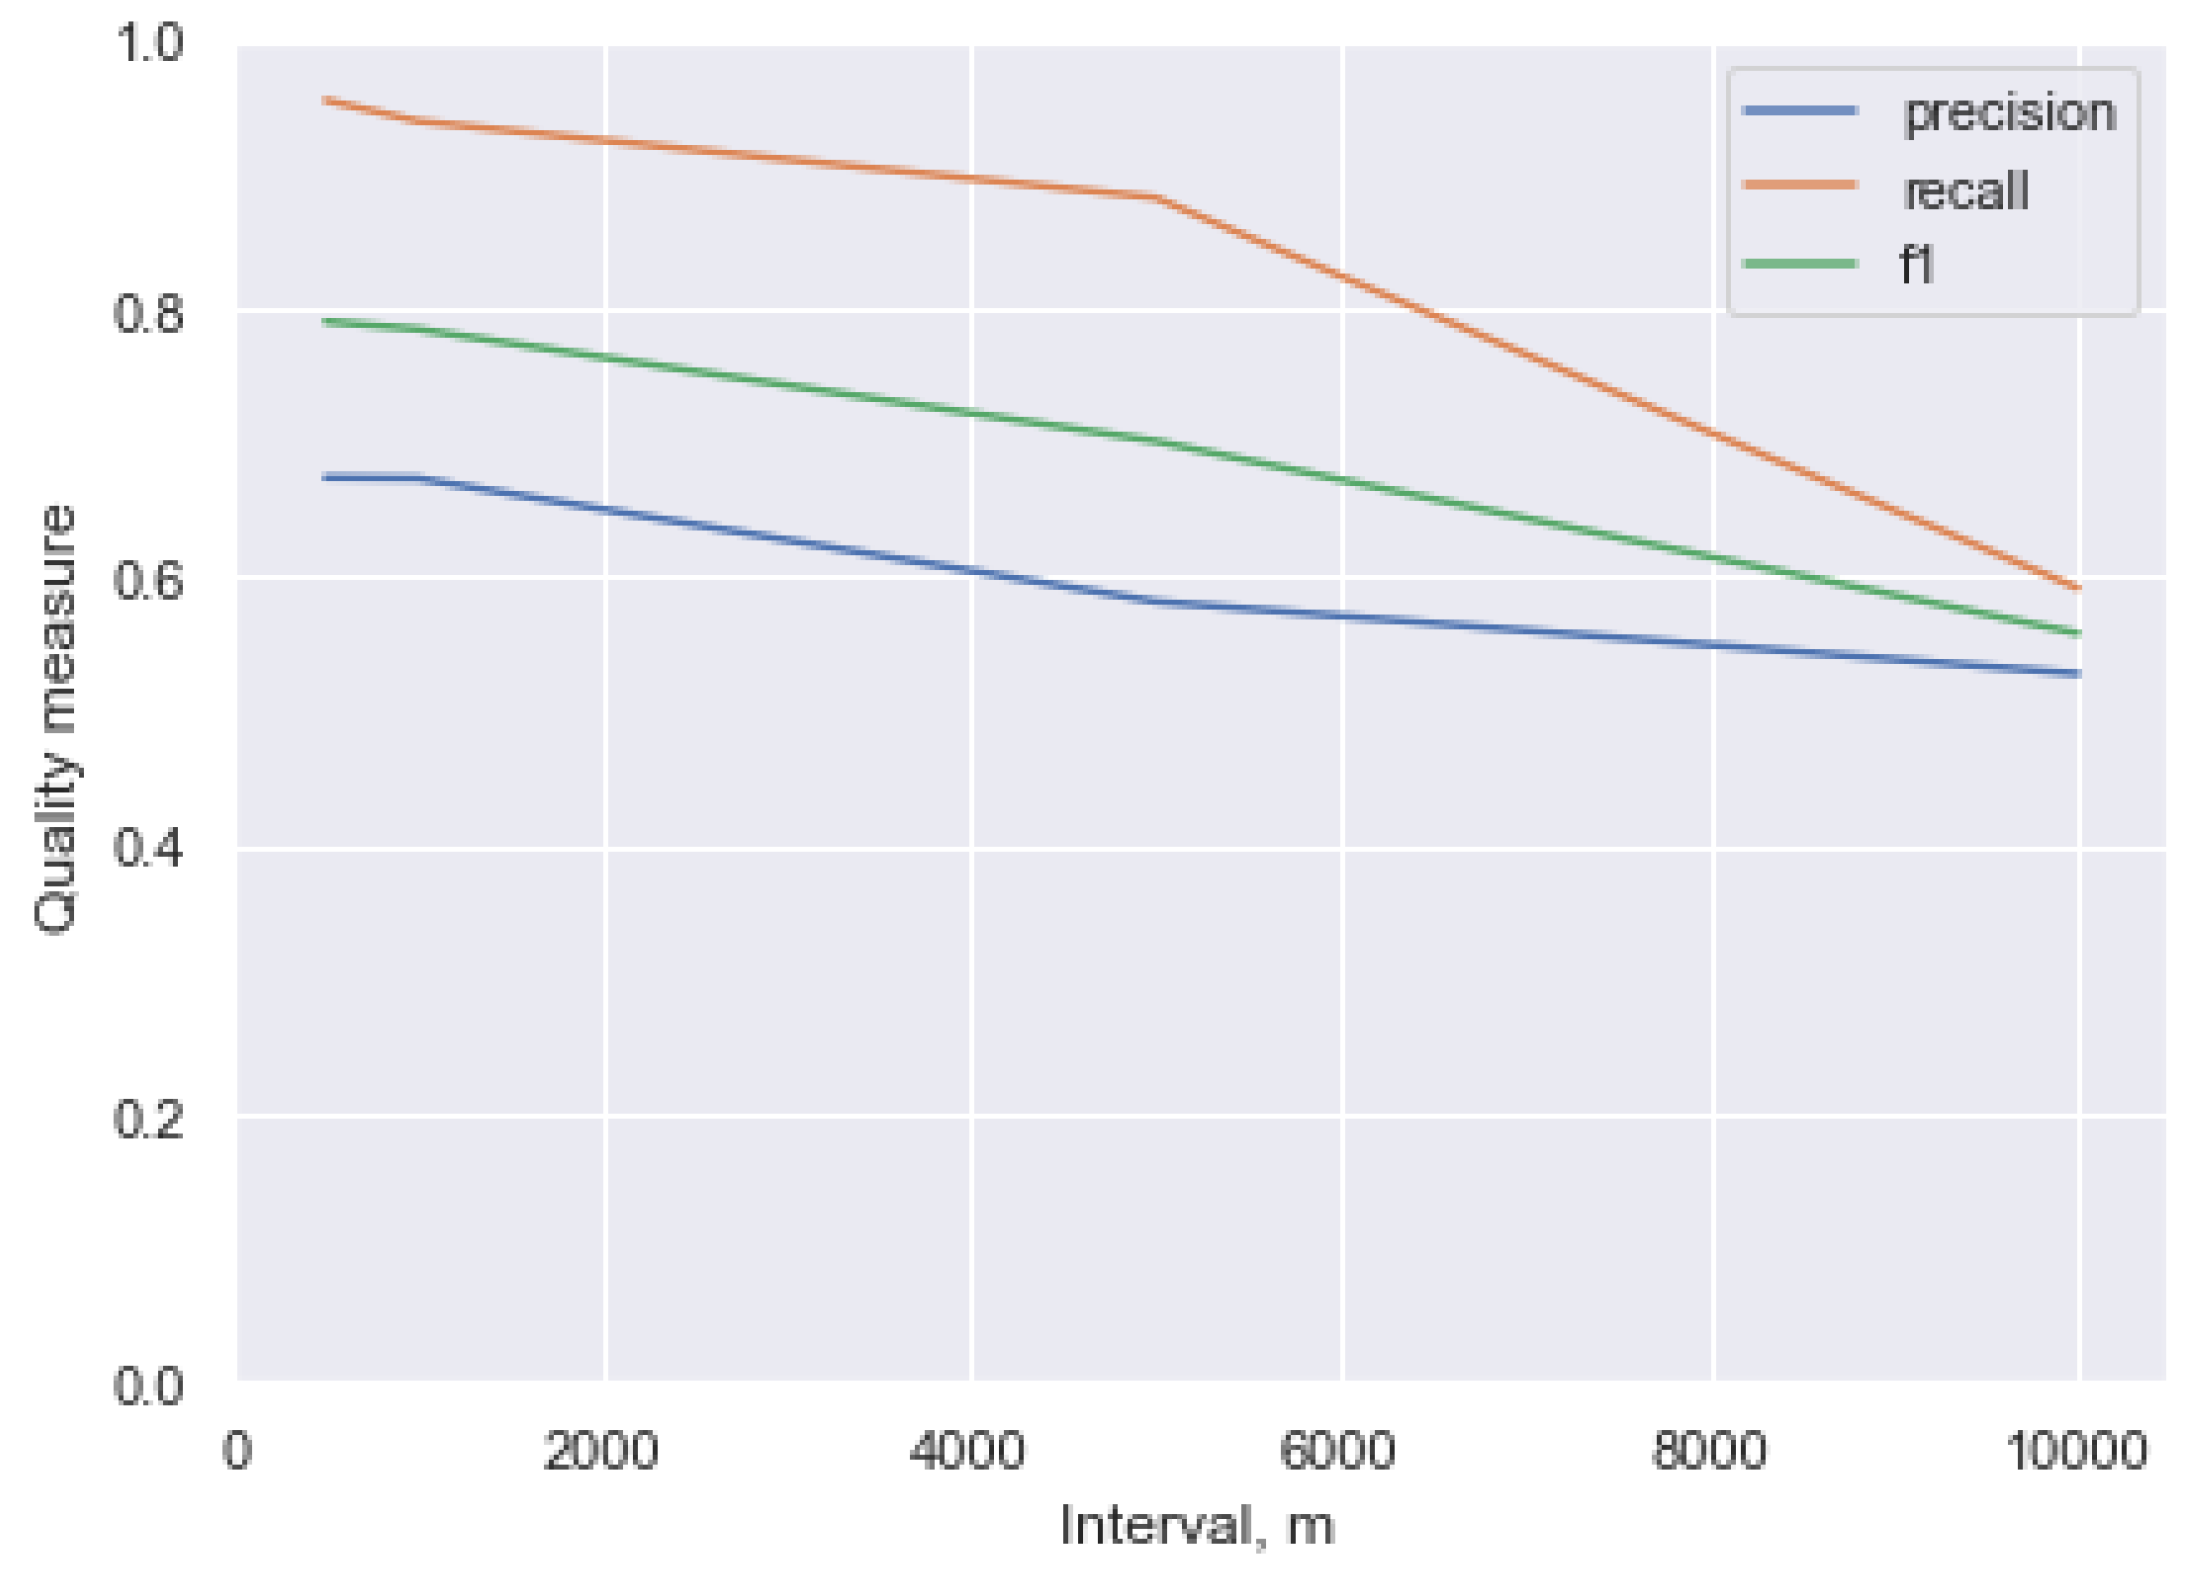
To assess the quality, precision, recall and F-measure were used. These metrics were calculated for two sets: the set of participant-image pairs returned by the search procedure based on a priori information (the pair was included in the set if the probability of the participant being in the area of the snapshot exceeded 0.3) and the set of participant-image pairs of the reference data set (the actual presence of the participant in the snapshot).
As shown in Figure 7, the quality of the search with detailed location data (each 500 m) is quite good. High recall (0.954) indicates that almost all of the images in which participants are present were indeed included in the resulting set. Low (even at 500 m) precision is primarily due to the fact that not all participants who are close to the photographer are photographed. As the interval between known points increases, the uncertainty regarding the location of the participant also increases, respectively, and the qualitative characteristics of the search procedure predictably decrease. It can be seen that the proposed method of leveraging the location information allows searching race participants with relatively high recall and relatively low precision. This is because the method finds all the race participants who are likely to be near the photographer, which is a necessary (but not sufficient) condition of being present in a photo (because a photographer usually is not able to take a photo of every runner passing by).
In conjunction with the primary importance of the recall to the utility for a user, as well as with the fact that having such a simple baseline obviates the necessity to involve two users in tagging each image, the location-based model increases the utility of using the system, as well as extends the range of the situations to which the system is applicable.
6.2. Quality of Search Based on Tagging
Evaluation of the quality of the search based on the tagging was carried out using two instances of the tagging model corresponding to low-quality and high-quality tagging, respectively. The values of the model parameters and for low-quality tagging were taken as 0.7 and 0.1, and for high-quality tagging as 0.9 and 0.05, respectively. These values were selected based on the analysis of the usage history of the developed application. Note that the tagging model does not necessarily correspond to the crowd-based tagging, it may be some algorithmic approach as well (e.g., [22]). The generated set of images was processed using these tagging models and two sets of participant-image pairs were obtained. The results of the quality assessment are given in Table 3. Comparison of Figure 7 and Table 3 shows that the search based on only a priori probability with detailed information about the movement of the participant in the run yields a better result according to F-measure (and in recall) than a search based on low-quality tagging. In other cases, the search by tagged data yields significantly better results according to F-measure than the search based on the a priori probability only (and this is natural, since the analysis of the images themselves is carried out during the tagging).
6.3. Quality of Search Based on Data Fusion Model
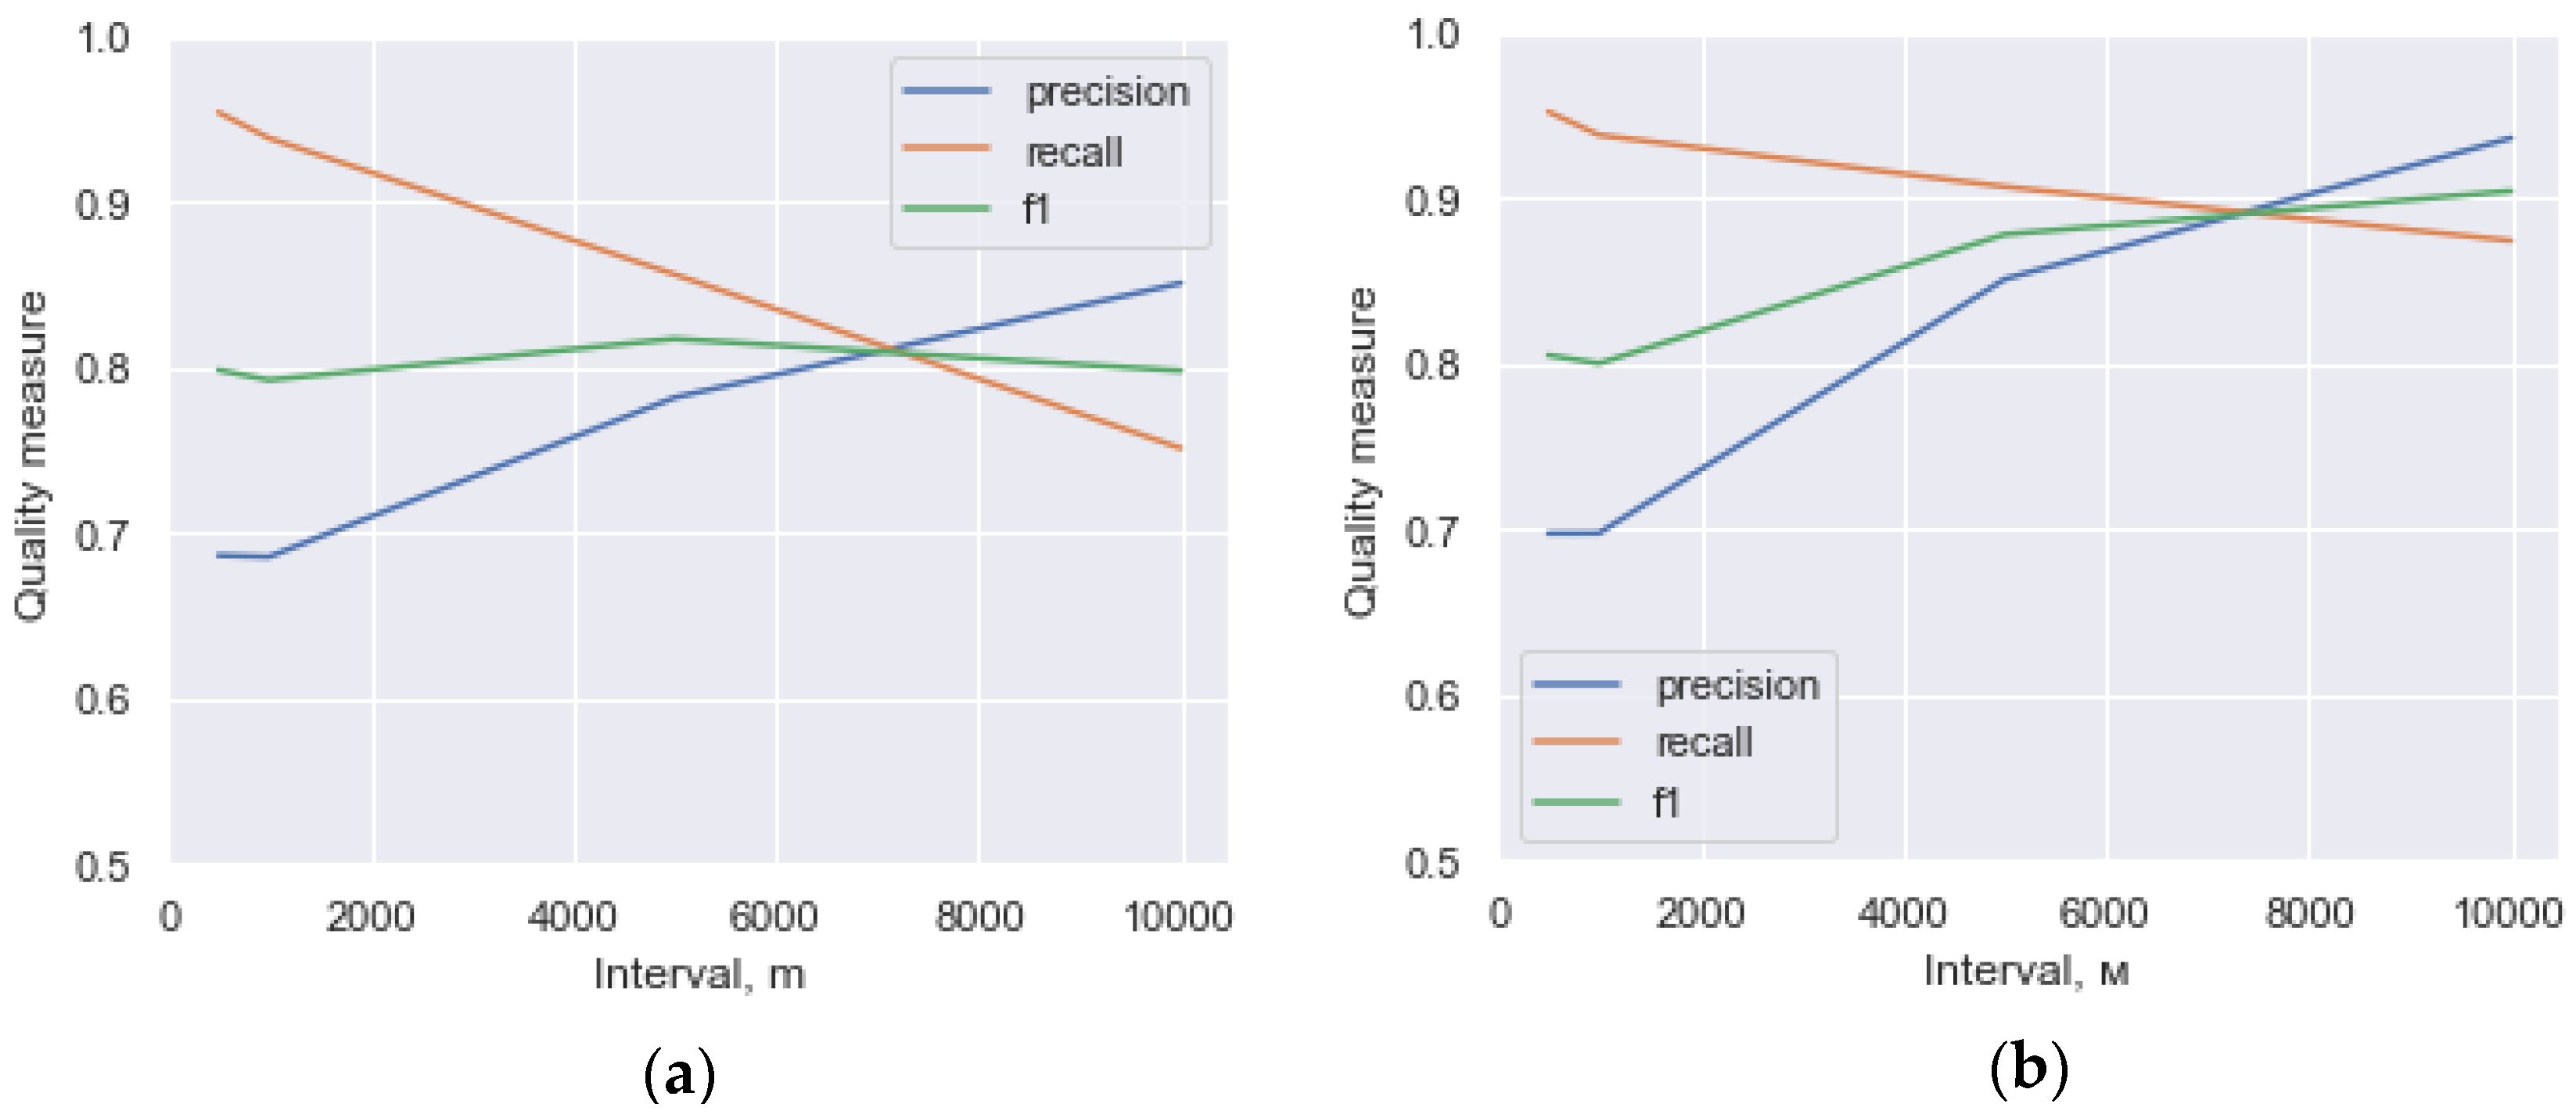
A study of the quality of the search based on the proposed model of data fusion was also carried out with different values of the interval between the known positions of the runner and with different quality tagging. Estimated quality indicators are shown in Figure 8.
It can be seen (Figure 8a) that for different intervals between the known positions of the race participant, the joint measure (F-measure) of the quality of the search has approximately the same value, but the role of different types of information gradually changes. At the small intervals (500 m, 1 km), the search is characterized by high recall and relatively low precision (a significant role here is played by the a priori estimate of the probability of the participant being in a given interval). For greater intervals, the precision becomes higher and a characteristic sign of human tagging results; human taggers were more likely to miss a runner present in a photo, than to provide a non-present bib number tag, hence, typically high precision. In any case, due to the data fusion scheme, the overall quality of the results (F-measure) increased by approximately 0.05 compared with low-quality tagging, and the recall increased by 0.1.
When integrating information about the position of the participant with the tagging of high quality (Figure 8b), detailed information about the location has a negative impact on the value of the generalized measure of quality. This is due to low precision value of a priori model (not all the participants who happened to be close to the photographer at the time the photo was taken get into the photo). However, the recall is still significantly higher than with manual tagging, and, as shown earlier, it is more important, and still has a positive effect on users’ utility.
7. Discussion
The paper presents a web application leveraging principles of crowd computing (i.e., using an effort of a network community) for tagging photos of running races with bib numbers of the participants in order to enable fast photo search. In addition, a data fusion approach is proposed to integrate the information received from crowd (or any other unreliable tagger) with the race participant information contained in GPS tracks. The practical assessment of the service has shown that non-monetary stimulation associated with facilitating the search for photographs identified is adequate and participants are willing to participate in tagging. Experiments have revealed another source of motivation, which was not obvious during the design and implementation of the system. This source boils down to the value of feeling involved in a chain of socially useful activities performed on a non-commercial basis, a kind of “gratitude” for the work of the photographer who took pictures and made the photos free to the community. Due to this, the contribution of some members of the community has significantly exceeded the necessary minimum.
Comparison of the quality of tags obtained from the community with a specially prepared reference set showed that the quality of tags obtained from the community members is comparable to the “superficial” tagging, which only identifies clearly visible numbers and does not attempt to analyze the context in the form of chronologically adjacent photos (although the implemented service allows this). At the same time, with the activation of this possibility, the completeness of tagging can grow quite significantly (about 20%). It suggests that mechanisms should be designed to incentivize the participants to use this feature.
Furthermore, the quality of the tags obtained via Amazon Mechanical Turk using monetary incentives was not very different, suggesting that the ability to search photos and emotional involvement provided nearly the same incentive for quality.
The results of the study of the proposed data fusion approach with the use of simulation model have shown that fusion is especially effective in conditions of low-quality tagging. However, even in conditions of high-quality tagging, the use of fusion allows increasing the completeness of search results in the presence of detailed information on location.
In general, we can conclude that the use of data fusion in processing the results of crowd computing is a promising technique, and the use of probabilistic graphical models (e.g., Bayesian networks) for data fusion allows one to smoothly increase the accuracy of the results of the system with an increase in the amount of available information.
Future research is connected with three major directions. The first direction is to improve tagging quality (this includes the study of the influence of other non-monetary incentive mechanisms, like gamification) on user participation in the system and the quality of the results obtained, and the development of incentive mechanisms for using additional contextual during the tagging process. The second direction is including existing automated tagging models into the tagging (e.g., algorithm acting as one non-reliable tagger). Finally, the third direction is to elaborate the fusion model through the use of more detailed tagging participant error models.
Funding
The research was funded by Russian State Research, project 0073-2019-0005. The research on using probabilistic graphical models to improve the quality of crowdsourcing with interrelated labels was also supported by Russian Foundation for Basic Research, project number 19-07-01120.
Conflicts of Interest
The authors declare no conflicts of interest. The funders had no role in the design of the study; in the collection, analyses, or interpretation of data; in the writing of the manuscript, or in the decision to publish the results.
References
- Franzoni, C.; Sauermann, H. Crowd science: The organization of scientific research in open collaborative projects. Res. Policy 2014, 43, 1–20. [Google Scholar] [CrossRef] [Green Version]
- Shamir, L.; Diamond, D.; Wallin, J. Leveraging Pattern Recognition Consistency Estimation for Crowdsourcing Data Analysis. IEEE Trans. Hum. Mach. Syst. 2016, 46, 474–480. [Google Scholar] [CrossRef]
- Faulkner, M.; Clayton, R.; Heaton, T.; Chandy, K.M.; Kohler, M.; Bunn, J.; Guy, R.; Liu, A.; Olson, M.; Cheng, M.; et al. Community Sense and Response Systems: Your Phone as Quake Detector. Commun. ACM 2014, 57, 66–75. [Google Scholar] [CrossRef]
- Meier, P. How Crisis Mapping Saved Lives in Haiti. Available online: https://blog.nationalgeographic.org/2012/07/02/how-crisis-mapping-saved-lives-in-haiti/ (accessed on 3 July 2020).
- Chittilappilly, A.I.; Chen, L.; Amer-Yahia, S. A Survey of General-Purpose Crowdsourcing Techniques. IEEE Trans. Knowl. Data Eng. 2016, 28, 2246–2266. [Google Scholar] [CrossRef]
- Li, G.; Wang, J.; Zheng, Y.; Franklin, M. Crowdsourced Data Management: A Survey. IEEE Trans. Knowl. Data Eng. 2016, 28, 2296–2319. [Google Scholar] [CrossRef] [Green Version]
- Allahbakhsh, M.; Benatallah, B.; Ignjatovic, A.; Motahari-Nezhad, H.R.; Bertino, E.; Dustdar, S. Quality Control in Crowdsourcing Systems: Issues and Directions. IEEE Internet Comput. 2013, 76–81. [Google Scholar] [CrossRef]
- Durrant-Whyte, H.; Henderson, T. Multisensor Data Fusion. In Handbook of Robotics, 2nd ed.; Springer: Cham, Switzerland, 2016; pp. 867–896. [Google Scholar]
- Castanedo, F. A Review of Data Fusion Techniques. Sci. World J. 2013, 2013, 704504. [Google Scholar] [CrossRef] [PubMed]
- Khaleghi, B.; Khamis, A.; Karray, F.; Razavi, S. Multisensor Data Fusion: A Review of the State-of-the-Art. Inf. Fusion 2013, 14, 28–44. [Google Scholar] [CrossRef]
- Running in the USA. Available online: http://www.runningintheusa.com/ (accessed on 3 July 2020).
- Ahotu Marathons. Available online: http://marathons.ahotu.com/calendar/europe/road-running (accessed on 4 June 2019).
- Scheerder, J.; Breedveld, K. (Eds.) Running Across Europe: The Rise and Size of One of the Largest Sport Markets; Palgrave Macmillan: London, UK, 2015. [Google Scholar]
- Roy, S.; Shivakumara, P.; Mondal, P.; Raghavendra, R.; Pal, U.; Lu, T. A New Multi-Modal Technique for Bib Number/Text Detection in Natural Images. Available online: https://www.researchgate.net/publication/300254818_A_New_Multi-modal_Technique_for_Bib_NumberText_Detection_in_Natural_Images (accessed on 5 August 2020).
- Ben-Ami, I.; Basha, T.; Avidan, S. Racing Bib Numbers Recognition. In Proceedings of the British Machine Vision Conference (BMVC), Surrey, UK, 3–7 September 2012. [Google Scholar]
- Von Ahn, L.; Blum, M.; Langford, J. Telling Humans and Computers Apart Automatically. Commun. ACM 2004, 47, 57–60. [Google Scholar] [CrossRef] [Green Version]
- Yang, Y.; Zhu, B.; Guo, R.; Yang, L.; Li, S.; Yu, N. A Comprehensive Human Computation Framework—With Application to Image Labeling. In Proceedings of the 16th ACM international conference on Multimedia, Vancouver, BC, Canada, 26–31 October 2008; pp. 479–488. [Google Scholar]
- Muhammadi, J.; Rabiee, H.R.; Hosseini, A. Crowd Labeling: A Survey. Available online: http://arxiv.org/abs/1301.2774 (accessed on 3 July 2020).
- Kara, Y.E.; Genc, G.; Aran, O.; Akarun, L. Modeling annotator behaviors for crowd labeling. Neurocomputing 2015, 160, 141–156. [Google Scholar] [CrossRef]
- Marge, M.; Banerjee, S.; Rudnicky, A.I. Using the Amazon Mechanical Turk for transcription of spoken language. In Proceedings of the 2010 IEEE Conference on Acoustics, Speech and Signal Processing, Dallas, TX, USA, 14–19 March 2010; pp. 5270–5273. [Google Scholar]
- Mason, W.A.; Watts, D.J. Financial incentives and the performance of crowds. In Proceedings of the ACM SIGKDD Workshop on Human Computation, New York, NY, USA; 2009; pp. 77–85. [Google Scholar]
- Anuntachai, A.; Chaorattana, W.; Boonchoay, J. Runner BIB number recognition system. In Proceedings of the 17th International Conference on Control, Automation and Systems (ICCAS), Jeju, Korea, 18–21 October 2017. [Google Scholar]
- Ponomarev, A. Quality control methods in crowd computing: Literature review. SPIIRAS Proc. 2017, 5, 152–184. [Google Scholar] [CrossRef] [Green Version]
- Haney, T.A., Jr. Variability of Pacing in Marathon Distance Running. Master’s Thesis, University of Nevada, Las Vegas, NV, USA, 2010. Available online: https://digitalscholarship.unlv.edu/thesesdissertations/779 (accessed on 3 July 2020).
- Ponomarev, A. Community Photo Tagging: Engagement and Quality Study. In Proceedings of the 2017 ACM on Web Science Conference, New York, NY, USA, 25 June 2017; pp. 409–410. [Google Scholar]
Figure 1.
Example of a bib number.

Figure 2.
Page map.

Figure 3.
Contribution page.

Figure 4.
Precision and recall for different values of utility of using a system (Usystem(20)).

Figure 5.
Illustration of the principle of estimating the probability of a runner’s presence in a photo.
Figure 5.
Illustration of the principle of estimating the probability of a runner’s presence in a photo.

Figure 6.
Layout of the proposed Bayesian network for data fusion.

Figure 7.
Quality indicators for search based on location information only.

Figure 8.
Quality indicators for search based on fused data. (a) Fusion of location data with low quality tagging; (b) Fusion of location data with high quality tagging.
Figure 8.
Quality indicators for search based on fused data. (a) Fusion of location data with low quality tagging; (b) Fusion of location data with high quality tagging.


Table 1.
Tagging quality comparison. AMT = Amazon Mechanical Turk.
| Recall | Precision | F-Measure | |
|---|---|---|---|
| Crowd (Bibtaggers) | 0.912 | 0.925 | 0.919 |
| Crowd (AMT $0.02) | 0.923 | 0.906 | 0.914 |
| Crowd (AMT $0.05) | 0.958 | 0.858 | 0.905 |
| Ben-Ami, Basha, and Avidan [15] | 0.45–0.62 | 0.65–0.75 | 0.56–0.63 |
| Anuntachai, Chaorattana, and Boonchoay [22] | 0.81 | 0.8 | 0.8 |
Table 2.
Users’ optimal strategies.
| Race Size\Coverage | Low | Medium | High |
|---|---|---|---|
| Tiny (50) | All | All | All |
| Small (100) | All | All | All |
| Small-Medium (200) | All | All | All |
| Medium (500) | Use system (20) | Use system (40) | Use system (100) |
| Large-Medium (1000) | Use system (20) | Use system (40) | Use system (100) |
| Large (5000) | Use system (20) | Use system (40) | Use system (100) |
Table 3.
Tagging quality.
| Recall | Precision | F-Measure | |
|---|---|---|---|
| Low quality (0.7; 0.1) | 0.627 | 0.904 | 0.74 |
| High quality (0.9; 0.05) | 0.864 | 0.958 | 0.907 |
© 2020 by the author. Licensee MDPI, Basel, Switzerland. This article is an open access article distributed under the terms and conditions of the Creative Commons Attribution (CC BY) license (http://creativecommons.org/licenses/by/4.0/).
Share and Cite
MDPI and ACS Style
Ponomarev, A. Improving Search Quality in Crowdsourced Bib Number Tagging Systems Using Data Fusion. Information 2020, 11, 385. https://0-doi-org.brum.beds.ac.uk/10.3390/info11080385
AMA Style
Ponomarev A. Improving Search Quality in Crowdsourced Bib Number Tagging Systems Using Data Fusion. Information. 2020; 11(8):385. https://0-doi-org.brum.beds.ac.uk/10.3390/info11080385
Chicago/Turabian StylePonomarev, Andrew. 2020. "Improving Search Quality in Crowdsourced Bib Number Tagging Systems Using Data Fusion" Information 11, no. 8: 385. https://0-doi-org.brum.beds.ac.uk/10.3390/info11080385
Note that from the first issue of 2016, this journal uses article numbers instead of page numbers. See further details here.