The Role of Artificial Intelligence, MLR and Statistical Analysis in Investigations about the Correlation of Swab Tests and Stress on Health Care Systems by COVID-19


Abstract
:1. Introduction
2. Materials and Methods
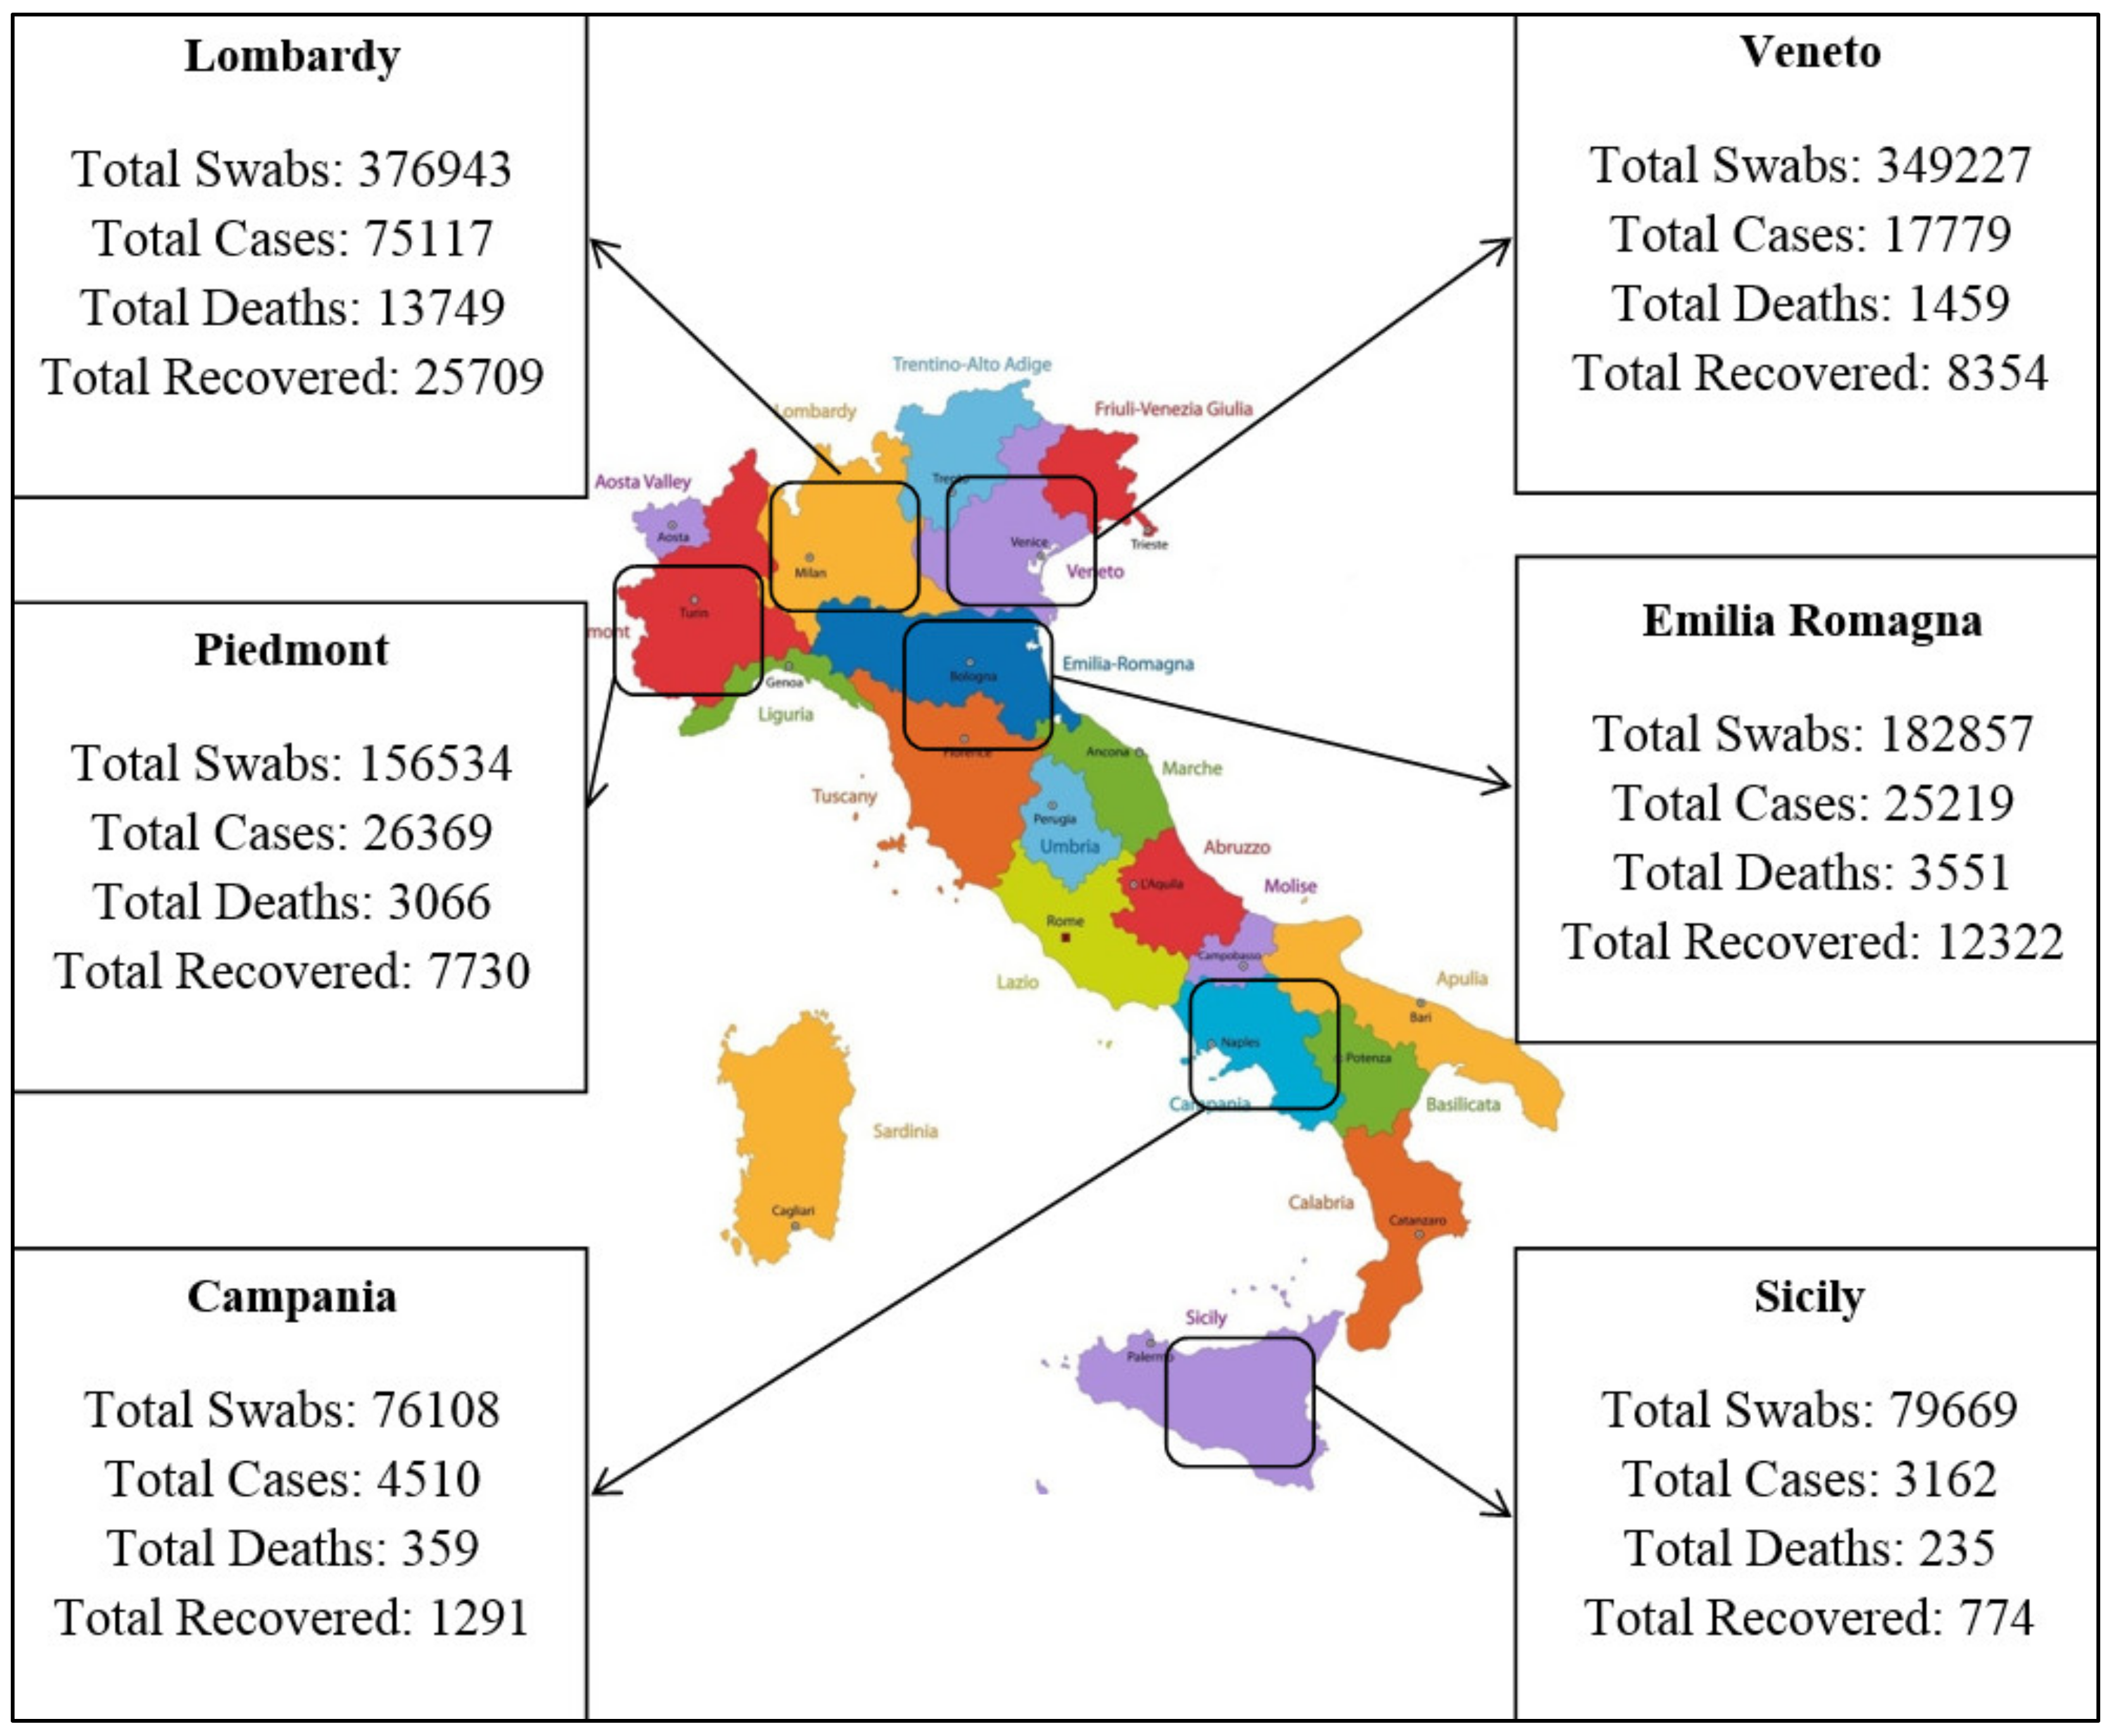
2.1. Case Study
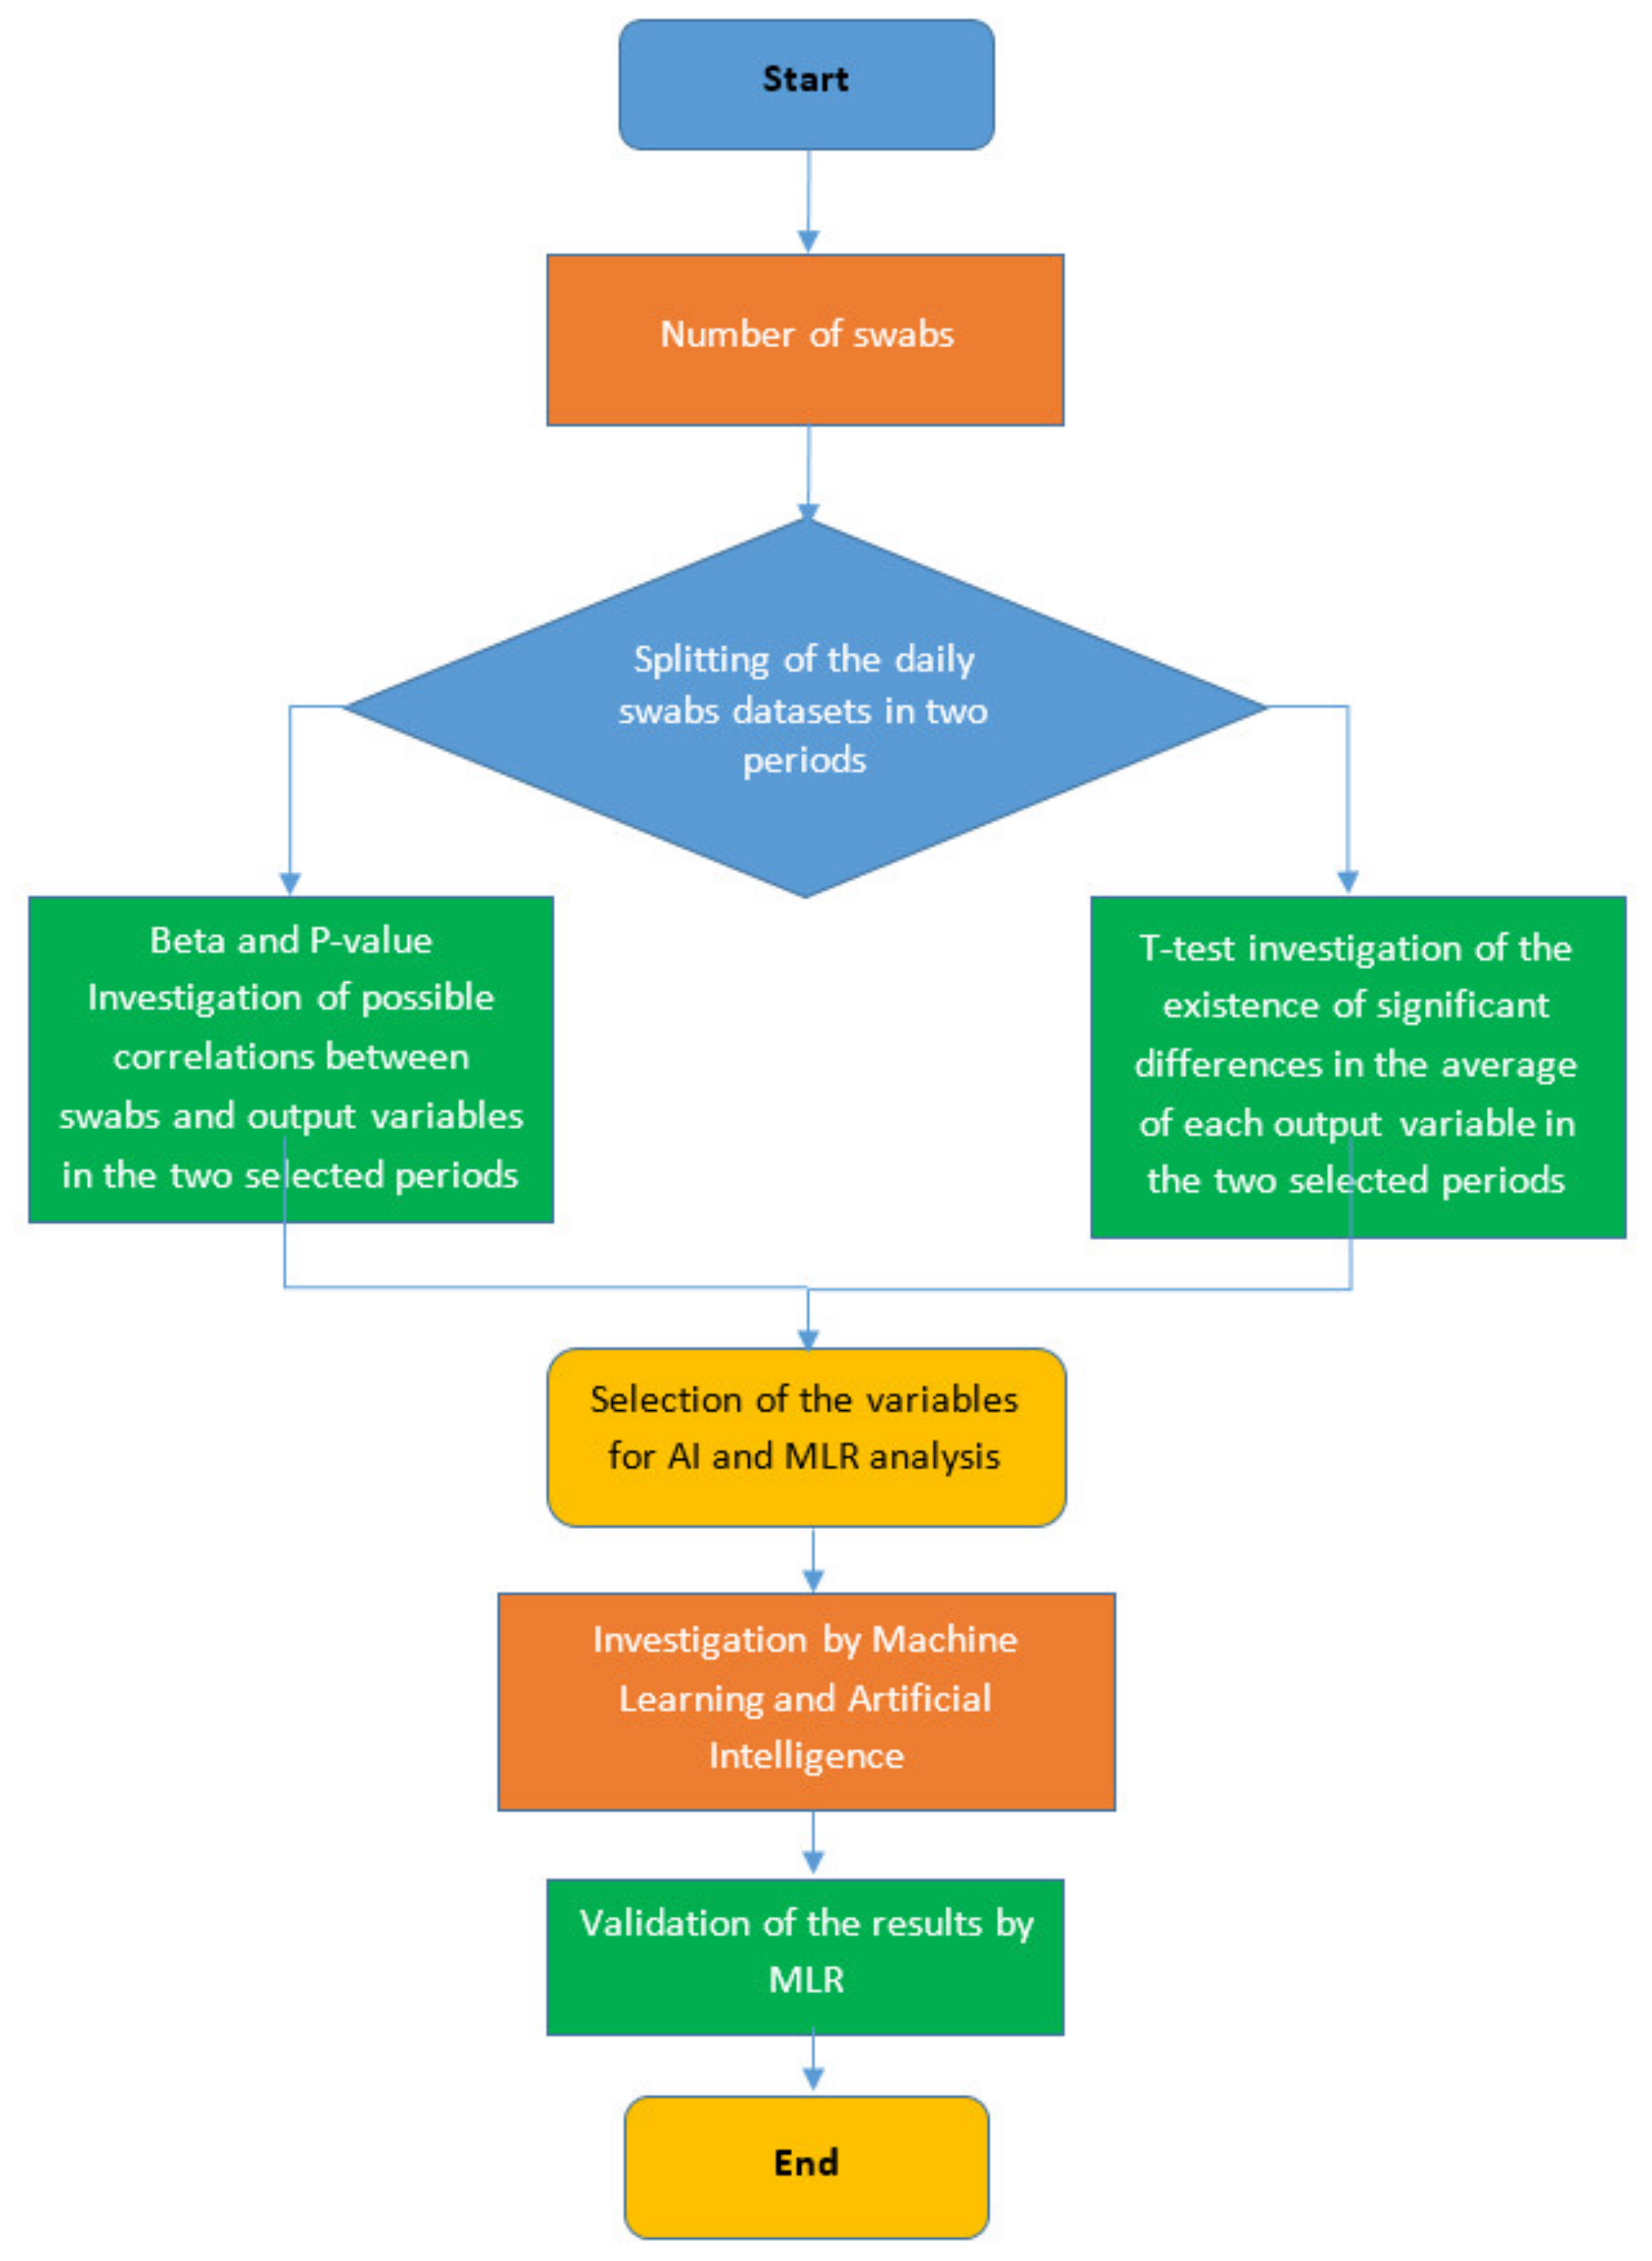
2.2. Mathematical Modeling and Statistical Analysis
The Set-Up of the SPSS Model
- Number of daily tests (Swabs test);
- Number of patients isolated at home (Home isolation);
- Number of patients admitted to the hospital in mild condition (Mild hosp.);
- Number of patients admitted to the intensive care section of the hospital (Int. care hosp.);
- Number of daily deaths;
- Use of the Independent-Samples t-test: The Independent-Samples t-test is used to test the existence of significant differences (with a confidence level of 95%) between the averages of two datasets. We recall that our dataset was divided into two subsets based on comparing the daily number of tests with its average over the full period. The t-test was applied both to the independent variable (Swabs) and to the dependent variables (Home isolation, Mild hosp., Int. care hosp., daily deaths, and daily new cases) to determine whether the comparison between the two periods of the corresponding data presented a significant difference.
- Evaluation of the p-value: If the result of the p-value resulting from the comparison of the independent variable (Swabs) and each dependent variable (Home isolation, Mild hosp., Int. care hosp.) was less than 0.05, the relationship between the two variables was considered to be significant, and we proceeded to the calculation of the beta coefficient. If, instead, the p-value was larger than 0.05, the significance of the relationship was excluded.
- Evaluation of the beta coefficient: A positive (negative) value of this coefficient meant that, for every 1-unit increase (decrease) in the predictor variable (swab number in our case), the outcome variable increased (decreased) by an amount equal to the value of the beta coefficient.
3. Results
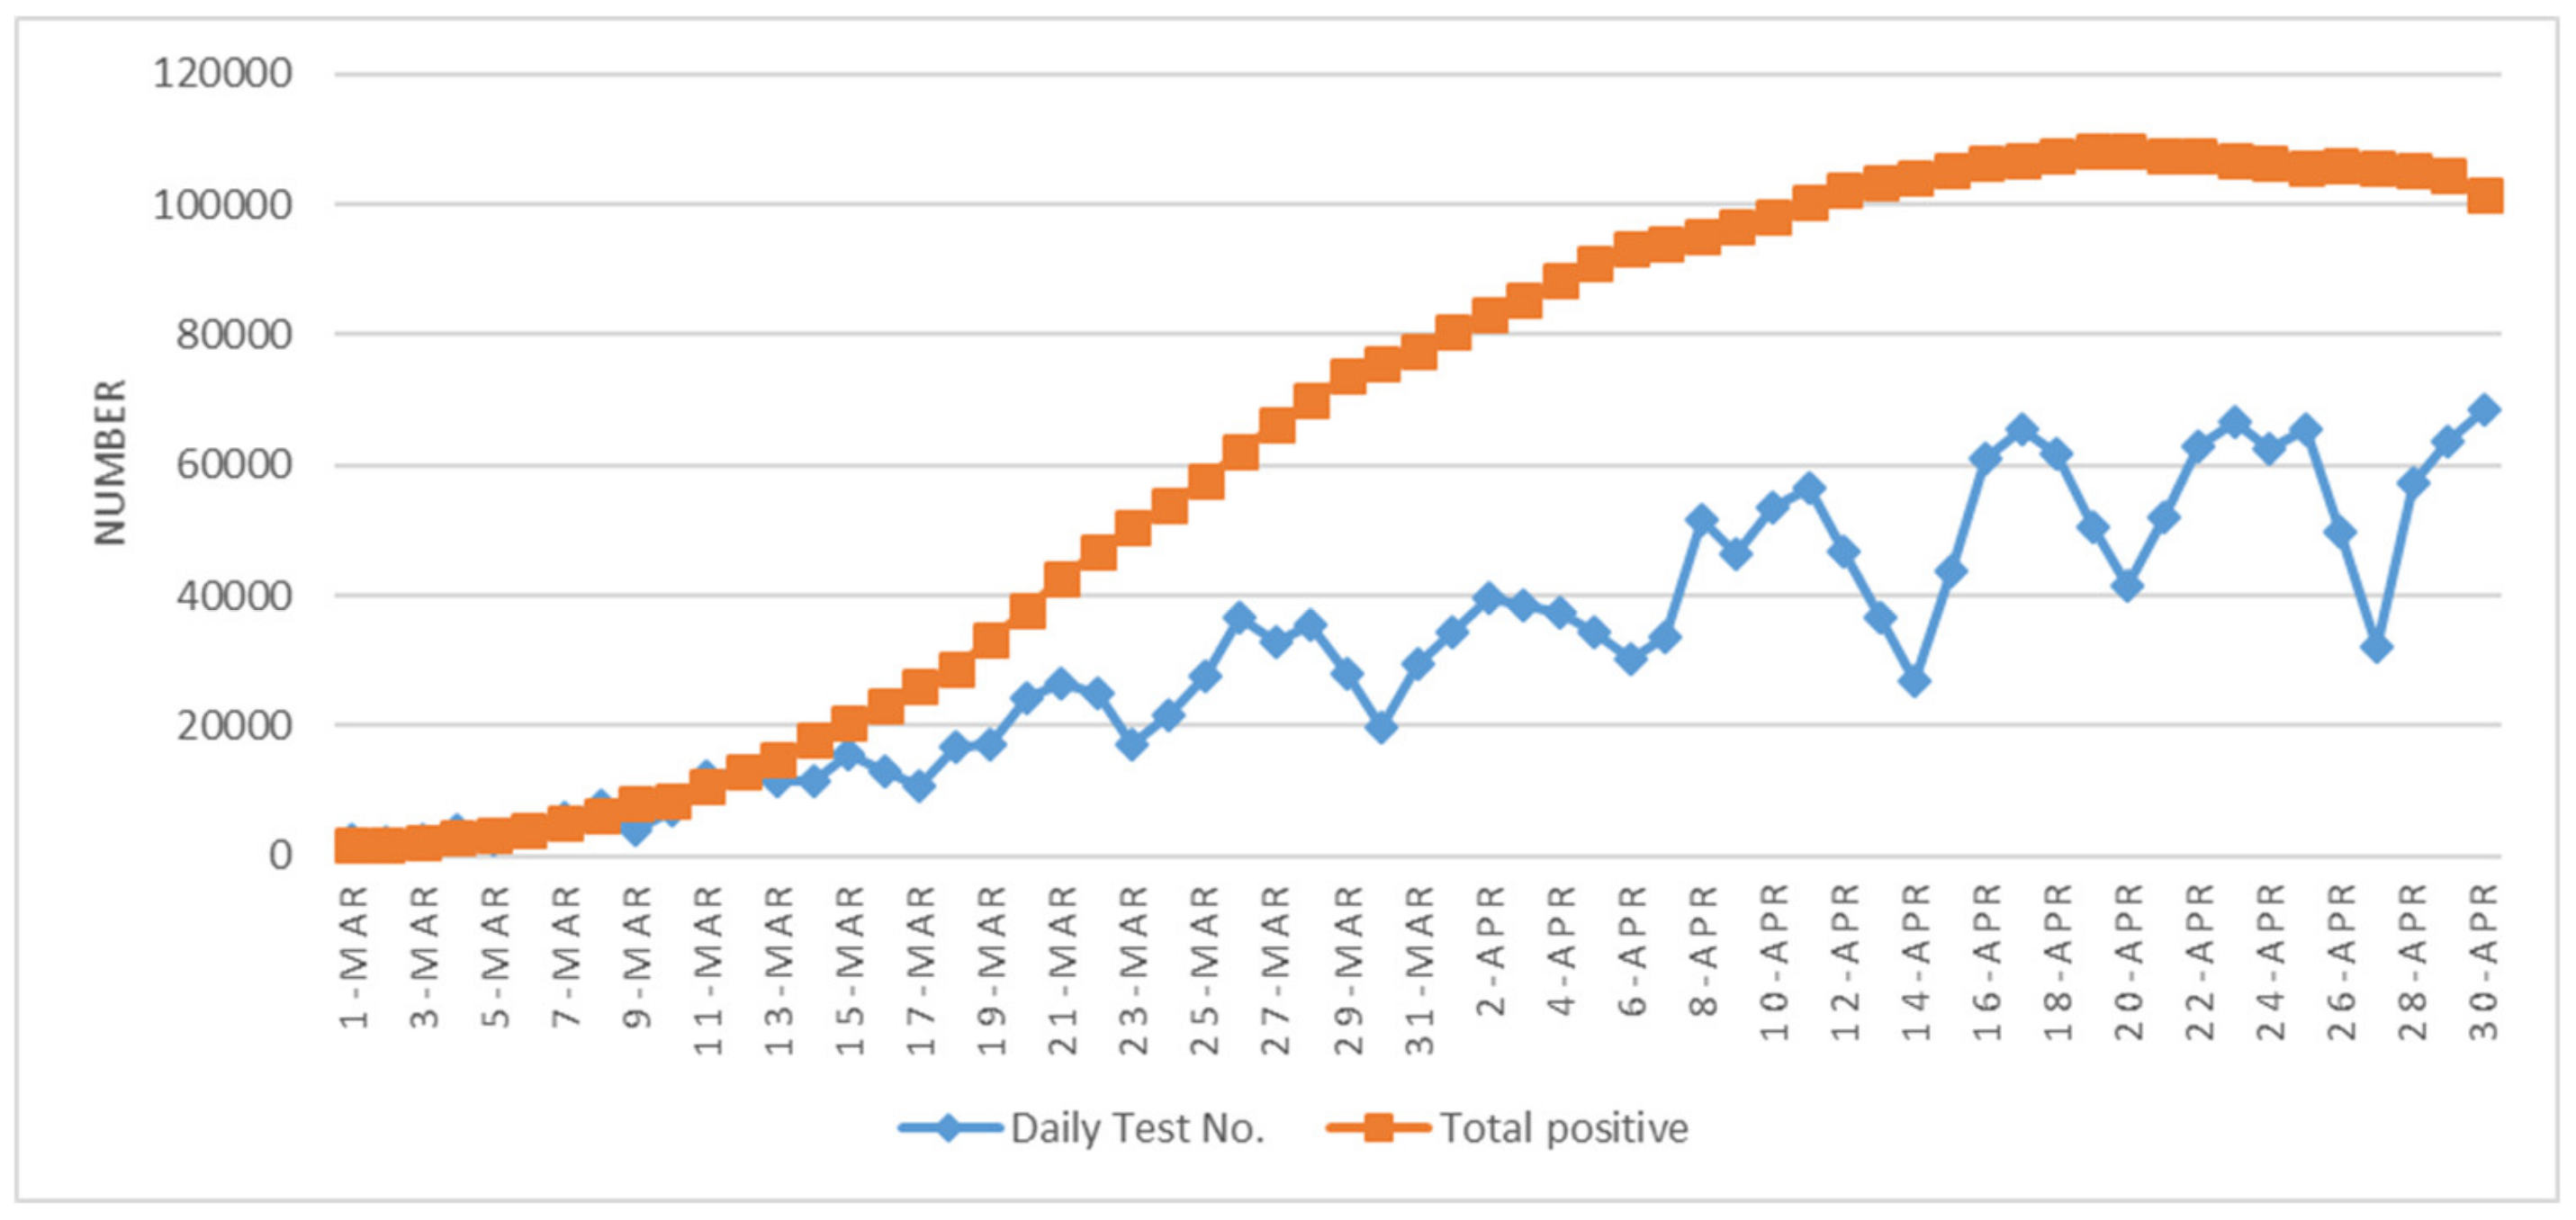
3.1. Correlations between Swabs and the Other Variables in the Whole of Italy
3.2. Correlations between Swabs and Other Variables at the Regional Level
- In the three regions, there was a remarkable increase in the average number of daily tests: in Lombardy by a factor of 2.48, in Veneto by a factor of 2.64, and in Piedmont by a factor of 3.69
- The average number of Home isolation and Mild hospital increased significantly for all of them.
- The average number of Int Care Hosp also increased everywhere, although not significantly in Piedmont.
- Daily New Cases exhibited a general decrease that was not significant
- Daily Deaths decreased (not significantly) in Lombardy and significantly increased in Piedmont and Veneto.
- In the first period, in each of the three regions, the global Italian result was confirmed, and one finds a significantly positive correlation between the number of swabs and each outcome variable.
- In the second period, whereas for Home isolation there was a positive correlation that was only significant in Lombardy, all the other correlations generally turned negative in a significant way, the only exceptions being Daily new cases in all three regions and Daily deaths in Veneto and Piedmont.
- In the three regions, there was a remarkable increase in the average number of daily tests: by a factor of 2.18 in Emilia–Romagna, and by a factor in the order of 3.5 in Campania and Sicily, although one may observe that, in these last two regions, the average in the first period was relatively low.
- The average number of Home isolation and Mild hosp. increased significantly for all of them.
- The average number of Int Care Hosp also increased everywhere, but the increase was only significant in Emilia–Romagna.
- As for Daily New Cases, no significant variation was observed in Campania, which differed from Emilia–Romagna and Sicily, where there was a significant decrease.
- The variations in Daily Deaths were not significant.
- In the first period, in each region, the global Italian result was confirmed, with a significantly positive correlation between the number of swabs and each outcome variable. Sicily, to some extent, is the only partial exception, since the relationship for Int. Care Hosp, although positive, did not reach a significant level.
- In the second period, there was a general turn from a positive to a negative relationship in Emilia–Romagna, but without arriving at a significant level. In Campania, Home isolation was positively, but not significantly, correlated, whereas all the other variables exhibited a significantly negative correlation. In Sicily, we found two significant correlations (Home isolation, positive; and Int. Care Hosp, negative) and no significant relationship for the remaining three variables.
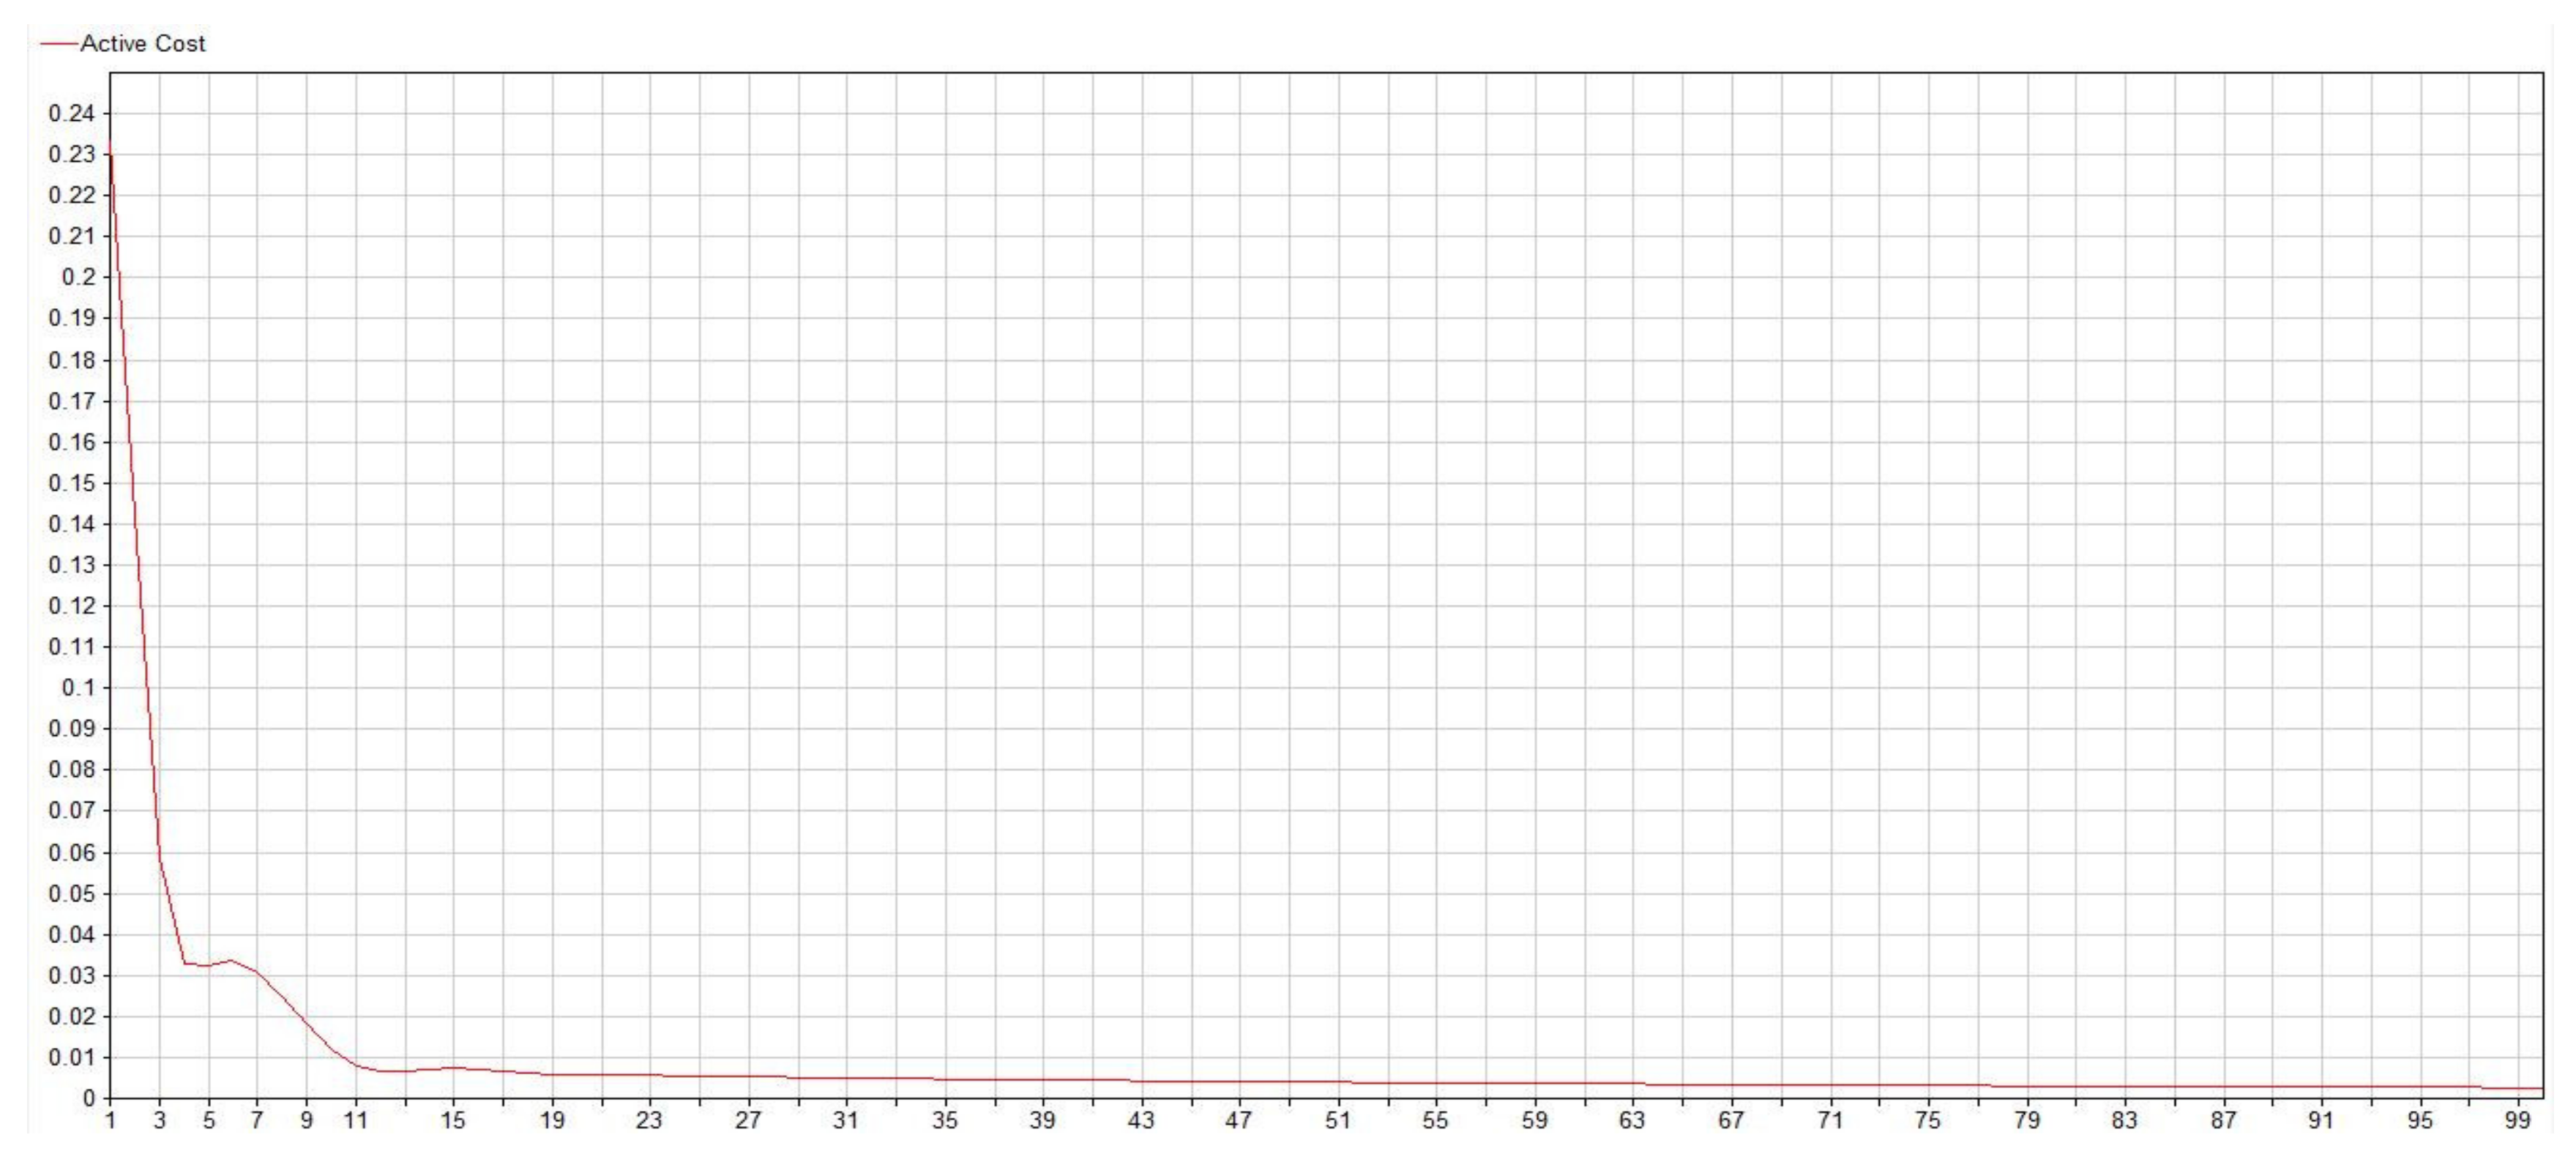
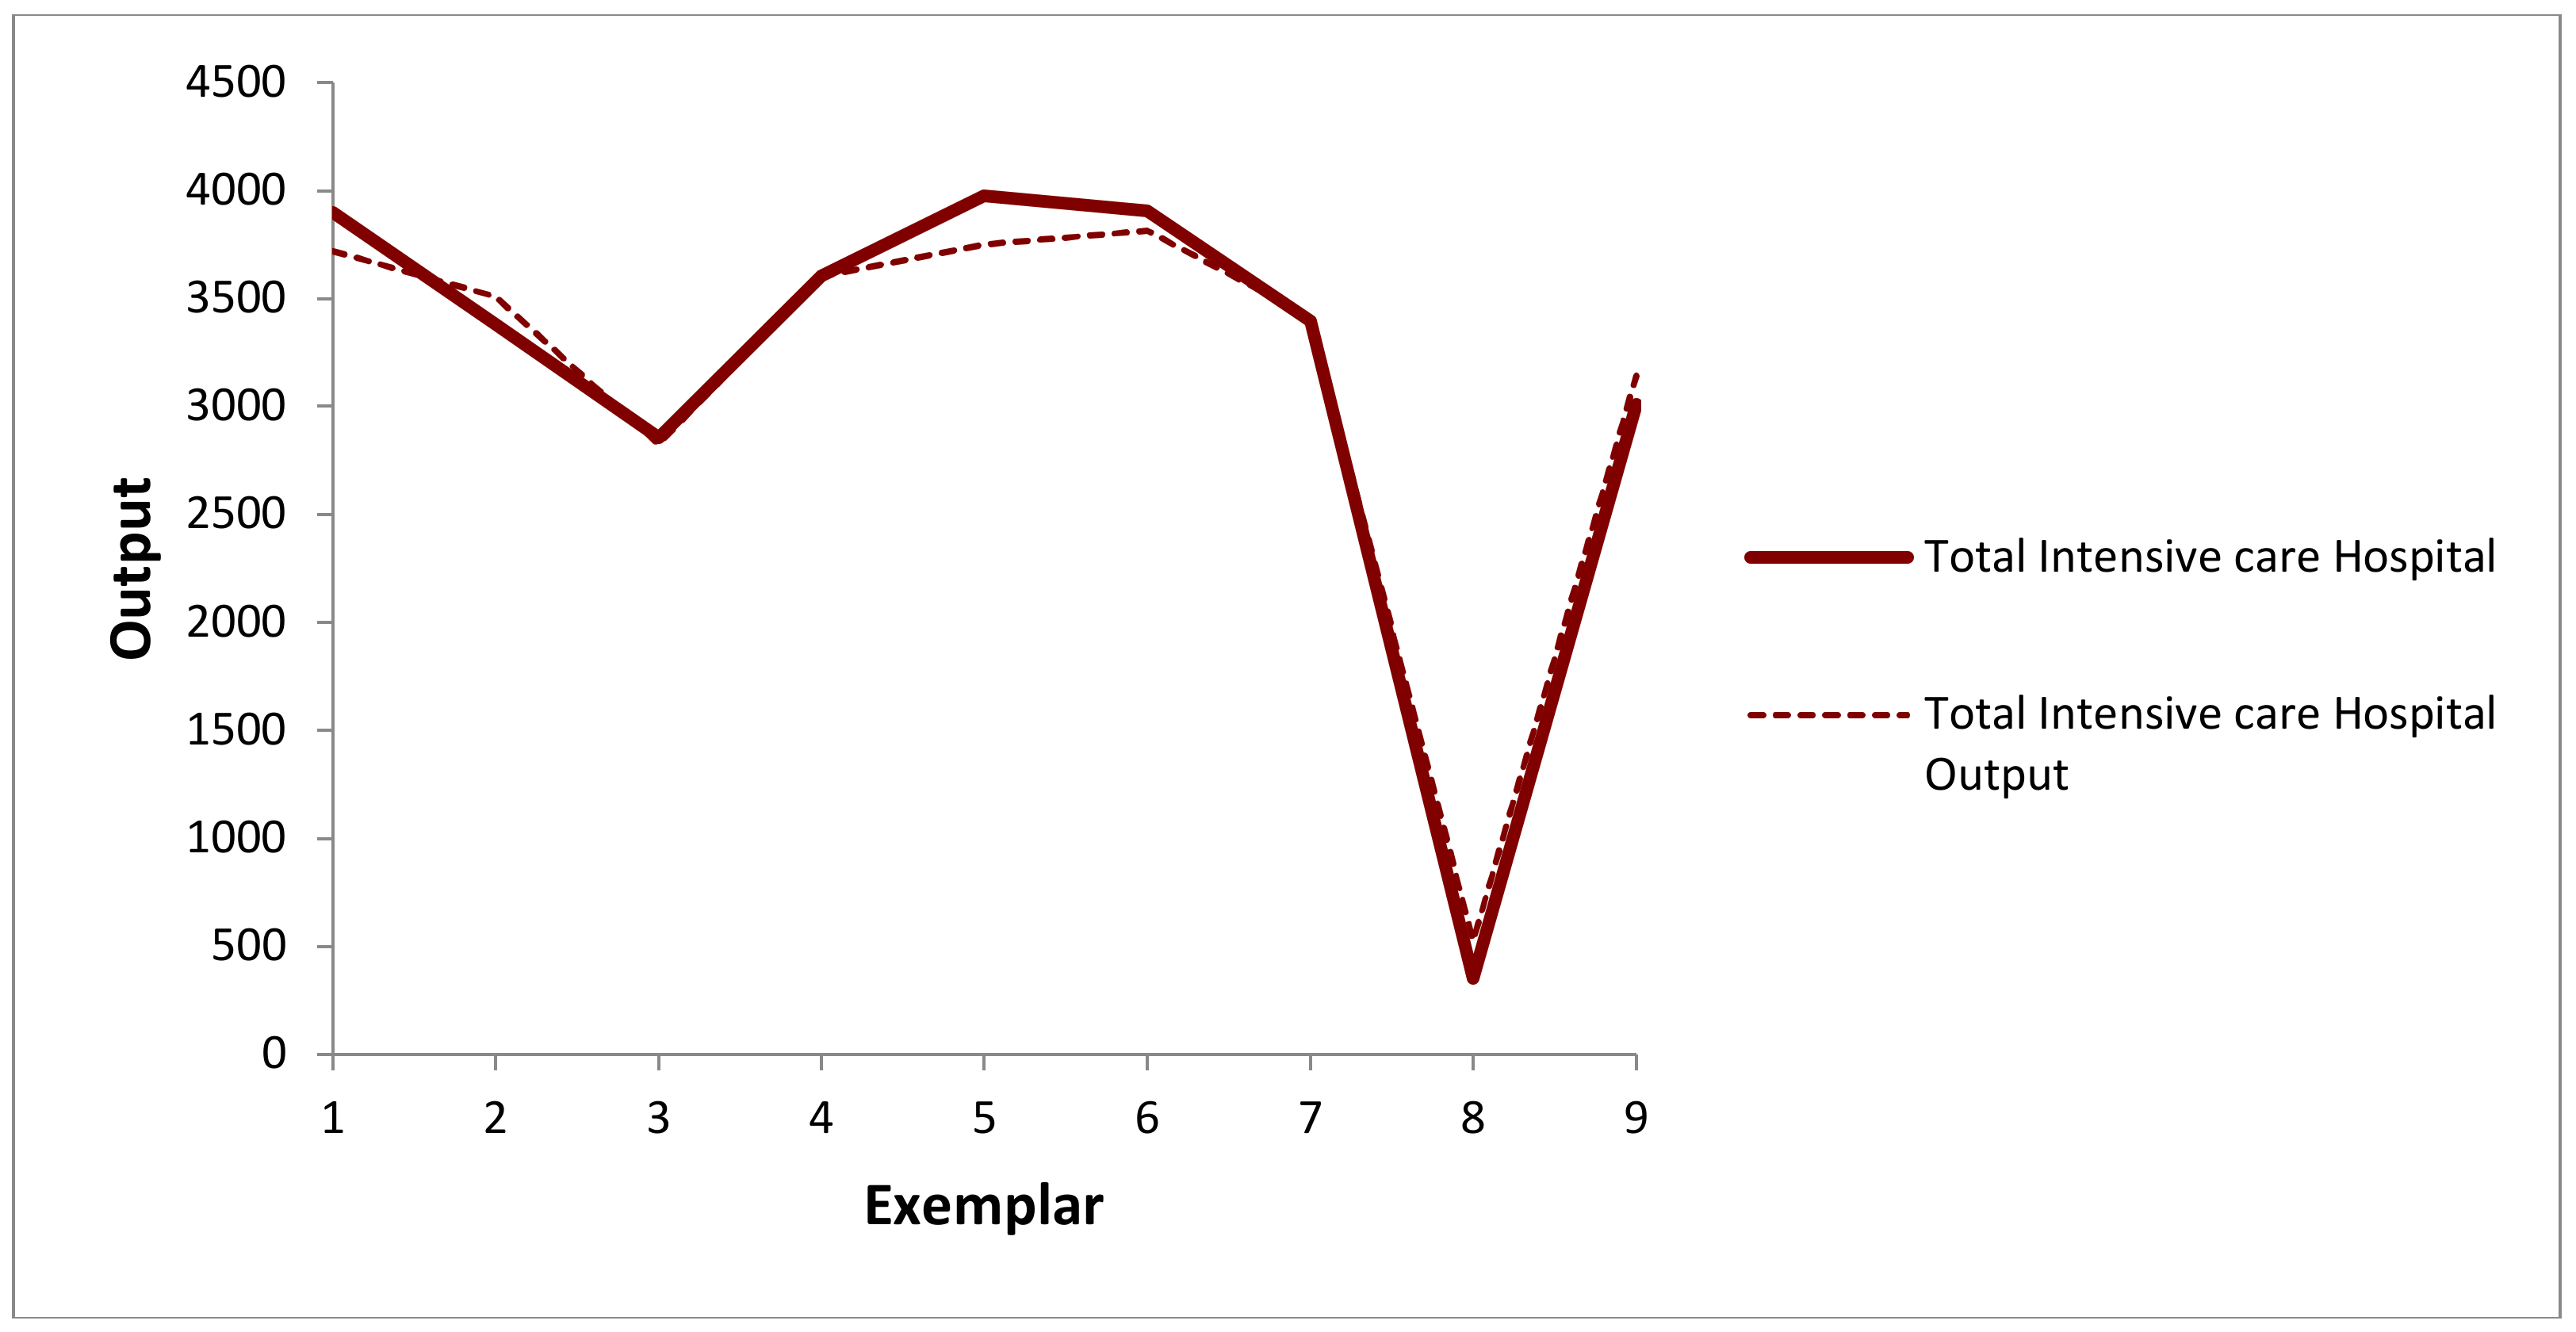
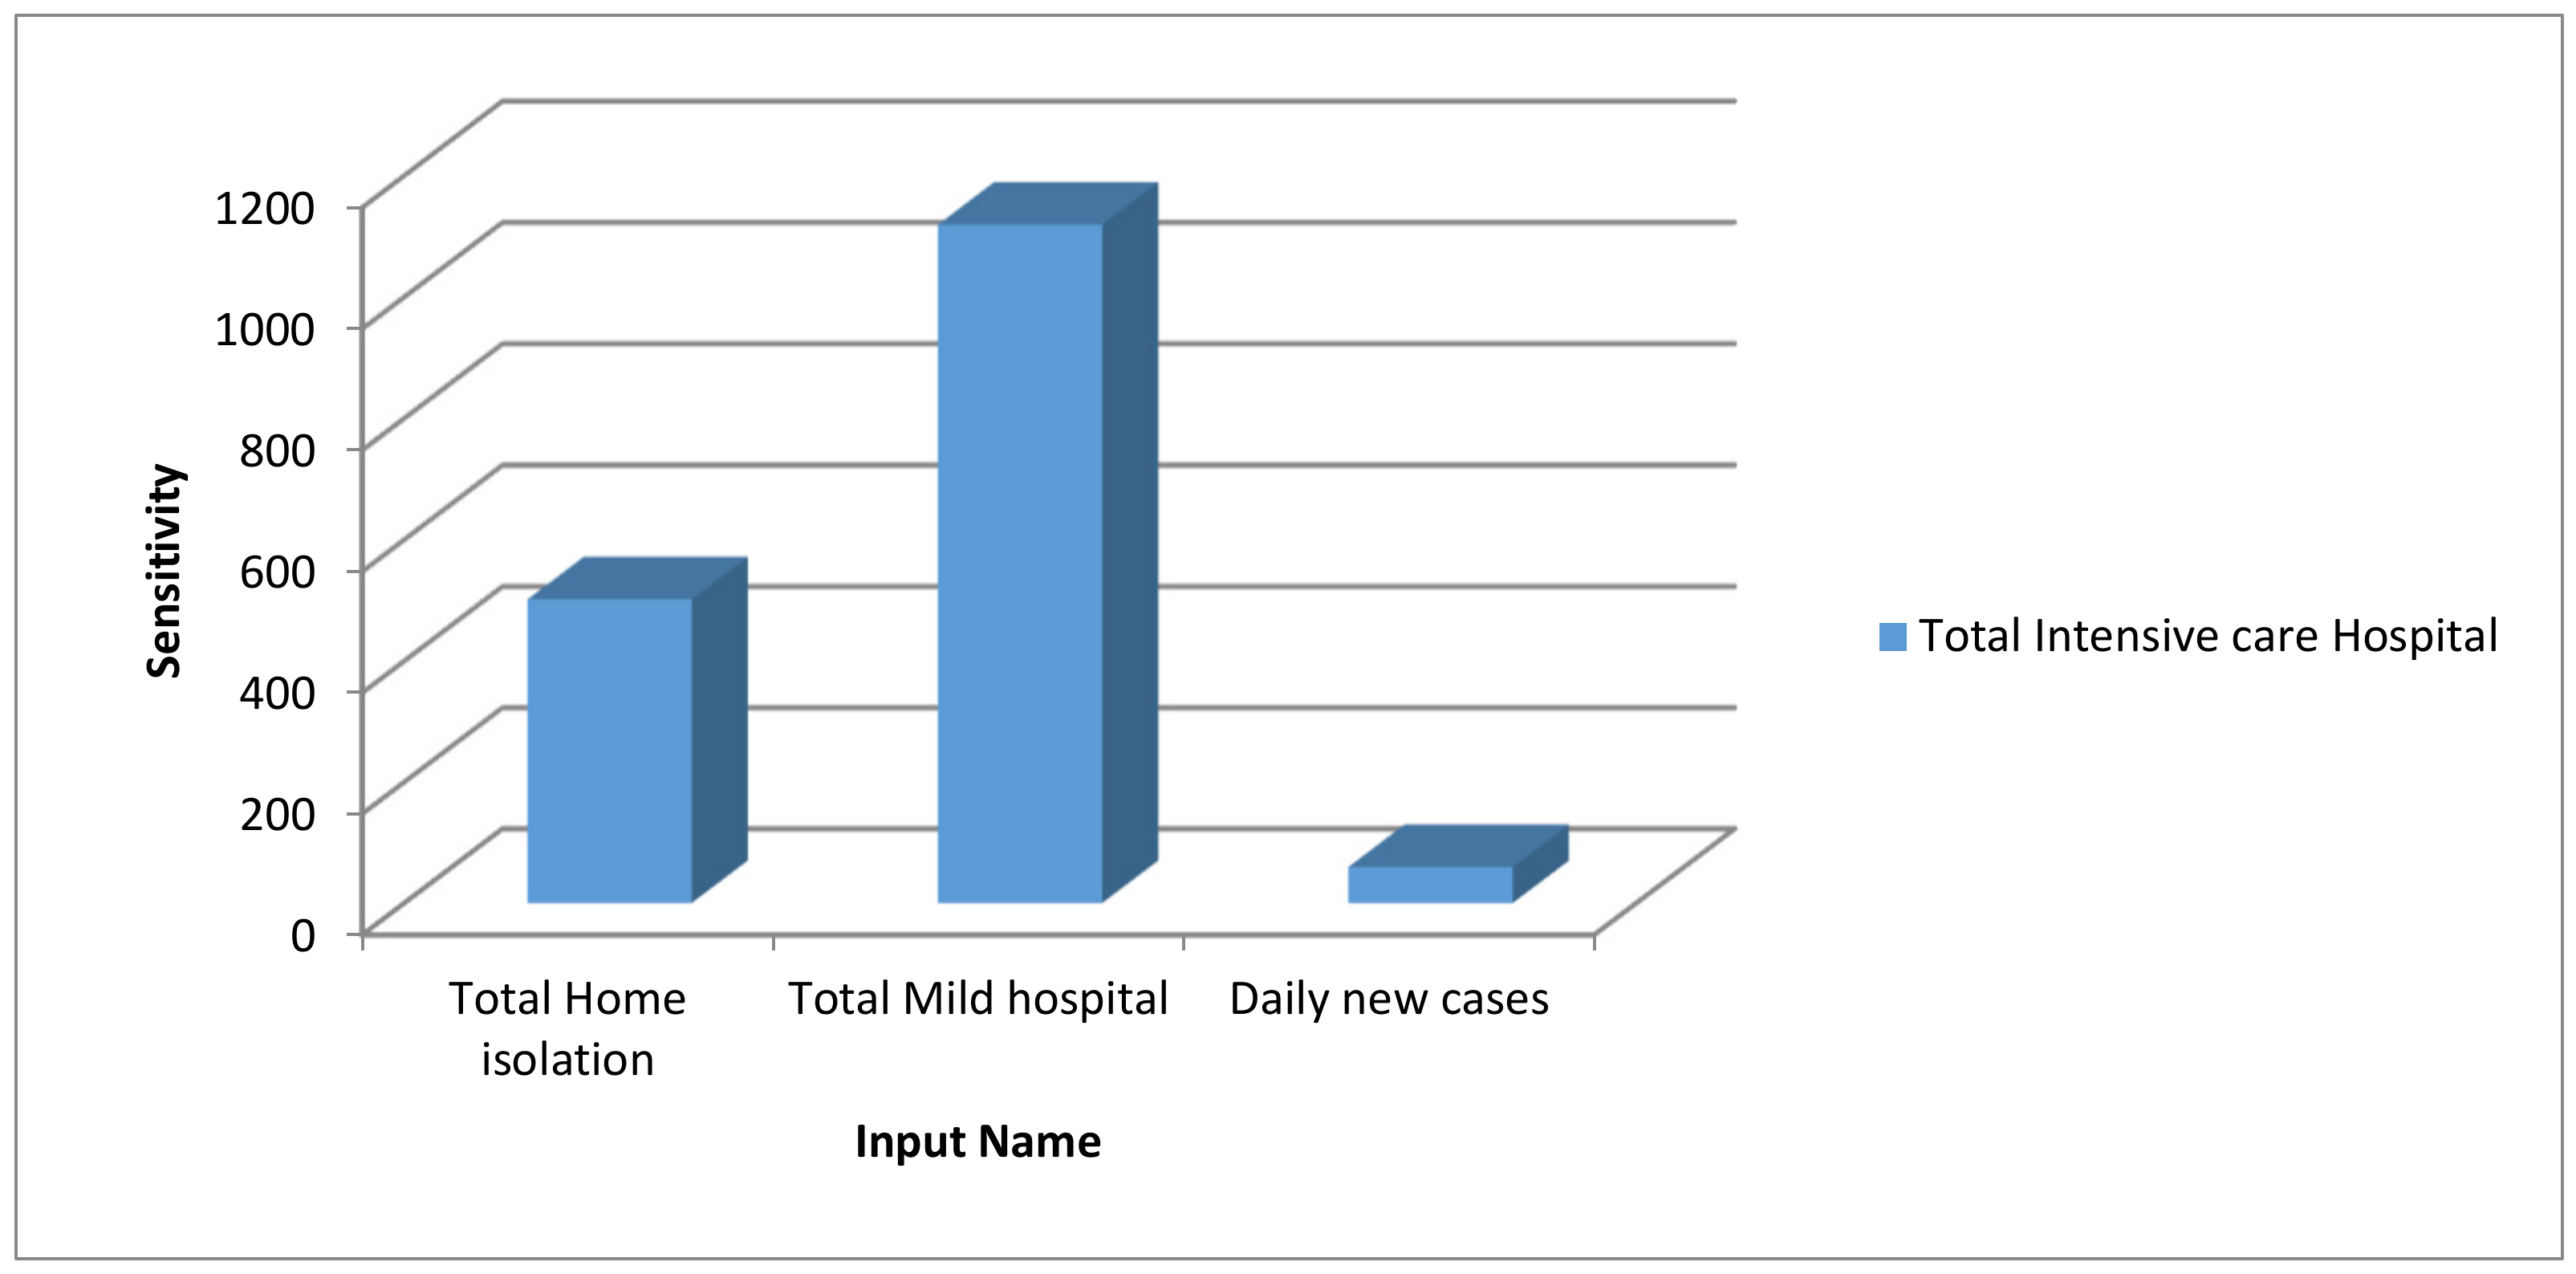
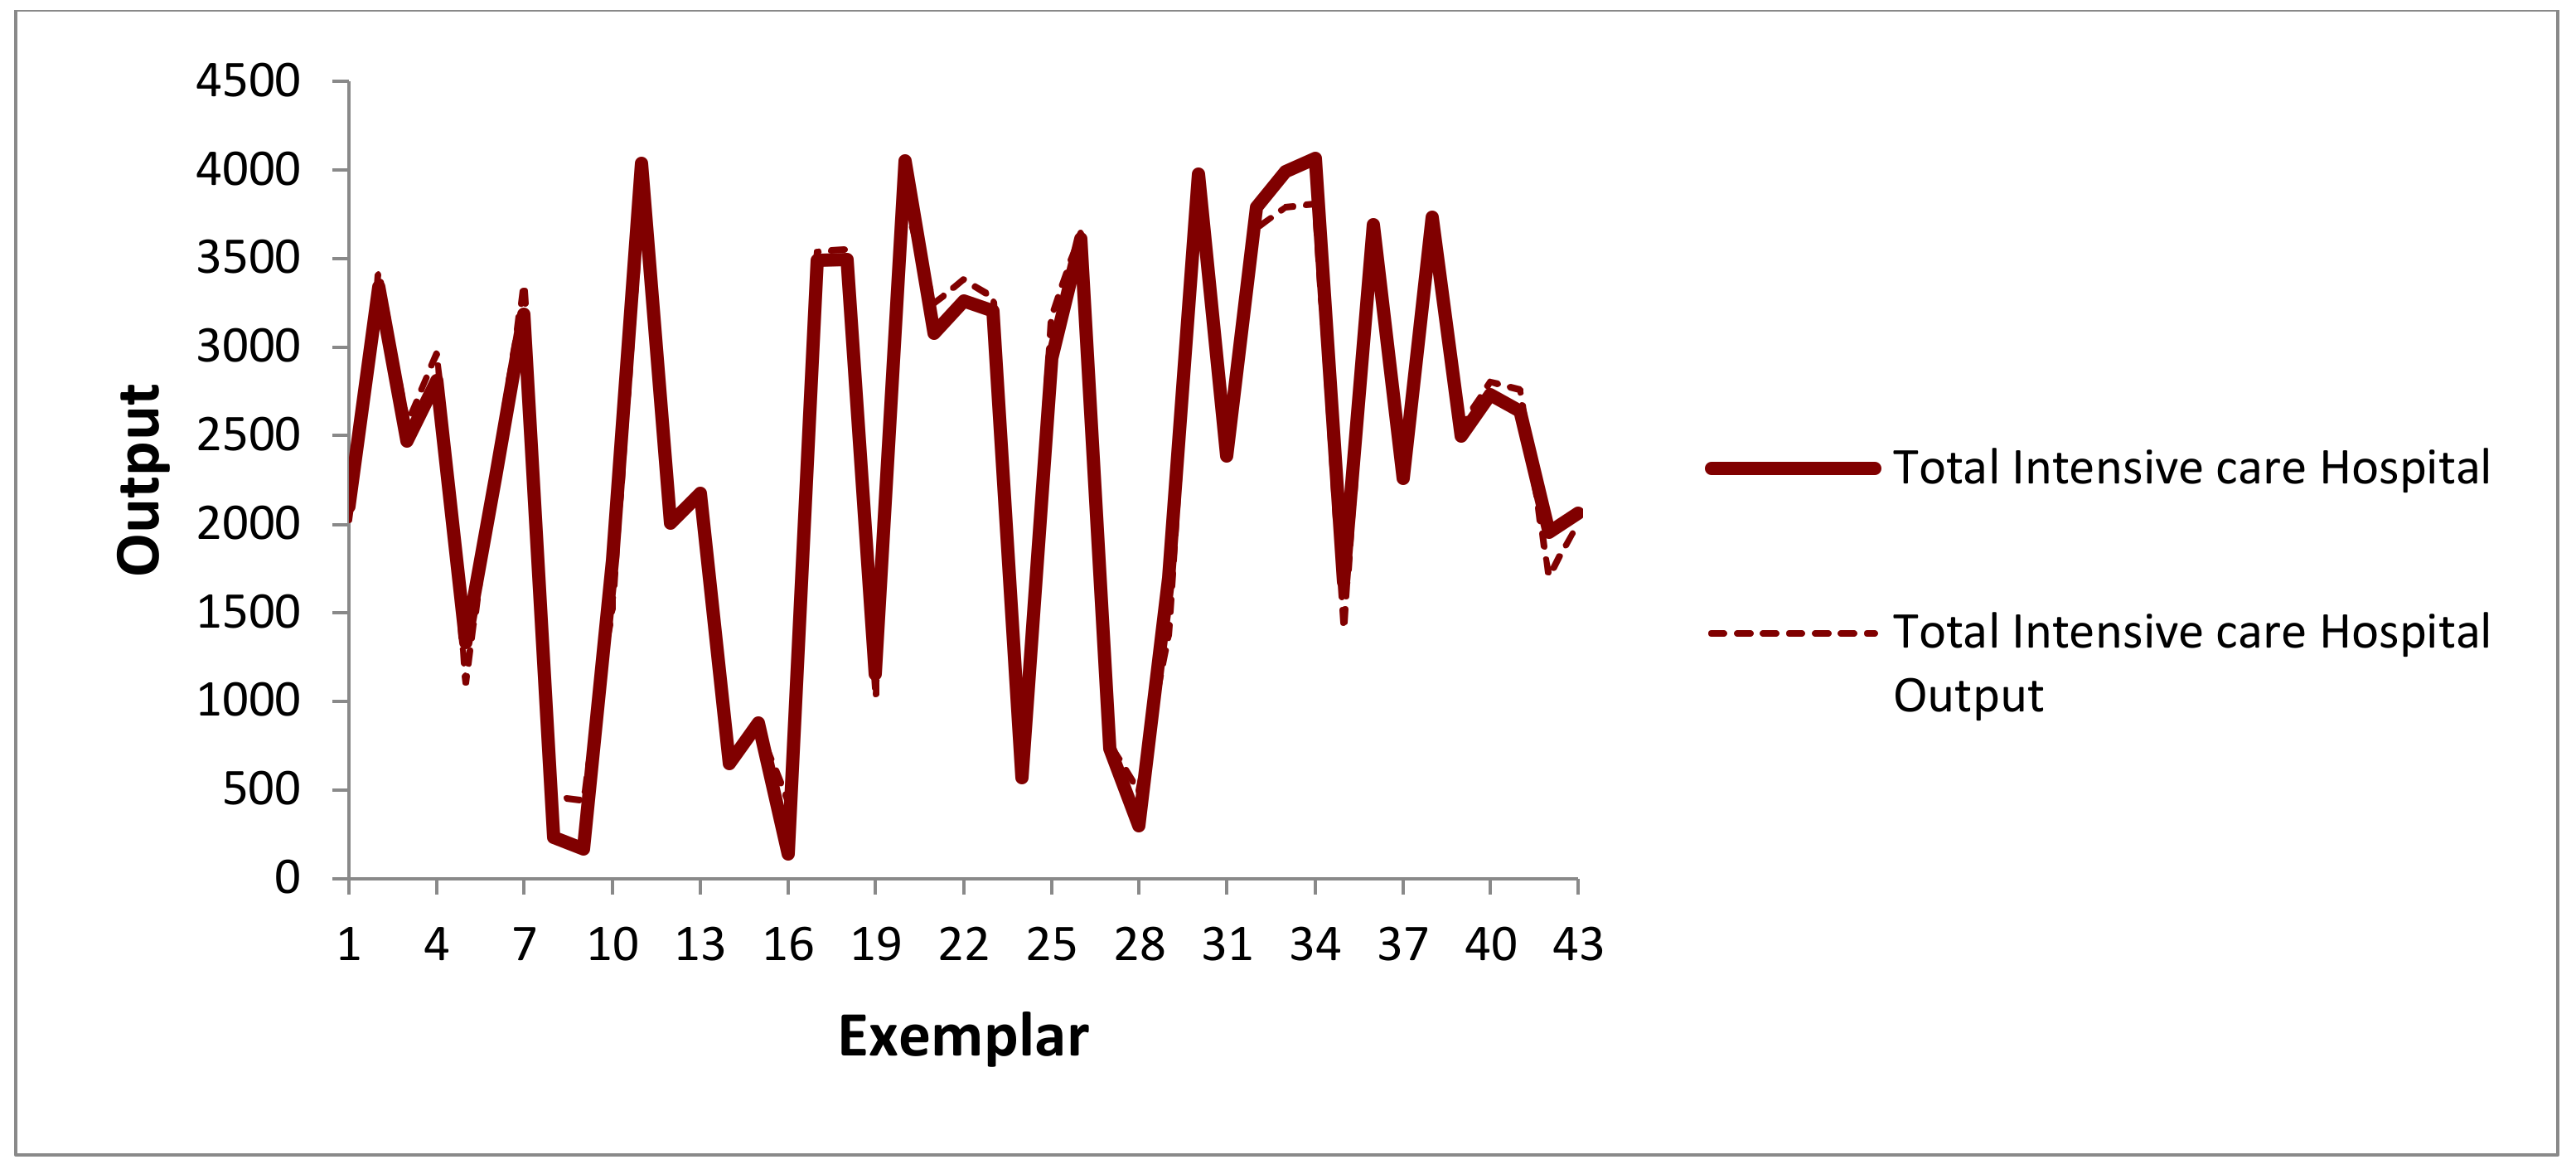
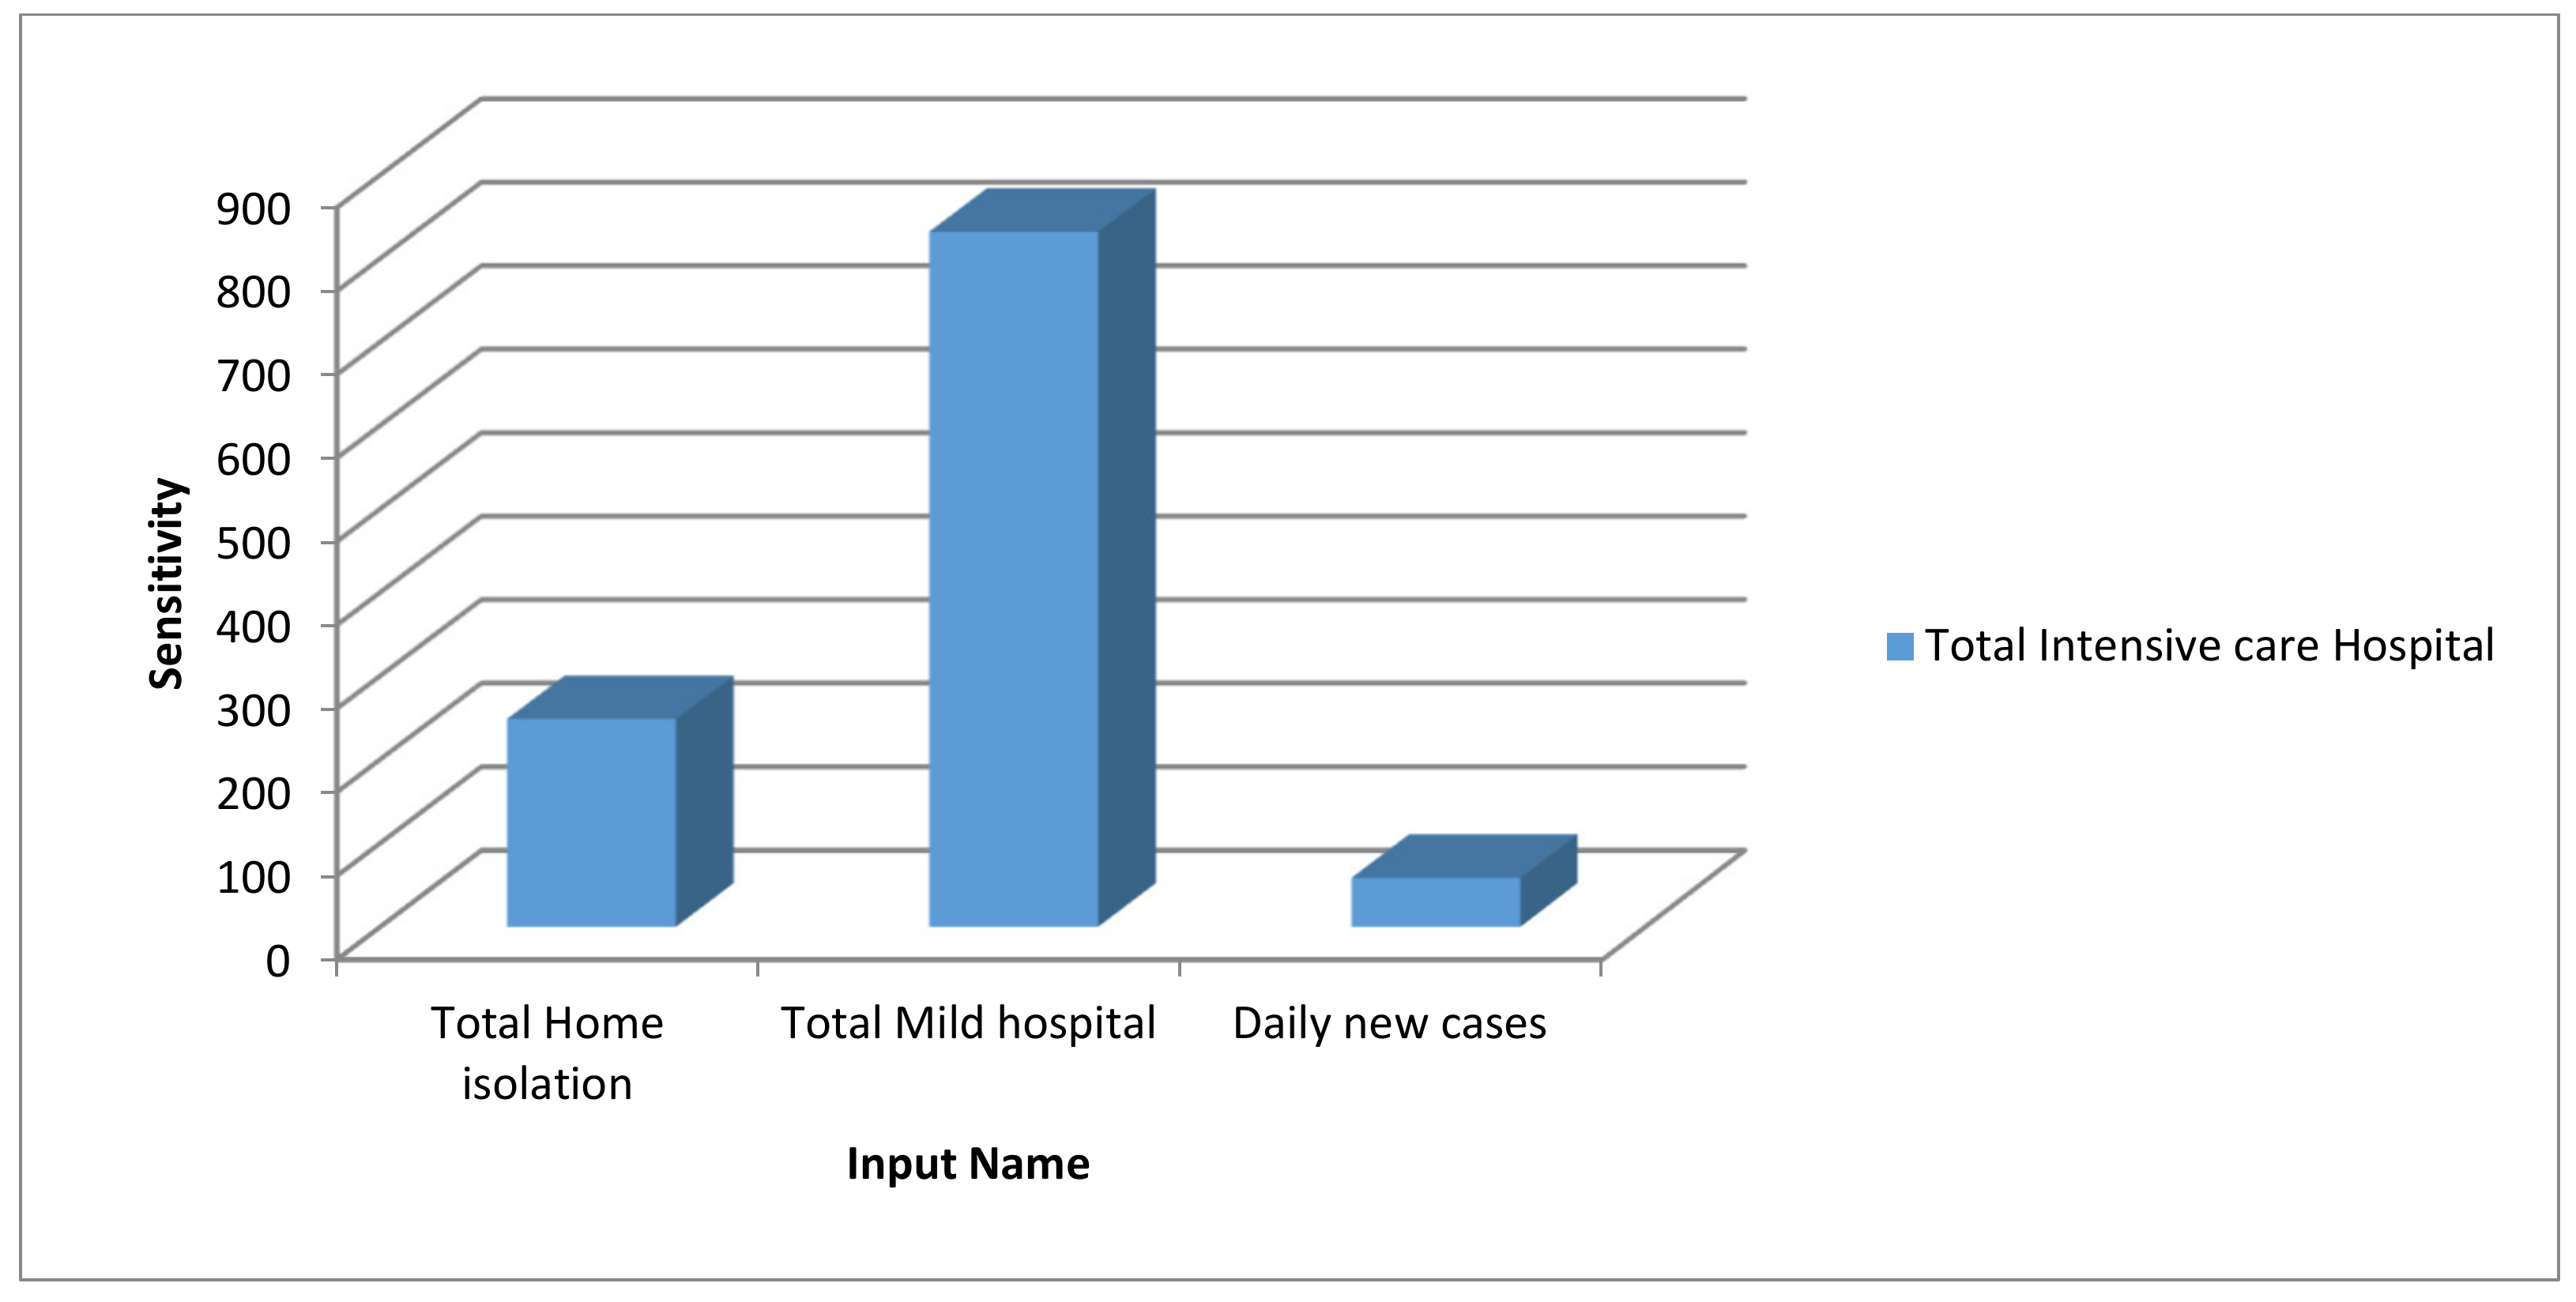
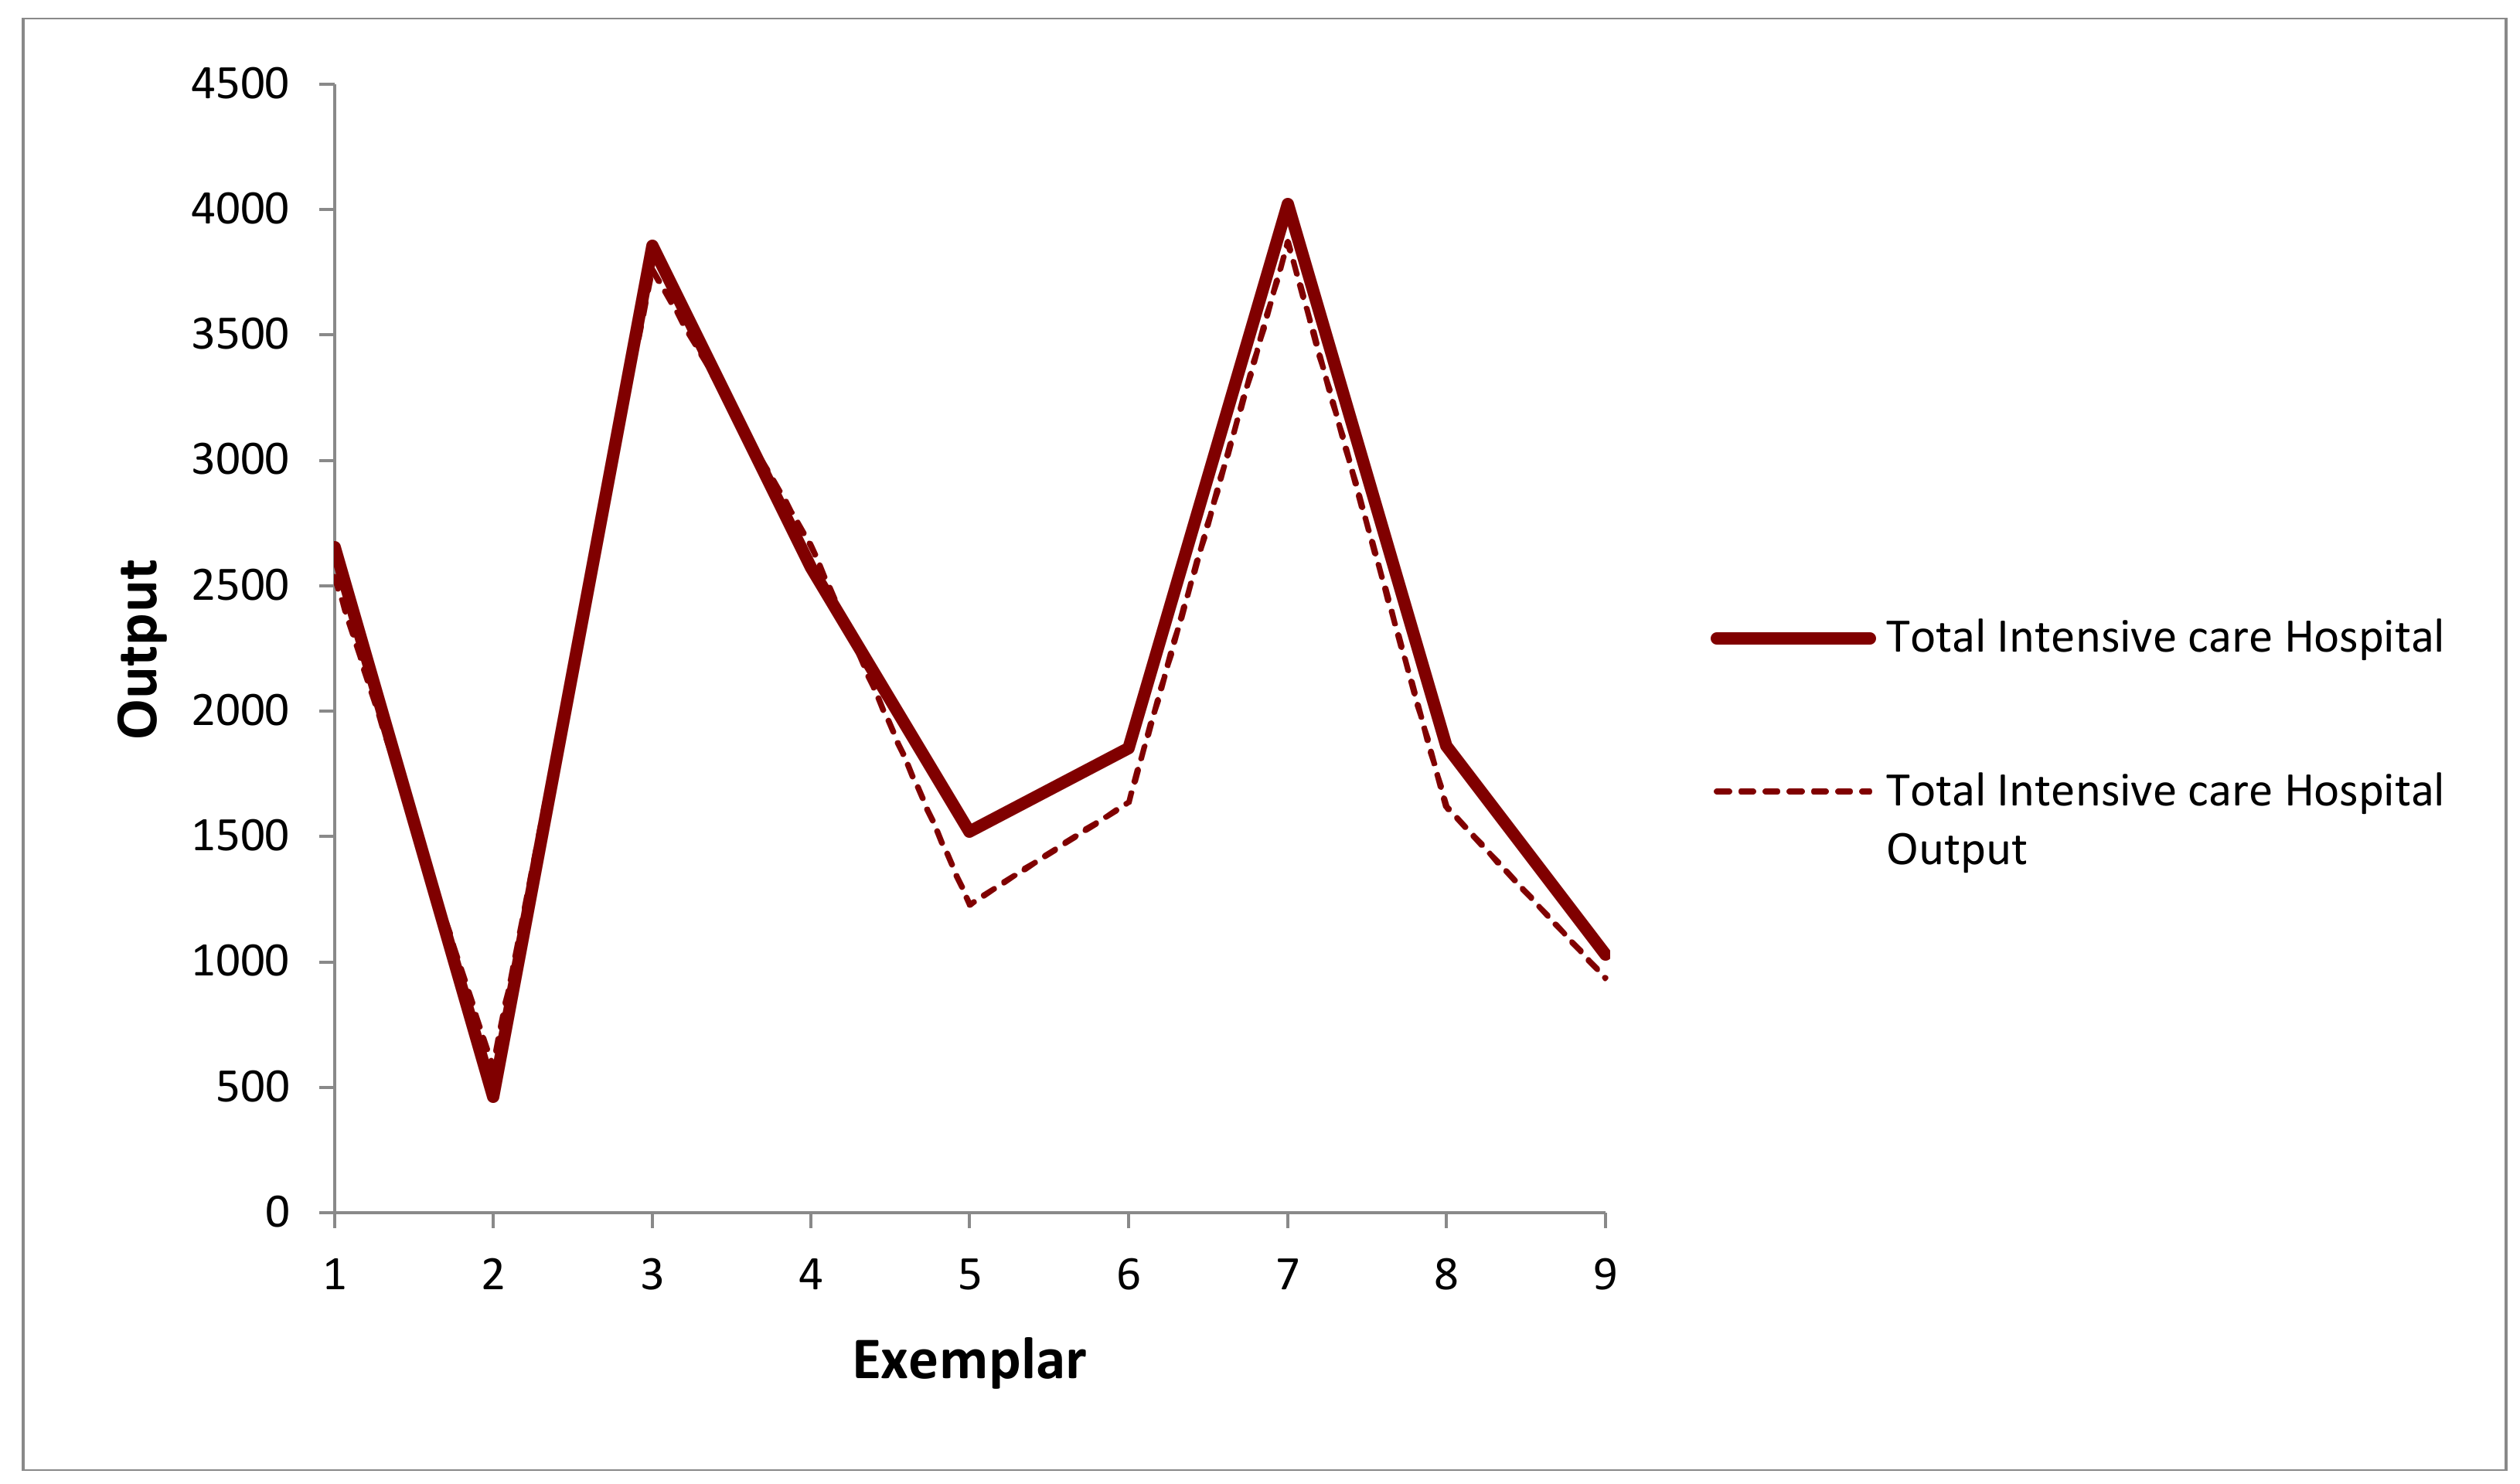
3.3. The Model Using ANN
- The selected hidden layers of ANN for the analysis: considered as 1, 3, 5, 10, 15, and 20;
- The maximum iteration values: considered as 20, 40, 70, 100, 120, and 140;
- The mean squared error (MSE) for the evaluation of the performance;
- The training data was 70% of the dataset, and the rest was for validation (15%) and testing (15%).
4. Discussion
5. Conclusions
Author Contributions
Funding
Acknowledgments
Conflicts of Interest
Appendix A


References
- Andersen, K.G.; Rambaut, A.; Lipkin, W.I.; Holmes, E.C.; Garry, R.F. The proximal origin of SARS-CoV-2. Nat. Med. 2020, 26, 450–452. [Google Scholar] [CrossRef] [Green Version]
- Pirouz, B.; Arcuri, N.; Pirouz, B.; Palermo, S.A.; Turco, M.; Maiolo, M. Development of an assessment method for evaluation of sustainable factories. Sustainability 2020, 12, 1841. [Google Scholar] [CrossRef] [Green Version]
- Pirouz, B.; Arcuri, N.; Maiolo, M.; Talarico, V.C.; Piro, P. A new multi-objective dynamic model to close the gaps in sustainable development of industrial sector. IOP Conf. Ser. Earth Environ. Sci. 2020, 410, 012074. [Google Scholar] [CrossRef] [Green Version]
- Maiolo, M.; Pirouz, B.; Bruno, R.; Palermo, S.A.; Arcuri, N.; Piro, P. The role of the extensive green roofs on decreasing building energy consumption in the mediterranean climate. Sustainability 2020, 12, 359. [Google Scholar] [CrossRef] [Green Version]
- Pirouz, B.; Maiolo, M. The role of power consumption and type of air conditioner in direct and indirect water consumption. J. Sustain. Dev. Energy Water Environ. Syst. 2018. [Google Scholar] [CrossRef] [Green Version]
- Shen, M.; Peng, Z.; Guo, Y.; Xiao, Y.; Zhang, L. Lockdown may partially halt the spread of 2019 novel coronavirus in Hubei province, China. medRxiv 2020. [Google Scholar] [CrossRef] [Green Version]
- Chinazzi, M.; Davis, J.T.; Ajelli, M.; Gioannini, C.; Litvinova, M.; Merler, S.; Piontti, A.P.; Mu, K.; Rossi, L.; Sun, K.; et al. The effect of travel restrictions on the spread of the 2019 novel coronavirus (COVID-19) outbreak. Science 2020, 368, 395–400. [Google Scholar] [CrossRef] [Green Version]
- Worldometer Coronavirus Incubation Period. Available online: https://www.reuters.com/article/us-china-health-incubation/coronavirus-incubation-could-be-as-long-as-27-days-chinese-provincial-government-says-idUSKCN20G06W (accessed on 26 April 2020).
- Kampf, G.; Todt, D.; Pfaender, S.; Steinmann, E. Persistence of coronaviruses on inanimate surfaces and their inactivation with biocidal agents. J. Hosp. Infect. 2020, 104, 246–251. [Google Scholar] [CrossRef] [Green Version]
- Li, Q.; Guan, X.; Wu, P.; Wang, X.; Zhou, L.; Tong, Y.; Ren, R.; Leung, K.S.M.; Lau, E.H.Y.; Wong, J.Y.; et al. Early transmission dynamics in Wuhan, China, of novel coronavirus-infected pneumonia. N. Engl. J. Med. 2020. [CrossRef]
- Phan, L.T.; Nguyen, T.V.; Luong, Q.C.; Nguyen, T.V.; Nguyen, H.T.; Le, H.Q.; Nguyen, T.T.; Cao, T.M.; Pham, Q.D. Importation and human-to-human transmission of a novel coronavirus in Vietnam. N. Engl. J. Med. 2020, 382, 1199–1207. [Google Scholar] [CrossRef] [PubMed] [Green Version]
- Pirouz, B.; Golmohammadi, A.; Masouleh, H.S.; Violini, G.; Pirouz, B. Relationship between Average Daily Temperature and Average Cumulative Daily Rate of Confirmed Cases of COVID-19. medRxiv 2020. [Google Scholar] [CrossRef] [Green Version]
- Grant, W.B.; Giovannucci, E. The possible roles of solar ultraviolet-B radiation and vitamin D in reducing case-fatality rates from the 1918–1919 influenza pandemic in the United States. Dermato-Endocrinology 2009, 1, 215–219. [Google Scholar] [CrossRef]
- Pirouz, B.; Haghshenas, S.S.; Haghshenas, S.S.; Piro, P. Investigating a serious challenge in the sustainable development process: Analysis of confirmed cases of COVID-19 (new type of Coronavirus) through a binary classification using artificial intelligence and regression analysis. Sustainability 2020, 12, 2427. [Google Scholar] [CrossRef] [Green Version]
- Haghshenas, S.S.; Pirouz, B.; Haghshenas, S.S.; Pirouz, B.; Piro, P.; Na, K.S.; Cho, S.E.; Geem, Z.W. Prioritizing and analyzing the role of climate and urban parameters in the confirmed cases of COVID-19 based on artificial intelligence applications. Int. J. Environ. Res. Public Health 2020, 17, 3730. [Google Scholar] [CrossRef]
- Chen, Y.C.; Lu, P.E.; Chang, C. A Time-dependent SIR model for COVID-19. arXiv 2020, arXiv:2003.00122. [Google Scholar]
- Pirouz, B.; Violini, G. A Novel Approach to Evaluate the Asymptomatic COVID19 Contagions. 2020. Available online: https://www.asiabiotech.com/exclusive/2020-04-30-03.pdf (accessed on 21 September 2020). [CrossRef]
- Hu, Z.; Ge, Q.; Jin, L.; Xiong, M. Artificial intelligence forecasting of covid-19 in China. arXiv 2020, arXiv:2002.07112. [Google Scholar]
- Pirouz, B.; Haghshenas, S.S.; Pirouz, B.; Haghshenas, S.S.; Piro, P. Development of an assessment method for investigating the impact of climate and urban parameters in confirmed cases of COVID-19: A new challenge in sustainable development. Int. J. Environ. Res. Public Health 2020. [Google Scholar] [CrossRef] [PubMed] [Green Version]
- Violini, G. Differenze Nazionali e Regionali Riguardo il COVID-19. PUCMM Preprint 2020. [Google Scholar] [CrossRef]
- Violini, G. Does COVID-19 Have an Internal Clock? Or is Pandemic Development Anthropic. CIF Preprint 2020. [Google Scholar] [CrossRef]
- Wen, J.; Aston, J.; Liu, X.; Ying, T. Effects of misleading media coverage on public health crisis: A case of the 2019 novel coronavirus outbreak in China. Anatolia 2020, 31, 331–336. [Google Scholar] [CrossRef]
- Nkengasong, J.N.; Mankoula, W. Looming threat of COVID-19 infection in Africa: Act collectively, and fast. Lancet 2020, 395, 10227. [Google Scholar] [CrossRef] [Green Version]
- Shin, D.; Ibahrine, M. The socio-technical assemblages of blockchain system: How blockchains are framed and how the framing reflects societal contexts. Digit. Policy Regul. Gov. 2020. [Google Scholar] [CrossRef]
- Shin, D.D.; Beede, P.; Ibahrine, M.; Zaid, B. Thumb movement and touch-based interaction heuristics in smart devices: Advances in human and smart device interaction. Int. J. Mob. Hum. Comput. Interact. 2020. [Google Scholar] [CrossRef]
- Turin, S. Coronavirus: Qual è il Numero (Vero) di Persone Sottoposte ai Tamponi in Italia. Available online: https://www.corriere.it/salute/malattie_infettive/20_aprile_23/coronavirus-quante-persone-sono-state-sottoposte-tampone-davvero-5bb59814-847c-11ea-8d8e-1dff96ef3536.shtml (accessed on 23 April 2020).
- Mumphrey, N. Orleans, Parish Jefferson Testing Sites Expand to Anyone Showing Symptoms of COVID-19. Available online: https://www.fox8live.com/2020/03/21/orleans-jefferson-parish-testing-sites-expand-anyone-showing-symptoms-covid-/ (accessed on 8 May 2020).
- Coronavirus Testing: How it is Done, When You Should Get one and How Long Results Take. Available online: https://www.liverpoolecho.co.uk/news/uk-world-news/coronavirus-testing-how-done-you-17912266 (accessed on 27 April 2020).
- Gray, N.; Calleja, D.; Wimbush, A.; Miralles-Dolz, E.; Gray, A.; De-Angelis, M.; Derrer-Merk, E.; Uchenna-Oparaji, B.; Stepanov, V.; Clearkin, L.; et al. No test is better than a bad test: Impact of diagnostic uncertainty in mass testing on the spread of Covid-19. medRxiv 2020. [Google Scholar] [CrossRef]
- Szklarsky, C. False Positive COVID-19 Test Results Rare Despite Recent Scares, Experts Say. Available online: https://www.ctvnews.ca/health/coronavirus/false-positive-covid-19-test-results-rare-despite-recent-scares-experts-say-1.4932859/ (accessed on 10 May 2020).
- Eberhardt, J.N.; Breuckmann, N.P.; Eberhardt, C.S. Multi-Stage Group Testing Improves Efficiency of Large-Scale COVID-19 Screening. J. Clin. Virol. 2020. [Google Scholar] [CrossRef]
- Ng, G.; Wang, C. The Proportion Testing Positive for SARS-COV-2 among the Tested Population in the U.S.: Benefits of the Positive Test ratio under Scaled Testing Scenarios. medRxiv 2020. [Google Scholar] [CrossRef] [Green Version]
- Corman, V.M.; Landt, O.; Kaiser, M.; Molenkamp, R.; Meijer, A.; Chu, D.K.W.; Bleicker, T.; Brünink, S.; Schneider, J.; Schmidt, M.L.; et al. Detection of 2019 novel coronavirus (2019-nCoV) by real-time RT-PCR. Eurosurveillance 2020. [Google Scholar] [CrossRef] [Green Version]
- Martinez-Garcia, M.; Zhang, Y.E.; Suzuki, K.; Zhang, Y.-D. Deep Recurrent Entropy Adaptive Model for System Reliability Monitoring. IEEE Trans. Ind. Inform. 2020, 1. [Google Scholar] [CrossRef]
- Martinez-Garcia, M.; Zhang, Y.; Wan, J.; McGinty, J. Visually interpretable profile extraction with an autoencoder for health monitoring of industrial systems. In Proceedings of the 2019 4th IEEE International Conference on Advanced Robotics and Mechatronics, ICARM 2019, Toyonaka, Japan, 3–5 July 2019. [Google Scholar]
- 2020 Coronavirus Pandemic in Italy. Available online: https://en.wikipedia.org/wiki/2020_coronavirus_pandemic_in_Italy#cite_note-139 (accessed on 29 April 2020).
- Veneto. Available online: https://en.wikipedia.org/wiki/File:Map_of_region_of_Veneto,_Italy,_with_provinces-en.svg (accessed on 29 April 2020).
- Coronavirus, la Situazione in Italia. Available online: https://lab.gedidigital.it/gedi-visual/2020/coronavirus-i-contagi-in-italia/ (accessed on 29 April 2020).
- AdminStat Maps, Analysis and Statistics about the Resident Population. Available online: https://ugeo.urbistat.com/AdminStat/en/it/demografia/dati-sintesi/milano/15/3 (accessed on 2 May 2020).
- World Population Review. Available online: http://worldpopulationreview.com/countries/ (accessed on 29 April 2020).
- Jafari Petrudi, S.H.; Pirouz, M.; Pirouz, B. Application of fuzzy logic for performance evaluation of academic students. In Proceedings of the 13th Iranian Conference on Fuzzy Systems, IFSC 2013, Qazvin, Iran, 27–29 August 2013. [Google Scholar] [CrossRef]
- Pirouz, B.; Khorram, E. A computational approach based on the \epsilon-constraint method in multi-objective optimization problems. Adv. Appl. Stat. 2016. [Google Scholar] [CrossRef]
- Pirouz, B.; Ramezani Paschapari, J. A Computational Algorithm Based on Normalization for Constructing the Pareto Front of Multiobjective Optimization Problems. In Proceedings of the 5th International Conference on Industrial and Systems Engineering, Mashhad, Iran, 4–5 September 2019. [Google Scholar]
- Palermo, S.A.; Talarico, V.C.; Turco, M. On the LID systems effectiveness for urban stormwater management: Case study in Southern Italy. IOP Conf. Ser. Earth Environ. Sci. 2020, 410, 012012. [Google Scholar] [CrossRef]
- Palermo, S.A.; Zischg, J.; Sitzenfrei, R.; Rauch, W.; Piro, P. Parameter Sensitivity of a Microscale Hydrodynamic Model. In Proceedings of the International Conference on Urban Drainage Modelling, Palermo, Italy, 23–26 September 2018; pp. 982–987. [Google Scholar]
- Palermo, S.A.; Talarico, V.C.; Pirouz, B. Optimizing Rainwater Harvesting Systems for Non-potable Water Uses and Surface Runoff Mitigation. In Lecture Notes in Computer Science (Including Subseries Lecture Notes in Artificial Intelligence and Lecture Notes in Bioinformatics); Springer: Cham, Switzerland, 2020. [Google Scholar] [CrossRef]
- Pirouz, B.; Palermo, S.A.; Turco, M.; Piro, P. New Mathematical Optimization Approaches for LID Systems. In Proceedings of the International Conference on Numerical Computations: Theory and Algorithms, Crotone, Italy, 15–21 June 2019. [Google Scholar] [CrossRef]
- Oberascher, M.; Zischg, J.; Palermo, S.A.; Kinzel, C.; Rauch, W.; Sitzenfrei, R. Smart Rain Barrels: Advanced LID Management Through Measurement and Control. In Proceedings of the International Conference on Urban Drainage Modelling, Palermo, Italy, 23–26 September 2018. [Google Scholar]
- AdiSrikanth; Kulkarni, N.J.; Naveen, K.V.; Singh, P.; Srivastava, P.R. Test case optimization using artificial bee colony algorithm. In Proceedings of the International Conference on Advances in Computing and Communications, Kochi Kerala, India, 22–24 July 2011. [Google Scholar]
- Cox, P.T.; Song, B. A formal model for component-based software. In Proceedings of the 2001 IEEE Symposium on Human-Centric Computing, Stresa, Italy, 5–7 September 2001. [Google Scholar]
- Zhu, G.; Kwong, S. Gbest-guided artificial bee colony algorithm for numerical function optimization. Appl. Math. Comput. 2010. [Google Scholar] [CrossRef]
- Li, J.; Pan, Q.; Xie, S. Flexible job shop scheduling problems by a hybrid artificial bee colony algorithm. In Proceedings of the 2011 IEEE Congress of Evolutionary Computation, CEC 2011, New Orleans, LA, USA, 5–8 June 2011. [Google Scholar]
- Windisch, A.; Wappler, S.; Wegener, J. Applying particle swarm optimization to software testing. In Proceedings of the GECCO 2007: Genetic and Evolutionary Computation Conference, London, UK, 7–11 July 2007. [Google Scholar]
- Ahmed, B.S.; Zamli, K.Z. A greedy particle swarm optimization strategy for T-way software testing. J. Artif. Intell. 2012. [Google Scholar] [CrossRef] [Green Version]
- Krause, J.; Cordeiro, J.; Parpinelli, R.S.; Lopes, H.S.A. A Survey of Swarm Algorithms Applied to Discrete Optimization Problems. In Swarm Intelligence and Bio-Inspired Computation; Elsevier: Amsterdam, The Netherlands, 2013. [Google Scholar]
- Durante, M.; Orecchia, R.; Loeffler, J.S. Charged-particle therapy in cancer: Clinical uses and future perspectives. Nat. Rev. Clin. Oncol. 2017, 14, 483–495. [Google Scholar] [CrossRef]
- Gu, W.; O’Connor, D.; Nguyen, D.; Yu, V.Y.; Ruan, D.; Dong, L.; Sheng, K. Integrated beam orientation and scanning-spot optimization in intensity-modulated proton therapy for brain and unilateral head and neck tumors. Med. Phys. 2018. [Google Scholar] [CrossRef]
- Emma, A.; Maurizio, A.; Alessio, L.; Francesca, M.; Filippo, M.; Pietro, P.; Giuseppe, P.; Fabrizio, R.; Giorgio, R.; Marco, S.; et al. Combinatorial optimisation in radiotherapy treatment planning. AIMS Med. Sci. 2018, 5, 2014–2223. [Google Scholar]
- Owen, H.; Lomax, A.; Jolly, S. Current and future accelerator technologies for charged particle therapy. Nucl. Instrum. Methods Phys. Res. Sect. A Accel. Spectrometers Detect. Assoc. Equip. 2016. [Google Scholar] [CrossRef] [Green Version]
- Robini, M.C.; Yang, F.; Zhu, Y. A stochastic approach to full inverse treatment planning for charged-particle therapy. J. Glob. Optim. 2020. [Google Scholar] [CrossRef]
- Palermo, S.A.; Turco, M.; Principato, F.; Piro, P. Hydrological effectiveness of an extensive green roof in Mediterranean climate. Water 2019, 11, 1378. [Google Scholar] [CrossRef] [Green Version]
- Myers, J.L.; Well, A.D. Research Design and Statistical Analysis; Routledge: London, UK, 2010. [Google Scholar]
- Gupta, P.; Sinha, N.K. Neural Networks for Identification of Nonlinear Systems: An Overview. In Soft Computing and Intelligent Systems; Academic Press: San Diego, CA, USA, 2000; Available online: https://0-doi-org.brum.beds.ac.uk/10.1016/B978-012646490-0/50017-2 (accessed on 21 September 2020).
- Arulampalam, G.; Bouzerdoum, A. A generalized feedforward neural network architecture for classification and regression. Neural Netw. 2003, 16, 561–568. [Google Scholar] [CrossRef]
- Bouzerdoum, A.; Mueller, R. A generalized feedforward neural network architecture and its training using two stochastic search methods. Lect. Notes Comput. Sci. 2003. [Google Scholar] [CrossRef]
- Meyer-Baese, A.; Schmid, V. Foundations of Neural Networks. In Pattern Recognition and Signal Analysis in Medical Imaging; Elsevier: Amsterdam, The Netherlands, 2014. [Google Scholar]
- Patterson, J.; Gibson, A. Deep Learning: A Practionar Approach; O’Reilly Media, Inc.: Sevastopol, CA, USA, 2017. [Google Scholar]
- Prin, M.; Wunsch, H. International comparisons of intensive care: Informing outcomes and improving standards. Curr. Opin. Crit. Care 2012, 18, 700–706. [Google Scholar] [CrossRef] [Green Version]
- Rhodes, A.; Moreno, R. Intensive care provision: A global problem. Rev. Bras. Ter. Intensiva 2012, 24, 322–325. [Google Scholar] [CrossRef] [Green Version]
- Perugini, E. La Situazione dei Posti di Terapia Intensiva in Italia. Available online: https://www.agi.it/cronaca/news/2020-03-14/coronavirus-posti-terapia-intensiva-7530891/ (accessed on 14 May 2020).
- The Countries Critical with the Most Critical Care Beds per Capital. Available online: https://specials-images.forbesimg.com/imageserve/5e6a0fadaa5428000759a47e/960x0.jpg?fit=scale (accessed on 14 May 2020).


| Region/Country | Capital | Population | Available Dataset |
|---|---|---|---|
| Lombardy | Milan | 10,040,000 | 1 March to 30 April |
| Veneto | Venice | 4,906,000 | 1 March to 30 April |
| Piedmont | Turin | 4,356,000 | 6 March to 30 April |
| Emilia–Romagna | Bologna | 4,459,000 | 6 March to 30 April |
| Campania | Naples | 5,827,000 | 7 March to 30 April |
| Sicily | Palermo | 5,000,000 | 8 March to 30 April |
| Italy | Rome | 60,317,116 | 1 March to 30 April |
| Case Study | Variables | Date | Average | Rate of Change | t-Test | Result | |
|---|---|---|---|---|---|---|---|
| t Value | p-Value | ||||||
| All Italy | Test No. | 1 March–31 March | 15,752 | 3.12 | −11.129 | 0.000 | Significant difference |
| 1 April–30 April | 49,075 | ||||||
| Home isolation | 1 March–31 March | 15,768 | 4.57 | −16.513 | 0.000 | ||
| 1 April–30 April | 72,053 | ||||||
| Mild hosp. | 1 March–31 March | 12,763 | 2.00 | −6.858 | 0.000 | ||
| 1 April–30 April | 25,566 | ||||||
| Int care hosp. | 1 March–31 March | 1986 | 1.49 | −3.457 | 0.000 | ||
| 1 April–30 April | 2975 | ||||||
| Daily Deaths | 1 March–31 March | 400 | 1.29 | −1.901 | 0.062 | No significant difference | |
| 1 April–30 April | 518 | ||||||
| Daily new cases | 1 March–31 March | 3376 | 0.98 | 0.131 | 0.896 | ||
| 1 April–30 April | 3322 | ||||||
| Country | Period | Dependent Variable | ANOVA p-Value | Beta | Existence of a Correlation | Significance |
|---|---|---|---|---|---|---|
| All Italy | 1 March–31 March | Home isolation | 0.000 | 0.896 | ✓ | Positive |
| Mild hosp. | 0.000 | 0.928 | ✓ | |||
| Int. care hosp. | 0.000 | 0.931 | ✓ | |||
| Daily Deaths | 0.000 | 0.946 | ✓ | |||
| Daily new cases | 0.000 | 0.921 | ✓ | |||
| 1 April–30 April | Home isolation | 0.000 | 0.616 | ✓ | ||
| Mild hosp. | 0.001 | −0.591 | ✓ | Negative | ||
| Int. care hosp. | 0.000 | −0.636 | ✓ | |||
| Daily Deaths | 0.004 | −0.509 | ✓ | |||
| Daily new cases | 0.115 | −0.294 | × | - * |
| Region | Variable | Period | Average | Rate of Change | t-Test | Result | |
|---|---|---|---|---|---|---|---|
| t Value | p-Value | ||||||
| Lombardy | Test No. | 1 March–31 March | 3525 | 2.48 | −8.185 | 0.000 | Significant difference |
| 1 April–30 April | 8743 | ||||||
| Home isolation | 1 March–31 March | 5006 | 4.06 | −12.635 | 0.000 | ||
| 1 April–30 April | 20,335 | ||||||
| Mild hosp. | 1 March–31 March | 6087 | 1.72 | −5.622 | 0.000 | ||
| 1 April–30 April | 10,483 | ||||||
| Int care hosp. | 1 March–31 March | 791 | 1.30 | −2.625 | 0.011 | ||
| 1 April–30 April | 1025 | ||||||
| Daily Deaths | 1 March–31 March | 231 | 0.94 | 0.351 | 0.727 | No significant difference | |
| 1 April–30 April | 219 | ||||||
| Daily new cases | 1 March–31 March | 1374 | 0.79 | 1.964 | 0.057 | ||
| 1 April–30 April | 1084 | ||||||
| Veneto | Test No. | 1 March–30 March | 3043 | 2.64 | −9.106 | 0.000 | Significant difference |
| 31 March–30 April | 8041 | ||||||
| Home isolation | 1 March–30 March | 2041 | 3.97 | −16.452 | 0.000 | ||
| 31 March–30 April | 8102 | ||||||
| Mild hosp. | 1 March–30 March | 664 | 2.09 | −6.520 | 0.000 | ||
| 31 March–30 April | 1386 | ||||||
| Int care hosp. | 1 March–30 March | 164 | 1.37 | −2.259 | 0.027 | ||
| 31 March–30 April | 225 | ||||||
| Daily Deaths | 1 March–30 March | 14 | 2.46 | 6.621 | 0.000 | ||
| 31 March–30 April | 34 | ||||||
| Daily new cases | 1 March–30 March | 285 | 1.05 | −0.316 | 0.752 | No significant difference | |
| 31 March–30 April | 298 | ||||||
| Piedmont | Test No. | 6 March–6 April | 1268 | 3.69 | −10.519 | 0.000 | Significant difference |
| 7 April–30 April | 4684 | ||||||
| Home isolation | 6 March–6 April | 2146 | 4.84 | −14.730 | 0.000 | ||
| 7 April–30 April | 10,378 | ||||||
| Mild hosp. | 6 March–6 April | 1894 | 1.68 | −5.729 | 0.000 | ||
| 7 April–30 April | 3180 | ||||||
| Int care hosp. | 6 March–6 April | 282 | 1.10 | −0.961 | 0.381 | No significant difference | |
| 7 April–30 April | 312 | ||||||
| Daily Deaths | 6 March–6 April | 39 | 1.94 | −6.111 | 0.000 | Significant difference | |
| 7 April–30 April | 76 | ||||||
| Daily new cases | 6 March–6 April | 400 | 0.79 | 2.852 | 0.005 | ||
| 7 April–30 April | 561 | ||||||
| Region | Date | Dependent Variable | ANOVA p-Value | Beta | Existence of a Correlation | Sign |
|---|---|---|---|---|---|---|
| Lombardy | 1 March–31 March | Home isolation | 0.000 | 0.683 | ✓ | Positive |
| Mild hosp. | 0.000 | 0.665 | ✓ | |||
| Int. care hosp. | 0.000 | 0.690 | ✓ | |||
| Daily Deaths | 0.000 | 0.782 | ✓ | |||
| Daily new cases | 0.000 | 0.856 | ✓ | |||
| 1 April–30 April | Home isolation | 0.004 | 0.515 | ✓ | ||
| Mild hosp. | 0.004 | −0.506 | ✓ | Negative | ||
| Int. care hosp. | 0.002 | −0.552 | ✓ | |||
| Daily Deaths | 0.005 | −0.497 | ✓ | |||
| Daily new cases | 0.693 | −0.075 | × | - * | ||
| Veneto | 1 March–30 March | Home isolation | 0.000 | 0.772 | ✓ | Positive |
| Mild hosp. | 0.000 | 0.782 | ✓ | |||
| Int. care hosp. | 0.000 | 0.795 | ✓ | |||
| Daily Deaths | 0.000 | 0.715 | ✓ | |||
| Daily new cases | 0.000 | 0.758 | ✓ | |||
| 31 March–30 April | Home isolation | 0.227 | 0.223 | × | - * | |
| Mild hosp. | 0.036 | −0.379 | ✓ | Negative | ||
| Int. care hosp. | 0.032 | −0.386 | ✓ | |||
| Daily Deaths | 0.604 | −0.097 | × | - * | ||
| Daily new cases | 0.864 | −0.032 | × | - * | ||
| Piedmont | 6 March–6 April | Home isolation | 0.000 | 0.835 | ✓ | Positive |
| Mild hosp. | 0.000 | 0.882 | ✓ | |||
| Int. care hosp. | 0.000 | 0.863 | ✓ | |||
| Daily Deaths | 0.000 | 0.825 | ✓ | |||
| Daily new cases | 0.000 | 0.857 | ✓ | |||
| 7 April–30 April | Home isolation | 0.002 | 0.607 | ✓ | ||
| Mild hosp. | 0.005 | −0.549 | ✓ | Negative | ||
| Int. care hosp. | 0.005 | −0.558 | ✓ | |||
| Daily Deaths | 0.745 | −0.330 | × | - * | ||
| Daily new cases | 0.250 | −0.244 | × | -* |
| Region | Variable | Period | Average | Rate of Change | t-Test | Result | |
|---|---|---|---|---|---|---|---|
| t Value | p-Value | ||||||
| Emilia Romagna | Test No. | 6 March–9 April | 2208 | 2.18 | −7.130 | 0.000 | Significant difference |
| 10 April–30 April | 4816 | ||||||
| Home isolation | 6 March–9 April | 4068 | 2.36 | −10.234 | 0.000 | ||
| 10 April–30 April | 9591 | ||||||
| Mild hosp. | 6 March–9 April | 2344 | 1.30 | −2.917 | 0.005 | ||
| 10 April–30 April | 3053 | ||||||
| Int care hosp. | 6 March–9 April | 241 | 1.19 | −2.115 | 0.039 | ||
| 10 April–30 April | 285 | ||||||
| Daily Deaths | 6 March–9 April | 62 | 0.95 | 0.516 | 0.608 | No significant difference | |
| 10 April–30 April | 59 | ||||||
| Daily new cases | 6 March–9 April | 244 | 0.36 | 3.870 | 0.000 | Significant difference | |
| 10 April–30 April | 87 | ||||||
| Campania | Test No. | 7 March–1 April | 587 | 3.55 | −10.566 | 0.000 | |
| 2 April–30 April | 2082 | ||||||
| Home isolation | 7 March–1 April | 465 | 4.79 | −20.819 | 0.000 | ||
| 2 April–30 April | 2229 | ||||||
| Mild hosp. | 7 March–1 April | 224 | 2.53 | −9.734 | 0.005 | ||
| 2 April–30 April | 568 | ||||||
| Int care hosp. | 7 March–1 April | 67 | 1.10 | −0.587 | 0.561 | No significant difference | |
| 2 April–30 April | 74 | ||||||
| Daily Deaths | 7 March–1 April | 6 | 1.27 | −1.070 | 0.290 | ||
| 2 April–30 April | 7 | ||||||
| Daily new cases | 7 March–1 April | 84 | 0.79 | 0.295 | 0.769 | ||
| 2 April–30 April | 79 | ||||||
| Sicily | Test No. | 8 March–4 April | 670 | 3.43 | −7.990 | 0.000 | Significant difference |
| 5 April–30 April | 2299 | ||||||
| Home isolation | 8 March–4 April | 428 | 3.59 | −13.552 | 0.000 | ||
| 5 April–30 April | 1534 | ||||||
| Mild hosp. | 8 March–4 April | 240 | 2.13 | −7.101 | 0.000 | ||
| 5 April–30 April | 511 | ||||||
| Int care hosp. | 8 March–4 April | 44 | 1.08 | −0.600 | 0.552 | No significant difference | |
| 5 April–30 April | 47 | ||||||
| Daily Deaths | 8 March–4 April | 4 | 1.20 | −0.826 | 0.413 | ||
| 5 April–30 April | 5 | ||||||
| Daily new cases | 8 March–4 April | 68 | 0.69 | 2.268 | 0.030 | Significant difference | |
| 5 April–30 April | 47 | ||||||
| Region | Period | Dependent Variable | ANOVA p-Value | Beta | Existence of a Correlation | Significance |
|---|---|---|---|---|---|---|
| Emilia Romagna | 6 March–9 April | Home isolation | 0.000 | 0.576 | ✓ | positive |
| Mild hosp | 0.000 | 0.659 | ✓ | |||
| Int. care hosp | 0.000 | 0.658 | ✓ | |||
| Daily Deaths | 0.000 | 0.646 | ✓ | |||
| Daily new cases | 0.000 | 0.717 | ✓ | |||
| 10 April–30 April | Home isolation | 0.141 | −0.332 | × | - * | |
| Mild hosp | 0.075 | −0.397 | × | - * | ||
| Int. care hosp | 0.097 | −0.372 | × | - * | ||
| Daily Deaths | 0.282 | −0.246 | × | - * | ||
| Daily new cases | 0.975 | −0.007 | × | - * | ||
| Campania | 7 March–1 April | Home isolation | 0.000 | 0.876 | ✓ | positive |
| Mild hosp | 0.000 | 0.933 | ✓ | |||
| Int. care hosp | 0.000 | 0.792 | ✓ | |||
| Daily Deaths | 0.000 | 0.751 | ✓ | |||
| Daily new cases | 0.000 | 0.859 | ✓ | |||
| 2 April–30 April | Home isolation | 0.172 | 0.261 | × | - * | |
| Mild hosp | 0.014 | −0.453 | ✓ | negative | ||
| Int. care hosp | 0.002 | −0.543 | ✓ | |||
| Daily Deaths | 0.002 | −0.556 | ✓ | |||
| Daily new cases | 0.014 | −0.453 | ✓ | |||
| Sicily | 8 March–4 April | Home isolation | 0.000 | 0.780 | ✓ | positive |
| Mild hosp | 0.000 | 0.810 | ✓ | |||
| Int. care hosp | 0.000 | 0.842 | × | - * | ||
| Daily Deaths | 0.000 | 0.883 | ✓ | positive | ||
| Daily new cases | 0.000 | 0.734 | ✓ | |||
| 5 April–30 April | Home isolation | 0.012 | 0.485 | ✓ | ||
| Mild hosp | 0.071 | −0.360 | × | - * | ||
| Int. care hosp | 0.036 | −0.413 | ✓ | negative | ||
| Daily Deaths | 0.714 | −0.076 | × | - * | ||
| Daily new cases | 0.744 | 0.067 | × | - * |
| Control Parameters | Values |
|---|---|
| Number of hidden layers | 5 |
| Maximum number of iterations | 100 |
| Number of training data | 43 (70%) |
| Number of cross-validation data | 9 (15%) |
| Number of testing data | 9 (15%) |
| Input processing elements (PEs) | 3 |
| Output processing elements (PEs) | 1 |
| Factors | Training Value | Validation Value | Test Value |
|---|---|---|---|
| MSE (mean squared error) | 25,910.652 | 29,293.519 | 17,537.786 |
| R2 | 0.982 | 0.988 | 0.990 |
| Min Abs Error | 6.400 | 82.626 | 4.350 |
| Max Abs Error | 320.300 | 289.164 | 227.142 |
| Countries | Critical Care Units |
|---|---|
| United States | 34.7 |
| Germany | 29.2 |
| Italy | 12.5 |
| France | 11.6 |
| South Korea | 10.6 |
| Spain | 9.7 |
| Japan | 7.3 |
| United Kingdom | 6.6 |
| China | 3.6 |
| India | 2.3 |
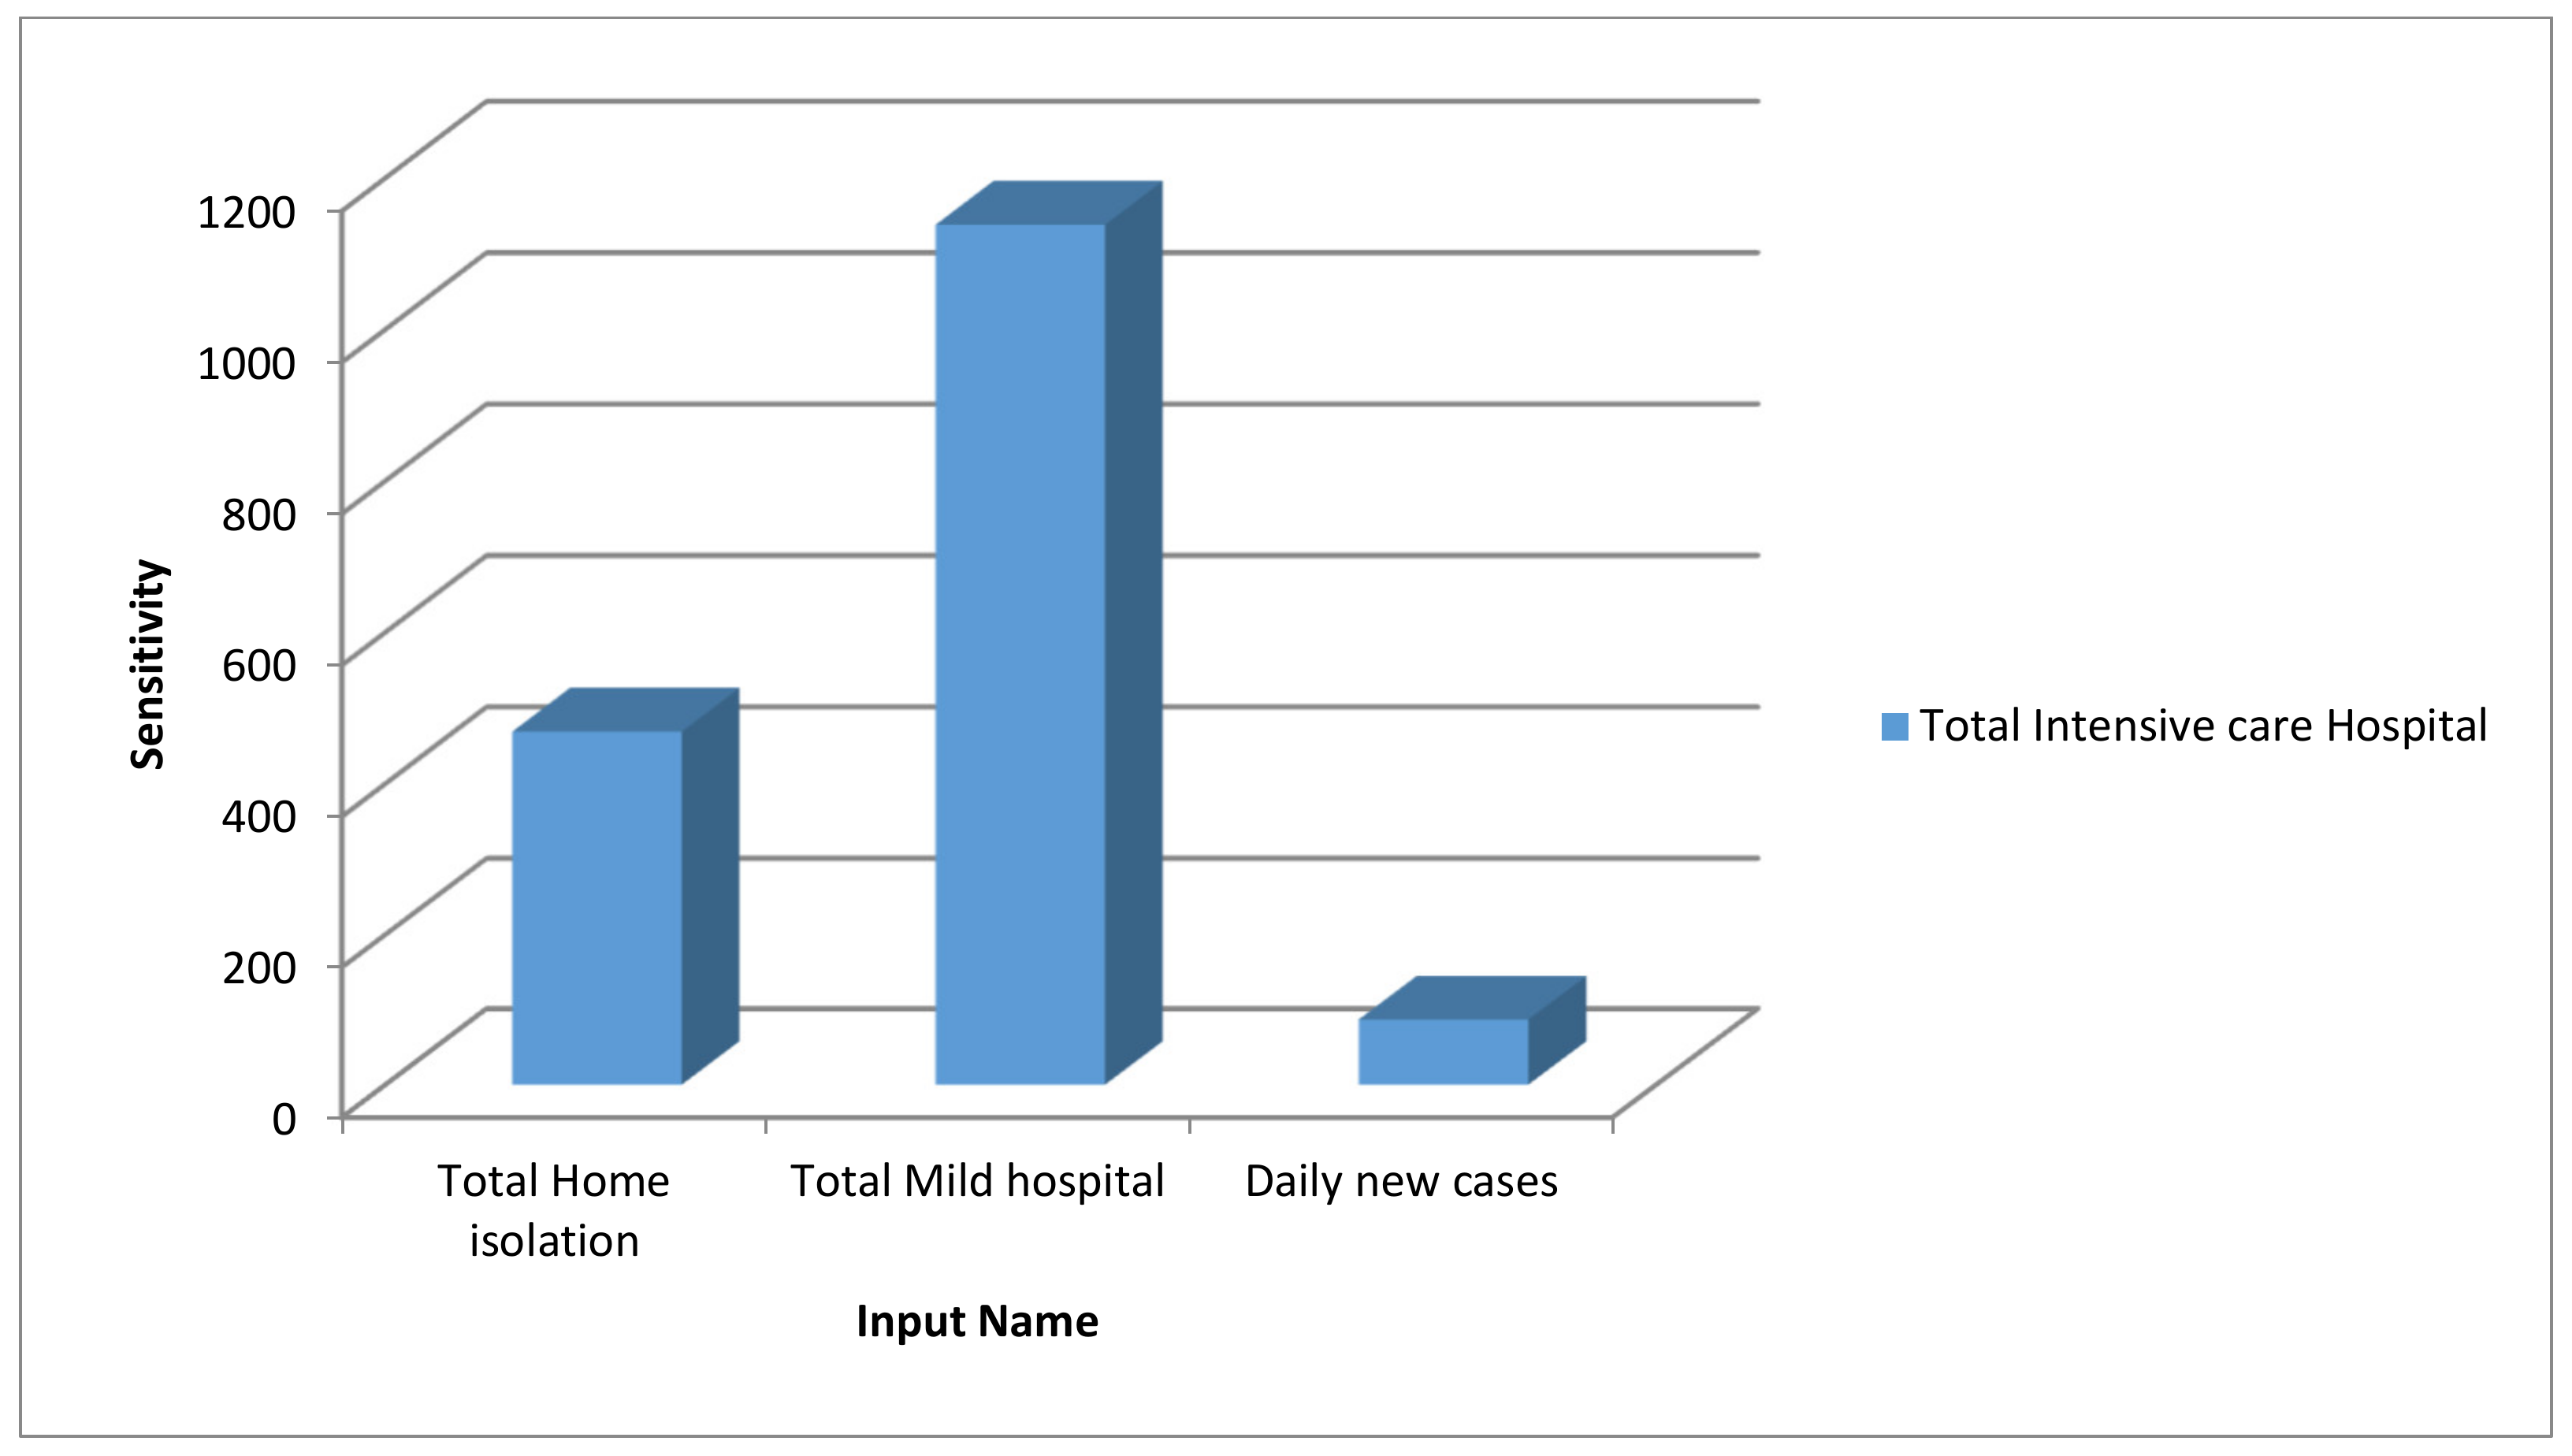
| Variables | p-Value | Beta | Coefficients |
|---|---|---|---|
| Constant | 0.011 | - | 77.751 |
| Total home isolation (x1) | 0.000 | −0.514 | −0.020 |
| Total mild hospital (x2) | 0.000 | 1.311 | 0.164 |
| Daily new cases (x3) | 0.009 | 0.050 | 0.38 |
© 2020 by the authors. Licensee MDPI, Basel, Switzerland. This article is an open access article distributed under the terms and conditions of the Creative Commons Attribution (CC BY) license (http://creativecommons.org/licenses/by/4.0/).
Share and Cite
Pirouz, B.; Nejad, H.J.; Violini, G.; Pirouz, B. The Role of Artificial Intelligence, MLR and Statistical Analysis in Investigations about the Correlation of Swab Tests and Stress on Health Care Systems by COVID-19. Information 2020, 11, 454. https://0-doi-org.brum.beds.ac.uk/10.3390/info11090454
Pirouz B, Nejad HJ, Violini G, Pirouz B. The Role of Artificial Intelligence, MLR and Statistical Analysis in Investigations about the Correlation of Swab Tests and Stress on Health Care Systems by COVID-19. Information. 2020; 11(9):454. https://0-doi-org.brum.beds.ac.uk/10.3390/info11090454
Chicago/Turabian StylePirouz, Behzad, Hana Javadi Nejad, Galileo Violini, and Behrouz Pirouz. 2020. "The Role of Artificial Intelligence, MLR and Statistical Analysis in Investigations about the Correlation of Swab Tests and Stress on Health Care Systems by COVID-19" Information 11, no. 9: 454. https://0-doi-org.brum.beds.ac.uk/10.3390/info11090454