Distributed Simulation with Multi-Agents for IoT in a Retail Pharmacy Facility


Department of Industrial Engineering, College of Engineering, King Abdulaziz University, Jeddah 21589, Saudi Arabia
Information 2020, 11(11), 527; https://0-doi-org.brum.beds.ac.uk/10.3390/info11110527
Submission received: 22 August 2020
/
Revised: 8 November 2020
/
Accepted: 9 November 2020
/
Published: 13 November 2020
(This article belongs to the Special Issue Distributed Simulation 2020)
Abstract
:Nowadays, internet of things (IoT) technology is considered as one of the key future technologies. The adoption of such technology is receiving quick attention from many industries as competitive pressures inspire them to move forward and invest. As technologies continue to advance, such as IoT, there is a vital need for an approach to identify its viability. This research proposes the adoption of IoT technology and the use of a simulation paradigm to capture the complexity of a system, offer reliable and continuous perceptions into its present and likely future state, and evaluate the economic feasibility of such adoption. A case study of one of the largest pharmacy retail chain is presented. IoT devices are suggested to be used to remotely monitor the failures of a geographically distributed system of refrigeration units. Multi-agents distributed system is proposed to simulate the operational behavior of the refrigerators and calculate the return of investment (ROI) of the proposed IoT implementation.
1. Introduction
Kevin Ashton first proposed the concept of internet of things (IoT) technology in 1999 [1]. According to [2], IoT is a worldwide network of physical objects that can communicate without human intervention. IoT is a structure that contains sensors that can send data to a cloud-based system through communication technology. The data on the cloud system is analyzed and processed using advanced real-time analytics software, which helps in fast and precise decision-making without a human involved. The utilization of the internet of things (IoT) technology is expected to increase significantly in the coming years [1]. The adoption of such technology is receiving quick attention from many various industries as competitive pressures inspire them to move forward and invest [3]. However, enterprises need to evaluate the opportunities and the challenges of this technology carefully because of the ambiguity and the high investment costs of IoT projects. Determining the return on investment (ROI) of IoT projects will be one of their main concerns.
IoT technology can bring a variety of benefits to businesses include improving operational efficiency, enhancing customers’ experience, increased productivity, and reducing waste [4]. For example, IoT will change the processes of the supply chain entirely by providing accurate and real-time investigation of the material and product flow. Companies will invest in adopting IoT technology to improve materials tracking and optimize the distribution cost. According to [2], the internet of things (IoT) technology will gain $14.4 trillion by 2022. Four primary industries will make more than half of the $14.4 trillion. These four industries are manufacturing industry (27%), retail trade industry (11%), finance and insurance industry (9%), and information services industry (9%) [2]. Many countries, such as China and the United Kingdom (UK), started to invest in the internet of things (IoT) technology after understanding its potential benefits. For example, China and the UK government invested $800 million and £5 million, respectively to improve IoT technology [1]. The applications of IoT enable enterprises to improve their operational process and sophisticated production. The applications covered many industries, including information sharing [5], decision alignment [6], production planning and optimization [7], supply chain management [8,9], and cloud-based predictive maintenance [10]. The predictive maintenance, our focus in this research, enables continuous monitoring and reporting to predict necessary maintenance arrangement before a problem exist [11]. It can forecast the expected failure time of a machine and program its maintenance schedule. This will help enterprises to reduce maintenance cost and increase machine productivity.
Modeling and simulation for the internet of things (IoT) environments have become a powerful tool to analyze big data obtained from IoT objects [12,13]. Simulation techniques can overcome big data challenges and predict the behaviors of a complex system [14]. The massive amount of data generated by IoT devices has brought many opportunities to the simulation field. According to [15], IoT big data has brought the following opportunities: It inspires modeling scientists to improve the existing techniques of simulation. In addition, IoT big data opens new scientific and modeling areas of research, such as intelligent simulation tools. In this research, a multi-agent distributed simulation is used to test the economic feasibility of an IoT project.
Currently, there is no standard approach for demonstrating real-world IoT-based scenarios. However, agent-based simulation model (ABSM) can be considered as one of the effective tools to support IoT implementation and solve complicated problems associated with adopting such technology. This research focuses on examining the IoT predictive maintenance project by calculating its ROI using multi-agent distributed simulation. The rest of the research paper is organized as follows. Section 2 provides an overview of the simulation paradigm, primarily multi-agent distributed simulation in the IoT environment. Section 3 presents a case study of one of the largest pharmacy retail chain in Saudi Arabia to determine the usefulness of using multi-agent distributed simulation to evaluate IoT project. Finally, the research concludes in Section 4.
2. Simulation Paradigm in the IoT Environment
Agent-based simulation model (ABSM) is recognized as a powerful tool to overcome IoT challenges [16]. It represents an appropriate and solid simulation paradigm to effectively tackle these challenges and support the growth of the IoT environment [17]. Fortino, Guerrieri [18] proposed the integration of ABSM and cloud architecture in an IoT setting. ABSM was used to support the development of distributed multi-agent systems while the cloud architecture helped to improve the IoT devices with powerful computing abilities and massive resources storage. Bernstein, Verghese [19] proposed a novel ABSM that allows the simulation of IoT with the main elements of an IoT setting. Their approach was to present events in IoT as stochastic. The simulation results showed that ABSM can be a practical solution for IoT systems validation, matching the real-world results. Dugdale, Moghaddam [20] used agents’ architecture of ABSM to model the reasoning of an individual agent while evacuating a building. Their work was applied to a real construction with IoT sensors installed. Batool and Niazi [21] presented a new approach to demonstrate the IoT settings. The proposed approach used the cognitive ABSM framework to mimic complicated IoT systems. They demonstrated the development of numerous standard complicated network topologies such as random and scale-free networks. A case study was presented to show the effectiveness of using ABSM to model the networked IoT devices.
ABSM distributed simulation is considered as a key paradigm for in-depth analysis of IoT big data [22,23]. With a data-intensive era, there is an essential need to support a multi-agent system which can access streaming and historical data [24,25]. Traditional distributed simulation techniques are not appropriate for multi-agent system simulations [22]. A new simulation approach is essential to meet the scalability and performance requirements of big data analytics. ABSM model allows simulation elements to be distributed for the best use of the available resources. [26,27,28]. Such a technique facilitates agent interaction and integration. However, agent-based modeling presents some challenges that other types of simulations, such as discrete-event simulation (DES), do not address them [29,30]. DES is a process-oriented approach based on a logical process modeling. Even though modeling an agent behavior is quite simple, it is difficult to be developed by DES. Table 1 compares agent-based modeling with DES models and summarizes the important attributes to differentiate between the two models.
ABSM has been used to model a wide range of applications in various industries such as manufacturing, retail, telecom, and traffic management [32]. For example, ABSM was used to model the interaction of cellular chemicals [33] and to model the behaviors of car parking [34]. Several applications of ABSM have focused on social and economic aspects such as the behaviors of the customers. Twomey and Cadman [35] built an agent-based simulation model to imitate the customer behavior in a media market. In addition, Douglas, Lee [36] used ABSM to examine the wireless cellular market. The literature shows that there are a few ABSM applications to model the network itself. Tonmukayakul and Weiss [37] developed ABSM to model sharing techniques in 5G networks. In addition, in [38] the authors investigate the frequency-sharing mechanism by considering the heterogeneous nodes as agents of the ABSM framework. ABSM helped them to understand market models better than the traditional analytical solution.
COVID-19 has been spreading globally in the last six months resulting in massive financial and health losses. Many countries placed their towns into a total lockdown causing a huge financial crisis. Others decided to control the financial loss at the cost of citizens’ wellbeing. Consequently, ABSM models were used to assess the effect of the interchange between people’s health and the financial state [39]. In addition to that, ABSM models were used to estimate the spread risk of the virus in numerous accommodations. Such information is significantly important in the decision-making process to know whether to apply the lockdown partially or completely [40].
Lastly, a small number of the previous studies are presented in the literature focusing on using ABSM to model complex IoT environments. Due to the high degree of flexibility provided by ABSM, the easiness of adopting new constraints, and the acceptance of the integration with the data science technique, the author of this paper believes that ABSM is a perfect match to model and evaluate the problem addressed in this paper.
3. Case Study
3.1. Description of Manufacturing Environment
One of the largest pharmacy retail chain in Saudi Arabia has been chosen in this research to determine the practicality of using multi-agent distributed simulation in evaluating the viability of IoT project. The facility manages a national network in 125 cities across the country, which makes it one of the fastest-growing facilities in the region. The facility has more than 4000 refrigerators in 1331 different store locations. Currently, the management experiences an annual cost of approximately $4 million due to unexpected refrigerator failure and its associated cost. The main reason behind this unexpected cost is the absence of having an effective checking system to monitor failures continually. One of the suggested solutions is to develop a condition-monitoring system by installing IoT sensors to its refrigerators.
The objective of this case study is to evaluate the financial feasibility by determining the ROI of the IoT solutions, which will be applied in 12 store locations as phase one of the project. A hybrid system containing a multi-agent and DES was developed to capture the system complexity. The agent-based simulation model (ABSM) helps to model this environment due to the high degree of flexibility provided by ABSM. In this research, the methodology proposed by Houston, Gooberman-Hill [41] was used. Their work aimed to examine the integration between agent-based modeling and data science techniques as a sophisticated process for responding to applied business questions. A detailed case study was presented to evaluate the ROI of installing sensors on elevators in an underground station in London. An agent simulation was built using the analysis from the old data. The model outputs determine when a positive ROI can be attained and identify the features obtained as an output of stochasticity in the agent model.
3.2. Agents in the Simulation Model
3.2.1. Analysis of Data
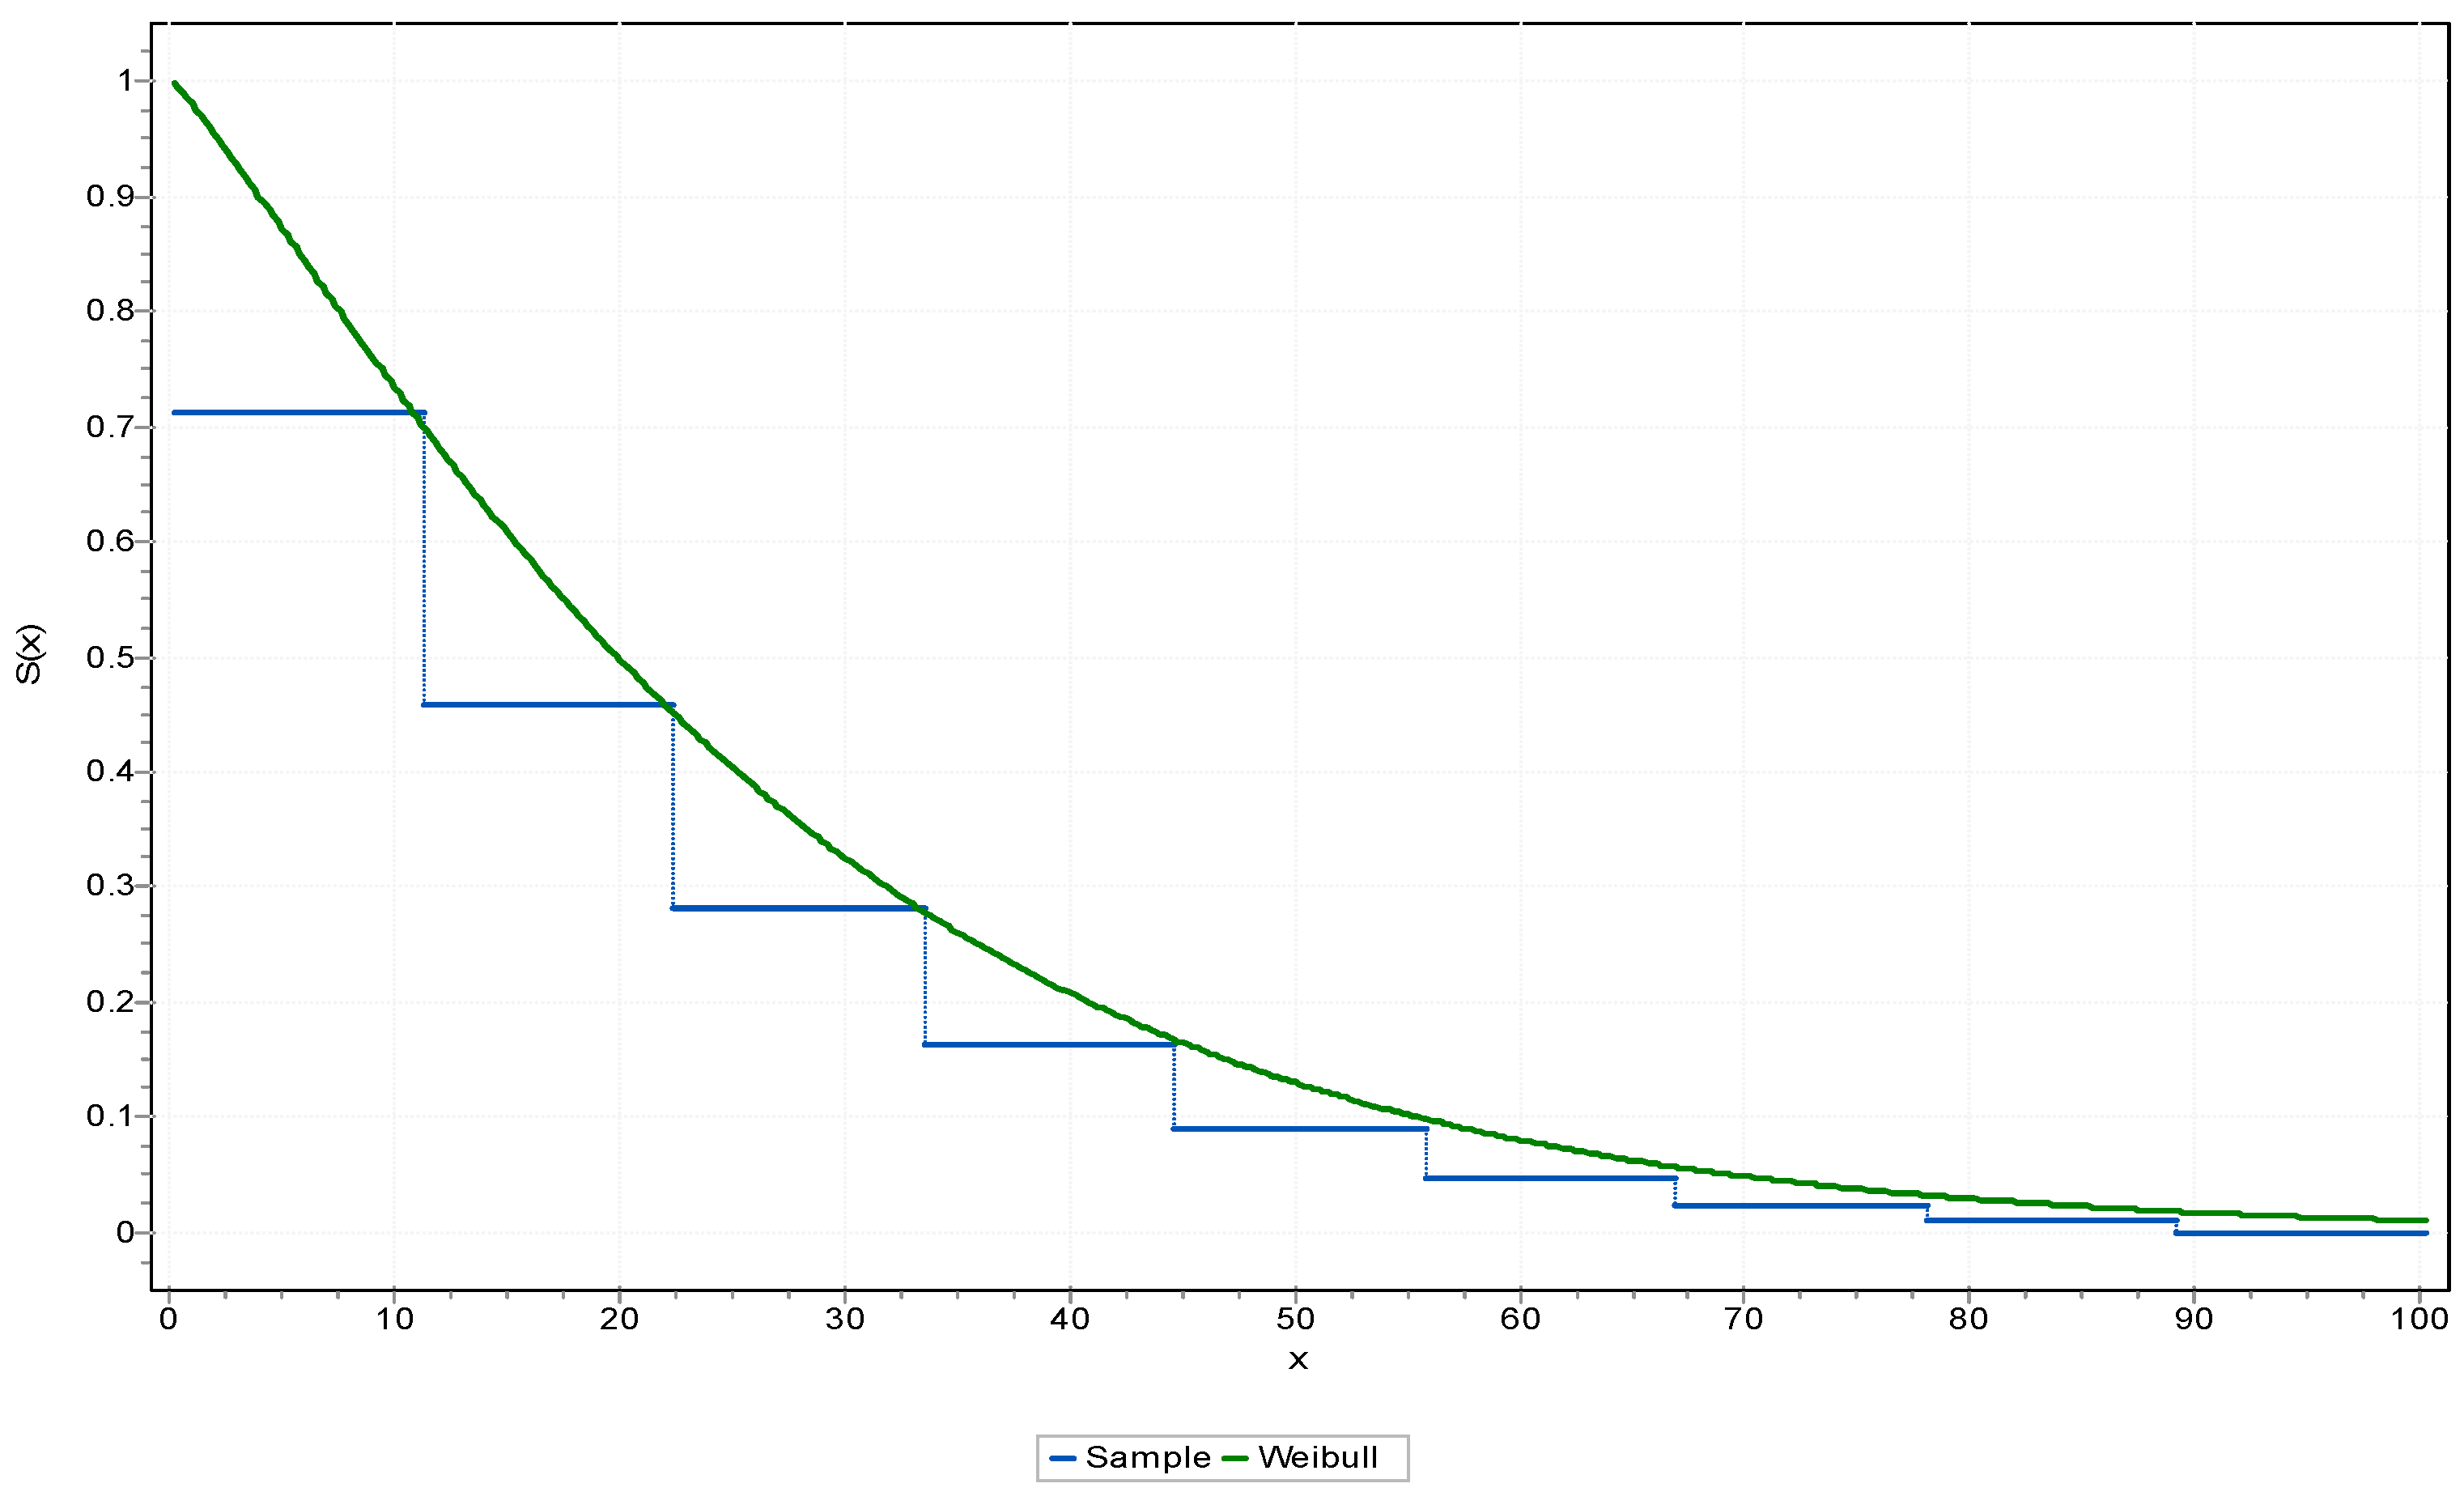
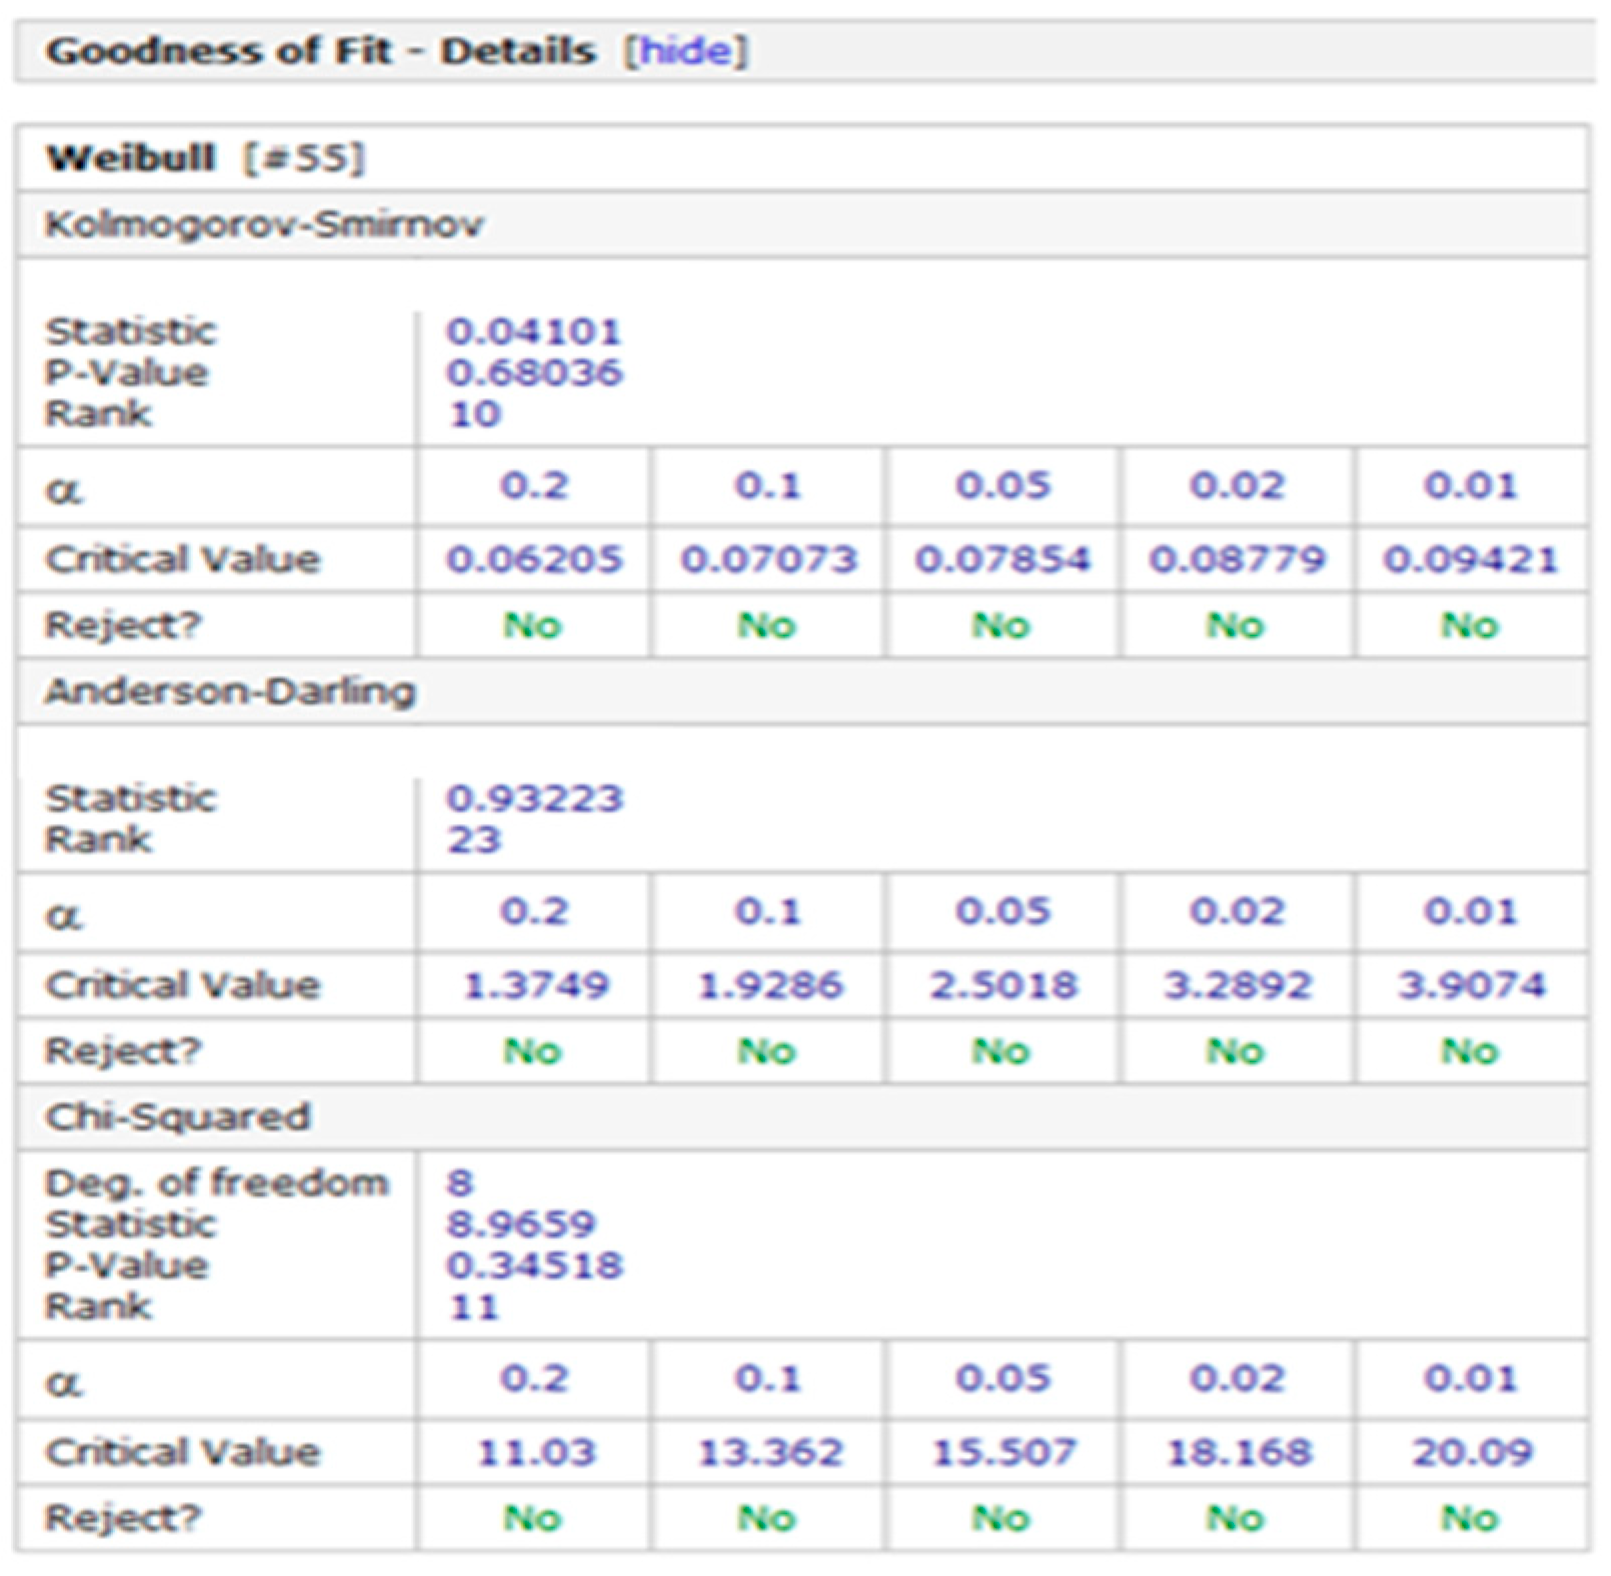
The historical failure rate data of the refrigerators were obtained and analyzed using statistical software. A distribution fitting technique was applied in this study to find the best fitting distribution. This technique helps to select the proper probability distribution that best defines the reliability of a component based on the available historical data. Yet, the use of the distribution fitting technique is attached to complicated calculations which require deep knowledge in the field of statistics and programming skills. This concern of choosing the best fitting distribution can be simply resolved by using a specialized distribution fitting software such as EasyFit. EasyFit software was used in this research to automate the entire distribution fitting process. It helped to make all the required calculations. Figure 1 displays the reliability function graph for the refrigerator failure rate which was obtained using EasyFit. The failure rate follows Weibull distribution with alpha = 5.7 and beta = 0.044. The goodness of fit tests (Chi-squared, Kolmogorov–Smirnov, and Anderson–Darling) to compare the fitted distributions were investigated (Figure 2). This specific type of distribution was selected based on the least square error obtained from the statistical software.
Table 2 lists the simulation input parameter, including the coordinate (geographical) data for 12 store locations and the main manufacturing facility.
3.2.2. Unified Modeling Language (UML) of ABSM Model
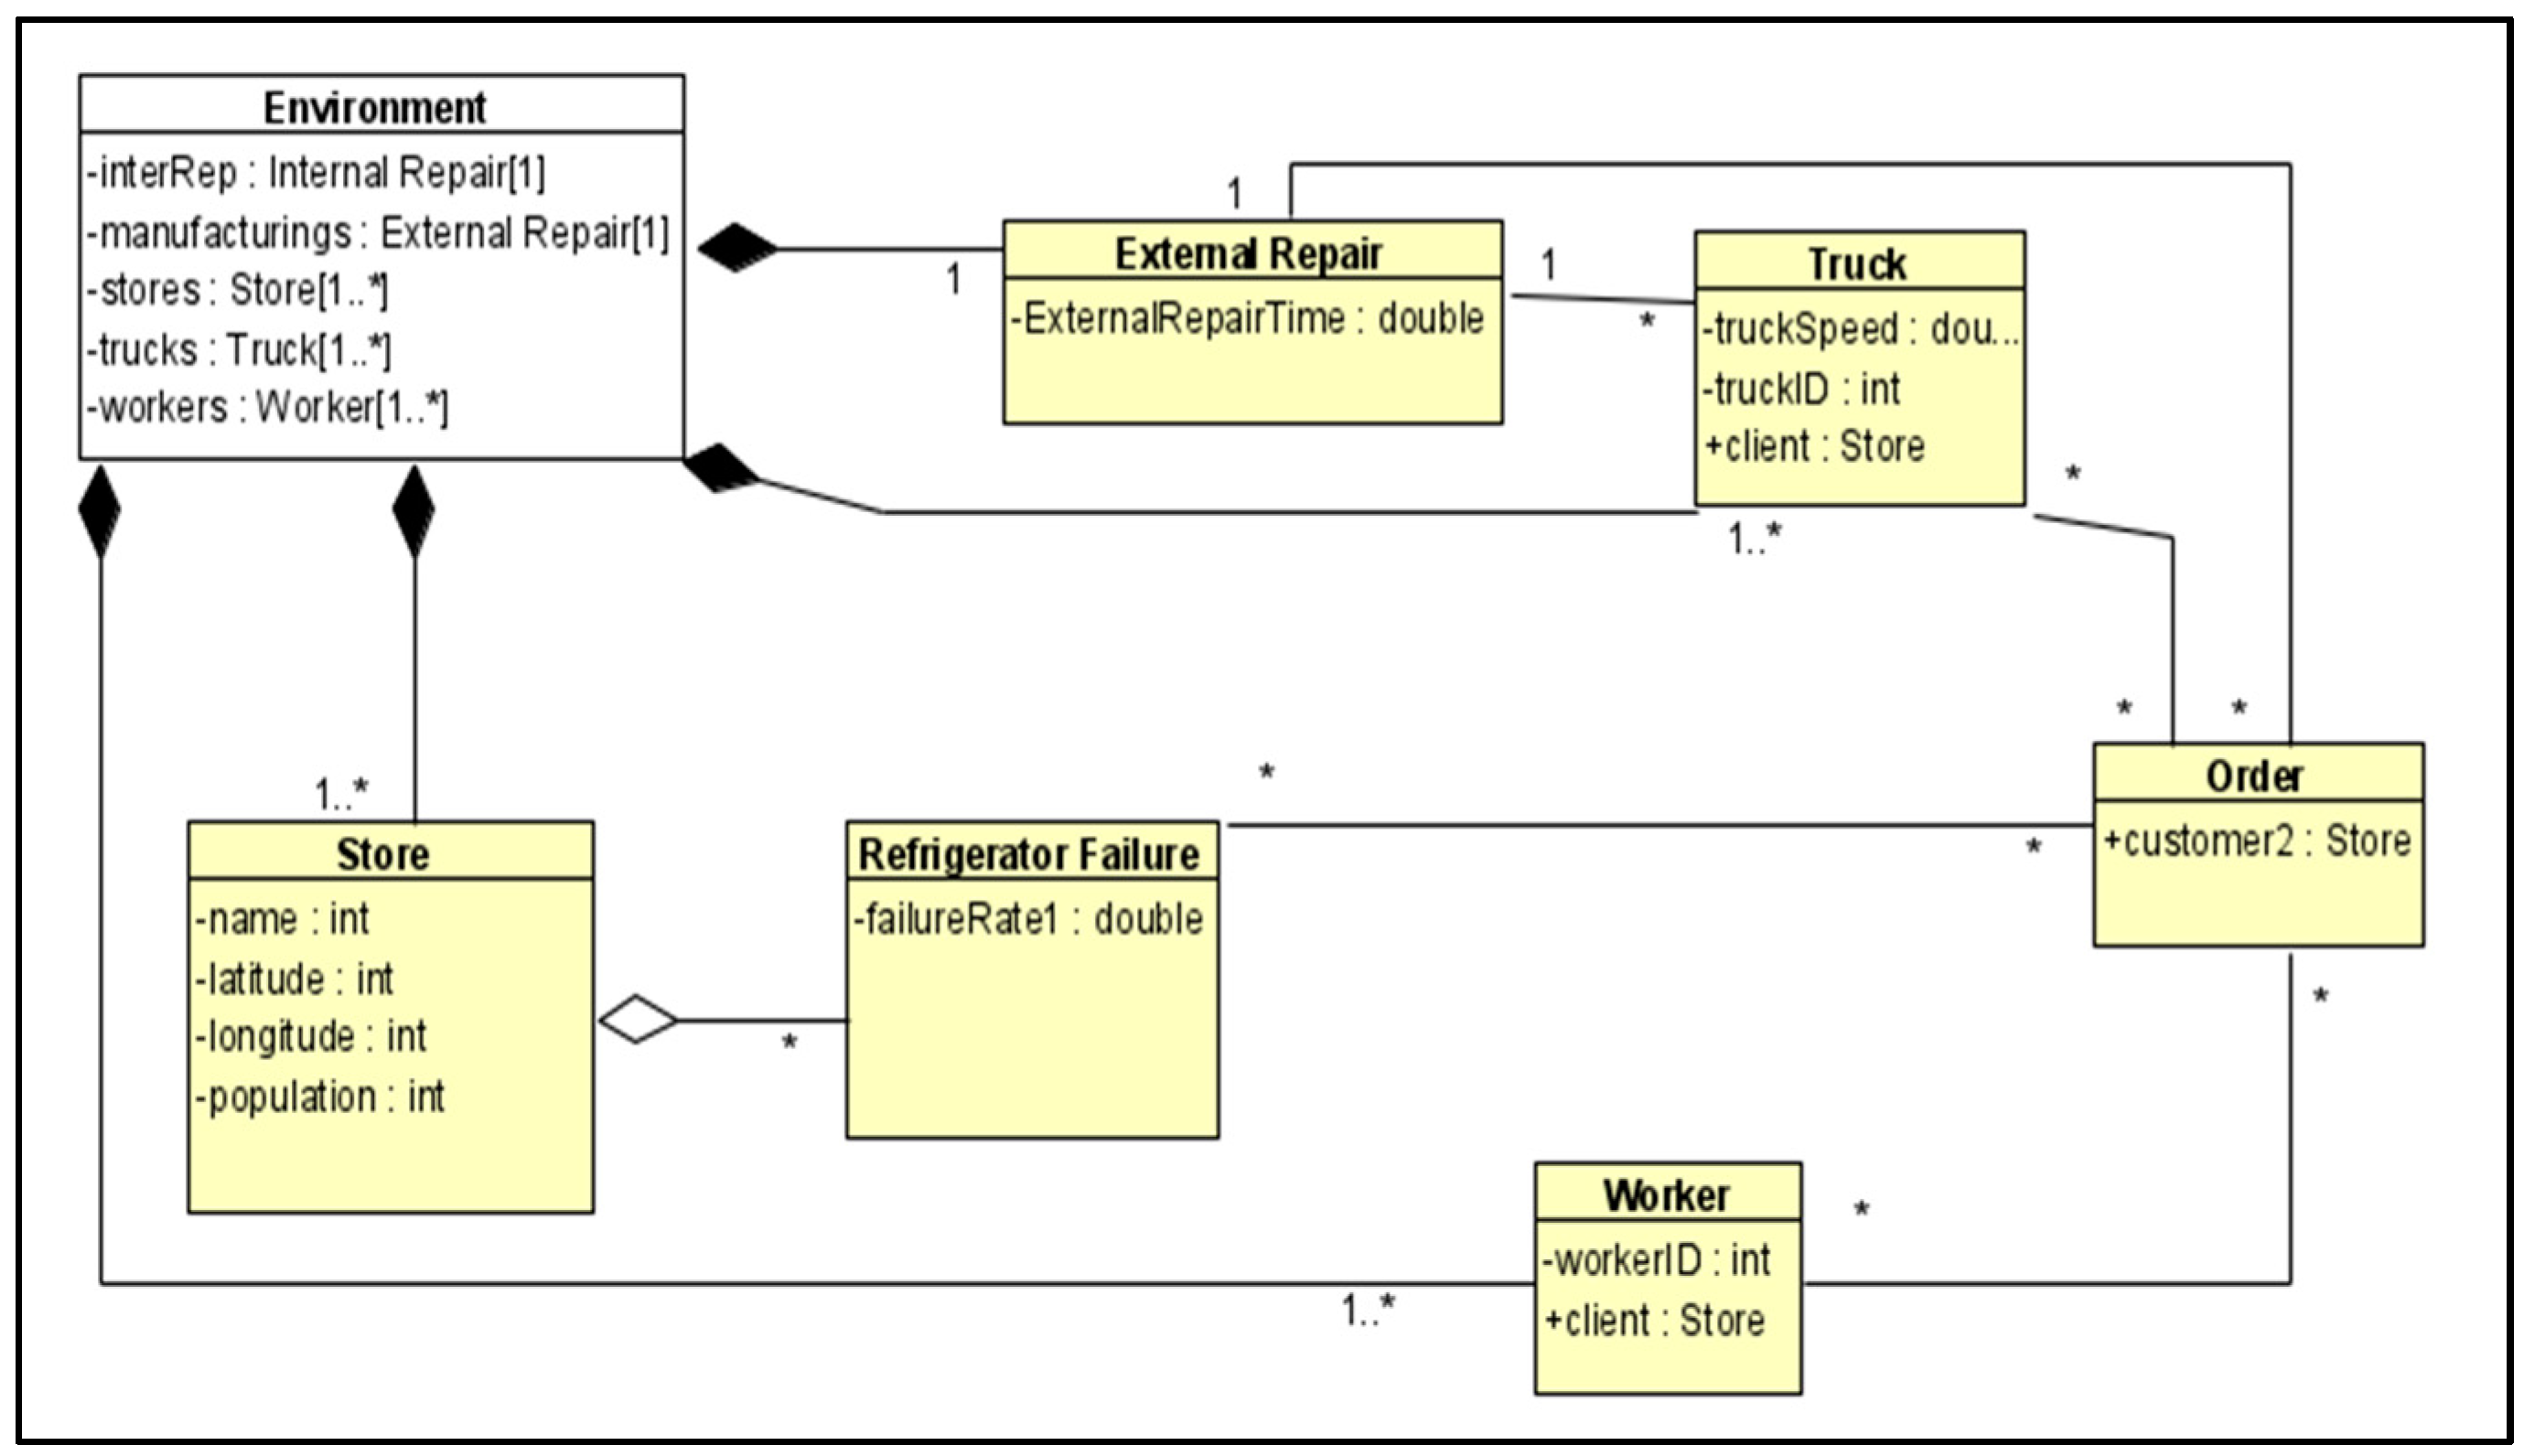
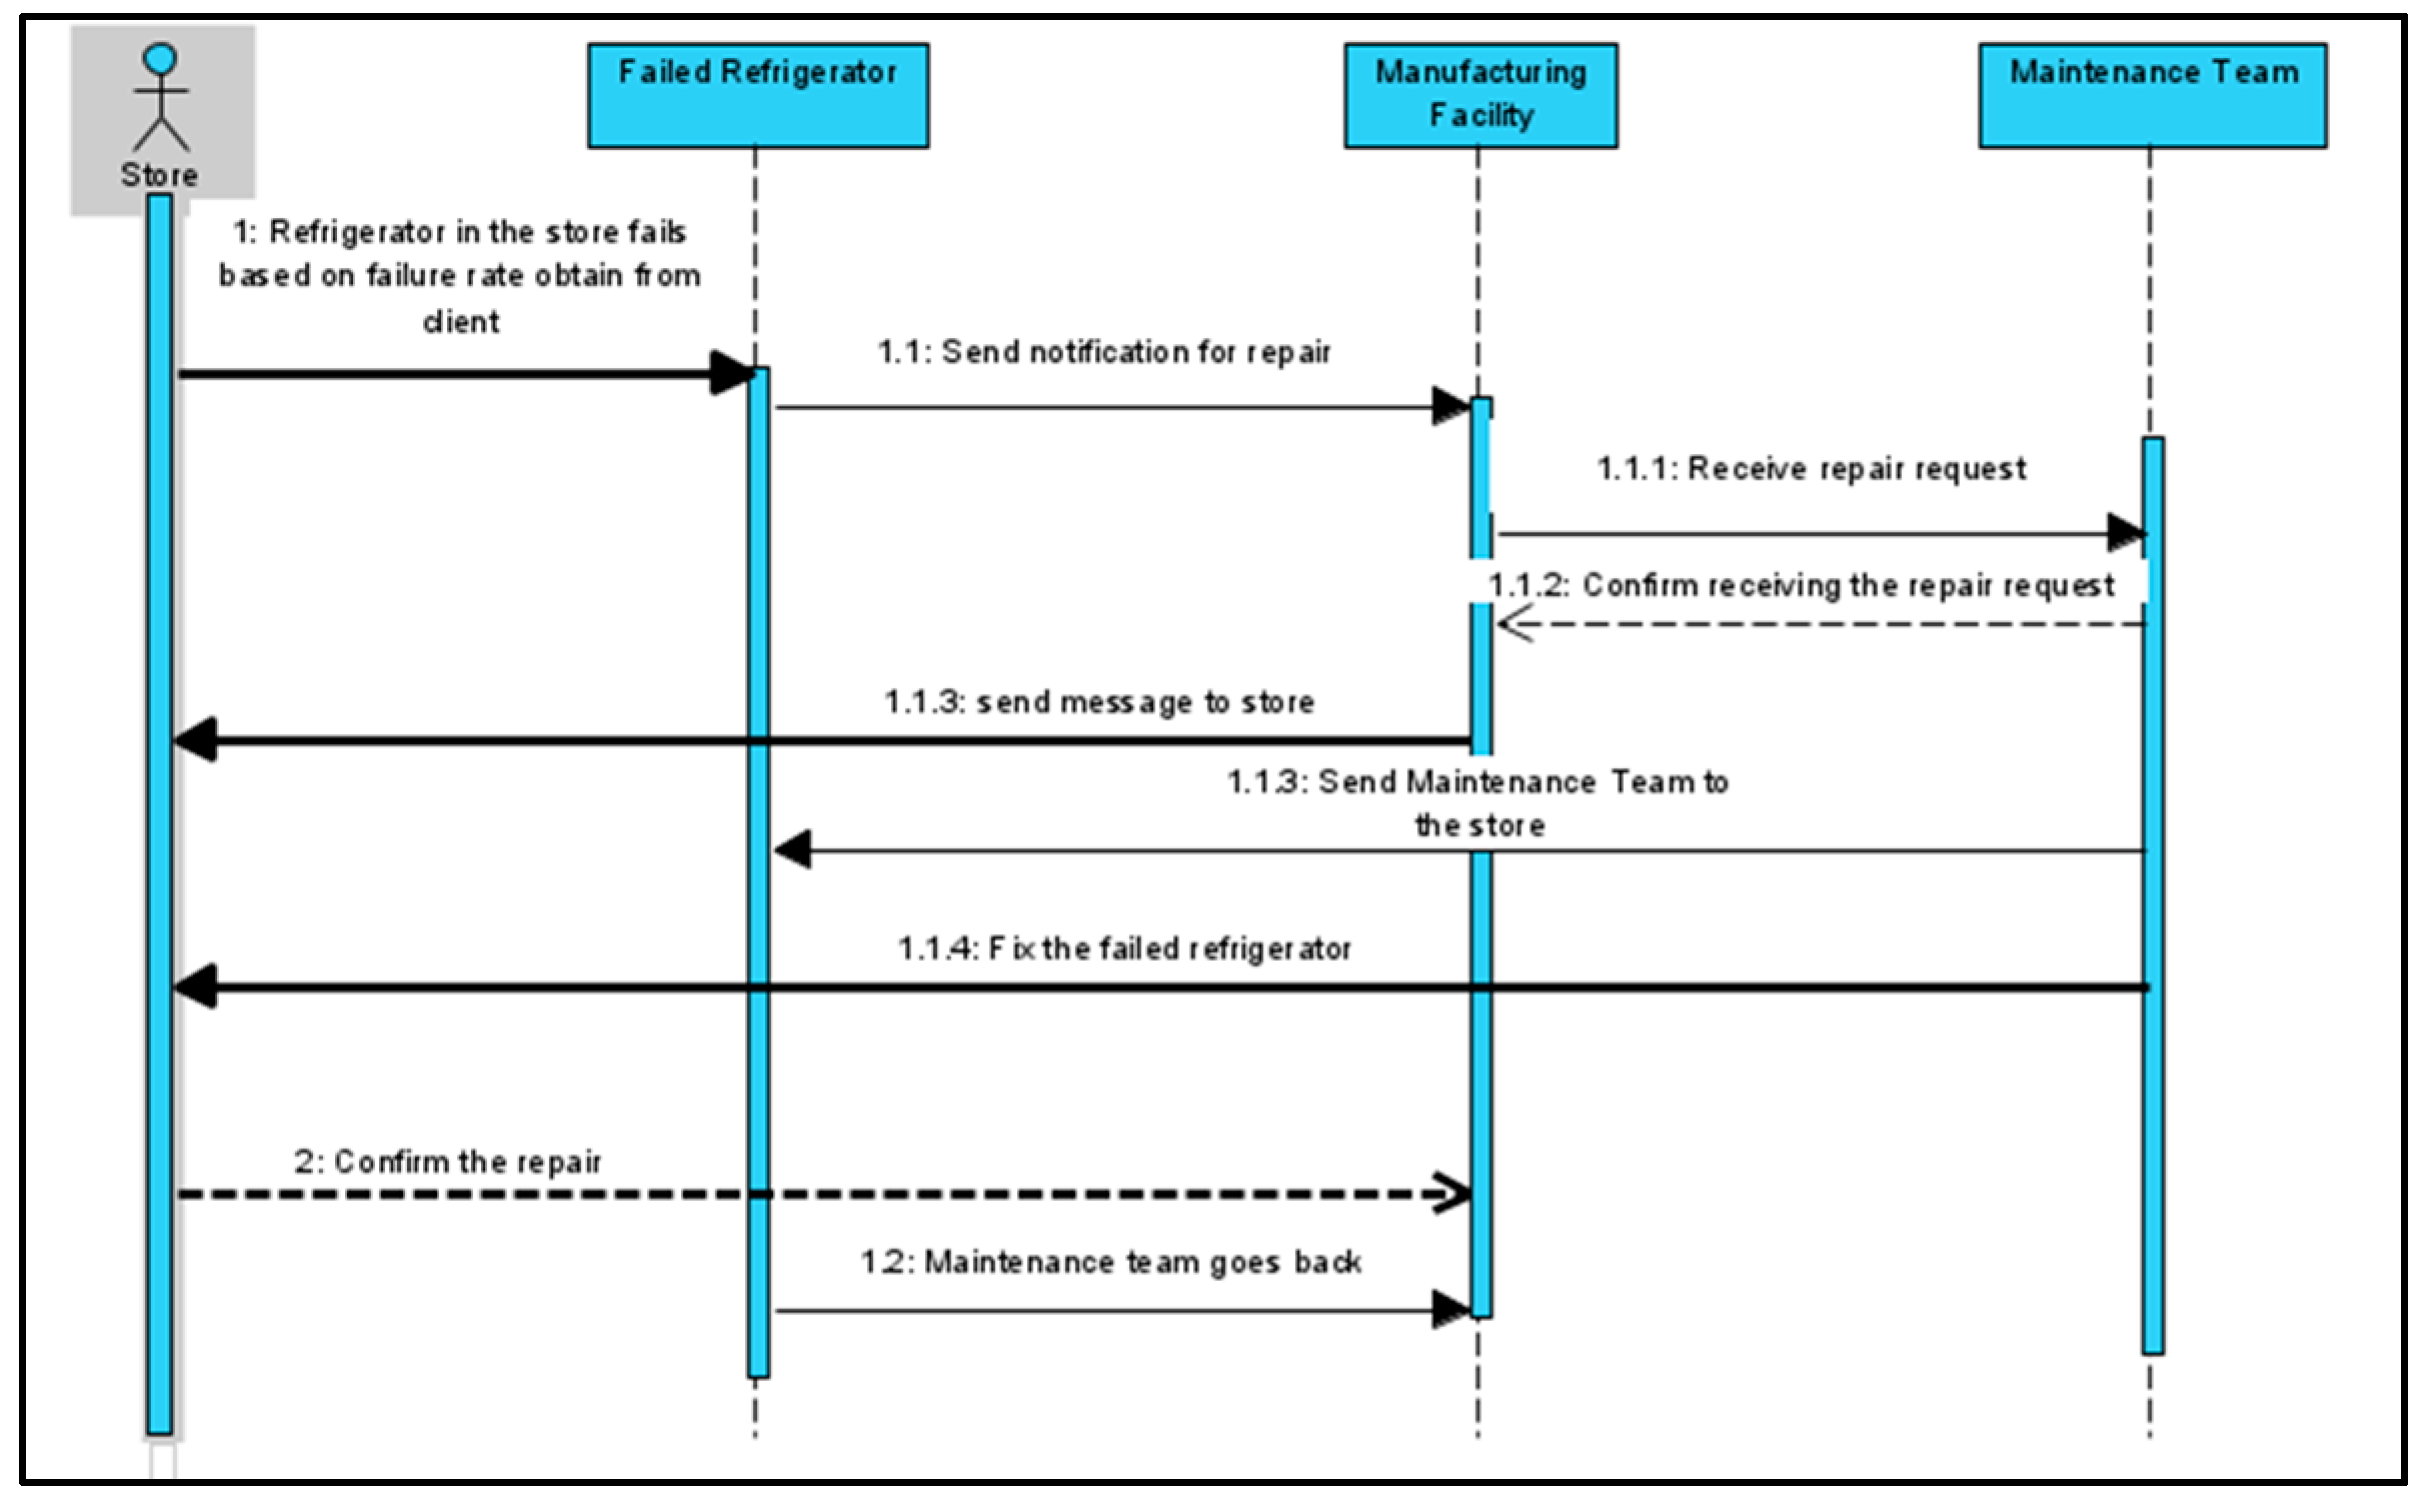
The various types of unified modeling language (UML) diagrams help in representing and validating simulation design. Three types of UML are presented in this study. Figure 3 shows a statechart diagram (behavioral illustration of UML) to display the transitions between different objects. The UML class diagram (Figure 4) is used to show the different system classes, their characteristics, and the type of relationships between agents. In addition to that, the sequence diagram which defines the sequence of messages and instructions between agents as is shown in Figure 5.
3.2.3. Build the Simulation Model
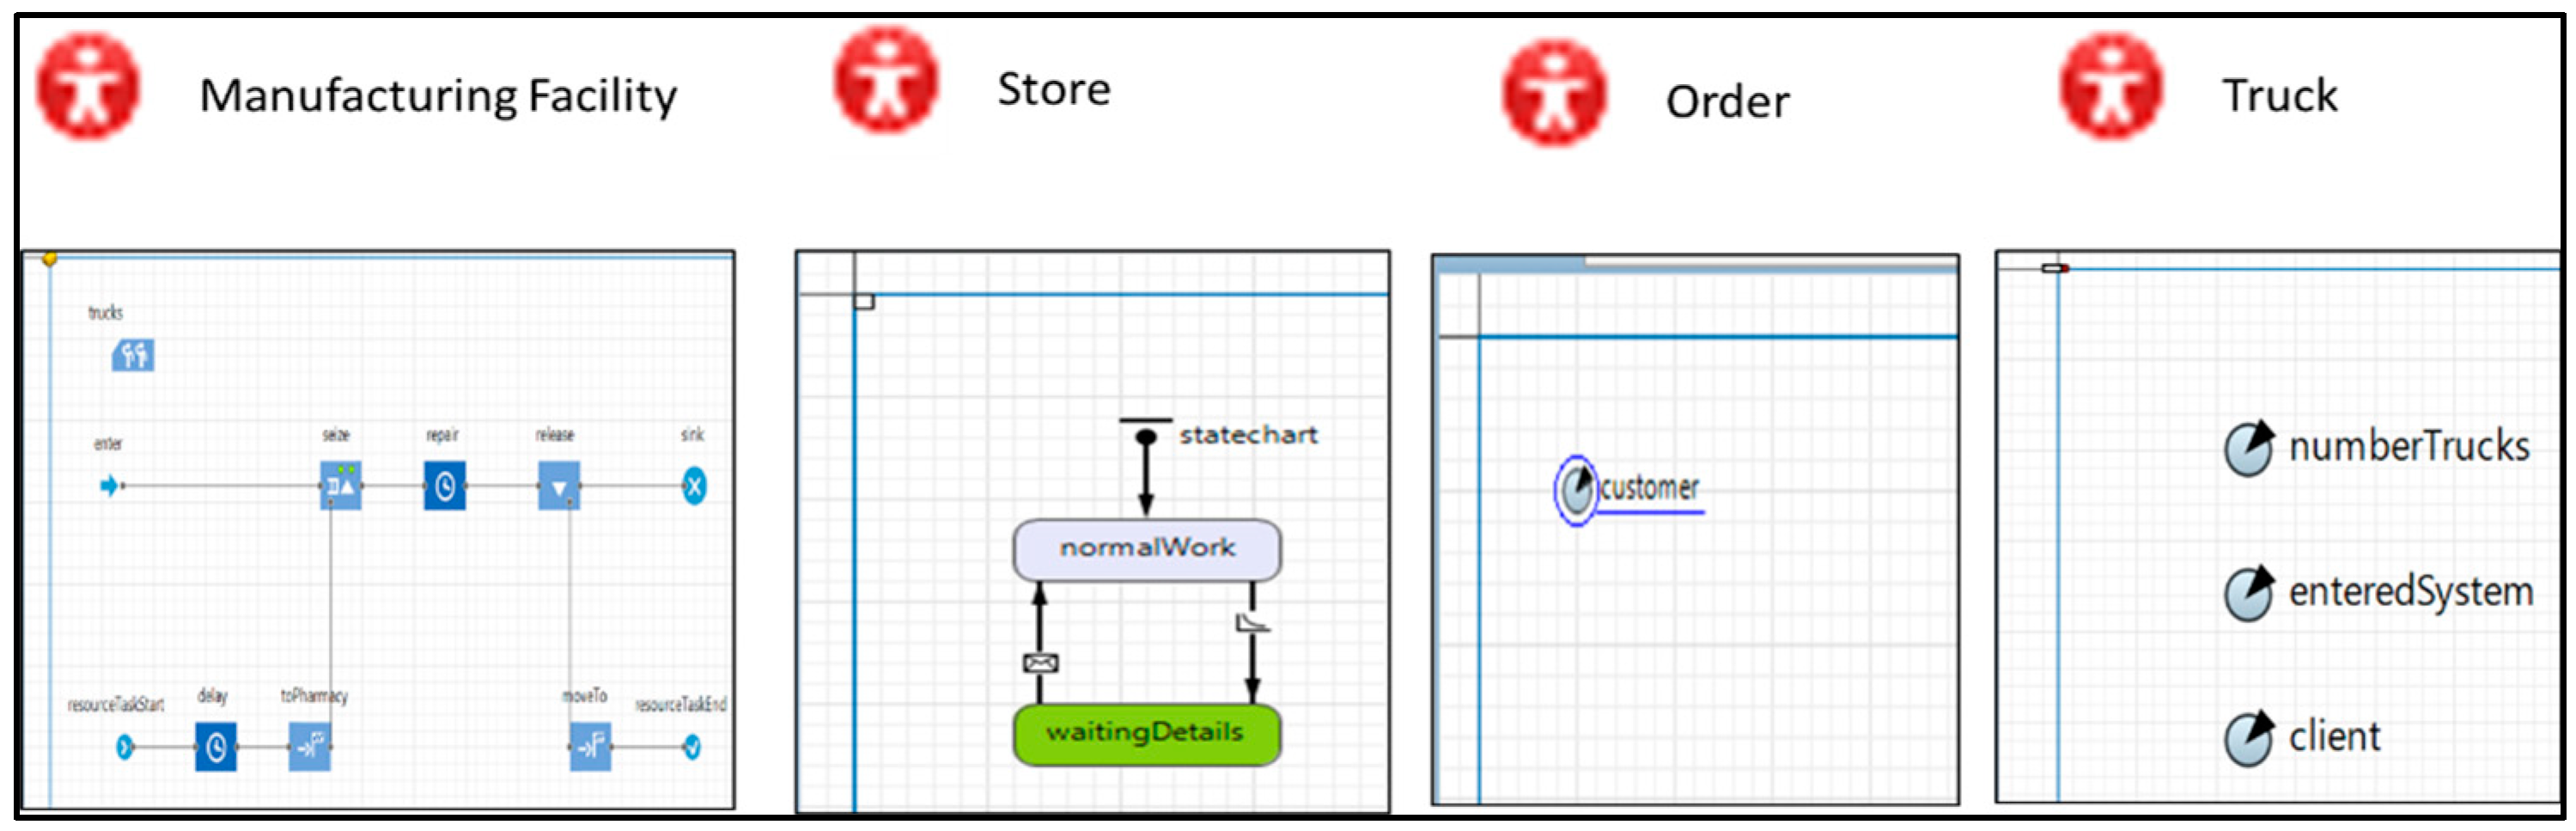
The scope of the case study contains one manufacturing facility, 12 stores, and ten trucks. The simulation model was built using AnyLogic software. There are four agents in ABSM: manufacturing agent, store agent, order agent, and truck agent. The structure of each agent and its parameters are shown in Figure 6.
All four agents are accessible from the main level. The 12 different store locations are combined in a collection feature in AnyLogic using the coordinate data for each store (Figure 7).
The store agent has two different statecharts (normalWork and waitingDetails), which describes the refrigerator behavior (Figure 6). Initially, the 240 refrigerators are in the normalWork state. When a failure occurs, the refrigerator moves from normalWork state to waitingDetails state. A specific failure rate triggers the transition between the two states. Maintenance orders are then sent to the manufacturing agent (different agent) requesting repair. After the repair, the refrigerator goes back to work typically (normalWork state) based on specific time out. When the manufacturing agent receives the maintenance orders, the truck starts moving to fix the failed refrigerator and then going back. The geographic information system (GIS) functionality in AnyLogic helps not only to locate the store and manufacturing agent on the map using their longitude and latitude data but also to define the exact roads between them automatically.
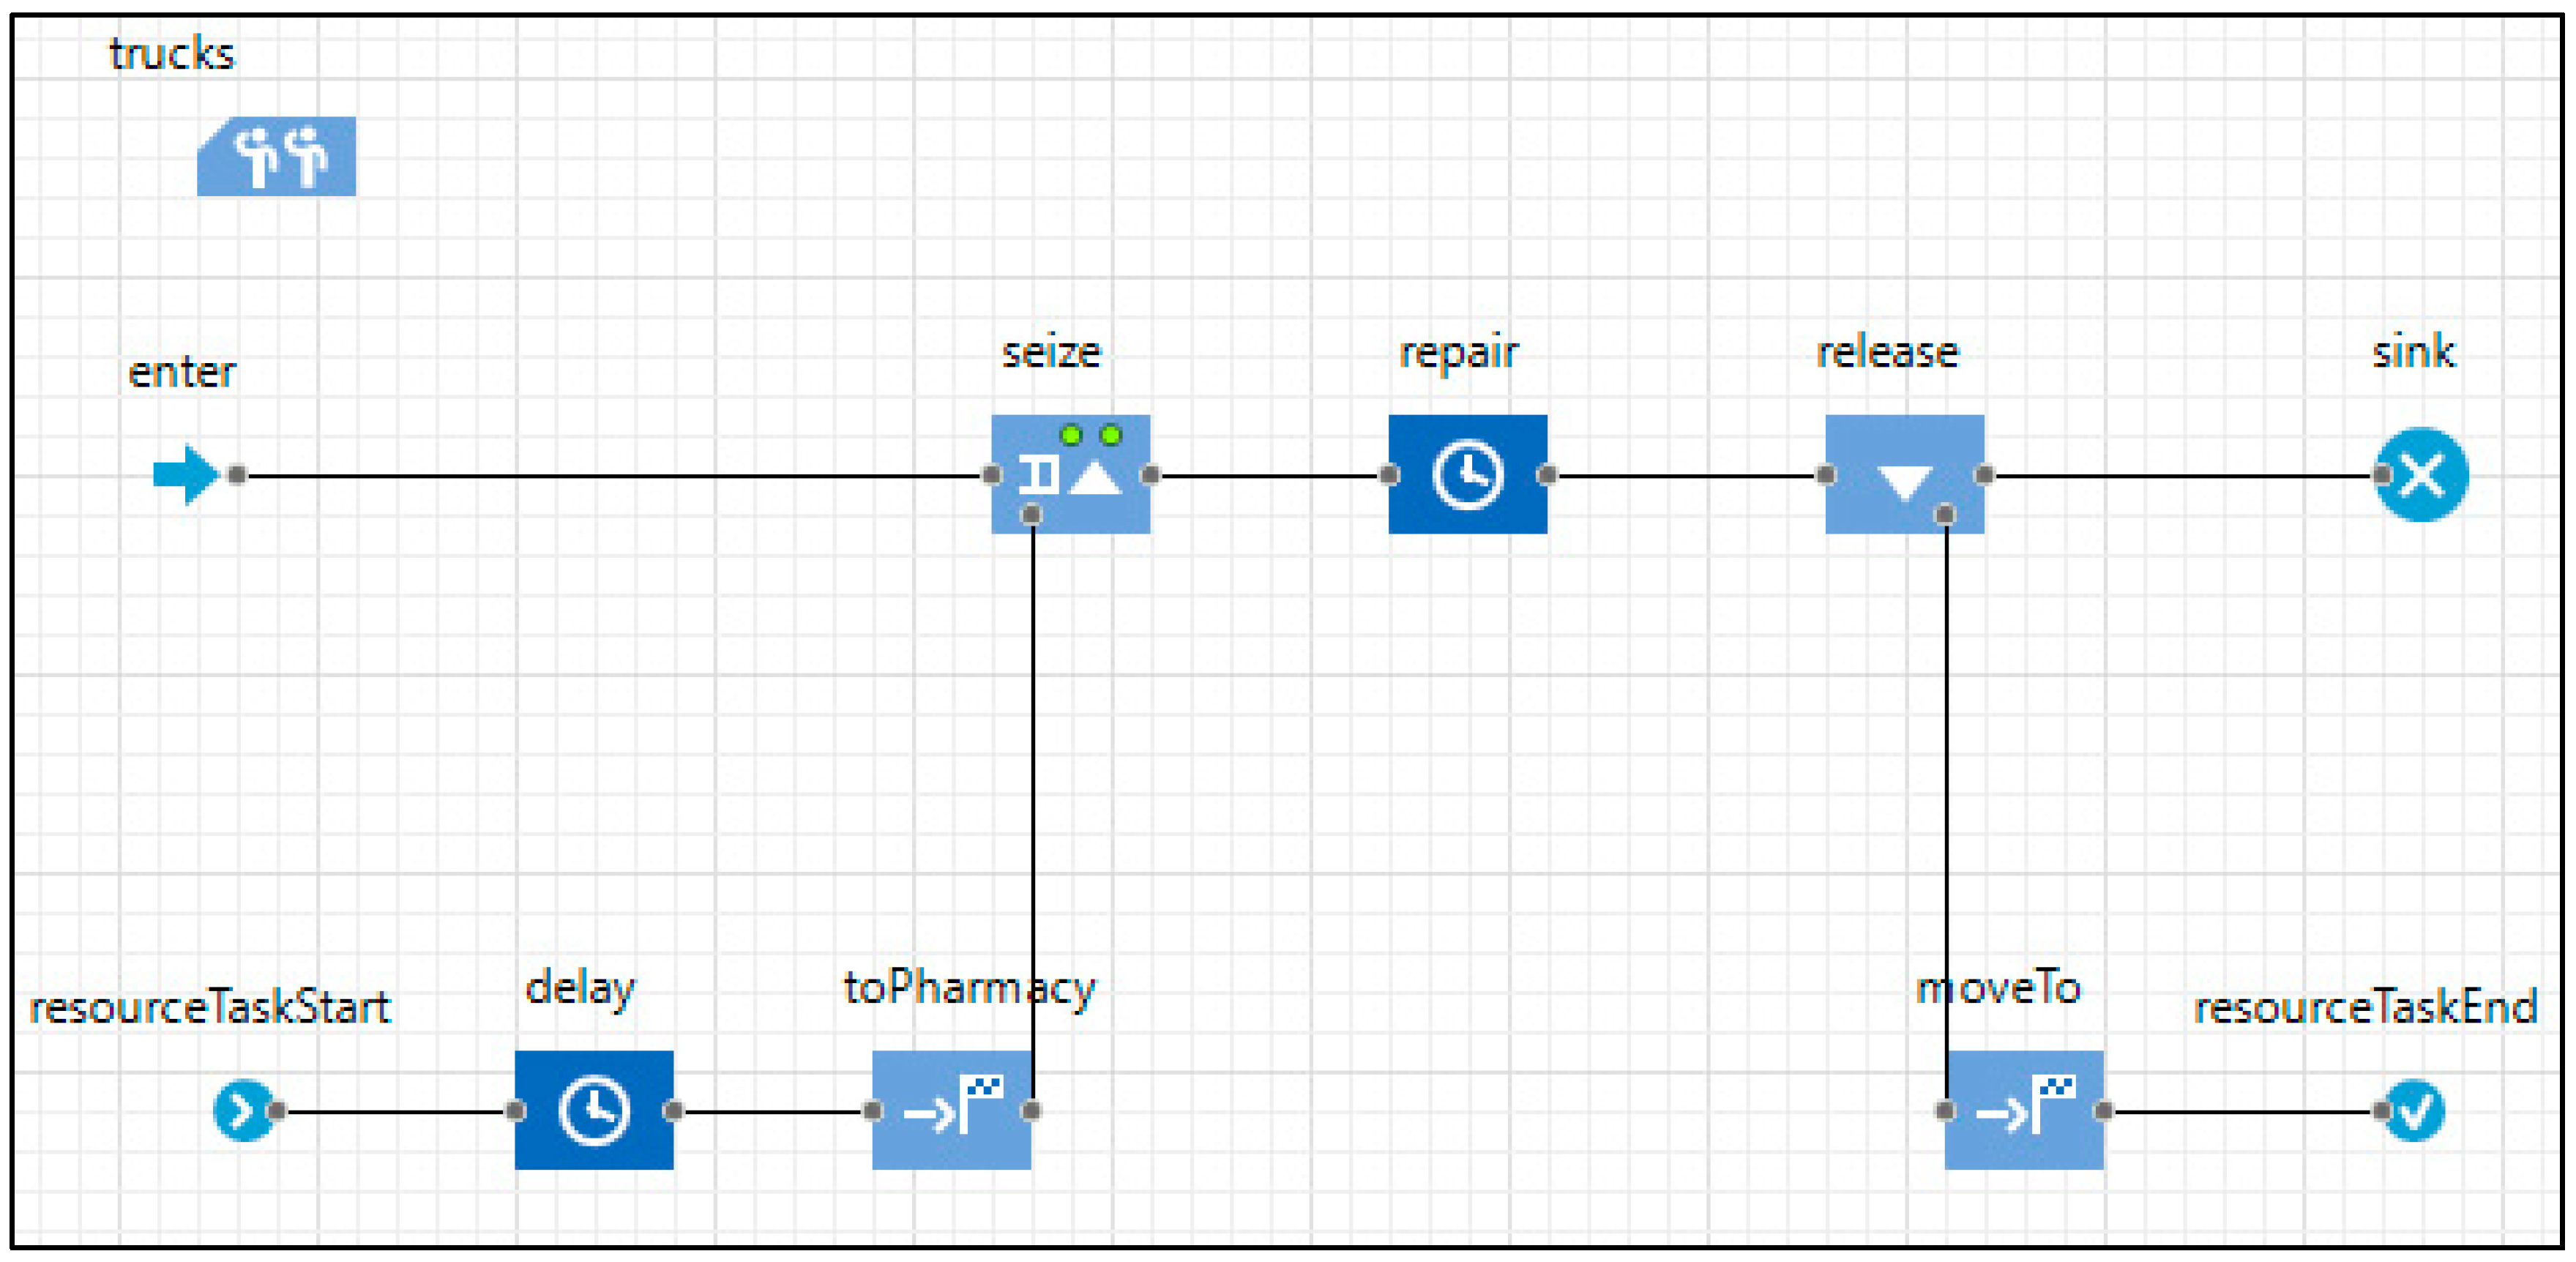
Figure 8 shows the processing logic of the manufacturing agent. A discrete-event simulation (DES) was developed to capture the truck movement between the two different types of agents. Each truck is assigned to a specific maintenance order using the parameters defined in the truck and order agent.
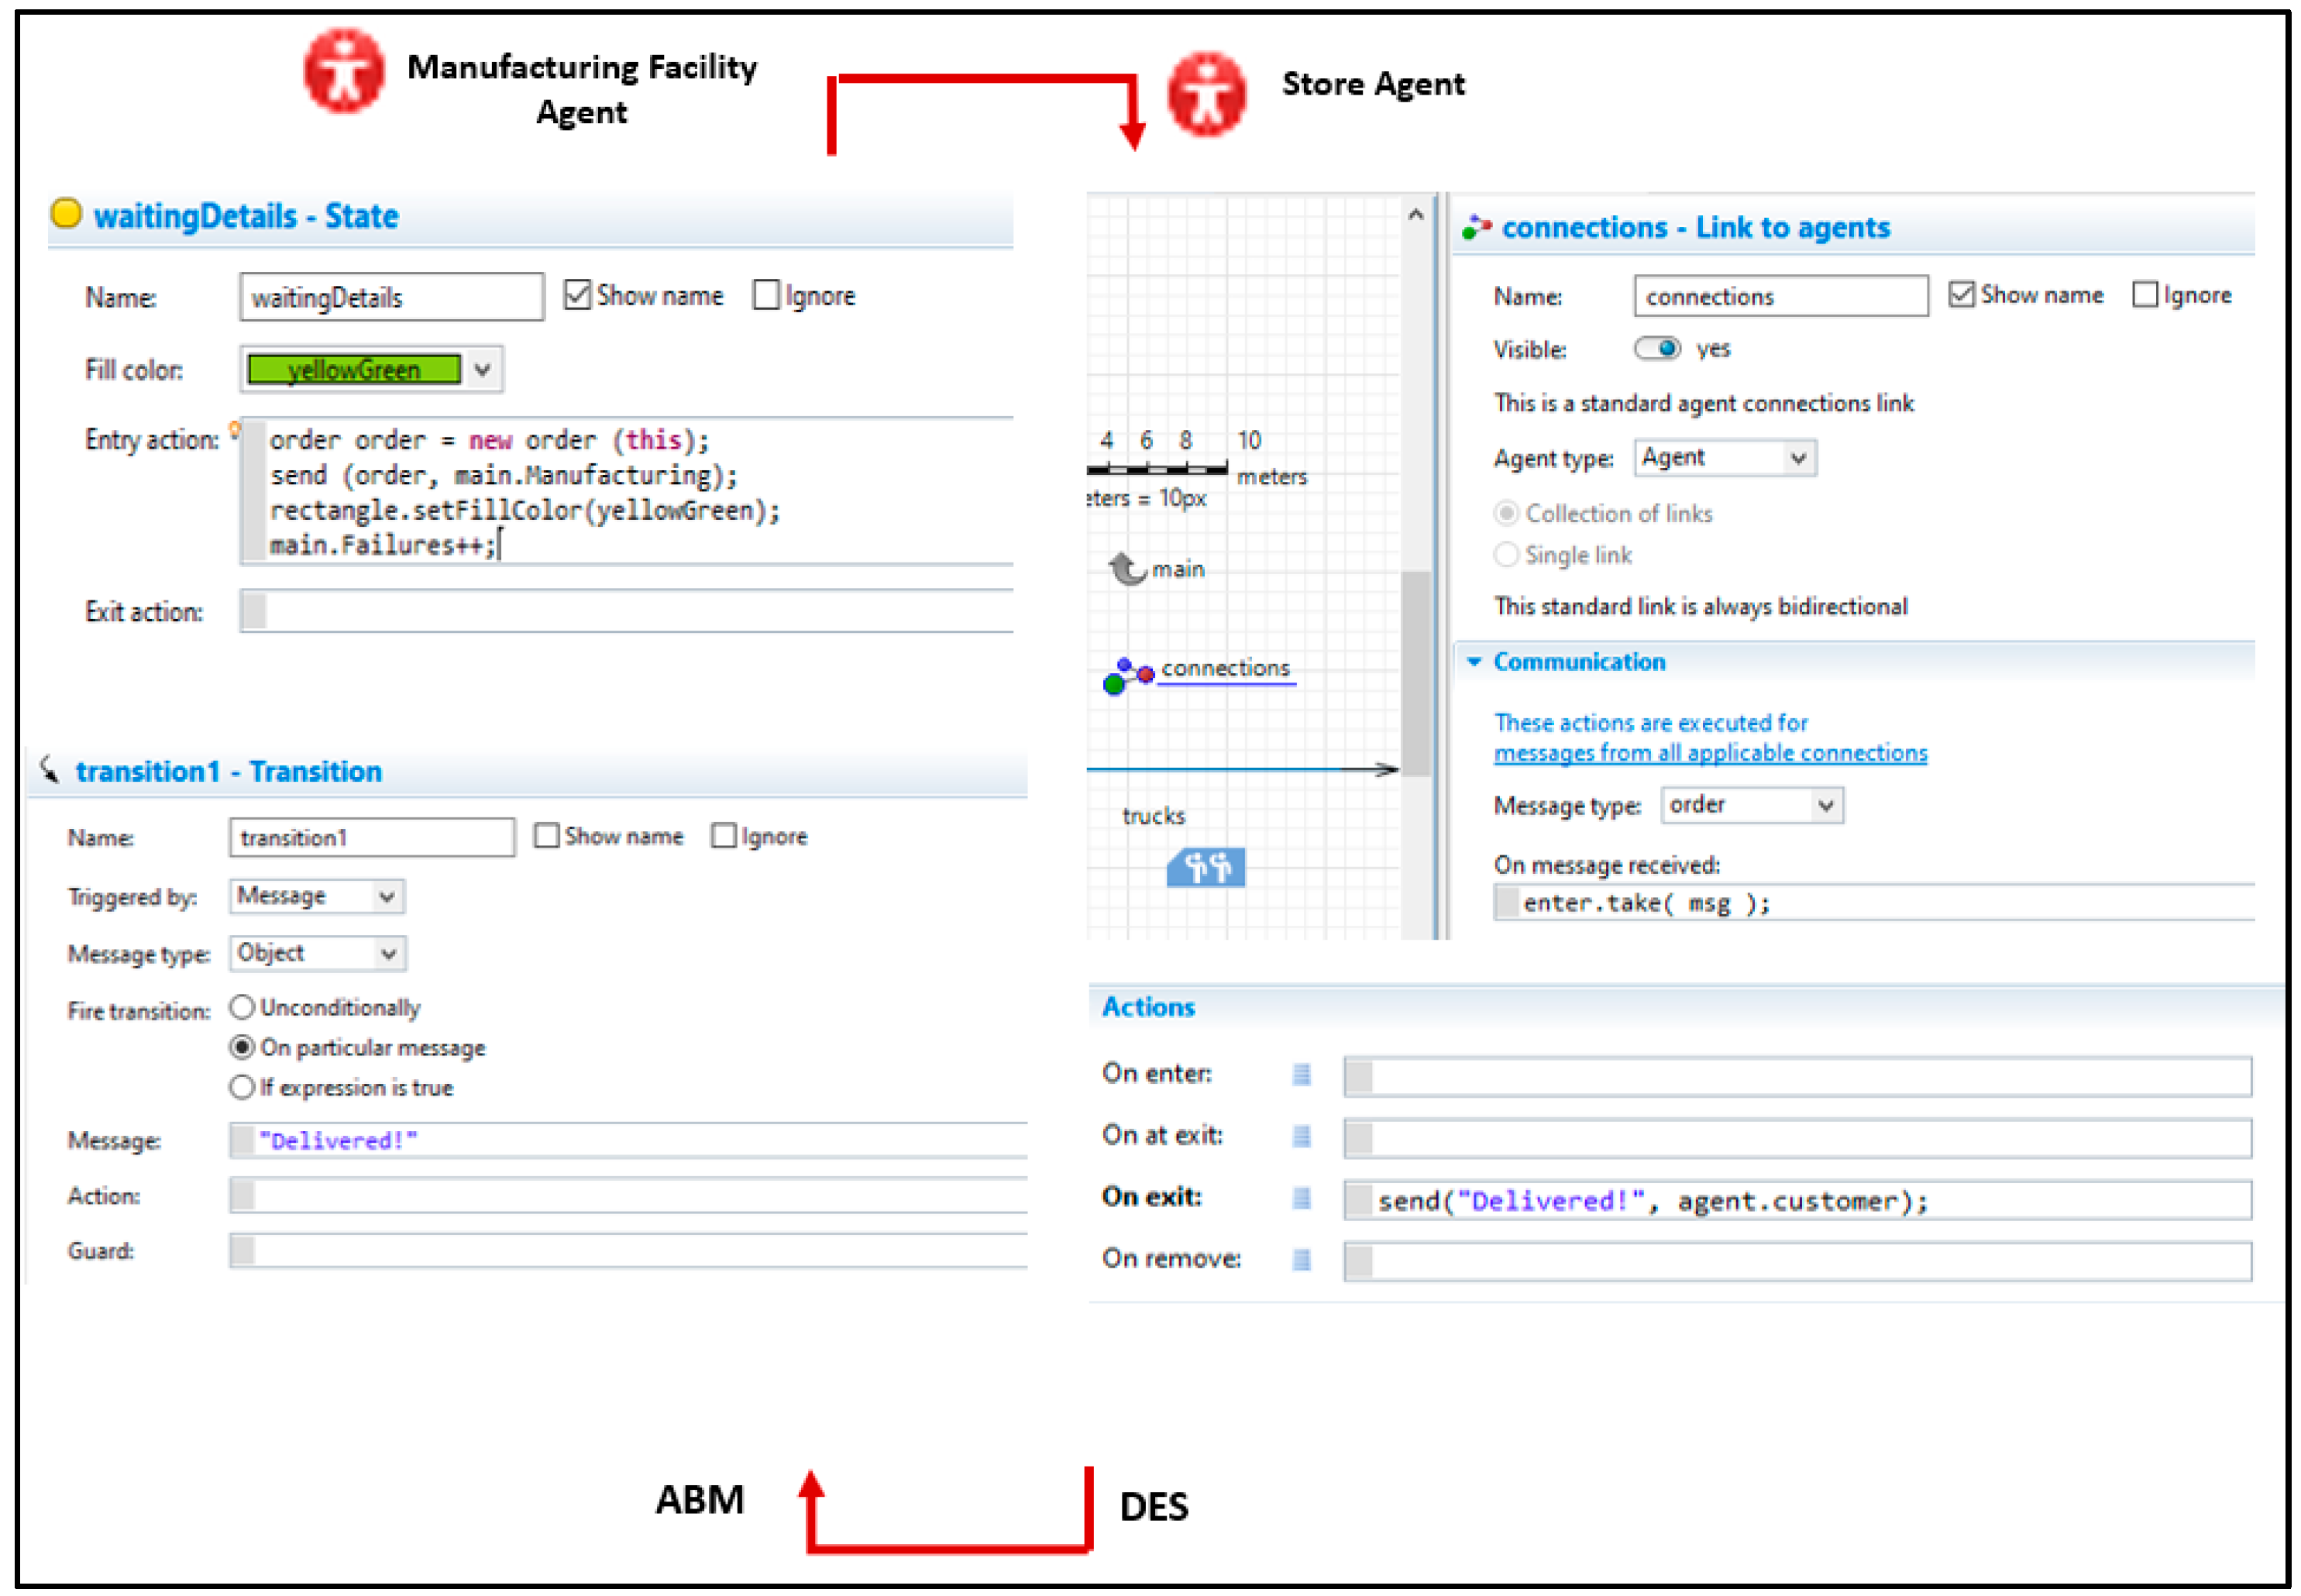
The DES model inside the manufacturing agent is connected to the store agent (hybrid system) using the connection feature embedded in AnyLogic. Different Java codes are used to capture system behaviors (Figure 9).
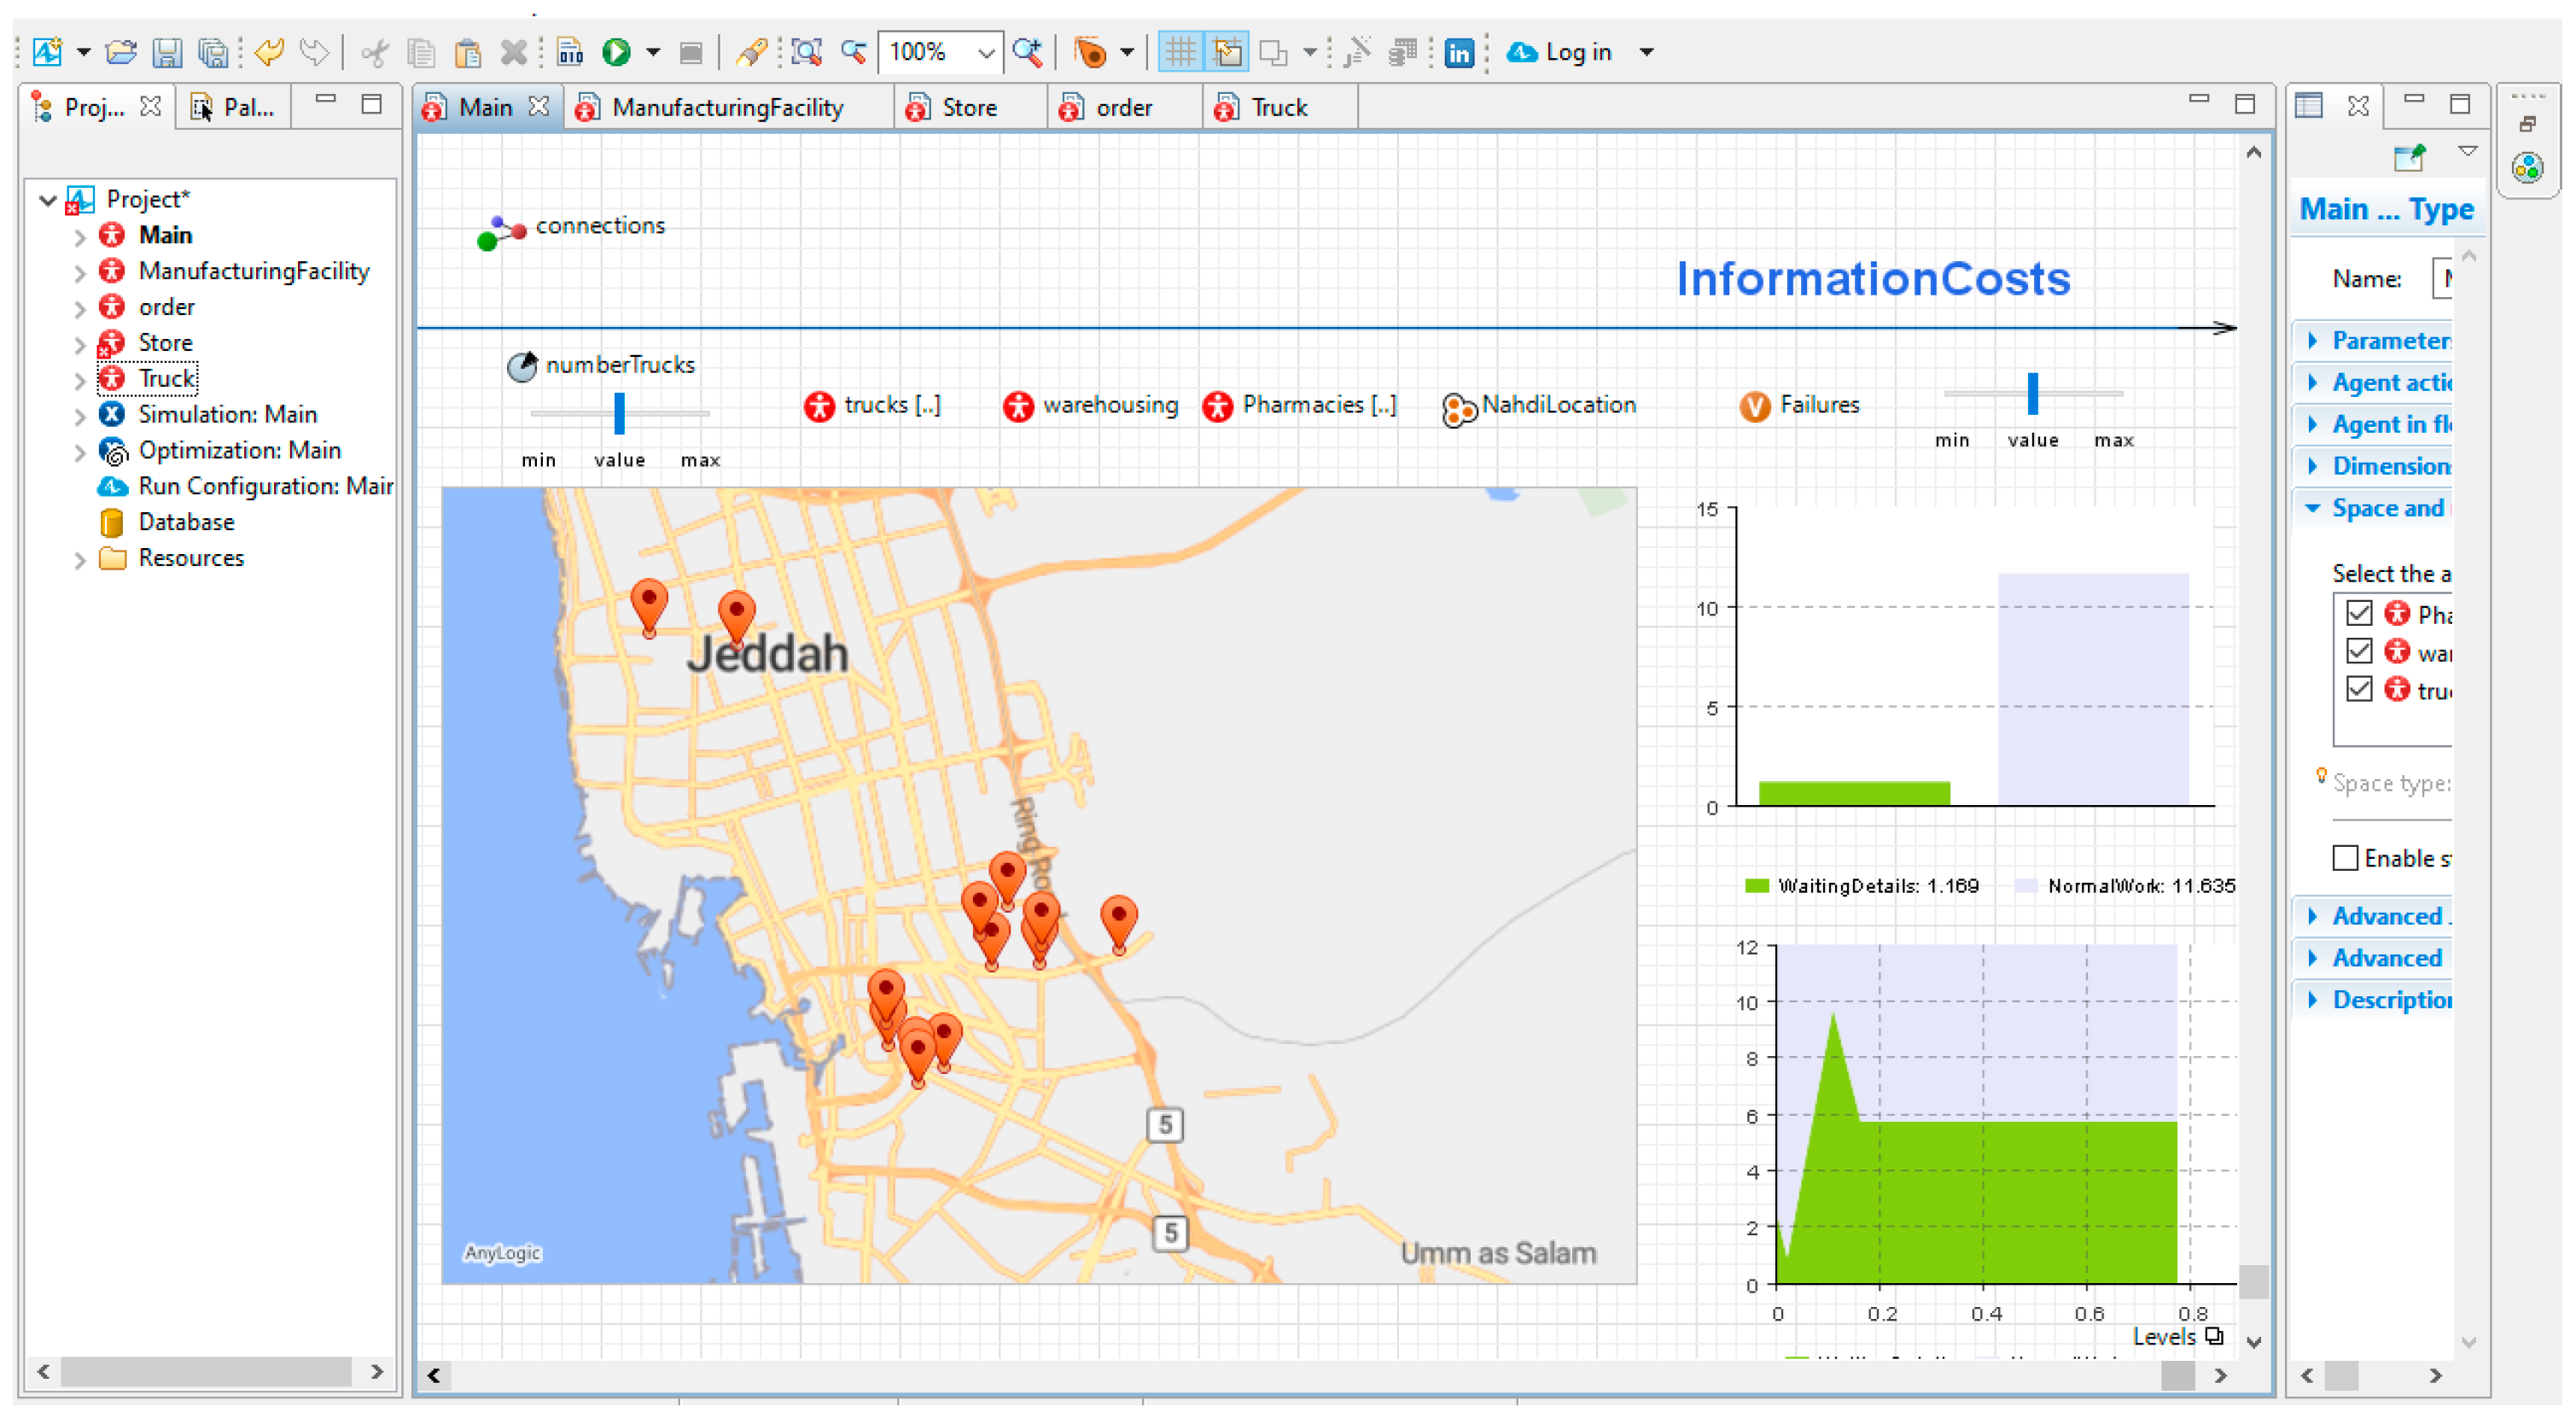
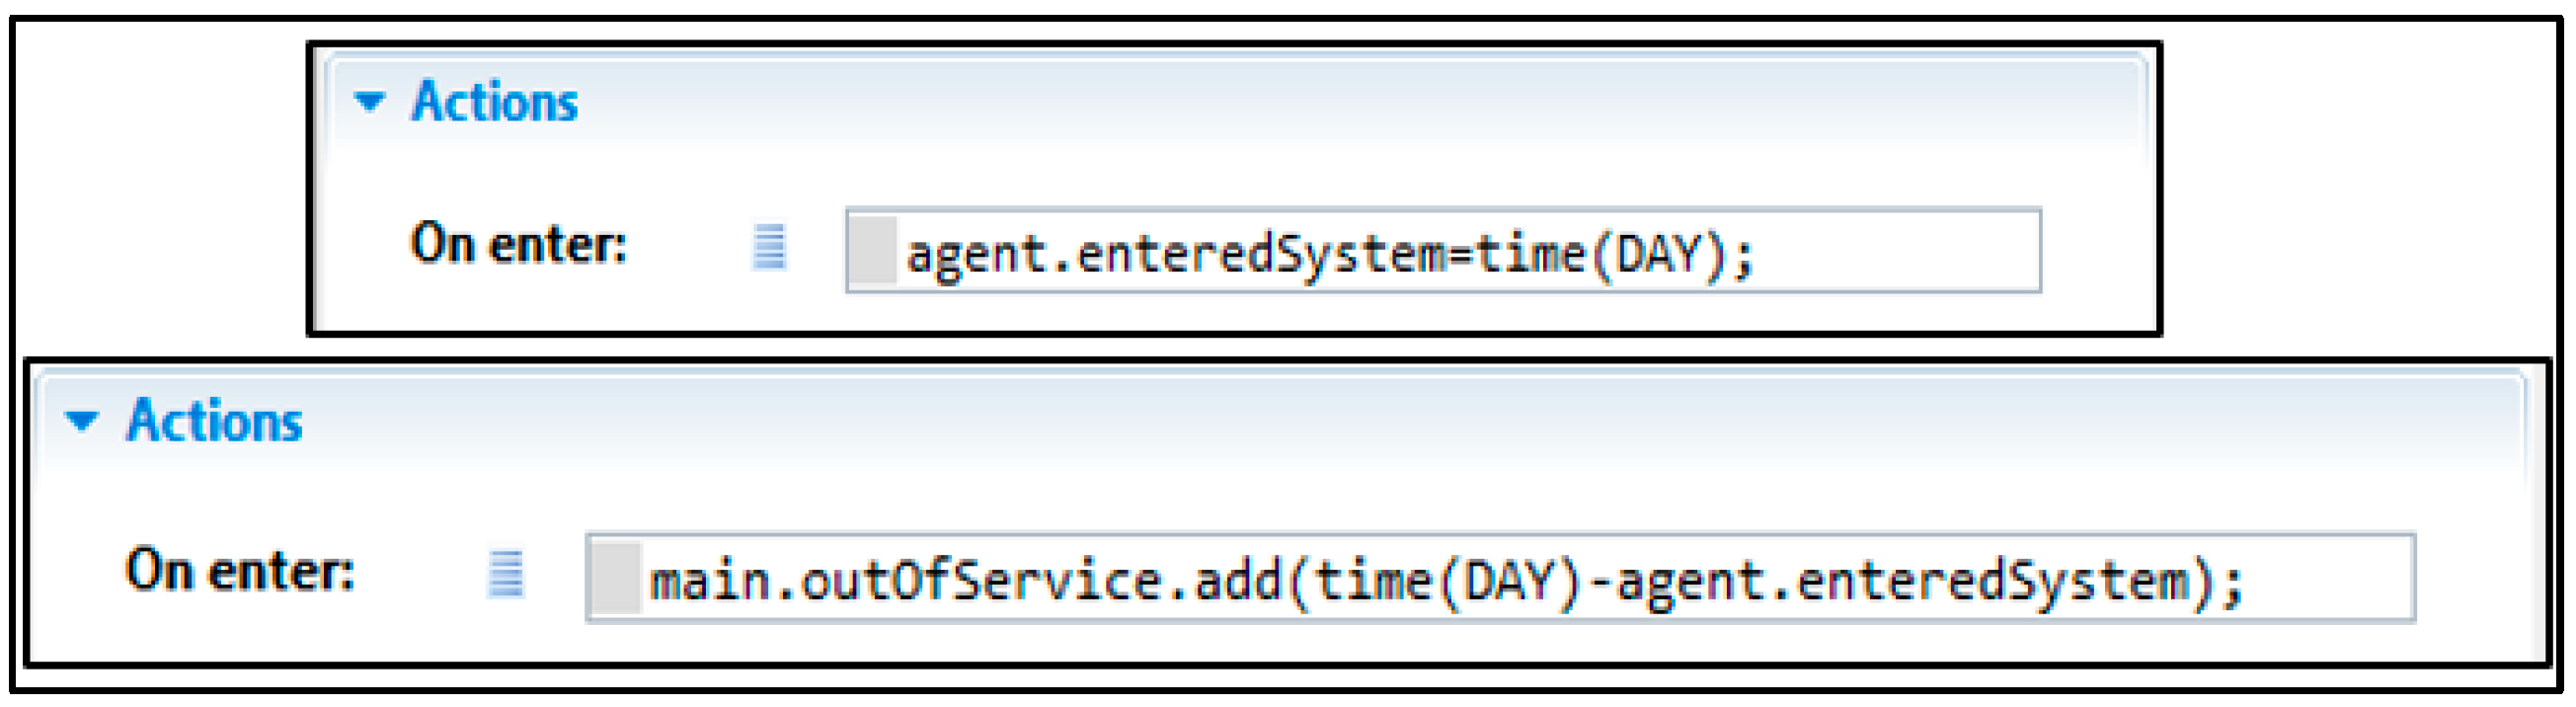
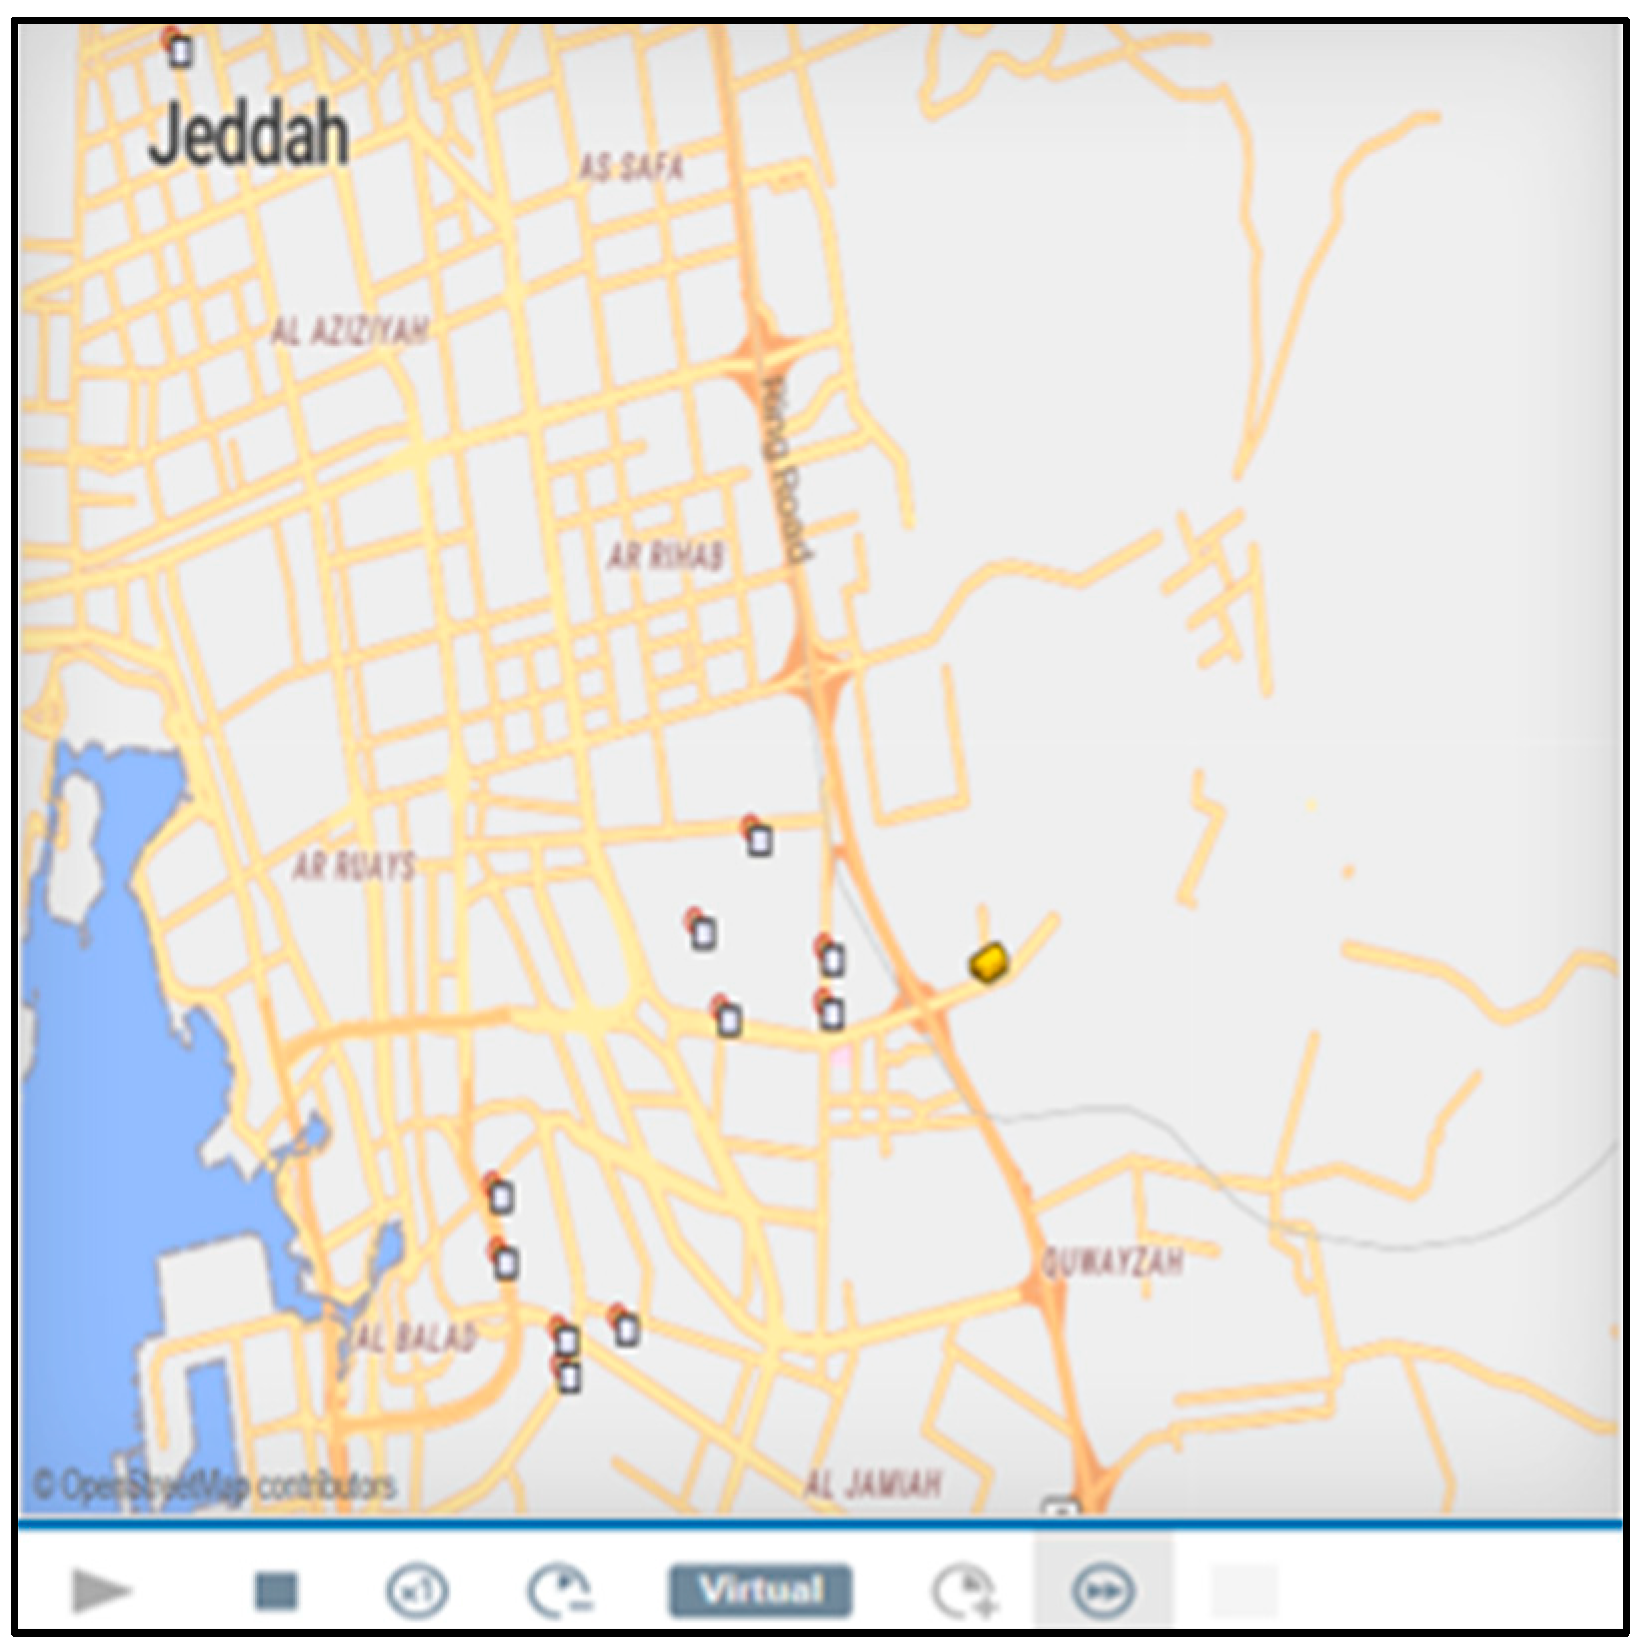
One of the essential elements in ABSM is to determine the out of service time for the 240 refrigerators in the 12 different store locations. This helps significantly to calculate the total cost and to validate the simulation model. The Java code is shown in Figure 10. Figure 11 shows the visualization of the ABSM animation of the Saudi Arabia map. The manufacturing facility and the 12 store locations are placed on the exact physical location to determine the accurate truck movement time between them.
3.2.4. ABSM Validation
Several runs were performed for 1 year to examine the ABSM validity. The process of validation follows the approach proposed by Klügl [42]:
- Face validity: the facility managers approve the ABSM base case initial results.
- Statistical validation: the initial results of out of service time in ABSM for 250 days were compared with a subset of out of service time for the same period, which was obtained from the facility management. The comparison shows a 4.32% relative difference between the two results, which suggests the ABSM is valid to mimic and imitate the real system.
3.3. Simulation Results
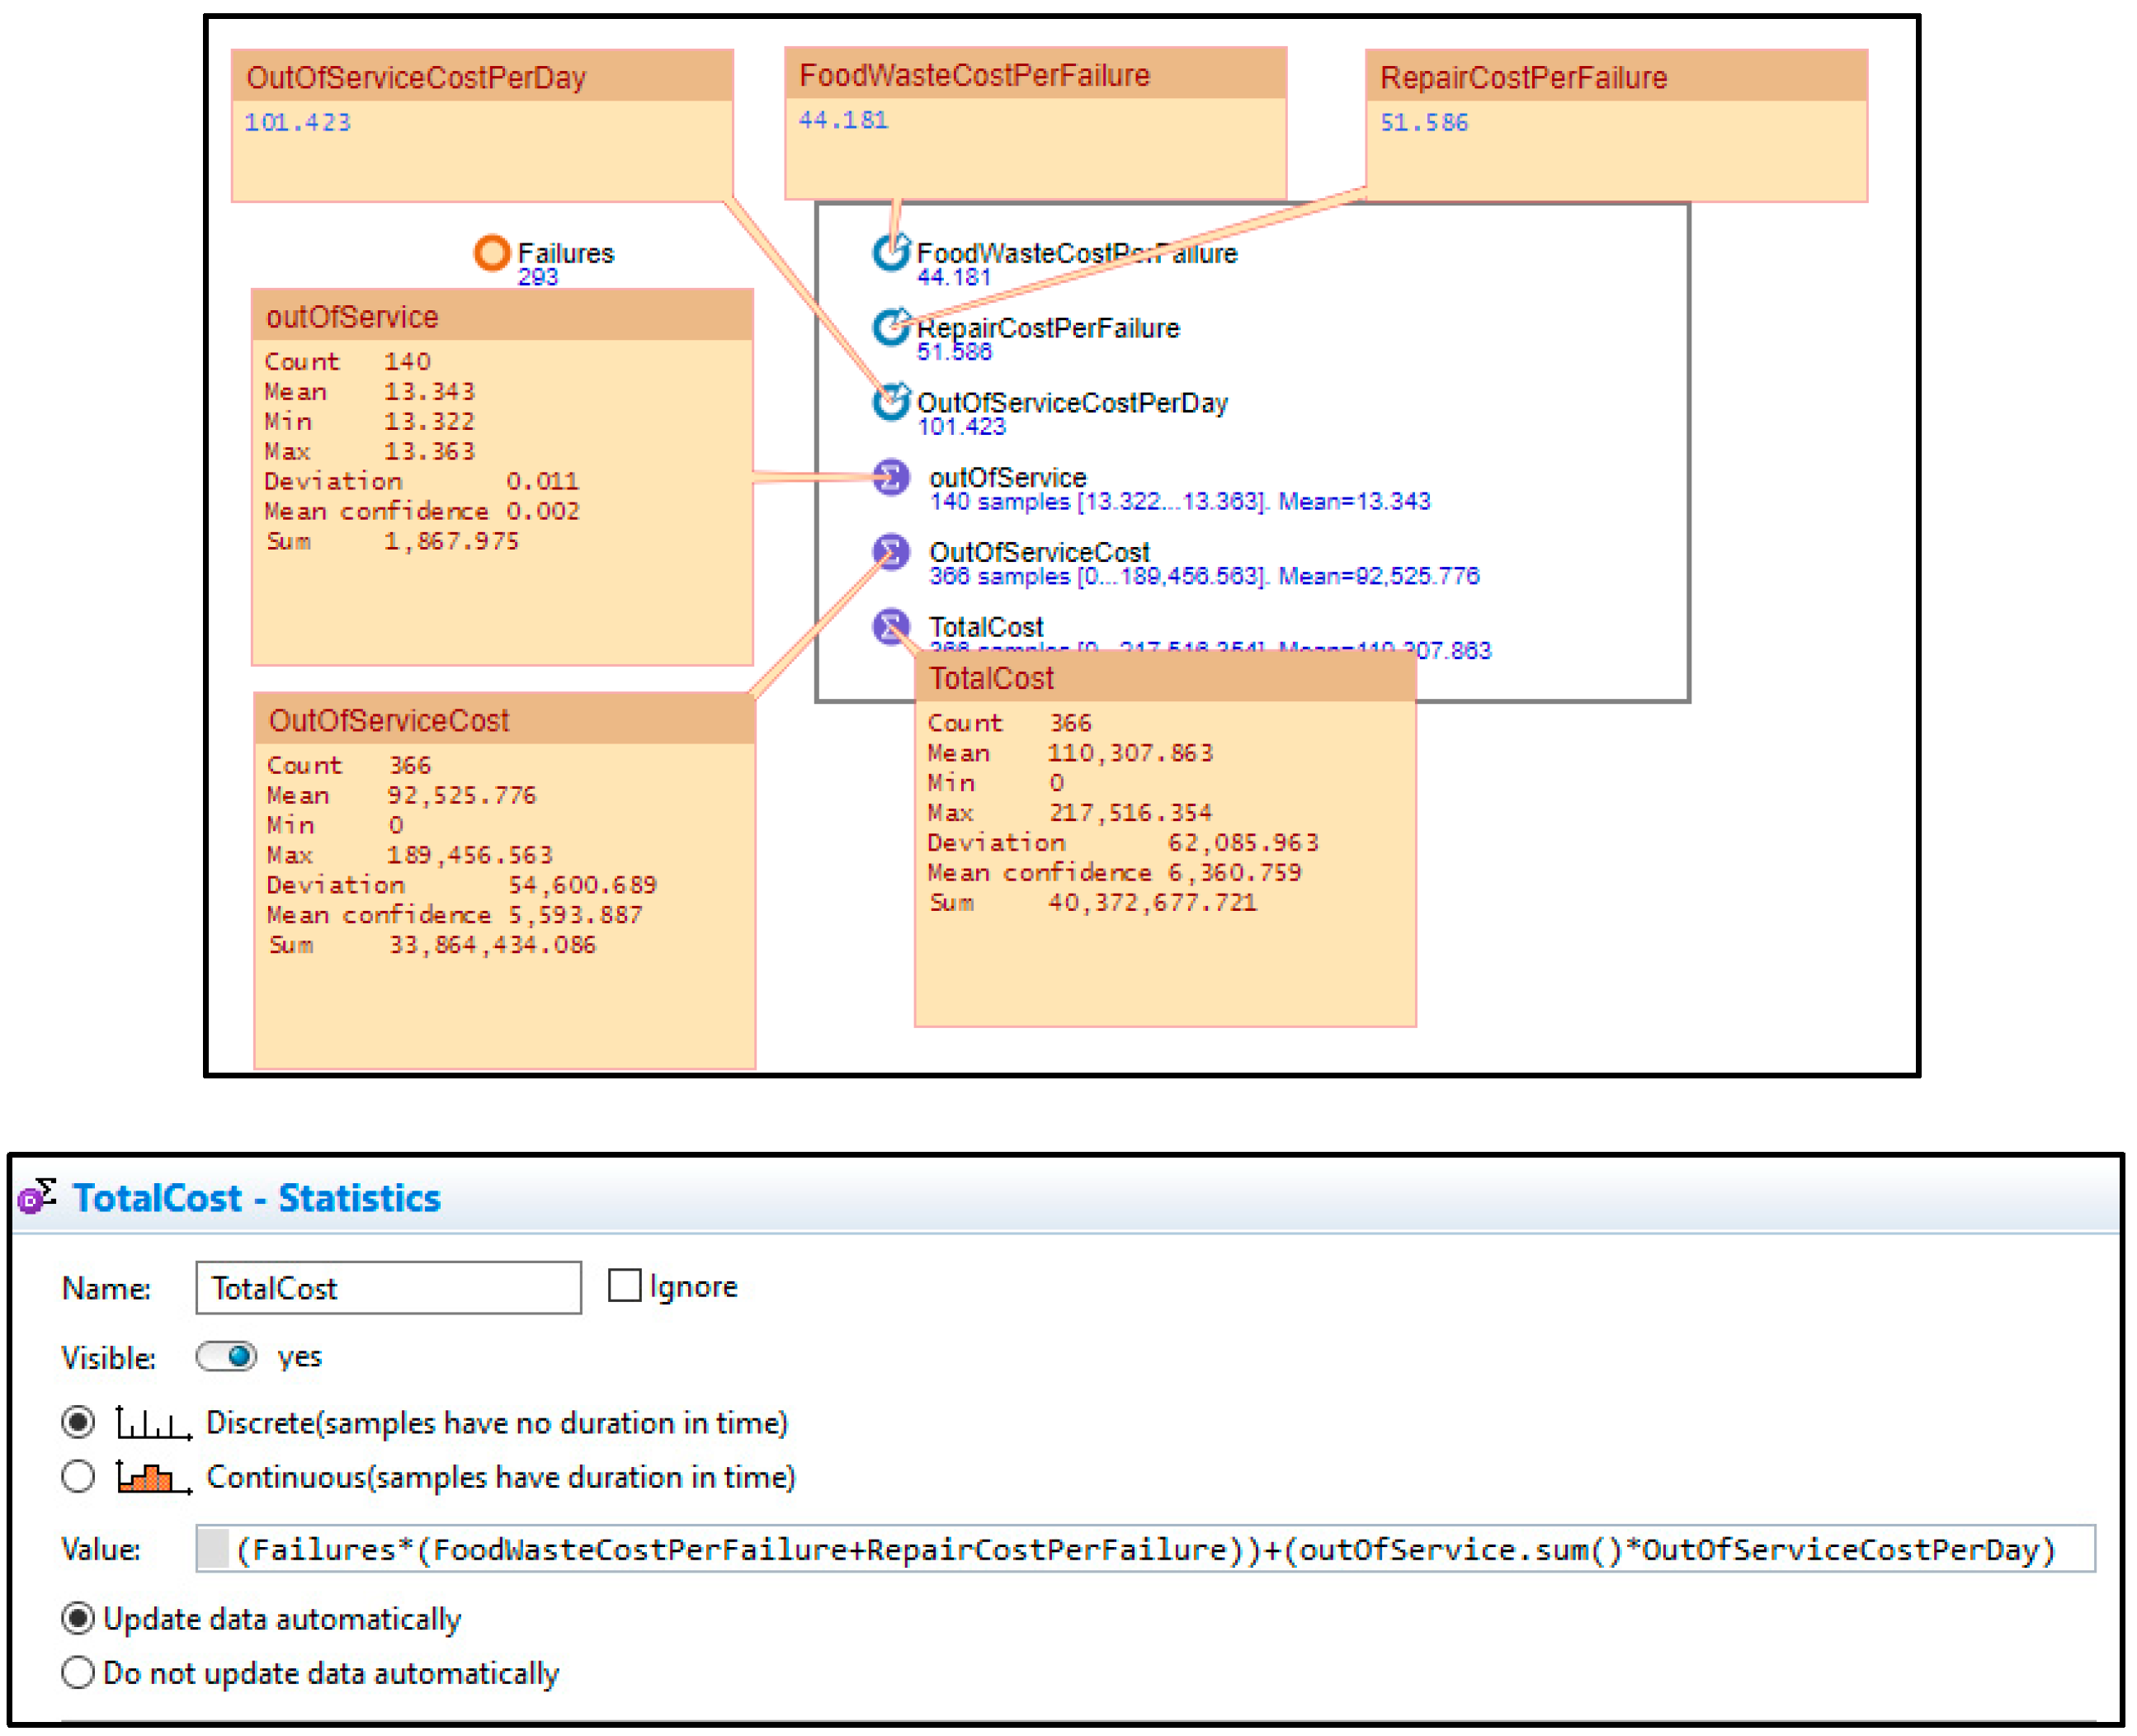
The initial results of the base case model of ABSM show an annual total cost of $217,516.354 ± $6360.759 due to 293 failed refrigerators and annual out of service cost of $189,456.975 ± $5593.887 (Figure 12).
3.3.1. Optimization Experiment
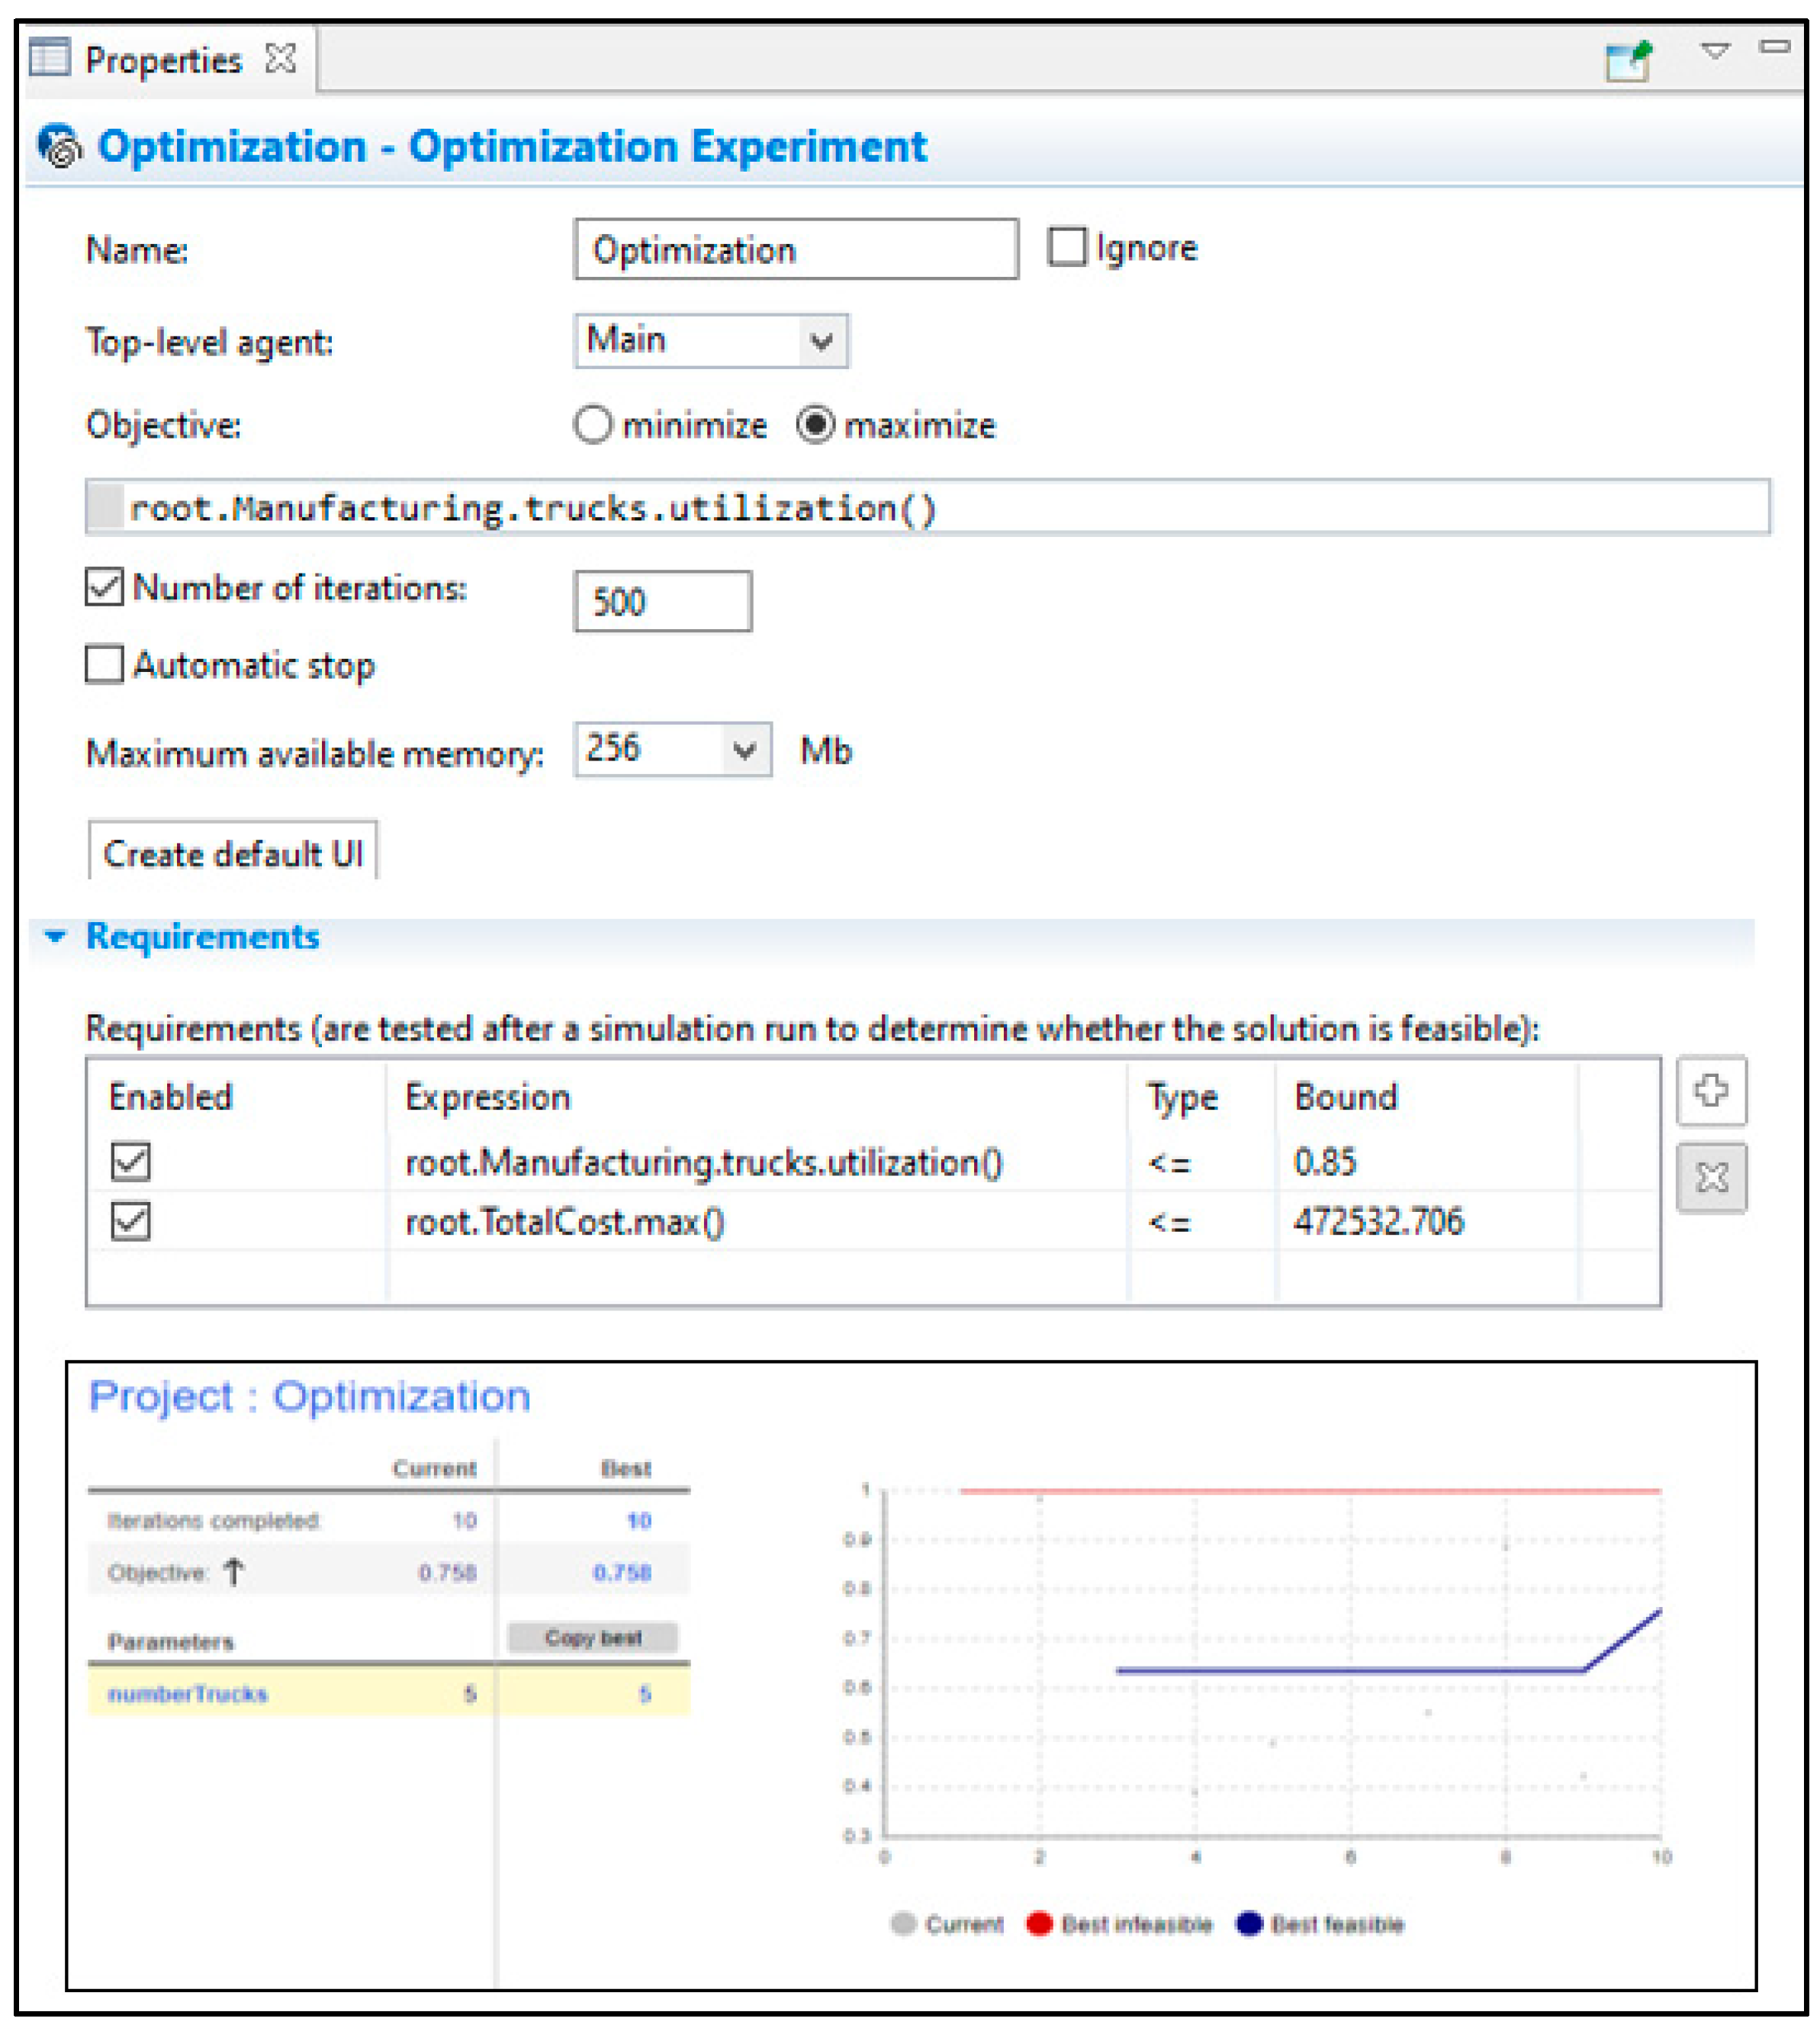
The best optimization of resources can be achieved by applying optimization techniques. Currently, the facility management operates ten trucks, and it was noticed that the utilization of the truck is low (39%). One of the problems that need to be solved is determining the ideal number of trucks. Since ABSM is valid with GIS functionality imbedded in AnyLogic software, this problem can be solved easily by conducting an optimization experiment (Figure 13). The management wants to maintain a targeted truck utilization of 85%. The optimization experiment result shows that the truck utilization of 76% can be reached by using five trucks only.
3.3.2. What-If Scenarios
Different scenarios can be applied to understand system behaviors. For example, two scenarios were chosen to understand the effect of the delay in the repair. Scenario 1 in Table 3 shows a reduction of the annual total cost by 0.91%. The out of service cost is minimized by 1.06%, and the out of service time is reduced by 19 days when the repair delay is decreased to half. Scenario 2, in the same table, shows that the annual total cost is reduced by 4.26%, the out of service cost is minimized by 2.07%, and the out of service time is reduced by 38 days when there is no delay in the repair process.
The facility aims to reduce the failure rate and its associated cost. One of the considered solutions is to invest in an IoT project by installing sensors on its 240 refrigerators to enable predictive maintenance capabilities. Multi-agent distributed simulation is used to test the economic feasibility by calculating the ROI of this project. This project requires the use of an intelligent sensing platform with routing abilities. Five IoT sensors need to be installed on each refrigerator to monitor its major components. Several potential sensors were assessed such as Libelium Waspmote and Genuino 1000. However, Wzzard sensing hardware was the most suitable platform in this case based on the facility’s IT team. In addition to that, the project requires an annual subscription to predictive analytics software. The facility expected that $550,000 would be the cost of such a project.
A total of 100 simulation runs were performed for 356 days to examine the full spectrum of simulation results. Table 4 presented the number of failed refrigerators corresponding to different failure reduction rates. These failure reduction rates were suggested by IoT experts. The goal of applying these scenarios is to expose the dynamics of change and use these insights to achieve workable solutions to the problem. Table 5 shows a significant reduction in the annual cost when the failure rate is improving (the facility suggests a response rate between 0.7 and 0.99 to respond to each refrigerator failure).
3.3.3. Financial Analysis
ROI can be defined by:
All costs in this study are discounted to the present value (PV). The facility suggests 12.8% as an annual discount rate. Table 6 illustrates how ROI was calculated with a 95% failure reduction rate and an 80% response rate.
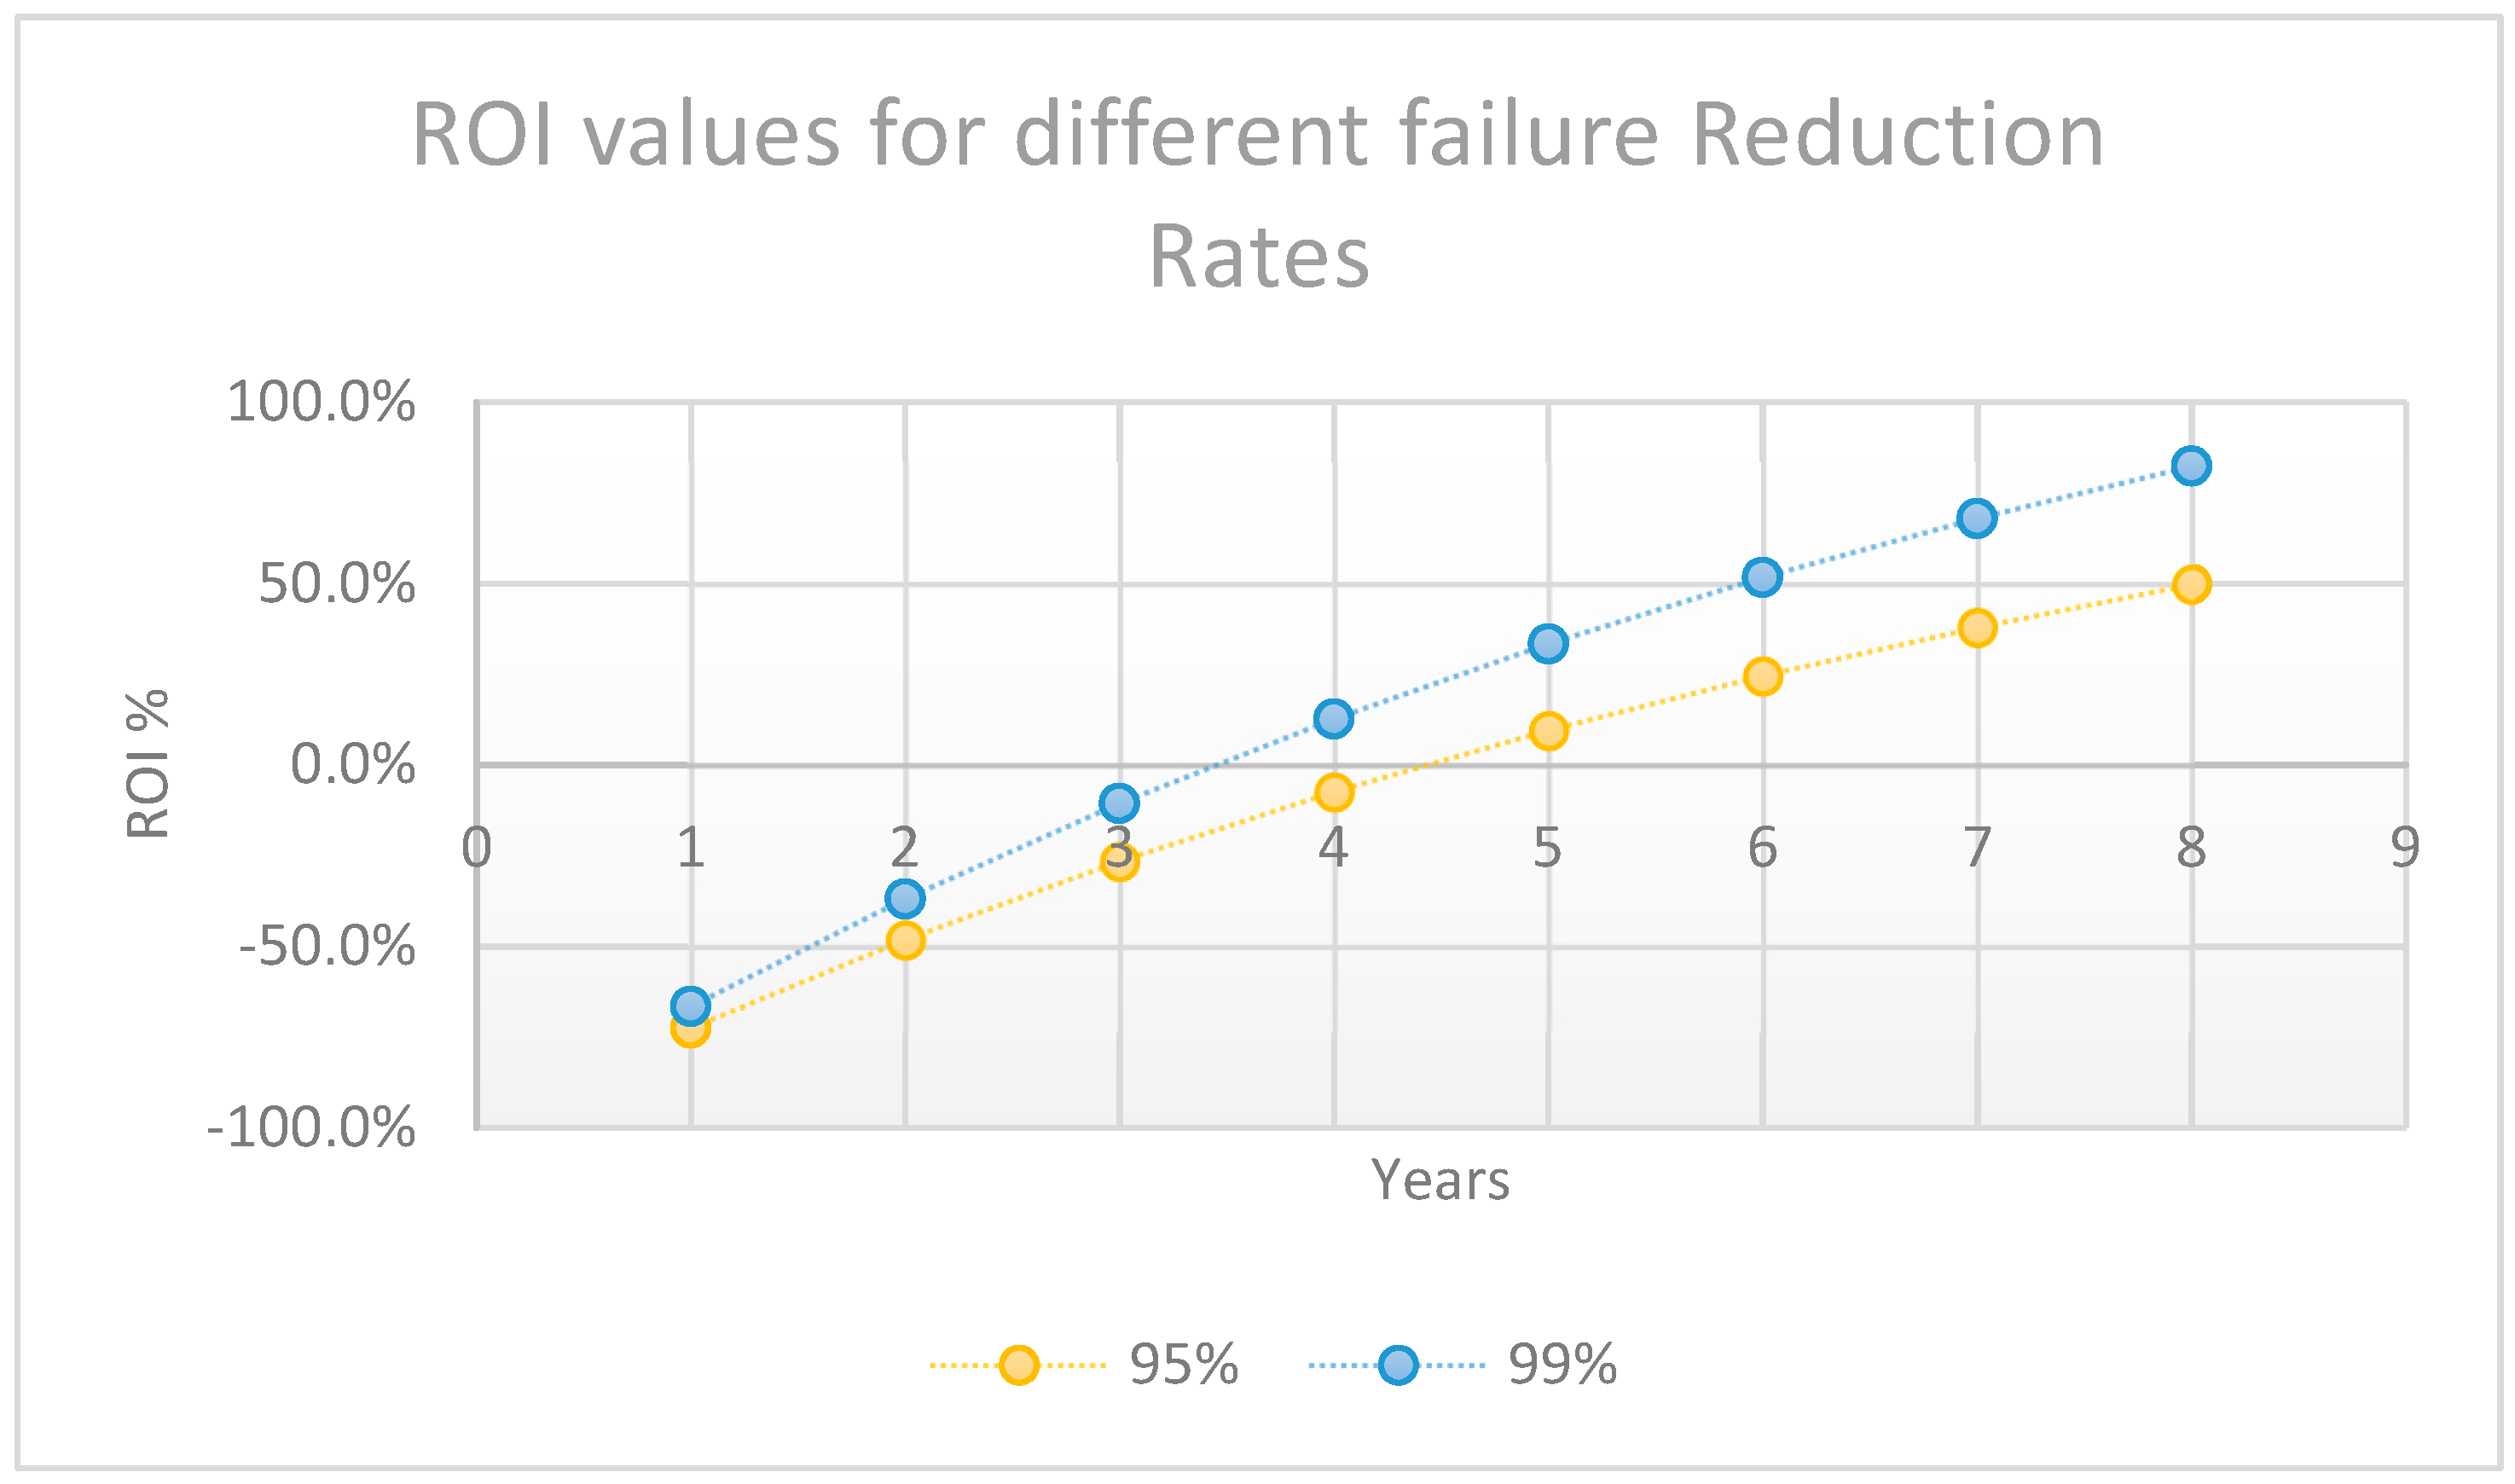
Table 7 and Figure 14 summarize the ROI values for different failure reduction rate with a facility response rate of 80%. Outputs show a positive ROI with a failure reduction rate of 0.95 achieves 9.5% in Year 5. In comparison, a failure reduction rate of 0.99 shows a positive ROI of 12.7% as soon as Year 4 (disregarding the response rate of the facility).
4. Discussion and Conclusions
The ABSM outputs suggest that the presented application of the IoT Intelligent Sensing Platform, which allows the predictive maintenance capabilities, would realize a positive ROI between Years 4 and 5 relying on the failure reduction rate of the predictive maintenance tactic. As for practical implementation, this study proposes that ABSM is a practical tool for facility management. It is vital to evaluate the IoT execution, assess its feasibility, and reduce its associated risks. Additionally, as skilled expert with the required technical and administrative skills, managers can use the ABSM outputs to address the ROI uncertainty as it is one of the main obstacles of IoT adoption.
One of the limitations of this study is that the current failure rates of the refrigerator are based on a fresh historical data, and it might not be applicable in the near future. Moreover, the likelihood of replacing the sensors is not considered. Future research work should combine numerous perceptions from software engineering, manufacturing engineering, and computer science. This combination would help in conveying the experience and designing a strong artificial intelligence structure that can be combined with ABSM.
Funding
This research received no external funding.
Conflicts of Interest
The authors declare no conflict of interest.
References
- Xu, L.D.; He, W.; Li, S. Internet of Things in Industries: A Survey. IEEE Trans. Ind. Inform. 2014, 10, 2233–2243. [Google Scholar] [CrossRef]
- Lee, I.; Lee, K. The Internet of Things (IoT): Applications, investments, and challenges for enterprises. Bus. Horiz. 2015, 58, 431. [Google Scholar] [CrossRef]
- Basingab, M. Investigating The Adoption of Internet of Things Technology Using Agent-Based Simulation. In Proceedings of the International Conference on Industrial Engineering and Operations Management, Bangkok, Thailand, 5–7 March 2019. [Google Scholar]
- Brous, P.; Janssen, M.; Herder, P. The dual effects of the Internet of Things (IoT): A systematic review of the benefits and risks of IoT adoption by organizations. Int. J. Inf. Manag. 2020, 51, 101952. [Google Scholar] [CrossRef]
- Gunasekaran, A.; Subramanian, N.; Tiwari, M.K.; Yan, B.; Yan, C.; Ke, C.; Tan, X. Information sharing in supply chain of agricultural products based on the Internet of Things. Ind. Manag. Data Syst. 2016. [Google Scholar] [CrossRef]
- Rezaei, M.; Shirazi, M.A.; Karimi, B. IoT-based framework for performance measurement. Ind. Manag. Data Syst. 2017. [Google Scholar] [CrossRef]
- Fang, C.; Liu, X.; Pei, J.; Fan, W.; Pardalos, P.M. Optimal production planning in a hybrid manufacturing and recovering system based on the internet of things with closed loop supply chains. Oper. Res. 2016, 16, 543–577. [Google Scholar] [CrossRef]
- Pan, F.; Shen, F. Fresh Produce Supply Chain Optimization of Our Country Based on the Internet of Things. Manag. Eng. 2011, 4, 19. [Google Scholar]
- Yan, B.; Wu, X.-h.; Ye, B.; Zhang, Y.-w. Three-level supply chain coordination of fresh agricultural products in the Internet of Things. Ind. Manag. Data Syst. 2017. [Google Scholar] [CrossRef] [Green Version]
- Aljumaili, M.; Wandt, K.; Karim, R.; Tretten, P. eMaintenance ontologies for data quality support. J. Qual. Maint. Eng. 2015, 21, 358–374. [Google Scholar] [CrossRef]
- Parpala, R.C.; Iacob, R. Application of IoT concept on predictive maintenance of industrial equipment. In Proceedings of the MATEC Web of Conferences, Sibiu, Romania, 7–9 June 2017; Volume 121, p. 02008. [Google Scholar]
- Plaza, S.; Ortega, M.; Celaya, A.; Sanchez, J.A.; De Lopez Lacalle, L.N.; Lzquierdo, B. About the importance of simulation tools in the learning process of metal forming and moulding. Mater. Sci. Forum 2011, 692, 1–7. [Google Scholar] [CrossRef]
- Ahmed, R.; Robinson, S. Modelling and simulation in business and industry: Insights into the processes and practices of expert modellers. J. Oper. Res. Soc. 2014, 65, 660–672. [Google Scholar] [CrossRef]
- Wintersim.org. Winter Simulation Conference. 2014. Available online: http://www.wintersim.org/2014/bigdataanalytics.html (accessed on 11 November 2020).
- Staff, W. Modeling and simulation in the big data era. UPI Space Daily. 15 June 2014. Available online: https://www.spacedaily.com/reports/Modeling_and_simulation_in_the_big_data_era_999.html (accessed on 11 November 2020).
- Laghari, S.; Niazi, M.A. Modeling the internet of things, self-organizing and other complex adaptive communication networks: A cognitive agent-based computing approach. PLoS ONE 2016, 11, e0146760. [Google Scholar] [CrossRef] [PubMed]
- Savaglio, C.; Ganzha, M.; Paprzycki, M.; Bădică, C.; Ivanović, M.; Fortino, G. Agent-based Internet of Things: State-of-the-art and research challenges. Future Gener. Comput. Syst. 2020, 102, 1038–1053. [Google Scholar] [CrossRef]
- Fortino, G.; Guerrieri, A.; Russo, W.; Savaglio, C. Integration of agent-based and cloud computing for the smart objects-oriented IoT. In Proceedings of the 2014 IEEE 18th International conference on Computer Supported Cooperative Work in Design (CSCWD), Hsinchu, Taiwan, 21–23 May 2014; pp. 493–498. [Google Scholar]
- Bernstein, S.L.; Verghese, V.; Leung, W.; Lunney, A.T.; Perez, I. Development and validation of a new index to measure emergency department crowding. Acad. Emerg. Med. 2003, 10, 938–942. [Google Scholar] [CrossRef]
- Dugdale, J.; Moghaddam, M.T.; Muccini, H. Agent-based Simulation for IoT Facilitated Building Evacuation. In Proceedings of the 2019 International Conference on Information and Communication Technologies for Disaster Management (ICT-DM), Paris, France, 18–20 December 2019; pp. 1–8. [Google Scholar]
- Batool, K.; Niazi, M.A. Modeling the internet of things: A hybrid modeling approach using complex networks and agent-based models. Complex Adapt. Syst. Modeling 2017, 5, 4. [Google Scholar] [CrossRef] [Green Version]
- Suryanarayanan, V.; Theodoropoulos, G.; Lees, M. PDES-MAS: Distributed simulation of multi-agent systems. Procedia Comput. Sci. 2013, 18, 671–681. [Google Scholar] [CrossRef] [Green Version]
- Weyns, D.; Van Dyke Parunak, H.; Michel, F. Environments for Multi-Agent Systems II; Springer: Berlin/Heidelberg, Germany, 2006. [Google Scholar]
- North, M.; Macal, C.; Pieper, G.; Drugan, C. Agent-Based Modeling and Simulation for EXASCALE Computing; Argonne National Lab (ANL): Argonne, IL, USA, 2008. [Google Scholar]
- Kennedy, C.; Theodoropoulos, G.; Sorge, V.; Ferrari, E.; Lee, P.; Skelcher, C. Data driven simulation to support model building in the social sciences. J. Algorithms Comput. Technol. 2011, 5, 561–581. [Google Scholar] [CrossRef] [Green Version]
- Anderson, J. A generic distributed simulation system for intelligent agent design and evaluation. In Proceedings of the Tenth Conference on AI, Simulation and Planning, AIS-2000, Society for Computer Simulation International; Springer: Berlin/Heidelberg, Germany, 2000; pp. 36–44. [Google Scholar]
- Schattenberg, B.; Uhrmacher, A.M. Planning agents in JAMES. Proc. IEEE 2001, 89, 158–173. [Google Scholar] [CrossRef]
- Gasser, L.; Kakugawa, K. MACE3J: Fast flexible distributed simulation of large, large-grain multi-agent systems. In Proceedings of the First International Joint Conference on Autonomous Agents and Multiagent Systems: Part 2; Association for Computing Machinery: New York, NY, USA, 2002; pp. 745–752. [Google Scholar]
- Ferscha, A.; Tripathi, S.K. Parallel and Distributed Simulation of Discrete Event Systems; Wiley: Hoboken, NJ, USA, 1998. [Google Scholar]
- Fujimoto, R.M. Parallel discrete event simulation. Commun. ACM 1990, 33, 30–53. [Google Scholar] [CrossRef]
- Siebers, P.-O.; Macal, C.M.; Garnett, J.; Buxton, D.; Pidd, M. Discrete-event simulation is dead, long live agent-based simulation! J. Simul. 2010, 4, 204–210. [Google Scholar] [CrossRef]
- Dzaferagic, M.; Butt, M.M.; Murphy, M.; Kaminski, N.; Marchetti, N. Agent-Based Modelling Approach for Distributed Decision Support in an IoT Network. arXiv 2019, arXiv:1901.04585. [Google Scholar]
- Pogson, M.; Smallwood, R.; Qwarnstrom, E.; Holcombe, M. Formal agent-based modelling of intracellular chemical interactions. Biosystems 2006, 85, 37–45. [Google Scholar] [CrossRef] [PubMed]
- Benenson, I.; Martens, K.; Birfir, S. PARKAGENT: An agent-based model of parking in the city. Comput. Environ. Urban Syst. 2008, 32, 431–439. [Google Scholar] [CrossRef]
- Twomey, P.; Cadman, R. Agent-based modelling of customer behaviour in the telecoms and media markets. info 2002, 4, 56–63. [Google Scholar] [CrossRef] [Green Version]
- Douglas, C.C.; Lee, H.; Lee, W. A computational agent-based modeling approach for competitive wireless service market. In Proceedings of the 2011 International Conference on Information Science and Applications, Jeju Island, Korea, 26–29 April 2011; pp. 1–6. [Google Scholar]
- Tonmukayakul, A.; Weiss, M.B. An agent-based model for secondary use of radio spectrum. In Proceedings of the First IEEE International Symposium on New Frontiers in Dynamic Spectrum Access Networks DySPAN, Baltimore, MD, USA, 8–11 November 2005; pp. 467–475. [Google Scholar]
- Horváth, D.; Gazda, V.; Gazda, J. Agent-based modeling of the cooperative spectrum management with insurance in cognitive radio networks. Eurasip J. Wirel. Commun. Netw. 2013, 2013, 261. [Google Scholar] [CrossRef] [Green Version]
- Kano, T.; Yasui, K.; Mikami, T.; Asally, M.; Ishiguro, A. An agent-based model for interrelation between COVID-19 outbreak and economic activities. arXiv 2020, arXiv:2007.11988. [Google Scholar]
- Cuevas, E. An agent-based model to evaluate the COVID-19 transmission risks in facilities. Comput. Biol. Med. 2020, 103827. [Google Scholar] [CrossRef]
- Houston, C.; Gooberman-Hill, S.; Mathie, R.; Kennedy, A.; Li, Y.; Baiz, P. Case Study for the Return on Investment of Internet of Things Using Agent-Based Modelling and Data Science. Systems 2017, 5, 4. [Google Scholar] [CrossRef] [Green Version]
- Klügl, F. A validation methodology for agent-based simulations. In Proceedings of the 2008 ACM Symposium on Applied Computing, Ceara, Brazil, 16–20 March 2008; pp. 39–43. [Google Scholar]
Figure 1.
Survival function graph for refrigerator.

Figure 2.
Probability destitution for ref. failure rate.

Figure 3.
Statechart diagram.

Figure 4.
Class diagram.

Figure 5.
Sequence diagram.

Figure 6.
The structure of each agent in the agent-based simulation model (ABSM).

Figure 7.
The main level in ABSM.

Figure 8.
Discrete-event simulation (DES) model in the manufacturing agent.

Figure 9.
The hybrid system.

Figure 10.
Determine the out of service time in ABSM.

Figure 11.
Model animation.

Figure 12.
ABSM results.

Figure 13.
Optimization experiment and its results.

Figure 14.
ROI values for different reduction rates of failures.


Table 1.
Important attributes of agent and discrete model [31].
Table 1.
Important attributes of agent and discrete model [31].
| Agent-Based Models | DES Models |
|---|---|
| Bottom-up modeling approach | Top-down modeling approach |
| The concept of queue does not exist | Queue is a main element |
| The input distributions of the simulation are mostly based on subjective data or perceptions | The input distributions of the simulation are mostly based on objective data |
| Each agent in the model has its own control | One direction of control |
Table 2.
Simulation input parameters.
| # | Parameter | Value | Unit | Source |
|---|---|---|---|---|
| 1 | Refrigerator Failure Probability | Weibull (5.7, 0.044) | Rate/Year | Analysis of Failure Dataset |
| 2 | Refrigeration Repair Time | Uniform (2, 3) | Hour | Client |
| 3 | Response Rate to Failure | Uniform (0.7, 0.99) | Rate/Failure | Client |
| 4 | Number of Manufacturing Facility | 1 | Facility | Client |
| 5 | Number of store locations | 12 | Locations | Client |
| 6 | Average Refrigeration unit/Store | 20 | Refrigerators | Client |
| 7 | Number of Refrigeration units | 240 | Refrigerators | Client |
| 8 | Delay of the repair | Uniform (5, 10) | Hour | Client |
| 9 | Number of Trucks | 10 | Trucks | Client |
| 10 | Truck Speed | 70 | Km/hour | Client |
| 11 | Queue Capacity | 40 | Trucks | Client |
| 12 | Cost of Repair | Triangular (50, 60, 100) | $ | Client Refrigerators Specialist |
| 13 | Cost of food waste/Refrigerator | Triangular (20, 50, 150) | $ | Client Refrigerators Specialist |
| 14 | Cost of Out of Service/Refrigerator/Day | Triangular (20, 80, 100) | $ | Client Refrigerators Specialist |
| 15 | Distance between the Manufacturing Facility and each store | AnyLogic GIS | Km | AnyLogic GIS |
| # | Store | Longitude | Latitude | |
| 1 | Al Nahdi Warehouse, Al Nakheel, Jeddah, Makkah Al-Mukarramah Region, 23241, Saudi Arabia | 39.25031 | 21.51589 | |
| 2 | Al Nahdi Pharmacy, Abdul Rahman Al Sudairi Street, Jeddah, Makkah Al-Mukarramah Region, 23437, Saudi Arabia | 39.15542 | 21.59468 | |
| 3 | Al Nahdi, Ahmad Al Attas st. Street, Jeddah, Makkah Province, 23424, Saudi Arabia | 39.13148 | 21.59764 | |
| 4 | Al Nahdi Pharmacy, Ali Al-Murtada St., Jeddah, Makkah Province, 21589, Saudi Arabia | 39.23951 | 21.51747 | |
| 5 | Al Sudais Pharmacy, Ahmed Ibrahim Al Tibi, Jeddah, Makkah Al-Mukarramah Region, 21589, Saudi Arabia | 39.23941 | 21.51284 | |
| 6 | Al Nahdi Pharmacy, Bani Malik Street, Historic Jeddah, Jeddah, Al-Mabahith Roundabout, Saudi Arabia | 39.23009 | 21.52764 | |
| 7 | Al Nahdi Pharmacy, Umm Al Muminin Safia, Jeddah, Makkah Al Mukarramah Region, Saudi Arabi | 39.22284 | 21.51971 | |
| 8 | Al Nahdi Pharmacy, Abi Al-Abbas Al-Hadithi, Historic Jeddah, Jeddah, Makkah Al-Mukarramah Region, 21589, Saudi Arabia | 39.22615 | 21.51232 | |
| 9 | Al Nahdi Pharmacy, Ba Khashab st. Bakhashab Street, Jeddah, Makkah Al-Mukarramah Region, 22331, Saudi Arabi | 39.21296 | 21.48603 | |
| 10 | Al Nahdi Pharmacy, King Khalid Street, Al Qurayyat, Makkah Al Mukarramah Region, 22331, Saudi Arabia | 39.20554 | 21.482 | |
| 11 | Al Nahdi Pharmacy, Al Matar st. Airport Street, Jeddah, Makkah Al-Mukarramah Region, 16992, Saudi Arabia | 39.19677 | 21.49728 | |
| 12 | Al Nahdi Pharmacy, Abu Ubaidah bin Al Jarrah, Jeddah, Makkah Al-Mukarramah Region, 22238, Saudi Arabia | 39.1974 | 21.49167 | |
| 13 | Al Nahdi Pharmacy, Old Makkah Road, Historical Jeddah, Jeddah, Makkah Al Mukarramah Region, 22331, Saudi Arabia | 39.20527 | 21.48507 | |
Table 3.
The result summary of Scenario 1 and Scenario 2.
| Annual Total Cost | The Out of Service Cost | The Out of Service Time Reduced By | |
|---|---|---|---|
| Scenario 1 | $215,545.142 | $187,485.351 | 19 days |
| Scenario 2 | $208,276.813 | $185,516.657 | 38 days |
Table 4.
Number of failed refrigerators corresponding to different failure rates.
| Failure Reduction Rate By | Failed Refrigerators |
|---|---|
| 80% | 144 |
| 85% | 106 |
| 90% | 76 |
| 95% | 33 |
| 99% | 7 |
Table 5.
The average annual cost for the different rates of failures and responses.
| Response Rate | |||||
|---|---|---|---|---|---|
| Failure Rate Reduction | 70% | 80% | 85% | 90% | 95% |
| 80% | $189,811.623 | $189,439.906 | $189,254.051 | $189,068.194 | $188,885.337 |
| 85% | $142,182.738 | $141,903.953 | $141,764.56 | $141,625.167 | $141,485.665 |
| 90% | $103,206.331 | $103,003.578 | $102,902,201 | $102,800.825 | $102,793.021 |
| 95% | $47,171.959 | $47,079.03 | $47,032.566 | $46,986.102 | $46,939.638 |
| 99% | $10,006.472 | $9986.76 | $976.904 | $9967.048 | $9957.192 |
Table 6.
Return of investment (ROI) calculation (95% failure reduction rate and 80% response rate).
| Year | 0 | 1 | 2 | 3 | 4 | 5 | 6 |
|---|---|---|---|---|---|---|---|
| Cost Saving | - | $170,483.79 | $170,483.79 | $170,483.79 | $170,483.79 | $170,483.79 | $170,483.79 |
| PV (Cost Saving) | - | $151,138.11 | $133,987.69 | $118,783.41 | $105,304.44 | $93,355.00 | $82,761.53 |
| Total PV (Cost Sav.) | $151,138.11 | $285,125.80 | $403,909.21 | $509,213.65 | $602,568.65 | $685,330.17 | |
| Investment | $550,000 | ||||||
| PV(Investment) | $550,000 | ||||||
| ROI | −72.5% | −48.2% | −26.6% | −7.4% | 9.5% | 24.6% |
Table 7.
Summary of annual cost savings and multi-year ROI for different rates.
| Facility Response Rate = 0.80 | ROI Values | ||||||||
|---|---|---|---|---|---|---|---|---|---|
| Reduction rates of failures | Annual cost-simulation result | 1 | 2 | 3 | 4 | 5 | 6 | 7 | 8 |
| 0.95 | $47,079.03 | −72.5% | −48.2% | −26.6% | −7.4% | 9.5% | 24.6% | 37.9% | 49.7% |
| 0.99 | $9,986.76 | −66.5% | −36.9% | −10.6% | 12.7% | 33.4% | 51.7% | 67.9% | 82.3% |
Publisher’s Note: MDPI stays neutral with regard to jurisdictional claims in published maps and institutional affiliations. |
© 2020 by the author. Licensee MDPI, Basel, Switzerland. This article is an open access article distributed under the terms and conditions of the Creative Commons Attribution (CC BY) license (http://creativecommons.org/licenses/by/4.0/).
Share and Cite
MDPI and ACS Style
Basingab, M. Distributed Simulation with Multi-Agents for IoT in a Retail Pharmacy Facility. Information 2020, 11, 527. https://0-doi-org.brum.beds.ac.uk/10.3390/info11110527
AMA Style
Basingab M. Distributed Simulation with Multi-Agents for IoT in a Retail Pharmacy Facility. Information. 2020; 11(11):527. https://0-doi-org.brum.beds.ac.uk/10.3390/info11110527
Chicago/Turabian StyleBasingab, Mohammed. 2020. "Distributed Simulation with Multi-Agents for IoT in a Retail Pharmacy Facility" Information 11, no. 11: 527. https://0-doi-org.brum.beds.ac.uk/10.3390/info11110527
Note that from the first issue of 2016, this journal uses article numbers instead of page numbers. See further details here.