Article

Semantically-Aware Retrieval of Oceanographic Phenomena Annotated on Satellite Images

1
Department of Geography, University of the Aegean, GR-81100 Mytilene, Greece
2
Department of Computer Science, University of Bari Aldo Moro, I-70126 Bari, Italy
3
Laboratory of Remote Sensing, Department of Topography, School of Rural, Surveying and Geomatics Engineering, National Technical University of Athens, GR-15780 Zografou, Greece
4
Department of Marine Sciences, University of the Aegean, GR-81100 Mytilene, Greece
*
Author to whom correspondence should be addressed.
Submission received: 25 June 2021 / Revised: 30 July 2021 / Accepted: 5 August 2021 / Published: 11 August 2021
(This article belongs to the Special Issue Information Retrieval, Recommender Systems and Adaptive Systems)

Abstract

:
Scientists in the marine domain process satellite images in order to extract information that can be used for monitoring, understanding, and forecasting of marine phenomena, such as turbidity, algal blooms and oil spills. The growing need for effective retrieval of related information has motivated the adoption of semantically aware strategies on satellite images with different spatio-temporal and spectral characteristics. A big issue of these approaches is the lack of coincidence between the information that can be extracted from the visual data and the interpretation that the same data have for a user in a given situation. In this work, we bridge this semantic gap by connecting the quantitative elements of the Earth Observation satellite images with the qualitative information, modelling this knowledge in a marine phenomena ontology and developing a question answering mechanism based on natural language that enables the retrieval of the most appropriate data for each user’s needs. The main objective of the presented methodology is to realize the content-based search of Earth Observation images related to the marine application domain on an application-specific basis that can answer queries such as “Find oil spills that occurred this year in the Adriatic Sea”.

1. Introduction

Coastal zones and oceans are the subjects of a vast and increasing number of studies whose purpose is to prevent or manage disasters, the sustainable management of coastal areas and oceans, and marine safety. Several studies develop Remote Sensing (RS) methods and techniques—such as processing of Earth Observation (EO) satellite images (indices, classifications, object-based image analysis, etc.), mathematical simulation models, and deep learning—for better monitoring, understanding, and forecasting natural or human-induced marine phenomena. Furthermore, these techniques are integrated with Geographic Information Systems (GIS) that allows the implementation of static, live or forecasting spatio-temporal analysis and the production of useful products like sea wind/waves, sea temperature, sea color, spatial distribution of the sea species, seasonal cycle of microorganisms (based on temperature, sunlight, currents, and presence of polluting species), oil spill detection etc. The growing interest in smart approaches for retrieving such information has motivated the development of a strategy for approaching the retrieval process of satellite images with different spatio-temporal and spectral characteristics semantically. The exploitation of semantic information derived from satellite imagery will provide ground for new smart products and applications and further promote satellite imagery.
Consequently, during the last few years, a line of research has been developed to support the users of remote sensing applications to retrieve satellite images with their annotated information in the simplest possible way, e.g., querying in natural language. The goal of such systems is to respond to queries like “Find the satellite images that contain turbidity phenomena around Lesvos this year”, helping users to retrieve the appropriate images for their specific needs or even alert them when a particular phenomenon occurs. The user queries could be related to the spatio-temporal distribution of specific phenomena, which can be identified on a satellite image, or concern certain spectral characteristics of appearances on the earth surface, which may be observable depending on the technical specifications of each satellite sensor. The big obstacle of this approach is the lack of specific and shared semantics about the content of satellite images, a problem known as the “semantic gap”. The semantic gap is defined according to Smeulders et al. [1], p. 1353, as “the lack of coincidence between the information that one can extract from the visual data and the interpretation that the same data have for a user in a given situation”. Therefore, the critical challenge is to connect the quantitative information of the satellite images with the qualitative (high-level user queries), store these connections in an appropriate knowledge base, and provide the most appropriate data for each user’s needs, enabling the retrieval of images based on semantically aware questions.
A straightforward strategy for bridging the gap between low-level image features and high-level queries consists in the adoption of Content-Based Image Retrieval (CBIR) approaches [1]. Especially Geographic Object Based Image Analysis (GEOBIA) is rapidly moving towards this direction. GEOBIA is a sub-discipline of Geographic Information Science devoted to developing automated methods to partition remote sensing imagery into meaningful image objects, and assessing their characteristics through spatial, spectral, and temporal scales, to generate new geographic information in GIS-ready format [2]. The term GEOBIA simply and elegantly distinguishes RS/GIS OBIA from other OBIA different disciplines, i.e., Biomedical Imaging, Astronomy, Microscopy, Computer Vision and others [2]. To translate spectral characteristics of image objects to real-world features, GEOBIA uses semantics based on descriptive assessment and knowledge, which means it incorporates “the wisdom of the user”. However, the diversity of users, from government agency experts to ordinary citizens, represents a significant challenge for effective information access and dissemination [3]. Therefore, it is better to use the combined interpretations of many experts, the “wisdom of crowds”, and to perform statistical analysis and likely correct interpretation and range of uncertainty before generating the semantics. The use of a shared conceptualization (vocabulary and semantics) and adopting a standard ontology language provides a mechanism for publishing representations of remote sensing images to be shared and reused among intelligent agents. Although formal ontologies do not necessarily improve the image analysis process in terms of classification accuracy (which the remote sensing community might consider a priority), their main asset is intra-domain, and inter-domain knowledge sharing and reuse [4]. One step further, the proposed agent-based image analysis (ABIA) introduces an integration framework whose aims are: (a) autonomously adapting rule sets and (b) image objects that can adapt and adjust themselves according to different imaging conditions and sensor characteristics [5]. Several works have demonstrated the GEOBIA potentials towards ontology-based image analysis [6,7,8,9] and co-authors of this work have also focused their research on the GEOBIA domain, especially for marine applications [10,11,12,13,14]. However, there is still much to be done to reach a common ground for content-based EO image analysis. Future research needs to transform GEOBIA databases into more comprehensive (web-enabled) geographic knowledge bases supporting knowledge discovery and analysis far beyond classic mapping [3]. This will facilitate the exploitation of the enormous amounts of information currently residing in images and image archives, transforming them into web-accessible value-added knowledge products [3]. Consequently, the realization of effective semantically-aware image annotation and retrieval strategy remains an open issue in the scientific literature.
In this work, we focus on an integrated process that: (a) extracts semantic knowledge from EO images, (b) models this knowledge using a geo-ontology for marine phenomena, and (c) applies question answering techniques on a semantically enabled knowledge base that allow users to express their needs and issue queries in natural language. Specifically, we develop automatic RS algorithms (mathematical modeling, classifications, indices, spectral matching, image segmentation, etc.), that extract information from the Sentinel 1, 2, and 3 satellites acquired daily. The algorithms annotate images with a set of pre-defined core marine phenomena (Chl-a, turbidity, oil-spills), but the system could be easily extended to support annotation of more marine phenomena and use images from other satellites as well. We define a marine phenomena ontology that semantically enriches the knowledge extracted from satellite images and serves as the basis for the knowledge base. Lastly, we adopt a methodology for realizing the content-based search and retrieval of images and phenomena by developing a Question Answering (QA) module that handles natural language queries, including a geocoding component for acquiring spatial entities’ coordinates. These components are integrated into a semantic web retrieval system for EO data, called in short SeMaRe (Semantic Marine Retrieval). The methodology presented in this paper has been initiated in the framework of a European Union’s Horizon 2020 research and innovation program under the Marie Sklodowska-Curie, namely SEO-DWARF (https://cordis.europa.eu/project/id/691071, accessed on 4 August 2021), and is a continuation of this work. Its main objective is to realize the content-based search of images related to the marine domain on an application-specific basis. Queries such as “Find satellite images that contain turbidity phenomena around Lesvos this year” would be answered by helping users retrieve the appropriate information for their specific needs.
The main innovative scope of this work is to bridge the gap between the raw information of satellite images and the knowledge gained from the marine domain to enable users to retrieve data that are relevant to their needs expressed by natural language queries. For this reason, we adopt a multidisciplinary approach where researchers in the marine domain provide knowledge and experience about their field, and ontology engineers capture the semantics on a marine phenomena ontology, and Natural Language Processing (NLP) experts integrate it in the SeMaRe search engine capable of performing natural language queries. The main contributions of this work are: (a) the development of algorithms for annotating EO images, (b) the formalization of the marine phenomena ontology, (c) the determination and implementation of the semantic queries for the application domain that realizes CBIR, and (d) the coordination of these components to design the architecture of the SeMare search engine that performs semantic storage, management, and retrieval of the extracted knowledge.
This paper is organized as follows. In Section 2, we present the related work on the three axes of this work, i.e., remote sensing algorithms for annotating satellite images with marine-related phenomena, modeling of the marine domain related knowledge using ontologies, and semantically enabled retrieval systems for satellite images. In Section 3, we present the RS algorithms for the annotation of marine-related phenomena, the SeMarRe ontology that supports the semantic representation of the domain, and the adopted question answering techniques for handling natural language queries. In Section 4, we present the implementation of the proposed methodology on the integrated semantic web retrieval system for EO data. In Section 5, we evaluate the retrieval accuracy and the query performance of the method. In Section 6, we conclude this paper with a discussion on the evaluation results and pointers for future work.

2. Background & Related Work

This section consists of three parts. Section 2.1 introduces the examined categories of marine phenomena, namely, turbidity, algal blooms and oil spills, and presents for each the main RS approaches for phenomena annotation on EO images. Section 2.2 presents existing ontologies for modelling the marine domain. Section 2.1 and Section 2.2 provide the necessary background material for the RS methods and the ontology implemented in this work. Section 2.3 presents state-of-the-art systems related to the semantically-aware image retrieval.

2.1. Marine Phenomena and Remote Sensing

In the SEO-DWARF project, several marine phenomena were examined and analyzed (i.e., hot-spots, upwelling, algal blooms, fronts, oil-spills, trophic status index, turbidity, winds, waves, shallow water bathymetry, coastal habitat mapping). In this work, we focus on: (a) turbidity, (b) algal blooms (estimated by Chl-a concentration), and (c) oil-spill detection.

2.1.1. Turbidity

Turbidity describes the level of transparency of a liquid based on the presence of undissolved material. It is expressed as the optical property of a medium to scatter or absorb light instead of transmitting it straightly through the sample. Suspended sediment in water presents the main cause of water quality deterioration, and contaminated water may cause significant health issues. Turbidity measurements are therefore used in many fields to estimate the concentration of suspended material in a sample [15]. The concentration and character of suspended sediments, phytoplankton, and dissolved organic matter affect the optical properties of water. Satellite sensors measure the water reflectance at different wavelengths, and their imagery can be used to estimate water optical properties. This is an advantageous method of measuring water quality, compared to ground sampling, because of the following reasons [16]: (a) its spatial coverage allows the estimation of water quality over large areas, (b) its global coverage allows the estimation of water quality in remote areas, and (c) the long record of archived imagery enables the estimation of water quality for time periods when no ground measurements are available. State of the art algorithms regarding the turbidity phenomenon are: (a) the method of Garaba et al. [17]—a derivation of turbidity algorithm using the 645nm band, (b) the method of Dogliotti et al. [18]—combines three main approaches: Red-NIR combination as ratio, Red based linear algorithm at 645 nm, and NIR based linear algorithm, and (c) the method of Nechad et al. [19] a calibrated algorithm using the 665 nm band.

2.1.2. Algal Blooms (Estimated by Chl-a Concentration)

Phytoplankton, also known as microalgae, are photosynthesizing microscopic organisms that inhabit the upper sunlit layer of almost all oceans and bodies of freshwater. In a complex light-dependent process, photosynthesis transfers absorbed photon energy to organic compounds [20]. A microalgae bloom is a rapid increase or accumulation in the population of algae (typically microscopic) in a water system. Remote sensing techniques, and in particular ocean color data, are extensively used to derive and monitor phytoplankton blooms [21,22,23,24]. There is a wide variety of operational ocean color satellite sensors and algorithms to assist in the detection and monitoring of phytoplankton blooms [21].
The seawater optical properties are mainly determined by phytoplankton, the concentration of which is approximated with Chl-a, color dissolved organic matter (CDOM), and suspended sediments [25]. These are the three main components that affect the ocean color and are used as a base for classifying the oceanic waters. One thing that should always be considered is the differences between Case 1 and Case 2 waters. As defined by Morel and Prieur [26], and Morel [27] Case 1 waters have their main optical properties determined by phytoplankton and are slightly influenced by particulate organic carbon and CDOM. On the other hand, Case 2 waters optical properties are dominated by substances (mineral particles, CDOM) changing independently of phytoplankton. Oceanographers have commonly used the Case 1 and Case 2 classifications to differentiate essentially open ocean and coastal waters, respectively, as per Dickey, Lewis, and Chang [28]. At this stage, our study is focused on the estimation of Chl-a from Sentinel-2 MSI data for the more complex Case 2 waters. Reflectance band-ratio algorithms are intensively used to retrieve chlorophyll concentrations and used for standard product computations. Empirical blue-green (440–550 nm) spectral band ratios are the most common ocean color algorithms used for Chl-a retrievals because most of the phytoplankton absorption occurs within this portion of the visible spectrum. However, the use of visible wavelengths can be unreliable in coastal waters. In optically complex Case 2 waters, blue-green reflectance band-ratios become less sensitive to changes in Chl-a concentrations because of increasing concentrations of CDOM and total suspended matter (TSM) (e.g., [29]). To overcome this limitation, other studies suggested the use of red-NIR band-ratios, empirical models, neural networks, and machine learning for Chl-a retrieval in coastal waters [30,31,32,33,34]. Most of the studies present encouraging but not very accurate results, and our experiments using Copernicus in-situ Chl-a data to assess the accuracy of some of the most common algorithms (C2RCC, ACOLITE OC2, etc.) showed that there is still work needed in this field.

2.1.3. Oil-Spill Detection

Effective and efficient monitoring of oil spills that originate from ships, offshore platforms, and any accident is of high importance from the view of public safety and environmental protection [35]. For radar systems, the primary backscattering mechanism in marine regions is surface roughness due to capillary waves [10]. Oil on the sea surface dampens the capillary waves, and in the radar image, these regions appear as ‘dark spots’. Several other phenomena have the attenuating effect on the capillary waves and thus also appear as slicks (‘look-alikes’) in radar images, such as natural films/slicks, grease ice, threshold wind speed areas (wind speed < 3 m/s), wind sheltering by land, rain cells, shear zones, internal waves, etc. [36,37]. Differentiation of actual spills from look-alikes is one of the main challenges in oil spill detection in Synthetic Aperture Radar (SAR) imagery. A common methodology for oil spill detection in SAR images is Object Based Image Analysis (OBIA) [37,38]. This approach consists of four main steps: Image pre-processing, segmentation, feature extraction, and post classification. In the framework of our former research program (SEO-DWARF), a new open-source method using OBIA has been developed for oil-spill detection using Sentinel-1 data [10].

2.2. Marine Domain Ontologies

Although much research has been conducted on the development of EO data ontologies to represent knowledge related to the Earth sciences and the marine domain [39,40,41,42,43], the provision of state-of-the-art ontologies is rare. One of the most notable projects that involve Earth and environmental aspects is SWEET (The Semantic Web for Earth and Environmental Terminology) [44]. It is promoted by NASA to improve the use of Earth science data in semantic applications. For this project, 200 separated ontologies were created, and more than 6000 concepts were subdivided into nine categories that cover aspects of space, time, earth realms, physical quantities, etc., and integrative science knowledge concepts (such as phenomena, events, etc.). The starting point of this ontology development was the collection of keywords in the NASA Global Change Master Directory that contains about 1000 controlled terms structured as a taxonomy. Moreover, other 20,000 terms, often synonymous with the previous, were extracted by free-text. The level of granularity used is high, and this group of ontologies can be seen as a group of top-level ontologies. For example, the term “air temperature” was not defined as a specific concept but only as a composition of “air” and “temperature” term. SWEET Ontologies are written in OWL 2 [45] and can be easily edited in Protégé after the download from the official project site [44], enabling thus its reuse in other ontologies.
European Environment Agency (EEA) is the driving force of a consortium of organizations that provide CORINE Land Cover methodology, technology, and data [46]. Land cover and land use in Europe are derived from satellite imagery, then classified and provided for download (as shapefiles) to the public. The classification is used to characterize areas, e.g., green urban areas, code 141. On top of the EEA maintained classification, an ontology is modeled [46]. This ontology is developed to cover the CORINE nomenclature. It is defined in three levels, which describe natural and artificial elements that can be visualized in a geographical image. Analyzing the ontology macroscopically, we can identify five classes: artificial areas, agricultural areas, forest, and semi-natural areas, wetlands, and water bodies. Marine waters are also described, such as oceanic and continental shelf waters, bays, and narrow channels, including sea lochs or loughs, fiords or fjords, rye straits, and estuaries. The ontology is written in OWL 2 [45], and it is available online for free download, use, and extension.
Koubarakis [47] proposed another ontology for EO images called DLR Ontology, which was developed to annotate TerraSAR-X images for the European project TELEIOS [48]. This ontology is different from the previous because it describes EO images and presents concepts about the image acquisition metadata. In particular, the following macro sections are described:
  • Image metadata: this section includes predicates that describe image properties. A small number of metadata are included, such as time and area of acquisition, sensor, image mode, incidence angle.
  • Elements of annotation: this section includes classes about patches, images, vectors used to describe an EO Image after the knowledge discovery step.
  • Concepts about the land cover: this section includes an object visible in an EO image such as agriculture areas, bare grounds, forests, transport areas, urban areas, water bodies.
The ontology is not very specific but covers macro-concepts that can be further specialized and extended for specific domain applications.
Ontologies proposed in [41,42,43] focus on the image interpretation process for coastal and ocean areas, while SWEET [44] and CORINE ontology [46] focus on a high level conceptualization of the Earth science domain. Our work is most similar to DLR [47], in the sense that they also develop an application-specific ontology that focuses on the retrieval process. In Section 3.2, we present a lightweight application-specific ontology for aiding marine phenomena image retrieval.

2.3. Semantic Image Retrieval

The necessity for content-based image retrieval (CBIR) techniques in remote sensing calls for new methodologies to match the information contained within images with the semantics of users’ queries. Related work focuses on techniques for hyperspectral remote sensing images [49], while in the EU-funded project TELEIOS, features are extracted from TerraSAR-X images and accompanied with image metadata and GIS data unfold their semantics [50]. The methodology in the work of Priti and Namita [51] is applied on multispectral images to different image processing and querying techniques. Object/Segment oriented techniques for relating low-level features of images and ontological concepts can be seen in Ruan et al. [52], Li and Bretschneider [53], Liu et al. [54], and Wang et al. [55]. In Datcu et al. [56], Li and Narayanan [57], Aksoy et al [58] the labeling process is applied to pixels. Tiede et al. [59] propose a system that allows performing queries to retrieve specific EO images. However, users have to express their information need using a particular user interface that allows specifying a list of filters. These works do not consider natural language as an interface for querying, limiting the use of the system to advanced users. With our work, we want to further enhance the users’ expressiveness, allowing them to perform queries using natural language, i.e., formulate a question like they are talking to another human being. To the best of our knowledge, this is the first work to implement a Question Answering (QA) system for marine related image retrieval.
Question Answering systems can be used to allow non-technical users to retrieve the information they are looking for even in restricted domain applications and currently represents one of the most advanced tasks topics in the field of Natural Language Processing. In fact, QA is an advanced form of information retrieval where the aim is to satisfy a user’s information need expressed through natural language, i.e., English. More specifically, QA as a discipline was born in the late sixties with the development of natural language interfaces for databases [60]. The birth of the semantic web [61] at the beginning of this century led to the development of several large open and closed domain ontologies, which are constantly being expanded like DBpedia [62] and Wikidata [63]. Exploiting QA systems to retrieve the information encapsulated within ontologies is nowadays one of the main challenges in the NLP research field: the QALD challenge [64] is the most well-known series of evaluation campaigns on open domain question answering over DBpedia. Even though the research in this field is now mainly focused on open domain QA systems, closed domain QA systems are still proposed in the literature. QUARK [65], GeoVAQA [66], and QUASAR [67] represent examples of QA systems in the geographical domain however they extract the information needed to formulate the answer from text documents. More recently, systems like [68,69,70,71] instead exploit the geographic information contained in well known knowledge bases like DBpedia, OpenStreetMap (https://www.openstreetmap.org/, accessed on 4 August 2021) and the GADM [72] dataset. Although working on geographic information, none of these systems allow to query ontologies containing such specific information about phenomena collected from EO satellite images.

3. Methodology

In this section, we present the underlying methodology of SeMaRe, which consists of the following parts: (a) the annotation of marine phenomena on EO images (Section 3.1), (b) the design of the marine domain ontology (Section 3.2), and (c) the question answering methodology for retrieving semantically enriched data (Section 3.3).

3.1. Annotation of Marine Phenomena

Marine phenomena are annotated on EO satellite images provided by Sentinel 1, 2, and 3. Each image is a raster file covering a geographic area on a specific timestamp and contains low-level information, which is exploited by RS algorithms to identify features or phenomena within the image. Different approaches and RS algorithms have been tested and evaluated for their accuracy and computational cost. Below, we describe the processing chain of the most efficient algorithm (in terms of achieving the best possible classification accuracy with the least computational cost) for each of the marine phenomena under consideration.

3.1.1. Turbidity

Based on the experimental results using in-situ data, we implemented the turbidity algorithm proposed by Dogliotti et al. [18] as it provides enhanced turbidity values. The ACOLITE processor (https://odnature.naturalsciences.be/remsem/software-and-data/acolite, accessed on 4 August 2021) has been used for this scope and was integrated into the processing system. Consulting oceanic domain experts, relevant to the marine phenomena considered in this work, it has been decided that the quantitative classes of Table 1 will be used for classifying turbidity phenomena into high level categories. The unit used for the turbidity classes is the Formazin Nephelometric Unit (FNU). Image pixel level of detail is contained in the exported geometries with only minor generalization for the correction of the output polygon topology. The polygon creation and generalization process consists of three steps, which are performed on the raster output of the ACOLITE processor: (1) using the GDAL (https://gdal.org/, accessed on 4 August 2021) sieve command with a size of 50, isolated pixels and very small areas are eliminated, (2) using the GDAL polygonize command the output geometries are created, and (3) a python script performs an erosion filtering process within a small buffer (20 pixels) to correct the output for overlapping polygons. The same process is applied to the raster output of Chl-a concentration as well.

3.1.2. Algal Blooms

A processing algorithm has been implemented for Chl-a concentration using Sentinel-2 images. After several experiments with various Chl-a estimation algorithms (MCI, OC2, OC3, C2RCC) and in-situ data, we decided that the system will use the blue/green ratio (OC2) algorithm of the ACOLITE processor. The default settings and the aerosol correction method of “Dark Spectrum Fitting” were chosen [73]. The diffuse attenuation coefficient at the wavelength of 490 nm was calculated using the Quasi-Analytical Algorithm (QAA) of Lee et al. [74]. It has been decided that the quantitative classes of Table 2 will be used for classifying Chl-a concentration into high level categories. Again, this has been done after consulting oceanic domain experts relevant to the marine phenomena considered in this work.

3.1.3. Oil-Spill Detection
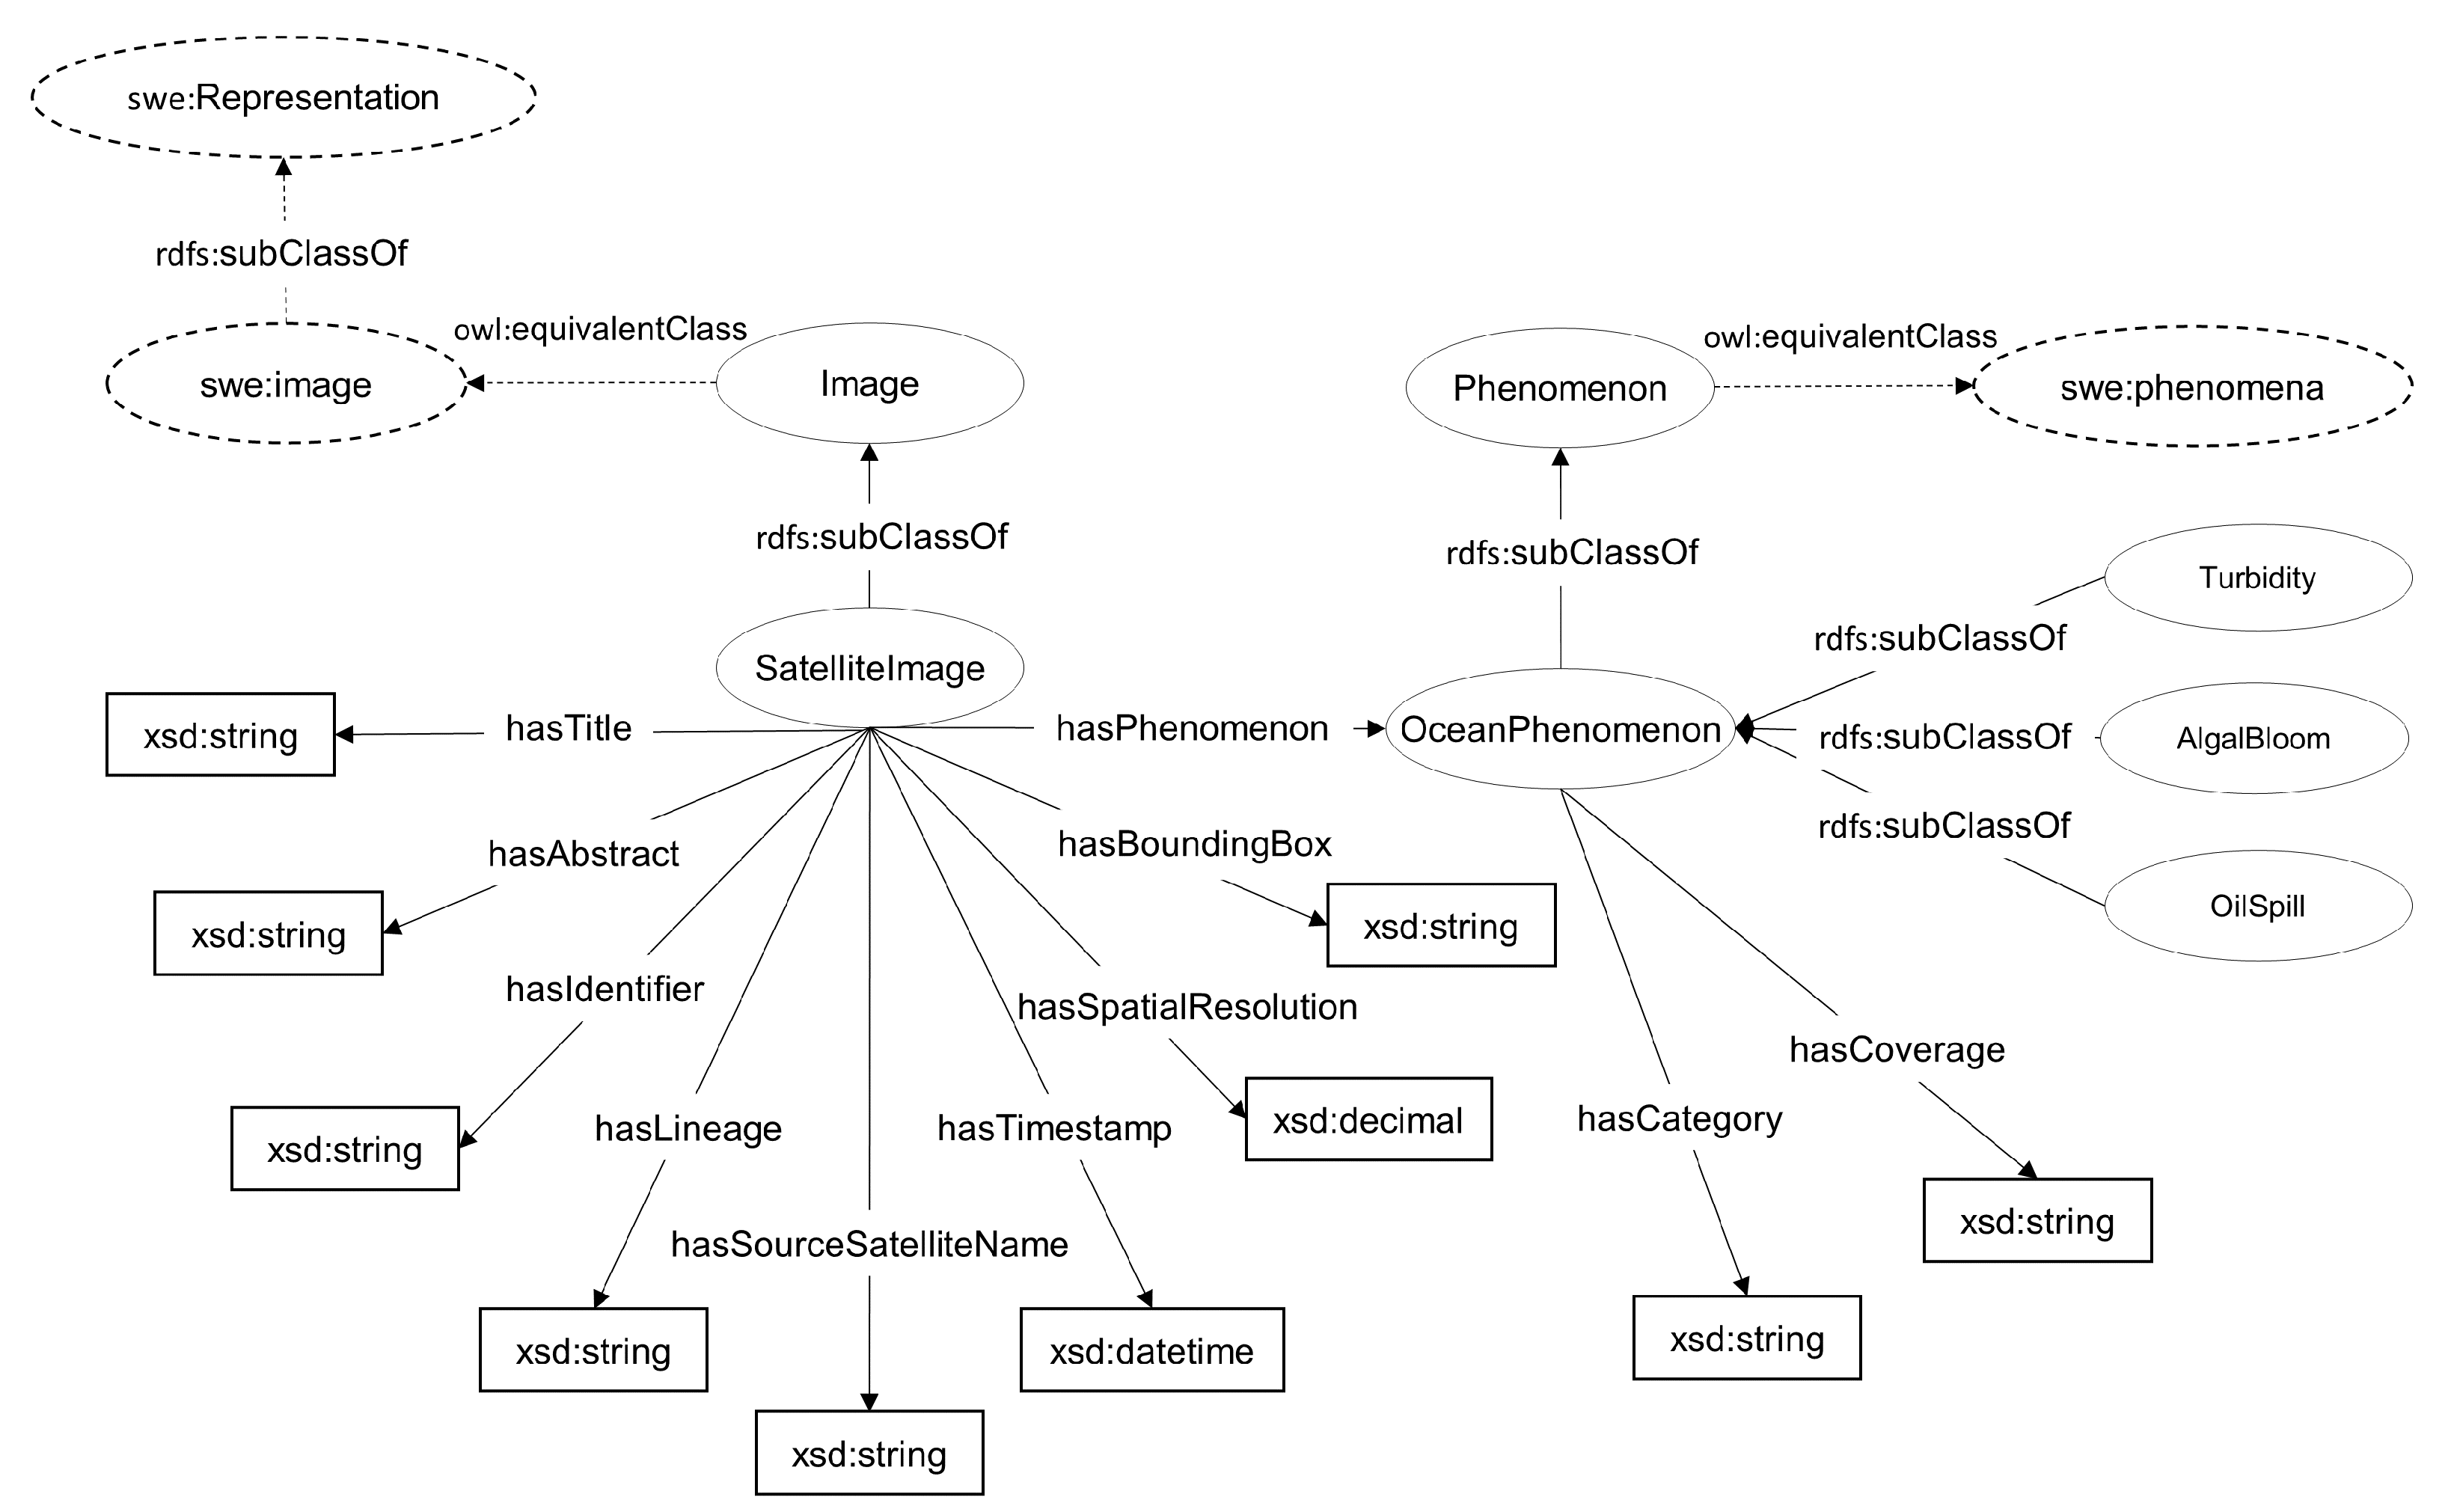
In the framework of the SEO-DWARF project, we developed a new open-source OBIA method for oil-spill detection using Sentinel-1 data. Initially, the Sentinel-1 images were pre-processed (land masking, noise reduction, etc.). Then, images were segmented in order to extract the dark spots and feed them into the classifier. After the image segmentation, the Orfeo Toolbox SVM vector classifier was trained based on the features extracted and separated the objects to possible oil spills and look-alikes. The method is fully described in [10]. The high level categories of Table 3 were used for the oil-spills, in accordance to the OBIA algorithm output. Although a look-alike category was included, it was not an active class in the system and was only used for experiments. This means that no metadata for look-alikes were stored in order not to overload the system with false oil-spill detections. Nevertheless, the look-alike category already exists and can be easily activated and processed in a future version of the system.

3.2. Ontology

In Section 2.2 we presented ontologies related to the marine domain. In this section, we first examine the possibility of adopting them in order to develop an application-level marine phenomena ontology. SWEET [44] ontology covers densely interconnected marine and landscape related concepts, which complicates the reuse of a particular branch of the entire ontology to formalize only the closed domain of marine application. Additionally, it does not refer to a specific application domain, and consequently, it needs to be specialized and adapted to the specific application. Nevertheless, the specialization cost is mitigated because most of the required information is fully covered. The complexity for future extensions is low, is frequently updated, and is supported by a large community of supporters. CORINE [46] is less detailed than SWEET, and the absence of formalization for many EO concepts can make the extension process for future applications laborious. DLR [47] has specific concepts for the application domain. It covers water and land concepts, and the three-level structure makes possible the extension or the specification of concepts. The main limitation is the difficulty accessing that ontology because it is private, and no future updates are confirmed. As a consequence of these considerations, it has been decided to develop a new lightweight marine phenomena ontology (called SeMaRe) that will facilitate the retrieval process and reuse top-level concepts from the NASA SWEET where possible.
To develop the marine phenomena ontology, we followed the Linked Open Terms (LOT) methodology initially proposed by Poveda Villal [75] and further developed by García-Castro et al. [76]. It guided us during all the steps of definitions of requirements and ontology development. The specialization of the marine phenomena concepts was approached through a top-down decomposition strategy with a conceptualization approach. We started from a general concept, and we specialized it where needed. Newly identified concepts were added to the SeMaRe ontology and linked with the appropriate relations (e.g., father-child) to the other SeMARe concepts. The conceptualization step refers to the identification of the concepts, which could be mapped with the SWEET ontology and other external sources, e.g., DBpedia. Concepts and properties defined in the SeMaRe ontology were distinguished with the namespace seo pointing at seodwarf.eu/ontology/v1.0/. It is important to notice that our specialization of the SWEET ontology was strictly related to the specific domain application and the algorithm used in the Question Answering (QA) module that would use it for semantic entailment. In particular, the QA module used the name of classes and relations to explore the semantic structure of the ontology and then find a path in it that could be considered the right candidate for answering user queries. This particular intended use of SeMaRe ontology forced us to diversify from the original hierarchy of the NASA SWEET ontology in some points, ignoring relations that were not useful for answering user queries. Moreover, in our ontology design, phenomena already existing in the SWEET ontology in some cases were redefined to accomplish the specific project goals.
We began the design of the SeMaRe ontology from the general concept of image (class seo:Image), which, for this application, was specialized in the concept of satellite image (class seo:SatelliteImage). The class seo:Image was linked with concept of image of the SWEET ontology located under the swe:representation class. The class seo:SatelliteImage had the following properties extending the INSPIRE Directive for spatial datasets metadata (https://inspire.ec.europa.eu/metadata/6541, accessed on 4 August 2021):
  • Title (property seo:hasTitle): the title assigned to the image.
  • Identifier (property seo:hasIdentifier): a unique identifier of the image.
  • Abstract (property seo:hasAbstact): textual description of the image.
  • Timestamp (property seo:hasTimeStamp): the date the image was acquired.
  • Lineage (property seo:hasLineage): contains textual information about the image, such as the process of its production.
  • Spatial Resolution (property seo:hasSpatialResolution): a resolution value for the image.
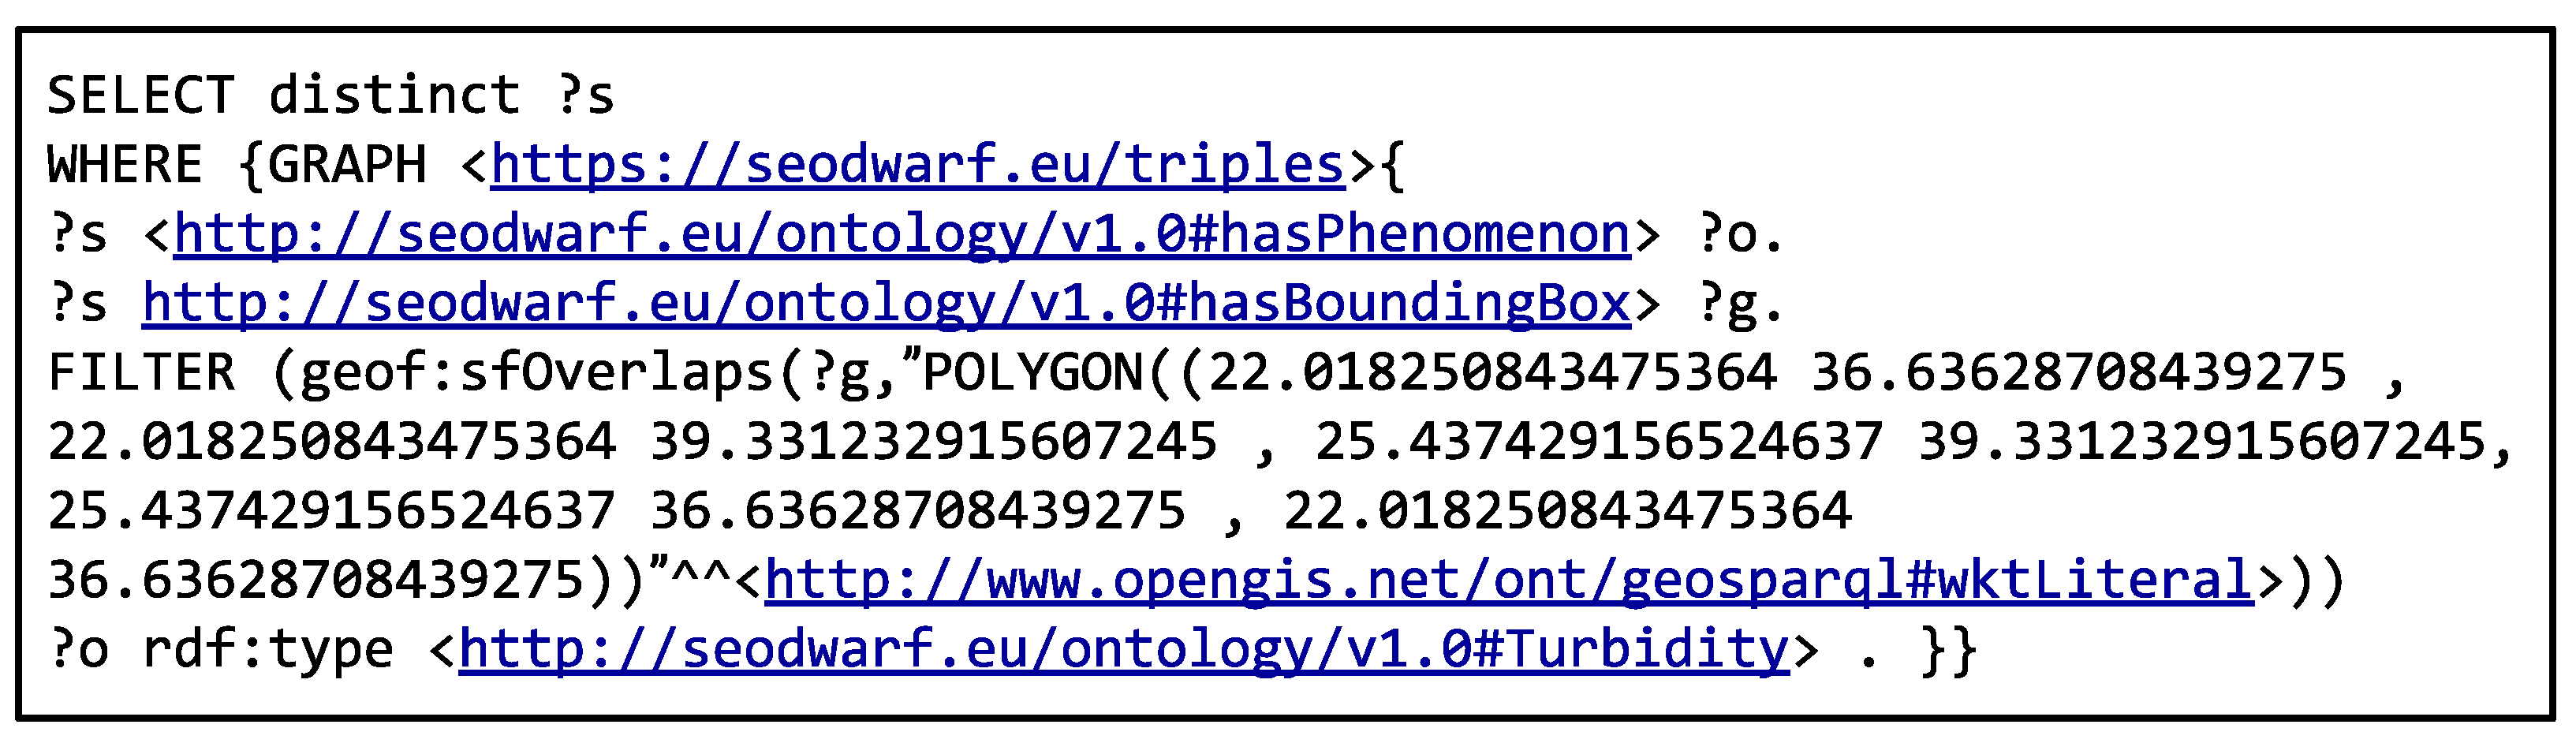
  • Bounding Box (property seo:hasBoundingBox): the spatial extent of the image in WKT (Well Known Text) format (https://www.ogc.org/standards/wkt-crs, accessed on 4 August 2021) using the WGS84 reference system.
  • Satellite of provenience (property seo:hasSourceSatelliteName): the name of the satellite that provides the image.
  • Phenomena (property seo:hasPhenomenon): a concept representing a phenomenon associated with the image.
The general concept phenomenon (class seo:Phenomenon) was specialized into the concept of ocean phenomenon (class seo:OceanPhenomenon) and each specific phenomenon was defined as an rdfs:subClassOf the seo:OceanPhenomenon acquiring all its shared properties. The class seo:Phenomenon was linked with a owl:equivalentClass relation with the phenomena concept (class swe:phenomena) of the SWEET ontology. We considered as a valid conceptualization of the following marine phenomena:
  • Turbidity (class seo:Turbidity): it refers to the cloudiness or haziness of a fluid caused by large numbers of individual particles. The concept is placed as subclass of seo:OceanPhenomenon and is linked with the SWEET ontology concept swe:turbidity current with an owl:equivalentClass relation.
  • Algal Bloom (class seo:AlgalBloom): it refers to the rapid increase or accumulation in the population of algae in a water system. The concept is placed as subclass of seo:OceanPhenomenon and is linked with the SWEET ontology concept swe:algal bloom with an owl:equivalentClass relation.
  • Oil Spill (class seo:OilSpill): it refers to areas where liquid petroleum is released into the environment, especially marine areas. The concept is placed as subclass of seo:OceanPhenomenon and is linked with the SWEET ontology concept swe:oil spill with an owl:equivalentClass relation.
It is worth noting that new phenomena could be easily added as subclasses of the seo:OceanPhenomenon class similarly. The seo:Phenomenon class, and consequently its subclasses, had the following properties:
  • Category (Property seo:hasCategory): the category of a phenomenon (see Section 3.1), a value for characterizing the phenomenon.
  • Coverage (Property seo:hasCoverage): the geometry of a phenomenon in WKT (Well Known Text) format using the WGS84 reference system.
The overall design of the SeMaRe ontology is depicted at Figure 1. We sketch the following use case to illustrate the use of the ontology: an EO image about an area in the Mediterranean Sea is declared as instance of the class seo:SatelliteImage, and is described by the appropriate properties (e.g., seo:hasTitle, seo:hasTimestamp, seo:hasBoundingBox, etc.). Each identified phenomenon (e.g., algal bloom) within the image is declared as an instance of the class seo:AlgalBloom, a subclass of the seo: OceanPhenomenon class, and is described by the properties seo:hasCoverage and seo: hasCategory. The image and each algal bloom phenomenon identified within the image are then linked with the object type property seo:hasPhenomenon. If for an image there are no identified phenomena, then the specific image instance does not use the seo:hasPhenomenon property.

3.3. Question Answering Module

3.3.1. Extraction of Spatial Entities

Our QA module included a geocoding component that recognizes the geographical entity within the query through techniques of Named Entity Recognition (NER). The new component was able to model as output the geographical polygon of the entity according to the adverbs within the query. It was therefore necessary to design the following modules:
  • Module for the management of the user query in natural language;
  • Module for the recognition of the geographical entities within the query;
  • Geocoding module for the geographical entity;
  • Module for the management of adverbs of place in the query;
  • Module for parsing lexical dependencies between query words;
  • Module for generating the custom output polygon.
Initially, the user query, which was written using natural language, was processed and tokenized through a standard NLP pipeline based on the Stanford CoreNLP framework [77]. The geographical entity inside the query was extracted and geocoded (assignment of its latitude and longitude coordinates) through a Named Entity Recognition module based on the CoreNLP framework. It was important to identify a gazetteer with comprehensive coverage of marine environments and locations since the system was used to identify coastal cities, beaches, gulfs, seas, oceans, etc. Thus, we employed GeoNames (https://www.geonames.org/, accessed on 4 August 2021), which is a geographic database available for free download. If within the query there was an adverb of place, it was detected and parsed by our system [78] to derive the lexical dependencies between the different words. This step helped us understand if there was a lexical relationship between the adverb of place and the geographical location. Indeed, our goal was to model the output polygon based on the type of adverb of place. When one of these dependencies existed, we extracted the adverb, and we check if it was one of our pre-defined list of modifiers. The full list of modifiers and their corresponding number of kilometers used for transforming the polygon are reported in Table 4 and defined in a configuration file. We defined these kilometers values arbitrarily to fit our project use cases. Anyway, these values could be changed according to the necessities, e.g., in the case of vast areas where the center coordinates of this place were too much inland or to fit the needs of the final user of the framework. At this point, we used the geographic entity obtained as an output of GeoNames and the modifier (i.e., move, shrink, enlarge) for generating the output polygon describing our area of investigation. The polygon had a square shape and was obtained by applying mathematical functions (depending on the adverb, if present) to the point given as output by GeoNames. The default size of the polygon was 10 × 10 km. For example, suppose we detected a geographical entity as “Athens” and an adverb like below. In that case, we would obtain by Geonames the center coordinates of Athens (N  37°59′1″, E 23°43′40″) and, starting from this point, we first generated a polygon of 10 × 10 km and, consequently, it was moved by 10 km to the south.

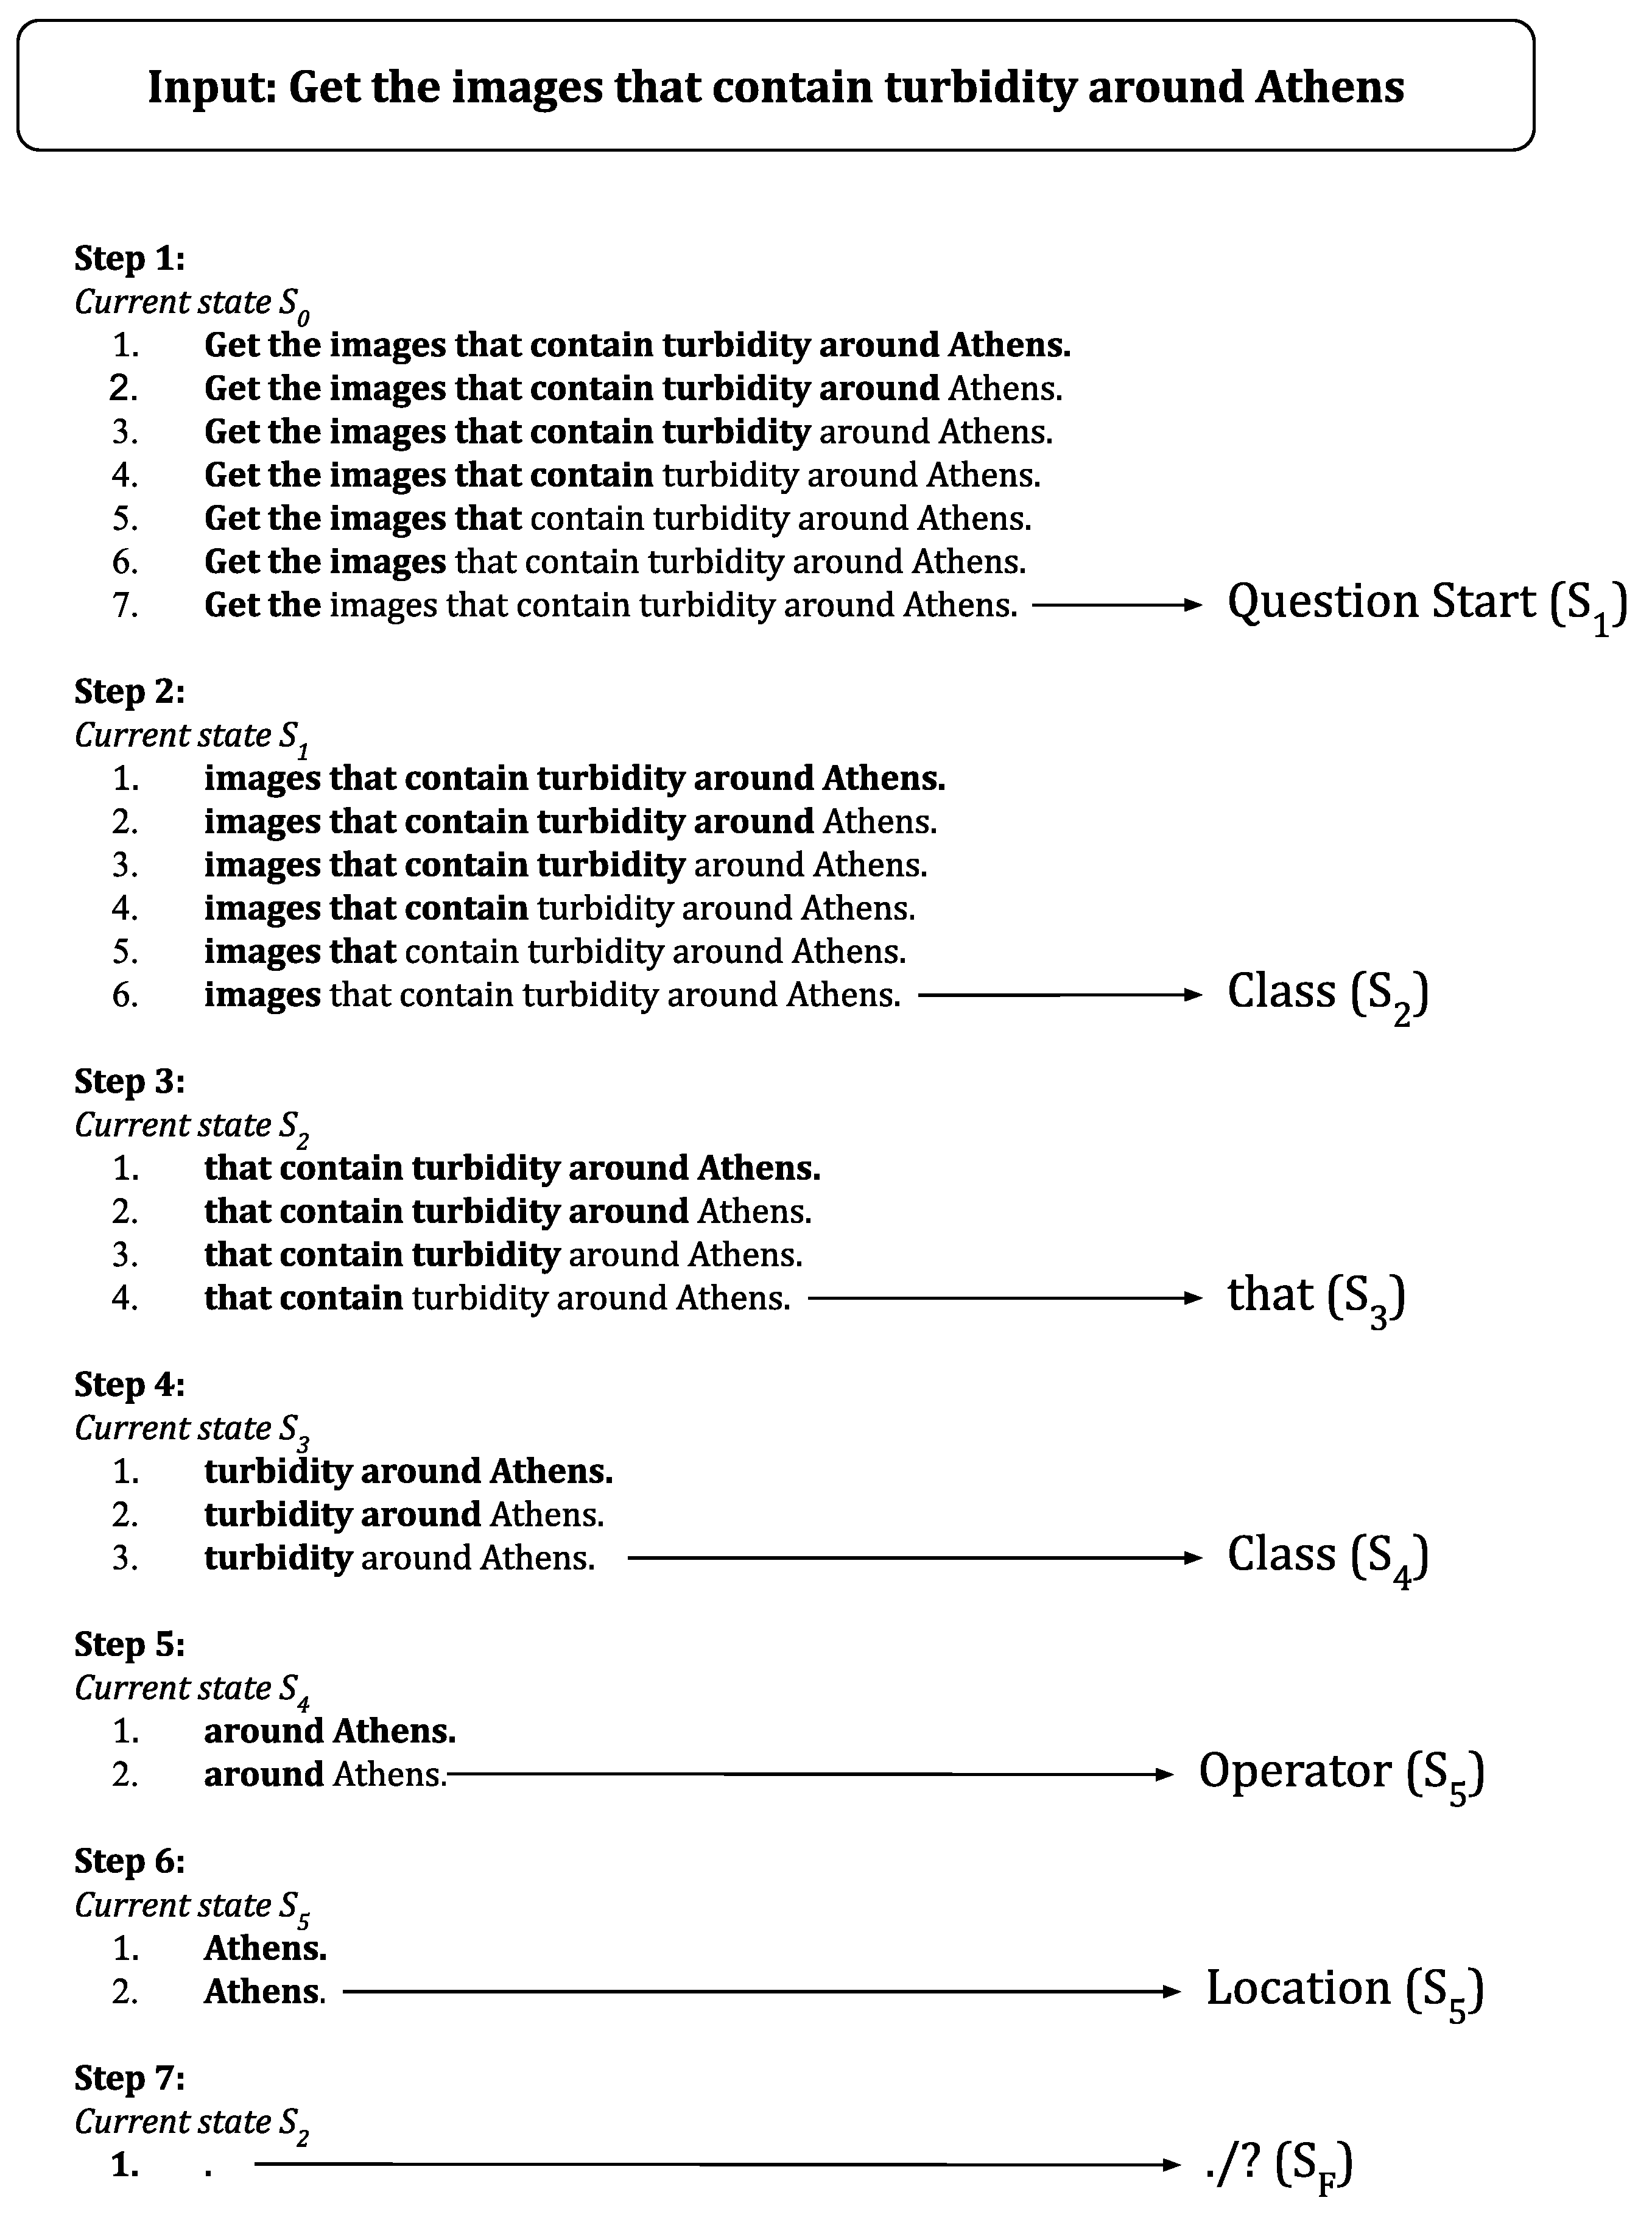
3.3.2. Question Processing

The question answering approach for retrieving appropriate EO data was based on controlled natural languages as proposed in [79]. Given a language, we obtained a controlled language by considering only a subset of its vocabulary and its grammatical rules. This was based on the assumption that, especially in close domain scenarios like the SeMaRe ontology, the words and the syntactic structure of the questions that users used for asking the system follows specific patterns. By creating a controlled natural language, the process of answering users’ questions could be seen as a deterministic process of searching for the right resource in the ontology. In this way, it was possible to build a finite state automaton (FSA) [80] that was capable of recognizing any sentence written in the controlled natural language of choice.
Following the approach shown in [79], we first built the dictionary for our controlled natural language by taking into account all the labels of each entity, class, and property that could be found in the SeMaRe ontology.
This dictionary was used to map words or phrases contained in the question to the proper resources in the ontology. For example, the word “turbidity” was mapped to the ontology class seo:Turbidity. However, if we just considered the resources’ labels to build our vocabulary, the system would lack the ability to cover any case where there was no direct match between the words in the questions and the ontology entities, like what happened in the case of typos and synonyms.
To cope with this problem, we extended the vocabulary using an approach based on distributional semantics models. More specifically, we exploited Word2Vec [81] to create a vector space model using Wikipedia abstracts.
During the data matching step, the system checked if there was a match between a phrase in the question and one of the labels of the knowledge base by exploiting the dictionary. If a match was not found, the system additionally computed a ranked list of alternative phrases semantically similar to the one in the question. Therefore, the system substituted iteratively the phrase in the question with the ones retrieved using the distributional semantic model until a match with the knowledge base was found. To prevent deadlocks, we also introduced a backtracking algorithm that, combined with the semantic matching mechanism described above, allowed the FSA to reconsider the previous choices, thus leading to the correct resource.
The FSA, which was used to analyze the users’ questions, was designed based on the syntactic structure of questions for the English language and is shown in Figure 2. Each state (i.e., S 0 S 1 , . . . S F ) was associated with portions of SPARQL templates and the type of token analyzed by the system causes the shift from one state to the next. The token type could be one of the following: Question start, Entity, Property, Class, Literal, Operator, Location, and Date. In particular, the types Entity, Property, Class and Literal referred to the respective resource types of the SeMaRe ontology, while the types Operator, Location and Date were used to answer more complex questions involving specific modifiers. For example in the question “Get the images that contain turbidity phenomena after 22 May 2019”, “after” is an Operator, while “22 May 2019” is a Date. In addition there were some words/characters, i.e., “having”, “with”, “?”, “.” which caused the FSA to shift in particular states: for example, the character “?” or “.” caused the shift to the final state S F which concluded the computation.
Given a natural language question, the system analyzed it progressively by gradually removing the rightmost word. In this way, it was possible to identify the most extended token that allowed the FSA to shift from the current state to the next. An example of this behavior is shown in Figure 3. Given as example the question ”Get the images that contain turbidity around Athens”, the algorithm first attempted a match between the entire string and the resources of the ontology as defined by the rules of the FSA. Since there was no match with this first attempt, the algorithm reduced the string removing the last word from the right until matching was found.
In this example, “Get the” had a matching with the initial state of the FSA. After a match was found, the string was removed from the initial question, and the algorithm analyzed the remaining section similarly.
In the next step (step 2), the process was iterated, and a match is found between “images” and one of the resources of the SeMaRe ontology. Again, the string was removed, and the FSA could shift to the next state. The process goes on until the FSA reached its final state. At the end of this process, the list of the states that were visited by the FSA, as well as the strings that caused each shift were used to construct the final SPARQL query. Each state of the FSA was paired with a specific SPARQL pattern. By combining the patterns of all the states that have been visited during the execution, it was possible to build the final SPARQL query (Figure 4).

4. Implementation

The SeMaRe methodology was implemented on application specific basis following the overall architecture presented in Figure 5. The Semantic Annotation module regularly retrieved satellite images, i.e., the raw data and their XML metadata, and applied remote sensing algorithms to identify any oceanographic phenomena in them. The output of the module’s processing step was: (a) metadata about images obtained directly from the satellite and updated during RS processing, and (b) geospatial objects representing phenomena that were extracted by RS algorithms applied on raw data of images. At post-processing, the module converted the output into a semantically aware format, that is, as RDF instances according to the SeMaRe ontology, and populated the Knowledge Base (KB), ensuring that the latter was up-to-date with the output of the Semantic Annotation module. The Knowledge Base was the middleware between the user needs and the raw data by providing the information that the Question Answering (QA) module needed to parse the user query and by generating the response to the user. The user interacted with the QA module by providing natural language queries as free text using a REST API. The text was parsed, elaborated, and mapped with all the fields supposed for the exact interpretation of the query. Then, the text was transformed into a SPARQL query and sent to the Knowledge Base to retrieve the appropriate data. Finally, the QA module parsed the response and satisfied the user’s needs. The details for each module are presented in the following sections.

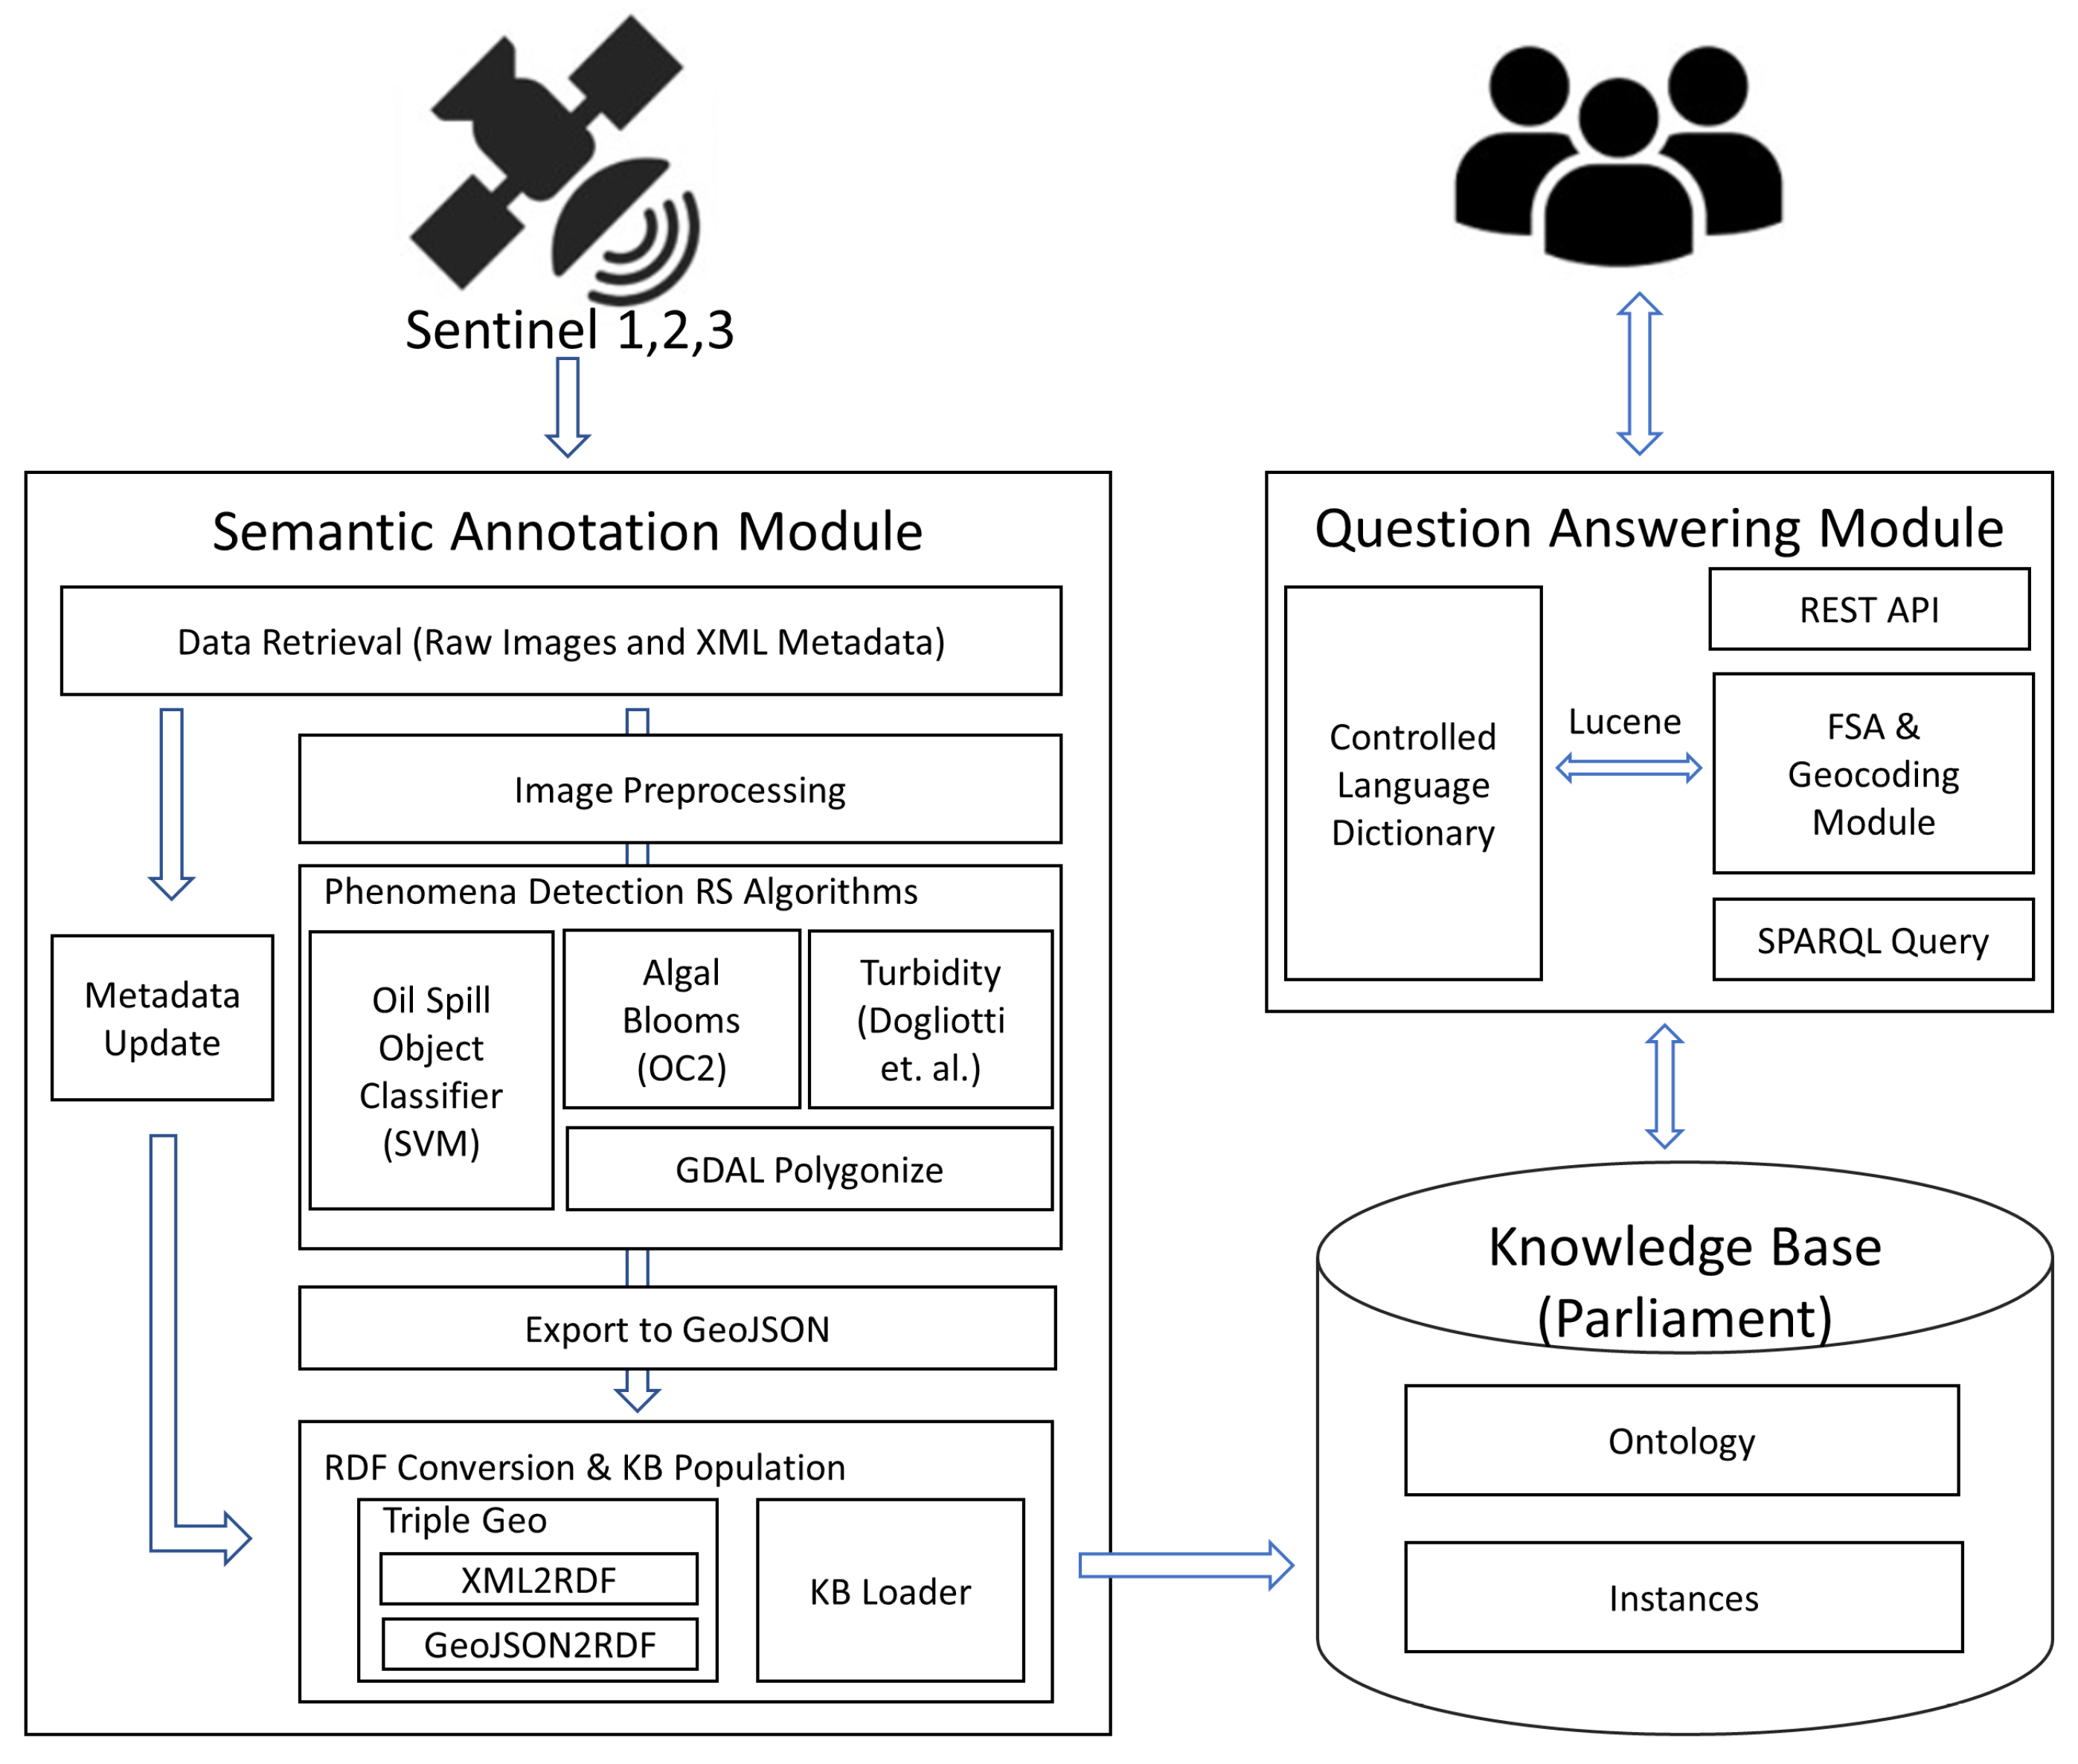
4.1. Semantic Annotation Module

The Semantic Annotation module contains python scripts that downloaded newly acquired images from Sentinel 1, 2, and 3 daily. The system was limited to work in a specified geographic region between Italy and Greece due to the computational costs of the processing step. Still, it can be expanded to global coverage if appropriate computing capacity becomes available. Each image was provided with its INSPIRE-based image-level metadata (name, abstract, spatial extent, time of the acquisition, etc.) and is appropriately pre-processed and processed to identify phenomena within the image. The general processing followed the pursuing scheme starting at 00:00 a.m. every day:
  • Image and XML metadata download;
  • Image pre-processing (radiometric/atmospheric corrections, cloud masking, etc.);
  • Phenomenon-specific image processing (see Section 3.1);
  • Creation of phenomenon-specific raster map;
  • Conversion of the raster map to vector (GeoJSON);
  • Update of the INSPIRE compliant enriched metadata combining image metadata and phenomenon-specific processing results.
All the above steps of the routine were carried out by a combination of Python scripts, SNAP GPT (Sentinel Application Platform, https://step.esa.int/main/toolboxes/snap/, accessed on 4 August 2021) and GDAL commands, and bash scripts in a Linux server. For each satellite image, the module produced two files, containing the output of the processing step:
  • An XML file containing the original and the updated metadata of the image. The original metadata file maintained generic metadata about the retrieved image and used the INSPIRE datasets and services in ISO/TS 19139 based XML format (https://inspire.ec.europa.eu/id/document/tg/metadata-iso19139, accessed on 4 August 2021). The updated metadata file extendd the original version during the image processing with additional application-specific elements.
  • A GeoJSON file that maintains spatial and descriptive metadata about the identified phenomena within the image. Each phenomenon instance was characterized by (a) the spatial area it covers, that is, its geometry in Well-Known-Text (WKT) format using the WGS84 reference system and (b) the set of its descriptive properties as described in Section 3.1.
At post-processing, the module automatically converted the image’s INSPIRE-extended metadata (XML file) and phenomena (GeoJSON file) to an RDF file. For the conversion step, the TripleGeo utility (https://github.com/GeoKnow/TripleGeo, accessed on 4 August 2021) was used and adapted according to SeMaRe needs. The conversion is based on manually-defined rules in XSLT files that map XML and GeoGSON fields to RDF classes and predicates according to the SeMaRe ontology. The generated RDF file was loaded to the Knowledge Base automatically using the Knowledge Base’s API.

4.2. Knowledge Base

The semantically-enabled core of the SeMaRe system was the knowledge base, which was structured in two levels:
  • Schema Level: Modeled the marine domain application concepts about phenomena that are present and interpretable in EO images and formalized as an ontology containing the semantic definition of the data and defining what properties each image and phenomenon had as described in Section 3.2.
  • Instance Level: Contained the actual data for describing semantically annotated images and phenomena according to the schema.

4.2.1. Schema

The task of conceptualization, described in Section 3.2, produced the general design of the ontology. This design needed to be translated using a descriptive language for storing semantically annotated EO images into a computable representation. We used the W3C RDF (https://www.w3.org/TR/rdf11-concepts/, accessed on 4 August 2021), a common language and instrument for ontology development for the Semantic Web. To translate the design of the ontology in RDF language, we used Protégé (https://protege.stanford.edu/, accessed on 4 August 2021), an open-source tool provided by the University of Stanford that allowed developing ontologies and intelligent systems. The RDF/XML serialization of the SeMaRE ontology is available in Github (https://github.com/SeMaReSEODWARF/Ontology, accessed on 4 August 2021)) and is used as the schema of the Knowledge Base. The following are some general implementation decisions:
  • The ontology IRI was specified to http://seodwarf.eu/ontology/v1.0;
  • The Pascal case capitalization style used for naming classes (e.g., SatelliteImage);
  • The Camel case capitalization style used for naming properties (e.g., hasCoverage).

4.2.2. Instances

While the schema level refers to the implementation of the domain conceptualization, instances are the actual data of the Knowledge Base, that is, instantiated information about semantically annotated EO images and phenomena. Instances were generated as RDF triples in accordance with the ontology and they are inserted in the Knowledge Base during the semantic annotation process. Both instances and the ontology were represented as triples and are preserved and exposed through the Knowledge Base’s endpoint.

4.2.3. Endpoint

The Knowledge Base is semantically enabled, and thus its implementation supports semantic web technologies. Its content uses the RDF data model and is consultable using a query language such as SPARQL, allowing semantically enabled query answering over its content. In addition, it supports the GeoSPARQL query language for executing queries involving relations between spatial entities. Well known frameworks that support handling of RDF formatted data include Apache Jena (https://jena.apache.org/, accessed on 4 August 2021), OpenLink Virtuoso (https://virtuoso.openlinksw.com/, accessed on 4 August 2021) and Parliament [82] and several studies compare state-of-the-art RDF stores [83,84]. In this implementation, the Knowledge Base was implemented in the Parliament store because it supported GeoSPARQL queries on polygon geometries. Knowledge Base’s (available at http://90.147.102.176/parliament, accessed on 4 August 2021) content was exposed through a public SPARQL endpoint and organized in two graphs. Schema level information could be queried from the http://seodwarf.eu/ontology/v1.0 graph and instance level information from the http://seodwarf.eu/triples graph.

4.3. Question Answering Module

The Question Answering (QA) module consisted of the dictionary and the query matching module. The dictionary contained the labels of the resources belonging to the ontology and was used to map phrases in the user question and the aforementioned resources. Its content was exposed through Apache Lucene (https://lucene.apache.org/, accessed on 4 August 2021), which is a high-performance text search engine. The query matching module included the FSA logic and the geocoding module, and its responsibility was to transform the natural language question into a SPARQL query. The question was split into sections, and each of them triggered a transition of the FSA from one state to another. Each state was associated with a specific SPARQL construct. At the end of the NLP analysis, the set of states in which the FSA transitioned was used to build the final SPARQL query that was then executed against the KB endpoint. The QA module was implemented in Java and supports a RESTful architecture for the communication between system modules and users. The REST API exposed the following two basic methods:
  • getExpandedQuery, which was used internally to translate a natural language question into its equivalent SPARQL query; and
  • getKBResults, which allowed user communication with SeMaRe by retrieving their NLP queries and responding with the appropriate answers.

5. Preliminary Evaluation

In this section, we describe the preliminary evaluation of the SeMaRe system. For this kind of retrieval systems, based on a natural language interface, an “in vivo” evaluation would be desirable to assess:
  • the ease of use of the system, i.e., if the adoption of natural language actually helped the users to express their needs;
  • the accuracy of the system, i.e., its ability to correctly retrieve instances when querying a knowledge base in which semantically annotated EO images and phenomena were described as RDF triples;
  • the efficiency of the system in terms of response time.
In the following, we describe the preliminary evaluation performed to assess the ease of use (Section 5.1) and the accuracy and efficiency (Section 5.2) of the system.

5.1. Ease of Use Evaluation

We carried out an “in vivo” evaluation by involving a company that expressed its willingness to participate in the experiment.
The experiment involved a set of 25 subjects, in which participants were selected according to their degree of knowledge with SPARQL so that the ratio between expert and non-expert users would be balanced. The experiment was composed of the following four phases:
  • Gathering personal information, e.g., age and gender;
  • Gathering information about the participant’s skills in IT and SPARQL;
  • Participants were asked to interact with the system by freely querying the interface;
  • Survey about the system, collecting feedback from the participants.
From the second phase of the experiment, it emerged that the 52 % of the participants declared that they had low to medium level of IT skills; the 48 % of them declared having none or little knowledge of SPARQL. During phase 4, we asked the participants to express their overall rating about the system using a 10 point Likert scale, which ranged from a minimum of 1, which expressed the lowest score, to a maximum of 10. From the analysis of the user feedback, it emerged that the Natural Language Interface was appreciated by 80 % of the participants, who assigned an overall rating greater than 6. We asked the users to select a preference between SPARQL and natural language when querying the database after interacting with the system. Although this result is influenced by the presence among the participants of users that never used SPARQL, we can see that also people with technical skills felt more confident in using natural language rather than a data query language.

5.2. Accuracy & Efficiency Evaluation

For evaluation purposes, we transformed and loaded to the knowledge base 165 images and their associated phenomena. This sample consists of semantically annotated images from 10 Novermbaer 2019 to 3 December 2019 and contains turbidity, oil spill, and algal bloom phenomena. Their geospatial distribution covered a large area of the Adriatic, Ionian, and Tyrrhenian Sea (Figure 6). We note that all phenomena were described by polygon geometries. Table 5 summarizes the content of the knowledge base. The total number of the generated triples for the 165 images was 103,673, resulting in approximately 628 triples per image. The total number of identified phenomena was 29,099, which resulted in approximately 176 phenomena per image. Out of the 165 images, six did not contain phenomena because the RS algorithm did not identify a phenomenon, and consequently, they could not extract phenomena related metadata (empty GeoJSON file). For these images, the knowledge base maintained only its generic metadata (INSPIRE based metadata). Table 5 also presents statistics per phenomenon type. For instance, the knowledge base contained 47 images annotated with turbidity phenomena. The total identified turbidity phenomena were 3791, and, thus, the average turbidity phenomena per image was approximately 80.
The SeMaRe system, and especially the ontology and the QA module, was designed based on some generic user information needs that are sufficiently representative of the range of requests that are possible to be made by the end-users. These user needs were specified by marine domain experts in the framework of the SEO-DWARF project and expressed as potential query forms. According to these generic query forms, an end-user could ask for information about:
  • images that contained a phenomenon, optionally, for a given location and a given period of time;
  • phenomena, optionally, for a given location and a given period of time;
  • areas where a user specified threshold of parameters/index, i.e., phenomenon category, was reached.
For this preliminary evaluation, these generic query forms were instantiated for the turbidity phenomenon to the seven natural language queries shown in Table 6, and we assessed: (a) their accuracy, i.e., if the natural language query could be converted in a suitable SPARQL form and return the correct result set, and (b) their efficiency regarding the time needed to execute each query. The Results column shows the number of the results for each query, and the Time column shows the response time for each query in seconds. For example, the natural language query Q: “Get all the images that contain turbidity phenomena” (SN 3) was transformed by the QA module to the respective SPARQL query S and returned 47 results, i.e., images, in 5 s. As indicated by the Images with turbidity statistic of Table 5, the query managed to identify all 47 images contained in the knowledge base. In fact, the execution of the SPARQL query was a deterministic process that ensured that all correct results from the knowledge base were retrieved as long as the SPARQL query was syntactically correct and matched the underlying schema. Therefore, the focus lay on the correct transformation of the natural language to the SPARQL query, which as Table 6 shows, was successful for all queries, including those containing spatial and temporal references (queries 4, 5 and 6). Nevertheless, in real-world, end users are free to express their own queries, and it is natural to make the hypothesis that real user free-text queries will greatly vary regarding their syntax and structure. A further evaluation of the system accuracy would require online experiments to capture user expressed needs and test whether they are satisfied with their results. This kind of evaluation is left as a future work due to the need of building an appropriate prototype and a dataset, in which it is necessary to:
  • collect a real-word set of natural language queries asked to the system;
  • define the subset of the relevant images for each query in order to compute the accuracy in terms of the classic precision and recall measures adopted in Information Retrieval.
Regarding system efficiency, we observed that the slowest queries contained spatial references (queries 4 and 6). Even though this is an expected behaviour because spatial operations are in general costly, in the discussion section, we stress that RS algorithms produced fine-grained, pixel-level scale, polygon geometries for the phenomena, which further increased the associated query execution costs. A solution to the efficiency problem could be the use of geometric approximations of the phenomena polygons (e.g., Minimum Bounding Boxes) for the execution of spatial operations during querying.

6. Discussion and Conclusions

In this paper, we have presented SeMaRe, a semantic marine retrieval framework that aims to allow users to retrieve information regarding marine phenomena annotated on EO satellite images. Specific marine phenomena have been selected as the test case of SeMaRe, i.e., turbidity, Chl-a concentration (algal bloom), and oil spills. Information contained in the images provided by three satellites (namely Sentinel 1, 2, and 3) is routinely extracted for the selected marine phenomena using RS algorithms, which are either widely tested and accepted by the scientific community (ACOLITE processor) or were developed by our team for this scope (OBIA method for oil spills). The evaluation of the algorithms needs extensive in-situ data, but this activity is beyond the scope of this work. Another issue, which has arisen during the test phase of the SeMaRe system, concerns the geometries of the RS algorithm output for the marine phenomena. Working at the pixel level scale produces a very high volume of geometries about the phenomena, and the limited generalization, which is being applied, does not efficiently reduce this high volume of geometries. Due to this fact, the associated storage, processing, and retrieval costs are also high, as the response times (Table 6) of some queries show. Thus, it is important that a more efficient generalization algorithm for the geometries produced will be integrated into the SeMaRe system.
The marine domain knowledge is formalized as an ontology that contains information about EO satellite images and their associated phenomena. The presented ontology models turbidity, algal bloom, and oil spill phenomena, but it can be easily extended for other marine phenomena such as hot spots, upwelling, fronts, trophic status index, winds, and waves. SeMaRe concepts are linked with the SWEET ontology, but links with other sources, such as DBpedia and GeoNames, can be established at schema or instance level in order to enrich the Knowledge Base. For example, a SeMaRe phenomenon could be linked, using an include spatial relation, with a GeoNames geographical entity that would allow the Question Answering module to perform more complex or semantically-abstract queries (e.g., “find oil spills around big coastal cities”) and to retrieve more accurate information. In the current implementation, SeMaRe ontology uses custom properties for representing images (seo:hasBoundingBox) and phenomena (seo:hasCoverage) geometries in order to explicitly define the relation of concepts and geometries in a simple way. However, in terms of reusability, the substitution of these properties with a common spatial vocabulary, e.g., the GeoSPARQL annotation, is suggested.
Our framework is also based on a Question Answering module which allows users to express their information needs by using natural language easily. To translate the users’ questions into SPARQL queries, we adopted a method based on controlled natural language, which has also been empowered with distributional semantics models. Since questions can be related to specific geographical areas, a geocoding module has been integrated to recognize geographical entities within the question and translate them into the corresponding coordinates (latitude and longitude). As for the retrieval capabilities of the framework, we observe that the system is able both to retrieve images that contain certain phenomena and to find phenomena in a certain image. However, queries that involve spatial operations with phenomena geometries (e.g., intersects) present increased response times mainly due to the fine-grained representation of phenomena geometries (exported by the Semantic Annotation module). Possible improvements regarding the response times of the Knowledge Base include the capture of a less fine-grained geometry for each phenomenon (e.g., its bounding box) or the substitution of Parliament with another RDF store that supports spatial querying. Regarding the use of natural language to query the system, a very preliminary evaluation session with real users showed that the majority of the participants appreciated this kind of interface. It was interesting to observe that people with technical skills preferred natural language interaction rather than using a data query language. As future work, since the specificity of the topic does not allow finding suitable resources in the available literature, we plan to conduct an “in vivo” evaluation of the whole framework to assess its performances in terms of accuracy and degree of usability perceived by real users. In order to do so, we plan to develop a user interface that can allow users to insert their question by writing them in a text box and selecting the area of interest using maps.

Author Contributions

Conceptualization, M.d.G. and K.T.; methodology, M.P. and P.K.; software, V.K. and L.S.; validation, V.K., P.K. and M.d.G.; formal analysis, M.P. and M.V.; investigation, P.K. and M.P.; resources, P.K.; data curation, P.K., V.K. and L.S.; writing—original draft preparation, V.K., L.S. and P.K.; writing—review and editing, V.K., L.S., M.P., P.K., M.V., M.d.G., and K.T.; visualization, V.K.; supervision, M.V., M.d.G. and K.T.; project administration, M.d.G. and K.T.; funding acquisition, M.d.G. and K.T. All authors have read and agreed to the published version of the manuscript.

Funding

This research was funded by the European Union’s Horizon 2020 research and innovation program under the Marie Skłodowska-Curie grant agreement No 691071.

Institutional Review Board Statement

Not applicable.

Informed Consent Statement

Not applicable.

Data Availability Statement

Data supporting reported results can be found at http://90.147.102.176/parliament/, accessed on 4 August 2021.

Conflicts of Interest

The authors declare no conflict of interest.

References

  1. Smeulders, A.W.; Worring, M.; Santini, S.; Gupta, A.; Jain, R. Content-based image retrieval at the end of the early years. IEEE Trans. Pattern Anal. Mach. Intell. 2000, 22, 1349–1380. [Google Scholar] [CrossRef]
  2. Hay, G.; Castilla, G. Geographic Object-Based Image Analysis (GEOBIA): A new name for a new discipline. In Object-Based Image Analysis: Spatial Concepts for Knowledge-Driven Remote Sensing Applications; Springer: Berlin/Heidelberg, Germany, 2008; pp. 75–89. [Google Scholar]
  3. Blaschke, T.; Hay, G.; Kelly, M.; Lang, S.; Hofmann, P.; Addink, E.; Feitosa, R.; Meer, F.; van der Werff, H.; Van Coillie, F.; et al. Geographic Object-Based Image Analysis—Towards a new paradigm. ISPRS J. Photogramm. Remote Sens. 2014, 87, 180–191. [Google Scholar] [CrossRef] [Green Version]
  4. Arvor, D.; Belgiu, M.; Falomir, Z.; Mougenot, I.; Durieux, L. Ontologies to interpret remote sensing images: Why do we need them? GISci. Remote Sens. 2019, 56, 1–29. [Google Scholar] [CrossRef] [Green Version]
  5. Hofmann, P.; Lettmayer, P.; Blaschke, T.; Belgiu, M.; Wegenkittl, S.; Graf, R.; Lampoltshammer, T.; Andrejchenko, V. Towards a framework for agent-based image analysis of remote-sensing data. Int. J. Image Data Fusion 2015, 6, 115–137. [Google Scholar] [CrossRef] [Green Version]
  6. Belgiu, M.; Tomljenovic, I.; Lampoltshammer, T.; Blaschke, T.; Höfle, B. Ontology-Based Classification of Building Types Detected from Airborne Laser Scanning Data. Remote Sens. 2014, 6, 1347–1366. [Google Scholar] [CrossRef] [Green Version]
  7. Gu, H.; Li, H.; Yan, L.; Liu, Z.; Blaschke, T.; Soergel, U. An Object-Based Semantic Classification Method for High Resolution Remote Sensing Imagery Using Ontology. Remote Sens. 2017, 9, 329. [Google Scholar] [CrossRef] [Green Version]
  8. Lang, S.; Hay, G.; Baraldi, A.; Tiede, D.; Blaschke, T. GEOBIA Achievements and Spatial Opportunities in the Era of Big Earth Observation Data. Int. J. Geo-Inf. 2019, 8, 474. [Google Scholar] [CrossRef] [Green Version]
  9. Ghorbanzadeh, O.; Tiede, D.; Wendt, L.; Sudmanns, M.; Lang, S. Transferable instance segmentation of dwellings in a refugee camp-integrating CNN and OBIA. Eur. J. Remote Sens. 2021, 54, 127–140. [Google Scholar] [CrossRef]
  10. Konstantinidou, E.; Kolokoussis, P.; Topouzelis, K.; Moutzouris-Sidiris, I. An open source approach for oil spill detection using Sentinel-1 SAR images. In Seventh International Conference on Remote Sensing and Geo-Information of Environment (RSCy2019); Springer: Berlin/Heidelberg, Germany, 2019. [Google Scholar]
  11. Papakonstantinou, A.; Stamati, C.; Topouzelis, K. Comparison of True-Color and Multispectral Unmanned Aerial Systems Imagery for Marine Habitat Mapping Using Object-Based Image Analysis. Remote Sens. 2020, 12, 554. [Google Scholar] [CrossRef] [Green Version]
  12. Kolokoussis, P.; Karathanassi, V. Oil Spill Detection and Mapping Using Sentinel 2 Imagery. J. Mar. Sci. Eng. 2018, 6, 4. [Google Scholar] [CrossRef] [Green Version]
  13. Kampouri, M.; Kolokoussis, P.; Argialas, D.; Karathanassi, V. Mapping of forest tree distribution and estimation of forest biodiversity using Sentinel-2 imagery in the University Research Forest Taxiarchis in Chalkidiki, Greece. Geocarto Int. 2019, 34, 1273–1285. [Google Scholar] [CrossRef]
  14. Ziokas, N.; Soulakellis, N.; Topouzelis, K. Use of Object Based Image Analysis in Very High-Resolution Images to Evaluate Buildings Damage after an Earthquake: The Case of Vryssa Settlement. In Proceedings of the 11th International Conference of the Hellenic Geographical Society (ICHGS-2018), Lavrion, Greece, 12–15 April 2018. [Google Scholar]
  15. Lawler, D. emTurbidity, Turbidimetry, and Nephelometry. InReference Module in Chemistry, Molecular Sciences and Chemical Engineering; Reedijk, J., Ed.; Elsevier: Waltham, MA, USA, 2016. [Google Scholar]
  16. Hellweger, F.L.; Schlosser, P.; Lall, U.; Weissel, J. Use of satellite imagery for water quality studies in New York Harbor, Estuar. Coast. Shelf Sci. 2004, 61, 437–448. [Google Scholar] [CrossRef]
  17. Garaba, S.; Badewien, T.; Braun, A.; Schulz, A.; Zielinski, O. Using ocean colour remote sensing products to estimate turbidity at the Wadden sea time series station Spiekeroog. J. Eur. Opt. Soc. Rapid Publ. 2014, 9, 140120. [Google Scholar] [CrossRef]
  18. Dogliotti, A.; Ruddick, K.; Nechad, B.; Doxaran, D.; Knaeps, E. A single algorithm to retrieve turbidity from remotely-sensed data in all coastal and estuarine waters. Remote Sens. Environ. 2015, 156, 157–168. [Google Scholar] [CrossRef] [Green Version]
  19. Nechad, B.; Ruddick, K.; Park, Y. Calibration and validation of a generic multisens or algorithm for mapping of total suspended matter in turbid waters. Remote Sens. Environ. 2010, 114, 854–866. [Google Scholar] [CrossRef]
  20. Falkowski, P.G.; Raven, J.A. Aquatic Photosynthesis; Princeton University Press: Oxford, UK, 2013. [Google Scholar]
  21. Blondeau-Patissier, D.; Gower, J.; Dekker, A.; Phinn, S.; Brando, V. A review of ocean color remote sensing methods and statistical techniques for the detection, mapping and analysis of phytoplankton blooms in coastal and open oceans. Prog. Oceanogr. 2014, 123, 123–144. [Google Scholar] [CrossRef] [Green Version]
  22. Robinson, I. Measuring the Oceans from Space: The Principles and Methods of Satellite Oceanography; Springer: Berlin/Heidelberg, Germany, 2004. [Google Scholar]
  23. Gordon, H.; Dennis, D.; James, M.; Warren, H. Phytoplankton Pigments from the Nimbus-7 Coastal Zone Color Scanner: Comparisons with Surface Measurements. Science 1980, 210, 63–66. [Google Scholar] [CrossRef]
  24. Kutser, T. Passive optical remote sensing of cyanobacteria and other intense phytoplankton blooms in coastal and inland waters. Int. J. Remote Sens. 2009, 30, 4401–4425. [Google Scholar] [CrossRef]
  25. Sathyendranath, S. Remote Sensing of Ocean Colour in Coastal, and Other Optically-Complex, Waters. In Reports of the International Ocean-Colour Coordinating Group; International Ocean Colour Coordinating Group (IOCCG): Dartmouth, NS, Canada, 2000. [Google Scholar]
  26. Morel, A.; Prieur, L. Analysis of variations in ocean color1. Limnol. Oceanogr. 1977, 22, 709–722. [Google Scholar] [CrossRef]
  27. Morel, A. Optical modeling of the upper ocean in relation to its biogenous matter content (case I waters). J. Geophys. Res. Ocean. 1988, 93, 10749–10768. [Google Scholar] [CrossRef] [Green Version]
  28. Dickey, T.; Lewis, M.; Chang, G. Optical oceanography: Recent advances and future directions using global remote sensing and in situ observations. Rev. Geophys. 2006, 44, 1–39. [Google Scholar] [CrossRef] [Green Version]
  29. Bowers, D.; Mitchelson-Jacob, E. Inherent Optical Properties of the Irish Sea Determined from Underwater Irradiance Measurements. Estuarine Coast. Shelf Sci. 1996, 43, 433–447. [Google Scholar] [CrossRef]
  30. Gitelson, A.; Gurlin, D.; Moses, W.; Barrow, T. A bio-optical algorithm for the remote estimation of the chlorophyll-a concentration in case 2 waters. Environ. Res. Lett. 2009, 4, 045003. [Google Scholar] [CrossRef]
  31. Moses, W.; Gitelson, A.; Berdnikov, S.; Saprygin, V.; Povazhnyi, V. Operational MERIS-based NIR-red algorithms for estimating chlorophyll-a concentrations in coastal waters—The Azov Sea case study. Remote Sens. Environ. 2012, 121, 118–124. [Google Scholar] [CrossRef] [Green Version]
  32. Shanmugam, P. A new bio-optical algorithm for the remote sensing of algal blooms in complex ocean waters. J. Geophys. Res. Ocean. 2011, 116, 4016. [Google Scholar] [CrossRef] [Green Version]
  33. Pahlevan, N.; Smith, B.; Schalles, J.; Binding, C.; Cao, Z.; Ma, R.; Alikas, K.; Kangro, K.; Gurlin, D.; Hà, N.; et al. Seamless retrievals of chlorophyll-a from Sentinel-2 (MSI) and Sentinel-3 (OLCI) in inland and coastal waters: A machine-learning approach. Remote Sens. Environ. 2020, 240, 111604. [Google Scholar] [CrossRef]
  34. Ansper, A.; Alikas, K. Retrieval of Chlorophyll a from Sentinel-2 MSI Data for the European Union Water Framework Directive Reporting Purposes. Remote Sens. 2019, 11, 64. [Google Scholar] [CrossRef] [Green Version]
  35. Misra, A.; Balaji, R. Simple Approaches to Oil Spill Detection Using Sentinel Application Platform (SNAP)-Ocean Application Tools and Texture Analysis: A Comparative Study. J. Indian Soc. Remote Sens. 2017, 45, 1065–1075. [Google Scholar] [CrossRef]
  36. Espedal, H. Detection of Oil Spill and Natural Film in the Marine Environment by Spaceborne Synthetic Aperture Radar. Ph.D. Thesis, Department of Physics, University of Bergen and Nansen Environment and Remote Sensing Center, Bergen, Norway, 1998. [Google Scholar]
  37. Brekke, C. Automatic Detection of Oil Spills by SAR Images: Dark Spot detection and Feature Extraction Report; Forsvarets Forskningsinstitutt: Kjeller, Norway, 2005. [Google Scholar]
  38. Topouzelis, K. Oil Spill Detection by SAR Images: Dark Formation Detection, Feature Extraction and Classification Algorithms. Sensors 2008, 8, 6642–6659. [Google Scholar] [CrossRef] [Green Version]
  39. Fonseca, F.; Egenhofer, M.; Agouris, P.; Camara, G. Using ontologies for integrated geographic information systems. Trans. GIS 2002, 6, 231–257. [Google Scholar] [CrossRef]
  40. Kauppinen, T.; de Espindola, G. Ontology-based modeling of land change trajectories in the brazilian amazon. In Proceedings of the Geoinformatik–GeoChange, Münster, Germany, 15–17 June 2011. [Google Scholar]
  41. Forestier, G.; Wemmert, C.; Puissant, A. Coastal image interpretation using background knowledge and semantics. Comput. Geosci. 2013, 54, 88–96. [Google Scholar] [CrossRef] [Green Version]
  42. Huang, H.; Chen, J.; Li, Z.; Gong, F.; Chen, N. Ontology-Guided Image Interpretation for GEOBIA of High Spatial Resolution Remote Sense Imagery: A Coastal Area Case Study. ISPRS Int. J. Geo-Inf. 2017, 6, 105. [Google Scholar] [CrossRef] [Green Version]
  43. Almendros-Jiménez, J.M.; Domene, L.; Piedra-Fernández, J.A. A Framework for Ocean Satellite Image Classification Based on Ontologies. IEEE J. Sel. Top. Appl. Earth Obs. Remote Sens. 2013, 6, 1048–1063. [Google Scholar] [CrossRef]
  44. Raskin, R.G.; Pan, M.J. Knowledge representation in the semantic web for Earth and environmental terminology (SWEET). Comput. Geosci. 2005, 31, 1119–1125. [Google Scholar] [CrossRef]
  45. Vassiliadis, V.; Wielemaker, J.; Mungall, C. Processing OWL2 Ontologies using Thea: An Application of Logic Programming. In Proceedings of the 5th International Workshop on OWL: Experiences and Directions (OWLED 2009), Chantilly, VA, USA, 23–24 October 2009. [Google Scholar]
  46. Bossard, M.; Feranec, J.; Otahel, J. CORINE Land Cover Technical Guide: Addendum 2000; European Environment Agency: Copenhagen, Denmark, 2000.
  47. Koubarakis, M.; Sioutis, M.; Kyzirakos, K.; Karpathiotakis, M.; Nikolaou, C.; Vassos, S.; Garbis, G.; Bereta, K.; Dumitru, O.; Espinoza-Molina, D.; et al. Building Virtual Earth Observatories Using Ontologies, Linked Geospatial Data and Knowledge Discovery Algorithms. In On the Move to Meaningful Internet Systems: OTM 2012; Meersman, R., Panetto, H., Dillon, T., Rinderle-Ma, S., Dadam, P., Zhou, X., Pearson, S., Ferscha, A., Bergamaschi, S., Cruz, I.F., Eds.; Lecture Notes in Computer Science; Springer: Berlin/Heidelberg, Germany, 2012; Volume 7566. [Google Scholar]
  48. Koubarakis, M.; Datcu, M.; Kontoes, C.; Di Giammatteo, U.; Manegold, S.; Klien, E. TELEIOS: A database-powered virtual earth observatory. Proc. VLDB Endow. 2012, 5, 2010–2013. [Google Scholar] [CrossRef]
  49. Veganzones, M.A.; Maldonado, J.O.; Graña, M. On Content-Based Image Retrieval Systems for Hyperspectral Remote Sensing Images. In Computational Intelligence for Remote Sensing; Springer: Berlin/Heidelberg, Germany, 2008; pp. 125–144. [Google Scholar]
  50. Dumitru, C.O.; Molina, D.E.; Cui, S.; Singh, J.; Quartulli, M.; Datcu, M. KDD Concepts and Methods Proposal: Report & Design Recommendations; Del. 3.1, FP7project TELEIOS; DLR: Wessling, Geramny, 2011.
  51. Maheshwary, P.; Namita, S. Prototype System for Retrieval of Remote Sensing Images based on Color Moment and Gray Level Co-Occurrence Matrix. Int. J. Comput. Sci. Issues 2009, 3, 20–23. [Google Scholar]
  52. Ruan, N.; Huang, N.; Hong, W. Semantic-Based Image Retrieval in Remote Sensing Archive: An Ontology Approach. In Proceedings of the 2006 IEEE International Symposium on Geoscience and Remote Sensing, Denver, CO, USA, 31 July–4 August 2006; Volume 1, pp. 2888–2891. [Google Scholar]
  53. Li, Y.; Bretschneider, T.R. Semantic-Sensitive Satellite Image Retrieval. IEEE Trans. Geosci. Remote Sens. 2007, 45, 853–860. [Google Scholar] [CrossRef] [Green Version]
  54. Liu, T.; Zhang, L.; Li, P.; Lin, H. Remotely sensed image retrieval based on region-level semantic mining. EURASIP J. Image Video Process. 2012, 2021, 4. [Google Scholar] [CrossRef] [Green Version]
  55. Wang, M.; Wan, Q.; Gu, L.; Song, T. Remote-sensing image retrieval by combining image visual and semantic features. Int. J. Remote Sens. 2013, 34, 4200–4223. [Google Scholar] [CrossRef]
  56. Datcu, M.; Daschiel, H.; Pelizzari, A.; Quartulli, M.; Galoppo, A.; Colapicchioni, A.; Pastori, M.; Seidel, K.; Marchetti, P.; D’Elia, S. Information mining in remote sensing image archives: System concepts. IEEE Trans. Geosci. Remote Sens. 2004, 41, 2923–2936. [Google Scholar] [CrossRef] [Green Version]
  57. Jiang, L.; Narayanan, R.M. Integrated spectral and spatial information mining in remote sensing imagery. IEEE Trans. Geosci. Remote Sens. 2004, 42, 673–685. [Google Scholar]
  58. Aksoy, S.; Koperski, K.; Tusk, C.; Marchisio, G.; Tilton, J. Learning bayesian classifiers for scene classification with a visual grammar. IEEE Trans. Geosci. Remote Sens. 2005, 43, 581–589. [Google Scholar] [CrossRef] [Green Version]
  59. Tiede, D.; Baraldi, A.; Sudmanns, M.; Belgiu, M.; Lang, S. Architecture and prototypical implementation of a semantic querying system for big Earth observation image bases. Eur. J. Remote Sens. 2017, 50, 452–463. [Google Scholar] [CrossRef] [PubMed]
  60. Androutsopoulos, I.; Ritchie, G.D.; Thanisch, P. Natural language interfaces to databases–an introduction. Nat. Lang. Eng. 1995, 1, 29–81. [Google Scholar] [CrossRef] [Green Version]
  61. Berners-Lee, T.; Hendler, J.; Lassila, O. The semantic web. Sci. Am. 2001, 284, 34–43. [Google Scholar] [CrossRef]
  62. Auer, S.; Bizer, C.; Kobilarov, G.; Lehmann, J.; Cyganiak, R.; Ives, Z. Dbpedia: A nucleus for a web of open data. In The Semantic Web; Springer: Berlin/Heidelberg, Germany, 2007; pp. 722–735. [Google Scholar]
  63. Vrandečić, D.; Krötzsch, M. Wikidata: A free collaborative knowledgebase. Commun. ACM 2014, 57, 78–85. [Google Scholar] [CrossRef]
  64. Lopez, V.; Unger, C.; Cimiano, P.; Motta, E. Evaluating question answering over linked data. Web Semant. Sci. Serv. Agents World Wide Web 2013, 21, 3–13. [Google Scholar] [CrossRef] [Green Version]
  65. Waldinger, R.J.; Appelt, D.E.; Dungan, J.L.; Fry, J.; Hobbs, J.R.; Israel, D.J.; Jarvis, P.; Martin, D.L.; Riehemann, S.; Stickel, M.E.; et al. Deductive Question Answering from Multiple Resources. New Dir. Quest. Answ. 2004, 2004, 253–262. [Google Scholar]
  66. Luque, J.; Ferrés, D.; Hernando, J.; Mariño, J.B.; Rodríguez, H. GeoVAQA: A voice activated geographical question answering system. In Proceedings of the Actas de las IV Jornadas en Tecnolog´ıa del Habla (4JTH), Zaragoza, Spain, 8–10 November 2006. [Google Scholar]
  67. Buscaldi, D. Resource Integration for Question Answering and Geographical Information Retrieval; Research Project Report; The Department of Information Systems and Computation, Polytechnic University of Valencia: Valencia, Spain, 2007; Available online: http://users.dsic.upv.es/~{}prosso/resources/BuscaldiDEA.pdf (accessed on 4 August 2021).
  68. Younis, E.M.; Jones, C.B.; Tanasescu, V.; Abdelmoty, A.I. Hybrid geo-spatial query methods on the Semantic Web with a spatially-enhanced index of DBpedia. In Proceedings of the International Conference on Geographic Information Science, Columbus, OH, USA, 18–21 September 2012; Springer: Berlin/Heidelberg, Germany, 2012; pp. 340–353. [Google Scholar]
  69. Bereta, K.; Koubarakis, M. Ontop of geospatial databases. In Proceedings of the International Semantic Web Conference, Kobe, Japan, 17–21 October 2016; Springer: Berlin/Heidelberg, Germany, 2016; pp. 37–52. [Google Scholar]
  70. Kyzirakos, K.; Karpathiotakis, M.; Koubarakis, M. Strabon: A semantic geospatial DBMS. In Proceedings of the International Semantic Web Conference, Boston, MA, USA, 11–15 November 2012; Springer: Berlin/Heidelberg, Germany, 2012; pp. 295–311. [Google Scholar]
  71. Punjani, D.; Singh, K.; Both, A.; Koubarakis, M.; Angelidis, I.; Bereta, K.; Beris, T.; Bilidas, D.; Ioannidis, T.; Karalis, N.; et al. Template-based question answering over linked geospatial data. In Proceedings of the 12th Workshop on Geographic Information Retrieval, Seattle, WA, USA, 6 November 2018; pp. 1–10. [Google Scholar]
  72. Salas, J.; Harth, A. Finding spatial equivalences accross multiple RDF datasets. In Proceedings of the Terra Cognita Workshop on Foundations, Technologies and Applications of the Geospatial Web, Citeseer, Bonn, Germany, 23–27 October 2011; pp. 114–126. [Google Scholar]
  73. Vanhellemont, Q.; Ruddick, K. Atmospheric correction of metre-scale optical satellite data for inland and coastal water applications. Remote Sens. Environ. 2018, 216, 586–597. [Google Scholar] [CrossRef]
  74. Lee, Z.; Carder, K.; Arnone, R. Deriving inherent optical properties from water color: A multiband quasi-analytical algorithm for optically deep waters. Appl. Opt. 2002, 41, 5755–5772. [Google Scholar] [CrossRef]
  75. Poveda-Villalón, M. A reuse-based lightweight method for developing linked data ontologies and vocabularies. In Proceedings of the Extended Semantic Web Conference, Heraklion, Crete, Greece, 27–31 May 2012; Springer: Berlin, Germany, 2012; pp. 833–837. [Google Scholar]
  76. Castro, G. Vicinity d2. 2: Detailed Specification of the Semantic Model; Technical Report; Universidad Politécnica de Madrid (UPM): Madrid, Spain, 2017; Available online: https://vicinity2020.eu/vicinity/node/229 (accessed on 4 August 2021).
  77. Manning, C.D.; Surdeanu, M.; Bauer, J.; Finkel, J.R.; Bethard, S.; McClosky, D. The Stanford CoreNLP natural language processing toolkit. In Proceedings of the 52nd Annual Meeting of the Association for Computational Linguistics: System Demonstrations, Baltimore, MD, USA, 22–27 June 2014; pp. 55–60. [Google Scholar]
  78. Finkel, J.R.; Grenager, T.; Manning, C.D. Incorporating non-local information into information extraction systems by gibbs sampling. In Proceedings of the 43rd Annual Meeting of the Association for Computational Linguistics (ACL’05), Ann Arbor, MI, USA, 25–30 June 2005; pp. 363–370. [Google Scholar]
  79. Mazzeo, G.M.; Zaniolo, C. CANaLI: A System for Answering Controlled Natural Language Questions on RDF Knowledge Bases; Technical Report; EDBT 2016; University of California: Los Angeles, CA, USA, 2016. [Google Scholar]
  80. Hopcroft, J.E.; Motwani, R.; Ullman, J.D. Introduction to automata theory, languages, and computation. ACM Sigact News 2001, 32, 60–65. [Google Scholar] [CrossRef]
  81. Mikolov, T.; Sutskever, I.; Chen, K.; Corrado, G.; Dean, J. Distributed representations of words and phrases and their compositionality. arXiv 2013, arXiv:1310.4546. [Google Scholar]
  82. Battle, R.; Kolas, D. Enabling the geospatial Semantic Web with Parliament and GeoSPARQL. Semant. Web 2012, 3, 355–370. [Google Scholar] [CrossRef]
  83. Bellini, P.; Nesi, P. Performance assessment of RDF graph databases for smart city services. J. Vis. Lang. Comput. 2018, 45, 24–38. [Google Scholar] [CrossRef]
  84. Garbis, G.; Kyzirakos, K.; Koubarakis, M. Geographica: A Benchmark for Geospatial RDF Stores (Long Version). In Proceedings of the The Semantic Web—ISWC 2013, Sydney, NSW, Australia, 21–25 October 2013; Lecture Notes in Computer Science. Springer: Berlin/Heidelberg, Germany, 2013; Volume 8219. [Google Scholar]
Figure 1. SeMaRe ontology. The namespace for SeMaRe classes and properties (seo) is omitted for brevity. Dashed classes and properties represent external objects, specifically, SWEET classes and their relation with the SeMaRe classes.
Information 12 00321 g001
Figure 2. Structure of the FSA used to translate the natural language question.
Information 12 00321 g002
Figure 3. Example of query processed by SeMaRe methodology.
Information 12 00321 g003
Figure 4. Example of SPARQL query built by SeMaRe methodology.
Information 12 00321 g004
Figure 5. SeMaRe system architecture.
Information 12 00321 g005
Figure 6. Geographical coverage of SeMaRe Knowledge Base images.
Information 12 00321 g006
Table 1. Turbidity classes and association between low and high level categories.
Low Level Quantitative CategoriesHigh Level Qualitative Categories
<1 FNUVERY LOW
1–10 FNULOW
10–50 FNUMODERATE
50–100 FNUHIGH
>100 FNUVERY HIGH
Table 2. Chl-a classes and association between low and high level categories.
Low Level Quantitative CategoriesHigh Level Qualitative Categories
<1 mg/LNOT SIGNIF.
1–5 mg/LVERY LOW
5–10 mg/LLOW
10–20 mg/LMODERATE
20–40 mg/LHIGH
>40 mg/LVERY HIGH
Table 3. Oil-spill high level categories.
High Level Categories
OIL-SPILL
LOOK-ALIKE
SEAWATER
Table 4. Adverbs used by the geocoding system and movement size in kilometers.
AdverbkmAdverbkm
near5far25
above10nearby5
around15there5
about7here5
down10up10
in5below10
on10east10
over10inside5
under10outside15
away15--
Table 5. Knowledge base content statistics.
StatisticQuantityStatisticQuantity
Total Images165Images with turbidity47
Annotated images159Turbidity phenomena3791
Total triples103,673Avg. turbidity phenomena per image80
Avg. triples per image628Images with oil spills67
Total Phenomena29,099Oil spill phenomena17,981
Avg. phenomena per image176Avg. oil spill phenomena per image268
Distinct image dates20Images with algal bloom45
Algal bloom phenomena7327
Avg. algal bloom phenomena per image162
Table 6. Results for the example queries.
SN Results (#)Time (s)
1QFind all the available images1654
SSELECT DISTINCT ?s WHERE {
GRAPH <http://seodwarf.eu/triples>
{ ?s seo:hasIdentifier ?o }}
2QGet the phenomena found in the image with
the identifier
seo:S2A_MSI_2019_11_21_09_43_11_
T33SWB_t_dogliotti
2233
SSELECT DISTINCT ?s ?p ?o WHERE {
GRAPH <http://seodwarf.eu/triples>{
<seo:S2A_MSI_2019_11_21_09_43_11_
T33SWB_t_dogliotti> seo:hasPhenomenon ?s.
?s ?p ?o }}
3QGet all the images that contain turbidity phenomena475
SSELECT DISTINCT ?s WHERE {
GRAPH <http://seodwarf.eu/triples>{
?s seo:hasPhenomenon ?o .
?o a seo:Turbidity .}}
4QGet images that contain turbidity phenomena in Bari107
SSELECT distinct ?s WHERE{
GRAPH <http://seodwarf.eu/triples>{
?s seo:hasPhenomenon ?o.
?s seo:hasBoundingBox ?g .
FILTER (geof:sfOverlaps(?g,"POLYGON((
15.08... 39.77..., 15.08... 42.46... , 18.65... 42.46...,
18.65... 39.77... , 15.08... 39.77...))"
^^<http://www.opengis.net/ont/geosparql#wktLiteral>)) ?o rdf:type seo:Turbidity. }}
5QFind images that contain turbidity phenomena happened after 22 November 2019255
SSELECT DISTINCT ?s WHERE {
GRAPH <http://seodwarf.eu/triples>
{ ?s seo:hasTimestamp ?d.
?s seo:hasPhenomenon ?o.
?o a seo:Turbidity.
FILTER(str(?d) >"2019-11-22")}}
6QGet turbidity phenomena near Bari happened after 01 November 2019635
SSELECT DISTINCT ?s ?p ?o ?o1 WHERE{
GRAPH <http://seodwarf.eu/triples> {
?s seo:hasTimestamp ?d.
?s seo:hasPhenomenon ?o.
?o a seo:Turbidity.
?o seo:hasPhenomenoCoverage ?g.
?o ?p ?o1. FILTER (str(?d) >"22019-11-01"&&
geof:sfIntersects(?g,"POLYGON((15.08...
39.77... , 15.08... 42.46... , 18.65.. 42.46.. ,
18.65... 39.77... ,15.08... 39.77...))"^^<http://www.opengis.net/ont/geosparql#wktLiteral>))}}
7QGet the turbidity phenomena areas with value ’50-100 FNU’474
SSELECT DISTINCT ?o WHERE {
GRAPH <http://seodwarf.eu/triples>{
?s seo:hasClass "50-100 FNU".
?s seo:hasPhenomenonCoverage ?o.}}
Publisher’s Note: MDPI stays neutral with regard to jurisdictional claims in published maps and institutional affiliations.

