
A GIS-Based Fuzzy Multiclassification Framework Applied for Spatiotemporal Analysis of Phenomena in Urban Contexts


1
Dipartimento di Architettura, Università degli Studi di Napoli Federico II, via Toledo 402, 80134 Naples, Italy
2
Centro di Ricerca Interdipartimentale “Alberto Calza Bini”, Università degli Studi di Napoli Federico II, via Toledo 402, 80134 Naples, Italy
*
Author to whom correspondence should be addressed.
Information 2022, 13(5), 248; https://0-doi-org.brum.beds.ac.uk/10.3390/info13050248
Submission received: 12 April 2022
/
Revised: 27 April 2022
/
Accepted: 11 May 2022
/
Published: 12 May 2022
(This article belongs to the Special Issue Knowledge Management and Digital Humanities)
Abstract
:In this research, we propose a GIS-based framework implementing a fuzzy-based document classification method aimed at classifying urban areas by the type of criticality inherent or specific problems highlighted by citizens. The urban study area is divided into subzones; for each subzone, the reports of citizens relating to specific criticalities are analyzed and documents are created, and collected by topic and by temporal extension. The framework implements a model applied to the multiclassification of the documents in which the topic to be analyzed is divided into categories and a dictionary of terms connected to each category is built to measure the relevance of the category in the document. The framework produces, for each time frame, thematic maps of the relevance of a category in a time frame in which a subzone of the study area is classified based on the classification of the corresponding document. The framework was experimented on to analyze and monitor over time the relevance of disruptions detected by users in entities that make up urban areas, such as: roads, private buildings, public buildings and transport infrastructures, lighting networks, and public green areas. The study area is the city of Naples (Italy), partitioned in ten municipalities. The results of the tests show that the proposed framework can be a support for decision makers in analyzing the relevance of categories into which a topic is partitioned and their evolution over time.
1. Introduction
Modern machine learning techniques such as, in particular, deep learning approaches, are successfully applied in many data regression and data classification applications. However, in some application contexts, where it is not possible to have a large set of labeled data points, the use of a supervised classifier built using a deep learning model can determine the results with an unsatisfactory level of accuracy. A solution to the problem of the scarcity of labeled data can be found by using a semi-supervised approach that also makes use of unlabeled data [1,2,3]. Some researchers propose self-training methods in which the classifier is initially trained on a reduced set of labeled data points to classify unlabeled data points [4,5].
Other approaches use co-training techniques in which the set of features is divided into two related subsets to allow the evaluation of the label to be assigned to an unlabeled data point. [6,7,8].
Semi-supervised generative methods are used by some authors to capture and better model data distributions. In [9], a deep generative semi-supervised approach in which is applied a variational optimization algorithm for approximate Bayesian inference is presented. In [10], a categorical generative adversarial network model is constructed in which is used an objective function to take into account the relation between the measured data and their predicted class distributions. In [11] is added an encoder to a categorical generative adversarial network to extract bidirectional mapping of the data distribution.
Some research has been recently aimed at the development of soft computing semi-supervised methods aimed at increasing the classification accuracy. In [12] is proposed a semi-supervised method using an evolutionary learning algorithm to construct a massive training set with large amounts of unlabeled data and a small quantity of labeled data. A semi-supervised hybrid sentiment classification model using a genetic algorithm and a logistic regression is applied on Twitter data in [13]. Type-2 fuzzy classifiers are proposed in [14,15] for managing uncertainty in labeling data.
One of the main criticalities of these models is their computational complexity, which can limit their use in the management of massive data. To overcome this criticality, in [16] is proposed a new unsupervised classification model applied to sentiment classification of social data, called fuzzy relevance emotional document classification (for short, FREDoC). FREDoC performs a fuzzy-based multiclassification of documents into prevailing emotional categories, evaluating the relevance of an emotional category in a document based on the use of the term frequency-inverse document frequency index.
The classification of areas of an urban fabric based on the impressions and reports of users represents a function to support decision makers and urban planners to evaluate the relationships between citizens and the services offered, or to analyze any situations of urban hardship or instability. In [17], a semi-supervised classification model proposed in [18] and based on the extended fuzzy C-means fuzzy clustering algorithm [19] was built to classify urban areas based on citizens’ moods. This model was used to evaluate the livability of the neighborhood perceived by citizens residing in the districts of the municipality of Bologna (Italy).
In this work, a GIS-based framework was built that implements the FREDoC model to classify urban areas based on user information extracted in social media posts or interview reports. The main drawback of this approach is given by the iterative process of the partitive clustering algorithm. In addition, this approach requires creating mapping between the class and the corresponding cluster. In [17,18], this mapping was generated by associating to the class the cluster to which the majority of data points in the training set assigned to that class belong. Finally, this model does not perform the multiple classification of data points by assigning a data point to the class corresponding to the cluster to which the data point belongs with the highest membership degree, even if the membership degrees to other clusters are not negligible. These drawbacks are overcome in FREDoC, in which a fuzzy partition of the emotional relevance measure is constructed to evaluate the incidence of an emotional category in a document and a multiclassification of a document is performed assigning it to the more relevant emotional categories.
We generalize the FREDoC classification model, extending the concept of emotional categories to characteristics or entities that identify a problem. In particular, we have implemented the FREDoC model in a GIS-based framework to classify subzones in which an urban area is partitioned; the framework was tested on an urban study area to classify the subzones by relevance of reported failures on categories of urban subsystems, such as roads, residential buildings, public buildings and transport infrastructures, lighting networks, and public green areas. The data points consist of reports made over time by citizens through the use of different channels in a deconstructed or semi-structured way. A thematic map of the relevance of the category in the subzones of the study area is produced for each category and for each time frame.
Aims and Advantages of This Research
The specific aims of this research are the following:
- -
- Implementing a GIS-based model to classify the subzones into which an urban area is partitioned in terms of relevance of a specific category and analyze its temporal evolution.
- -
- Analyzing the temporal evolution of the relevance of a category in a subzone, dividing the period in which citizens’ reports are entered into time frames.
- -
- Provide a GIS-based framework to support the decision maker for the analysis and monitoring of problems in urban contexts reported on different channels by citizens and residents.
The main advantages of this approach are the following:
- -
- The use of a light approach of multiclassification of urban areas on user information, eliminating the obstacle of the high computational complexity of semi-supervised classification soft computing models and allowing the processing of massive data extracted in social media posts or interview reports.
- -
- An interpretation of the results close to the decision maker’s reasoning. In fact, the proposed framework allows the user to obtain a clear linguistic interpretation of the final classification of the relevance of a specific feature in an urban area and to analyze how this relevance has varied over time.
The remainder of the paper is organized as follows. In Section 2 the FREDoC model proposed in [16] and generalized for the multiple classification of documents is presented. Section 3 focuses on the presentation of the proposed GIS-based framework through the description of its architecture and all its functional components. Section 4 describes the results of the GIS framework experimentation carried out on the study area of the city of Naples (Italy), in which the subzones are made up of the ten municipalities into which the city is divided and the problem concerns the instability of urban subsystems reported by citizens. Finally, Section 5 is devoted to a final discussion and future developments.
2. The FREDoC Document Classification Method
The FREDoC model (fuzzy relevance emotions document classification) [16] is a fuzzy-based multiple document classification model that has been applied for the classification of emotional categories expressed by users in social media posts.
In our framework, we apply FREDoC in general application contexts, to classify documents based on a set of C categories characterizing a specific topic or problem.
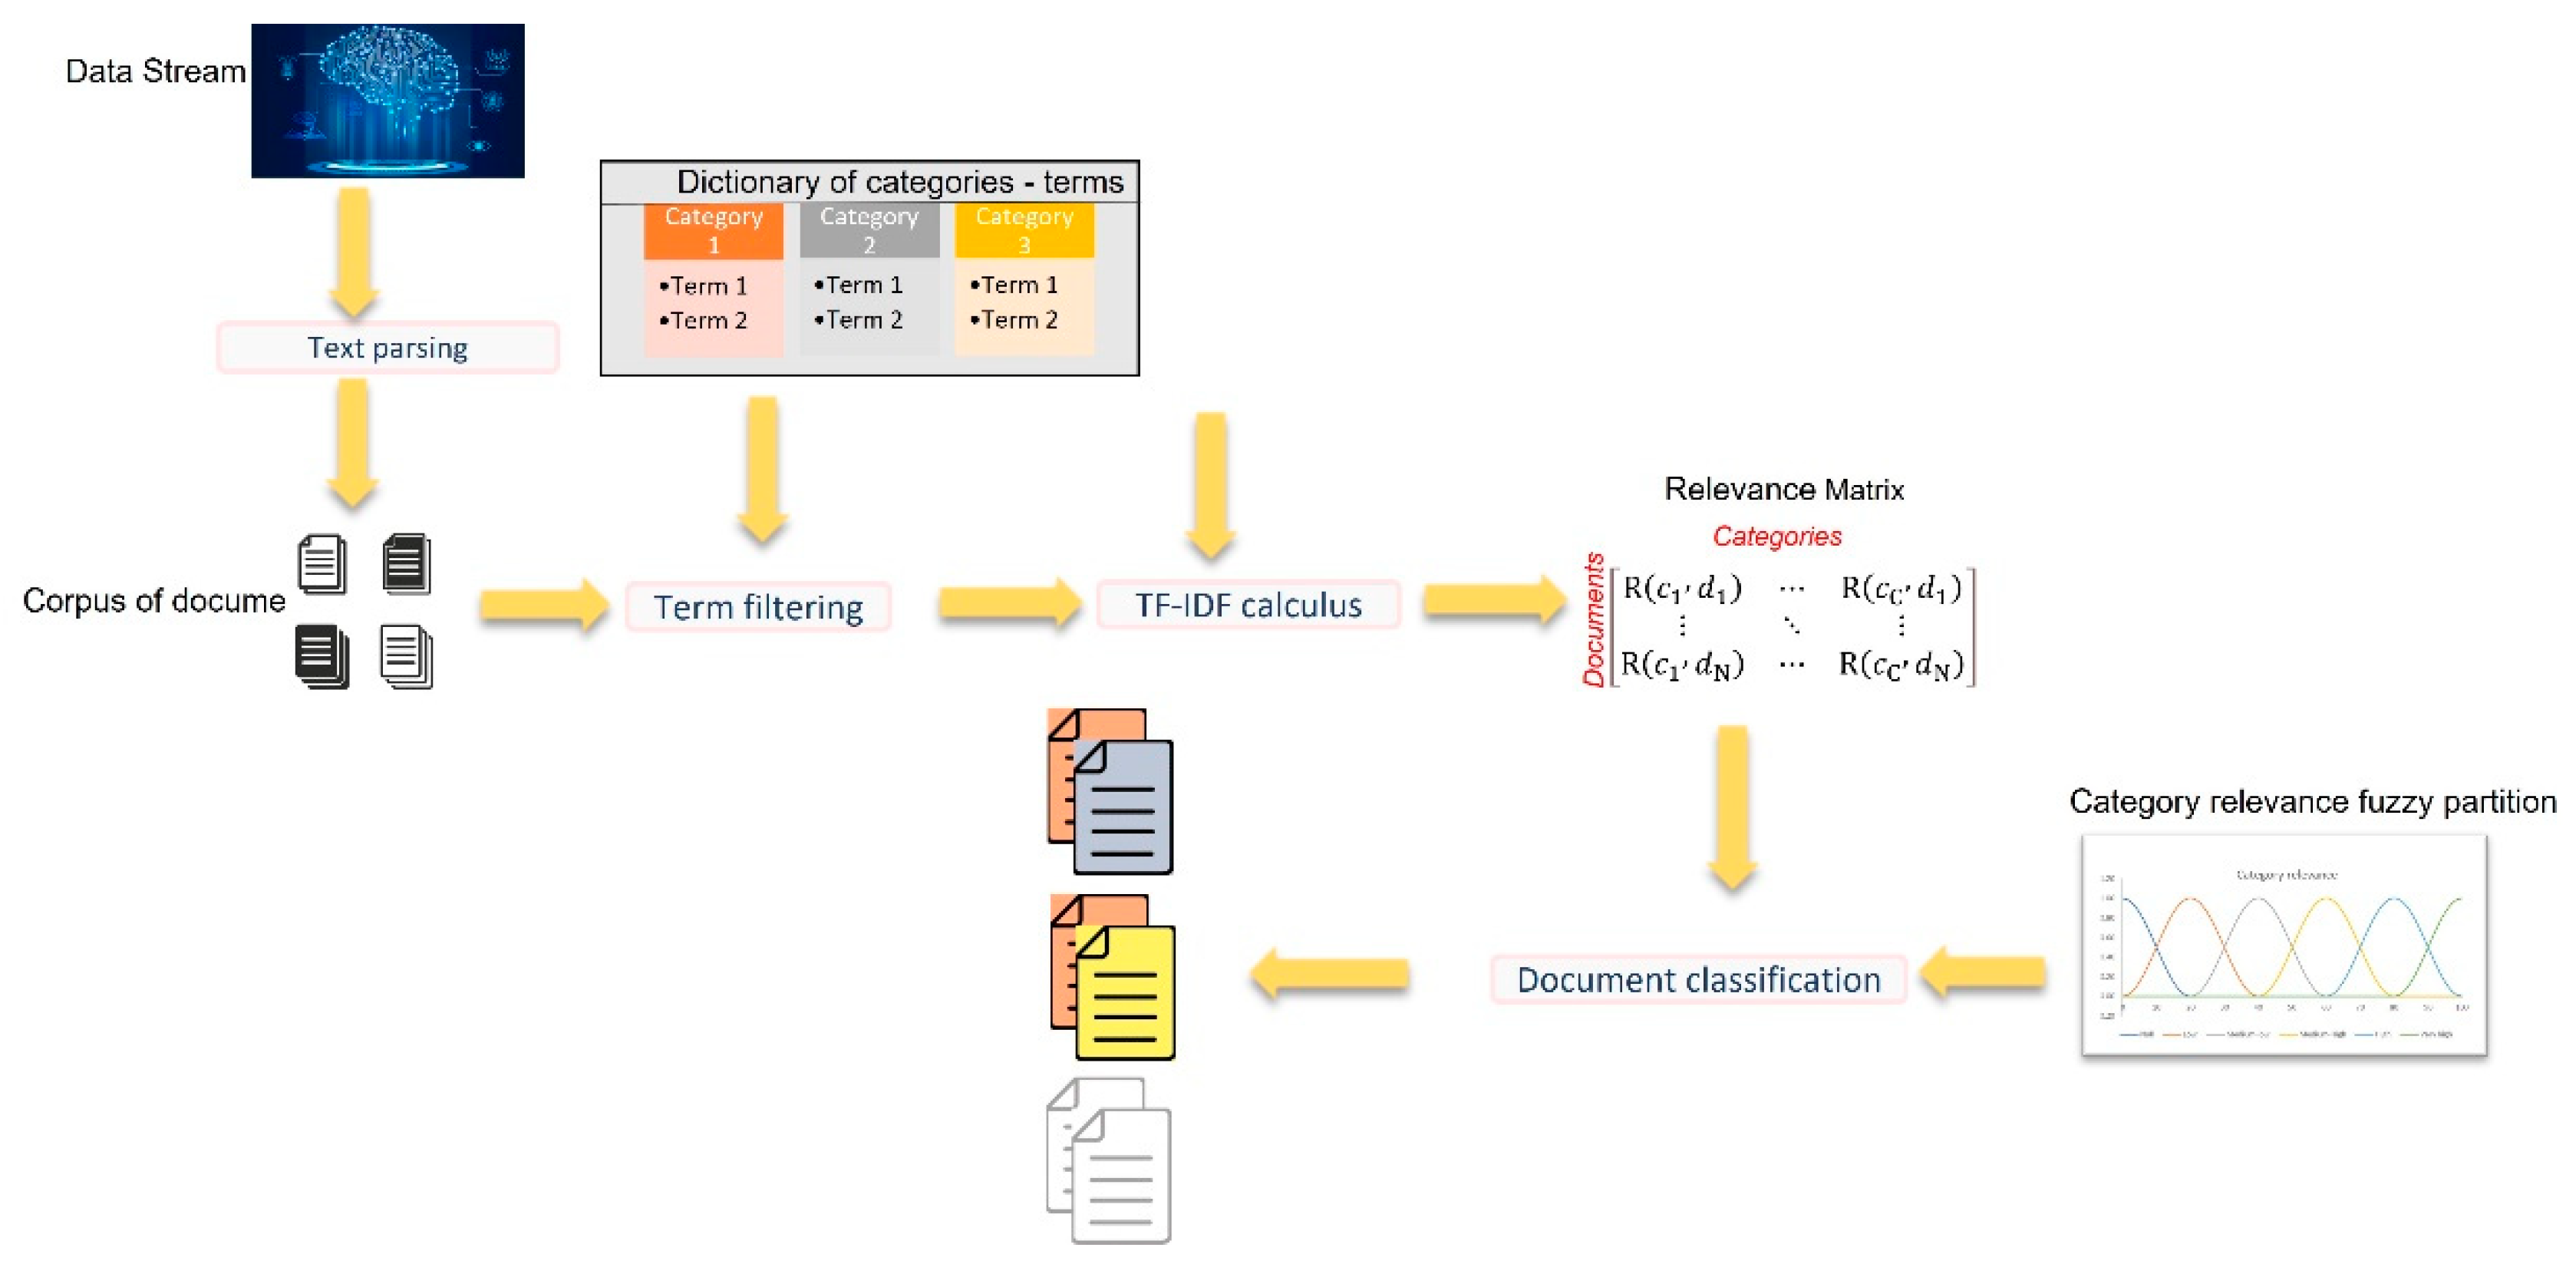
A schema of FREDoC is shown in Figure 1.
Initially, the user produces a dictionary of categories—terms, in which all terms falling into a category are collected and assigned to that category.
The user defines the set of categories that characterize the problem to be analyzed. Just to give an example, let us imagine that the set of categories referring to transport services most used in a tourist area are: subway, bus, tram, and private taxi. For each category, all the terms corresponding to it are collected by the user. For example, some terms associated with the subway category are: subway station, subway line, tunnel, track, quay, wagon, conductor, and train manager. A term in the dictionary is subsequently reduced to its stemmed form.
The extracted data are grouped by the text parsing component according to a set of keywords, and transformed into N documents. For example, if the data stream is given by Twitter messages, they can be grouped based on the hashtag, the time period in which the message was created, and the place from which it was sent. The content of each grouped set of data is cleaned by all the irrelevant noise information.
The term filtering component compresses each word in the document in its stemmed form, preserving its root. Then, the stemmed word is compared to the terms enclosed in the dictionary of categories. If a match is found, the word in the document is associated with its category. Then, the term filtering component produces a matrix called relevance matrix, whose elements represent the relevance of a category in a document, measured by computing the term frequency–inverse document frequency index (for short, TF-IDF), an index used to evaluate the importance of the terms of a category with respect to a document. The relevance matrix elements are given by the formula:
where is the relevance of the jth category in the ith document and the term is the TF-IDF of the terms of the jth category in the ith document.
If Trj is the set of the terms assigned to the jth category, the term is given by the sum of the formula:
where is the TF-IDF index of the term tr, in the ith document.
The component document classification evaluates the relevance of the jth category in the ith document using a Ruspini fuzzy partition [20] constructed initially on the domain [0, 1] of the TF-IDF relevance matrix measures and called category relevance fuzzy partition. For each document and category, this component computes the membership degree of the category relevance fuzzy sets, assigning as relevance of the jth category in the ith document the linguistic label of the fuzzy set to which the relevance measure R(cj,di) belongs with a higher membership degree.
The document is classified assigning it to the categories whose relevance is greater than or equal to a specific threshold.
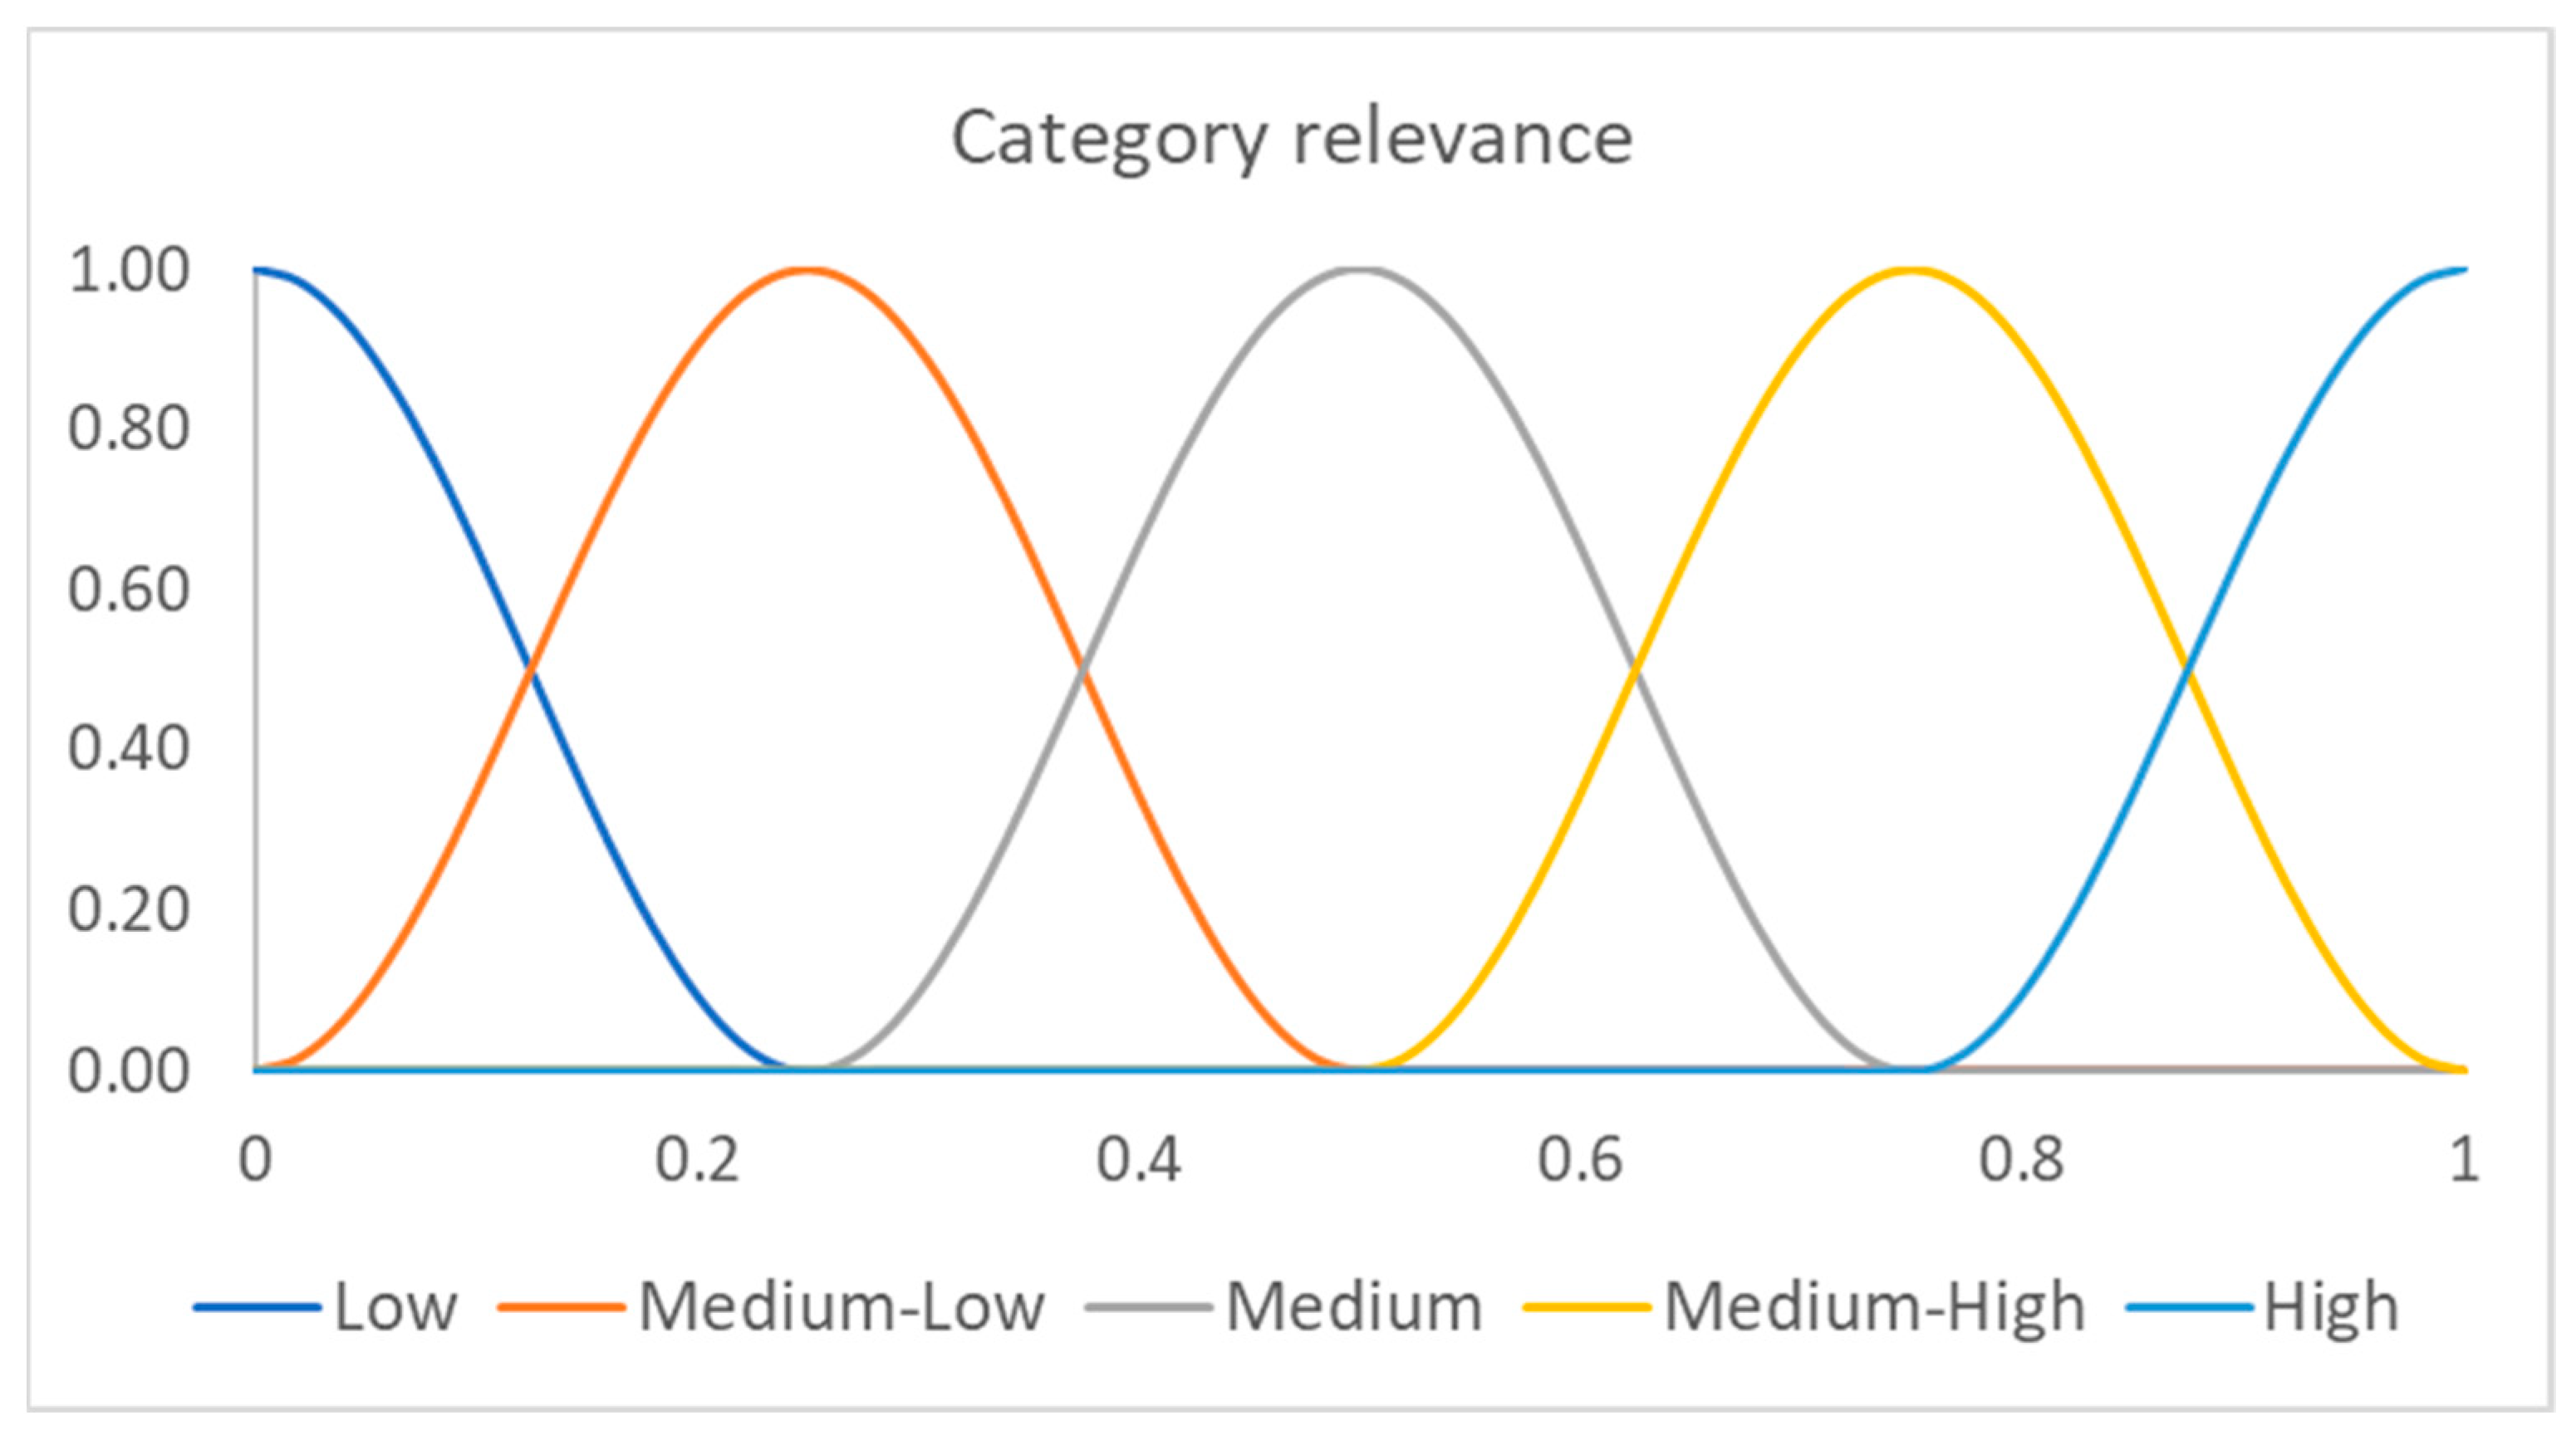
For example, let the category relevance fuzzy partition be composed by the following five ordered fuzzy sets: low, medium-low, medium, medium-high, high, constructed as in Figure 2, in which cosinusoidal fuzzy sets are generated.
The fuzzy sets are ordered according to the relevance value in which the membership function has the maximum value. In this example, the order sequence is: low → medium-low → medium → medium-high → high.
Let the fixed threshold be medium. If to a category is attributed a relevance in a document greater than or equal to medium, it is considered, otherwise it is discarded.
As an example, let us assume that the relevance in the ith document of each of the four categories has been calculated on the basis of Formula (1), as reported in Table 1. These relevance values are the values in the ith row of the relevance matrix.
The highest membership degrees are highlighted in bold in Table 1.
The only category whose relevance in the document will be considered negligible is tram, as its relevance (low) is below the threshold (medium).
The multiple classification of a document is completed by assigning the relevance of each category it is labeled with. The ith document is classified as in Table 2.
3. The Proposed GIS-Based Framework
In our framework, the FREDoC model is encapsuled in a GIS-based platform.
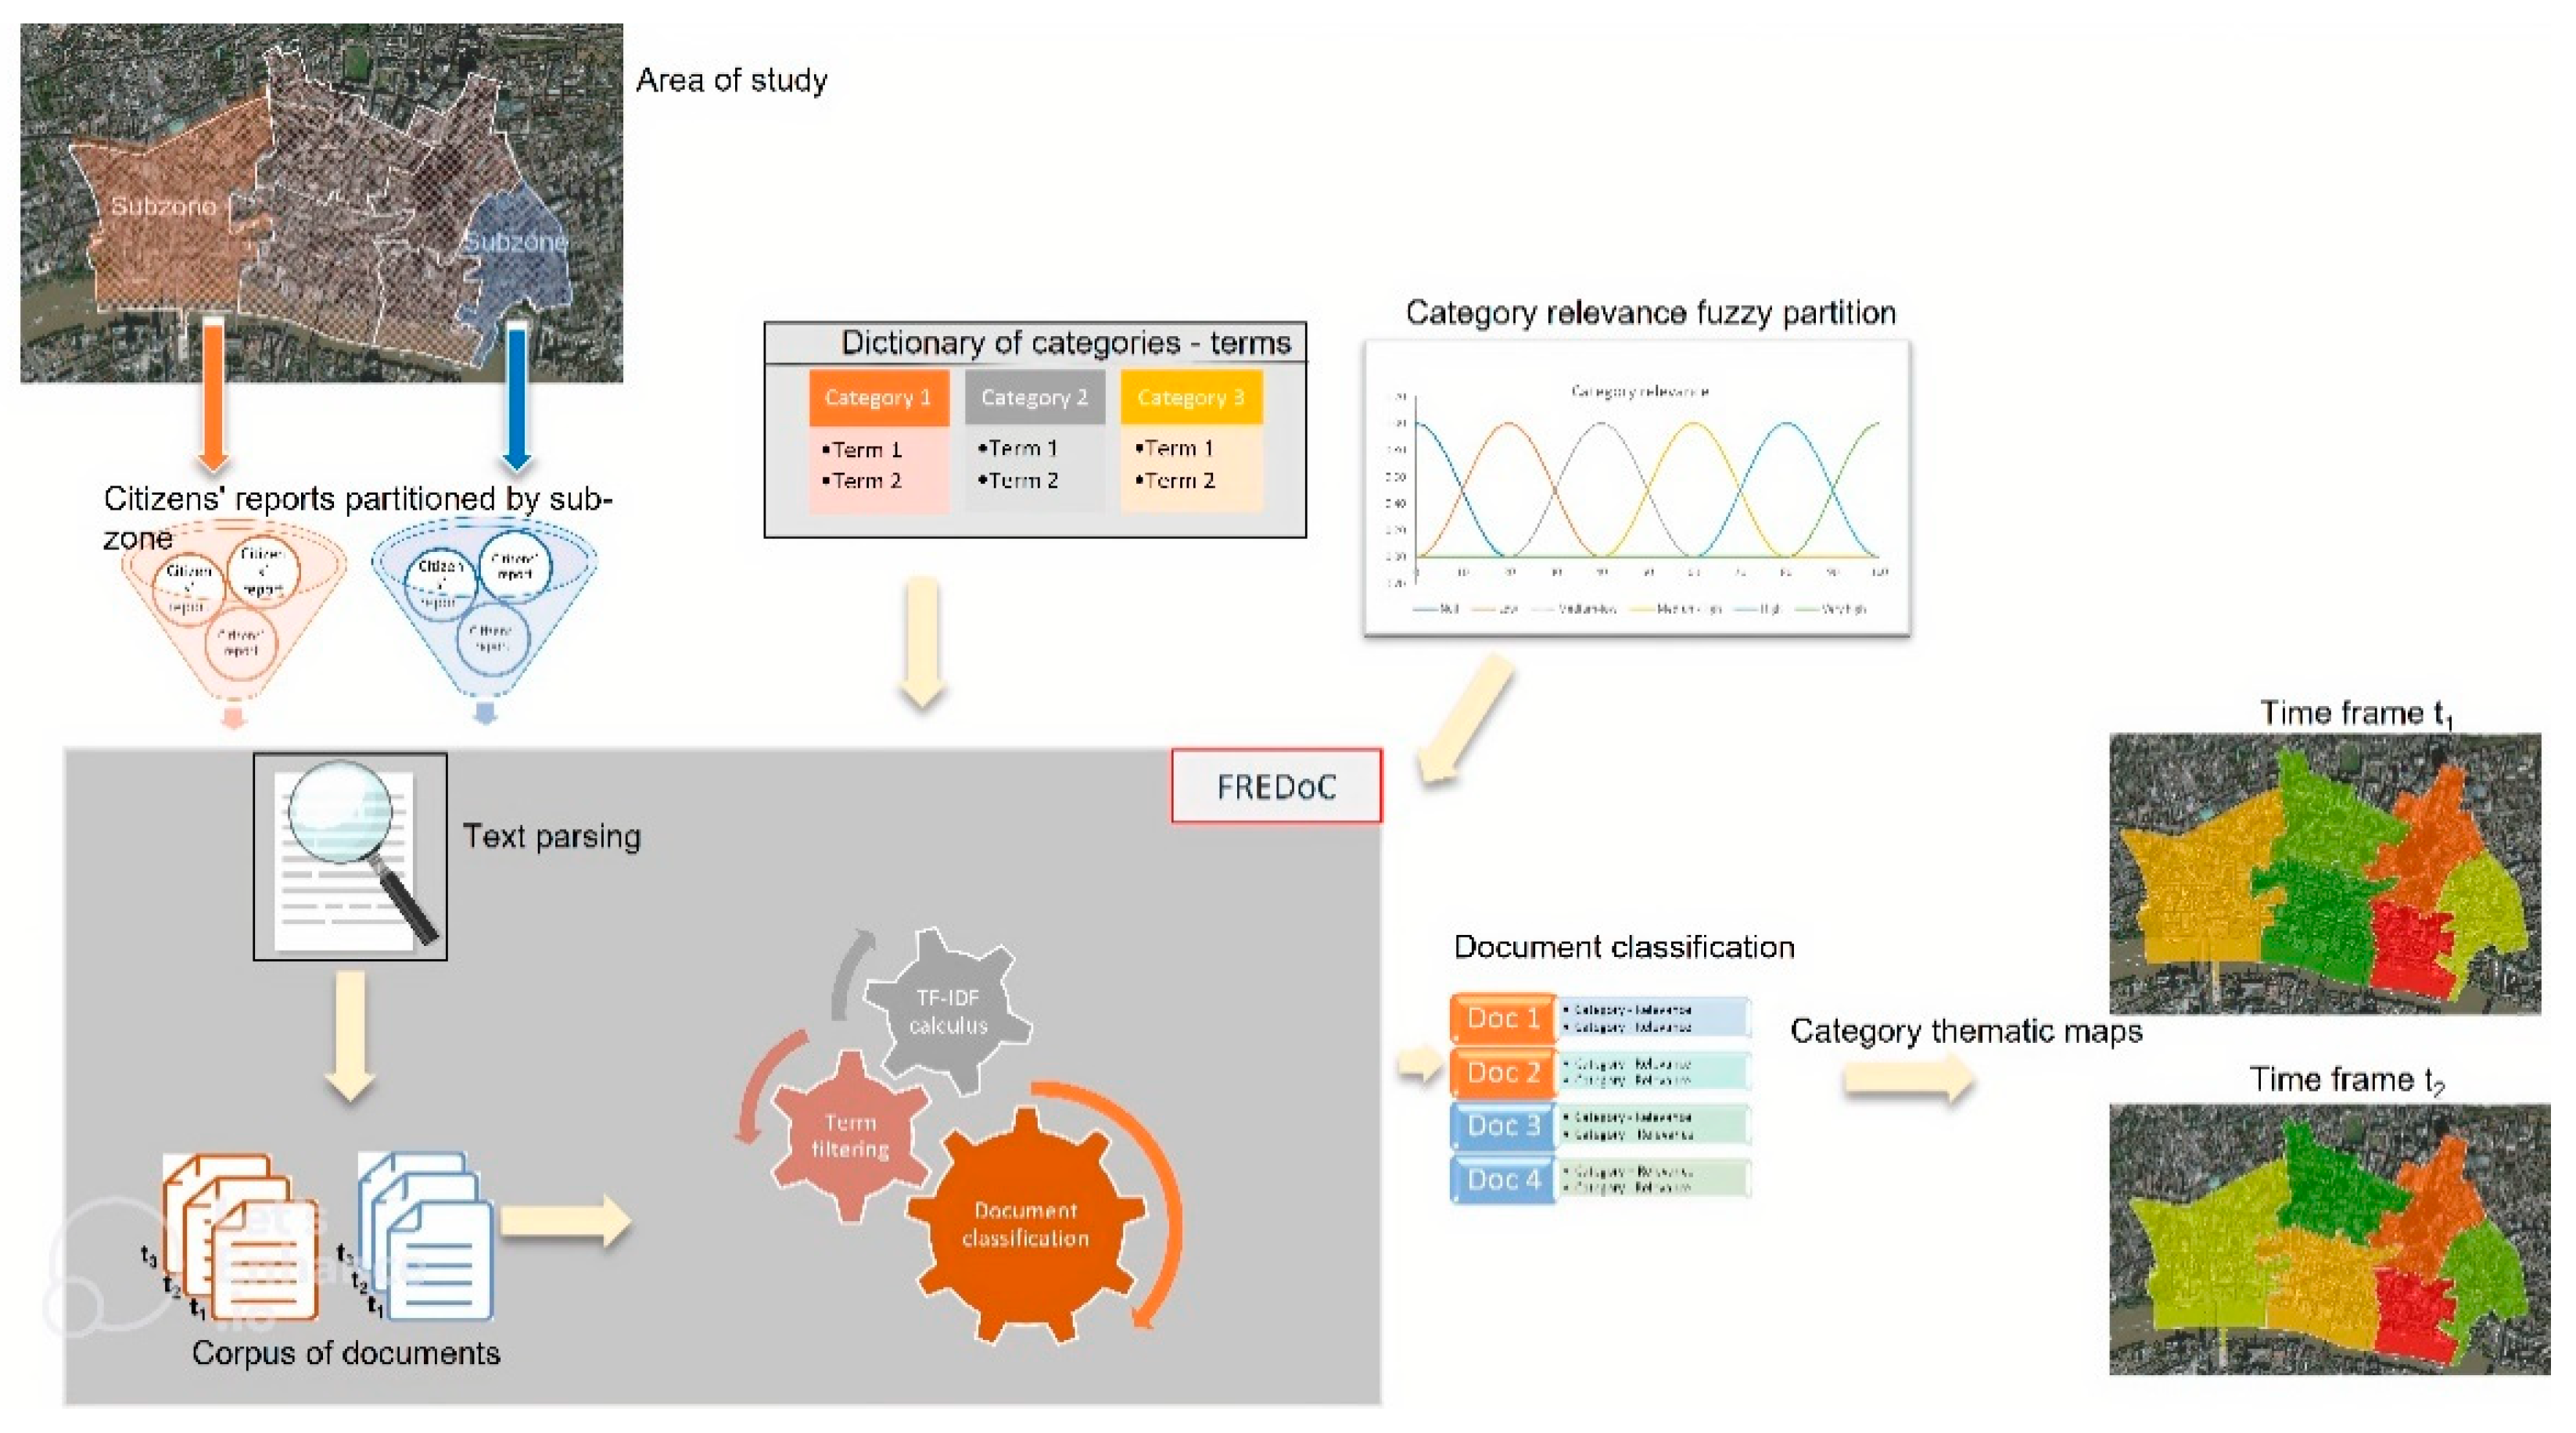
In Figure 3 is schematized the proposed GIS-based framework.
The user of the framework is a decision maker who intends to analyze the distribution in the study area of the relevance of each category and its evolution over time. To analyze its evolution over time, he sets a unitary time interval, the time frame, dividing the survey period of the information into time frames.
The urban study area is partitioned into subzones by the user, who aims to obtain for each time frame a thematic map of the subzones classified by relevance of a specific category.
The dictionary of categories is prepared by the user dividing the entities that characterize the problem to be analyzed into categories. For example, in an analysis problem of the reported instability in urban areas, a possible subdivision into categories could be the following:
- -
- Disruption on the road
- -
- Failure to buildings
- -
- Disruption on public green areas
- -
- Malfunctions in public lighting
- -
- Malfunctions to the sewer system
Terms that refer to a specific category are assigned in the dictionary to that category. Examples of terms related to the disruption on the road category are: pothole, chasm, landslide, pavement, etc. Examples of terms related to the failure to buildings category are: plaster, cornice, gutter, roof, balcony, etc.
Furthermore, the user constructs the fuzzy partition of the relevance of a category, called category relevance fuzzy partition, assigning the number of fuzzy sets and, for each fuzzy set, its membership function and linguistic label.
After constructing the category relevance fuzzy partition, the FREDoC model is executed in order to classify documents constructed by acquiring the reports made by citizens. These reports are made by citizens using institutional or social channels and are connected to the problem to be analyzed; they are collected and grouped by subzone and time frame.
To assign a report to a sub-zone, a geocoding process can be performed in order to georeference the report as a point on the map and assign it to the sub-zone in which it is included. For example, if the report refers to a street address, the geocoding process is implemented by acquiring the toponymic dataset of the study area.
FREDoC creates the corpus of documents, filters the terms in the documents, and computes the TF-IDF index values of each category in each document. Then, it classifies the documents, assigning to each category its fuzzy relevance in the document, as in the example in Table 1.
Unlike the FREDoC framework proposed in [16], we do not use a relevance threshold, as the aim of our framework is to create thematic maps of the subzones relating to a category and a time frame in which all relevance levels are considered.
Finally, thematic maps of the classified subzones are constructed for each time frame.
Each document refers to a specific subzone and a specific time frame. A thematic map of a category in the study area referred to a time frame is constructed, assigning to each subzone the relevance attributed to the category in the document associated with the subzone and the time frame. In this way, it is possible to analyze the evolution over time of the relevance of a category.
A pseudo-code of the algorithm is shown in Algorithm 1.
| Algorithm 1: GIS-based category classification. |
 |
The next section shows the results of the application of our framework for the study of the major problems of instability on open spaces and the built environment identified, starting from the reports made by citizens. The study area is made up of the urban fabric of the city of Naples.
The surface of Naples is partitioned into ten municipalities, which are urban areas with functions of organizational and managerial autonomy. Municipalities are able to decide directly on matters that are important for the lives of citizens.
The dataset used in these tests is the archive of citizens’ alarm reports collected by the Civil Protection of the Campania region, a body that protects citizens from damage that may derive from natural events.
4. Results and Discussion
4.1. Case Study Application
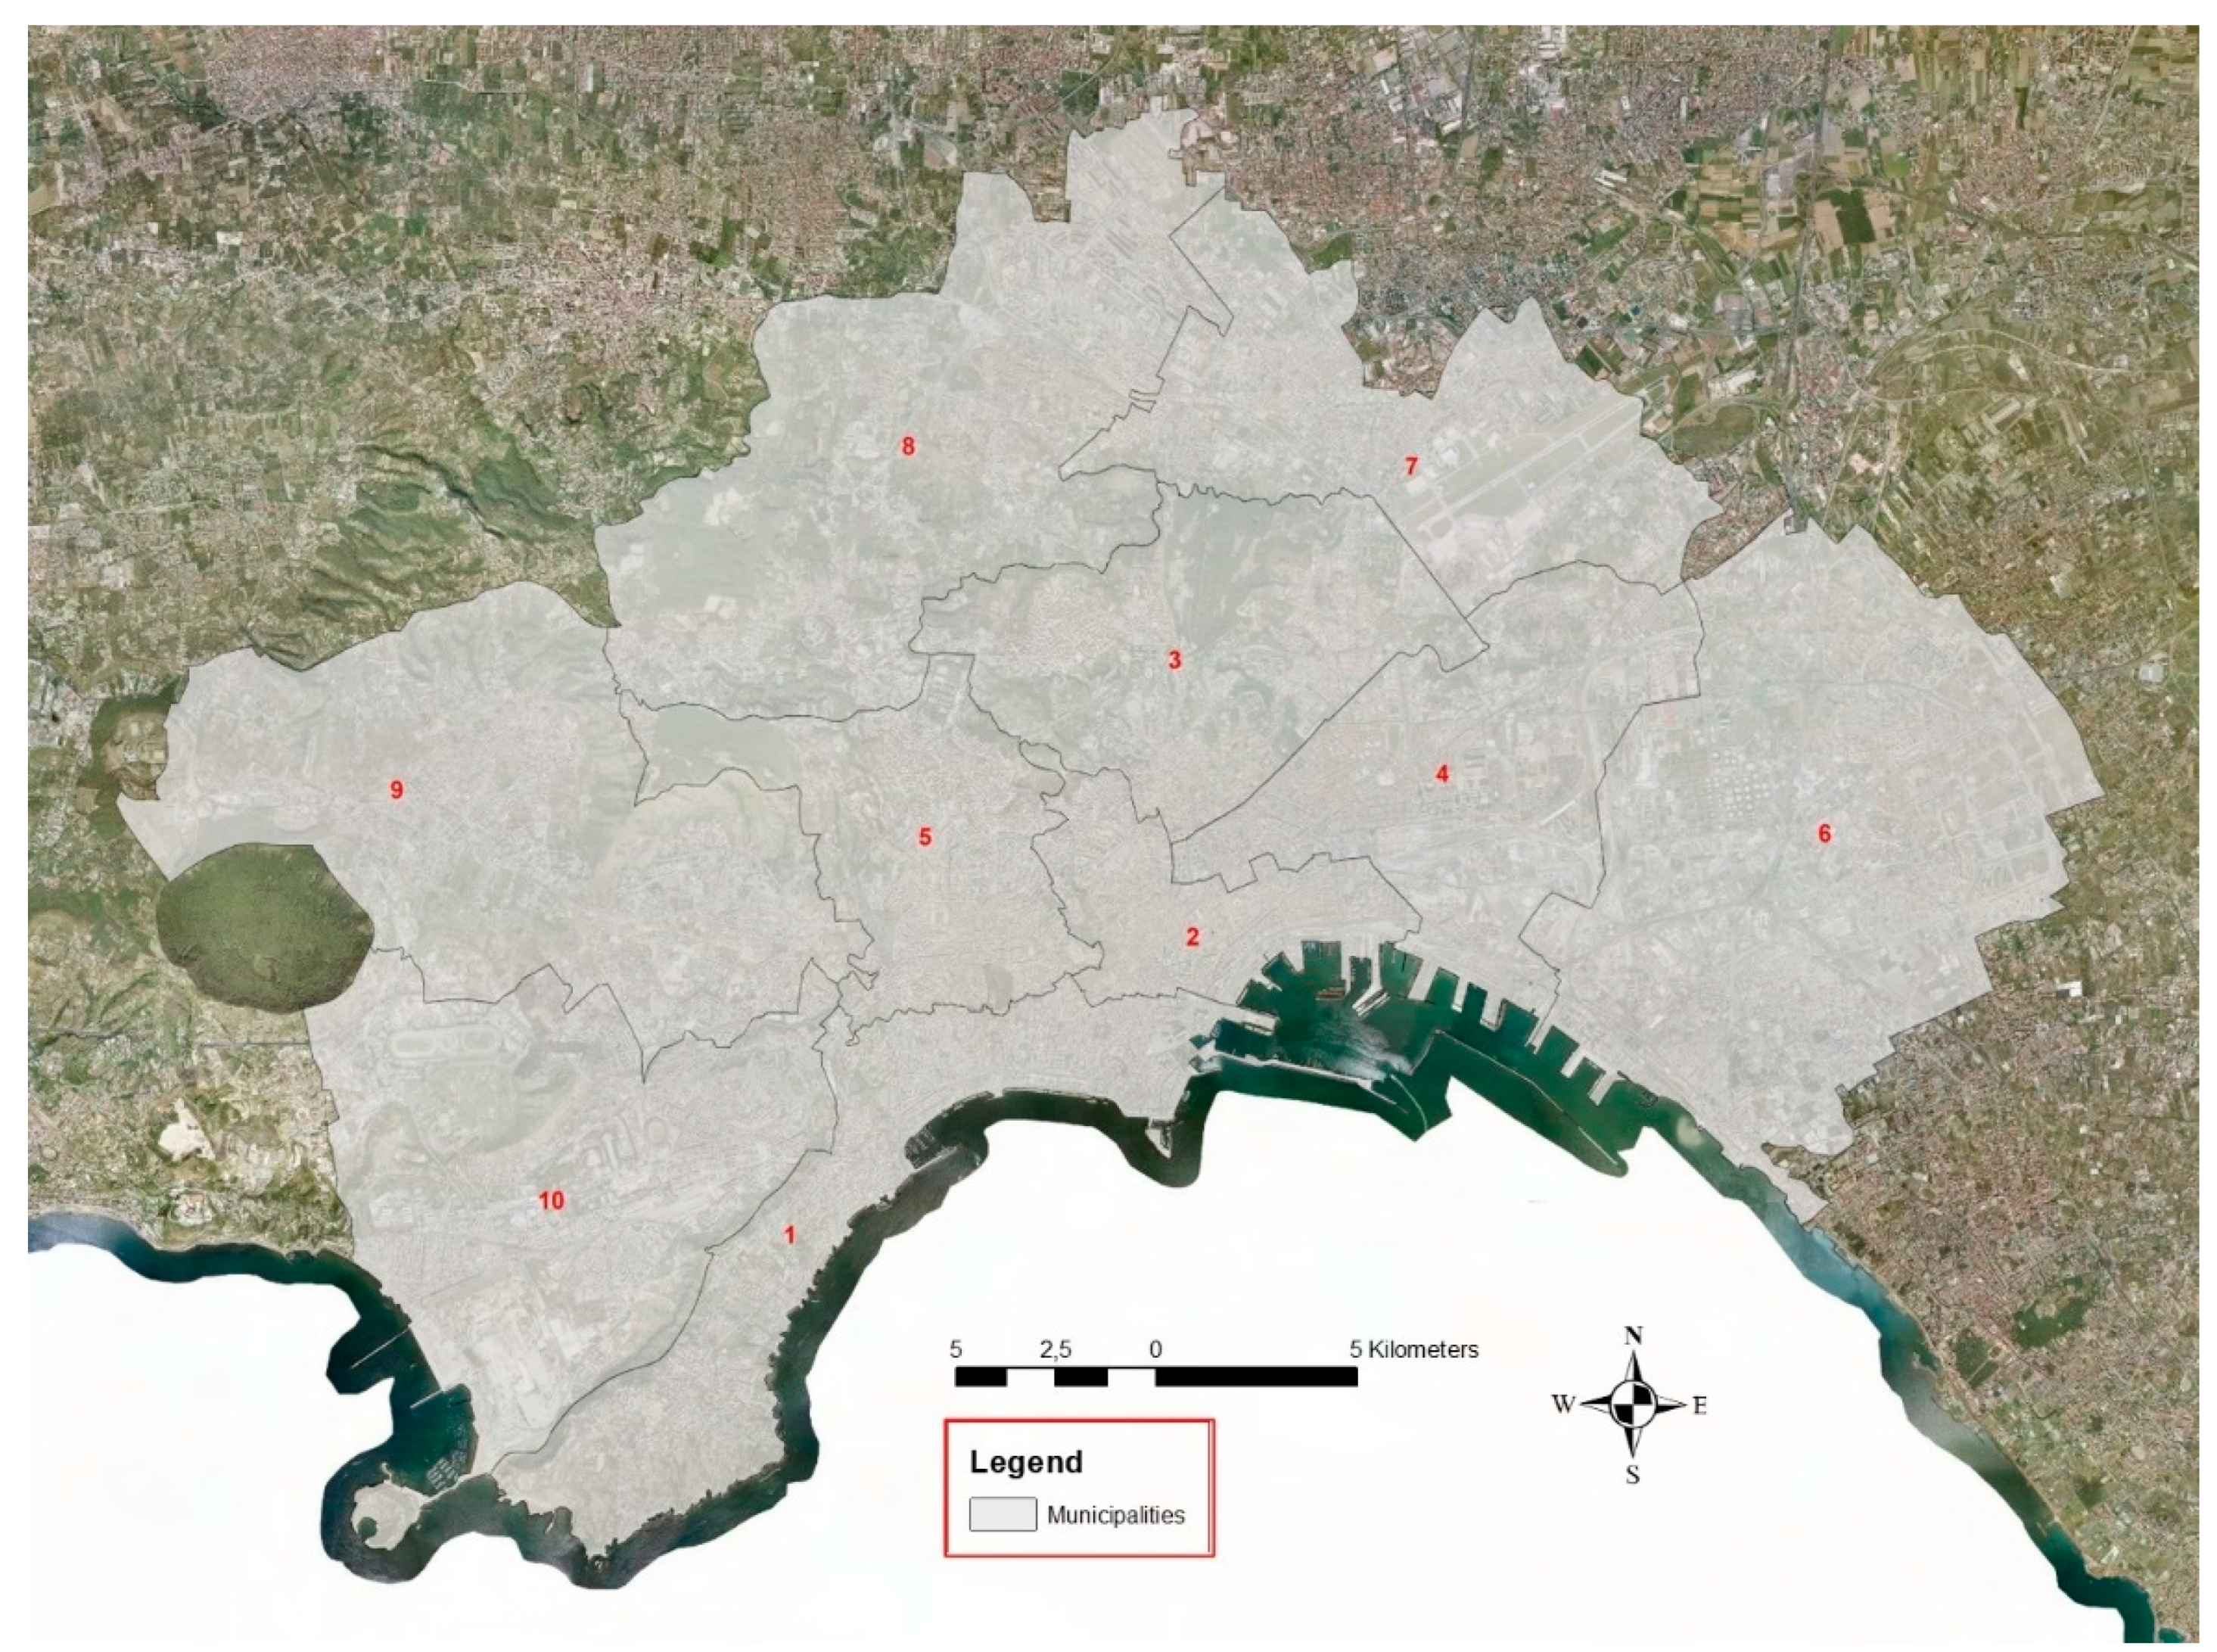
We’ve applied our framework on the city of Naples; it is partitioned into ten municipalities with organizational and functional autonomy in urban management. Figure 4 shows the study area spatially partitioned into its ten municipalities; each municipality constitutes a subzone of the urban study area.
In Table 3 are shown the size, the number of inhabitants, and the population density of the ten subzones.
Municipalities 2,3,4, and 5 are the most densely populated; they characterize the historic and the urban city center. Municipality 1 is the one that includes the wealthiest population. The other municipalities include peripheral areas of the city.
The GIS-based framework was implemented using the ESRI ArcGIS Desktop 10.8 tool (https://www.esri.com/en-us/arcgis/products/arcgis-desktop/resources Accessed on 1 April 2022). The Python package ESRI ArcPy (https://www.esri.com/en-us/arcgis/products/arcgis-python-libraries/libraries/arcpy Accessed on 1 April 2022) was used to implement our classification model. The address locator functionalities of the tool were used to build the geocoding functions of citizens’ reports.
The dataset used consists of the Civil Protection archive with the reports of citizens made from 2014 to 2021. It has been partitioned into eight subsets, containing the reports made in one year, considering time frames lasting one year. The eight subsets have a similar size of approximately 104 user reports.
In the preprocessing phase, the street map of the city provided by the municipality of Naples was used to geo-localize the reports.
The aim of these tests is to assign, for each time frame, the relevance of a specific category of instability to a subzone, taking into consideration the following set of five categories of instability (Table 4):
The user reports a failure to the Civil Protection. All reports referring to a sub-zone and a year are grouped in a single document. The dictionary of categories—terms, contains, for each category, the set of terms that identify it and connote the urban entity to which the category refers. Table 5 shows the main terms assigned to each category in the dictionary.
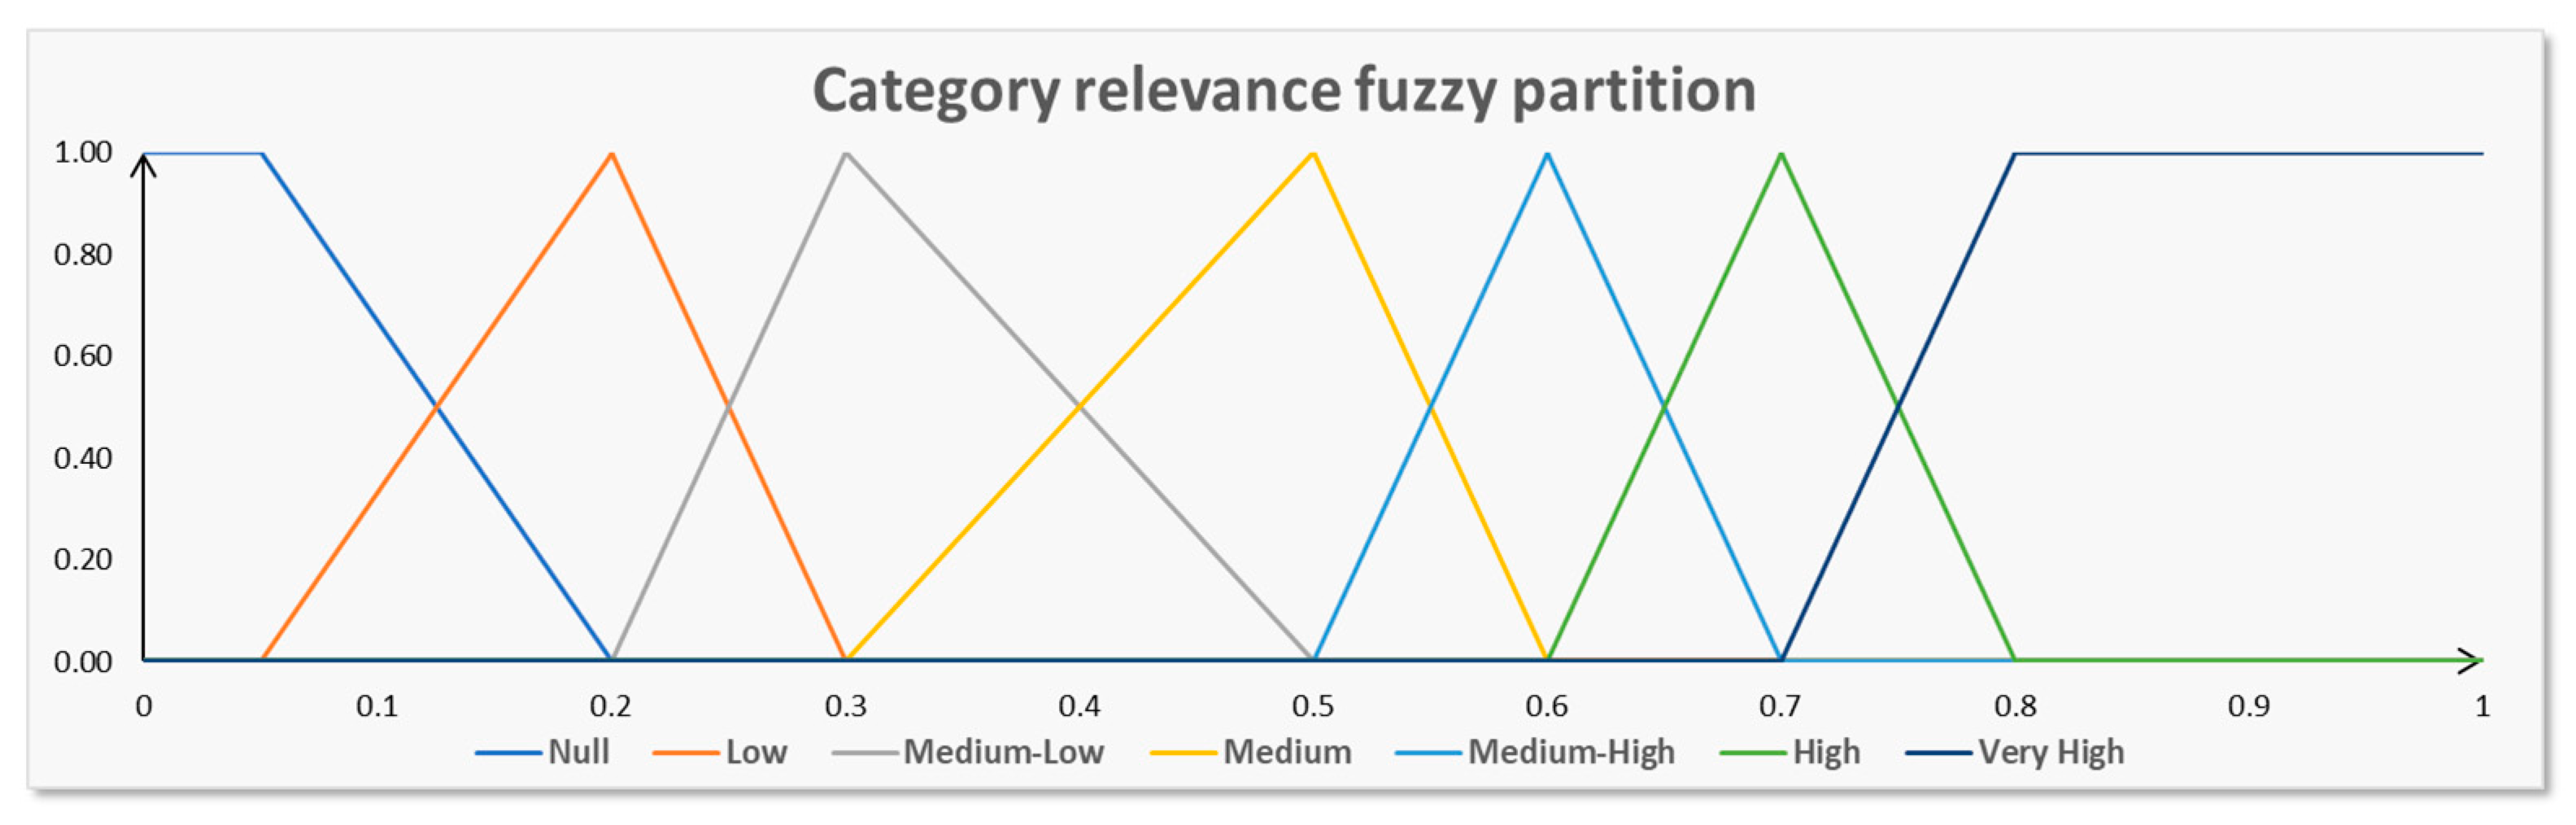
The category relevance fuzzy partition is made up of seven fuzzy sets, defined in the interval [0, 1]. The linguistic labels of the seven fuzzy sets are: null, low, medium-low, medium, medium-high, very high. This fuzzy partition is shown in Figure 5.
4.2. Experimental Results
After executing our GIS-based framework, are obtained the category thematic maps for each category and time frame.
For the sake of brevity, the thematic maps obtained for all categories in the years 2020 and 2021 are shown and discussed below.
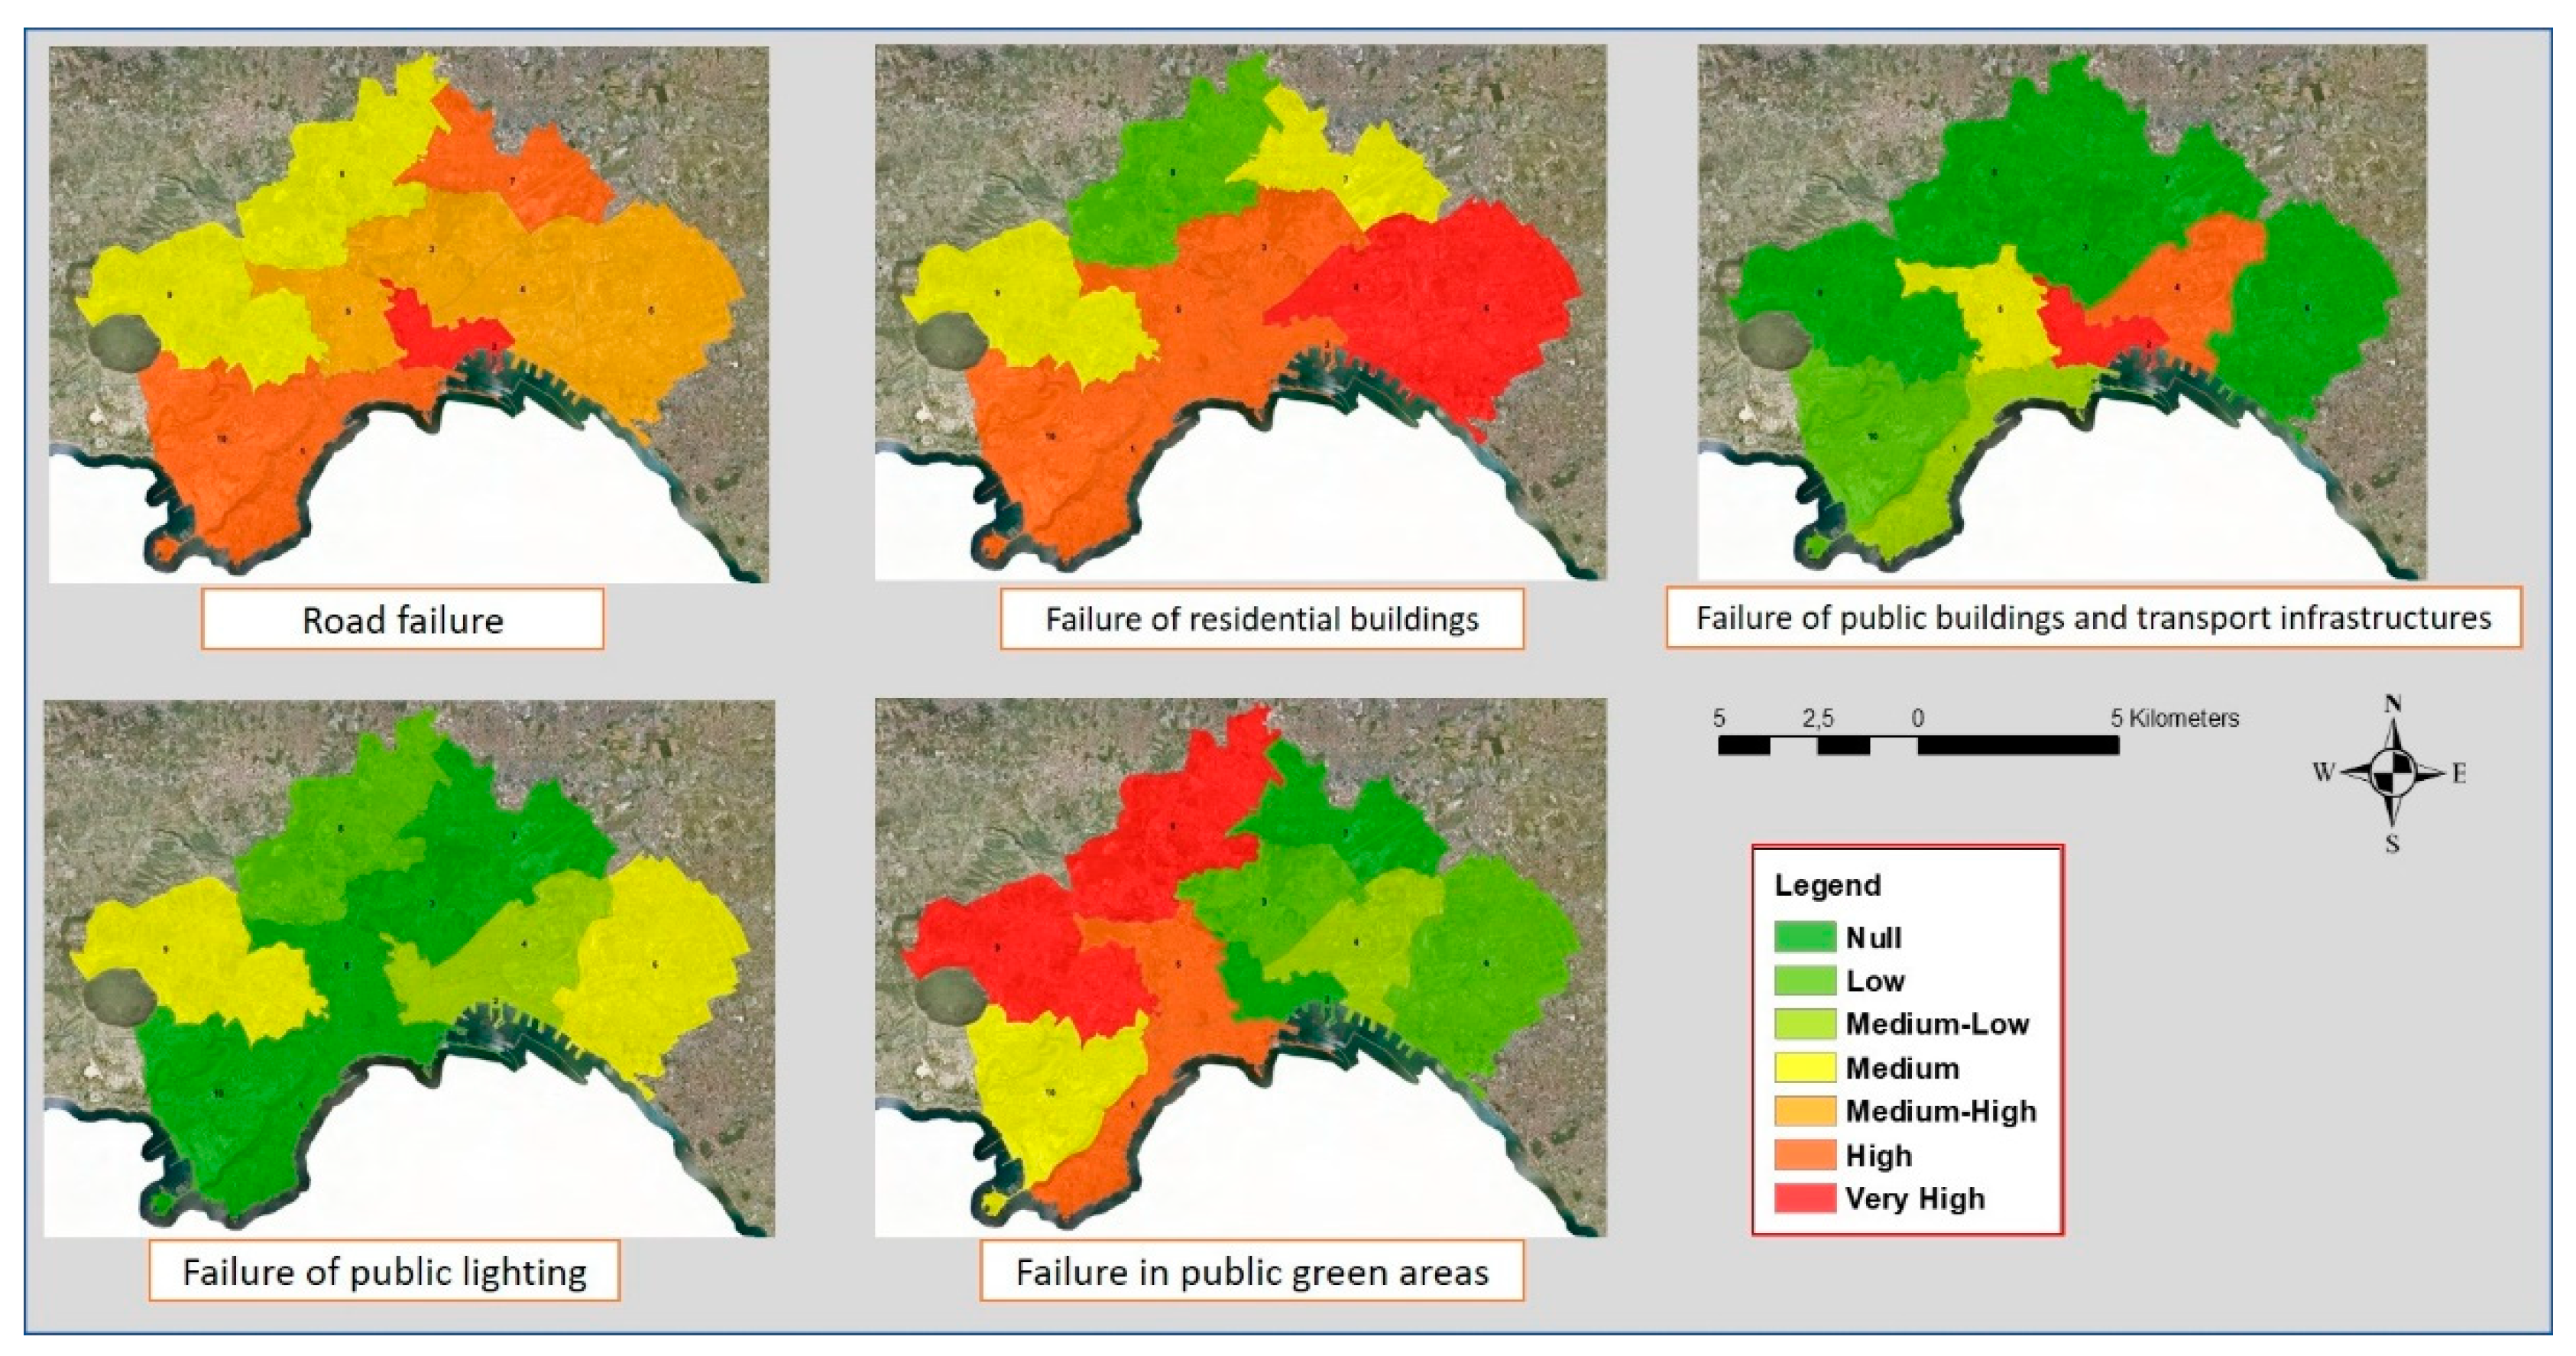
In Figure 6 are shown the category thematic maps obtained for the five categories in the year 2020. Each subzone is classified assigning to it the class corresponding to the relevance of the category in it.
The results in Figure 5 show that in all the subzones, the relevancies of the categories road failure and failure of residential buildings are not negligible or significant, taking values from medium to very high. Conversely, in all subzones, the relevance of the category failure of public lighting is not negligeable only in the municipalities 6, 8, and 9, taking the value medium. The relevance of the category failure of public buildings and transport infrastructures is significant in the municipalities 2 and 4, corresponding to the historic city center. The relevance of the category failure in public green areas is significant in the municipalities 1, 5, 8, and 9, corresponding to areas that are not historical or recently urbanized and in which there are public green areas of different types.
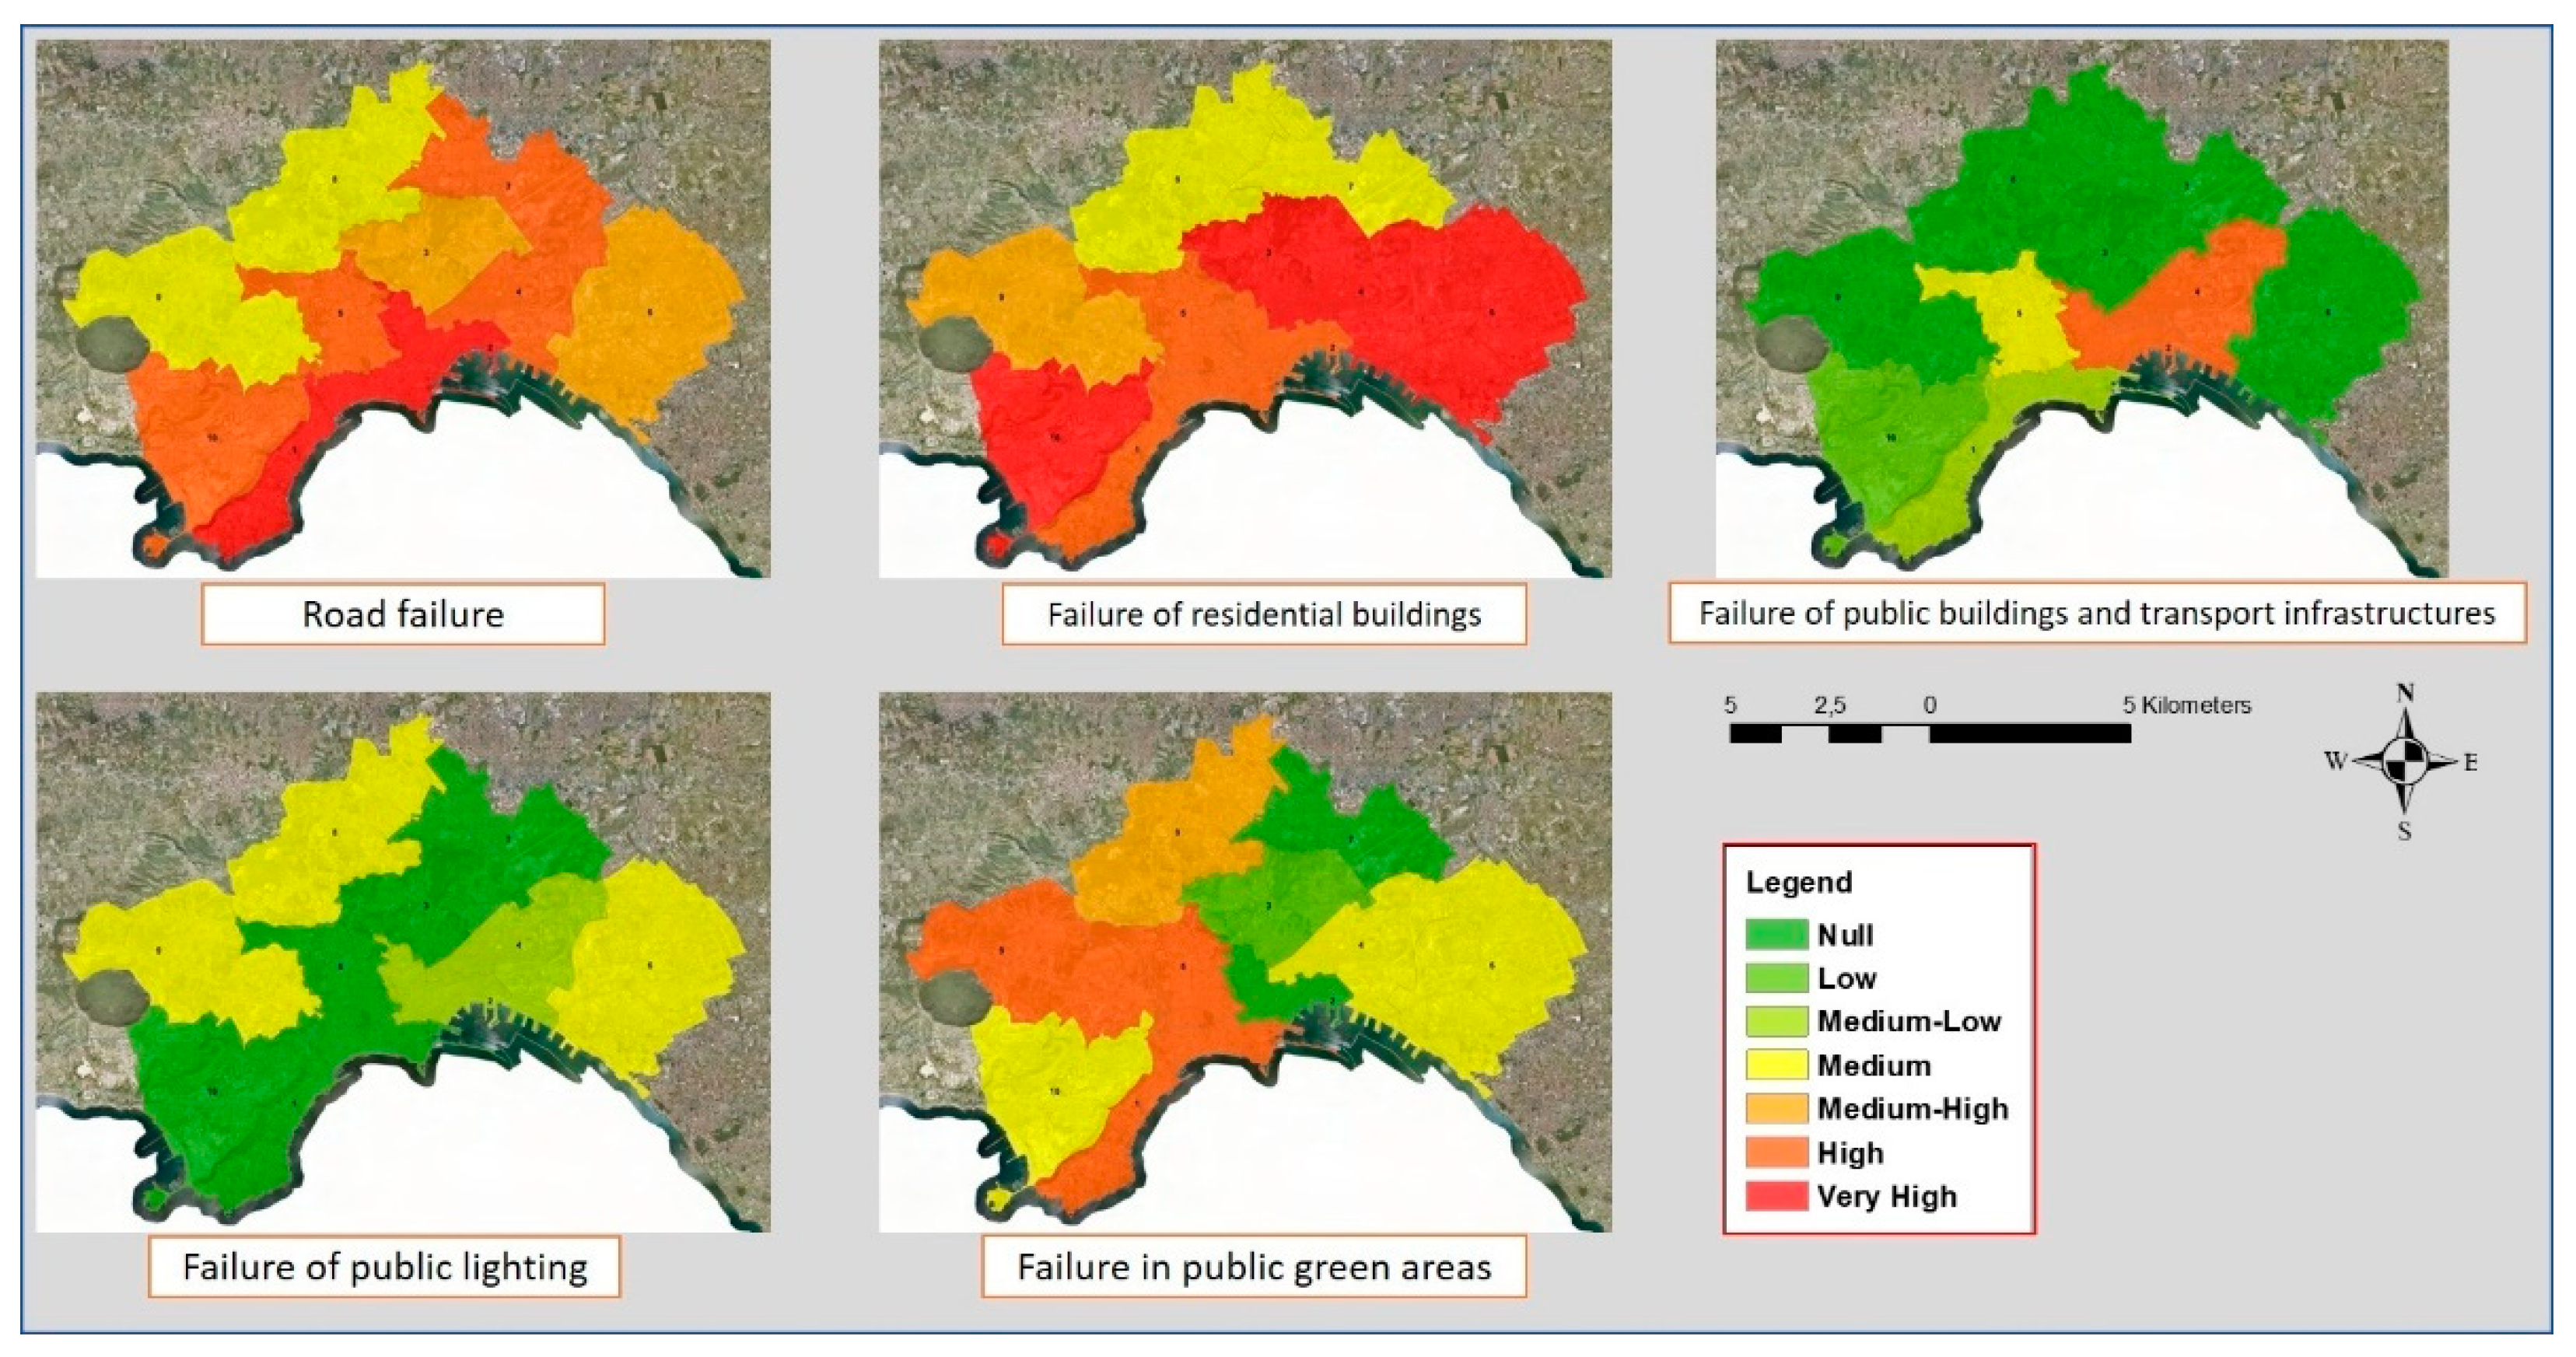
In Figure 7 are shown the category thematic maps obtained for the five categories in the next year, 2021.
The results in Figure 7 show that in 2021, the relevance of the road failure category was significant in all microzones, similar to that measured for 2020, further intensifying in municipality 1. The relevance of the failure of residential buildings category further increased in 2021. The relevancies of the category Failure of public buildings and transport infrastructures and failure in public green areas remained on average unchanged with respect to those measured for the previous year. The relevance of the failure in public green areas category is on average less than that measured in 2020; it changed from very high to medium-high in municipality 8 and from very high to high in municipality 9; only in municipalities 4 and 6 it enhanced and was classified as medium.
The use of the framework makes it possible to monitor the variation over time of the relevance of a category in a subzone. The results obtained in two different types of subzones are shown below: a municipality with luxury housing, rich in parks including extensive public green areas, and a densely populated historic center type municipality with poor green areas.
Table 6 shows for the years from 2014 to 2021 and for each of the five categories, the category relevancies obtained in municipality 1. This municipality includes two wealthy residential districts with luxury homes: Chiaia and Posillipo. Furthermore, it is rich in parks and is close to an extensive green hilly area.
The category C1 (road failure) has a consistent relevance that oscillates over time between high and very high. The relevance of the category C2 (failure of residential buildings) oscillates over time between medium-high and high. The category C3 (failure of public buildings and transport infrastructures) it is not very significant as its relevance fluctuates over time between low and medium low; in fact, public buildings and transport infrastructures located in this municipality are rare. Similarly, the relevance of the category C4 (failure in public lighting) oscillate between null and low. The relevance of category C5 (failure in public green areas) fluctuates between values medium-high and high. In fact, the municipality contains several parks and is close to an extensive green hilly area subject to numerous reports of instability by users.
In Table 7 are shown the category relevancies obtained in municipality 2. This municipality includes the six districts that make up the historic city center: Avvocata, Montecalvario, San Giuseppe, Mercato, Pendino, and Porto. They are densely populated and lacking in public green areas.
The relevance of the category C1 (road failure) remains very significant (very high), without changing over time. The category C2 (failure of residential buildings) has a consistent relevance that oscillates over time between high and very high. In fact, in municipality 2 there are many old residential buildings that require maintenance work and are the cause of the numerous intervention reports. Unlike municipality 1, in municipality 2, the relevance of the category C3 (failure of public buildings and transport infrastructures) is significant, fluctuating over time between medium-high, high, and very high; in fact, this municipality includes many public buildings and transport infrastructures. Similarly to what was found for the municipality 1, the relevance of category C4 (failure in public lighting) is not significant, oscillating between null and medium-low. The relevance of category C5 (failure in public green areas) always takes the value null, without changing over time. This is due to the fact that municipality 2 is very poor in public green areas.
4.3. Discussion of the Results
These results show that through the use of our GIS-based framework, by partitioning an urban study area into a subzone and defining the dictionary of categories into which a specific problem is broken down, it is possible to analyze which are the categories that most interest each subzone and how the relevance of a category varies over time.
The use of a light multiclassification approach based on fuzzy partitioning of the relevance of a category allows offering the decision maker a clear linguistic interpretation of the thematic map of the distribution of the relevance of a category in the urban area of study. Furthermore, the framework makes it possible to analyze the trend of the relevance of a category over time in the subzones into which the study area is partitioned. The experimental results have shown that the relevance of a category and its trend in a municipality can be related to the characteristics of the municipality. For example, in municipality 2, the relevance of the failure of residential buildings category remains significant over time, due to the presence of a large number of old residential buildings that require continuous maintenance. On the contrary, the relevance of the category failure in public green areas remains negligible over time as the municipality is characterized by a historic urban center dense with poor public green areas.
Therefore, this framework represents a valid tool to support decision makers and urban planners in their activities.
5. Conclusions
We have proposed a GIS-based framework in which the document multiple classification model FREDoC presented in [16] has been implemented to analyze, starting from information entered in a not structured way over time by users, which of the categories that make up a topic are most relevant in a specific urban area and how that relevance changes over time.
The framework was tested on the urban study area of Naples (Italy), divided into ten municipalities, analyzing the reports of urban instability made by users from 2014 to 2021. The categories that make up the study topic refer to the entities covered by the reports (roads, private buildings, public transport buildings and infrastructures, lighting network, public green areas). The data points were geo-referenced using geocoding functionalities and all datapoints relating to a municipality and a year were merged to form a document. The framework, in addition to classifying the documents by determining the relevance of each category, has produced thematic maps of the study area for each category and each year. The results show the usefulness of the framework to support the urban planner in analyzing the characteristics and evolution of an urban fabric.
We intend to carry out further experiments with the framework in the future to analyze various types of problems connected to urban systems in the presence of massive data extracted from different sources (social data, sensor data, etc.). Furthermore, in the future, we intend to improve the usability of the framework, creating a WebGIS platform that allows the user to build the dictionary of categories and the fuzzy partition of relevance in a user-friendly way, and which offers further services for viewing thematic maps and graphs of space–time trend analysis of the relevance of a category.
Author Contributions
Conceptualization, B.C. and F.D.M.; methodology, B.C. and F.D.M.; software, B.C. and F.D.M.; validation, B.C. and F.D.M.; formal analysis, B.C. and F.D.M.; investigation, B.C. and F.D.M.; resources, B.C. and F.D.M.; data curation, B.C. and F.D.M.; writing—original draft preparation, B.C. and F.D.M.; writing—review and editing, B.C. and F.D.M.; visualization, B.C. and F.D.M.; supervision, B.C. and F.D.M. All authors have read and agreed to the published version of the manuscript.
Funding
This research received no external funding.
Institutional Review Board Statement
Not applicable.
Informed Consent Statement
Not applicable.
Data Availability Statement
All data has been presented in main text.
Conflicts of Interest
The authors declare no conflict of interest.
References
- Chapelle, O.; Schölkopf, B.; Zien, A. Semi-Supervised Learning, IV Series; The MIT Press: Cambridge, MA, USA, 2007; p. 524. [Google Scholar]
- Van Engelen, J.E.; Hoos, H.H. A survey on semi-supervised learning. Mach. Learn. 2020, 109, 373–440. [Google Scholar] [CrossRef] [Green Version]
- Zhu, X. Semi-Supervised Learning Literature Survey; Technical Report 1530; University of Wisconsin—Madison: Madison, WI, USA, 2008; p. 39. [Google Scholar]
- Yarowsky, D. Unsupervised Word Sense Disambiguation Rivaling Supervised Methods. In Proceedings of the 33rd Annual Meeting of the Association for Computational Linguistics, Cambridge, MA, USA, 26–30 June 1995; Association for Computational Linguistics: Stroudsburg, PA, USA, 1995; pp. 189–196. [Google Scholar]
- Li, M.; Zhou, Z.H. SETRED: Self-training with Editing. In Advances in Knowledge Discovery and Data Mining, Proceedings of the 9th Pacific-Asia Conference, PAKDD 2005, Hanoi, Vietnam, 18–20 May 2005; Lecture Notes in Computer Science, 2005, 3518; Ho, T.B., Cheung, D., Liu, H., Eds.; Springer: Berlin/Heidelberg, Germany, 2005. [Google Scholar]
- Blum, A.; Mitchell, T. Combining labeled and unlabeled data with co-training. In Proceedings of the Annual ACM Conference on Computational Learning Theory, Madison, WI, USA, 24–26 July 1998; pp. 92–100. [Google Scholar]
- Du, J.; Ling, C.X.; Zhou, Z.H. When does co-training work in real data? IEEE Trans. Knowl. Data Eng. 2010, 23, 788–799. [Google Scholar] [CrossRef] [Green Version]
- Sun, S.; Jin, F. Robust co-training. Int. J. Pattern Recognit. Artif. Intell. 2011, 25, 1113–1126. [Google Scholar] [CrossRef]
- Kingma, D.P.; Mohamed, S.; Rezende, D.J.; Welling, M. Semi-Supervised Learning with Deep Generative Models. Adv. Neural Inf. Process. Syst. 2014, 27, 3581–3589. [Google Scholar]
- Springenberg, J.T. Unsupervised and semi-supervised learning with categorical generative adversarial networks. In Proceedings of the 4th International Conference on Learning Representations, ICLR 2016, San Juan, Puerto Rico, 2–4 May 2016; p. 20. [Google Scholar]
- Donahue, J.; Krahenbuhl, P.; Darrell, T. Adversarial feature learning. In Proceedings of the ICLR 2017, Toulon, France, 24–26 April 2017; p. 18. [Google Scholar]
- Triguero, I.; García, S.; Herrera, F. Self-labeled techniques for semi-supervised learning: Taxonomy, software and empirical study. Knowl. Inf. Syst. 2013, 42, 245–284. [Google Scholar] [CrossRef]
- Mihi, S.; Ben Ali, B.A.; El Bazi, I.; Arezki, S.; Laachfoubi, N. Multi-way Arabic Sentiment Classification Using Genetic Algorithm and Logistic Regression. In Advances in Intelligent Systems and Computing, Proceedings of the International Conference on Artificial Intelligence and Computer Vision, AICV 2021, Settat, Morocco, 28–30 June 2021; Springer: Cham, Switzerland, 2021; Volume 1377, pp. 317–325. [Google Scholar]
- Ontiveros-Robles, E.; Melin, P. Toward a development of general type-2 fuzzy classifiers applied in diagnosis problems through embedded type-1 fuzzy classifiers. Soft Comput. 2020, 24, 83–89. [Google Scholar] [CrossRef]
- Rubio, E.; Castillo, O.; Valdez, F.; Melin, P.; Gonzalez, C.I.; Martinez, G. An Extension of the Fuzzy Possibilistic Clustering Algorithm Using Type-2 Fuzzy Logic Techniques. Adv. Fuzzy Syst. 2017, 2017, 7094046. [Google Scholar] [CrossRef] [Green Version]
- Cardone, B.; di Martino, F.; Senatore, S. A fuzzy partition-based method to classify social messages assessing their emotional relevance. Inf. Sci. 2022, 594, 60–75. [Google Scholar] [CrossRef]
- Cardone, B.; di Martino, F.; Sessa, S. GIS-based fuzzy sentiment analysis framework to classify urban elements according to the orientations of citizens and tourists expressed in social networks. Evol. Intell. 2021, 2021, 10. [Google Scholar] [CrossRef]
- Di Martino, F.; Senatore, S.; Sessa, S. A lightweight clustering-based approach to discover different emotional shades from social message streams. Int. J. Intell. Syst. 2019, 34, 1505–1523. [Google Scholar] [CrossRef]
- Kaymak, U.; Setnes, M. Fuzzy clustering with volume prototype and adaptive cluster merging. IEEE Trans. Fuzzy Syst. 2002, 10, 705–712. [Google Scholar] [CrossRef]
- Ruspini, E.H. A new approach to clustering. Inf. Control. 1969, 15, 22–32. [Google Scholar] [CrossRef] [Green Version]
Figure 1.
Schema of FREDoC.

Figure 2.
Example of category relevance fuzzy partition composed by five fuzzy sets.

Figure 3.
Schema of the proposed GIS-based framework.

Figure 4.
The study area of Naples (Italy) and its 10 municipalities.

Figure 5.
Category relevance fuzzy partition.

Figure 6.
Category thematic maps obtained in the year 2020.

Figure 7.
Category thematic maps obtained in the year 2021.


Table 1.
Example of classification of documents: relevance of the categories in a document.
| Category | Relevance | Membership Degree to the Fuzzy Sets | ||||
|---|---|---|---|---|---|---|
| Low | Medium-Low | Medium | Medium-High | High | ||
| Subway | 0.89 | 0.00 | 0.00 | 0.00 | 0.41 | 0.59 |
| Bus | 0.67 | 0.00 | 0.00 | 0.23 | 0.77 | 0.00 |
| Tram | 0.11 | 0.59 | 0.41 | 0.00 | 0.00 | 0.00 |
| Private taxi | 0.43 | 0.00 | 0.18 | 0.82 | 0.00 | 0.00 |
Table 2.
Example of classification of a document.
| Docum | Class | Relevance | Class | Relevance | Class | Relevance |
|---|---|---|---|---|---|---|
| di | Subway | High | Bus | Medium-high | Private taxi | Medium |
Table 3.
Surface and population data in the ten municipalities of Naples (Italy).
| Subzone | Area (km2) | Number of Inhabitants | Population Density (Inhabitants/km2) |
|---|---|---|---|
| 1 | 8.80 | 82,673 | 9553.07 |
| 2 | 4.56 | 91,536 | 20,073.68 |
| 3 | 9.51 | 103,633 | 10,897.27 |
| 4 | 9.27 | 96,078 | 10,364.40 |
| 5 | 7.42 | 11,9978 | 16,169.54 |
| 6 | 19.28 | 138,641 | 7190.92 |
| 7 | 10.26 | 91,460 | 8914.23 |
| 8 | 17.45 | 92,616 | 5307.51 |
| 9 | 16.56 | 106,299 | 6419.02 |
| 10 | 14.16 | 102,192 | 7416.38 |
Table 4.
Set of categories of instability.
| Category | Description |
|---|---|
| C1 | Road failure |
| C2 | Failure of residential buildings |
| C3 | Failure of public buildings and transport infrastructures |
| C4 | Failure in public lighting |
| C5 | Failure in public green areas |
Table 5.
Main terms of each category in the dictionary.
| Category | Main Terms |
|---|---|
| C1 | sidewalk, road pavement, pedestrian area, cycle path, roadway, central reservation, square, intersection, widening, roundabout, large square, elevated, road junction |
| C2 | plaster, cornice, gutter, roof, balcony, foundations, entrance door, entrance hall, staircase, perimeter walls, windows, courtyard. |
| C3 | school, museum, church, monument, town hall, stadium, sports hall, train station, subway station, municipal swimming poo |
| C4 | light pole, lampion, flashing lamp, pendant lamps, spotlights, neon, luminous sign. |
| C5 | flowerbed, meadow, forest, scrubland, gardens carousels. |
Table 6.
Municipality 1 category relevancies measured annually from 2014 to 2021.
| Year | C1 | C2 | C3 | C4 | C5 |
|---|---|---|---|---|---|
| 2014 | High | Medium-high | Low | Null | Medium-high |
| 2015 | High | Medium-high | Medium-low | Null | Medium-high |
| 2016 | High | Medium-high | Medium-low | Null | High |
| 2017 | Very high | High | Medium-low | Null | High |
| 2018 | Very high | High | Low | Low | High |
| 2019 | Very high | High | Low | Low | Medium-high |
| 2020 | High | High | Low | Null | High |
| 2021 | Very high | High | Medium-low | Null | High |
Table 7.
Municipality 2 category relevancies measured annually from 2014 to 2021.
| Year | C1 | C2 | C3 | C4 | C5 |
|---|---|---|---|---|---|
| 2014 | Very high | Very-high | Medium-high | Null | Null |
| 2015 | Very high | High | High | Null | Null |
| 2016 | Very high | High | High | Low | Null |
| 2017 | Very high | High | High | Medium-low | Null |
| 2018 | Very high | Very high | Very high | Low | Null |
| 2019 | Very high | Very high | Very high | Low | Null |
| 2020 | Very high | High | Very high | Medium-low | Null |
| 2021 | Very high | High | High | Medium-low | Null |
Publisher’s Note: MDPI stays neutral with regard to jurisdictional claims in published maps and institutional affiliations. |
© 2022 by the authors. Licensee MDPI, Basel, Switzerland. This article is an open access article distributed under the terms and conditions of the Creative Commons Attribution (CC BY) license (https://creativecommons.org/licenses/by/4.0/).
Share and Cite
MDPI and ACS Style
Cardone, B.; Di Martino, F. A GIS-Based Fuzzy Multiclassification Framework Applied for Spatiotemporal Analysis of Phenomena in Urban Contexts. Information 2022, 13, 248. https://0-doi-org.brum.beds.ac.uk/10.3390/info13050248
AMA Style
Cardone B, Di Martino F. A GIS-Based Fuzzy Multiclassification Framework Applied for Spatiotemporal Analysis of Phenomena in Urban Contexts. Information. 2022; 13(5):248. https://0-doi-org.brum.beds.ac.uk/10.3390/info13050248
Chicago/Turabian StyleCardone, Barbara, and Ferdinando Di Martino. 2022. "A GIS-Based Fuzzy Multiclassification Framework Applied for Spatiotemporal Analysis of Phenomena in Urban Contexts" Information 13, no. 5: 248. https://0-doi-org.brum.beds.ac.uk/10.3390/info13050248
Note that from the first issue of 2016, this journal uses article numbers instead of page numbers. See further details here.