
Two-Way Contact Network Modeling for Identifying the Route of COVID-19 Community Transmission


1
Department of Forensics, Sungkyunkwan University, Seoul 03063, Korea
2
Capital Market Judiciary Enforcement Unit, Financial Supervisory Service, Seoul 07321, Korea
3
Department of Police Science, Korea National Police University, Asan 10050, Korea
*
Author to whom correspondence should be addressed.
Informatics 2021, 8(2), 22; https://0-doi-org.brum.beds.ac.uk/10.3390/informatics8020022
Submission received: 13 February 2021
/
Revised: 17 March 2021
/
Accepted: 22 March 2021
/
Published: 25 March 2021
Abstract
:In this study, we address the problem originated from the fact that “The Corona 19 Epidemiological Research Support System,” developed by the Korea Centers for Disease Control and Prevention, is limited to analyzing the Global Positioning System (GPS) information of the confirmed COVID-19 cases alone. Consequently, we study a method that the authority predicts the transmission route of COVID-19 between visitors in the community from a spatiotemporal perspective. This method models a contact network around the first confirmed case, allowing the health authorities to conduct tests on visitors after an outbreak of COVID-19 in the community. After securing the GPS data of community visitors, it traces back to the past from the time the first confirmed case occurred and creates contact clusters at each time step. This is different from other researches that focus on identifying the movement paths of confirmed patients by forward tracing. The proposed method creates the contact network by assigning weights to each contact cluster based on the degree of proximity between contacts. Identifying the source of infection in the contact network can make us predict the transmission route between the first confirmed case and the source of infection and classify the contacts on the transmission route. In this experiment, we used 64,073 simulated data for 100 people and extracted the transmission route and a top 10 list for centrality analysis. The contacts on the route path can be quickly designated as a priority for COVID-19 testing. In addition, it is possible for the authority to extract the subjects with high influence from the centrality theory and use them for additional COVID-19 epidemic investigation that requires urgency. This model is expected to be used in the epidemic investigation requiring the quick selection of close contacts.
1. Introduction
The Korea Centers for Disease Control and Prevention (KCDC) developed “The Corona 19 Epidemiological Investigation Support System (COVID-19 EISS)” to track the confirmed COVID-19 cases on 10 April 2020 [1]. This system, referred to as Table 1, was setup to supplement the shortcoming of the conventional manual process of collecting and analyzing the relevant information of confirmed cases, which involves writing official documents between 28 related organizations and wired communications. This system identifies the transmission route by analyzing the GPS line of the confirmed case using the location information obtained from mobile base stations and the credit card payment of the confirmed COVID-19 case to help the investigation of the authority. The government announced that the authority could obtain many-sided identification of the movement paths of the confirmed cases in less than 10 min via real-time information exchange between related institutions [2].
This system is beneficial because it has computerized the collection of various information, which was previously performed manually. However, from an analytical perspective, the system provides only a basic geographic information analysis, which is relatively new to the field of Social Network Analysis (SNA). SNA refers to the technique that identifies the location and behavior of nodes on a network, and analyzes the structural characteristics and effects on the relationship between each node [3].
Currently, the location information of the confirmed case provided by each carrier is not obtained GPS data of the mobile phone, but from the base station access information (latitude and longitude), which has an inconsistent accuracy, ranging from an estimated 50 to 200 m in urban areas. Consequently, to perform a proper spatial analysis, it is imperative for the authority to identify confirmed COVID-19 cases within 200 m of the base station access information. The above system extracts culprits from the area within the radius of a certain distance provided by a global commercial program such as ESRI [4] ArcGIS PRO. However, the spatial analysis algorithm that calculates distance, coordinates, and angle from the nearest point seems to have been almost nonexistent. Furthermore, even in the base station data, each component, such as base station radius error, is different from each carrier, and some carriers are reluctant to reveal their customers’ information of the latitude and longitude, which can lead to many errors in the location information analysis process.
However, to analyze the transmission route that confirms the relationship between cases who have been contacted in the past, the SNA algorithm and visualization technology with timeline analysis should be applied. Notwithstanding, there is no function available for the network analysis algorithm (centrality, subgroup, Equivalence, 2-mode network analysis, etc.), infographic presentation, and analysis of big data in this system.
Finally, the quarantine authorities randomly check the access information of the confirmed case from the mobile base stations to identify the transmission route, and then classify contacts via face-to-face epidemic investigation. If the contact is identified as an infected individual, the transmission route is obtained by analyzing the movement path of the second confirmed case and repeating the epidemic investigation. To trace contacts, after obtaining the movement path of the first confirmed case, it is necessary to conduct epidemic investigations for the contacts individually. This explains why it takes tremendous time and effort for the authority to find the transmission route of the infection.
Contributions. In this study, we will attempt to deal with the model to trace the transmission route of COVID-19 confirmed cases via SNA. In the community spread case, close contacts are identified based on the first confirmed case. As it is traced back to the past, it takes the selectivity process, extracting the second and third contacts of close contacts. By means of this process, the contact network [4] can be modeled for the confirmed cases and contacts of community spread. If the source of infection is identified on the contact network, this model offers the following:
- The transmission route between the first confirmed case and the source of infection can be extracted.
- The contacts present on the route are supposed to be designated as the priorities for COVID-19 testing.
- The quarantine authority could use the centrality theory to recognize the influence of confirmed cases and contacts in the contact network for the epidemic investigation.
That is, the priorities for COVID-19 testing from the contact network can quickly be identified. The contact network model proposed in this study is not to deny COVID-19 EISS, but to propose a function to quickly extract the priorities for COVID-19 testing. I shall not dwell on how effective this model is added to the actual system.
Chapter 2 deals with related work. We discuss research about SNA, COVID-19, epidemic investigation. After that in chapter 3 background theory is described to help the reader understand this paper. This chapter contains close graph model, clustering algorithm, and centrality analysis. The next chapter 4 deals with contact network modeling. This describes how the model will work and how it is structured. The different algorithm is explained and how it is used in the model. In chapter 5 the results from the experiment are listed and discussed. This shows how we can extract the priorities for COVID-19 testing. Chapter 6 is a conclusion that evaluates results and suggests future work.
2. Related Work
SNA is composed of a node and a link, with two nodes directly connected by a link. The social network can improve cost efficiency by extracting the shortest distance and minimum cost path via path analysis between the nodes [5] by modeling the connection structure and the status of nodes on a graph [6]. The social network is utilized in a variety of fields, such as a road network for analyzing spatial structures, a capital network for financial transactions, and a friend-to-friend network for the relationship and the interaction of the behavior. Regarding the spread of the infection, referred to as Table 2, studies have been conducted to verify the transmission route of the infection and identify its hub by plotting the patient variance using a heat map containing data from patients that hospitalized for colds [7]. In recent months, many attempts have been made to mitigate the spread of COVID-19 infections by utilizing social networks in each field owing to the declaration of COVID-19 announced as a global pandemic by the World Health Organization (WHO). To prevent this disease from spreading, a method was suggested to involve deleting links on the spreadable path after the identification of main nodes (Hub, Pulsetaker, and Gatekeeper) in SNA [8]. In addition, to control the spread of COVID-19 inside the company, the method is proposed to designate self-quarantine subjects in case a person was identified to have close contact with infected patients [9]. In relation to COVID-19 pandemic, there is also a study analyzing the average number of contacts by the trend of confirmed cases in China, Italy, and United States [10]. To prevent the spread of COVID-19, the spatially explicit model for the lockdown strategy has been proposed from a geographical perspective [11].
Generally, recent studies on the spread of COVID-19 tend to focus on the level of isolating confirmed cases and contacts by simply using the link composed by the social network from a spatial perspective. Currently, there is no study on modeling a method to predict the transmission route by tracing back to the past point while concentrating on the confirmed COVID-19 case spatiotemporally, in the community spread case. The purpose of this study is to propose the method that prevents infection from spreading by swiftly identifying the transmission route of COVID-19 and conducting COVID-19 testing for the visitor to the infected area from a spatiotemporal perspective.
There is a research that tracks the movement path of the confirmed case based on IoT with anonymous RFID information stored in the blockchain [12]. The location information from the mobile device is very useful to track the movement paths of the confirmed cases and the contacts. There is a research to track the location of the contacts by using the confirmed case’s mobile application anonymizing personal information [13] via polling, to prevent the personal information exposure after the confirmed case is identified [14]. Countries, such as the United Kingdom, Australia, Singapore, and Korea, developed the mobile applications to identify the location of the confirmed case. In particular, the UK developed the contact tracking app that can be converted to an Apple and Google model [15]. And Sarkar et al. [16] has proposed a data driven decision-making and smartphone-based contact tracing app model for the organizations to combat of COVID-19. And there is also a proposal for an application function that enables non-confirmed persons to respond by monitoring confirmed cases via a crowdsourcing solution [17]. However, there is an issue as to whether the disclosure of the confirmed case’s location does not violate the Personal Information Protection Act [18]. The Korean government stipulates that the public health safety is immune from the Personal Information Protection Act to actively mitigate the community spread.

Table 2.
Summary of previous works to prevent COVID-19.
| No. | Reference | Summary | Limitation |
|---|---|---|---|
| 1 | Ljubic et al. [7] | Identification of the hub and verification of the transmission route by plotting the patient variance via heat map | Only representation of the specific region data at a specific time |
| 2 | Gambetta [8] | Deletion of the links on the spreadable path after identifying the main nodes in SNA | Limitation to SNA and not able to present how to get the weights |
| 3 | Goncalves [9] | Self-quarantine of close contacts with the infected patient to prevent the spread of COVID-19 in the company | Schematization of SNA limited to a specific time. |
| 4 | O’sullivan et al. [11] | Proposal of the lockdown strategy to prevent the spread of COVID-19 from a spatial perspective. | Necessity to Consider the route of COVID-19 community transmission |
| 5 | Garg et al. [12] | Path tracing of the confirmed case after storing anonymous RFID information in the blockchain | Necessity to disclose information at the national level to use privacy data |
| 6 | Trivedi et al. [19] | Proposal of forward tracking model | Difficulty tracking the transmission route before the confirmed case |
Because this paper is for the purpose of the epidemic investigation, the forward COVID-19 contact tracing of the confirmed case [19,20] (see Figure 1) is outside the scope of the research. In other words, this is similar to other studies in that it uses location information of mobile devices, but differs from other studies in that the contacts are extracted by using the backward COVID-19 contact tracing from the time of the first confirmed case to the past from a spatial perspective.
3. Background Theory
3.1. Close Graph Modeling
Any objects in Euclidean space can be expressed as a graph (G = (V, E)). This graph is generally represented by a set of nodes (nodes, vertices, objects) V and edges (edges, links, edges) E. The nodes in this graph are used to represent objects in Euclidean space while the links represent the relationships between these nodes. The distance between the nodes is calculated by the use of the Euclidean distance. Using the inverse distance weighting method [21], the proximity between nodes shows that if two nodes are closer to each other, it will attain a higher weight (w) value. The closer two nodes are, the bigger the weight. Therefore, the shortest path between these nodes can be obtained by converting to a reversal graph [22] and applying the minimum cost algorithm.
3.2. Clustering Algorithm
Hierarchical clustering [23] is a popular method for analyzing clusters in multidimensional multivariate statistical analysis. Following the assumption that n objects are present in separate clusters, the distance between nodes in each cluster is measured to gradually combine similar clusters and form one final cluster. This method is mainly used to calculate the similarity between the nodes in network analysis [4]. Multiple entities on coordinates can be clustered via the hierarchical clustering technique. Therefore, it is evident that individuals bound by the same clustering have the high proximity to each other. Even if the nodes are projected to more than three-dimension, hierarchical clustering makes it possible to group nodes on coordinates.
3.3. Centrality Analysis
From the centrality analysis of the social network, the influence of nodes on the network can be found out. It is mainly utilized as a method for extracting information on how nodes affect the core of a social network after deriving the centrality of these nodes via the weight and direction of the path. The representative types of centrality analysis are degree, betweenness, and closeness centrality.
Degree centrality is an index that indicates the degree of connection between nodes. The influence of a node can be measured using the total number of links and weights directly connected to each node, and the node with the highest index becomes the center of the contact network. Betweenness centrality is an index that represents the influence of a node over the flow information between every pair of nodes as the role of bridge or hub [24]. Closeness centrality is the index based on the distance between nodes, indicating how far a node is from another node.
4. Contact Network Modeling
4.1. Overview
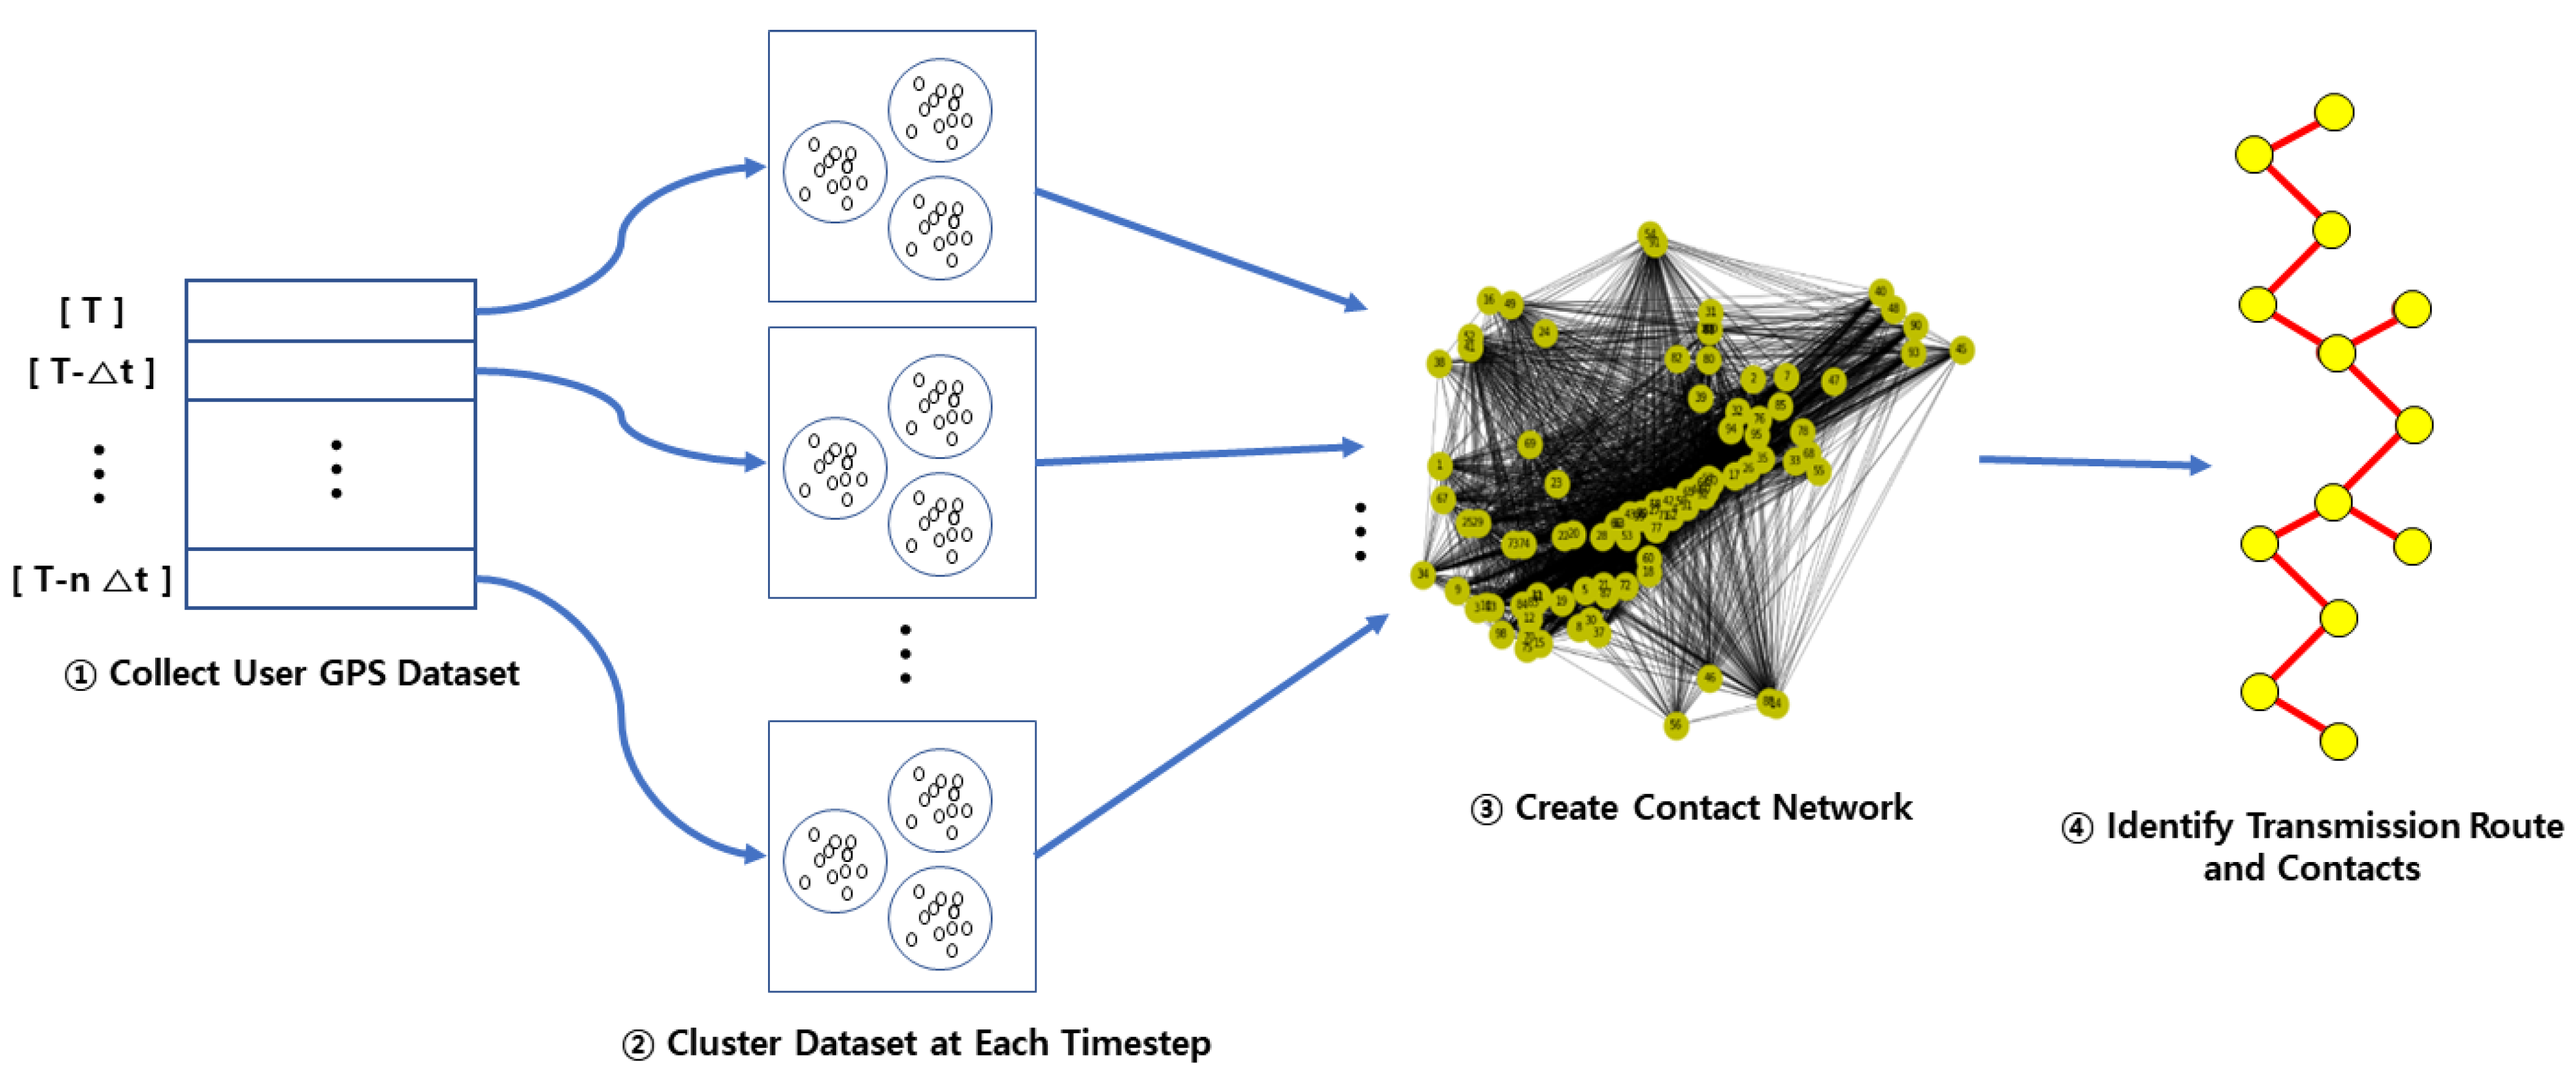
Figure 2 shows how the contact network is created. After obtaining cases of GPS dataset together with time, GPS data first can be clustered at each time point by tracing back to the past from the time of the first confirmed case. Close contacts are identified based on the first confirmed case, followed by the generation of a weighted graph. If contacts are included in the same cluster, it is inferred that both the degrees of contact and weight are significantly high. The contact network is finalized when the trace has moved to the point in time when the source of infection occurred. This contact network can be used to extract the transmission route between the first confirmed case and the source of infection and to analyze the centrality.
4.2. One-Way Contact Network Modeling
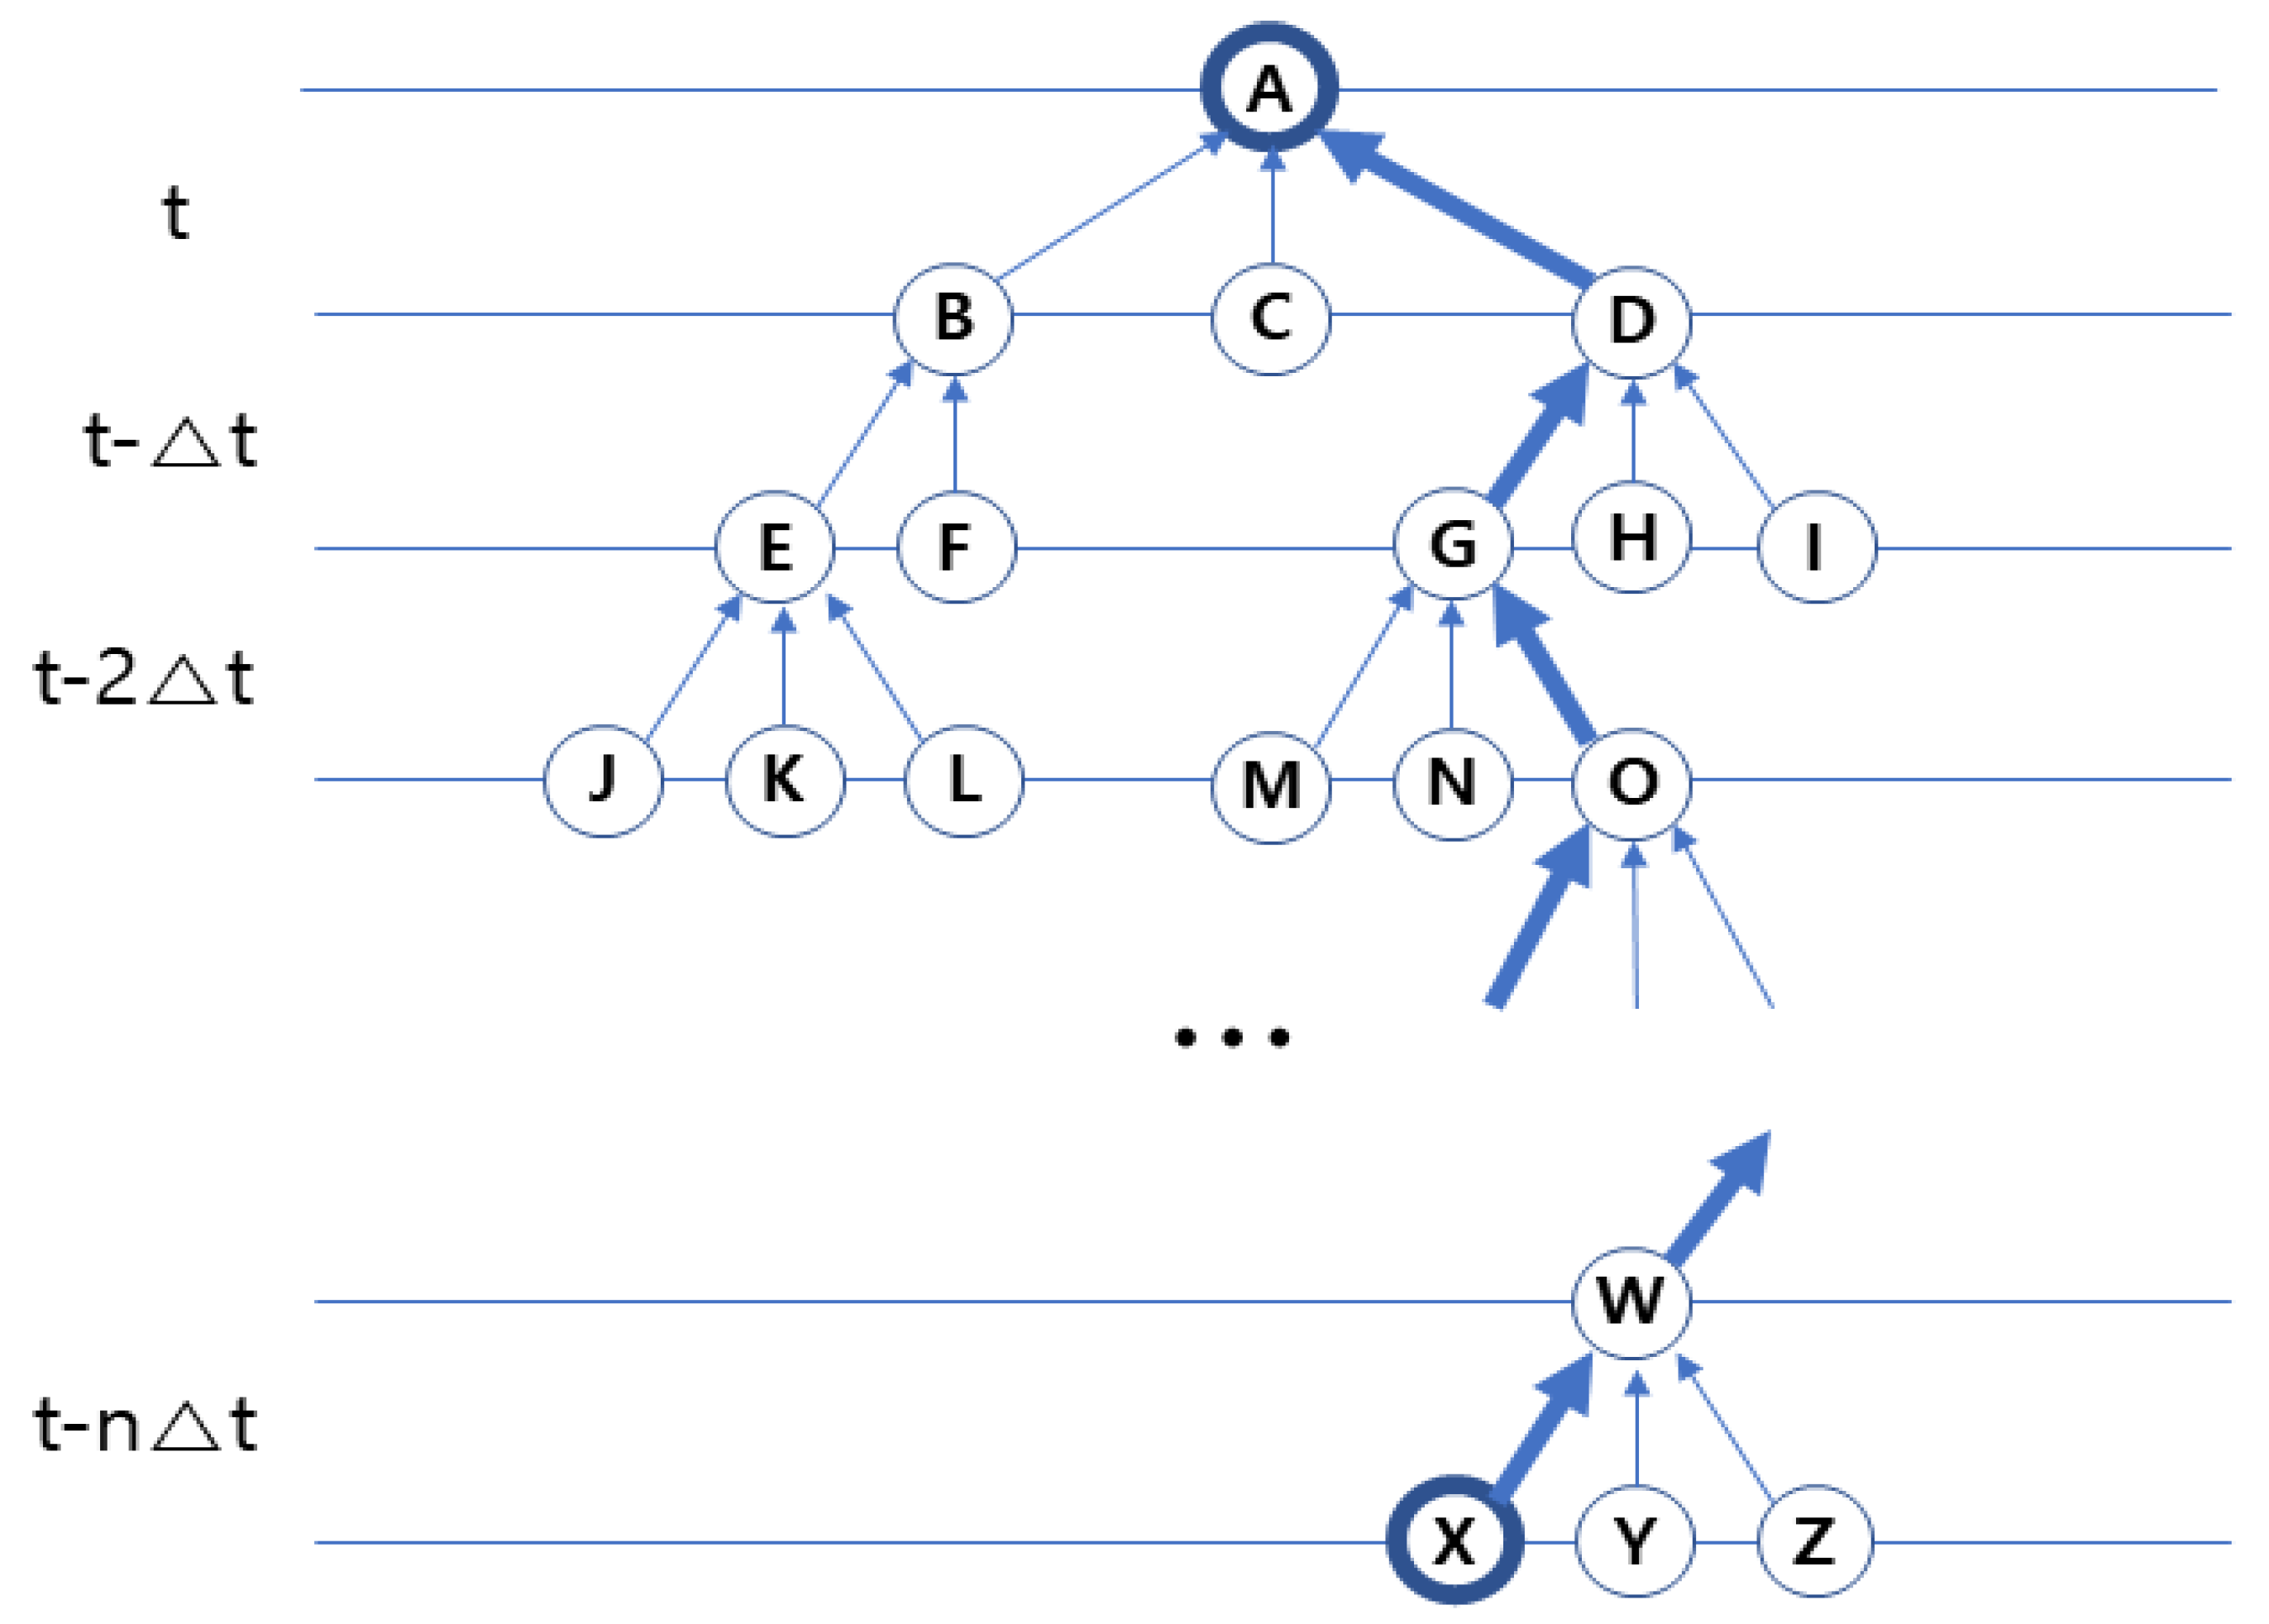
The location information of subjects over time can be projected to the Euclidean space. Therefore, the proximity data between the nodes in this space using hierarchical clustering [23] at each time point can be secured. Figure 3 shows two-dimensional nodes, {B}, {C}, and {D}, close to {A}, can be represented at the time T. At the time T − ∆t, the nodes {G}, {H}, and {I}, close to {D} which is a close object to A, can be obtained. At the time T − 2∆t, the nodes {M}, {N}, and {O} close to {G} can be obtained. It can be observed that the nodes {A} is influenced by nodes {B, C, D}, {D} by {G, H, I}, and {G} by {M, N, O}, respectively. The connection status of nodes in the Euclidean space can be modelled at every time point and a one-way link between the adjacent nodes bound to the same cluster can be created, as shown in Figure 3. Tracing back to the past time T − n∆t from the time T, the connection of the cluster centered on the overlapping nodes can be represented.
When cluster paths at each time point are merged and expressed as a graph centered on the overlapping nodes, this graph is illustrated as a one-way link relationship between the nodes, as shown in Figure 4. By tracing back to the past per unit time ∆t from the time T, how the nodes are connected to each other can be kept track of. The contact network of nodes influencing the current viewpoint can be modelled based on the assumption that the degree of proximity is the same as the degree of contact. Looking at the contact network illustrated in Figure 3, which path the X node at the past time has reached to the A node at the time T can be found. The intermediate transit nodes {W... O, G, D} on this path are the main contact nodes. This can be presented schematically as follows:
Assuming a contact network regarding COVID-19 community spread is modeled, visitors during the COVID-19 outbreak can be identified provided the first outbreak has occurred and has led to regional infections. Here, a visitor to the infected area corresponds to a node, and a link expresses the existence of contact between each node [10].
At this point, if you trace back to the past point and sequentially cluster the first confirmed case with the close contact, the close contact with the second contact, the second contact with the third contact, etc., one-way contact network model can be constructed, as shown in Figure 4. If the existence of the source of infection at the time T − n∆t is already confirmed, it can be observed that the first confirmed case at the time T is likely to have been infected with COVID-19 via an intermediate contact from the source at the time T − n∆t. In addition, the contacts on the transmission route of the COVID-19 infection can be identified as a priority for COVID-19 testing, and investigations on the COVID-19 epidemic can be conducted in a timely manner.
4.3. Two-Way Contact Network Modeling
As in the “one-way contact network modeling” method, clusters grouped at each time point have only one overlapping node per cluster. It would be ideal if the contact network is constructed via the overlapping nodes. However, when data is clustered at each time point, various cases could occur such that the same node is continuously clustered into the same group or into different groups and then included in the same group again. Because the clustering is configured differently at each time point, it is necessary to create a model that can reflect various situations (Algorithm 1).
If two nodes are continuously grouped in the same cluster at the time T and T − ∆t, we can assume that the proximity between two nodes is high. If two nodes are included in the same cluster at the time T, they can be connected with a link {} and the weight {} calculated by the inverse distance weight method can also be assigned to the link. After calculating the Euclidean distance between two nodes {X, Y}, the inverse distance weight {} can be obtained by converting the distance value into a reciprocal number. Therefore, the bigger the value of the weight, the higher the degree of the proximity.
| Algorithm 1 Inverse distance weight matrix algorithm. |
| 1: Initialize the list of clusters to contain the cluster consisting of all nodes. |
| 2: repeat |
| 3: for i = 1 to number of trials, j = 1 to number of trials do |
| 4: Calculate the Euclidean distance between node i and node j. |
| 5: Convert the distance value into a reciprocal number. |
| 6: Accumulate the value to both the element (i, j) and (j, i) in the n-by-n matrix E. |
| 7: end for |
| 8: until the list of clusters all clusters. |
The weight value of the link increases by adding the weight at the time T to the weight at the previous time T − ∆t. If two nodes are frequently included in the same cluster until T − n∆t, the weight of the link between two nodes will become higher and higher owing to the accumulation of the weights.
As illustrated in Figure 5, two bidirectional links are created in three nodes {B, C, D} around {A} at the time T, and the total link has the weights {, ,, , , }. At the time T − ∆t, if {A} and {B} are grouped in the same cluster again, the weight between two nodes also increases to {+. Because E is newly included in the cluster grouping {A} and {B}, the weights {} are constructed between {E}, {A}, and {B}. Additionally, because {C} and {D} belong to the different cluster, the weight of the link between two nodes also increases to {+. If {A}, {B}, and {D} are included in the same cluster again at the time T − 2∆t, the corresponding weights increase to {+}. In addition, {M} is added to the cluster including {A}, {B}, and {D} nodes, and a link connected from {M} is created, and each link newly has a weight. {E} and {F} are also grouped in the other cluster and have the new link between them.
By applying this to the COVID-19 regional infection case, the two-way contact network can be setup for community COVID-19 spread. At the time T the first confirmed case occurred, the cluster of close contacts was created by focusing on the confirmed case and at T − ∆t, a secondary contact cluster, which came into contact with the first confirmed case and close contacts, could be created. If this is sustained until T − n∆t, the two-way contact network centered on the first confirmed case can be created. By tracking back to the past time T − n∆t from the time T, the weight between two contacts is accumulated and increased if they are included in the same cluster. In the contact network, the bigger weight means the higher degree of contact between two nodes and the more possibility of infection transmission. Therefore, it remains possible to predict the transmission route of infection and targets present on the route via a contact network.
4.4. Prediction of the Transmission Route
The transmission route can be predicted via a weighted contact network. Because the weight indicates the degree of contact between the nodes, the transmission route between the first confirmed case and the source of infection can be predicted, focusing on the link between the high degrees of contact. And the shortest path algorithm was used to obtain the transmission route using weights (Algorithm 2). Because the contact network has a significantly high value of weight owing to its degree of contact, the contact network to adapt the shortest path algorithm can be reversed, as shown in Figure 6. First, the maximum value of the weight (max) is obtained from the total weights. Secondly, one is added to the maximum value of the weight to prevent the maximum reverse value of the weight from being zero (i.e., max’ = max + 1). Finally, the reversal contact network containing the converted value of the weight is created by subtracting each value of the weight from max’ for the entire link [22].
| Algorithm 2 Reverse weight matrix algorithm. |
| 1: Initialize the training dataset n-by-n matrix E. |
| 2: for i = 1 to number of trials, j = 1 to number of trials do |
| 3: Find the maximum element (i, j) in the n-by-n matrix E. |
| 4: Assign it to Max. |
| 5: End for |
| 6: Increase Max by 1. |
| 7: for i = 1 to number of trials, j = 1 to number of trials do |
| 8: Subtract element (i, j) in the n-by-n matrix from Max. |
| 9: Assign the value to element (i, j) in the n-by-n matrix E′. |
| 10: End for |
| 11: Return E′ |
By converting to the reversal contact network and applying the Dijkstra algorithm [25] to obtain the shortest path, the transmission route between the nodes with high degrees of contacts is created. Because of the generation of the shortest path graph for the entire contact network, the transmission route from all visitors can be predicted, and the contacts on this route can be identified as the priorities for COVID-19 testing.
5. Experiment
5.1. Data Acquisition
Various types of unstructured data can be downloaded using the Google takeout service (http://takeout.google.com, accessed on 24 March 2021). In this experiment, we use the “LocationHistory.json” file, which can be downloaded after selecting ”Location History” on the Google takeout web. This includes the GPS information of the Google Android phone user according to the timestamp (ms) flow. Therefore, the location information of the user, including latitude (latitudeE7) and longitude (longitudeE7), can be secured from the json file. In the event of the COVID-19 confirmed case, if the “LocationHistory.json” file is obtained from Google Android phone users after acquiring a list of visitors to the area where the COVID-19 confirmed case occurred, the GPS location information belonging to the visitors to the COVID-19 infected area can also be obtained.
For the acquisition of information belonging to the visitors, we assumed that the number of people visiting the infected area is 100. Because it is not easy to acquire Google GPS data for 100 people on the same day and time, we put the case that 100 days of data for 1 person is interpreted as daily data for 100 people. Therefore, a total of 63,057 location information (hourly, latitude, longitude, etc.) for 100 people are obtained after processing 100 days of Google GPS data for 1 person. (The code is publicly available https://github.com/skku-df-lab/covid19sna, accessed on 24 March 2021) Because the real GPS data is processed, the simulated data can be used in the proof of the concept stage to deduct the possibility of modeling the contact network. Google GPS information contains rather inaccurate location data such that the accuracy value over 1000 is excluded from the dataset to isolate the inaccurate information [26]. The experiment with 54,430 location information data was conducted.
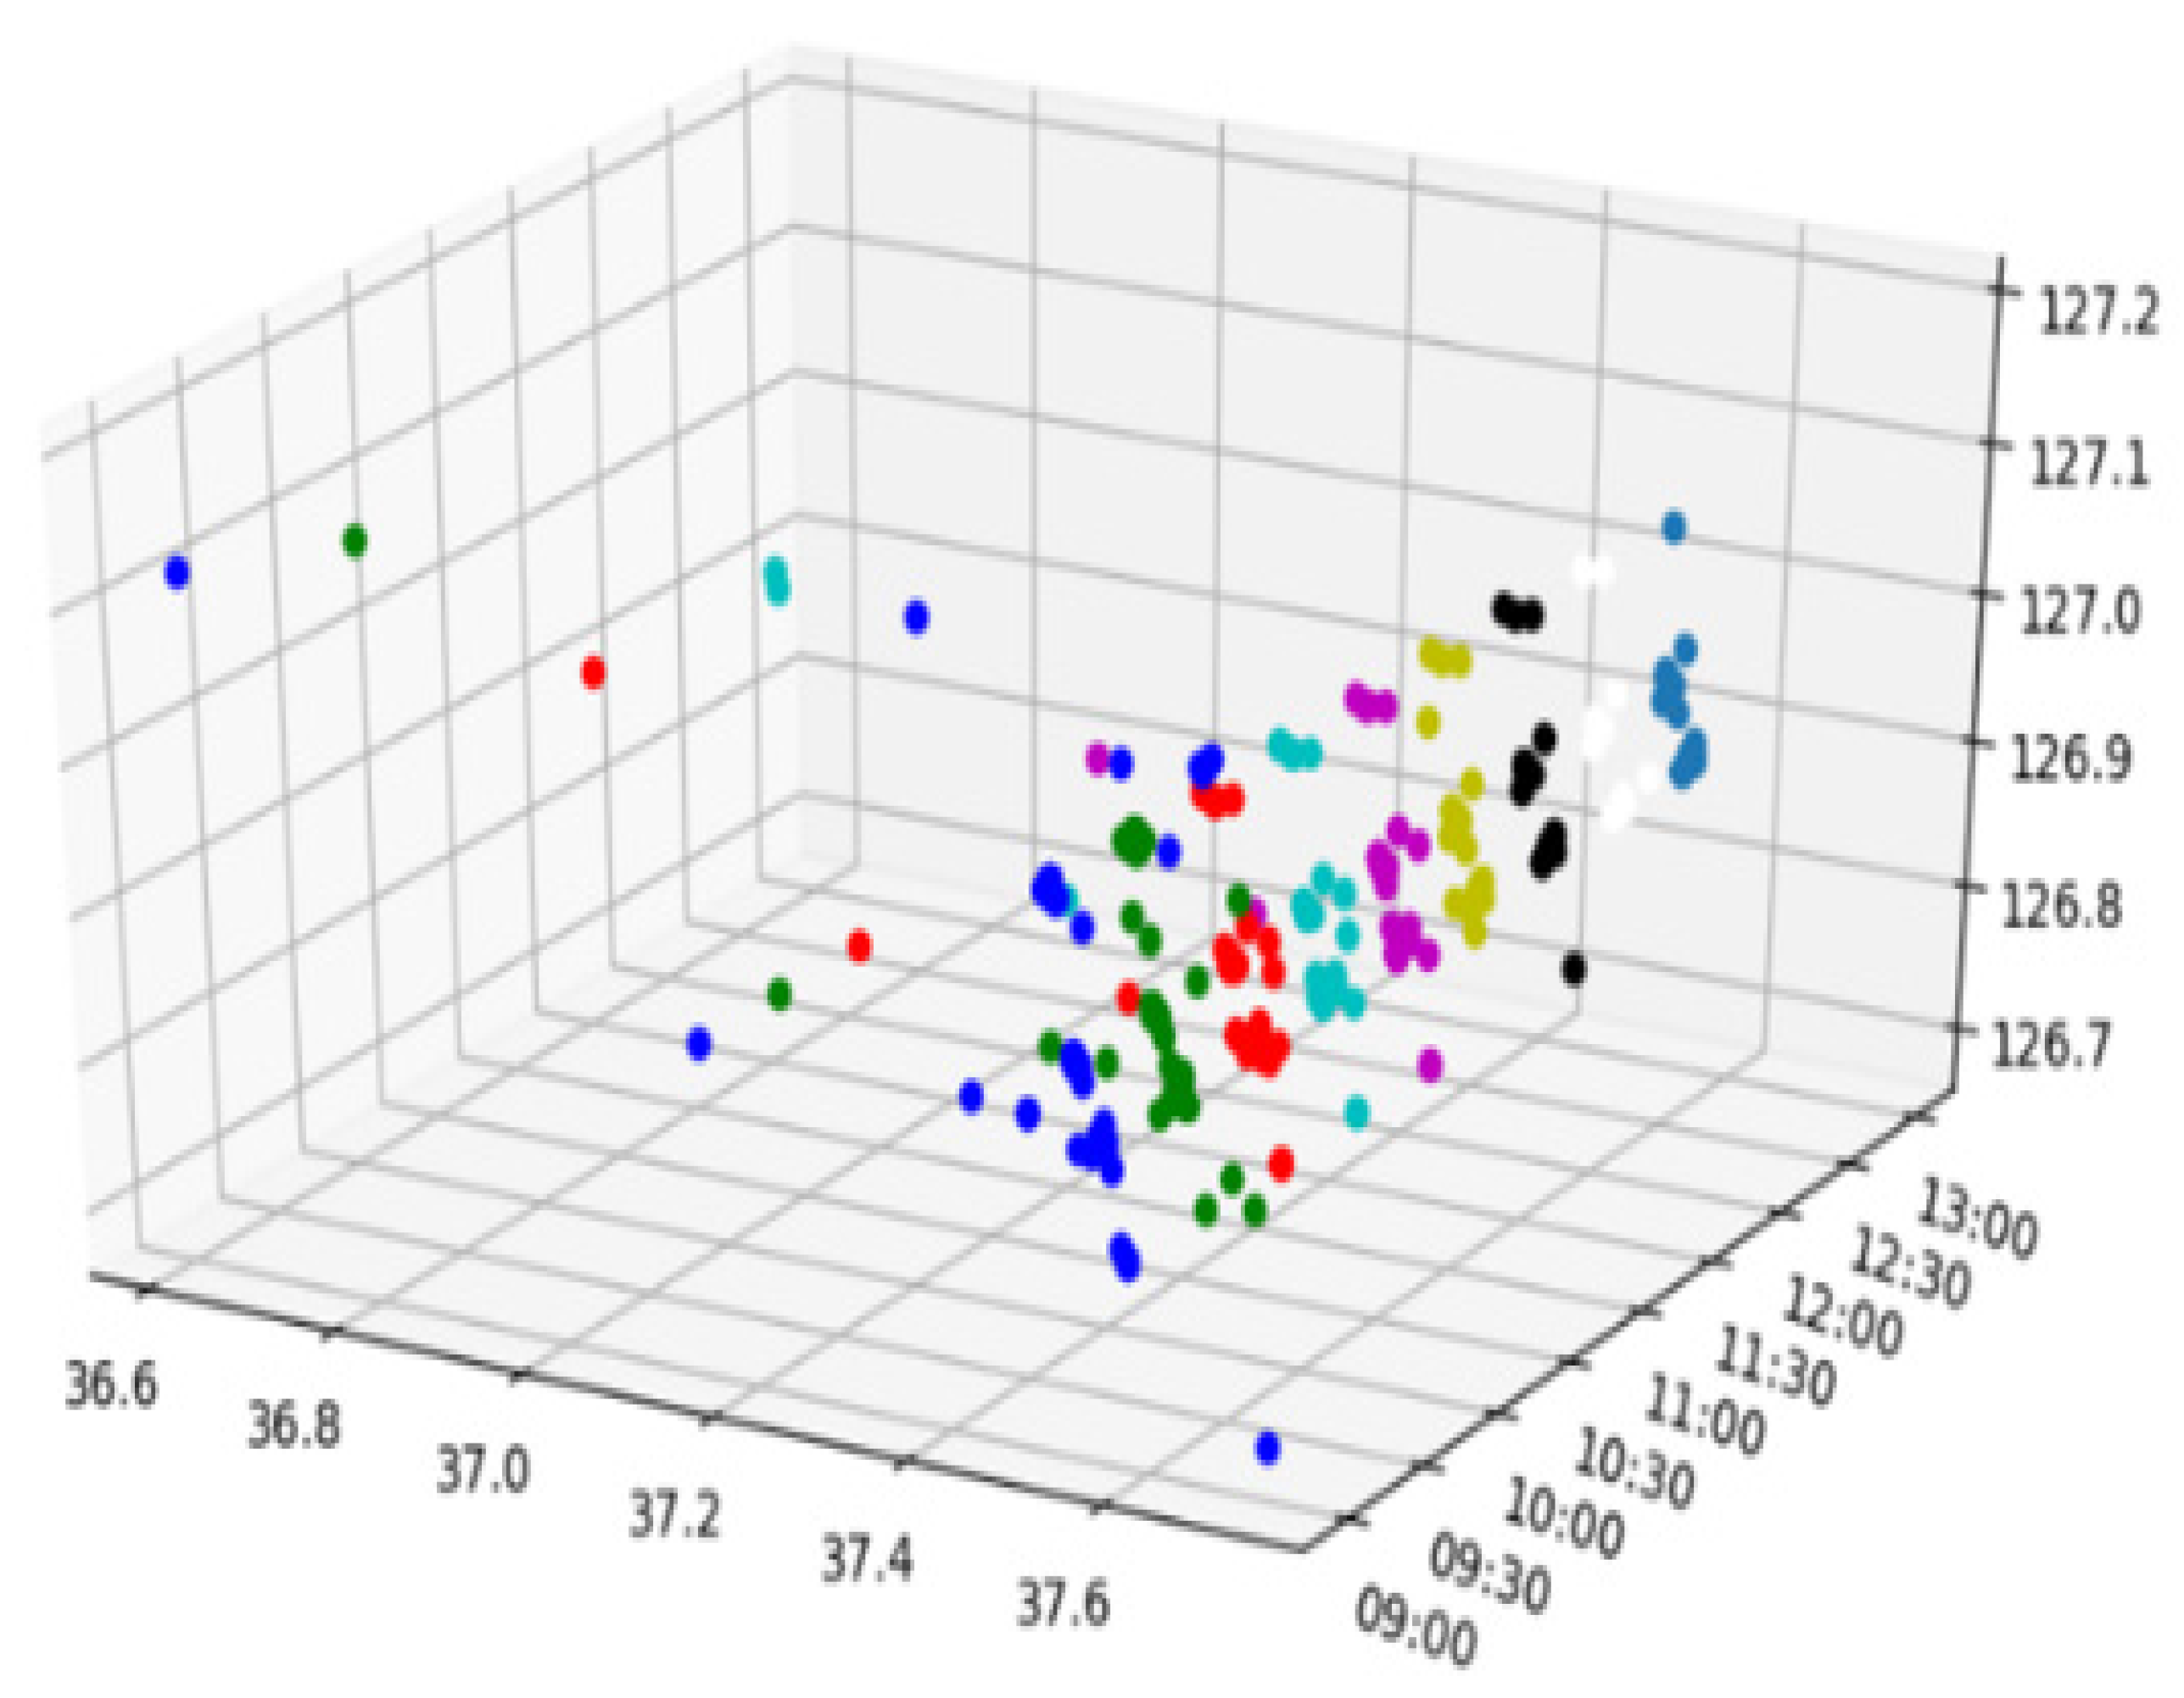
Data recorded in an approximately 30 min time step from 9:00 AM to 1:00 PM were selected from a total of 54,430 data, and 857 GPS data were obtained for 100 subjects. Figure 7 shows the 3D presentation of spatiotemporal tracking data of all subjects. This algorithm was implemented in Python 3.8.3. All experiments were run on a system with Windows 10, Intel(R) Core(TM) i5-8250U CPU @ 1.60 GHz, 8 GB RAM (Samsung, Korea).
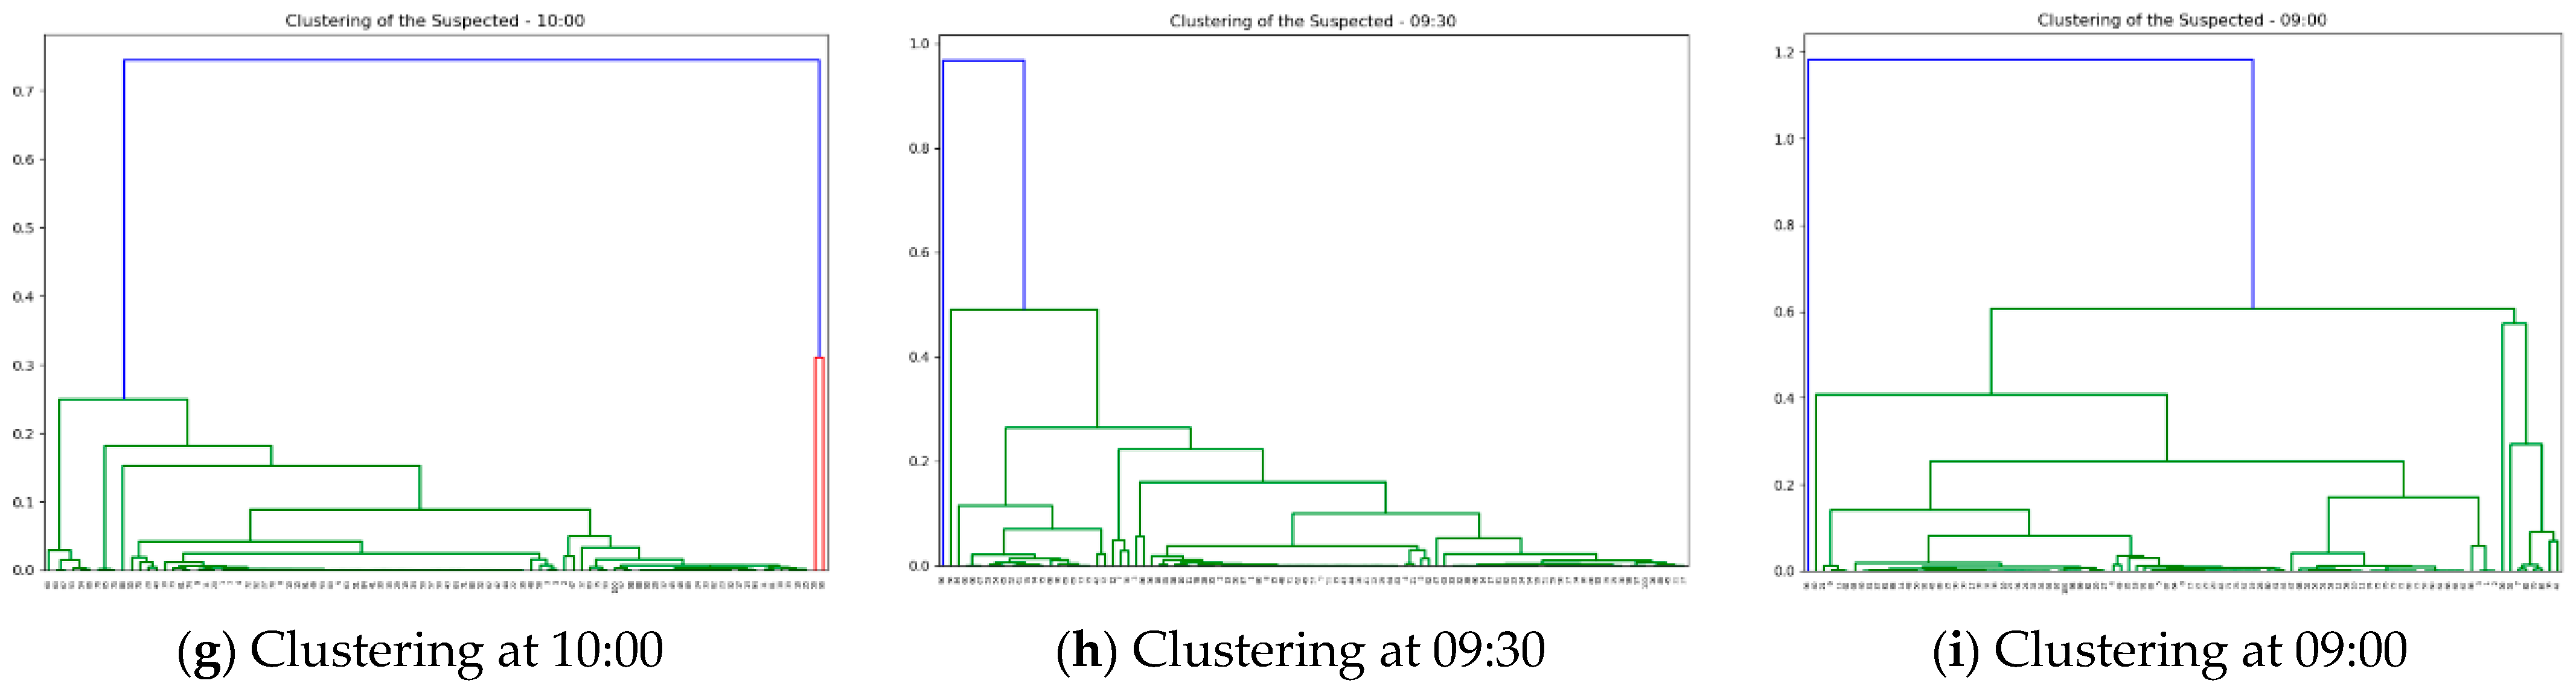
5.2. Creation of Contact Network
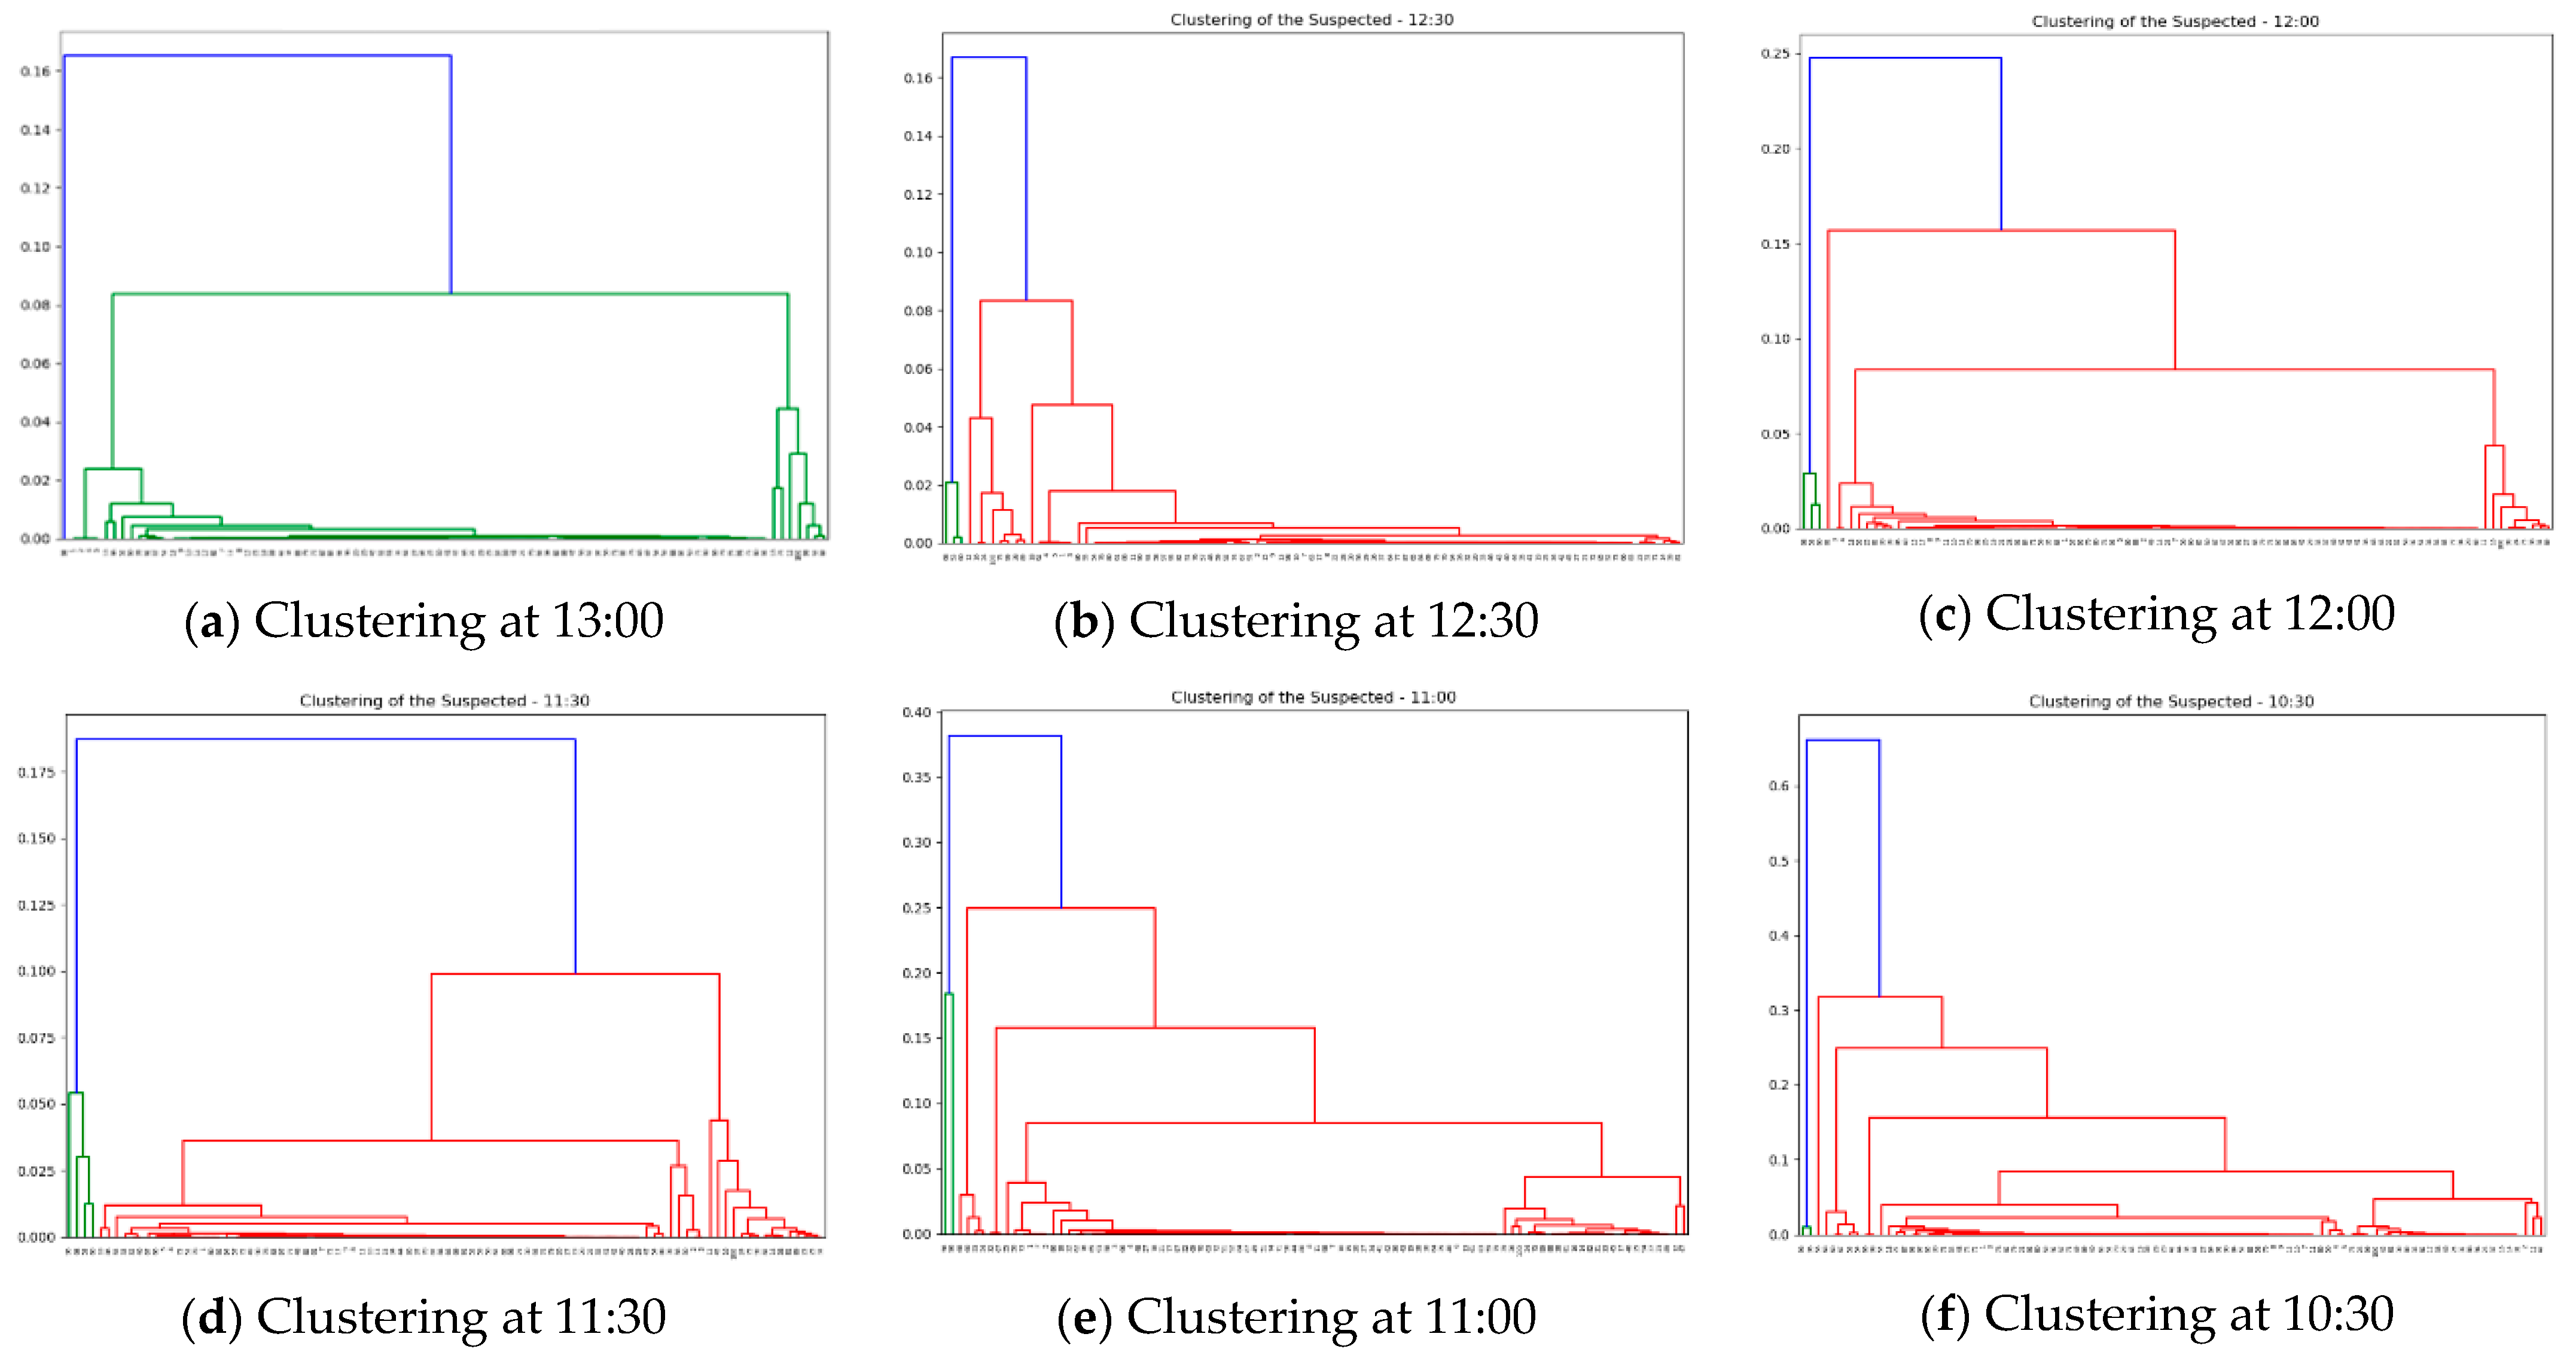
In this experiment, hierarchical clustering was used to cluster the GPS dataset for each time point, and the number of clusters used to reduce the link spreading speed between contacts was set to 20 to generate 20 clusters every hour. Figure 8 shows the results of clustering Google GPS data by tracking back to the previous time point every 30 min from 1:00 PM to 9:00 AM. The clustered Google GPS data were tracked to the past per 30 min interval to generate graphs sequentially. Subject 1 was assumed to be the first confirmed case at 1:00 PM, and the proximity of subjects 2, 4, and 5 included in the same cluster as the confirmed case was inferred to be high and they were classified as close contacts. After that, we traced back to the past time point in 30 min decrements (13:00 → 12:30 → … → 9:00). Then, the second and third contacts with the first confirmed case and close contact are sequentially identified, followed by the generation of a graph over time.
On the graph, the link at each time interval has a weight. The value of this weight is obtained using the inverse distance weighting method. First, the Euclidean distance between two nodes is obtained by using vector values of latitude and longitude obtained from Google GPS data. Additionally, utilizing the inverse distance weighting method, the weight of the links between two nodes can be converted to the higher value of the weight as the degree of proximity increases.
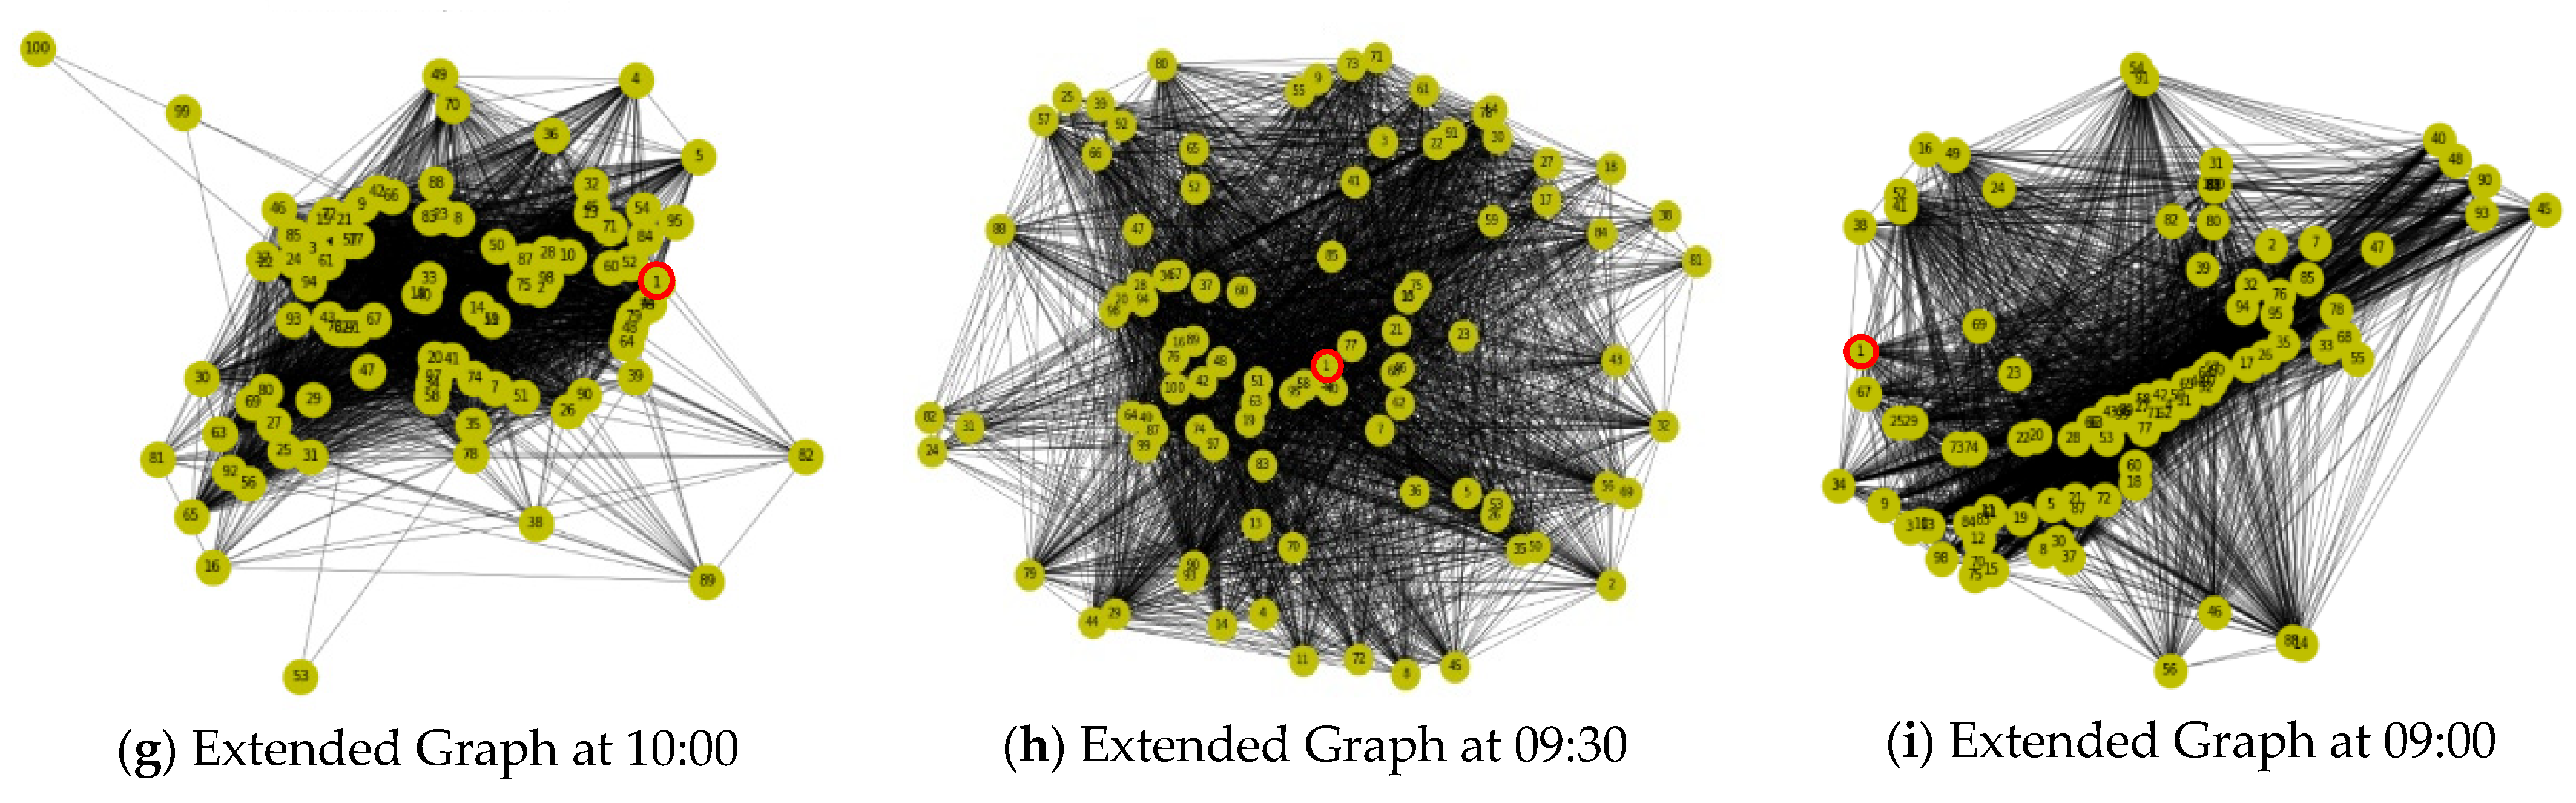
Gradually, a graph focusing on the first confirmed case No. 1 is created for each hour, and its results are illustrated in Figure 9. From 1:00 PM, this graph traces back to the previous time point every 30 min and creates the contact network for local contacts centered on the first confirmed case.
5.3. Prediction Analysis of the Transmission Route
Various interpretation can be derived from the contact network. In other words, the transmission route of the COVID-19 infection from the source of infection to the first confirmed case can be predicted, and the subjects present on the route as the priorities for COVID-19 testing can be identified.
The Dijkstra algorithm for the shortest path can be used to generate the transmission route from the source of infection to the first confirmed case. Because the contact network has a significantly high value of the weight owing to its high contact degree, it is necessary to first convert the contact network into a reversal contact network to use the shortest path algorithm. Owing to the smaller value of the weight on the reversal contact network as its the contact accuracy is higher, we utilize the shortest path algorithm to establish the transmission route according to the contact accuracy focusing on the first confirmed case No. 1.
In Table 3, assuming that the contact No. 100 is the source of infection in the region where the local infection occurred, when the number of clusters (n) is 20, the route of transmission that appears in the contact network is [100 → 92 → 1] and the priorities are {1, 92, 100}. If n = 40 and the source of infection is 81, the transmission route is [81 → 88 → 93 → 3 → 1], and the priorities for COVID-19 testing are {1, 3, 81, 88, 93}.
5.4. Analysis of the Centrality
The main targets affecting the entire contact network can be identified using the centrality analysis of the contact network, such as degree, betweenness, and closeness centrality. The centrality analysis is implemented in Python 3.8.3, with relevant libraries NetworkX 2.4 and Pandas 1.0.3.
The value of degree centrality is large when the central node is connected to a number of links to other nodes. The value of degree centrality for each node represents the number of links that a contact is connected to other contacts, and it can be interpreted that the higher the degree of connection between contacts, the more widely contacted other contacts [27]. Table 4 shows that it can be observed that the degree centrality of contact No. 51 is the highest, and it is located at the center of the contact network.
The value of betweenness centrality can also be extracted from the contact network of the COVID-19 regional infection. Degree centrality is the degree of activation connected to a node, whereas betweenness centrality refers to the accessibility to other nodes. Therefore, if the contact with a low degree centrality has a high betweenness centrality, it can be considered as a significant hub for COVID-19 spread [28]. Contact No. 37 in Table 5 has a low degree centrality, but a high betweenness centrality. Therefore, it can be considered to have the high spread power because it acts as a hub connecting nodes in the contact network.
Closeness centrality can be obtained from the contact network by focusing on confirmed cases in the COVID-19 area, thus indicating that the physical contact distance between other contacts is closer to the contact with the higher proximity. In this experiment, the top 8 ranked values of degree centrality are included in a top 10 list to closeness centrality in Table 6, which indicates that the contacts who have high values of centrality are in close proximity with many other contacts. Designating the top-ranked contacts as the priorities for COVID-19 testing, an epidemic investigation as speedily as possible to prevent the spread of the COVID-19 infection can be conducted.
6. Conclusions
After the World Health Organization declared a global pandemic as the COVID-19, numerous studies have attempted to prevent the spread of the infection. However, most of the studies for predicting the transmission route of confirmed COVID-19 cases has not been proposed from a spatiotemporal perspective. In this study, we propose the way that the authority can rapidly predict the priorities for COVID-19 testing by tracking back to the past from the time of the first confirmed case and identifying the route of transmission. After securing a list of visitors to the infected area of COVID-19, the authority can obtain the Google GPS information from their mobile device to model the contact network focused on the first confirmed case. Using the contact network, the authority extracts the transmission route from the source of infection to the first confirmed case and identifies the contacts with high proximity on the route as the priorities for COVID-19 testing. Furthermore, applying centrality analysis to the contact network will help them to identify super-spreaders in the epidemic investigation requiring urgency.
In this study, the contact network is modeled by means of the distance between nodes in Euclidean space. The nodes can be expressed as the multi-dimensional vector such that the contact network consisting of the vector can include various information. If the authority adds data like pharmacy visit history other than longitude and latitude to the element of the vector, it will be probable to increase the accuracy of the results to track the confirmed cases. We just use the simulated data set extracted from the Google Android phone. However, if the authority configures the contact modeling with real GPS data, such as data from mobile base stations and the information of visitors’ credit card payment in the infected area, more accurate experimental results will be able to be obtained. However, “LocationHistory.json” containing GPS information is downloaded from the Google Cloud server synchronizing the mobile device. If the GPS function of the mobile device is deactivated or the smartphone is turned off, there is a limitation that GPS data cannot be obtained.
Up to now we have looked at the contact network centered on a region where the community spread occurred. However, if multiple community spreads occur simultaneously in the near future, more research is needed to construct an expanded contact network that interacts with other regions. It is to be hoped that additional research to prevent the spread of COVID-19 will be conducted based on the way of establishing the contact network proposed in this study.
Author Contributions
Conceptualization, S.J.L. and G.B.K.; methodology, S.J.L., J.-O.K. and G.B.K.; software, S.J.L.; validation, S.J.L., S.E.L., J.-O.K. and G.B.K.; formal analysis, S.J.L. and S.E.L.; investigation, S.J.L.; resources, S.J.L.; data curation, S.J.L.; writing—original draft preparation, S.J.L. and G.B.K.; writing—review and editing, S.J.L. and G.B.K.; visualization, S.J.L.; supervision, J.-O.K. and G.B.K. All authors have read and agreed to the published version of the manuscript.
Funding
This research received no external funding.
Institutional Review Board Statement
Not applicable.
Informed Consent Statement
Not applicable.
Data Availability Statement
The data presented in this study are available on request from the corresponding author.
Conflicts of Interest
The authors declare no conflict of interest.
References
- Korea Policy Briefing. Online Press Briefing Session for Corona 19 Epidemiological Investigation Support System. Available online: https://www.korea.kr/news/pressReleaseView.do?newsId=156385019 (accessed on 24 March 2021).
- Park, Y.J.; Cho, S.Y.; Lee, J.; Lee, I.; Park, W.H.; Jeong, S.; Kim, S.; Lee, S.; Kim, J.; Park, O. Development and Utilization of a Rapid and Accurate Epidemic Investigation Support System for COVID-19. Osong Public Health Res. Perspect. 2020, 11, 118–127. [Google Scholar] [CrossRef] [PubMed]
- Nooy, W.D.; Mrvar, A.; Bategelj, V. Exploratory Social Network Analysis with Pajek; Cambridge University Press: New York, NY, USA, 2005. [Google Scholar]
- Kim, Y.H.; Kim, Y.J. Social Network Analysis; Parkyoungsa: Seoul, Korea, 2019. [Google Scholar]
- Yoon, H.Y.; Yang, S.J. A Study on Research Trend of Journal of Korean Regional Development Association using Keyword Network Analysis. J. Korean Reg. Dev. Assoc. 2018, 30, 1–22. [Google Scholar]
- Kim, D.R. Knowledge Structure Analysis on Management Research Using Keyword Network Analysis; Kyungil University: KyungSan, Korea, 2015. [Google Scholar]
- Ljubic, B.; Gligorijevic, D.; Gligorijevic, J.; Pavlovski, M.; Obradovic, Z. Social network analysis for better understanding of influenza. J. Biomed. Inform. 2019, 93, 103161. [Google Scholar] [CrossRef] [PubMed]
- Gambetta, M. Understanding the Behavior of COVID-19 through Social Network Analysis (SNA). Preprint: 2020, pp 1–11. Available online: https://www.researchgate.net/profile/Marcelo-Gambetta/publication/341090593_Understanding_the_behavior_of_COVID-19_through_social_network_analysis_SNA_-_English_version/links/5eaca71d299bf18b958e2f0e/Understanding-the-behavior-of-COVID-19-through-social-network-analysis-SNA-English-version.pdf (accessed on 13 February 2021).
- Goncalves, R. Performing Social Network Analysis to Fight the Spread of COVID-19. Available online: https://www.sisense.com/blog/performing-social-network-analysis-to-fight-the-spread-of-covid-19 (accessed on 14 March 2021).
- Reich, O.; Shalev, G.; Kalvari, T. Modeling COVID-19 on a network: Super-spreaders, testing and containment. medRxiv 2020. Available online: https://www.medrxiv.org/content/10.1101/2020.04.30.20081828v1 (accessed on 13 February 2021). [CrossRef]
- O’Sullivan, D.; Gahegan, M.; Exeter, D.J.; Adams, B. Spatially explicit models for exploring COVID-19 lockdown strategies. Trans. GIS 2020, 24, 967–1000. [Google Scholar] [CrossRef] [PubMed]
- Garg, L.; Chukwu, E.; Nasser, N.; Chakraborty, C.; Garg, G. Anonymity Preserving IoT-Based COVID-19 and Other Infectious Disease Contact Tracing Model. IEEE Access 2020, 8, 159402–159414. [Google Scholar] [CrossRef]
- Zeinalipour-Yazti, D.; Claramunt, C. COVID-19 Mobile Contact Tracing Apps (MCTA): A Digital Vaccine or a Privacy Demolition? In Proceedings of the 21st IEEE International Conference on Mobile Data Management (MDM), Versailles, France, 30 June–3 July 2020; pp. 1–4. [Google Scholar]
- Cho, H.; Ippolito, D.; Yu, Y.W. Contact Tracing Mobile Apps for COVID-19: Privacy Considerations and Related Trade-offs. arXiv 2020, arXiv:2003.11511. Available online: https://arxiv.org/abs/2003.11511 (accessed on 13 February 2021).
- Wise, J. Covid-19: UK drops its own contact tracing app to switch to Apple and Google model. BMJ 2020, 369, 2472. [Google Scholar] [CrossRef] [PubMed]
- Sarkar, A.; Ray, S.K. A Data Driven Decision Making and Contract Tracing App for Organizations to Combat COVID-19. In Proceedings of the International Conference on Computing, Networking, Telecommunications & Engineering Sciences Applications (CoNTESA), Tirana, Albania, 9–10 December 2020; pp. 88–93. [Google Scholar]
- Cruz, M.M.; Oliveira, R.S.; Beltrao, A.P.V.; Lopes, P.H.B.; Viterbo, J.; Trevisan, D.G.; Bernardini, F. Assessing the level of acceptance of a crowdsourcing solution to monitor infectious diseases propagation. In Proceedings of the IEEE International Smart Cities Conference (ISC2), Virtual Conference. 28 September–1 October 2020; pp. 1–8. [Google Scholar]
- Bengio, Y.; Janda, R.; Yu, Y.W.; Ippolito, D.; Jarvie, M.; Pilat, D.; Struck, B.; Krastev, S.; Sharma, A. The need for privacy with public digital contact tracing during the COVID-19 pandemic. Lancet Digital Health 2020, 2, e342–e344. [Google Scholar] [CrossRef]
- Trivedi, A.; Vasisht, D. Digital Contact Tracing: Technologies, Shortcomings, and the Path Forward. ACM SIGCOMM Computer Commun. Rev. 2020, 50, 75–81. [Google Scholar] [CrossRef]
- Bradshaw, W.J.; Alley, E.C.; Huggins, J.H.; Lloyd, A.L.; Esvelt, K.M. Bidirectional contact tracing could dramatically improve COVID-19 control. Nat. Commun. 2021, 12, 232. [Google Scholar] [CrossRef] [PubMed]
- Shepard, D. A two-dimensional interpolation function for irregularly-spaced data. In Proceedings of the 23rd ACM National Conference, Las Vegas, NV, USA, 27–29 August 1968; pp. 517–524. [Google Scholar]
- Gong, M.; Li, G.; Wang, Z.; Ma, L.; Tian, D. An efficient shortest path approach for social networks based on community structure. CAAI Transact. Intell. Technol. 2016, 1, 114–123. [Google Scholar] [CrossRef] [Green Version]
- Nielsen, F. Introduction to HPC with MPI for Data Science; Springer: Cham, Switzerland, 2016. [Google Scholar]
- Freeman, L.C. The Development of Social Network Analysis: A Study in the Sociology of Science; Empirical Press: Vancouver, BC, Canada, 2004. [Google Scholar]
- Dijkstra, E.W. A Note on Two Problems in Connextion with Graphs. Numer. Math. 1959, 1, 269–271. [Google Scholar] [CrossRef] [Green Version]
- Mathur, K. Analyzing my Google Location History. Available online: https://towardsdatascience.com/analyzing-my-google-location-history-d3a5c56c7b70 (accessed on 24 March 2021).
- Zhao, P.S.; Lee, J.H.; Lee, M.H. Characterizing the Structure of China‘s Passenger Railway Network Based on the Social Network Analysis(SNA) Approaches: Focused on the 2008, 2013, and 2018 Railway Service Data, Respectively. Korea Contents Soc. 2019, 19, 685–697. [Google Scholar]
- Song, M.G.; Yeo, G.T. An Analysis of Major Railway in Eurasia and Characteristics of China’s Rail Network. J. Korean Navig. Port Res. 2017, 41, 155–164. [Google Scholar] [CrossRef] [Green Version]
Figure 1.
Comparison with other researches.

Figure 2.
Process of modeling contact network.

Figure 3.
Example of merging clusters by time.

Figure 4.
Example of one-way contact network model.

Figure 5.
Example of two-way contact network model.

Figure 6.
Example of creating reversal contact network.

Figure 7.
Example of GPS data together with time.

Figure 8.
Hierarchical clustering results.


Figure 9.
Graph results based on clusters.


Table 1.
Before and after comparison of the construction of COVID-19 EISS [2].
Table 1.
Before and after comparison of the construction of COVID-19 EISS [2].
| Division | Before | After |
|---|---|---|
| Tracking analysis of confirmed COVID-19 cases | Manual analysis via epidemic investigators (about 24 h) | Automatic analysis via the system (within 10 min) |
| Access control of personal information | Handwritten, manual, limited in control | Automatic control via digitized records |
| Inter-institutional work system | Individual contacts made to each institution, excessive work and delays in contacts owing to manual nature of requests | Real-time information exchanges between 28 institutions via the system |
Table 3.
Transmission route based on first confirmed case (No. 1).
| n | Source of Infection | Route of Transmission | Priorities |
|---|---|---|---|
| n = 20 | 100 | 100 → 92 → 1 | 1, 92, 100 |
| 81 | 81 → 88 → 1 | 1, 81, 88 | |
| 51 | 51 → 1 | 1, 51 | |
| n = 30 | 100 | 100 → 97 → 4 → 1 | 1, 4, 97, 100 |
| 81 | 81 → 92 → 1 | 1, 92, 81 | |
| 51 | 51 → 1 | 1, 51 | |
| n = 40 | 100 | 100 → 97 → 83 → 1 | 1, 83, 97, 100 |
| 81 | 81 → 88 → 93 → 3 → 1 | 1, 3, 81, 88, 93 | |
| 51 | 51 → 1 | 1, 51 |
Table 4.
Example of a top 10 list for degree centrality.
| No. | Confirmed Case and Contacts | Degree Centrality |
|---|---|---|
| 1 | 51 | 0.9375 |
| 2 | 48 | 0.916667 |
| 3 | 27 | 0.90625 |
| 4 | 34 | 0.90625 |
| 5 | 90 | 0.90625 |
| 6 | 93 | 0.90625 |
| 7 | 97 | 0.90625 |
| 8 | 59 | 0.895833 |
| 9 | 4 | 0.895833 |
| 10 | 30 | 0.885417 |
Table 5.
Example of a top 10 list for betweenness centrality.
| No. | Confirmed Case and Contacts | Betweenness Centrality |
|---|---|---|
| 1 | 51 | 0.041447 |
| 2 | 37 | 0.01886 |
| 3 | 61 | 0.01864 |
| 4 | 34 | 0.017763 |
| 5 | 58 | 0.016447 |
| 6 | 93 | 0.01557 |
| 7 | 27 | 0.014254 |
| 8 | 97 | 0.012939 |
| 9 | 59 | 0.011842 |
| 10 | 43 | 0.010746 |
Table 6.
Example of a top 10 list for closeness centrality.
| No. | Confirmed Case and Contacts | Closeness Centrality |
|---|---|---|
| 1 | 51 | 0.941211272 |
| 2 | 48 | 0.9230804 |
| 3 | 93 | 0.916229278 |
| 4 | 34 | 0.914371979 |
| 5 | 27 | 0.914314556 |
| 6 | 97 | 0.914307752 |
| 7 | 90 | 0.914299063 |
| 8 | 59 | 0.906200428 |
| 9 | 94 | 0.905670685 |
| 10 | 37 | 0.899784127 |
Publisher’s Note: MDPI stays neutral with regard to jurisdictional claims in published maps and institutional affiliations. |
© 2021 by the authors. Licensee MDPI, Basel, Switzerland. This article is an open access article distributed under the terms and conditions of the Creative Commons Attribution (CC BY) license (http://creativecommons.org/licenses/by/4.0/).
Share and Cite
MDPI and ACS Style
Lee, S.J.; Lee, S.E.; Kim, J.-O.; Kim, G.B. Two-Way Contact Network Modeling for Identifying the Route of COVID-19 Community Transmission. Informatics 2021, 8, 22. https://0-doi-org.brum.beds.ac.uk/10.3390/informatics8020022
AMA Style
Lee SJ, Lee SE, Kim J-O, Kim GB. Two-Way Contact Network Modeling for Identifying the Route of COVID-19 Community Transmission. Informatics. 2021; 8(2):22. https://0-doi-org.brum.beds.ac.uk/10.3390/informatics8020022
Chicago/Turabian StyleLee, Sung Jin, Sang Eun Lee, Ji-On Kim, and Gi Bum Kim. 2021. "Two-Way Contact Network Modeling for Identifying the Route of COVID-19 Community Transmission" Informatics 8, no. 2: 22. https://0-doi-org.brum.beds.ac.uk/10.3390/informatics8020022
Note that from the first issue of 2016, this journal uses article numbers instead of page numbers. See further details here.