
Academic Activities Recommendation System for Sustainable Education in the Age of COVID-19


1
Escuela de Ingeniería en Tecnologías de la Información, FICA, Universidad de Las Américas, Quito 170125, Ecuador
2
Departamento de Sistemas, Universidad Internacional del Ecuador, Quito 170411, Ecuador
*
Author to whom correspondence should be addressed.
Informatics 2021, 8(2), 29; https://0-doi-org.brum.beds.ac.uk/10.3390/informatics8020029
Submission received: 17 March 2021
/
Revised: 14 April 2021
/
Accepted: 16 April 2021
/
Published: 20 April 2021
(This article belongs to the Special Issue Managing the Consequences of the COVID-19 in the Every-Day Working, Learning, and Interacting Life)
Abstract
:Currently, universities are going through a critical moment due to the coronavirus disease in 2019. To prevent its spread, countries have declared quarantines and isolation in all sectors of society. This has caused many problems in the learning of students, since, when moving from a face-to-face educational model to a remote model, several academic factors such as psychological, financial, and methodological have been overlooked. To exactly identify the variables and causes that affect learning, in this work a data analysis model using a Hadoop framework is proposed. By processing the data, it is possible to identify and classify students to determine the problems they present in different learning activities. The results are used by an artificial intelligence system that takes student information and converts it into knowledge, evaluates the academic performance problems they present, and determines what type of activity aligns with the students. The artificial intelligence system processes the information and recommends activities that focus on each student’s abilities and needs. The integration of these systems to universities creates an adaptive educational model that responds to the new challenges of society.
1. Introduction
Currently, society is facing a pandemic known as coronavirus disease 2019 (COVID-2019). COVID-19 has exposed existing deficiencies in all sectors of society, with education being one of the sectors affected by the pandemic [1]. To face it, educational institutions have added information and communication technologies (ICT) to their educational and administrative processes [2]. This does not mean that this union between ICT and education did not exist before, it is simply that because of the pandemic they have a more active role in each educational process. An example of this is that ICT are generally applied in administrative management processes, such as tuition payments, human resources systems, payroll payments, enrollment systems, etc. With COVID-19 spreading throughout the world and without encountering any resistance that contains its high contagion capacity [3], society has been forced to implement lengthy isolation or quarantines. To continue with their activities, educational institutions, especially universities, have integrated videoconferencing systems into their infrastructures in order to generate synchronous meetings to replace face-to-face classes.
By replacing face-to-face classes with synchronous meetings, students and their learning are directly affected [4]. For this reason, universities are studying educational projects that allow them to change their educational model, focusing on meeting the new needs presented by students. Most of the educational projects that are analyzed by universities are not new, however, they have only been applied by some universities. Among these models are virtual education, online education, and coeducation [5]. These models have already been developed and there is a great deal of information on how they work. In these, the center of learning is the student, and they use resources and interactive activities that improve student understanding [6]. Once the student is in charge of learning it, the teacher takes the role of tutor who is in charge of clearing up the doubts that the student brings with him.
The pandemic and the measures that countries have taken to try to control it have changed society [7]. The use of ICT has allowed the continuity of most activities, which in the past focused on face-to-face attendance. With this reality, the future of education is definable, where its entire environment is modified and aligned to meet the needs of students. Mixed education is the alternative that is closest to the future, since having the best characteristics of face-to-face education and online education marks an advantage that adapts to the student, even with the integration of new technologies or emerging technologies [4]. It is possible to speak of a personalized education.
However, for the blended education model to be scalable and adaptable to the student, it needs to integrate ICT specifically in two important aspects. The first aspect is data analysis that allows the monitoring of students by simulating the areas of academic monitoring of face-to-face education. Data analysis has the advantage of obtaining information on all the activities that the student performs, regardless of the educational modality [8]. If necessary, the analysis includes psychosocial data to determine problems related to the student’s emotional state, quickly identifying problems in order to generate efficient solutions so as not to impair learning. Another aspect is decision-making; ICT have to provide systems that are in charge of notifying and giving quick solutions to students, always considering their learning [9].
This work takes as a reference the use of a data analysis architecture that allows identifying the needs of university students, and the results are analyzed to generate improvements in their learning [10]. For this, artificial intelligence (AI) techniques are used that take the knowledge generated from data analysis and interact with the student and with the areas in charge of academic monitoring [11]. This work is divided into the following sections that have been considered key to reach the proposed objectives. Section 2 defines the materials and method; Section 3 presents the results obtained from the analysis; Section 4 presents the discussion of the results obtained with the proposal for improvement in the educational modality to improve learning; Section 5 presents the conclusions found in the development of the work.
2. Materials and Methods
For the development of this work, it is necessary to establish the problem that education faces. In addition, it is important to establish the connection of the different concepts used and the relationship with the expected results of the data analysis, as well as the recommendation of the system through AI.
2.1. Identification of the Problem and Previous Knowledge
The pandemic generated by COVID-19 has changed the way society conducts its activities. University education is no exception, to the point that in order to give continuity to education, it has been necessary to include ICT in a more recurrent way. Among the ICT tools used are videoconferencing platforms, as well as learning management systems (LMS). These platforms solved many of the main problems generated by isolation to avoid contagion [12]. They also showed other problems that directly affect learning, but identifying the factors that affect learning becomes a difficult task to accomplish. By not clearly identifying the causes of poor student performance, it is impossible to make adequate decisions to improve learning and educational models [13].
2.1.1. Face-to-Face Education Model
Face-to-face education requires the mandatory presence of the student in the classroom, where learning is directed by a teacher [14], who, in his most traditional role explains, clarifies, and communicates ideas and experiences. In this model, learning has the teacher as the main actor; it is the teacher who determines what students should learn and how they should do it. The teacher determines the bibliographic references, the resources, and the activities that the student must carry out [15]. The assignments and projects and exercises in class are proposed by the teacher according to what he needs to evaluate.
2.1.2. Online Education Model
Online education refers to the technology used for the teaching–learning process, in which personal computers are used on the students’ side, connected through a network to a server where the system that provides and manages online courses is located [16]. However, this concept does not encompass everything that online education means, since, being a student-centered model, the methodology is adjusted and centered on the student. The design of resources and activities requires a greater effort in this modality, to the point that academic designers and multimedia designers with extensive knowledge in pedagogy are required [17]. Its objective is to create an interactive environment in all its phases that go from the meetings without chronicles to the development of activities.
2.1.3. Analysis of Data
Data analysis is widely used in organizations, and consists of processing available data and presenting the results for decision-making [18]. Through analysis, it is possible to identify patterns in the data and classify them in order to provide special treatment to the generators of the data. Analysis processes are widely used in areas of mass consumption, marketing, social networks, etc. Through analysis, organizations essentially seek to identify their customers’ consumption trends and offer them a better service [19].
The main models of data analysis considered are business intelligence (BI) and gig data. Big data is a technology that monopolizes world interest at the time of decision-making [20]. Its ability to handle structured and unstructured data places it above BI, as its ability is limited to handling strictly structured data [21]. The difference is not simply in this capacity, but also in the processing capacity and the speed at which they obtain results [22]. The choice of models depends on the needs that arise in organizations and the volume of data they handle.
2.1.4. Artificial Intelligence
AI is the simulation of human intelligence by machines. In other words, it is the discipline that tries to create systems capable of learning and reasoning like a human being, that can learn from experience to solve problems in certain given conditions [23]. These processes include learning (the acquisition of information and rules for using the information), reasoning (using the rules to arrive at approximate or definitive conclusions), and self-correction [10]. AI in education can automate various processes such as monitoring student assessments, generating grades, recommending activities, etc.
2.2. Application of the Data Analysis Model
The analysis model in a university depends on several factors, among these are the volume, variety, and speed of data processing. These factors are practically the characteristics of big data; though this does not imply that an architecture of this type fits every university. There are many universities that, within their infrastructures, include data analysis models such as BI for decision-making. Therefore, to establish which is the correct architecture that meets the needs of the university, a complete analysis of the questions to be solved must be carried out, as well as the type of data that is generated in the institution, whether structured or unstructured. The previous analysis of the requirements have been carried out by the authors in works such as [24,25,26], where it is defined that a big data architecture meets the needs of the study.
2.2.1. Data analysis Architecture
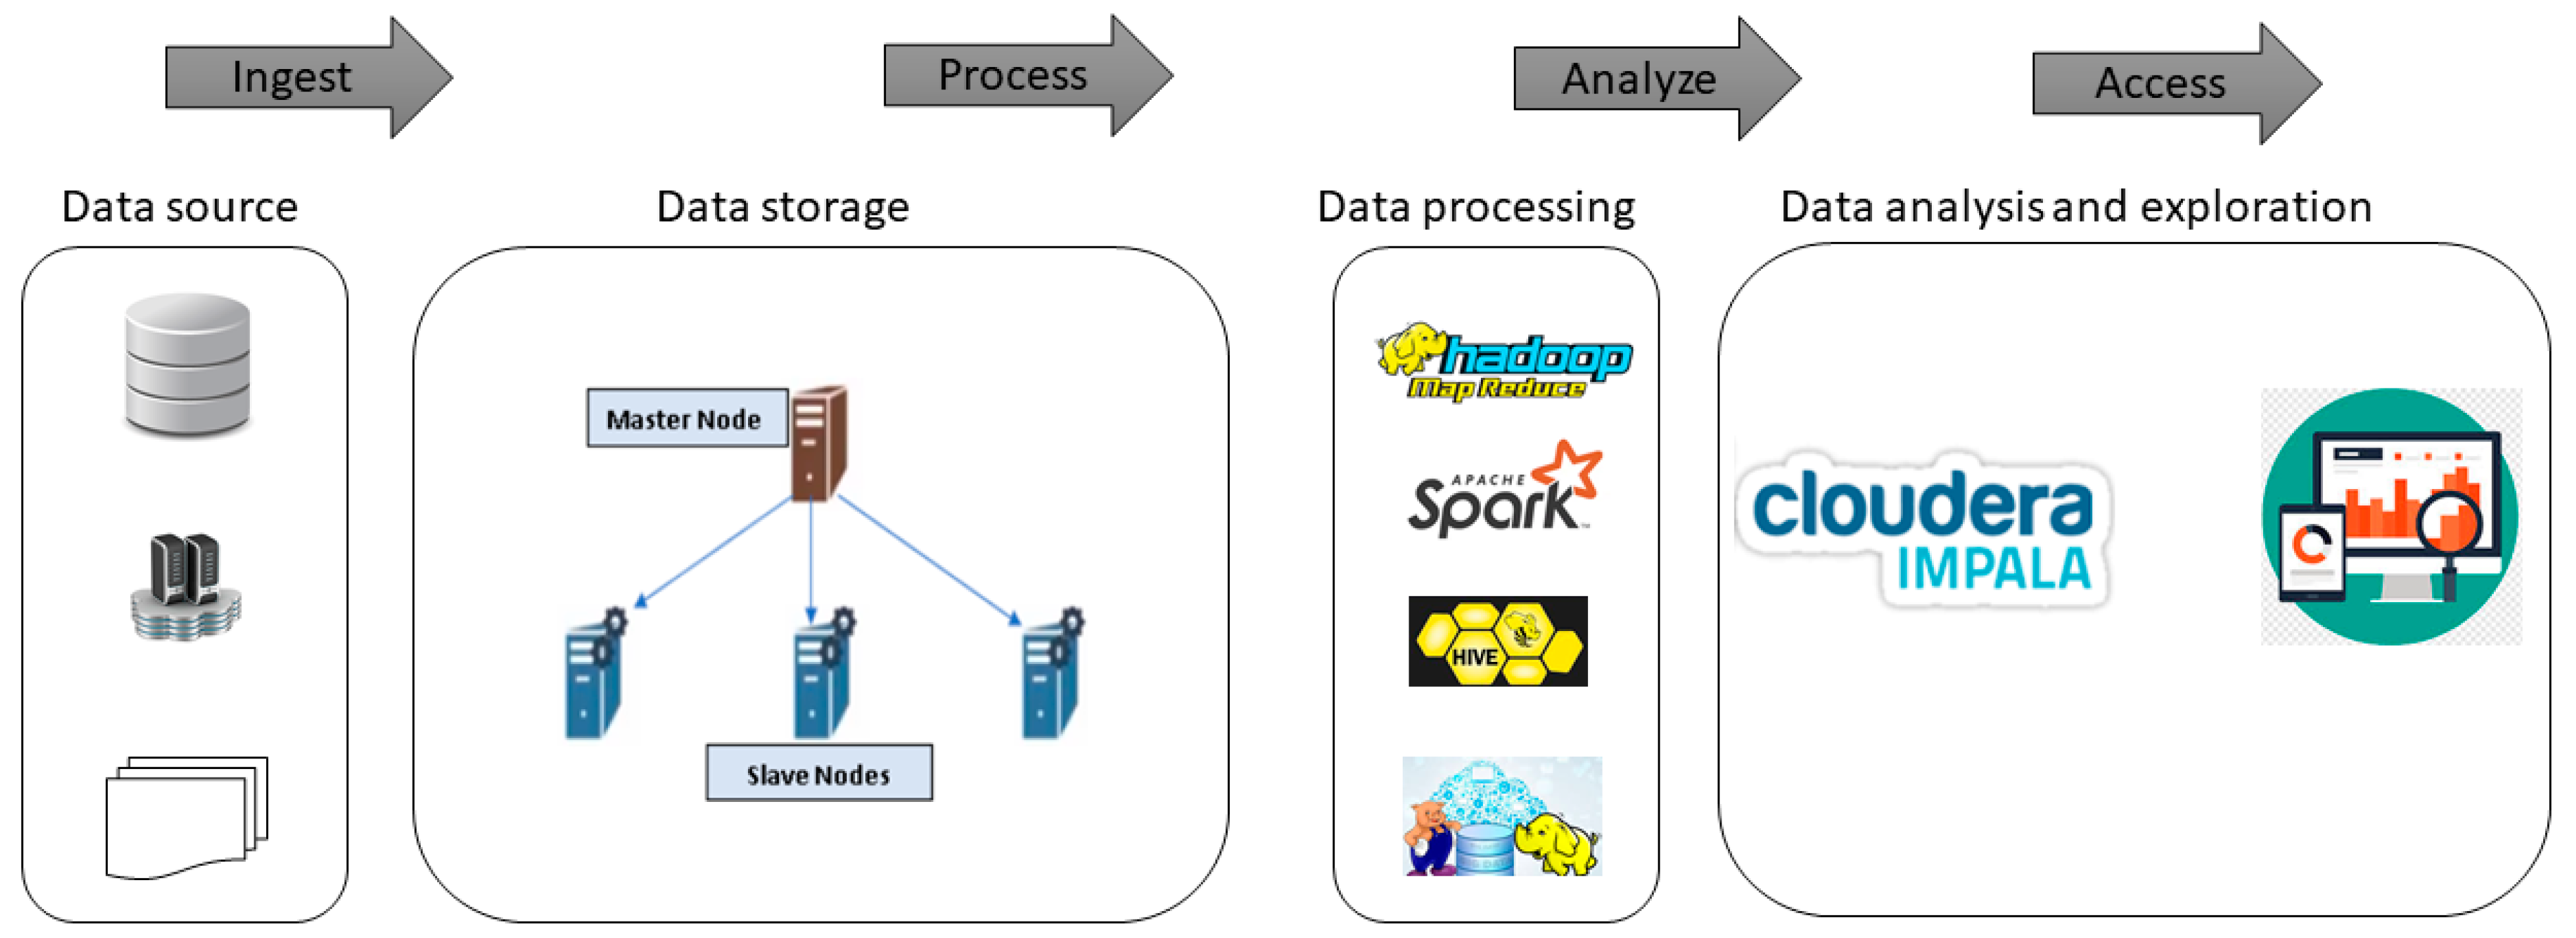
Currently, the use of big data architectures is common in organizations. For this reason, there are a wide variety of tools that contribute to its implementation in any environment [27]. There are tools that have commercial and open-source licensing, and for this work the Apache Hadoop framework is used. Hadoop is an open source tool, widely used by large corporations and has a large amount of information, which makes it easier for technicians to implement it [28]. In Figure 1, the general architecture that facilitates the analysis of the different data sources that are part of the university is presented. This architecture depends on four stages: ingestion, processing, analysis, and access to results.
In to ingest are all the data sources that are considered for the analysis, these sources contain structured and unstructured data. In remote mode, videoconferencing platforms are used that allow the generation of synchronous meetings [29]. All student interaction generates data that can be structured as unstructured that is integrated into the analysis. In addition, there are the traditional systems that consist of structured databases; therefore, it is necessary that there be scalability in the architecture considering that the future of education will be the integration of ICT to academic activities.
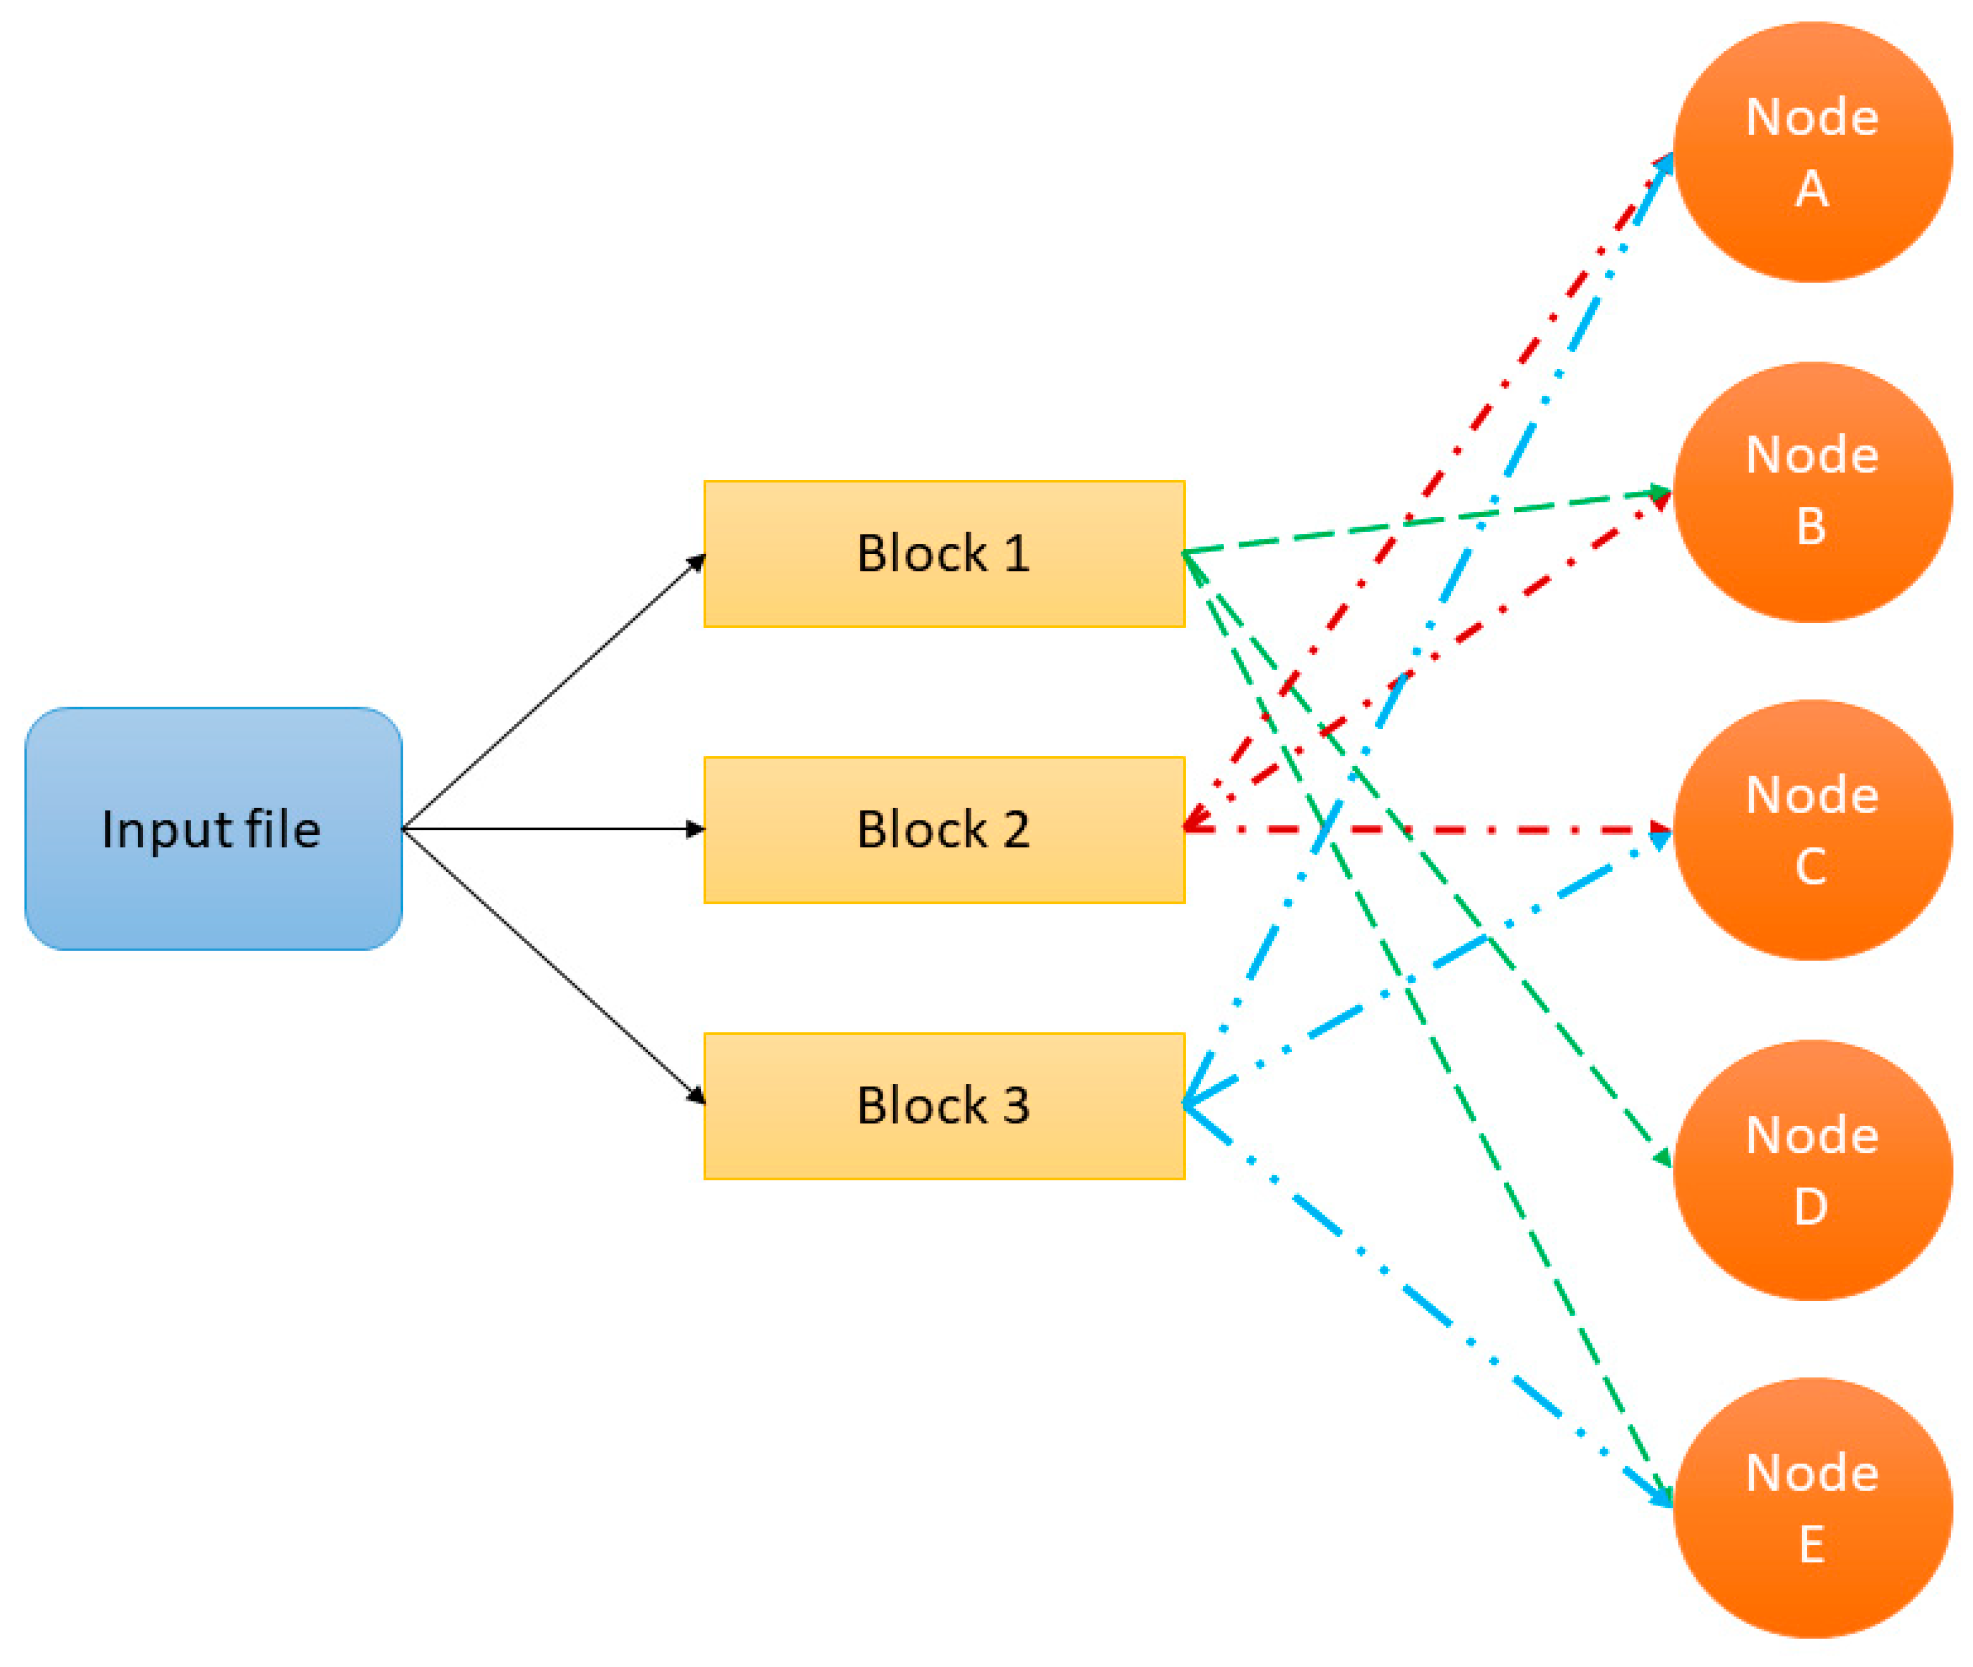
In the processing, the architecture begins with the storage of the data, for which it makes use of the tools of the Hadoop Distributed File System (HDFS) [30]. HDFS divides the data into blocks, where each block is replicated in different nodes so that the fall of a node implies the loss of the data it contains [31]. In this way, the use of programming models such as MapReduce is facilitated, since several blocks of the same file can be accessed in parallel, as can be seen in Figure 2.
The analysis includes data processing, for this, the architecture makes use of MapReduce that allows the development of applications and algorithms under the Java language for the distributed processing of large amounts of data [32]. Within the ecosystem, the applications developed for the MapReduce framework are known as “Jobs”; these are composed of the following functions: Map (mapping), in charge of dividing the processing units to be executed in each node and distributing them for parallel execution [33]. Each call is assigned a list of key/value pairs. Shuffle and sort, mixes the results of the previous stage with all the key/value pairs to combine them in a list and in turn they are ordered by key. Reduce, receive all keys and lists of values, adding them if necessary. In Figure 3, you can see the operation of each of the components.
The access refers to the analysis and exploration of the data, for which Impala is used. This allows interactive SQL queries with very low latency. In addition, it supports multiple formats such as Parquet, ORC, Json, or Avro and storage technologies such as HDFS, Kudu, Hive, HBase, etc. Processing is characterized by dividing the query into chunks and distributing them over the nodes. Therefore, for this strategy to be efficient it needs a large amount of data that is distributed and partitioned properly [34].
2.2.2. How the Data Analysis Model Works
To detail the operation of the data analysis model by means of the big data framework, each of the phases is represented by means of Figure 4. The process begins with the request that answers a question that seeks to be satisfied by the processing of the data. It is in this phase that the research question should be posed. For example, in the remote education modality it is necessary to establish the state of learning, and which the activities in which the students present the greatest disadvantages. To establish the solution, the architecture establishes all the data sources that have relevant information for the analysis. Among the selected sources is the LMS that the university has, the academic system that includes student attendance, a financial system that provides information on tuition payments. In addition, it is integrated as a data source to the system that is responsible for generating synchronous meetings. The reason for including these data is to verify the effectiveness in classes that refer to the interaction of the student with the teacher in the synchronous class [35].
With the identified data sources, data ingestion is performed using HDFS. This tool takes care of extracting the data you need and splits it into the cluster. This reduces storage and processing resources [36]. The data found in the different nodes of the cluster is processed through MapReduce. In the analysis, Pig is used as a tool for the development of queries to previously stored data [37]. The queries handle a format similar to SQL, so it becomes a friendly ecosystem for programmers. In the next phase the results are validated, if they exist, they do not give an answer to one of the questions. For example, if the data is not enough to answer the question that deals with the activities that represent a major problem for the students, the system returns to the data sources and integrates a new one in order to take the largest number of variables allowing you to perform a granular analysis of the problem. Instead, if the results are sufficient to answer the question, the results are stored by Hive. This tool allows to generate a data warehouse in order to offer an exhaustive summary of analyses, data, and queries [38].
The next phase allows access to the results, however, for this the data is processed by Impala. This tool allows performing analytical queries in core SQL language that facilitates obtaining results and allows presenting knowledge through graphical structures to improve decision-making. The results are evaluated again to determine that the results that will be presented to the end user meet the conditions established in the initial question [39]. If these do not present clarity in the answer, the process returns to the data warehouse created by Hive, adds the necessary data, and repeats the processing until the results are satisfactory. Otherwise, if the consultations made by Impala satisfy the conditions established in the question, the system presents the results graphically and exits the process.
2.3. Recommendation System through Artificial Intelligence
The results obtained from the data analysis contain value about the students. This implies that it is possible to identify patterns in student data and even classify them. With this knowledge, decision-making traditionally depends on a group of experts in academic and learning subjects. These groups of experts are the ones who are in charge of making decisions and generating notifications for students and teachers in search of a method that allows them to improve learning [40]. However, this usually creates a funnel where actions are dammed, or it takes too long for the people in charge to take an action that allows for improvement. Therefore, the effectiveness of the process is lost and sometimes a critical problem is generated in the students′ performance. To improve decision-making, it is necessary to include a model that allows effective and efficient decision-making.
Decision-making in this work is based on identifying the learning activities that represent a major problem for students. This knowledge is already available from data analysis and the results are presented in the form of reports or notifications, both to students and teachers to take action to improve their performance. In this scheme there is always an intermediate actor who discovers the anomaly [41]. This transmits this knowledge to the teacher who proposes a different activity to the student adjusted to her needs.
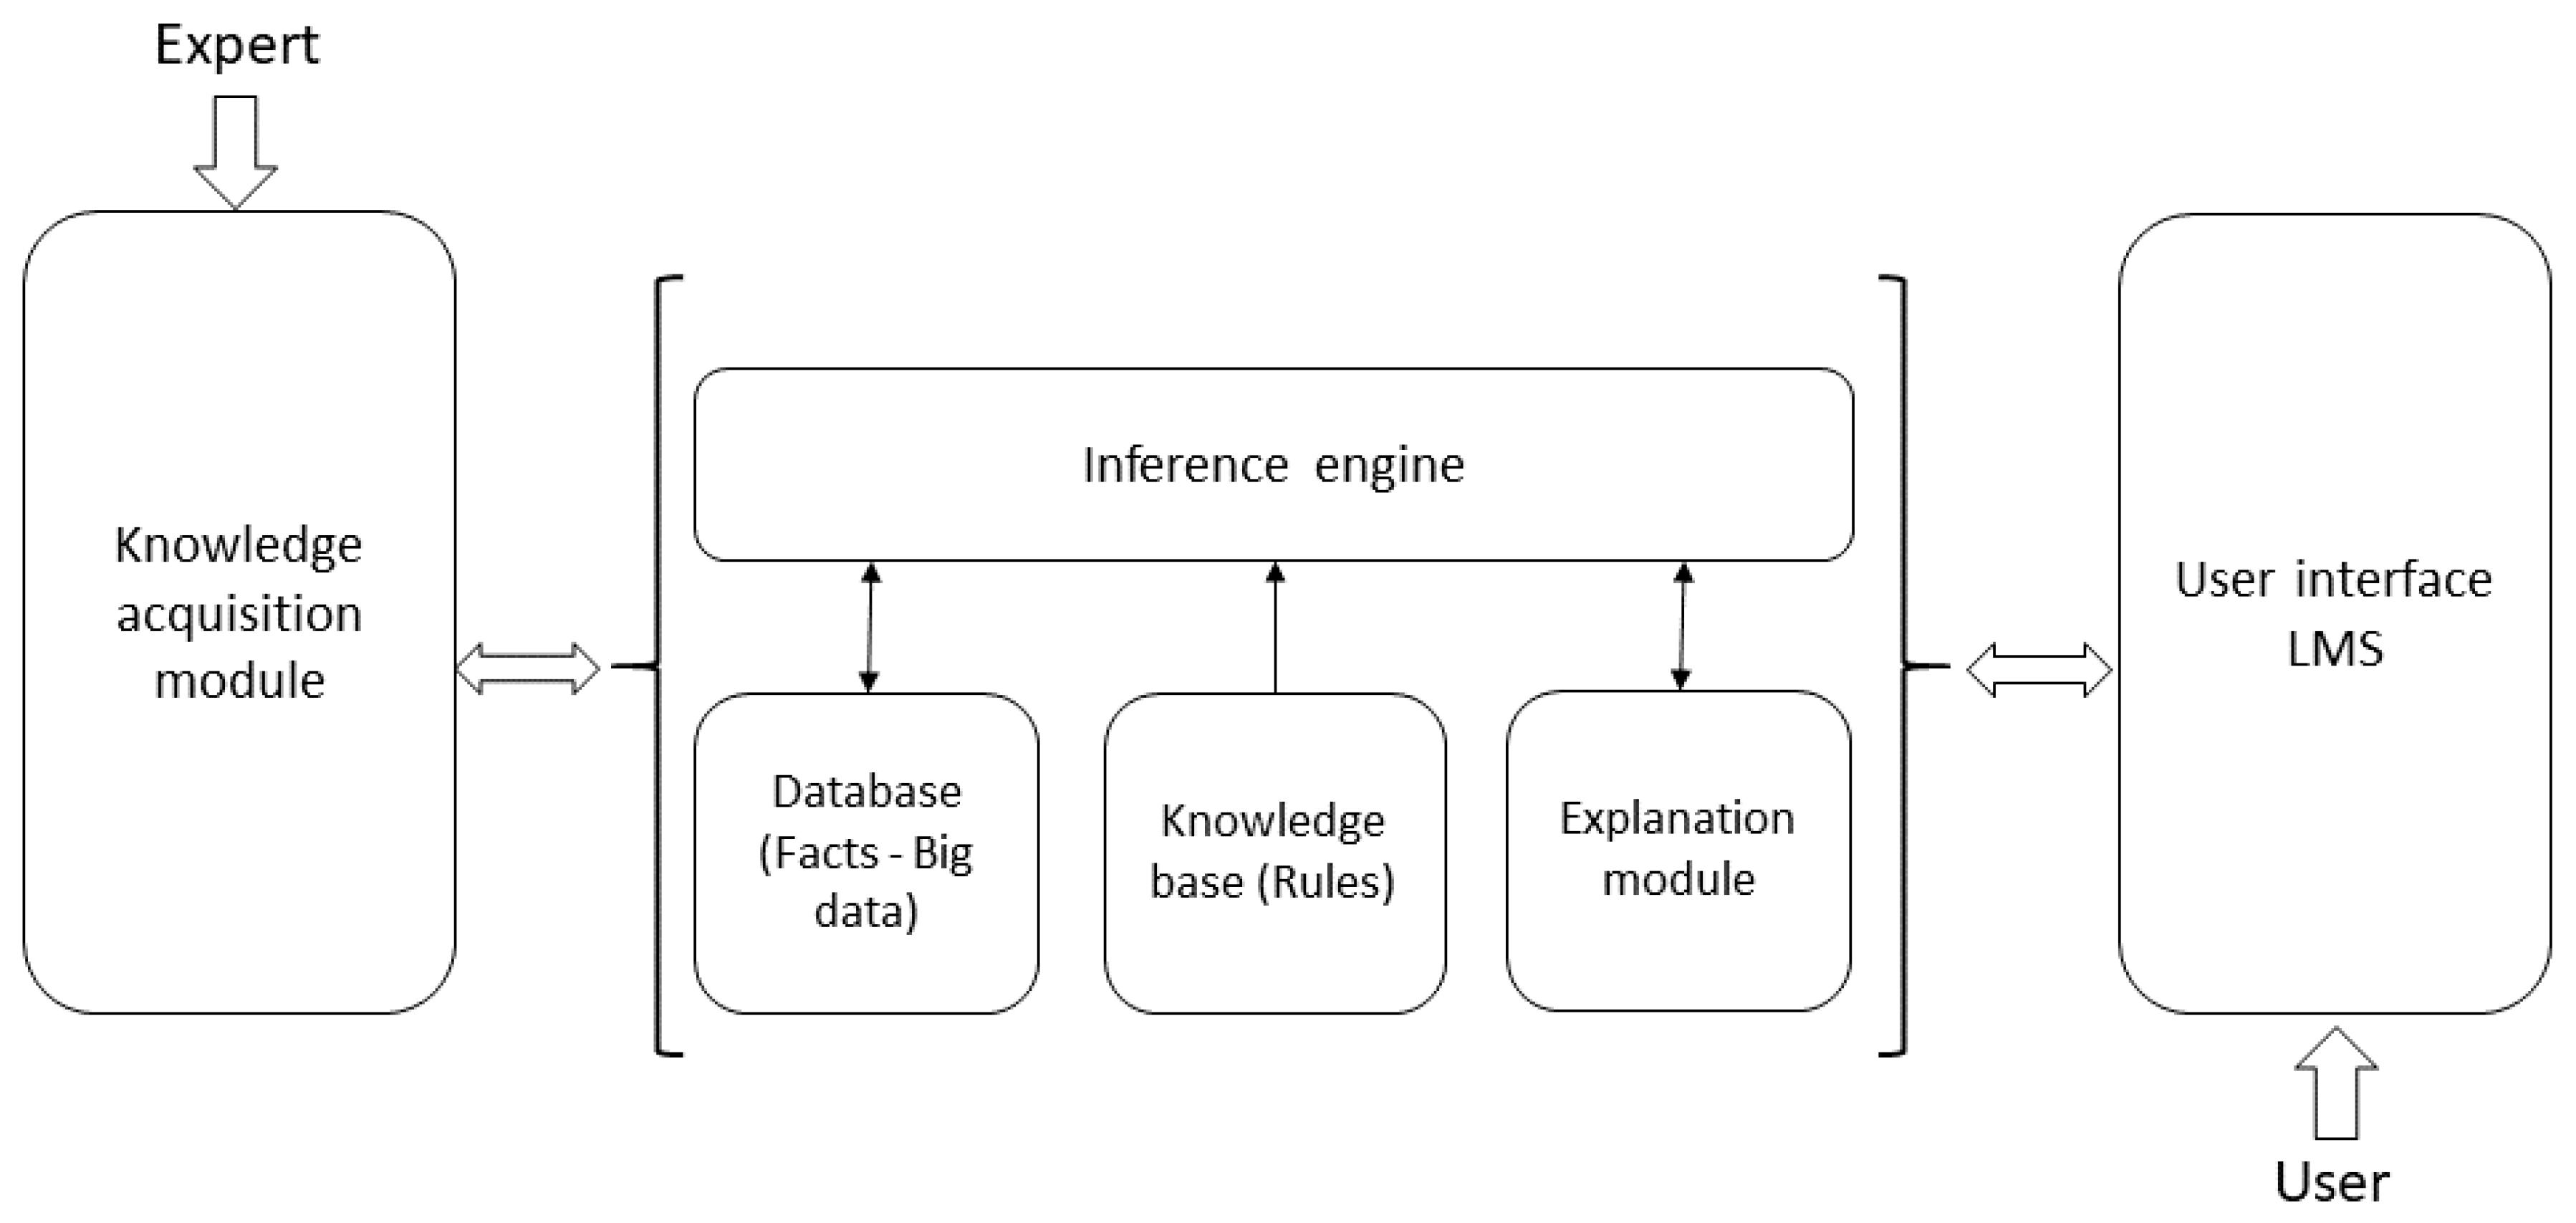
To create this intermediate actor that is in charge of interacting with the teacher and student based on the results of the data analysis, a proprietary application based on deterministic rules has been created. A rule in this context is a logical proposition that relates two or more objects in the domain and includes two parts: the premise and the conclusion. It is usually written as “If premised, then conclusion”. Each of these parts is a logical expression with one or more object-value statements connected by logical operators (and, or, or not). By using a rule-based system, the expert who is responsible for decision-making is simulated, the expert is designed to work as if he were an expert in recommending activities. It replicates or simulates the knowledge that these people have acquired based on the tools offered by artificial intelligence. Its main function is to offer solutions that can solve practical problems or the creation of new knowledge. In Figure 5, the general architecture of the expert system is presented [42].
The expert is the person who interacts with the system to transfer their knowledge to it by inserting rules [43]. In this area are academic developers, teachers, even multimedia developers who are responsible for translating the knowledge of experts into LMS. The knowledge acquisition module is the interface between the rule-based expert system and the human expert, through which new knowledge enters the knowledge base. The database (facts) is the important or relevant data related to the specific problem. It consists of two parts: permanent, which are the facts that do not change and that always appear in the problem, and temporary, which are variant facts that change while trying to solve the problem [44]. The knowledge base (rules) is the way in which knowledge is stored through the use of rules. A rule is only part of the knowledge with which the problem is solved. The explanation module is in charge of generating the results or diagnoses for the user, which have been obtained from the inference engine. The inference engine is in charge of generating new knowledge using the existing one, through the simulation of a reasoning procedure. This procedure starts from a series of data until a solution is obtained. The user interface is the part of the rule-based expert system with which the user interacts [45]. The user is the person who consults the system for an answer.
For the integration of the systems, it is necessary to define what is presented to the student or to the interested parties. The goal of this system is for the ability to interact with the user. For example, if a student has a poor grade in an activity, the system must generate and send an event that alerts both the student and the teacher about what happened [46]. However, this interaction is not enough and is part of the monitoring that the system can perform. Its scope goes to the recommendation of activities or resources that the student must develop and investigate to generate learning. In the integration of the systems, there are two points: the first is that the system that is in the first line of interaction with the student is the expert system, and in the second, the data analysis is executed. This does not imply that it has a lesser degree of importance; on the contrary, data analysis becomes the engine of the whole set. The Hadoop framework is in charge of identifying existing problems, even the academic follow-up declares it in an instance of data processing.
The data is integrated into the expert system on the basis of facts; here the expert system has the information of each student included in the analysis. With this information and based on the weights that are established, the system can determine any anomaly in the performance of the students. The expert system, by identifying the type of anomaly, for example, low grades, low times in the effectiveness of classes, etc., quickly recommends action to overcome the failure [47]. To carry out this process, the system searches the knowledge base for the different rules that allow it to solve the problem. The inference engine is in charge of this, for the management and logical control of the management and use of the knowledge stored in the database (DB).
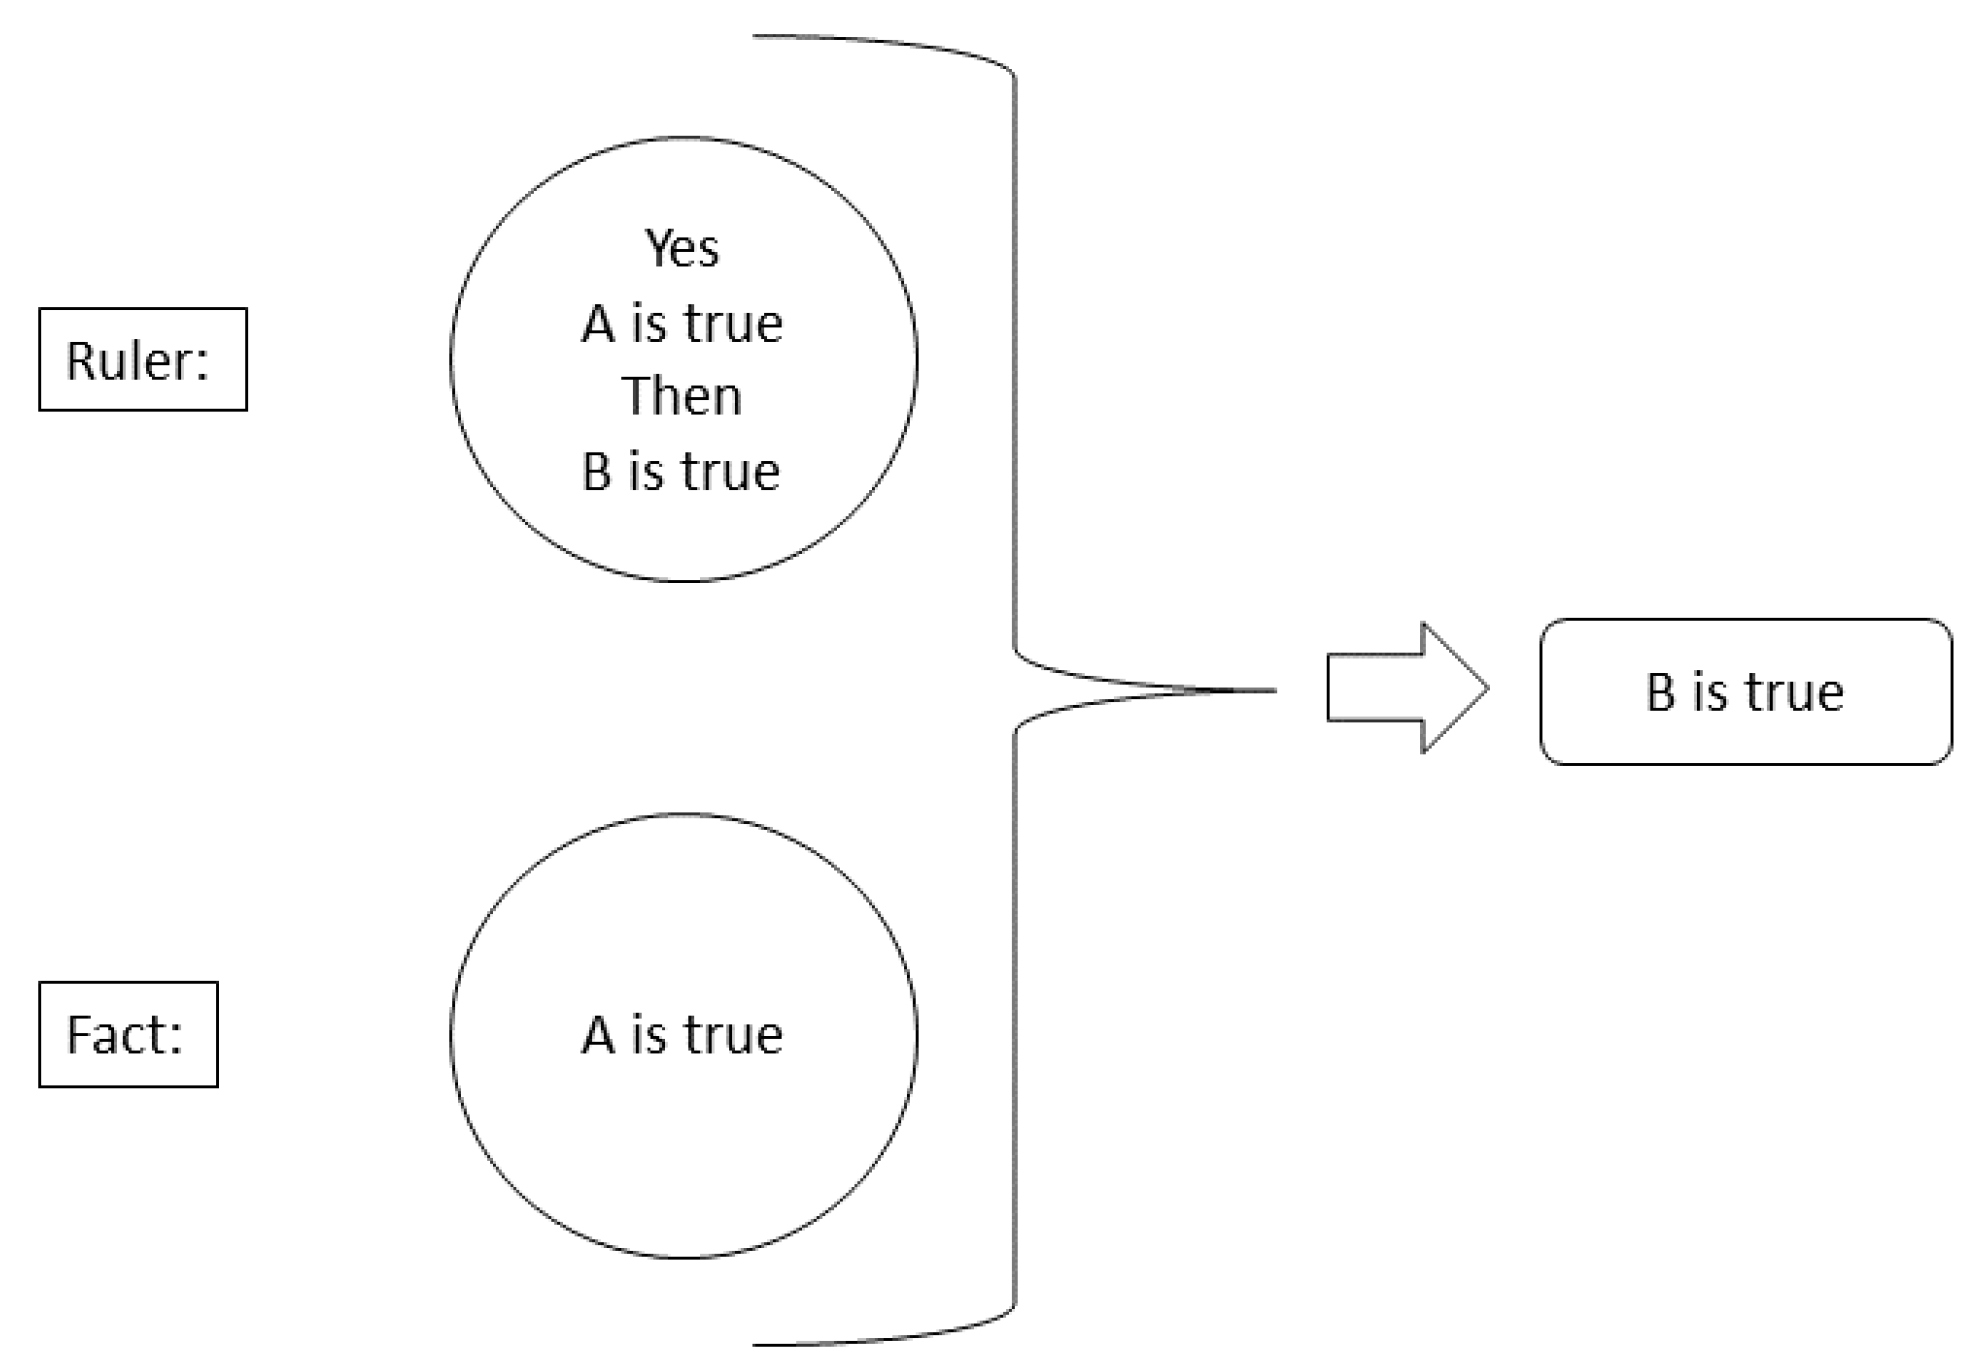
The inference engine performs two main tasks: examines facts and rules and, if possible, adds new facts, decides the order in which inferences are made, performs tasks, and uses inference strategies and control strategies [48]. The inference strategies that are most used in expert systems are based on the application of the logical rules called “modus ponens” and “modus tollens”.
In this work the modus ponens model is used; it is used to obtain simple conclusions as shown in Figure 6, it analyzes the premise of the rule, and if it is true, the conclusion becomes part of the knowledge. For example, suppose you have the rule, “If A is true, then B is true” and you also know that “A is true”, then the modus ponens rule concludes that “B is true”.
3. Results
The environment where the system is implemented is a university in Ecuador, which has a face-to-face academic proposal. To continue their activities during the pandemic, they have integrated a platform into their infrastructure that allows them to run synchronous meetings. The student population is close to 10,000 students divided into the matrix located in the city of Quito and two branches located in the main cities of the country. This work has been applied to the matrix that contains around 4000 students belonging to five different faculties. The analysis was carried out on first semester students in a remote mode as a result of the pandemic. The objective of conducting the analysis in this group is to determine if there are possible cases of attrition. In addition, it seeks to determine the state of learning in the group. The number of students is 18 people, this course belongs to the career of computer engineering, so the use of ICT in most of its activities is frequent, which ensures a large volume of data.
The expert system has been developed with the intention of being transparent in the interaction with the student. This means that it has been developed as an additional module of the LMS, this being the system that the student uses for most academic activities. Therefore, the student will not have to enter an additional system to observe her own performance. The system, at the moment the student accesses the LMS accesses the results of the data analysis in search of the student′s academic performance. If there is any pending activity, the system sends notifications through emails to the student and presents it on the LMS calendar. If there is any grade lower than 6/10, which is the average established by the university as a minimum grade that the student must meet to pass the different subjects, it triggers an event in the expert system that is responsible for starting the process for the recommendation of activities.
In the first stage, students with problems in academic performance are identified. Table 1 shows the results of the analysis, for which academic data sources, a synchronous meeting system, and financial sources were integrated. The relationship of the data obtained is as follows: the academic sources provide personal information of the students that, to present them, an identifier has simply been placed for the proper handling of the information. This system contains the final grades of the students, by university policy the students who do not reach the score of 6 points repeat the subject, which in this study is Programming I. The third column is information that the system has crossed with synchronous meeting system data. This system records the connection time that the student has. However, it is not simply the time a student starts the session and when it ends, but the system has the ability to detect if a student shows activity during the session. This is done through the detection of events that it has with the peripherals from your computer. For example, the camera detects the presence of the student, the software detects the activities that the student has, and issues reports on this interaction. The keyboard and microphone are used to detect the dedication of the student while in the synchronous session. The academic period is composed of 16 weeks of which 14 are effective weeks of classes with three hours a week assigned to the subject. Two weeks are used by the teacher to carry out comprehensive evaluations to students. Therefore, a student who effectively completes his classes through synchronous meetings will have 42 effective hours.
In the fourth column, the system adds the data from the financial system, and these data are obtained through surveys conducted with students. The objective of the surveys is to determine if there are financial problems for students or their families to generate tuition payments, given that the university is a model of private education that has its own financing. A weight was added to the answer to present them in the results with the information cross-referenced by the Hadoop framework. The survey presents several questions on various topics of interest to the university. However, the following question has been included in the analysis with its corresponding weights:
Due to the pandemic, you have financial problems to cover tuition costs:
- Very high: 1.00
- High: 0.75
- Medium: 0.5
- Low: 0.25
- None: 0.00
From the results obtained there is information that is easy to relate. For example, the majority of students who meet or exceed the average of 6 and pass the subject exceed 33 h of effectiveness in class. There is a case that must be analyzed because it exceeds the average of 6, but its effectiveness in classes reaches 17 h of the 42 required. There are six students who do not meet the requirements to pass the course and the study continues with these students. Table 2 shows the cases that have been considered for a granular analysis to determine the causes of their poor performance. The data presented in this table is easy to understand thanks to the Hadoop tools used. As a first analysis of these results, it can be determined that grades have a direct relationship with the number of effective class hours of students. One reason for this is the change from face-to-face to remote modality, which was so rapid that, in the change, the institutions maintained a face-to-face educational method. In other words, the resources, activities, and all that correspond to the material used for the development of learning were not modified. Even something as important as the syllabus of the subjects that are the main resource that helps students define the rules and norms that they must follow in each subject was maintained. The problem arises in that this method works when the main actor of learning is the teacher, who through face-to-face classes becomes the learning sensor. He is the one who identifies the existing problems within the classroom, even with the interaction with the student he can become the motivator of learning, defining what the student should learn and how he should do it.
When trying to replace face-to-face classes with synchronous meetings, a problem is generated that beyond learning is based on the motivation that the student feels through these tools. A proof of this is that the students presented in the table have a low number of effective hours of classes in relation to those who passed the course. However, it should be noted that in this group the problems with tuition payments are more accentuated. This is a factor that undoubtedly affects students, even creates a negative learning environment; there are cases where students, knowing that their economic projections do not cover the payment of the next tuition, abandon the subjects they are studying. Specifically, in these results we have three students with high problems in their economic situation. If to this factor we add the low number of hours of classes in the period, a low performance is imminent.
The next step in the analysis is to determine the cause of the problem that pushes students to present low academic performance. To identify the problem for analysis, a new data source is integrated, which is the LMS DB. In this DB the information about the activities that the student carries out are recorded. Table 3 shows the details of the activities that the student developed in a normal course of classes. The activities are proposed by the teacher and respond to the needs and issues that the teacher decides to evaluate. In the Programming I course, students must comply with two types of activities, autonomous activities are programming exercises raised on the topics that are developed during synchronous meetings.
The tasks are graded on 2.5 points and the first total takes the grade point average, then there are the continuous evaluation activities, reflected as questionnaires. These activities evaluate the conceptual knowledge of the subject; they are quick questionnaires where students choose one option or several according to the question posed. The next column labeled “Total” takes the average of the questionnaires that have been raised during the academic period. The activities add up to five points and the rest are evaluated in exams. The column “Prac” refers to the practical test and the “Theor” column to the theoretical exam. The distribution of scores is three points for the practical evaluation and two points for the theoretical evaluation. The “Final Total” column corresponds to the sum of the activities and exams and is the one that determines whether a student passes the subject.
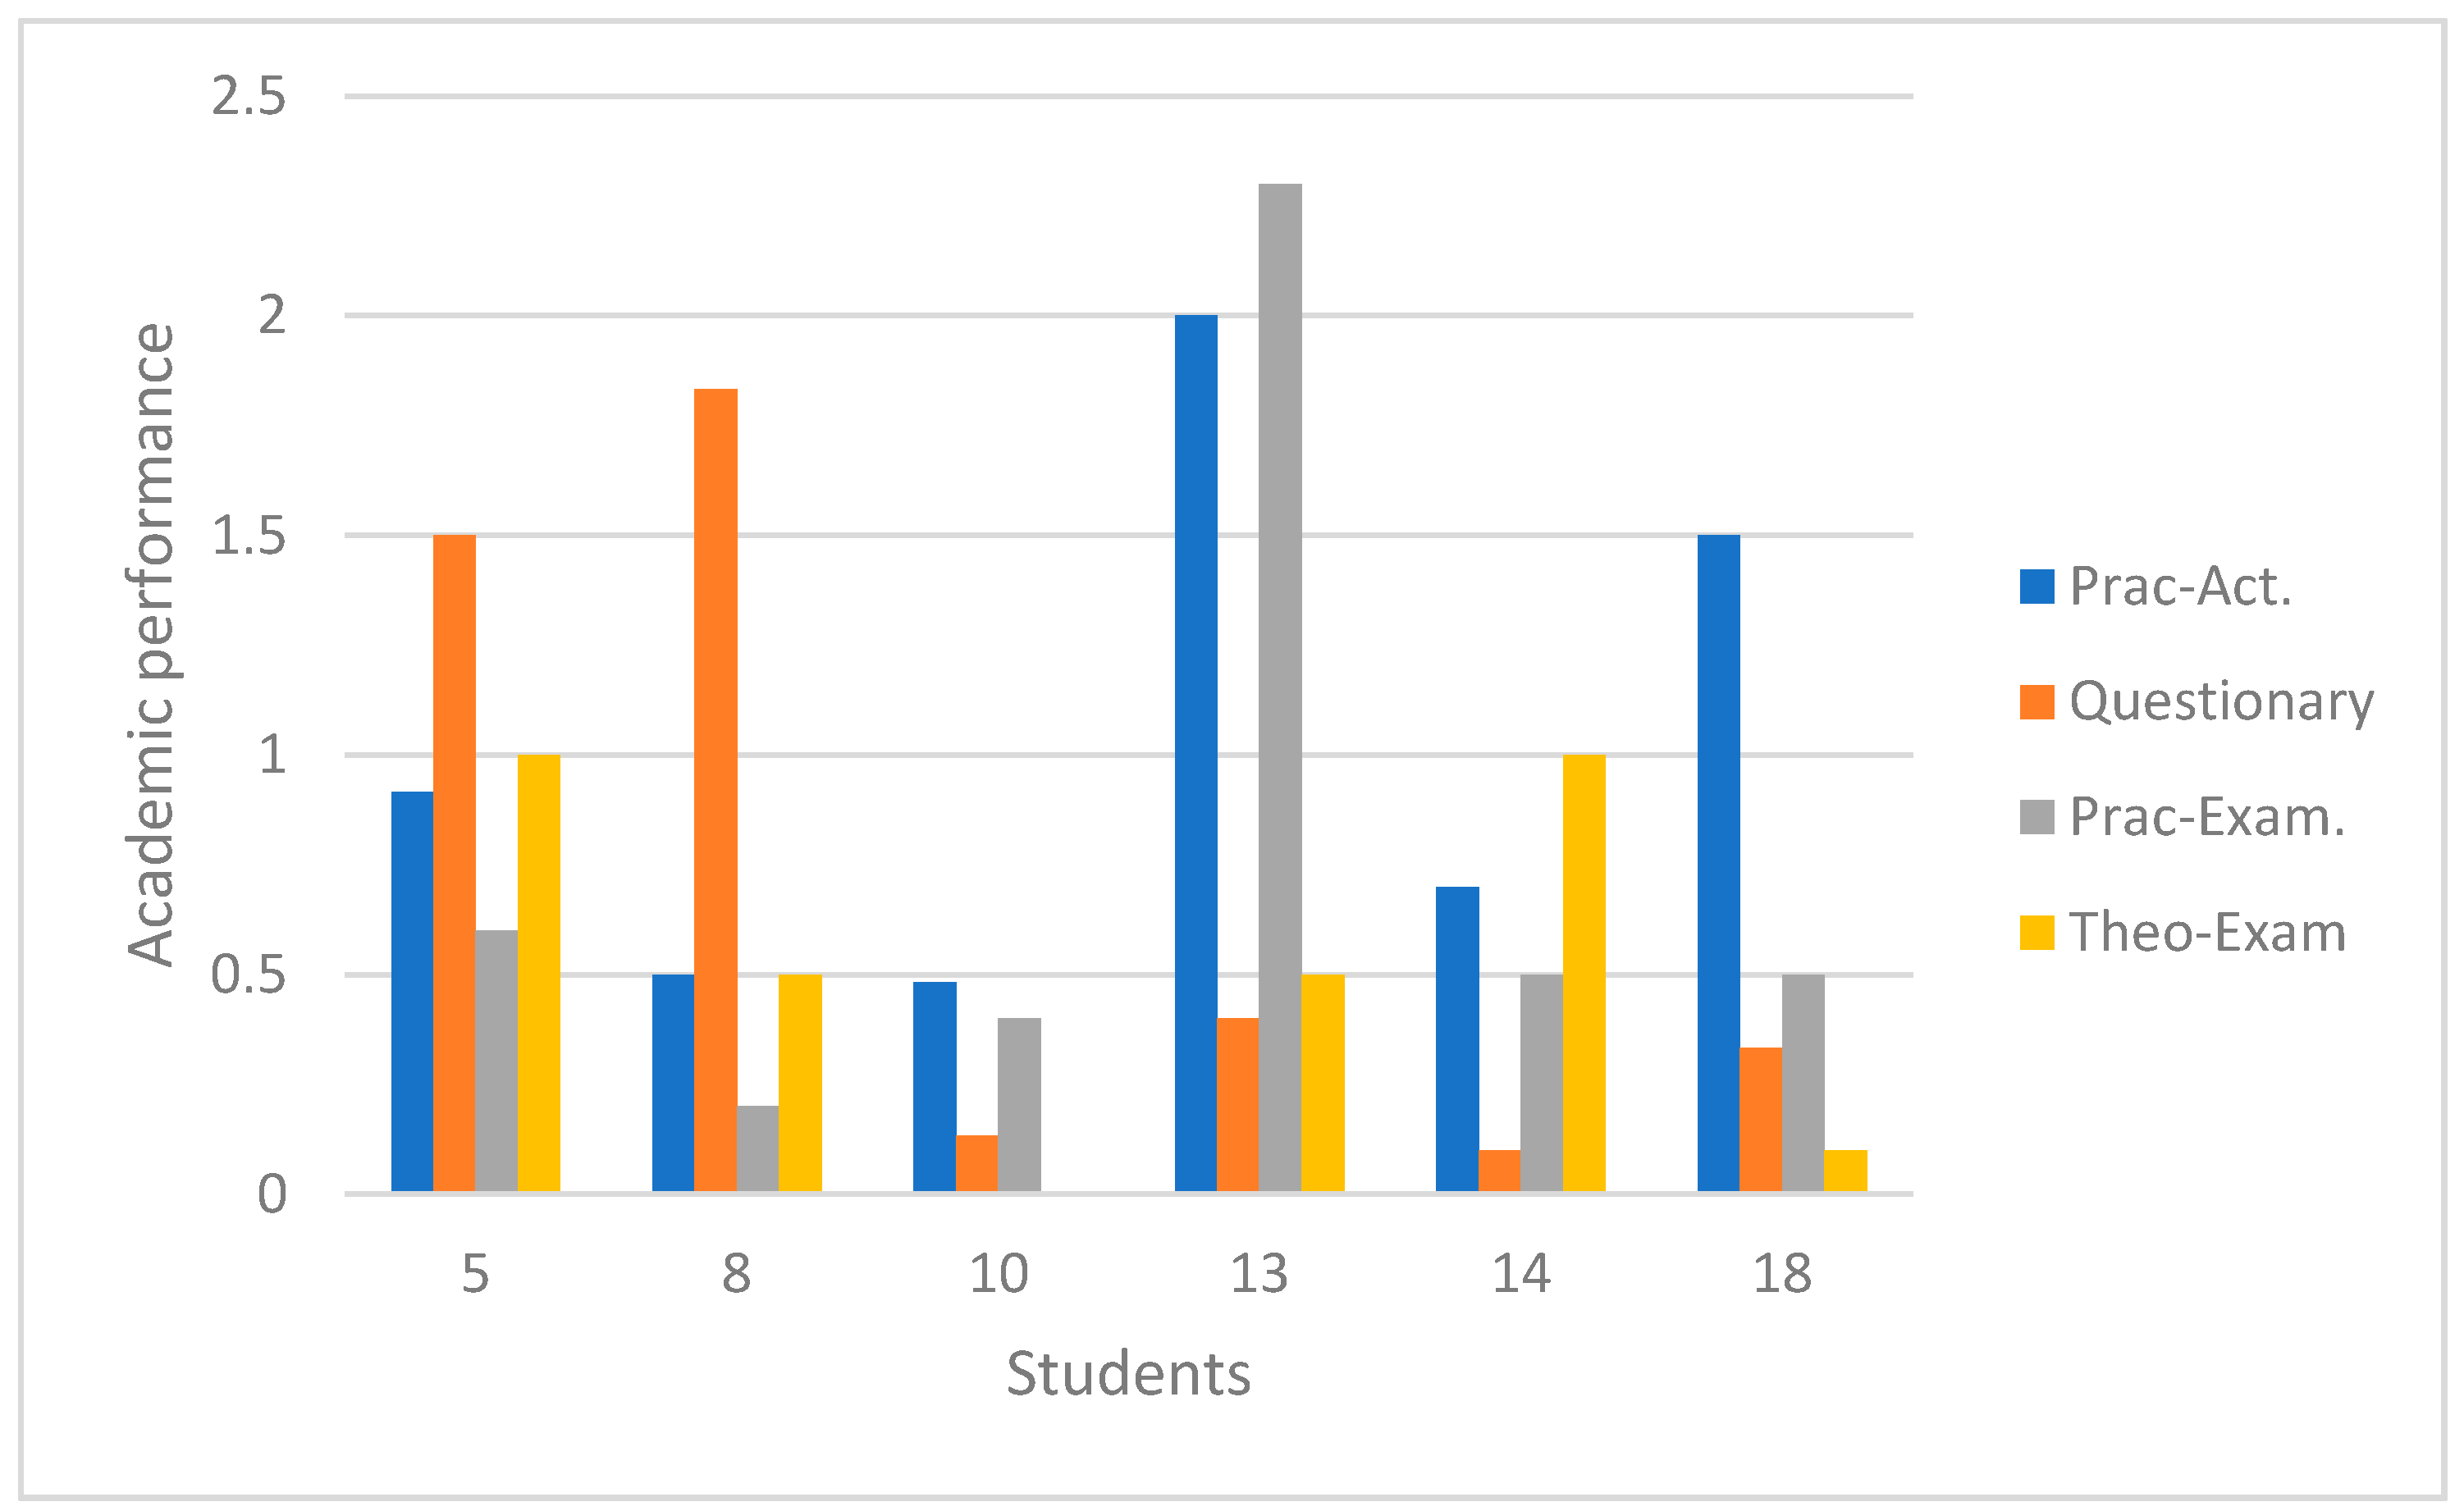
In the results presented in the table, the information is not clear, or it is difficult to understand what is happening in the analysis. Therefore, in accessing information, the Hadoop framework deploys several tools that allow interpreting this knowledge. In Figure 7, the performance of the different activities per student is presented, in the student axis are the identifiers of the six students analyzed. In this way, it can be determined that students 5 and 8 have a better performance in the development of questionnaire-type activities where the conceptual knowledge of the subject is evaluated. What is directly aligned with the development of the theoretical exam, this relationship is the one that needs to be exploited with the recommendation system.
In the case of the student with identifier 13, this relationship is more significant, since in the development of practical activities the performance is better than that found in the questionnaires. In addition, the performance in the practical exam is aligned with the results obtained in the practical activities. Similarly, in the following cases, although there is little distance between practical activities and questionnaires, it is possible to determine which activity best aligns the student.
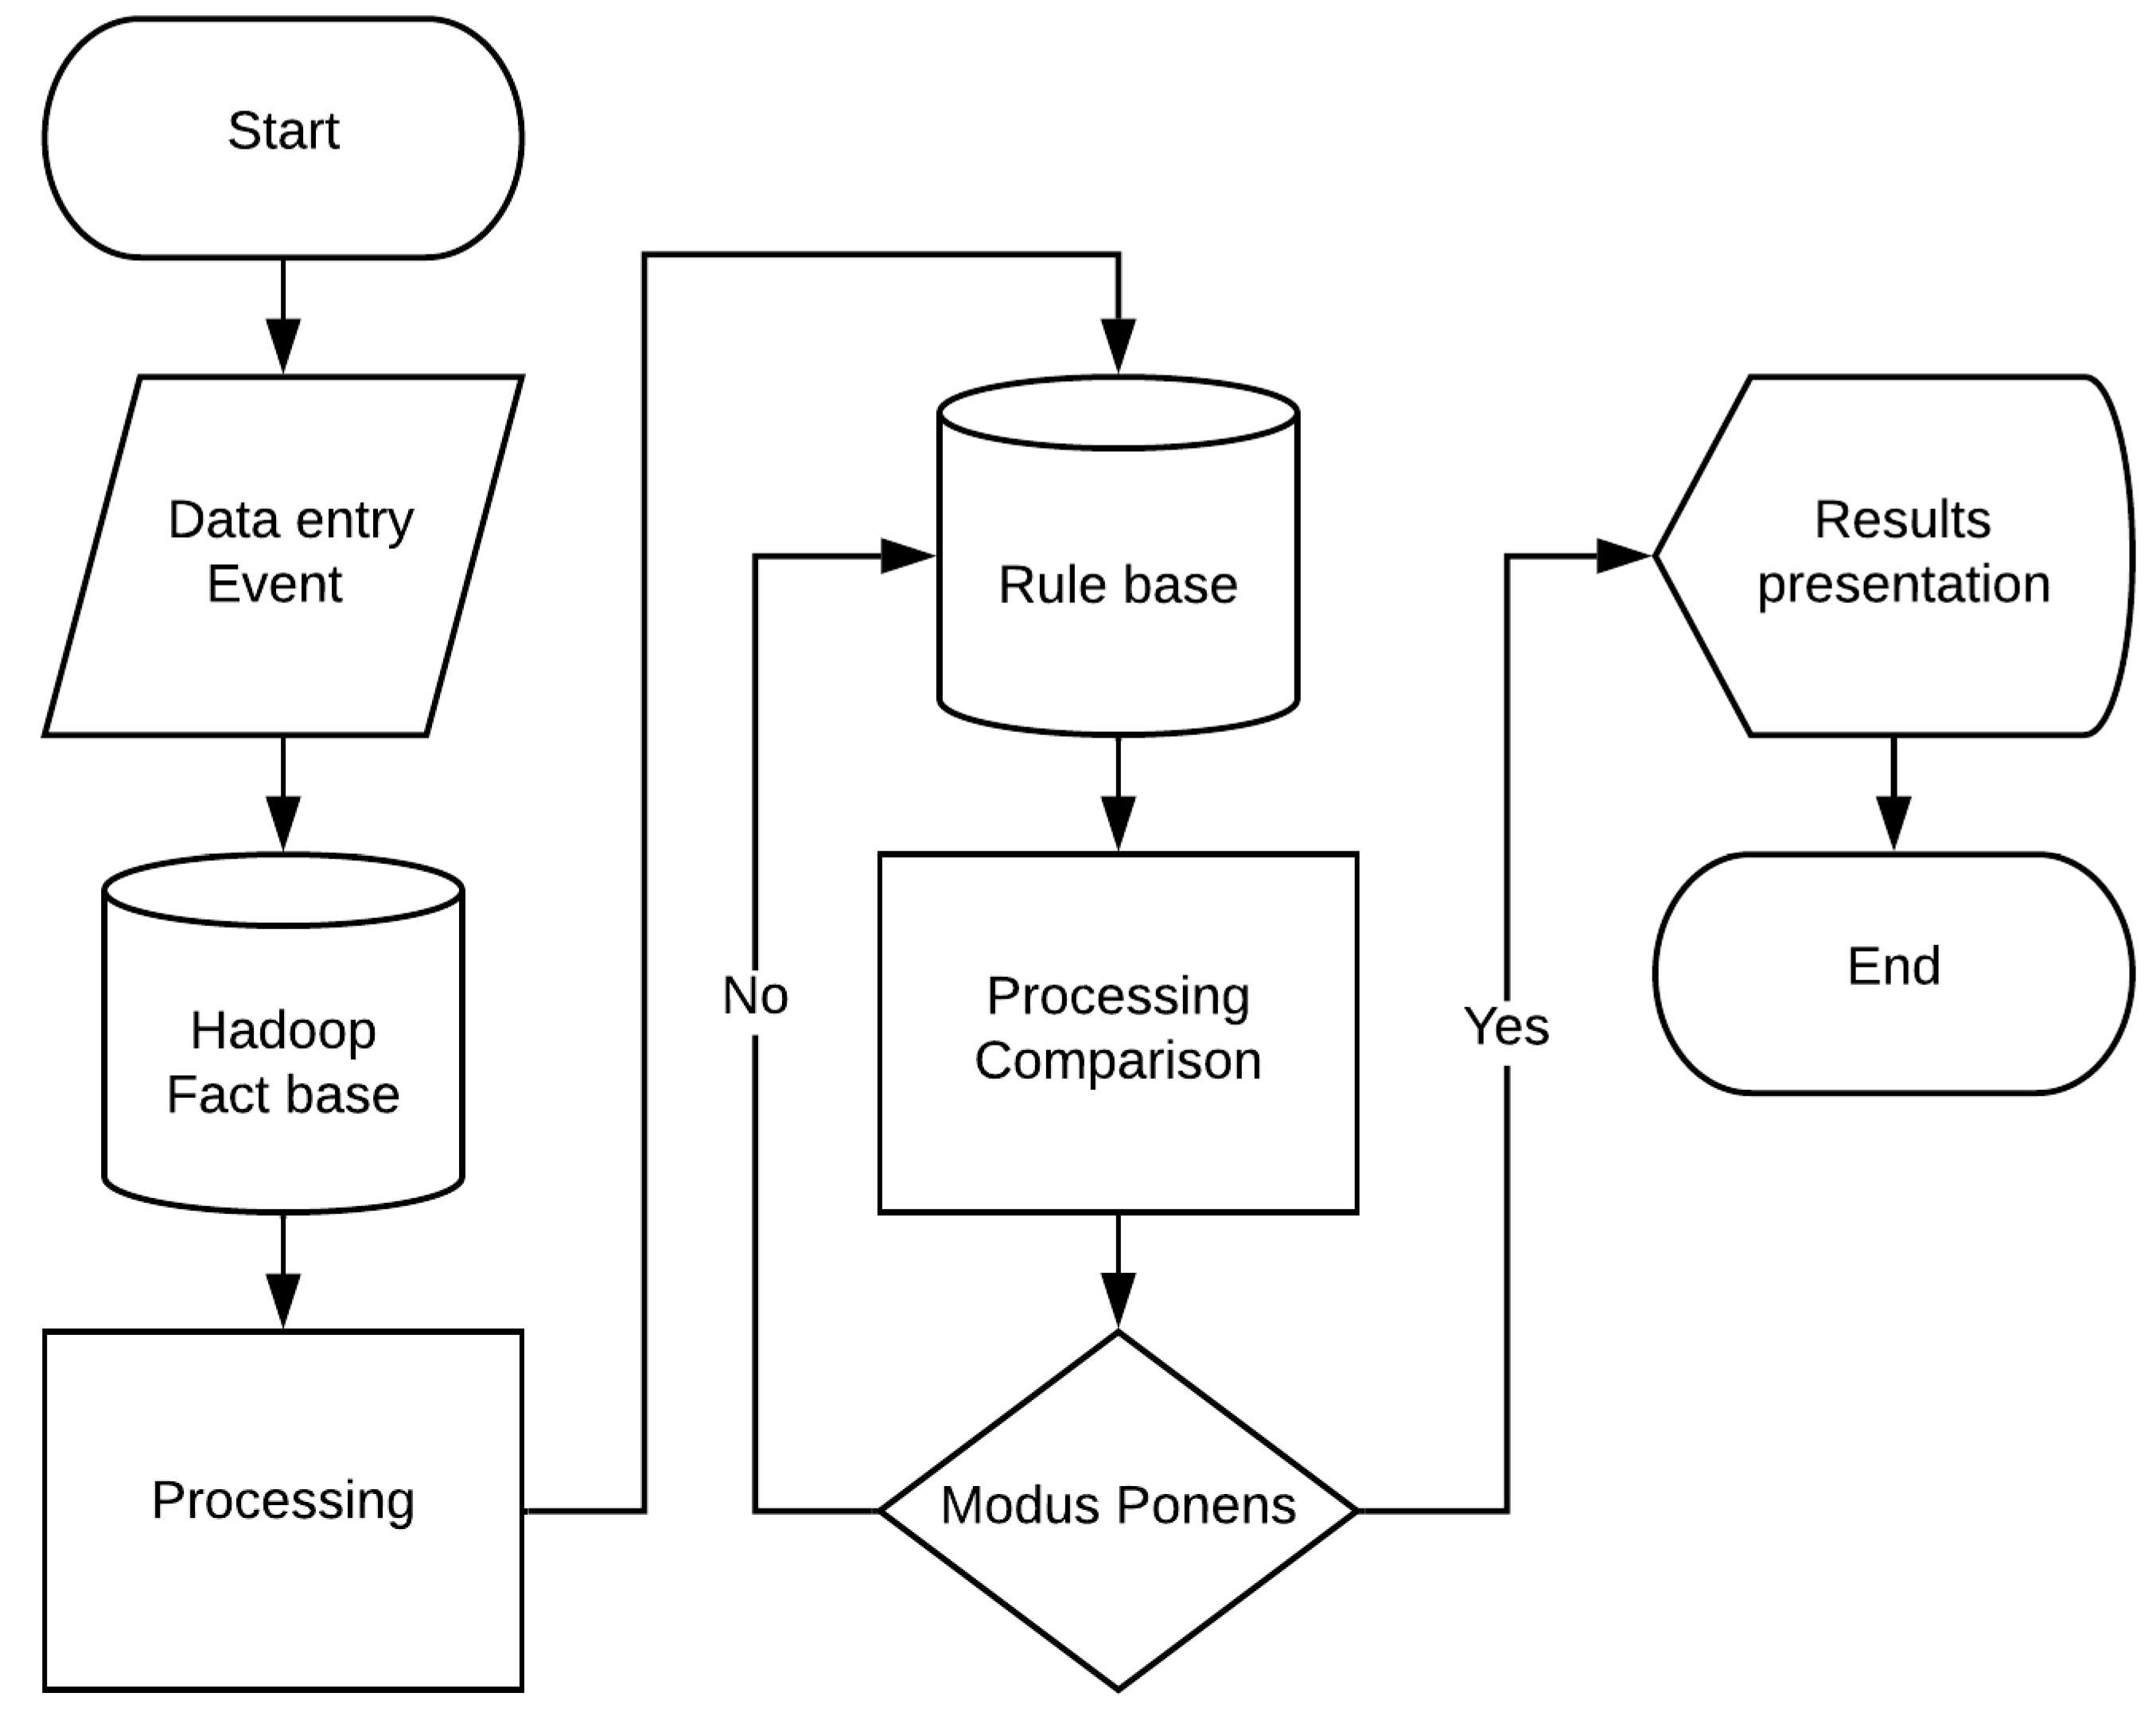
Next, the expert system takes the knowledge obtained by the data analysis framework and begins its processing to recommend improvements or activities. In Figure 8, the block diagram representing each stage of its processing is presented. The system starts with an event that is generated when the student logs into the LMS. The system reviews the students’ performance; in the case of the six students analyzed, it finds that there are learning anomalies by not achieving an average equal to or greater than 6 points. Identified, the student takes the data of her performance and processes them as a person does. In the data, find what is the deficiency of each student and in which of the activities you find a greater problem for their learning. In the process, the system compares the activities carried out by the student, the grades obtained and according to these compares with its base of rules to determine the activity meets these needs. The relationship by which he reaches a conclusion is as follows:
- Gets information from the fact base that is the results of the data analysis.
- Compare with your rule base, where it is concluded, that if a student demonstrates greater effectiveness in the development of practical activities and problems in the development of questionnaires. The system searches its knowledge base for activities that have this practical approach, such as project development, challenge activities, etc.
- If the student easily develops the questionnaires, it shows that conceptual knowledge is a means where the student′s knowledge can be exploited. Search the knowledge base for activities that meet this requirement and recommend the student to develop forums, discussion papers, concept maps, etc.
Once the processing has been determined and the activity to be recommended identified, the system presents the results to the student and the teacher. It processes this information and executes the action within the LMS. In addition, it sends notifications of the conclusion reached to the parts that interact in the learning. Once these occur, the system enters a waiting stage; this represents the time it takes the student to complete the activity and for it to be graded. Once these actions have been executed, the framework analyzes the data again and passes the information to the expert system where it is verified if there was an improvement in learning. If the student′s performance improves, the system takes this data and stores it in its knowledge base, which is useful for other cases with similar characteristics, and exits the process.
Table 4 presents the results of two students where the system is evaluated. The students included are those with identifiers 5 and 8, in the previous analysis it was determined that these students have greater facility for the development of questionnaire-type activities. The expert system recommended the replacement of activities that are 100% practical with activities where students feel more comfortable in their development. With this recommendation, the student was asked in the new period the development of the activities indicated in the table and in its detail. When comparing the results of these students with those of the previous period, the improvement is significant. It is even demonstrable that, if these changes were made on time, students would hardly miss a subject, and they guarantee learning. In addition, it should be noted that by including new activities such as forums, concept maps, as well as research reports, the student improves in the development of practical exercises. This is attributed to a better understanding and application of the conceptual part in a practical environment.
The recommendation of the activities is carried out by the system by the formation of groups, as it was done in the evaluated case. However, you can also do them individually by customizing the learning.
4. Discussion
Universities go through decisive moments, considering that education and the way it is run has changed. Well, the pandemic and ICT have shown that it can be carried out in remote environments. However, as in any organization, it is necessary to create scenarios where the application of technologies helps learning. In the case of universities, they have the advantage that they make use of many ICT tools, which improves the generation of data that can be processed in search of knowledge. From the results found in this work, we can emphasize certain key points, the first being the data analysis. Data analysis in universities is a common activity, but it is commonly applied to marketing management or financial decision-making. This work adopts a robust architecture in the analysis such as big data. The reason for this decision is due to the fact that education in the future will involve the use and integration of emerging technology. Many of these technologies present a great variety in the data, therefore, this work has been developed in such a way that it is scalable and adjusts to any situation generated in learning.
The next point is the recommendation system, in a remote education model it is common that there are several tasks where human management loses effectiveness. For this reason, AI through expert systems or recommendation systems are key to address the tasks where the efficiency and effectiveness of the systems is needed. According to the results, it has been determined that both the data analysis and the AI are efficient. However, it should be noted that being in a testing stage there are variables that were not considered. This does not mean that they were omitted from the analysis, it was simply established a controllable environment that can be conveyed in this document. Furthermore, the questions posed did not include a major inconvenience in data processing. Which is presented as an excellent projection in the use of Hadoop. With the data obtained and passed to the factual base of the expert system, it is possible to create a number of possible events that the expert can store in the knowledge base, speeding up the recommendation of activities.
The expert system has been designed as its own application aligned to the needs of the university. This guarantees that if there is a granular analysis, the system can provide feedback that allows its processing to be adjusted to the point of personalizing the recommendation of activities that is currently carried out through groups. The identification and classification of individuals in each group is carried out by the Hadoop framework. If in a very short time it is necessary to include a real-time analysis, the analysis architecture can integrate Apache Spark into the processing.
Several works focus on performing an analysis of educational data to identify the factors that influence the academic performance of students. However, it is necessary to consider that, in a comprehensive solution, the objective is to make decisions about the results obtained from the data analysis. Our proposal aims to improve learning and with it the educational model, for which a model of recommendation of academic activities is integrated into the data analysis. This model uses artificial intelligence to generate knowledge about the data obtained by having tools, such as big data, which are responsible for identifying patterns in student data and classifying them. Artificial intelligence identifies the academic deficiencies of each student and is able to recommend activities focused on students′ needs. Other works focus on the use of intelligent techniques that, through the use of statistical algorithms, identify the percentage of incidence of each factor in learning. These models, although they are effective, are not capable of handling large volumes of data, therefore, they are temporary solutions. Universities need to create scalable infrastructures that guarantee the operation of academic models in the short and long term. By integrating big data and artificial intelligence, a robust architecture is generated with the ability to work in various academic areas, improving the educational model and providing the scalability that is needed to create new educational projects.
With the results obtained from the evaluation of the proposed system, it is possible to highlight the ability to create an educational model based on the projections of each student and the detection of their weaknesses. To make adequate and effective decisions, however, it is necessary to emphasize that implementing a model such as the one proposed requires a consistent testing period, which can lead to a disadvantage. Since, at present and with the validity of the new normality, rapid and agile responses are required that provide solutions to the problems that universities are already facing.
5. Conclusions
The current situation in which society finds itself due to COVID-19 has changed the way in which it develops. The confinement to which society is subjected has forced the different sectors and areas to seek solutions based on the use of ICT to guarantee the continuity of their businesses or activities [49]. Universities as well as other organizations have introduced new tools to their activities to continue with education. The tools that have been integrated in most cases are video conferencing platforms. However, the integration of these tools solved the problems that arose at the beginning of the pandemic. The main problem being the development of face-to-face classes which, in the traditional educational modality, is the main activity for the development of education [50].
In the future, education will continue to evolve at the same speed as ICT, which is why all learning analytics work must focus on comprehensive solutions. This implies that data analysis will not be enough, systems that generate knowledge of the results of big data must necessarily be integrated. Adding value to data, although it has been a people-centered task, needs more speed and effectiveness. Systems that include AI are ideal for this type of application where the ability to solve a problem effectively allows even academic follow-ups and ICT become the ideal assistants in the academic development of students.
The lack of effectiveness in learning is an issue that is reflected in the dropout rates, as well as in the low academic effectiveness that is measured by the number of graduates in the different cohorts. These problems are accentuated in a future where it is considered that education will not be the same again [51]. The integration with new technologies in the educational field will accentuate the proposal of mixed educational models, where learning necessarily focuses on the student and the university focuses its efforts on meeting the needs of the students, including in the execution of a personalized education.
The recommendation system, as well as the identification of the factors that affect academic performance, allow making decisions that contribute to the improvement of learning. The results obtained guarantee the scalability of the system, with which it is possible to add a greater volume of data [52]. The recommendation of activities allow to significantly improve the grades and the learning of the students [53]. These results undoubtedly make it possible to reduce the dropout and repetition rates that, due to the pandemic, have suffered a considerable increase in the implementation of a remote education model.
The integration of technologies in academic settings is another factor that is considered in this study and future works. Although this work includes big data and AI, there are technologies, such as the internet of things, blockchain, cloud computing, etc., that should be included in educational systems. The integration aims to improve all aspects and environments where an educational event takes place.
Author Contributions
W.V.-C. contributed to the following: the conception and design of the study, acquisition of data, analysis, and interpretation of data, drafting the article, and approval of the submitted version. The authors M.R.-C. and W.V.-C. contributed to the study by design, conception, interpretation of data, and critical revision. S.S.-V. made the following contributions to the study: analysis and interpretation of data, approval of the submitted version. All authors have read and agreed to the published version of the manuscript.
Funding
This research received no external funding.
Institutional Review Board Statement
Not Application. Our work includes the data found in the systems, but we do not perform human testing.
Informed Consent Statement
Not Application.
Data Availability Statement
The data presented in this study are available on request from the corresponding author.
Conflicts of Interest
The authors declare no conflict of interest.
References
- Daniel, S.J. Education and the COVID-19 Pandemic. Prospects 2020, 49, 91–96. [Google Scholar] [CrossRef] [Green Version]
- Hill, J.R.; Hannafin, M.J. Teaching and Learning in Digital Environments: The Resurgence of Resource-based Learning. Educ. Technol. Res. Dev. 2001, 49, 37–52. [Google Scholar] [CrossRef]
- Li, H.; Liu, S.M.; Yu, X.H.; Tang, S.L.; Tang, C.K. Coronavirus Disease 2019 (COVID-19): Current Status and Future Perspectives. Int. J. Antimicrob. Agents 2020, 55, 105951. [Google Scholar] [CrossRef]
- Cook, D.J.; Augusto, J.C.; Jakkula, V.R. Ambient Intelligence: Technologies, Applications, and Opportunities. In Proceedings of the 55th Annual Meeting ISSS, Hull, UK, 17–22 July 2017; pp. 399–404. [Google Scholar]
- Salmerón-Manzano, E.; Manzano-Agugliaro, F. The higher Education Sustainability through Virtual Laboratories: The Spanish University as Case of Study. Sustainability 2018, 10, 4040. [Google Scholar] [CrossRef] [Green Version]
- Hussein, M.A.A.; Al-Chalabi, H.K.M. Pedagogical Agents in an Adaptive E-learning System. SAR J. Sci. Res. 2020, 3, 24–30. [Google Scholar] [CrossRef] [Green Version]
- Almaiah, M.A.; Al-Khasawneh, A.; Althunibat, A. Exploring the Critical Challenges and Factors Influencing the E-learning System Usage during COVID-19 Pandemic. Educ. Inf. Technol. 2020, 25, 5261–5280. [Google Scholar] [CrossRef] [PubMed]
- Villegas-Ch, W.; Palacios-Pacheco, X.; Román-Cañizares, M. An Internet of Things Model for Improving Process Management on University Campus. Future Internet 2020, 12, 162. [Google Scholar] [CrossRef]
- Gorham, J.; Zakahi, W.R. A Comparison of Teacher and Student Perceptions of Immediacy and Learning: Monitoring Process and Product. Commun. Educ. 1990, 39, 354–368. [Google Scholar] [CrossRef]
- Villegas-Ch, W.; Palacios-Pacheco, X.; Luján-Mora, S. Artificial Intelligence as a Support Technique for University Learning. In Proceedings of the IEEE World Conference on Engineering Education (EDUNINE), Lima, Peru, 17–20 March 2019; pp. 1–6. [Google Scholar]
- Shukla, V.K.; Verma, A. Enhancing LMS Experience through AIML Base and Retrieval Base Chatbot using R Language. In Proceedings of the International Conference on Automation, Computational and Technology Management IEEE, London, UK, 24–25 April 2019; pp. 561–567. [Google Scholar]
- Zhang, T. The Internet of Things Promoting Higher Education Revolution. In Proceedings of the International Conference on Multimedia and Security, Nanjing, China, 2–4 November 2012; pp. 790–793. [Google Scholar]
- Watson, J. Blending Learning: The Convergence of Online and Face-to-Face Education. Anal. Chim. Acta 2006, 572, 113–120. [Google Scholar]
- Gowensmith, W.N.; Murrie, D.C.; Boccaccini, M.T. Face-to-face versus Threaded Discussions: The Role of Time and Higher-order Thinking. Law Hum. Behav. 2010, 7, 55–65. [Google Scholar]
- Picciano, A.G. The Evolution of Big Data and Learning Analytics in American Higher Education. J. Asynchronous Learn. Netw. 2012, 16, 9–20. [Google Scholar] [CrossRef] [Green Version]
- Beldarrain, Y. Distance Education Trends: Integrating New Technologies to Foster Student Interaction and Collaboration. Distance Educ. 2006, 27, 139–153. [Google Scholar] [CrossRef]
- Comendador, B.E.V.; Rabago, L.W.; Tanguilig, B.T. An Educational Model Based on Knowledge Discovery in Databases (KDD) to Predict Learner’s Behavior Using Classification Techniques. In Proceedings of the IEEE International Conference on Signal Processing, Communications and Computing, Hong Kong, China, 5–8 August 2016; pp. 1–6. [Google Scholar]
- Villegas-Ch, W.; Roman-Cañizares, M.; Jaramillo-Alcázar, A.; Palacios-Pacheco, X. Data Analysis as a Tool for the Application of Adaptive Learning in a University Environment. Appl. Sci. 2020, 10, 7016. [Google Scholar] [CrossRef]
- Yan, Y.; Huang, C.; Wang, Q.; Hu, B. Data Mining of Customer Choice Behavior in Internet of Things within Relationship Network. Int. J. Inf. Manag. 2020, 50, 566–574. [Google Scholar] [CrossRef]
- Chiang, R.H.L.; Goes, P.; Stohr, E.A. Business Intelligence and Analytics Education, and Program Development: A Unique Opportunity for the Information Systems Discipline. ACM Trans. Manag. Inf. Syst. 2012, 3, 1–13. [Google Scholar] [CrossRef]
- Villegas-Ch, W.; Luján-Mora, S. Análisis de las Herramientas de Minería de Datos para la Mejora del E-learning en Plataformas LMS. In TIC Actualizadas Para Una Nueva Docencia Universitaria; McGraw-Hill: New York, NY, USA, 2016; pp. 761–774. ISBN 9788448612658. [Google Scholar]
- Villegas-Ch, W.; Luján-Mora, S.; Buenaño-Fernandez, D.; Palacios-Pacheco, X. Big Data, the Next Step in the Evolution of Educational Data Analysis. In Proceedings of the Advances in Intelligent Systems and Computing, Libertad City, Ecuador, 10–12 January 2018; Springer: Cham, Switzerland, 2018; Volume 721, pp. 138–147. [Google Scholar]
- Hssina, B.; Bouikhalene, B.; Merbouha, A. Europe and MENA Cooperation Advances in Information and Communication Technologies; Rocha, A., Mohammed, S., Felgueiras, C., Eds.; Springer: Cham, Switzerland, 2017; Volume 520, ISBN 978-3-319-46567-8. [Google Scholar]
- Villegas-Ch, W.; Palacios-Pacheco, X.; Luján-Mora, S. Application of a Smart City Model to a Traditional University Campus with a Big Data Architecture: A Sustainable Smart Campus. Sustainability 2019, 11, 2857. [Google Scholar] [CrossRef] [Green Version]
- Villegas-Ch, W.; Palacios-Pacheco, X.; Ortiz-Garcés, I.; Luján-Mora, S. Management of Educative Data in University Students with the Use of Big Data Techniques; AISTI–Associação Ibérica de Sistemas e Tecnologias de Informação: Lousada, Portugal, 2019; pp. 227–238. [Google Scholar]
- Villegas-Ch, W.; Molina-Enriquez, J.; Chicaiza-Tamayo, C.; Ortiz-Garcés, I.; Luján-Mora, S. Application of a Big Data Framework for Data Monitoring on a Smart Campus. Sustainability 2019, 11, 5552. [Google Scholar] [CrossRef] [Green Version]
- Sultan Mahmud, M.; Zhexue Huang, J.; Salloum, S.; Emara, T.Z.; Sadatdiynov, K. A Survey of Data Partitioning and Sampling Methods to Support Big Data Analysis. Big Data Min. Anal. 2020, 3, 85–101. [Google Scholar] [CrossRef]
- Mazumdar, S.; Dhar, S. Hadoop as Big Data Operating System–The Emerging Approach for Managing Challenges of Enterprise Big Data Platform. In Proceedings of the 2015 IEEE First International Conference on Big Data Computing Service and Applications (BigDataService) IEEE, Redwood City, CA, USA, 30 March–2 April 2015; pp. 499–505. [Google Scholar]
- Diaconita, V.; Bologa, A.R.; Bologa, R. Hadoop Oriented Smart Cities Architecture. Sensors 2018, 18, 1181. [Google Scholar] [CrossRef] [Green Version]
- Borthakur, D. Apache Hadoop 2.6.0–HDFS Architecture. Available online: http://hadoop.apache.org/docs/r2.6.0/hadoop-project-dist/hadoop-hdfs/HdfsDesign.html (accessed on 15 February 2021).
- Saraladevi, B.; Pazhaniraja, N.; Paul, P.V.; Basha, M.S.S.; Dhavachelvan, P. Big Data and Hadoop–A Study in Security Perspective. Procedia Comput. Sci. 2015, 50, 596–601. [Google Scholar] [CrossRef] [Green Version]
- Ghazi, M.R.; Gangodkar, D. Hadoop, Mapreduce and HDFS: A Developers Perspective. Procedia Comput. Sci. 2015, 48, 45–50. [Google Scholar] [CrossRef] [Green Version]
- Shan, Y.; Yan, J.; Wang, Y.; Xu, N. FPMR: MapReduce Framework on FPGA A Case Study of RankBoost Acceleration. In Proceedings of the 18th Annual ACM/SIGDA International Symposium on Field Programmable Gate Arrays, Monterey, CA, USA, 21–23 February 2010; pp. 93–102. [Google Scholar]
- Bhandarkar, M. MapReduce Programming with Apache Hadoop. In Proceedings of the 2010 IEEE International Symposium on Parallel & Distributed Processing (IPDPS), Atlanta, GA, USA, 19–23 April 2010; p. 1. [Google Scholar]
- Patel, A.B.; Birla, M.; Nair, U. Addressing Big Data Problem Using Hadoop and Map Reduce. In Proceedings of the 3rd Nirma University International Conference on Engineering (NUiCONE 2012), Ahmedabad, Gujarat, India, 6–8 December 2012; pp. 6–8. [Google Scholar]
- Cohen, J.; Acharya, S. Towards a More Secure Apache Hadoop HDFS Infrastructure: Anatomy of a Targeted Advanced Persistent Threat Against HDFS and Analysis of Trusted Computing Based Countermeasures. In Proceedings of the Network and System Security, NSS 2013, Madrid, Spain, 3–4 June 2013; Lecture Notes in Computer Science. Springer: Berlin/Heidelberg, Germany, 2013; Volume 7873, pp. 735–741. [Google Scholar]
- Shvachko, K.; Kuang, H.; Radia, S.; Chansler, R. The Hadoop Distributed File System. In Proceedings of the IEEE 26th Symposium Mass Storage Systems and Technologies, Incline Village, NV, USA, 3–7 May 2010; pp. 1–10. [Google Scholar]
- Thusoo, A.; Sarma, J.; Jain, N. Hive: A Warehousing Solution Over a Map-reduce Framework. Proc. VLDB Endow. 2009, 2, 1626–1629. [Google Scholar] [CrossRef]
- Villegas-Ch, W.; Román-Cañizares, M.; Palacios-Pacheco, X. Improvement of an Online Education Model with the Integration of Machine Learning and Data Analysis in an LMS. Appl. Sci. 2020, 10, 5371. [Google Scholar] [CrossRef]
- Abdrabbah, S.B.; Ayachi, R.; Amor, N. Ben Social Activities Recommendation System for Students in Smart Campus. Smart Innov. Syst. Technol. 2015, 76, 461–470. [Google Scholar]
- Christozov, D. Business Analytics as a Tool to Transforming Information into an Informing System: The Case of the On-line Course Registration System. Inf. Sci. 2017, 20, 167–178. [Google Scholar]
- Villegas-Ch, W.; Luján-Mora, S. Analysis of Data Mining Techniques Applied to LMS for Personalized Education. In Proceedings of the IEEE World Engineering Education Conference (EDUNINE), Santos, Brazil, 19–22 March 2017; pp. 85–89. [Google Scholar]
- Chen, C. Personalized E-learning System with Self-regulated Learning Assisted Mechanisms for Promoting Learning Performance. Expert Syst. Appl. 2009, 36, 8816–8829. [Google Scholar] [CrossRef]
- Jeong, H.; Choi, C.; Song, Y. Expert Systems with Applications Personalized Learning Course Planner with E-learning DSS using user profile. Expert Syst. Appl. 2012, 39, 2567–2577. [Google Scholar] [CrossRef]
- Villegas-Ch, W.; Palacios-Pacheco, X.; Buenaño-Fernandez, D.; Luján-Mora, S. Comprehensive Learning System Based on the Analysis of Data and the Recommendation of Activities in a Distance Education Environment. Int. J. Eng. Educ. 2019, 35, 1316–1325. [Google Scholar]
- Rodriguez-Ascaso, A.; Boticario, J.G.; Finat, C.; Petrie, H. Setting Accessibility Preferences about Learning Objects Within Adaptive Elearning Systems: User Experience and Organizational Aspects. Expert Syst. 2017, 34, 1–12. [Google Scholar] [CrossRef]
- McHugh, J.; Cuddihy, P.E.; Williams, J.W.; Aggour, K.S.; Kumar, V.S.; Mulwad, V. Integrated Access to Big Data Polystores through a Knowledge-driven Framework. In Proceedings of the IEEE International Conference on Big Data (Big Data 2017), Boston, MA, USA, 11–14 December 2017; pp. 1494–1503. [Google Scholar]
- D’Adamo, I.; Falcone, P.M.; Ferella, F. A Socio-economic Analysis of Biomethane in the Transport Sector: The Case of Italy. Waste Manag. 2019, 95, 102–115. [Google Scholar] [CrossRef]
- Sidpra, J.; Gaier, C.; Reddy, N.; Kumar, N.; Mirsky, D.; Mankad, K. Sustaining Education in the Age of COVID-19: A Survey of Synchronous Web-based Platforms. Quant. Imaging Med. Surg. 2020, 10, 1422–1427. [Google Scholar] [CrossRef] [PubMed]
- Bahasoan, A.N.; Ayuandiani, W.; Mukhram, M. Aswar Rahmat Effectiveness of Online Learning in Pandemic Covid-19. Int. J. Sci. Technol. Manag. 2020, 1, 100–106. [Google Scholar] [CrossRef]
- Hernandez-Ortega, J.; Daza, R.; Morales, A.; Fierrez, J.; Ortega-Garcia, J. edBB: Biometrics and Behavior for Assessing Remote Education. arXiv 2019, arXiv:1912.04786. [Google Scholar]
- Sunasee, R. Challenges of Teaching Organic Chemistry during COVID-19 Pandemic at a Primarily Undergraduate Institution. J. Chem. Educ. 2020, 97, 3176–3181. [Google Scholar] [CrossRef]
- Ovsyanik, A.I.; Sidorenko, G.G.; Prasolov, V.I.; Aleksandrova, N.S.; Mashkin, N.A.; Pozdnyakova, I.R.; Makarova, E.V. Remote Education in Modern University: Potential Opportunities, Quality or Availability? Int. J. Psychosoc. Rehabil. 2020, 24, 5027–5034. [Google Scholar] [CrossRef]
Figure 1.
Data analysis architecture in a big data environment.

Figure 2.
Hadoop Distributed File System architecture for data storage.

Figure 3.
MapReduce components and how they work.

Figure 4.
Block diagram of the operation of the data analysis framework.

Figure 5.
Components of the architecture of an expert system used for the recommendation of activities.
Figure 5.
Components of the architecture of an expert system used for the recommendation of activities.

Figure 6.
Functioning of a model based on modus ponens rules.

Figure 7.
Student performance according to the evaluated activities.

Figure 8.
Block diagram, rule-based recommender system operation.


Table 1.
Ratings results vs. time of dedication and financial problems for the payment of tuition.
| Student | Qualifications | Dedication Time | Tuition Payments |
|---|---|---|---|
| 1 | 9 | 38 | 0.00 |
| 2 | 6 | 37 | 0.25 |
| 3 | 9 | 40 | 0.00 |
| 4 | 10 | 41 | 0.00 |
| 5 | 4 | 15 | 0.50 |
| 6 | 7 | 36 | 0.50 |
| 7 | 10 | 42 | 0.75 |
| 8 | 3 | 25 | 0.75 |
| 9 | 10 | 40 | 0.00 |
| 10 | 1 | 24 | 1.00 |
| 11 | 9 | 40 | 0.50 |
| 12 | 8 | 42 | 0.50 |
| 13 | 5 | 21 | 0.25 |
| 14 | 2 | 26 | 1.00 |
| 15 | 6 | 33 | 0.25 |
| 16 | 7 | 17 | 0.75 |
| 17 | 6 | 33 | 0.25 |
| 18 | 2 | 30 | 1.00 |
Table 2.
Students who failed the subject of Programming I, identification of the causes of their low performance.
Table 2.
Students who failed the subject of Programming I, identification of the causes of their low performance.
| Student | Qualifications | Dedication Time | Tuition Payments |
|---|---|---|---|
| 5 | 4 | 15 | 0.50 |
| 8 | 3 | 25 | 0.75 |
| 10 | 1 | 24 | 1.00 |
| 13 | 5 | 21 | 0.25 |
| 14 | 2 | 26 | 1.00 |
| 18 | 2 | 30 | 1.00 |
Table 3.
Detail of the performance of the students in each activity during the class period.
| Student | Autonomous Activities | Questionnaires | Exams | Final Total | ||||||||
|---|---|---|---|---|---|---|---|---|---|---|---|---|
| 1 | 2 | 3 | Total | 1 | 2 | 3 | Total | Prac | Theor | Total | ||
| 5 | 1 | 1.25 | 0.5 | 0.9 | 1 | 1.5 | 2 | 1.5 | 0.6 | 1 | 1.6 | 4 |
| 8 | 1 | 0.5 | 0 | 0.5 | 2.5 | 2 | 1 | 1.8 | 0.2 | 0.5 | 0.7 | 3 |
| 10 | 0.75 | 0.5 | 0.2 | 0.5 | 0.1 | 0.2 | 0.1 | 0.1 | 0.4 | 0 | 0.4 | 1 |
| 13 | 2.5 | 1.5 | 2 | 2.0 | 0.1 | 0.6 | 0.5 | 0.4 | 2.3 | 0.5 | 2.8 | 5 |
| 14 | 1 | 0.8 | 0.3 | 0.7 | 0.3 | 0 | 0 | 0.1 | 0.5 | 1 | 1.5 | 2 |
| 18 | 2.5 | 1 | 1 | 1.5 | 0 | 1 | 0 | 0.3 | 0.5 | 0.1 | 0.6 | 2 |
Table 4.
Qualifications of the students who presented major problems in the development of practical activities, after the system will recommend activities aligned to their needs.
Table 4.
Qualifications of the students who presented major problems in the development of practical activities, after the system will recommend activities aligned to their needs.
| Student | Autonomous Activities | Control Activities | Exams | Final Total | ||||||||
|---|---|---|---|---|---|---|---|---|---|---|---|---|
| 1 | 2 | 3 | Total | 1 | 2 | 3 | Total | Prac | Theor | Total | ||
| 5 | 1.5 | 2.5 | 2 | 2.0 | 2.2 | 1.8 | 2.1 | 2.0 | 1.1 | 2 | 3.1 | 7 |
| 8 | 0.9 | 2.5 | 2.5 | 2.0 | 2 | 2.2 | 1.5 | 1.9 | 1.5 | 2.3 | 3.8 | 8 |
Autonomous Activities: 1: Practical activity; 2: Discussion forum; 3: Conceptual map. Control activities: 1: Investigation reports; 2: Control questionnaire 1; 3: Control questionnaire 2.
Publisher’s Note: MDPI stays neutral with regard to jurisdictional claims in published maps and institutional affiliations. |
© 2021 by the authors. Licensee MDPI, Basel, Switzerland. This article is an open access article distributed under the terms and conditions of the Creative Commons Attribution (CC BY) license (https://creativecommons.org/licenses/by/4.0/).
Share and Cite
MDPI and ACS Style
Villegas-Ch., W.; Sánchez-Viteri, S.; Román-Cañizares, M. Academic Activities Recommendation System for Sustainable Education in the Age of COVID-19. Informatics 2021, 8, 29. https://0-doi-org.brum.beds.ac.uk/10.3390/informatics8020029
AMA Style
Villegas-Ch. W, Sánchez-Viteri S, Román-Cañizares M. Academic Activities Recommendation System for Sustainable Education in the Age of COVID-19. Informatics. 2021; 8(2):29. https://0-doi-org.brum.beds.ac.uk/10.3390/informatics8020029
Chicago/Turabian StyleVillegas-Ch., William, Santiago Sánchez-Viteri, and Milton Román-Cañizares. 2021. "Academic Activities Recommendation System for Sustainable Education in the Age of COVID-19" Informatics 8, no. 2: 29. https://0-doi-org.brum.beds.ac.uk/10.3390/informatics8020029
Note that from the first issue of 2016, this journal uses article numbers instead of page numbers. See further details here.