1. Introduction
Adobe masonry is one of the oldest building techniques and is found in all continents in traditional dwellings, historic landmarks and new construction. Traditional adobe provides advantages compared to construction with modern materials (e.g., concrete, wood), such as the use of locally available materials (soils, straw, water), local brick manufacturing, ease of construction and relatively low cost. In addition, adobe masonry has thermal and sound insulation properties [
1,
2,
3,
4,
5] that attract many homeowners who may not afford the luxury of installing cooling/heating systems in their homes or are interested in the sustainable aspects of earthen construction. In general, the economic advantage and traditions are highly influential in the adoption of adobe as a construction material throughout the world, especially in rural and remote areas [
6,
7,
8].
Significant adobe construction is found in regions prone to earthquakes. Unreinforced adobe masonry structures have been damaged or have collapsed during earthquakes with considerable life and material losses due to their large mass and low tensile strength [
9,
10,
11,
12,
13,
14,
15]. Compared to other building types, adobe masonry has a lower value of strength-to-weight ratio [
15]. In addition to its low tensile strength, adobe is affected by the moisture that penetrates from the ground or through the plaster into the walls [
16]. Even though several studies have investigated the lateral load resistance behaviour of adobe walls or systems (e.g., [
15,
17,
18,
19,
20]), these did not explicitly consider the detrimental effects of higher water contents that may exist within the adobe walls. Experimental testing has shown that the water content of the adobe soil at mixing and at testing has important effects on the tensile and compressive strengths of adobe units [
21,
22,
23]. For example, the compressive strength of unstabilized adobe bricks was approximately 51–57% lower when the water content at mixing was increased from 15.83% to 20.94% [
14]. Numerical modelling has also shown that the in-plane (lateral) strength of adobe masonry walls can decrease considerably when there is a moist region immediately above the footing and that the reduction in lateral force resistance is a function of the length of the wet region and the water content of the material [
24]. For an I-shaped adobe wall with a 30 cm-high wet region (13–15% water content) immediately above the footing, the ability to carry lateral force decreased to about 60% of the lateral strength of a comparable dry wall (1–3% water content) [
24].
This paper describes the materials, methods, wall models, test setup and instrumentation, and results of in-plane lateral load tests conducted on two quarter-scale adobe masonry walls to experimentally investigate the strength behaviour and failure mechanisms of adobe walls with different water content. One of the walls was tested at air-dry condition (Wall 1) and the second wall was tested with a higher water content along the bottom part (Wall 2) to investigate the effect of extreme monotonic lateral loading when there is a wet region near or at the wall-footing interface. Understanding monotonic lateral loading will lead to a better understanding of the wall behaviour and allow for future work to incorporate the testing of adobe walls under reverse cyclic loading or shake table testing.
2. Materials and Methods
2.1. Adobe Materials and Brick Making
More than 560 bricks were made for the construction of each of the adobe masonry walls and their footings. The adobe material was composed of natural soil and poorly graded sand in a ratio of 25 to 9 (natural soil to sand) by mass. The resulting adobe mixture contained 54% sand-size, 33% silt-size, and 13% clay-size particles [
23]. The natural soil was thoroughly mixed with tap water (21% water content) and kept in covered buckets for 12 to 24 h to help break down and soften the clumps of clay and facilitate the mixing. The following day, the wet natural soil and sand were hand-mixed with a hoe in a wheelbarrow with additional water and cut straw to reach a mixing water content of 21% by mass for workability [
22]. The approximated ratio of straw to sand was 0.12 to 9 by mass [
23]. The material was manually compacted using a closed fist in wooden moulds to form the bricks. The bricks were carefully removed from the moulds to preserve the brick shape and placed on a plywood board to ease handling. The bricks were air-dried outdoors and exposed daily to several hours of direct sunlight for at least a week [
22]. The average compressive strength of quarter-scale adobe bricks prepared with this adobe mixture was 4254 kPa (standard deviation SD = 453 kPa) when the bricks were tested with a water content of 1.88% (SD = 0.51%) [
22].
2.2. Wall Footing
The wall models included a footing made of adobe bricks embedded in soil inside a wooden frame. The soil around and below the adobe footing simulated the local ground and consisted of a mixture of natural soil and poorly graded sand with the same mass ratio used to make the bricks and a target water content at mixing of 19% (by mass) for workability [
22]. The soil mixture was placed and compacted by hand with a closed fist in an oversized wooden frame. The wooden frame was 213 cm long, 23 cm wide and 28 cm deep. These dimensions were selected based on experience from prior tests to be large enough for minimizing the effects of confining pressure during the lateral loading and, at the same time, be as small as possible for reducing the labour and material volume needed to fill it with soil.
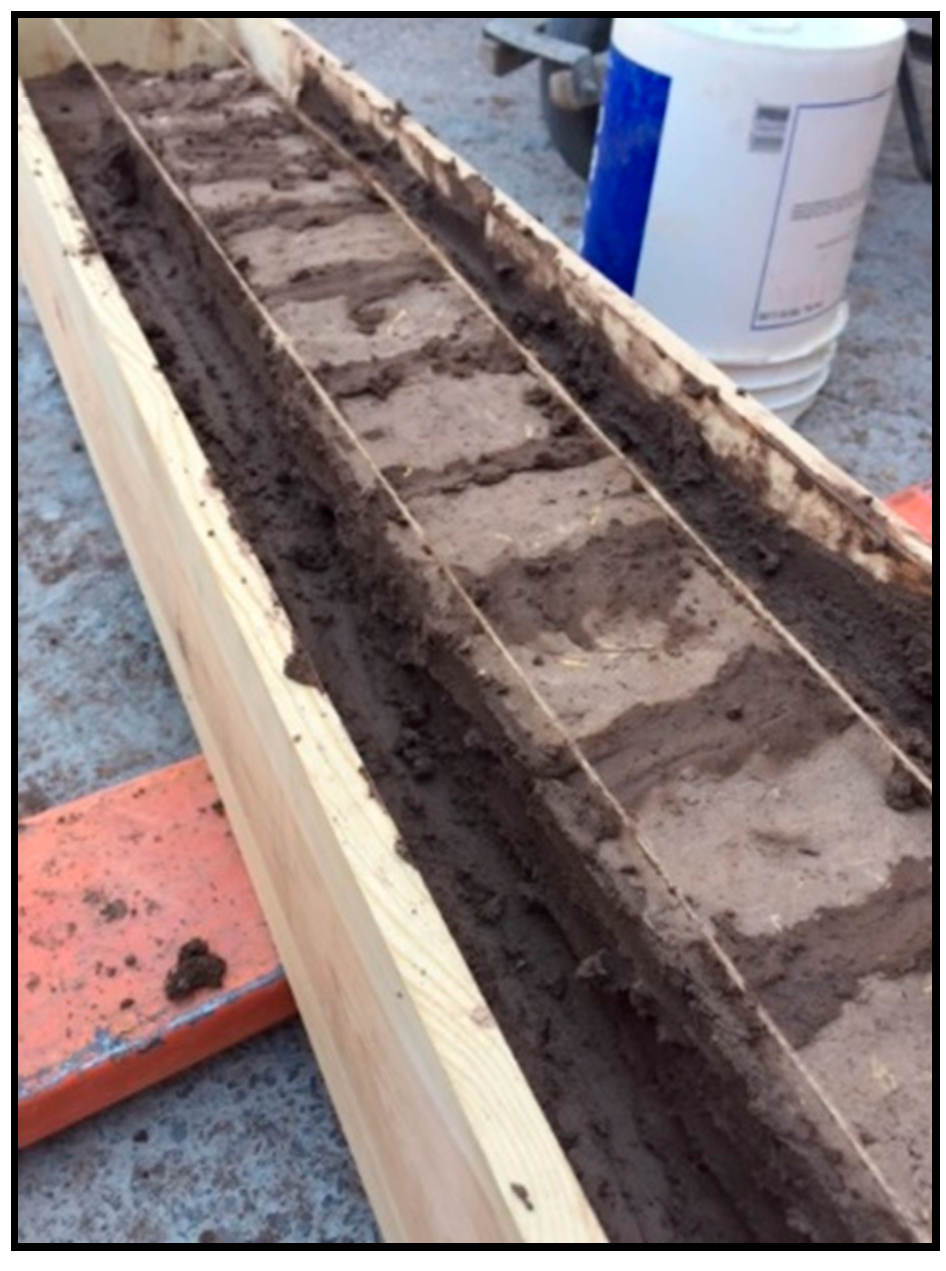
To represent traditional adobe construction of the southwestern region of the United States of America (USA), two courses of 16 adobe bricks measuring (length × width × thickness) 12.7 cm × 8.9 cm × 2.5 cm were placed in a running bond pattern to form the footing (see
Figure 1); the adobe soil mixture without straw was used as the mortar. Mortar joints in the footing measured approximately 1 cm between adobe bricks. Adobe bricks in the footing served as the connection to the wall. An adobe footing was used (instead of a concrete footing) because it is found in the traditional adobe construction and contributes to transporting moisture into the wall due to the capillary action. To prevent the sliding of the system during lateral loading, an anchor was placed in front of the foundation frame, consisting of four bolts going through two wooden members into a steel plate in the strong floor of the laboratory.
2.3. Wall Construction
Each scaled wall was 152 cm long, 76 cm high and 6 cm thick. These dimensions represent approximately the quarter scale of a typical residential adobe wall in the southwestern region of the USA. The mortar was made of the same adobe mixture without straw. The mortar was prepared with a water content of 21% (by mass), which is the upper bound of the 15–21% range recommended for workability for the soil used [
22]. Approximately 1-cm mortar joints were used between courses and bricks. The bricks were placed in running bond. Brick halves were used at the ends of the wall in alternate courses. After completion, the walls were built in stages to allow the bottom courses to partially dry before placing new courses to prevent out-of-plane deformation of the wall during construction. Up to eight courses were placed at a time in 24 h increments. The walls were air-dried in the laboratory for at least one week prior to testing because after this time the mortar appeared as dry as the bricks (by visual inspection).
A bond beam was used to prevent localized crushing failure at the point of application of the lateral load and simulate a roof diaphragm (see
Figure 2). For that, six holes (13 cm deep, 2 cm in diameter, spaced at 23 cm) were drilled on the top of the adobe wall and through an L-shaped wood bond beam of the same length as the wall. The L-shaped wood bond beam was positioned on top of the wall and fixed with six steel bars (15 cm long, 0.95 cm in diameter) placed inside the holes. The holes were then filled with a cement mortar with a maximum aggregate size of 2 cm to attach the wooden bond beam to the top of the adobe wall.
2.4. Instrumentation
The instrumentation consisted of two types of linear displacement transducers, a lateral load inducing hydraulic jack and pump combination, a load cell, a data acquisition system, and a test monitoring and data processing program. The instrumentation layout can be seen in
Figure 2. A single-direction hydraulic jack with 15.2 cm stroke and 300 kN capacity was used. A small, manually operated hydraulic pump was used to drive the piston at an approximately constant rate. The load cell was placed between the reaction column and the hydraulic jack. The wall deformations and displacements in the in-plane and out-of-plane directions were measured with seven string potentiometers (SP), also known as cable-extension transducers. Displacements along the vertical axis of the walls were measured with linear variable displacement transducers (LVDTs). The data from the instrumentation was recorded with a National Instruments data acquisition unit.
2.5. Test Setup
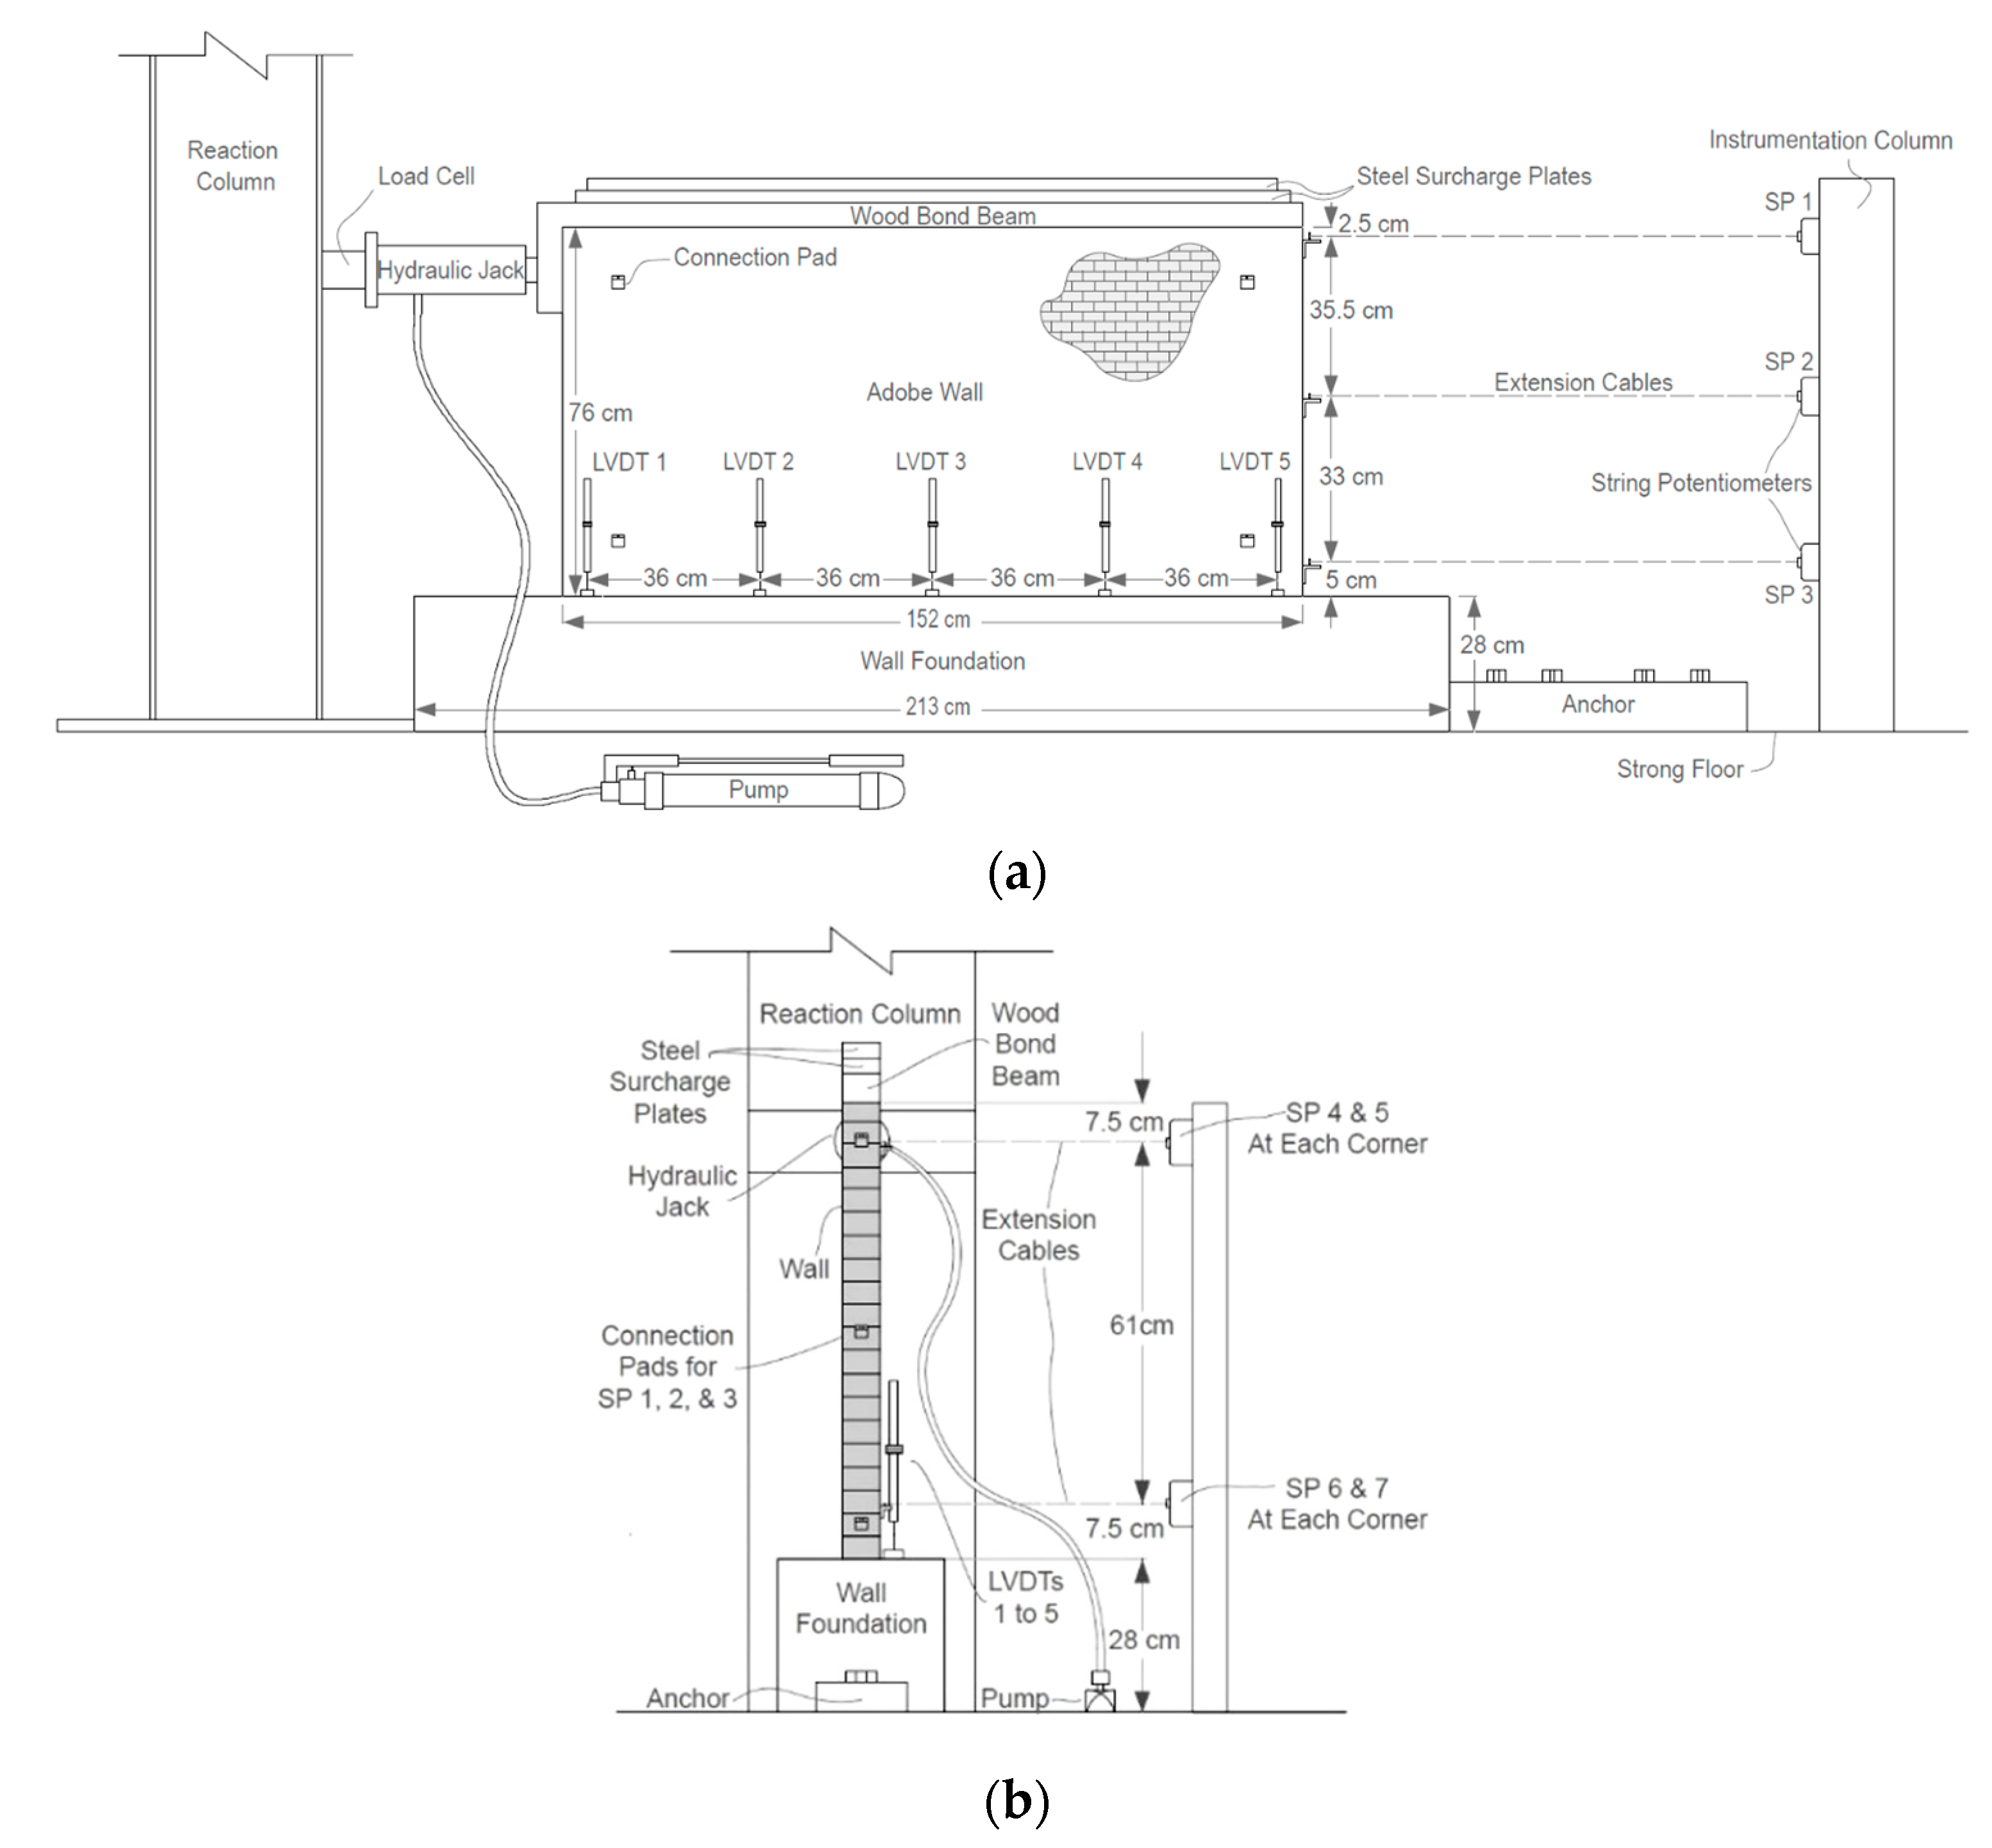
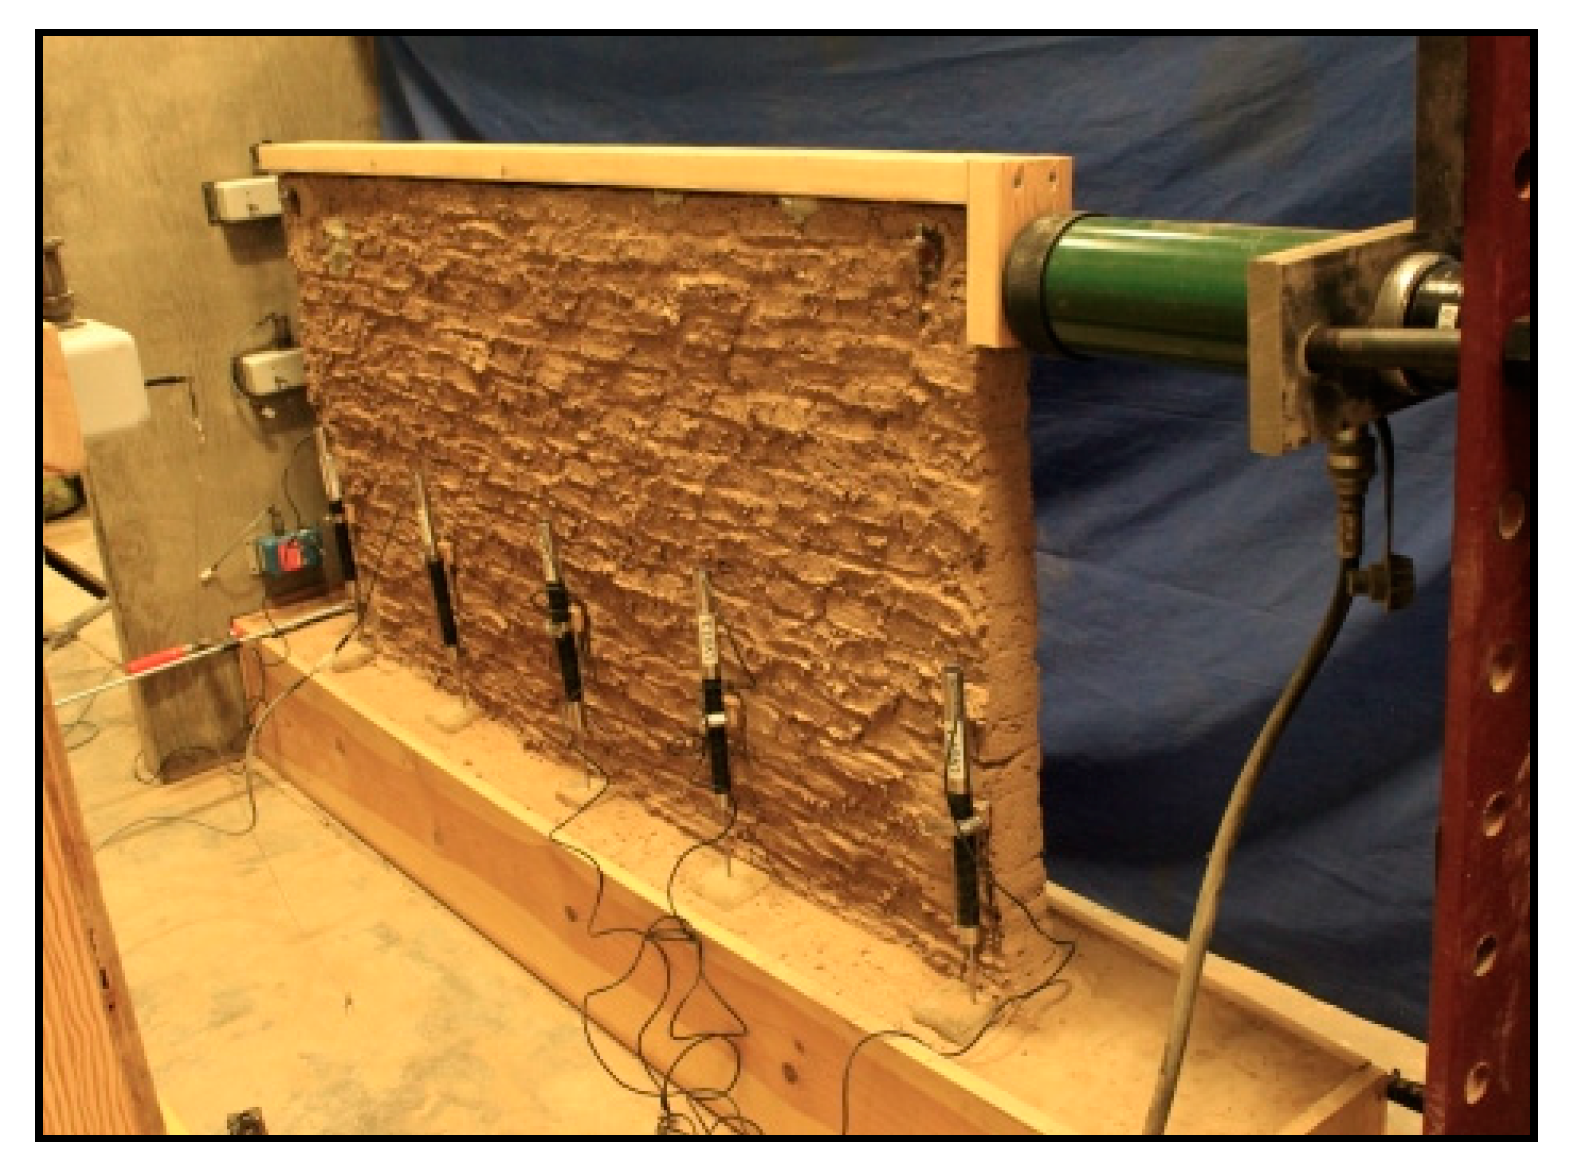
The test setup shown in
Figure 2 and
Figure 3 includes various measurement instruments, a reaction column, the adobe wall and foundation wood frame, the wood bond beam and steel surcharge plates, the connection and resting pads for sensor placement, and an instrumentation column. The L-shaped wood bond beam was used to transfer and distribute the lateral load from the hydraulic jack to the wall. Two steel plates (12.7 cm wide, 2.5 cm thick) were attached to the bond beam to represent a distributed roof load of 0.44 kN/m for the quarter-scale wall model. The tests were stopped when the wall resistance to lateral loading decreased significantly (i.e., failure).
For Wall 1, LVDT 1 and LVDT 5 were attached to the front face of the wall at 2.5 cm from the wall edges, and LVDT 3 was attached to the centre of the wall face (see
Figure 2a). LVDT 2 and LVDT 4 were attached in between LVDT 1 and LVDT 3, and LVDT 3 and LVDT 5, respectively. For Wall 2, LVDT 1 and LVDT 4 were attached to the front face of the wall at 2.5 cm from the wall edges; LVDT 2 and LVDT 3 were attached evenly spaced between LVDT 1 and LVDT 4. One of the LVDT sensors was damaged during the testing of Wall 1, and a replacement was not available for testing Wall 2; however, the loss of this instrumentation did not compromise the results of the test.
The LVDTs were secured to the wall with wooden connection pads epoxied to the adobe bricks. Three string potentiometers, measuring in-plane wall displacements, were secured to the instrumentation column about 91 cm from the edge of the wall; string potentiometer SP1 was placed 2.5 cm from the top of the wall; string potentiometer SP3 was placed 5 cm from the bottom of the wall; and string potentiometer SP2 was placed at mid-height of the wall. Extension cables were used to connect these devices to the wall. Four additional string potentiometers (SP4, SP5, SP6, and SP7) to measure the out-of-plane displacements were attached to a similar instrumentation column parallel to the wall and footing (along the wall horizontal axis), each one installed 7.5 cm from the wall edge at top and bottom of the wall, as shown in
Figure 2b.
2.6. Water Content
The ambient humidity in the laboratory was low (25–35%) during the testing period. The water content of the adobe bricks in the air-dry condition was approximately 2–2.5% (by mass) before constructing the wall models. One of the tests simulated moisture in the bottom part of the wall (Wall 2). To create the wet region in Wall 2, a predetermined amount of water was sprayed evenly along the bottom 10 cm on both sides of the wall. The wall was then completely covered with a plastic tarp with wet towels inside to keep a humid environment for at least 2 days to allow the moisture to penetrate the bricks and equilibrate before loading. Preliminary trials using quarter-scale bricks indicated that two days was sufficient time to allow moisture to penetrate the wall thickness in the scaled models. A 10 cm-high wet region in the quarter-scale wall represented a 40 cm-high wet region in a full-scale wall, which is within the range of capillary rise observed in adobe walls. After the loading tests, samples for water content measurements were taken at different locations along the top, middle, and bottom areas of the walls as well as the footing and foundation soil.
3. Results and Discussion
3.1. Wall 1
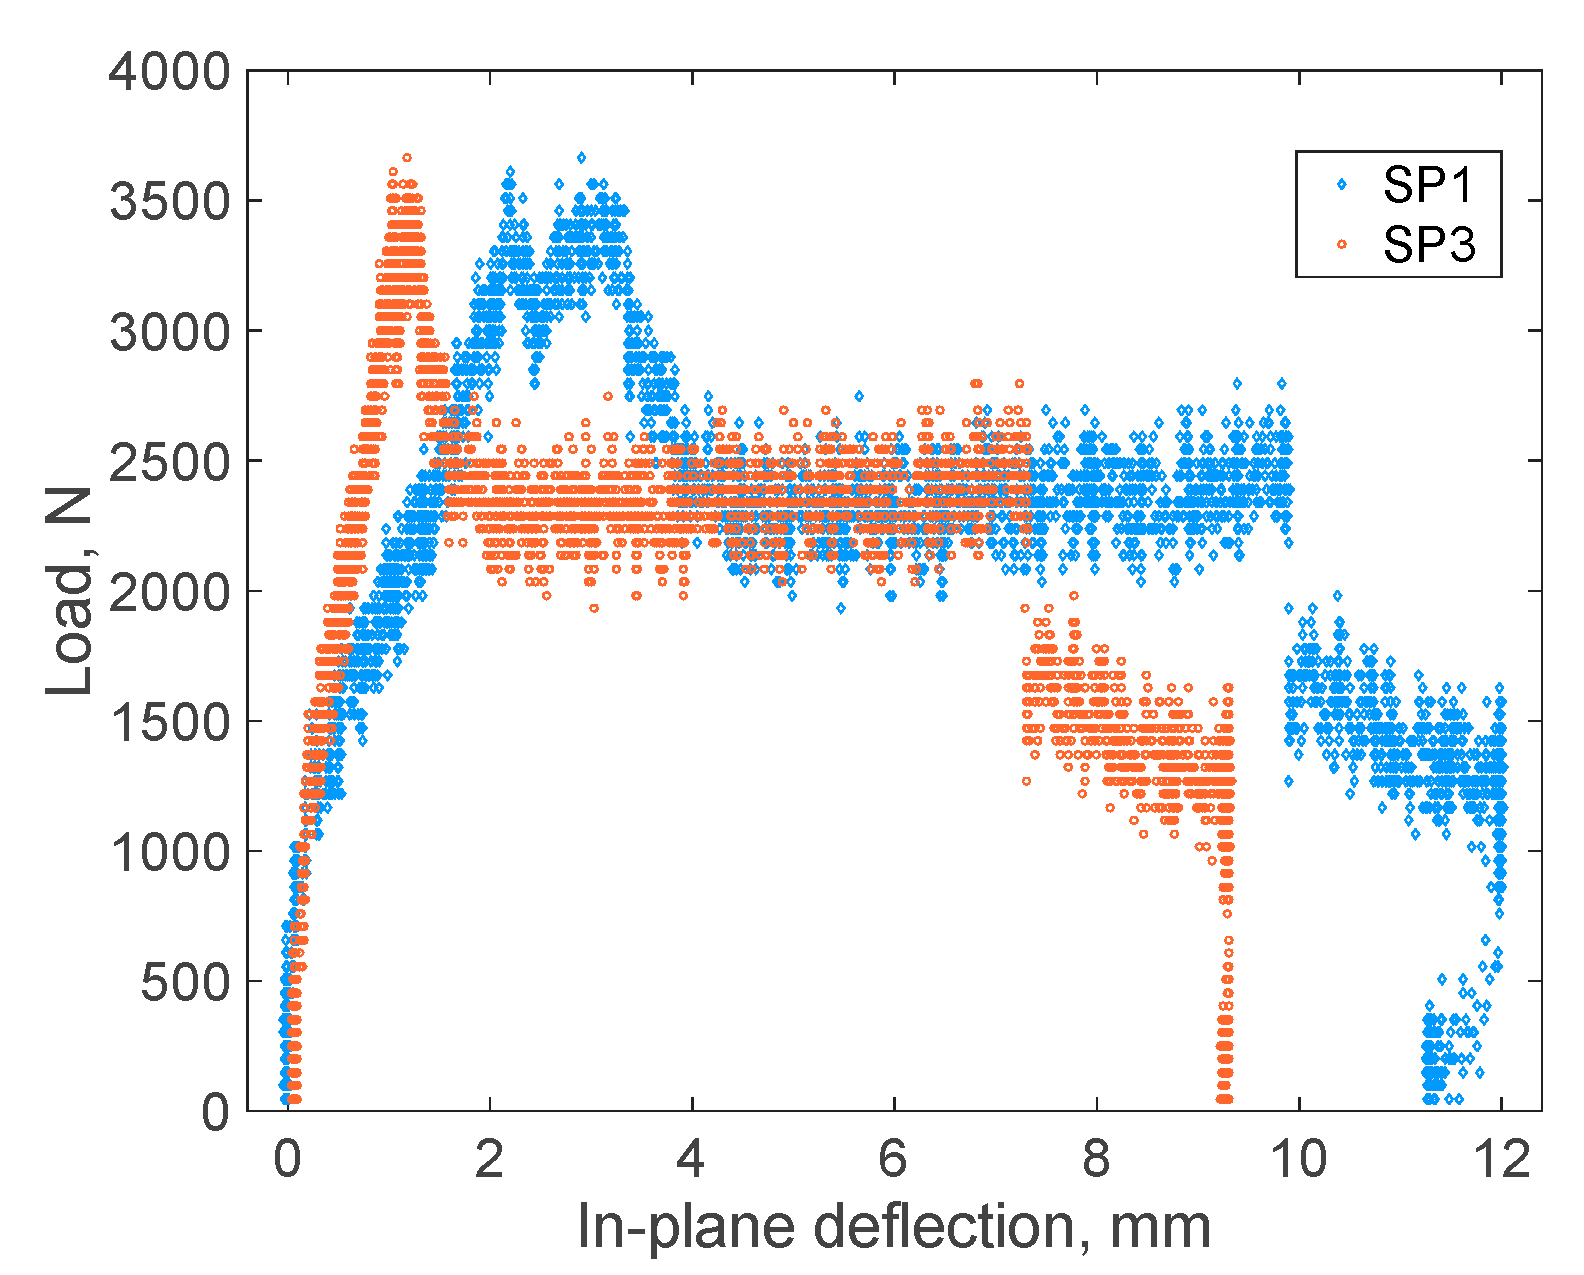
The average water contents at the top, middle and bottom areas of Wall 1 were 4.06%, 4.44% and 3.86%, respectively, and in the footing and foundation soil was 4.63%. In-plane deflections measured by SP1 and SP3 during loading are shown in
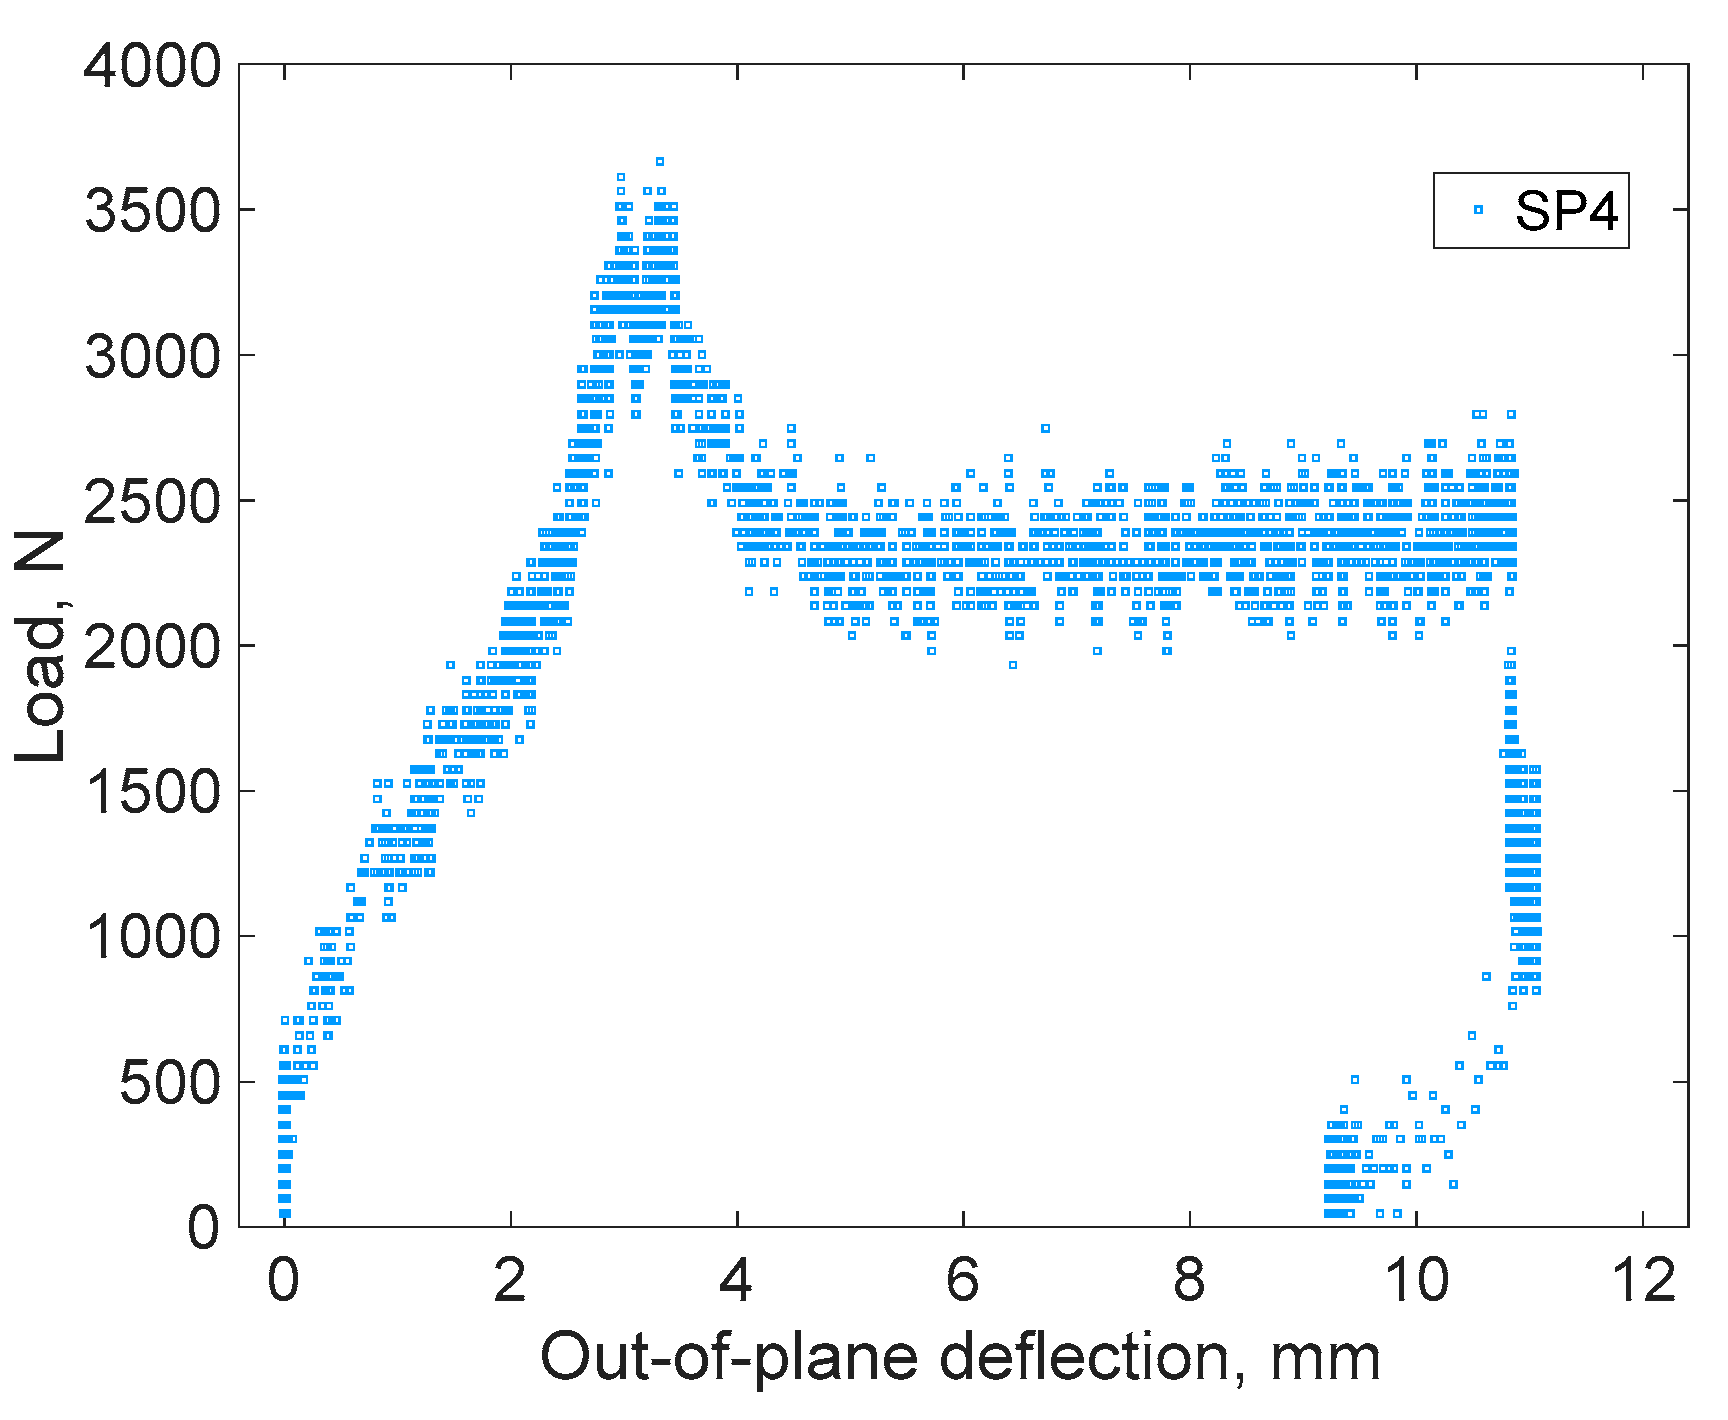
Figure 4. The maximum deflections of SP1 and SP3 were 12.0 mm and 9.3 mm, respectively. Initially, SP1 had a higher deflection than SP3 indicating that the wall was rocking. At a lateral load of approximately 3600 N, Wall 1 cracked and lost strength and stiffness. As loading continued, both SP1 and SP3 increased, indicating that the wall was rocking as well as sliding along the crack. Out-of-plane deflections were captured during the test by SP4, which measured a maximum displacement of 11 mm, as shown in
Figure 5. This indicates that Wall 1 was also tilting or twisting out-of-plane.
Wall 1 withstood a maximum load of about 3600 N (
Table 1) with minor deflections in-plane and out-of-plane at that load. At maximum load, SP1, SP3, and SP4 measured deflections of about 3.0 mm, 1.0 mm, and 3.0 mm, respectively. After reaching a load of 3600 N, Wall 1 lost approximately 38% of its capacity and the load dropped to about 2220 N due to cracking. As the test continued, the load slightly increased again due to friction resistance developed along the sliding plane resulting from the rough nature of the sliding surfaces. Eventually, Wall 1 failed completely at 2560 N as the crack along the mortar bonds continued to propagate and separate (see
Figure 6).
3.2. Wall 2
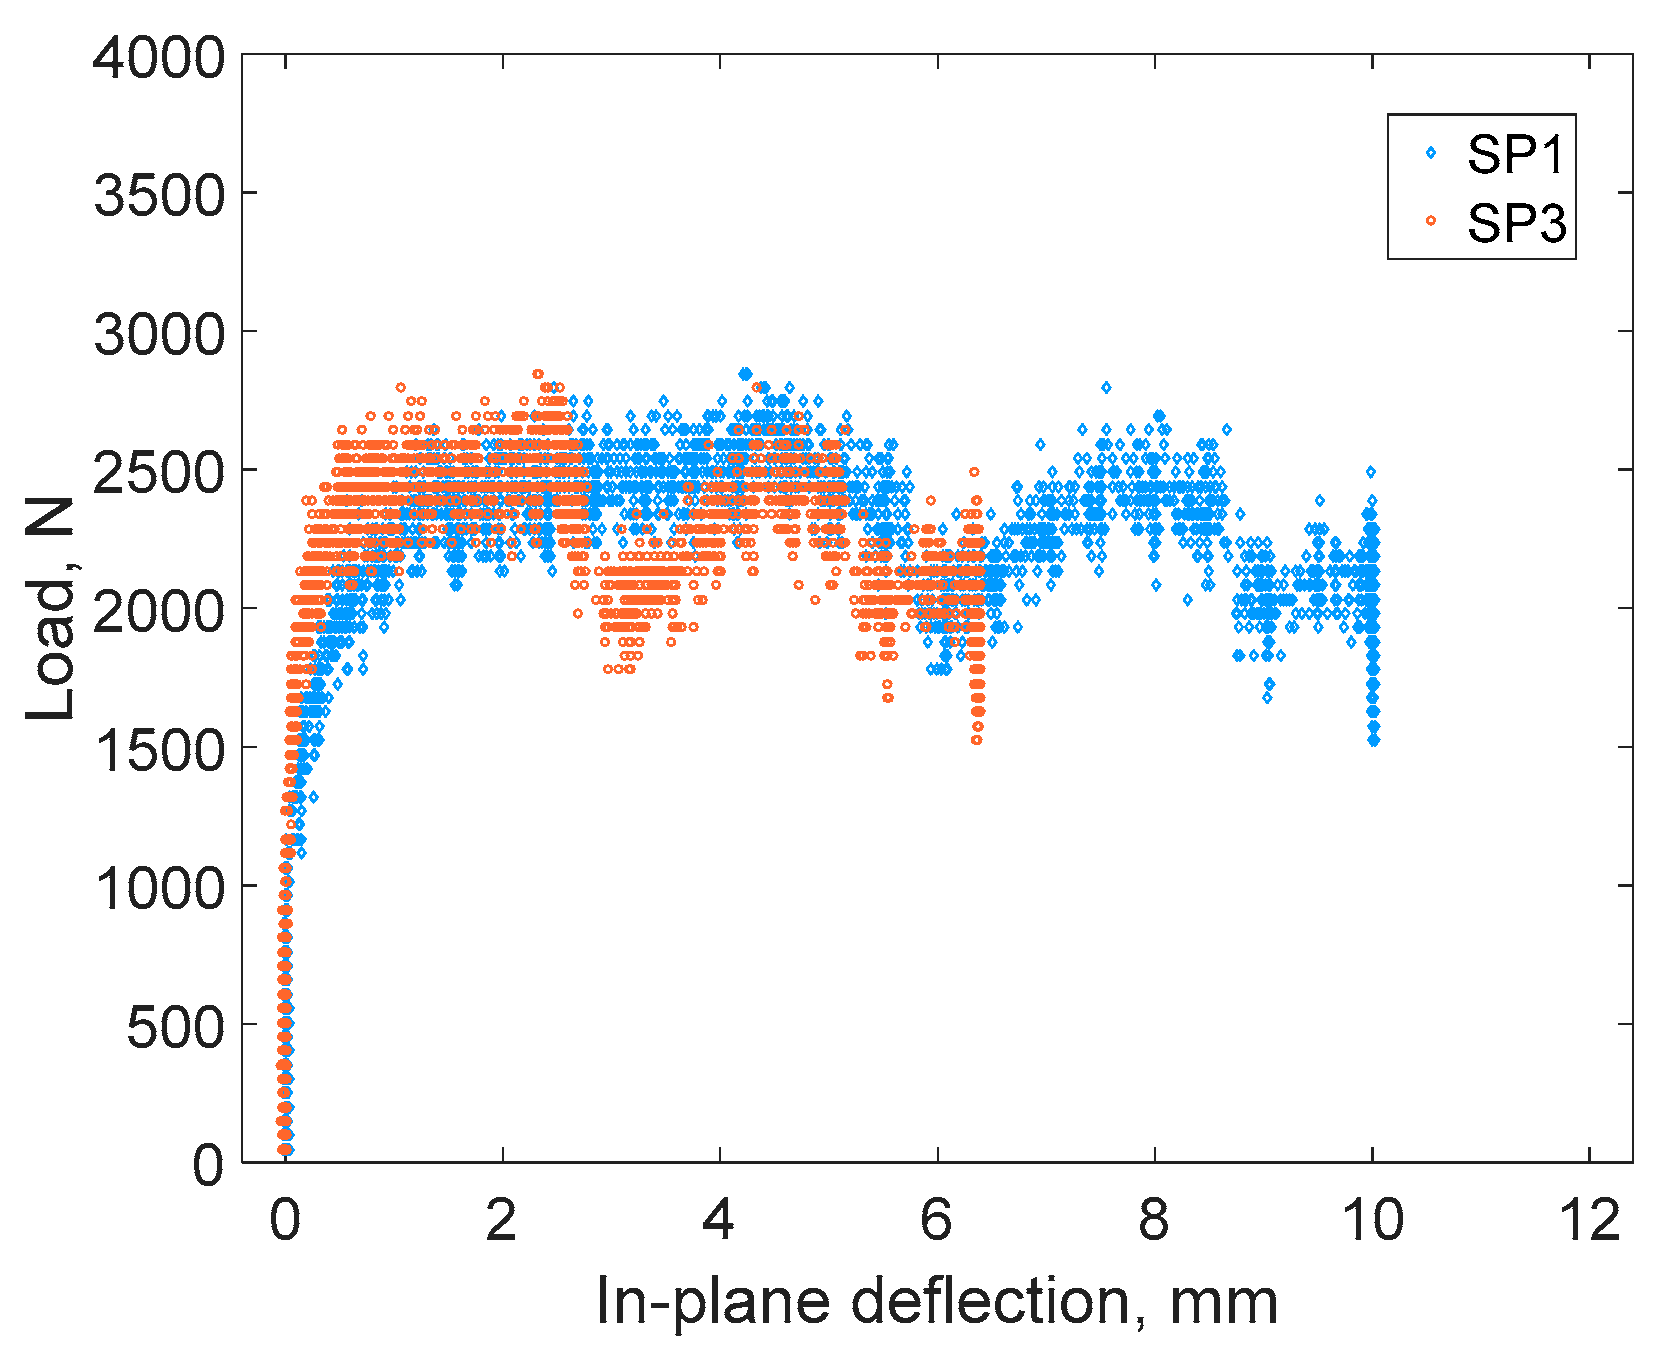
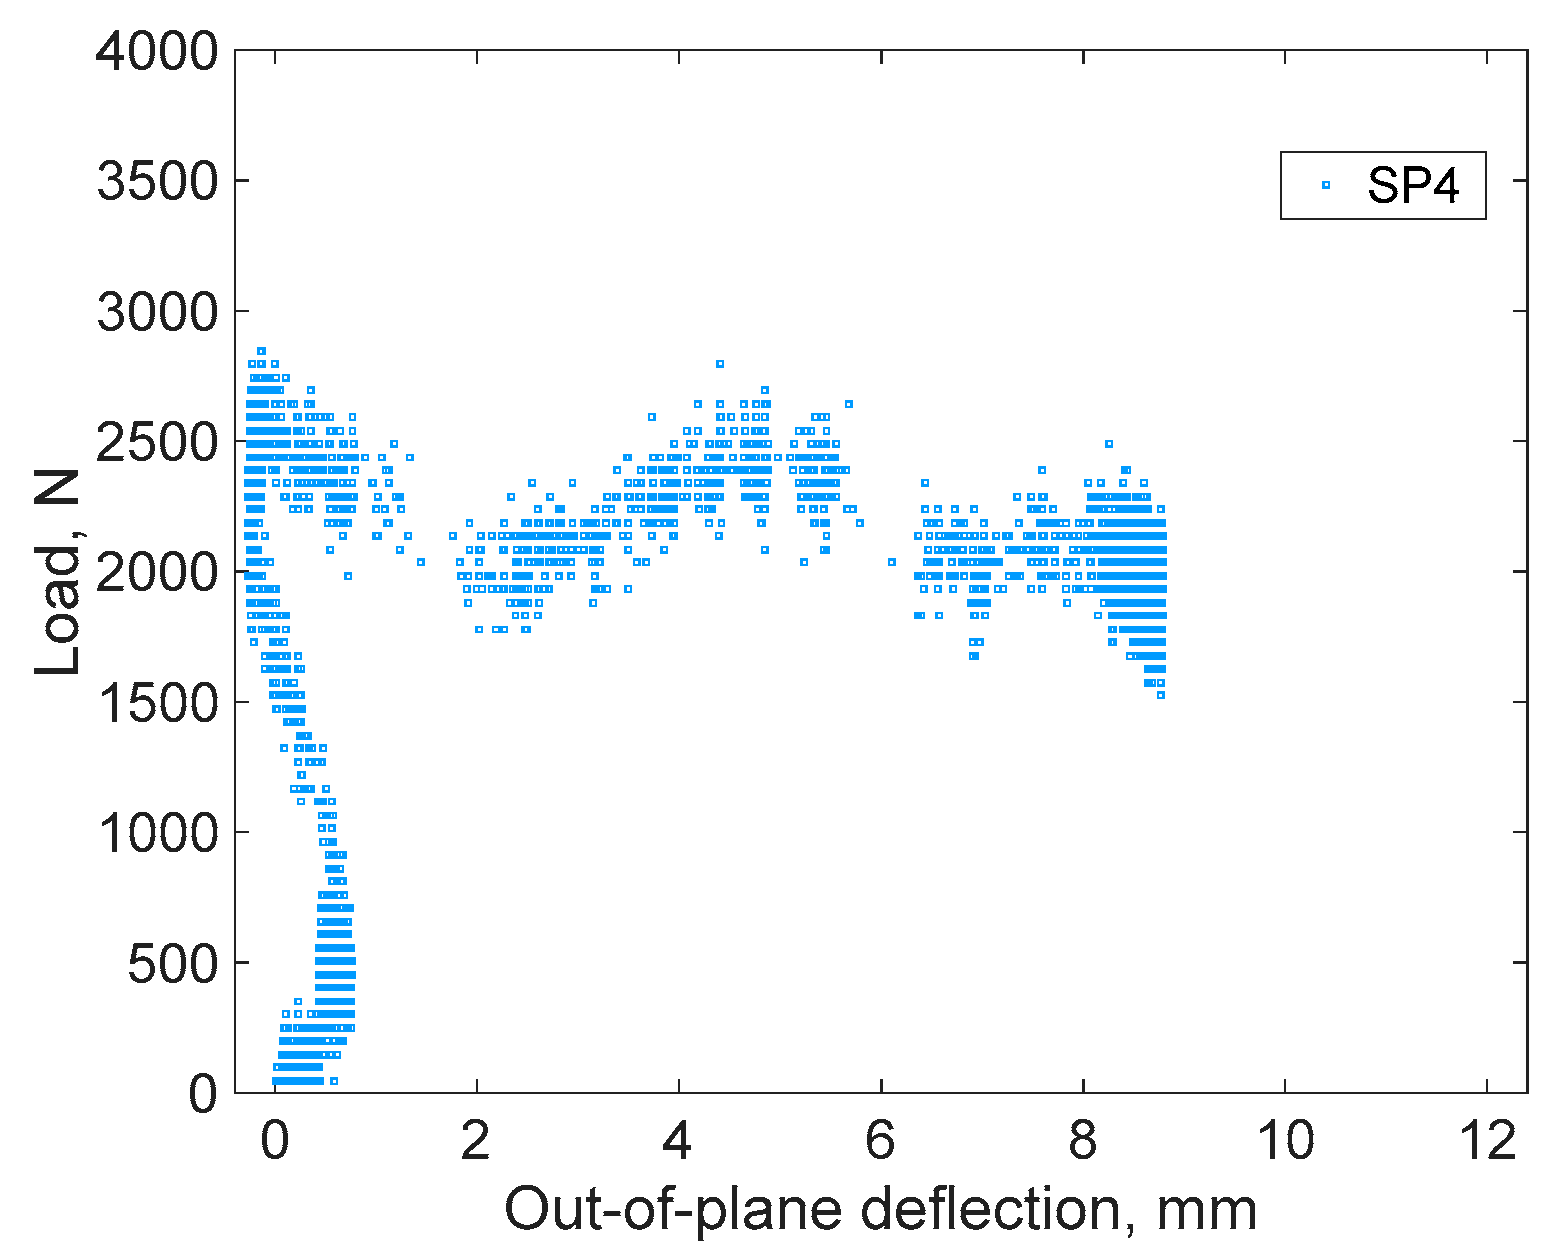
The average water contents at the top, middle and bottom areas of Wall 2 were 3.38%, 3.30% and 7.25%, respectively, and in the footing and foundation soil was 8.06%. In-plane deflections measured by string potentiometers during loading are shown in
Figure 7. The maximum deflections of SP1 and SP3 were 10.0 mm and 6.4 mm, respectively. The wall displacements indicated that Wall 2 rocked as well as slid in the in-plane direction. Deflection measurements indicated that Wall 2 also moved out-of-plane, twisting and tilting as the load was applied. The maximum deflection measured by SP4 was 8.8 mm, as shown in
Figure 8.
Wall 2 withstood a maximum load of approximately 2670 N (
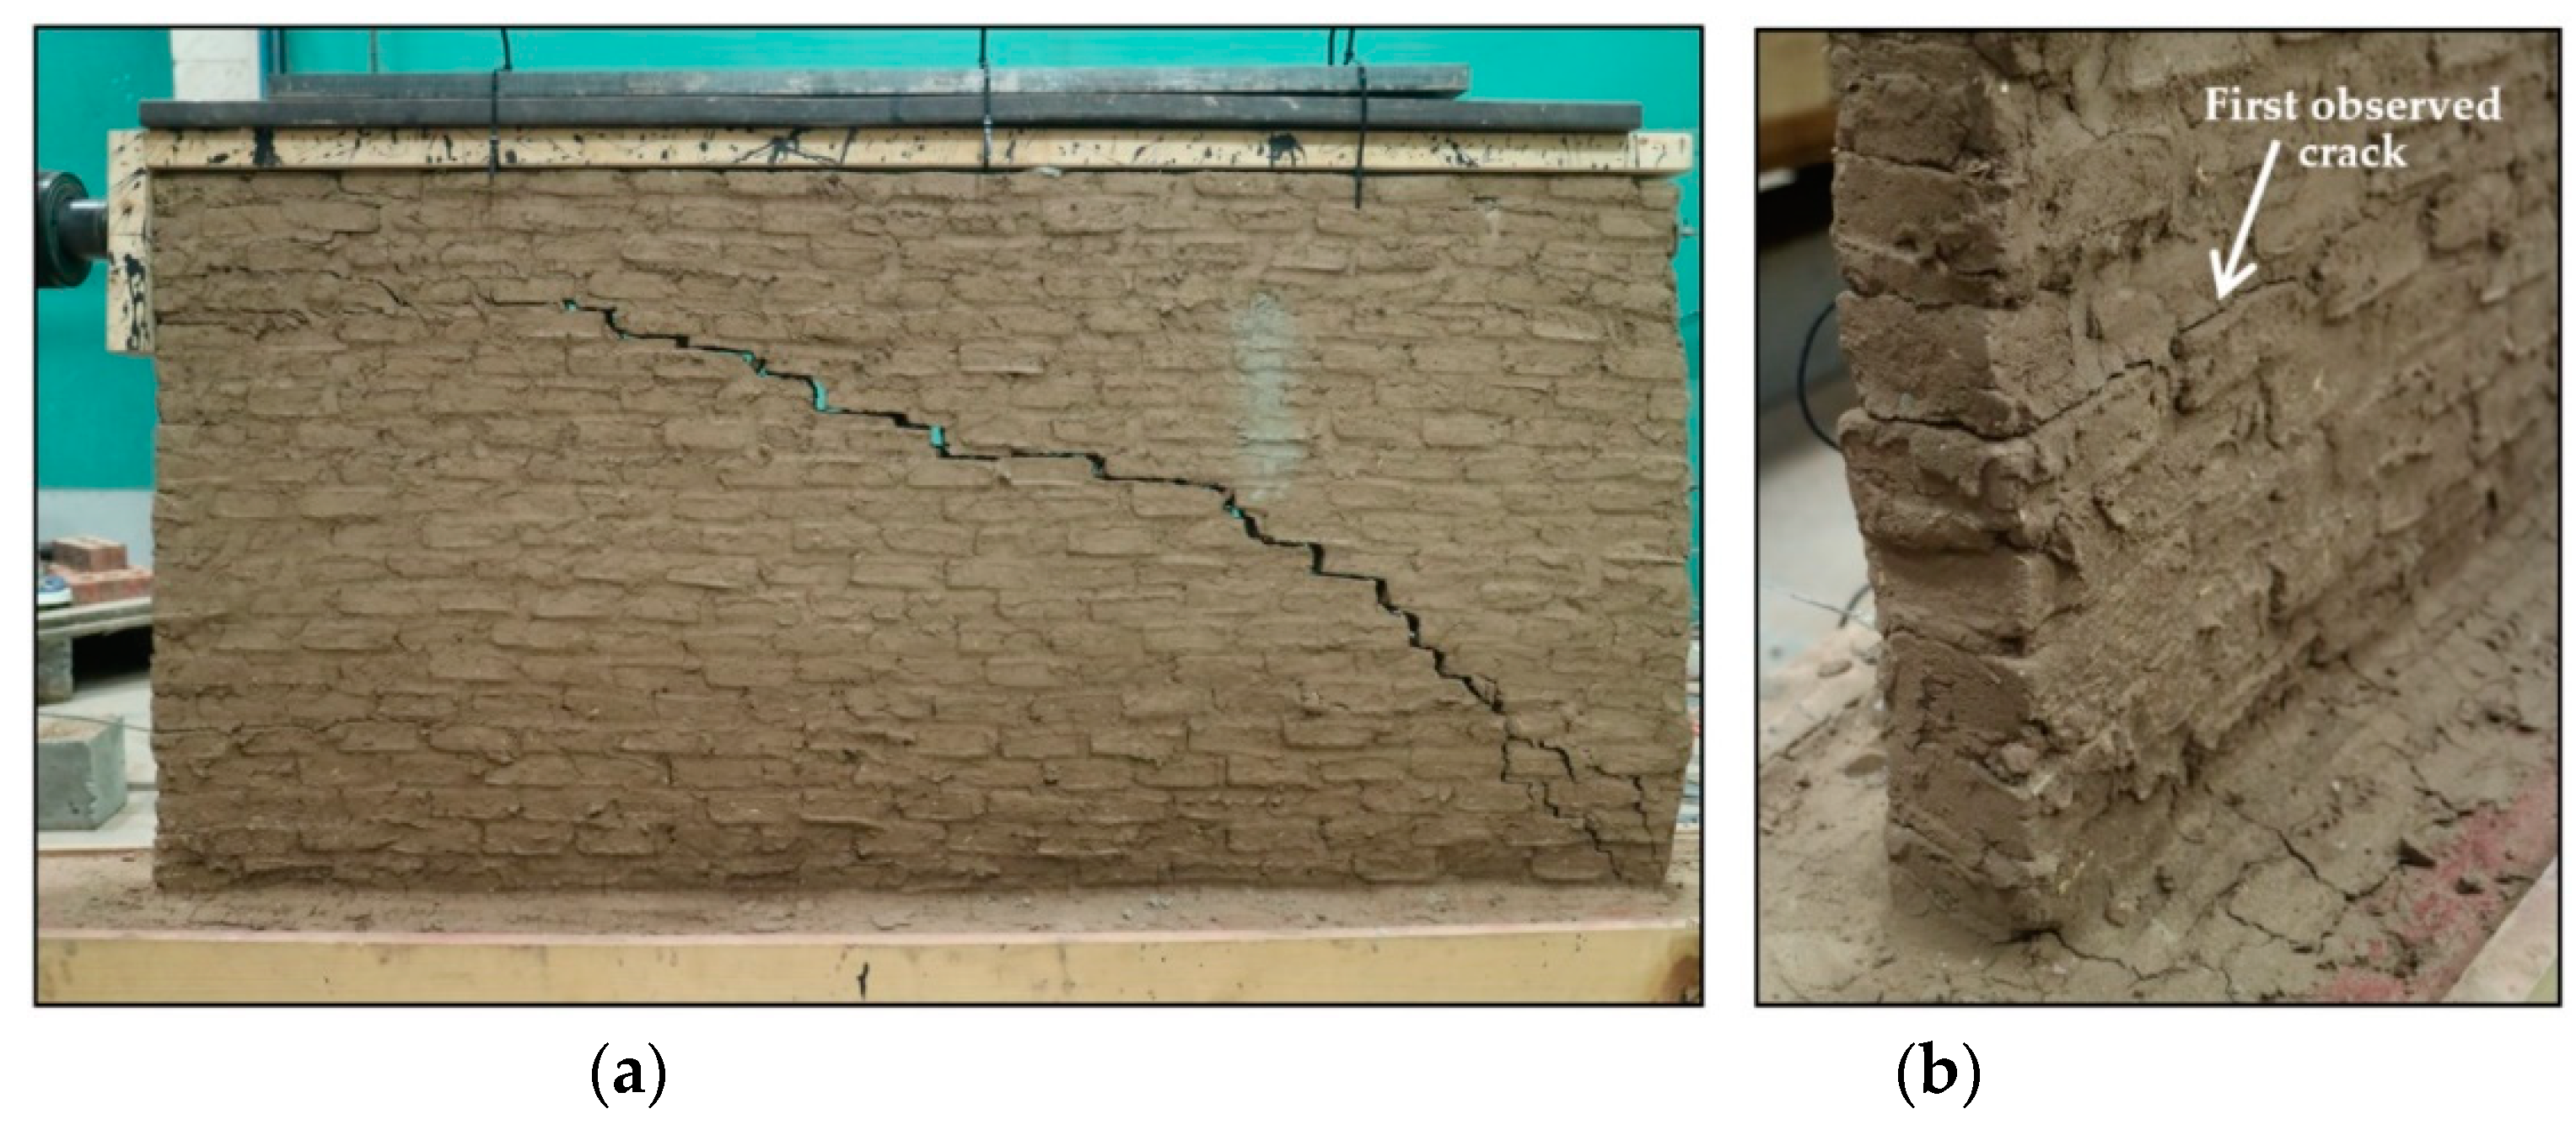
Table 1) with relatively small in-plane and out-of-plane deflections at that load. At maximum load, SP1 and SP3 measured deflections of about 2.4 mm, and SP4 did not measure a deflection due to the twisting effect. After reaching the maximum load of 2670 N, Wall 2 lost about 25% of its capacity dropping to about 2000 N (see
Figure 7 and
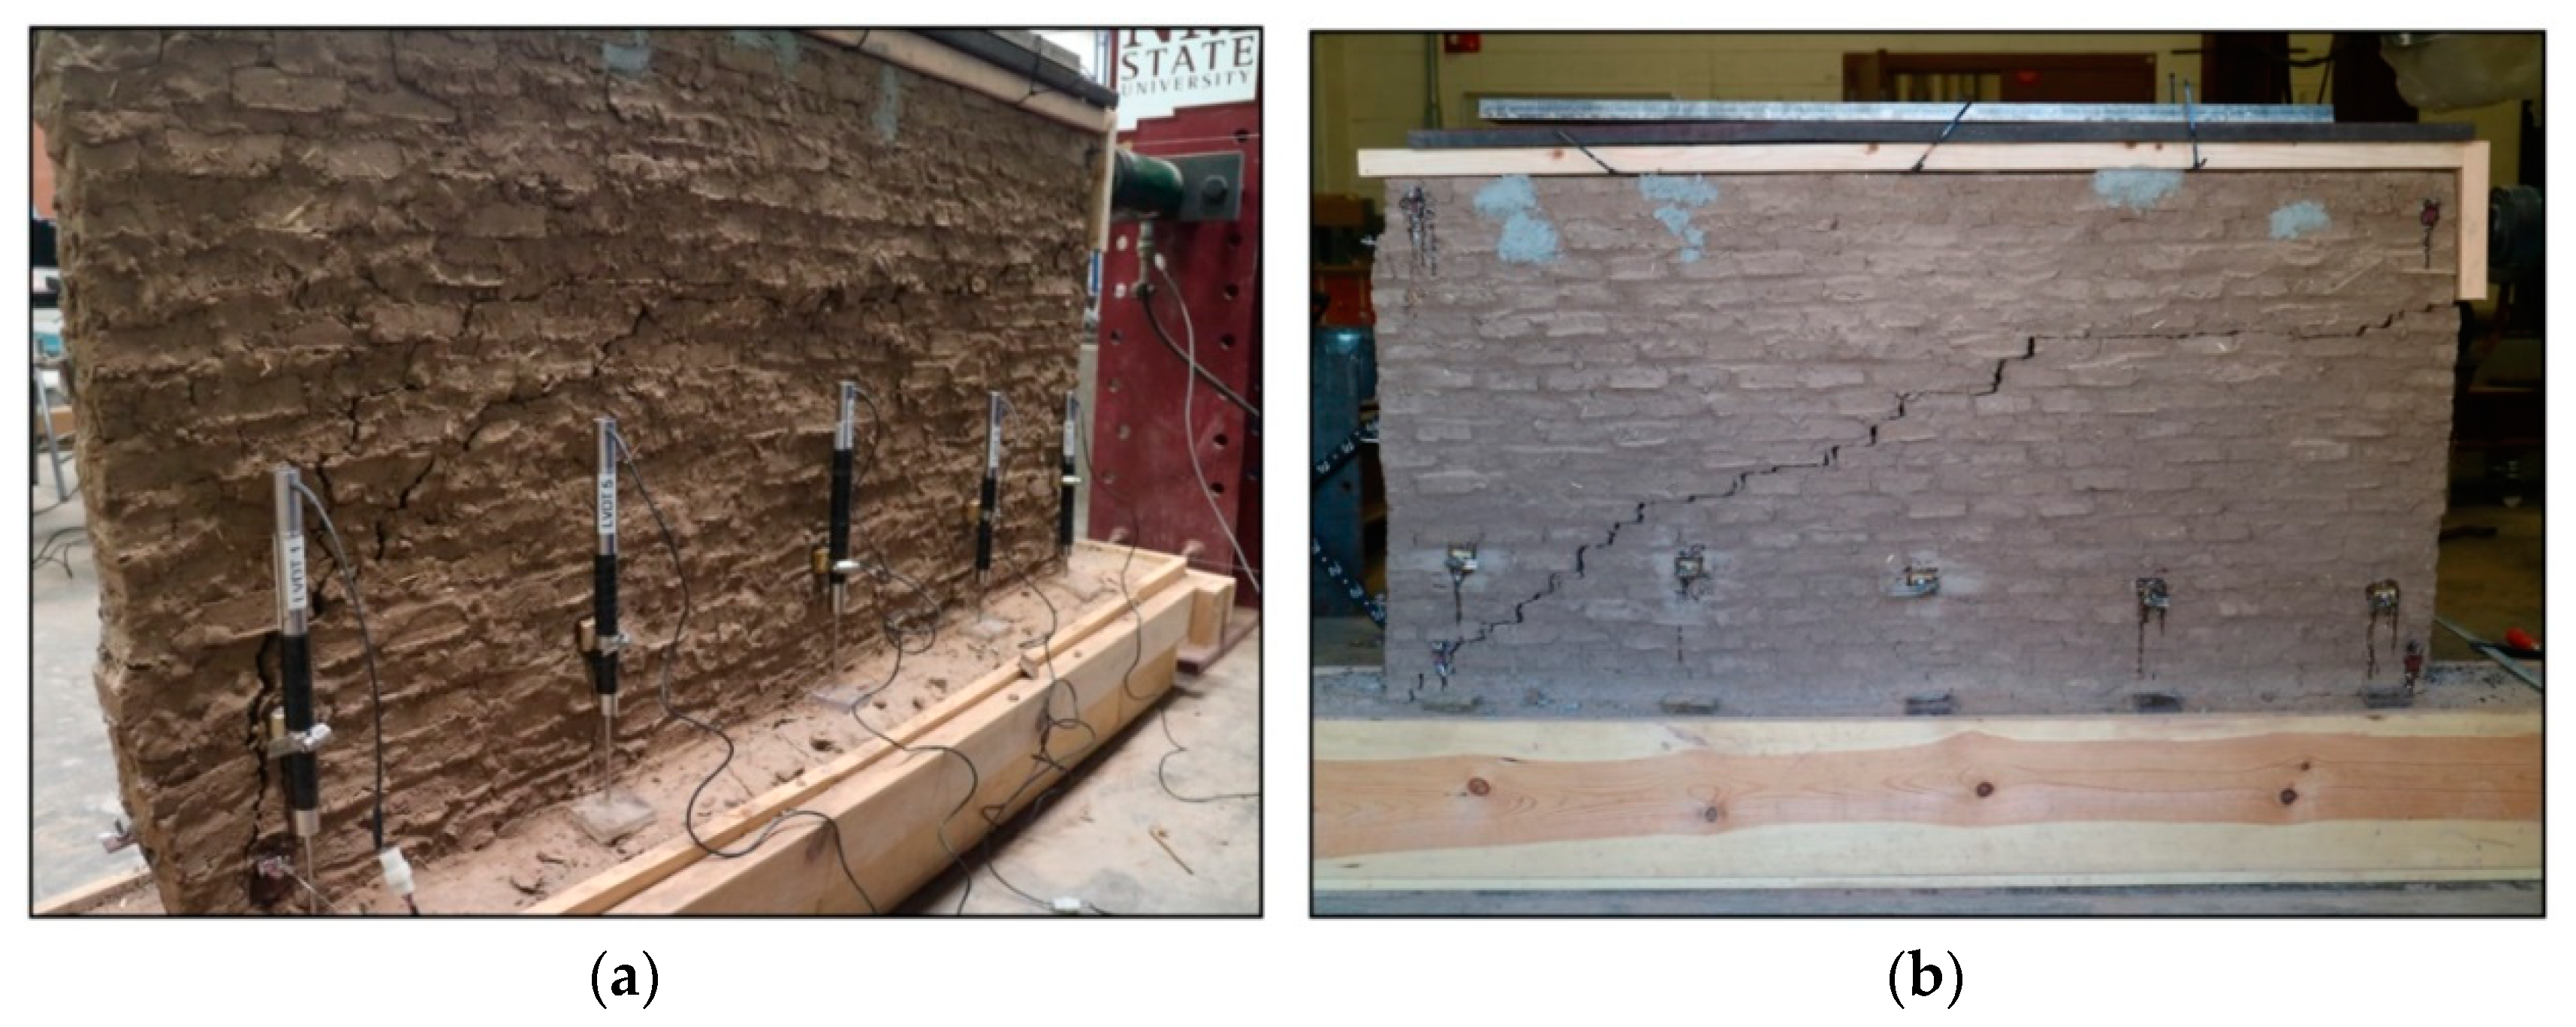
Figure 8) due to cracking (see
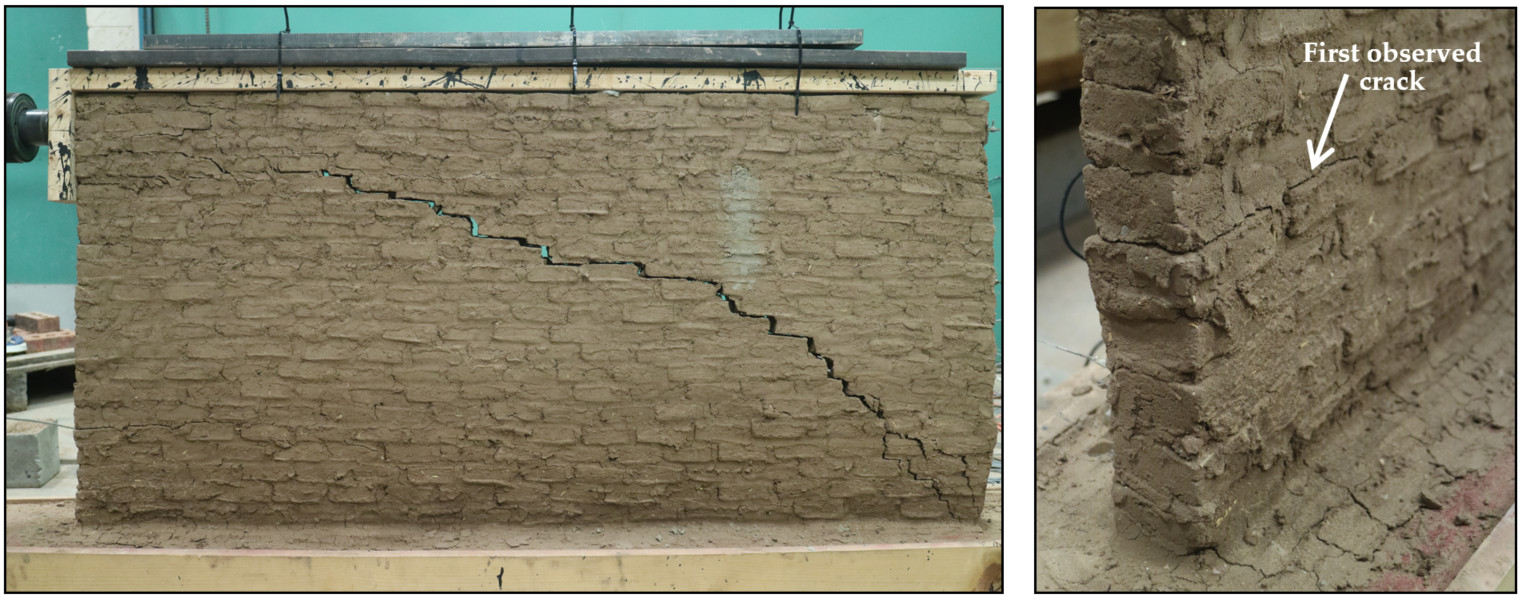
Figure 9a). Even though the wall seemed to regain some capacity, to approximately 2450 N, it eventually failed again, and the test was stopped because the out-of-plane deflection became excessive. The first crack was observed at a load of 1110 N at the transition zone between the wet and dry regions of the wall (see
Figure 9b). Even though the first crack appeared in that zone, the crack that made the wall fail was a shear crack through the dry section of the wall (see
Figure 9a).
3.3. Comparison between Scaled Walls
Walls 1 and 2 experienced similar behaviour in terms of deflections when subjected to lateral loading. Both walls underwent sliding, rocking, and tilting. However, the rocking of Wall 2 was greater than that observed in Wall 1, with a deflection difference between SP1 and SP3 of approximately 3.6 mm for Wall 2 and 2.7 mm for Wall 1; this can be attributed to crushing of the dry adobe at the corner of Wall 2. The crushing of the corner near the anchor point of the SP allowed the wall to slide over the crushed region.
Wall 2 experienced cracking along the location between dry and wet regions at an early load, but ultimately the failure was similar to that observed in Wall 1 (
Figure 9). Wall 1 had a peak load and then dropped suddenly after a crack formed diagonally across the wall length (
Figure 6), following the joints between the adobe bricks. After peak load, Wall 1 continued to carry the load, but crack propagation eventually led to ultimate failure. Wall 2 followed a similar trend but there was not a sharp drop of the load. However, the in-plane (lateral) load carrying capacity was approximately 75% of that of Wall 1, indicating that higher water content in the bottom part had a significant effect on the wall strength. Additionally, Wall 2 had considerably more out-of-plane twisting and sliding along the transition zone between the wet and dry regions of the wall.
4. Conclusions
Through the experimental tests conducted on the scaled walls, it can be concluded that moisture in the adobe walls can have a significant effect on their strength behaviour. The wet region along the bottom of Wall 2 reduced the wall strength to approximately 75% of the strength of Wall 1. Additionally, there were some differences in the failure mechanism due to the higher water content. The higher moisture content resulted in a lower compressive strength of the adobe material, which led to the crushing of the adobe blocks as Wall 2 rocked during lateral loading. Furthermore, the wet region created a weak horizontal plane and resulted in cracking at lower loads than observed in Wall 1. Finally, Wall 2 experienced more out-of-plane movement (twisting). This movement was focused on the weak plane near the top of the wet region. Based on the experimental work, it is important to understand how moisture will affect the strength properties of the adobe bricks and walls to ensure models and design techniques as well as building codes for adobe can be improved to account for these effects.
Incorporating improved connection methods between the wall and footing could significantly reduce in-plane deformations and improve the wall behaviour. Moreover, natural fibre reinforcement could potentially engage the whole wall, beginning at its footing through the top of the wall to improve its performance and create a more effective system. Further research will also assess the effects of fibre reinforcement, moisture and scale of bricks and walls using digital image correlation (DIC) tests.
Author Contributions
Conceptualization, B.W. and P.B.; methodology, B.W., P.B., E.D., M.M. and D.G.V.; formal analysis, B.W., P.B., E.D. and M.M.; funding acquisition, B.W. and P.B.; writing—original draft, B.W. and P.B.; writing—review and editing, B.W. and P.B.
Funding
This material is based upon work primarily supported by the National Science Foundation (NSF) under NSF Award Number EEC-1449501. Any opinions, findings and conclusions or recommendations expressed in this material are those of the authors, and do not necessarily reflect those of the NSF.
Acknowledgements
The help provided by research assistants Judit Garcia and Andres Alvarez of New Mexico State University with material preparation, wall model construction and test setup is very appreciated.
Conflicts of Interest
The authors declare no conflict of interest. The funding agency had no role in the design of the study; collection, analyses, or interpretation of data; writing of the manuscript; and decision to publish the results.
References
- Morony, J.J. Adobe Moisture Absorption and Temperature Control; Logged Data for a Humid Heat Wave 6–11 August 2004, Del Rio, Texas; South West Texas Junior College: Del Rio, TX, USA, 2005; Available online: http://www.udcinc.org/Adobe%20Moisture%20Absorption%20&%20Tempriture%20Control.PDF (accessed on 14 September 2018).
- Binici, H.; Aksogan, O.; Bodus, M.N.; Akca, E.; Kapur, S. Thermal isolation and mechanical properties of fibre reinforced mud bricks as wall materials. Constr. Build. Mater. 2007, 21, 901–906. [Google Scholar] [CrossRef]
- Bicini, H.; Aksogan, O.; Bakbak, D.; Kaplan, H.; Isik, B. Sound insulation of fibre reinforced mud brick walls. Constr. Build. Mater. 2009, 23, 1035–1041. [Google Scholar] [CrossRef]
- Revuelta-Acosta, J.D.; Garcia-Diaz, A.; Soto-Zarazúa, G.M.; Rico-Garcia, E. Adobe as a sustainable material: A termal performance. J. Appl. Sci. 2010, 10, 2211–2216. [Google Scholar]
- Lertwattanaruk, P.; Choksiriwanna, J. The physical and thermal properties of adobe brick containing bagasse for earth construction. Built 2011, 1, 54–61. [Google Scholar]
- Tolles, E.L., III. Seismic Studies in Small-Scale Models of Adobe Houses. Ph.D. Dissertation, Stanford University, Stanford, CA, USA, 1989. [Google Scholar]
- Sharma, V.; Vinayak, H.K.; Marwaha, B.M. Enhancing sustainability of rural adobe houses of hills by addition of vernacular fiber reinforcement. Int. J. Sustain. Built Environ. 2015, 4, 348–358. [Google Scholar] [CrossRef]
- Abanto, G.A.; Karkri, M.; Lefebre, G.; Horn, M.; Solis, J.L.; Gomez, M.M. Thermal properties of adobe employed in Peruvian rural areas: Experimental results and numerical simulation of a traditional bio-composite material. Case Stud. Constr. Mater. 2017, 6, 177–191. [Google Scholar] [CrossRef]
- Tolles, E.L.; Webster, F.A.; Crosby, A.; Kimbro, E.E. Survey of Damage to Historic Adobe Buildings after the January 1994 Northridge Earthquake; GCI Scientific Program Reports; Getty Conservation Institute: Los Angeles, CA, USA, 1996; ISBN 0-89236-391-6. [Google Scholar]
- Tolles, E.L.; Kimbro, E.E.; Ginell, W.S. Planning and Engineering Guidelines for the Seismic Retrofitting of Historic Structures; GCI Scientific Program Reports; Getty Conservation Institute: Los Angeles, CA, USA, 2002; ISBN 0-89236-588-9. [Google Scholar]
- Dowling, D. Adobe housing in El Salvador: Earthquake performance and seismic improvement. Geol. Soc. Am. Spec. Pap. 2004, 375, 281–300. [Google Scholar]
- Blondet, M.; Vargas, J.; Tarque, N. Observed behavior of earthen structures during the Pisco (Peru) earthquake of 15 August 2007. In Proceedings of the 14th World Conference on Earthquake Engineering, Beijing, China, 12–17 October 2008. [Google Scholar]
- Morris, H.; Walker, R. Observations of the performance of earth building following the February 2011 Christchurch Earthquake. Bull. N. Z. Soc. Earthq. Eng. 2011, 44, 358–367. [Google Scholar]
- Varum, H.; Tarque, N.; Silveira, D.; Camata, G.; Lobo, B.; Blondet, M.; Figueiredo, A.; Rafi, M.M.; Oliveira, C.; Costa, A. Structural behavior and retrofitting of adobe masonry buildings. In Structural Rehabilitation of Old Buildings; Costa, A., Guedes, J.M., Varum, H., Eds.; Springer: Berlin, Germany, 2013; Volume 2, pp. 37–75. ISBN 978-3-642-39685-4. [Google Scholar]
- Blondet, M.; Villa Garcia, G.; Brzev, S.; Rubiños, A. Earthquake-Resistant Construction of Adobe Buildings: A Tutorial, 2nd ed.; EERI/IAEE World Housing Encyclopedia: Oakland, CA, USA, 2011; Available online: http://www.world-housing.net/wp-content/uploads/2011/06/Adobe_Tutorial.pdf (accessed on 14 September 2018).
- Rainer, L. Deterioration and pathology of earthen architecture. In Terra Literature Review, An Overview of Research in Earthen Architecture Conservation; Avrami, E., Guillaud, H., Hardy, M., Eds.; Getty Conservation Institute: Los Angeles, CA, USA, 2008; pp. 45–61. [Google Scholar]
- Tarque, N.; Camata, G.; Espacone, E.; Varum, H.; Blondet, M. Numerical modelling of in-plane behavior of adobe walls. In Proceedings of the 8th National Conference on Seismology and Earthquake Engineering, Aveiro, Portugal, 20–23 October 2010. [Google Scholar]
- Tarque, N.; Camata, G.; Espacone, E.; Blondet, M.; Varum, H. The use of continuum model for analyzing adobe structures. In Proceedings of the 15th World Conference on Earthquake Engineering, Lisbon, Portugal, 24–28 September 2012; Paper No. 0128. Sociedade Portuguesa de Engenharia Sismica: Lisboa, Portugal, 2015. ISBN 978-1-63439-651-6. [Google Scholar]
- Illampas, R.; Charmpis, D.; Ioannou, I. Laboratory testing and finite element simulation of the structural response of an adobe masonry building under horizontal loading. Eng. Struct. 2014, 80, 362–376. [Google Scholar] [CrossRef]
- Miccoli, L.; Garofano, A.; Fontana, P.; Muller, U. Experimental testing and finite element modelling of earth block masonry. Eng. Struct. 2015, 104, 80–94. [Google Scholar] [CrossRef]
- Clifton, R.J.; Davis, F.L. Mechanical Properties of Adobe; U.S. National Bureau of Standards Technical Note 996; U.S. Department of Commerce. Government Printing Office: Washington, DC, USA, 1979.
- Wosick, E.; Gebremariam, T.; Weldon, B.; Bandini, P.; Al-Aqtash, U. Strength characteristics of typical adobe material in the Southwestern United States. In Proceedings of the 9th International Masonry Conference, Guimarães, Portugal, 7–9 July 2014; International Masonry Society: Guimarães, Portugal, 2014. [Google Scholar]
- Al Aqtash, U.; Bandini, P. Prediction of unsaturated shear strength of an adobe soil from the soil-water characteristic curve. Constr. Build. Mater. 2015, 98, 892–899. [Google Scholar] [CrossRef]
- Al Aqtash, U.; Bandini, P.; Cooper, S. Numerical approach to model the effect of moisture in adobe masonry walls subjected to in-plane loading. Int. J. Archit. Herit. 2017, 11, 805–815. [Google Scholar] [CrossRef]
© 2018 by the authors. Licensee MDPI, Basel, Switzerland. This article is an open access article distributed under the terms and conditions of the Creative Commons Attribution (CC BY) license (http://creativecommons.org/licenses/by/4.0/).


 ,
, 


