Novel Approaches for Fracture Detection in Steel Girder Bridges


Department of Civil and Environmental Engineering, Florida International University, Miami, FL 33174, USA
*
Author to whom correspondence should be addressed.
Infrastructures 2019, 4(3), 42; https://0-doi-org.brum.beds.ac.uk/10.3390/infrastructures4030042
Submission received: 25 June 2019
/
Revised: 7 July 2019
/
Accepted: 9 July 2019
/
Published: 11 July 2019
(This article belongs to the Special Issue Advanced Materials and Technology for Resilient Bridge Infrastructures)
Abstract
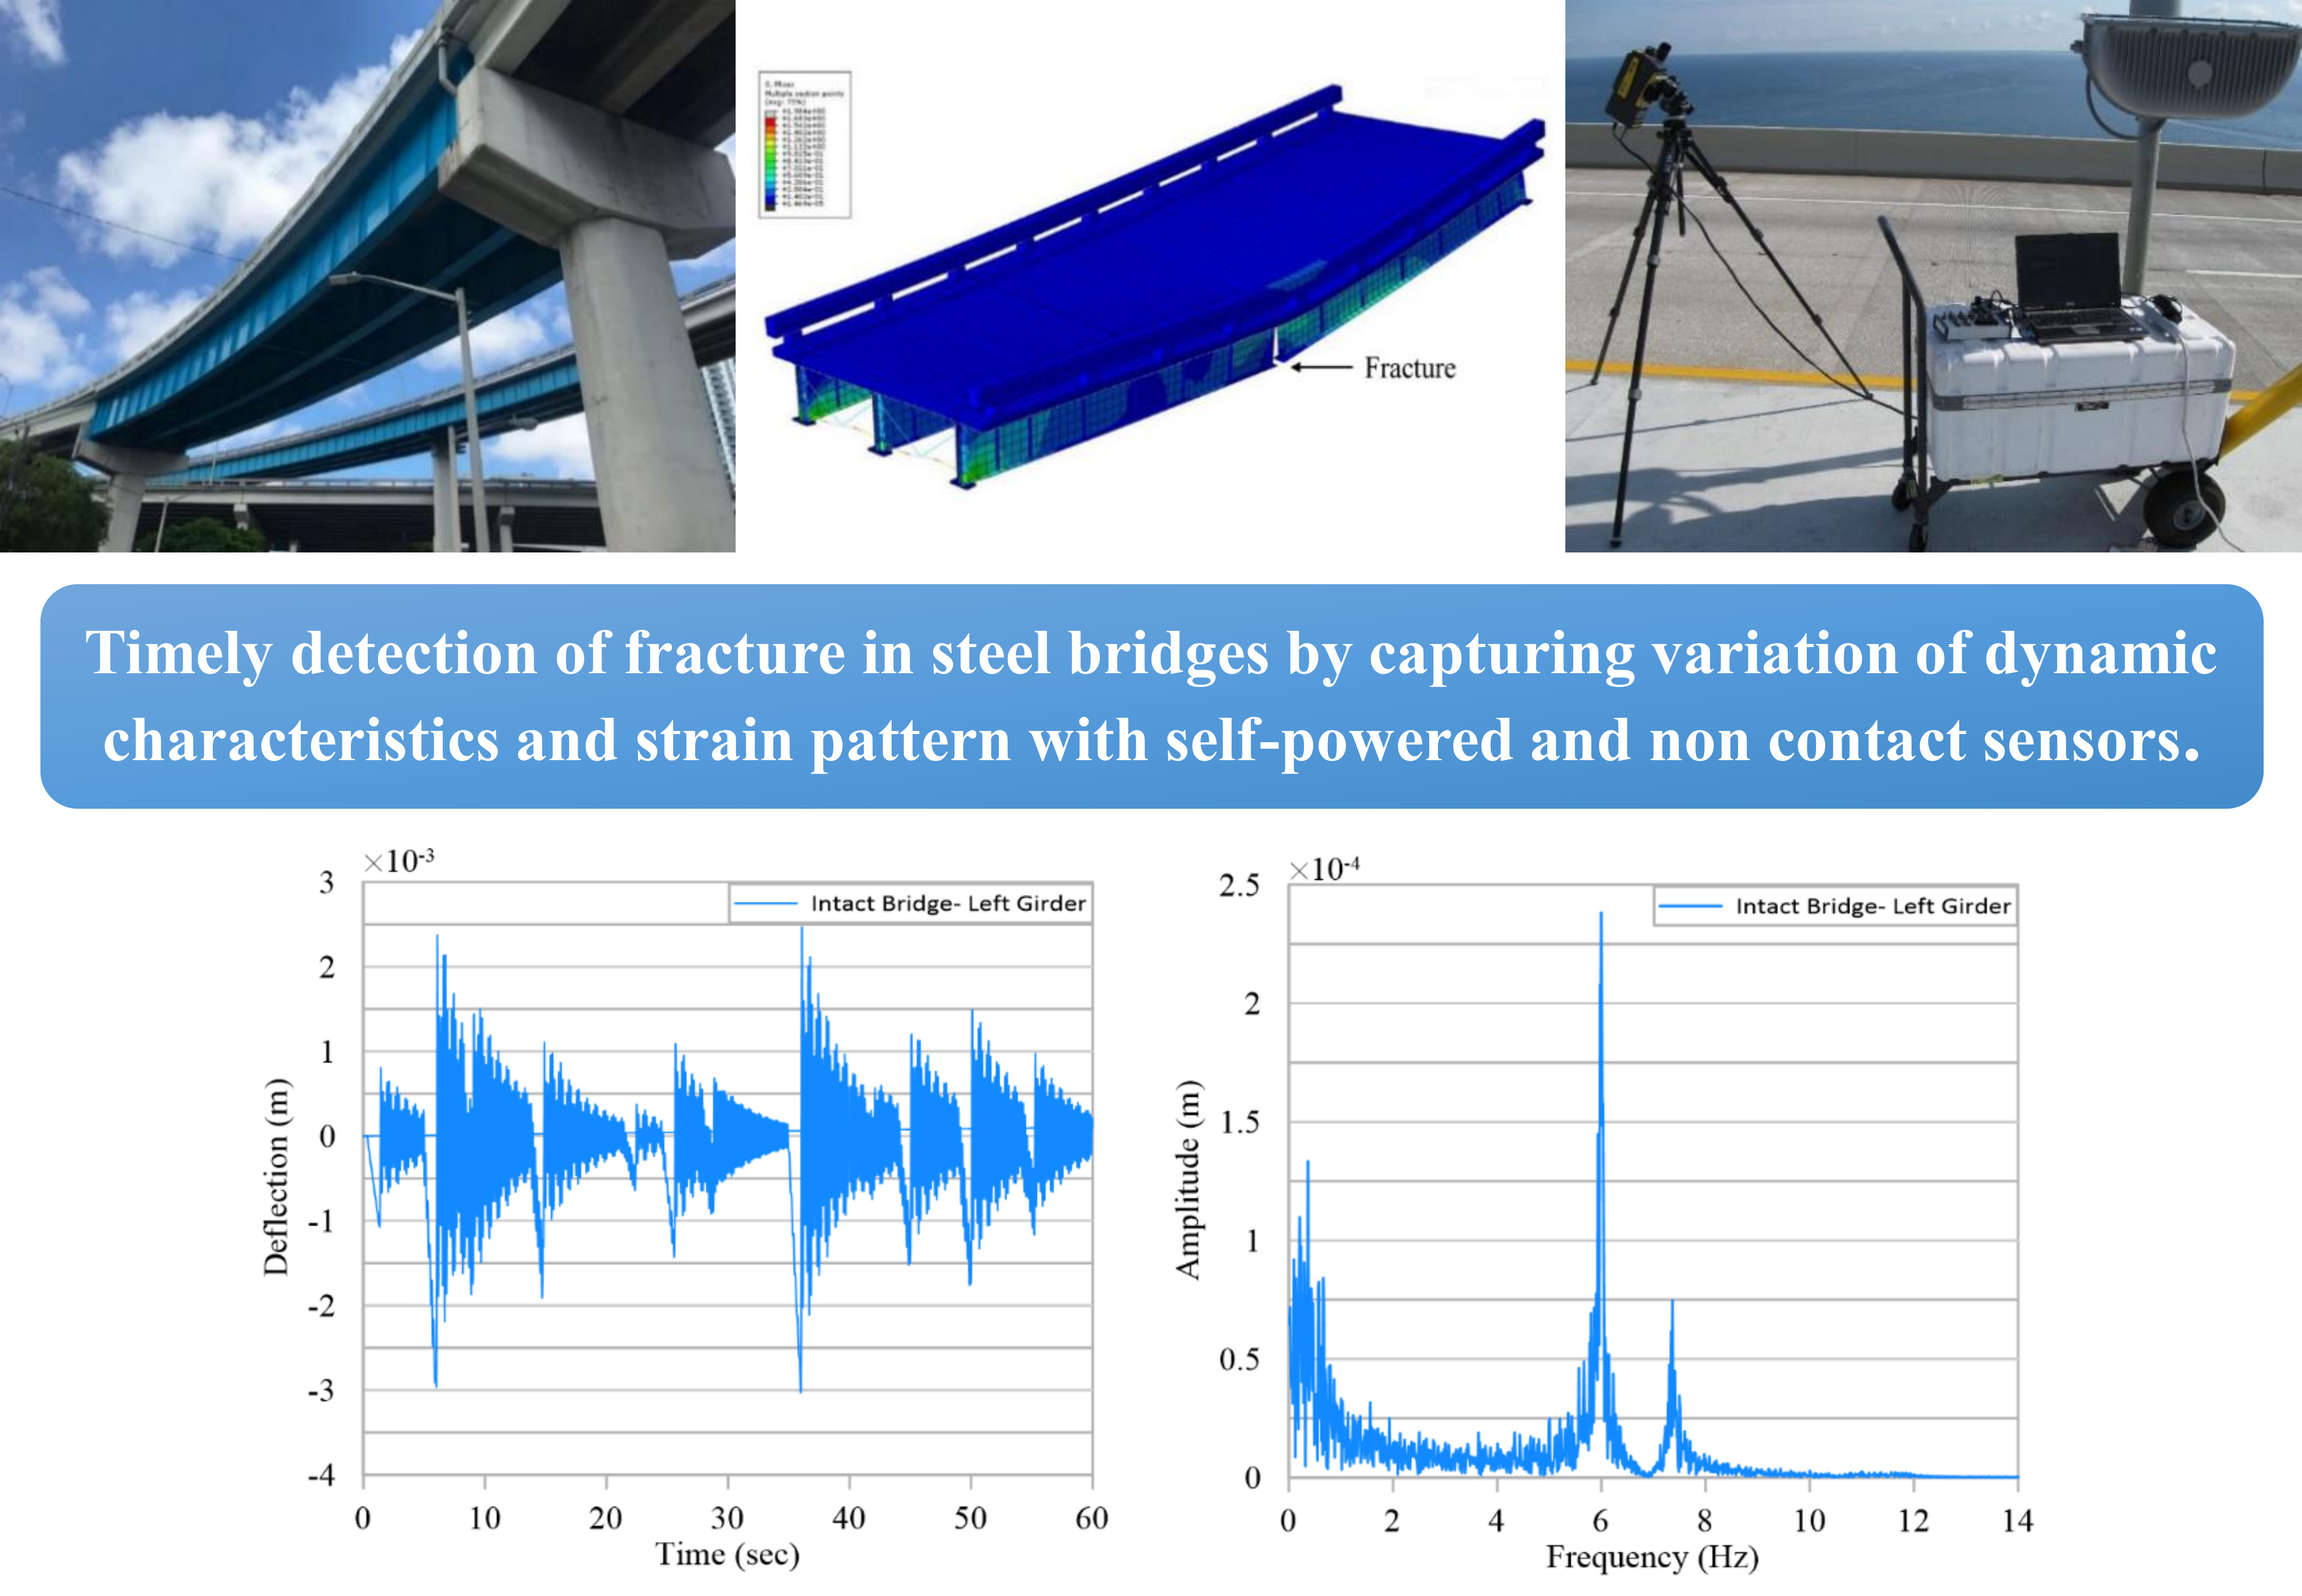
:The bottom flanges of steel plate girder bridges can be considered fracture-critical elements depending on the number of girders and bridge configuration. For such cases, it is required that inspection of these bridges be carried out using costly “arms-length” approach. New techniques in structural health monitoring (SHM) that use non-contact sensors and self-powered wireless sensors present alternative approach for inspection. Application of such techniques would allow timely detection and application of repair and strengthening, in other word, providing for more resilient bridges. This paper investigates the feasibility of using a handful of self-powered wireless or non-contact sensors for continuous or periodic monitoring and detection of fracture in steel plate girder bridges. To validate this concept, vibration measurements were performed on an actual bridge in the field, and detailed finite element analyses were carried out on a multi-girder bridge. The records obtained show that vibration amplitude was significantly increased for fractured girder, and a distinct pattern of strain variation was registered in the vicinity of fracture, all of which can be detected effectively with relevant sensors. Moreover, the amplitude and frequency of the vibration was shown to be significant enough for providing the required power for typical sensor(s).

1. Introduction
According to the American Association of State Highway Transportation Officials (AASHTO) Bridge Design Specifications [1], “fracture critical members (FCMs) are steel tension members or steel tension components of members whose failure would be expected to result in collapse of the bridge.” It is required that inspection of these bridges be carried out using the “arms-length” approach. Fatigue cracking is one of the most important phenomena affecting the structural integrity and performance of steel bridges [2]. In general, fatigue cracks can occur in steel bridges due to low fatigue resistance of structural members, members with large initial defects, members subjected to out-of-plane distortion, and details at end restraints and flange terminations [3]. Development of fatigue cracking due to out-of-plane distortion occurring at connections of transverse bracing and longitudinal girders may lead to the full depth fracture of steel girder bridges. In the positive bending moment region of steel girders, the bottom flanges are prone to fatigue cracking and consequently are considered fracture-critical elements depending on the number of girders and bridge configuration [4,5]. Inspection of girders’ bottom flanges near mid-span over a busy roadway is costly, time consuming and causes traffic disruption and potential safety hazards [6]. It may also take the inspectors as long as two years to detect fracture, rendering the bridge potentially unsafe for long duration. To address cost, traffic interruption and safety issues associated with conventional inspection, new techniques in structural health monitoring (SHM), such as the use of non-contact sensors and self-powered wireless sensors, offer an alternative that provides for both accuracy and economy for maintenance of this type of bridges. This in turn will allow timely detection and application of repair and strengthening resulting in faster recovery, in other words, providing for more resilient bridges. The approach discussed here will also be applicable to other bridges with fracture critical members.
SHM refers to a wide spectrum of activities and approaches to determining the changes in a structure and therefore determining its integrity and functional adequacy. This may range from routine visual inspection to sophisticated non-destructive evaluation techniques. It can be performed through periodic and on demand inspection, or can be carried out through continuous monitoring systems installed on the structure. One may consider SHM in two major categories; methods for which the structure is installed with sensors (sensor-based SHM), and methods for which health of the structure is evaluated without a sensor and using external devices. Non-destructive evaluation methods, use of remote non-contact sensors, visual inspection and other vision-based methods can be considered in the latter group. Contacting a sensor-based SHM system typically has three major subsystems: a sensor (and wirings), a data acquisition, and a diagnosis subsystem. The diagnosis subsystem generally includes data processing, data mining, and damage detection that can be developed further to model updating, and structural safety and reliability determination. The accuracy of results is largely dependent upon not only the type and sophistication of the sensors and instruments, but also on the variety, quantity and quality of the measured data.
In a larger scale, optimal sensor placement has been a concern among researchers and has been studied widely. The goal is to improve the ability of sensor subsystem with the least number of sensors possible [7,8]. The quality of the collected data is also a matter of attention [9]. Inaccurate results could lead to false alarms or missing an event all together. This can lead to an unsafe structure and its consequences. A sensor commonly consists of different elements, including a sensing component, transducer, signal-processing and communication interface module. Malfunction, harsh environment and normal wear and tear, as well as other factors such as electromagnetic interference, may lead to distortion of results and false data. For damage detection in large-scale structural systems, using a large number of sensors is a common trend because it promises more coverage hence a better chance of detection [10]. This in turn, introduces challenges for data collection and processing, and for meaningful interpretation of the results. Developing a simple economical, flexible and at the same time accurate sensor is very much in demand. Sensor types developed for SHM purposes in recent decades include electric strain gages, piezoelectric sensors, cement-based strain gauge, corrosion sensors, nano material-based sensors, wireless sensors, accelerometers, inclinometers, acoustic emission sensors [11], wave propagation sensing devices and various fiber optic sensors (FOS). Additionally, advanced sensor and sensing technologies, such as fiber optics and Bragg grating sensors [12,13] and those based on Global Positioning System [14] have been recently developed for strain, displacement, and other response measurement.
Each of the sensor types have a certain application and work better in certain conditions. Nevertheless, actual use of these sensors presents some challenges in the real environment. For instance, PZT (lead-zirconate-titanate)-based active and passive damage detection technologies can be used as an acoustic emission (AE) sensor, which receives the stress wave signal generated by damage occurred in a structure. Cement-based strain sensor is considered as one appropriate candidate to solve the incompatibly issue. Dispersed sensors have also been used for monitoring purposes. Incorporated with fibers, conductive nano-particles, magnetized or magnetic metals, PZT, or a combination can give concrete and other mediums a sensing ability.
Traditional wired sensors may enable continuous monitoring of the bridge. However, the cost of installing wired sensors for longer span bridges, providing continuous power, and their maintenance may make them impractical in many cases. To address the shortcomings associated with wired sensors, the use of wireless sensors offers a valuable alternative [15]. Nevertheless, these sensors typically rely on battery and super capacitor energy sources for operation, and the cost of periodic replacement of battery or capacitor systems for large scale monitoring would constitute a major expense [16,17]. New developments for “energy harvesting” to feed the sensors could be a potential solution for providing continuous power to permanent sensors. Energy harvesting techniques are mainly based on solar energy, thermal gradients and vibration energy. Among these techniques, vibration energy because of providing high level of energy and the ability for being embedded (as in concrete structures) could be used for a continuous large-scale monitoring [18,19,20,21]. As an example, Self-powered piezo-floating-gate (PFG) sensors empowered using piezoelectric transducers through harvesting energy are used for detection of distortion-induced fatigue cracking of steel bridges [22,23].
There are two main questions that need to be addressed to verify the feasibility of using wireless self-powered sensors for detection of fracture in fracture critical members. One is whether the bridge vibration under live load would generate enough energy to power the sensors, and the other, if variation in stress/strain at predefined locations and dynamic characteristics of the bridge resulted from fracture of a girder could be exploited as a means for detection of the fracture.
Sensor installation for monitoring requires direct contact with the structure. Therefore, using these methods can involve accessibility problems and traffic disruption. Recently, non-contact sensing systems like laser scanning and interferometric radar have been proposed as a measurement instrument in large structures, such as bridges, towers, and dams [24,25,26,27,28,29]. One such technique uses laser vibrometer for remote measurement of vibration in an attempt to detect damages indicated by variation in the dynamic characteristics of the structures. Potential for the use of laser vibrometer for detection of fracture is also investigated [30].
Objectives and Approach
The objective of this study is to explore new means for detecting fracture in fracture-critical bridge members that are both accurate and affordable at the same time. A timely detection of the onset of fracture will allow the maintenance crew to address the situation before the progress in damage threatens the public safety and requires major closures and costs.
To achieve the objective of this investigation, a two-fold investigation was performed. One was to verify that the changes in stress/strain state or dynamic characteristics of the bridge is adequate and clear to be detected by a set of optimally-placed sensors. The other was to determine;
- Whether the frequency and amplitude of the vibrations of the bridge from traveling vehicles and that caused by the fracture is large enough to power or trigger the wireless self-powered sensors installed strategically to detect the occurrence of the fracture,
- The feasibility of using self-powered wireless sensors for continuous monitoring of steel plate girder bridges,
- Applicability of non-contact laser vibrometer for a safe, rapid, economic, non-interruptive and accurate periodic measurement, and therefore, detection of variation in the vibration characteristics of the bridge.
One means for facilitating the use of self-powered wireless sensors is by harvesting the vibration energy of the bridge. In addition to the bridge vibration providing power for the sensors, variation in dynamic characteristics of the bridge resulted from fracture of girder can also be exploited as a means for detection of the fracture. The bridge vibration and displacement amplitude depends on the bridge characteristics and traffic loading. These parameters could vary based on the bridge geometry, design, location, type of vehicles crossing the bridge, and Average Daily Truck Traffic (ADTT). A knowledge of the vibration characteristics of the bridge in its intact condition can be developed by actual measurements, and finite element (FE) models can be used for dynamic analysis of the fractured bridge. This can lead to establishment of response thresholds for the bridge for indication of damage if certain threshold is surpassed. In this case, the sensor can be kept in waiting mode until the threshold is reached. The sensor can then begin emitting a signal as an indication of the damage/fracture. Alternatively, the stress/strain variation in the vicinity of the fracture recorded using self-powered wireless sensors on a continuous basis can be used to determine the type, location and intensity of the fracture event.
Once one of the girders fractured, the bridge vibration characteristic and displacement amplitude could change significantly because of reduction in bending stiffness potentially resulting in greater vibration amplitudes that may be adequate for functioning of the sensors. Therefore, even if the amplitude and frequency of the intact bridge vibration would not be adequate to provide the necessary power for the sensors, the vibration of the fractured bridge will potentially activate the sensors. The novelty of the proposed approach is that the self-powered sensors that are dormant for the intact bridge can start monitoring once the bridge is fractured, and send a warning to the owner for taking action. Additionally, the variation in vibration characteristics of the bridge between two measurement intervals can be detected using non-contact laser vibrometer in periodic field testing.
2. Field Test
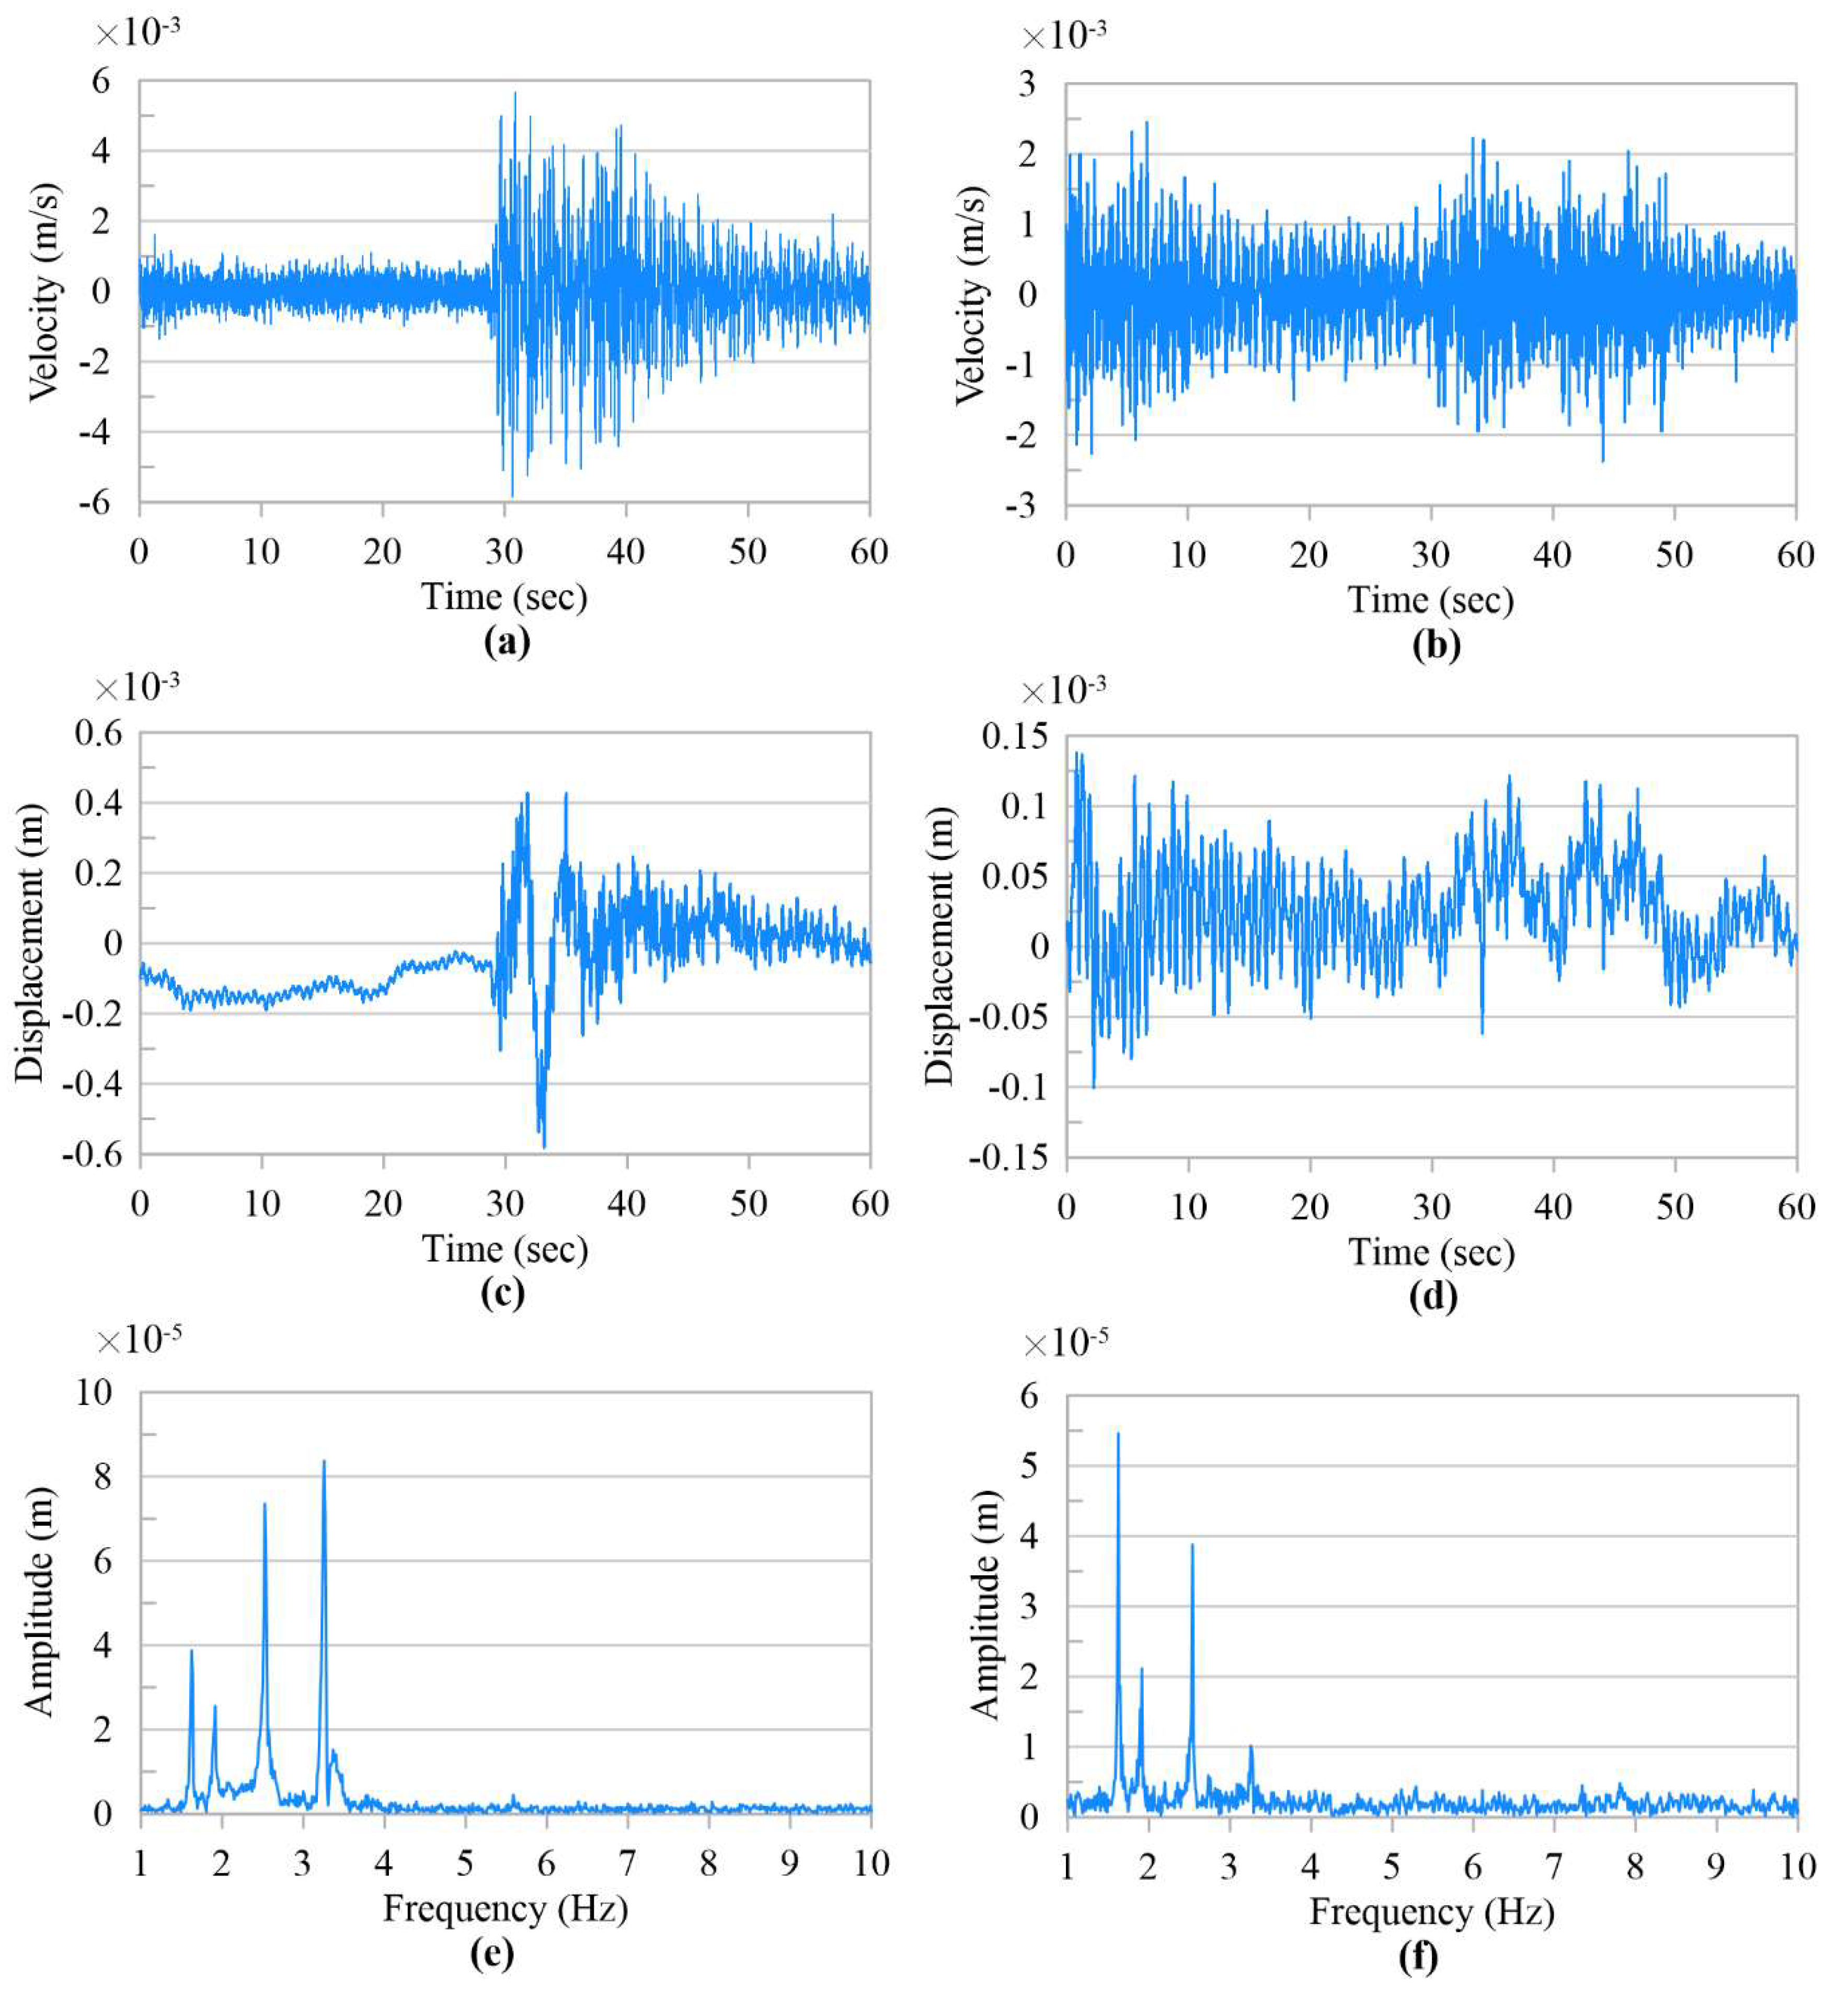
The I-95 NB to SE 1st Ave. highway bridge in downtown Miami, FL (Figure 1), was selected based on the accessibility for testing to study the characteristics of traffic-induced vibration. This bridge is a simple span multiple steel-girder bridge with the span length of 36.5 m (120 ft) carrying one traffic lane with the average daily traffic of 14,250 veh/day that was built in 1968. The last bridge inspection report on July 2016 shows the superstructure is in a satisfactory condition. A laser vibrometer as shown in Figure 2 was simply stationed under the bridge on a walkway with no interruption to traffic on and under the bridge and no need for direct access to the bridge. The bridge vibration at mid-span and quarter-span was captured under moving normal traffic loading for all three girders. The velocity time history of girders was recorded by the laser vibrometer at several time intervals of 60 s during very low traffic volume passing the bridge. The velocity time histories of the interior girder at mid-span and quarter-span (Figure 3a,b) were integrated to obtain the time histories of displacement (Figure 3c,d). Frequency spectra were also obtained using Fast Fourier Transform (FFT) and are shown in Figure 3e, f. Vehicle classes passing the bridge were recorded during the test and corresponded with the field test results. The vibration levels shown in Figure 3 are the results of passing vehicles in the class of Midsize Sport Utility Vehicle (SUV) with the average weight of 18.6 kN and lighter vehicles.
Several key observations can be made from this experiment. First, because of the integral composite bridge superstructure accommodating only one lane, vibration amplitudes of the interior and exterior girders are similar to each other. Second, vibration levels at supports are minimal and reach the maximum at the middle of the span. Third, the amplitude of displacement at mid-span and quarter span under light weight traffic (Midsize SUV with the average weight of 18.6 kN) reaches up to 0.6 mm and 0.15 mm, respectively. Fourth, and most importantly, the experiment demonstrated the capability of laser vibrometer for remote measurement of vibration and calculation of natural frequencies with minimal efforts. As it will be discussed later, a comparison between vibration characteristics of the intact and fractured bridge can lead to detection of fracture and other problems that occur in the interval between two measurements. Hence, the laser vibrometer provides an effective, economic, non-interruptive, and safe alternative technique for verification of the integrity of the bridge. Although, field test results can provide precious information regarding the bridge vibration under actual traffic for the intact bridge, however, finite element method is needed for comparing the vibration level of an intact and fractured bridge.
3. Numerical Simulations of the Fractured and Intact Bridge Vibration
To be able to verify the adequacy of bridge vibration in providing the energy required for self-powered sensors, as well as understanding the dynamic characteristics for two conditions of intact and fractured girder(s), a detailed finite element (FE) analysis was necessary [31]. Finite element modeling has been recognized as a reliable means for detailed analysis of steel plate girder bridges to investigate their vibration and displacement amplitude in both intact and fractured girder conditions. This method offers an efficient alternative to a differential equation and finite difference methods utilized by others [32]. Construction of a detailed FE model of the bridge and analysis under loading of various configuration could be a time-consuming and costly activity. Modeling of every detail in the bridge is neither economic nor always necessary. Additionally, solution methods available for numerical analysis of FE models are numerous and not always end to proper convergence and accurate results. Hence, the application of FE modeling and analysis can be quite complex, and finding an optimum level of refinement and modeling details, as well as proper solution method require performing some experimentation and validation. Validation can be performed by modeling and analysis of bridges that are tested and for which adequate data on the behavior is available.
In order to study the fractured bridge vibration behavior and compare the results with the field test, a similar simple span bridge with three-steel-plate girders tested at the University of Nebraska–Lincoln [33] was selected for modeling. This bridge tested in 1993 in the laboratory has similar structural details to the highway bridge subjected to field test in this study, and for which an abundance of data is available from the tests for use in validation of a FE model. It is believed that modeling of this bridge provides a good background for verification of the FE modeling method adopted for this study and comparing the vibration levels with the field test results under actual traffic loading. As a result, a detailed FE model of the bridge was developed in the environment of ABAQUS [34] and is validated using available laboratory test results including service and ultimate load testing.
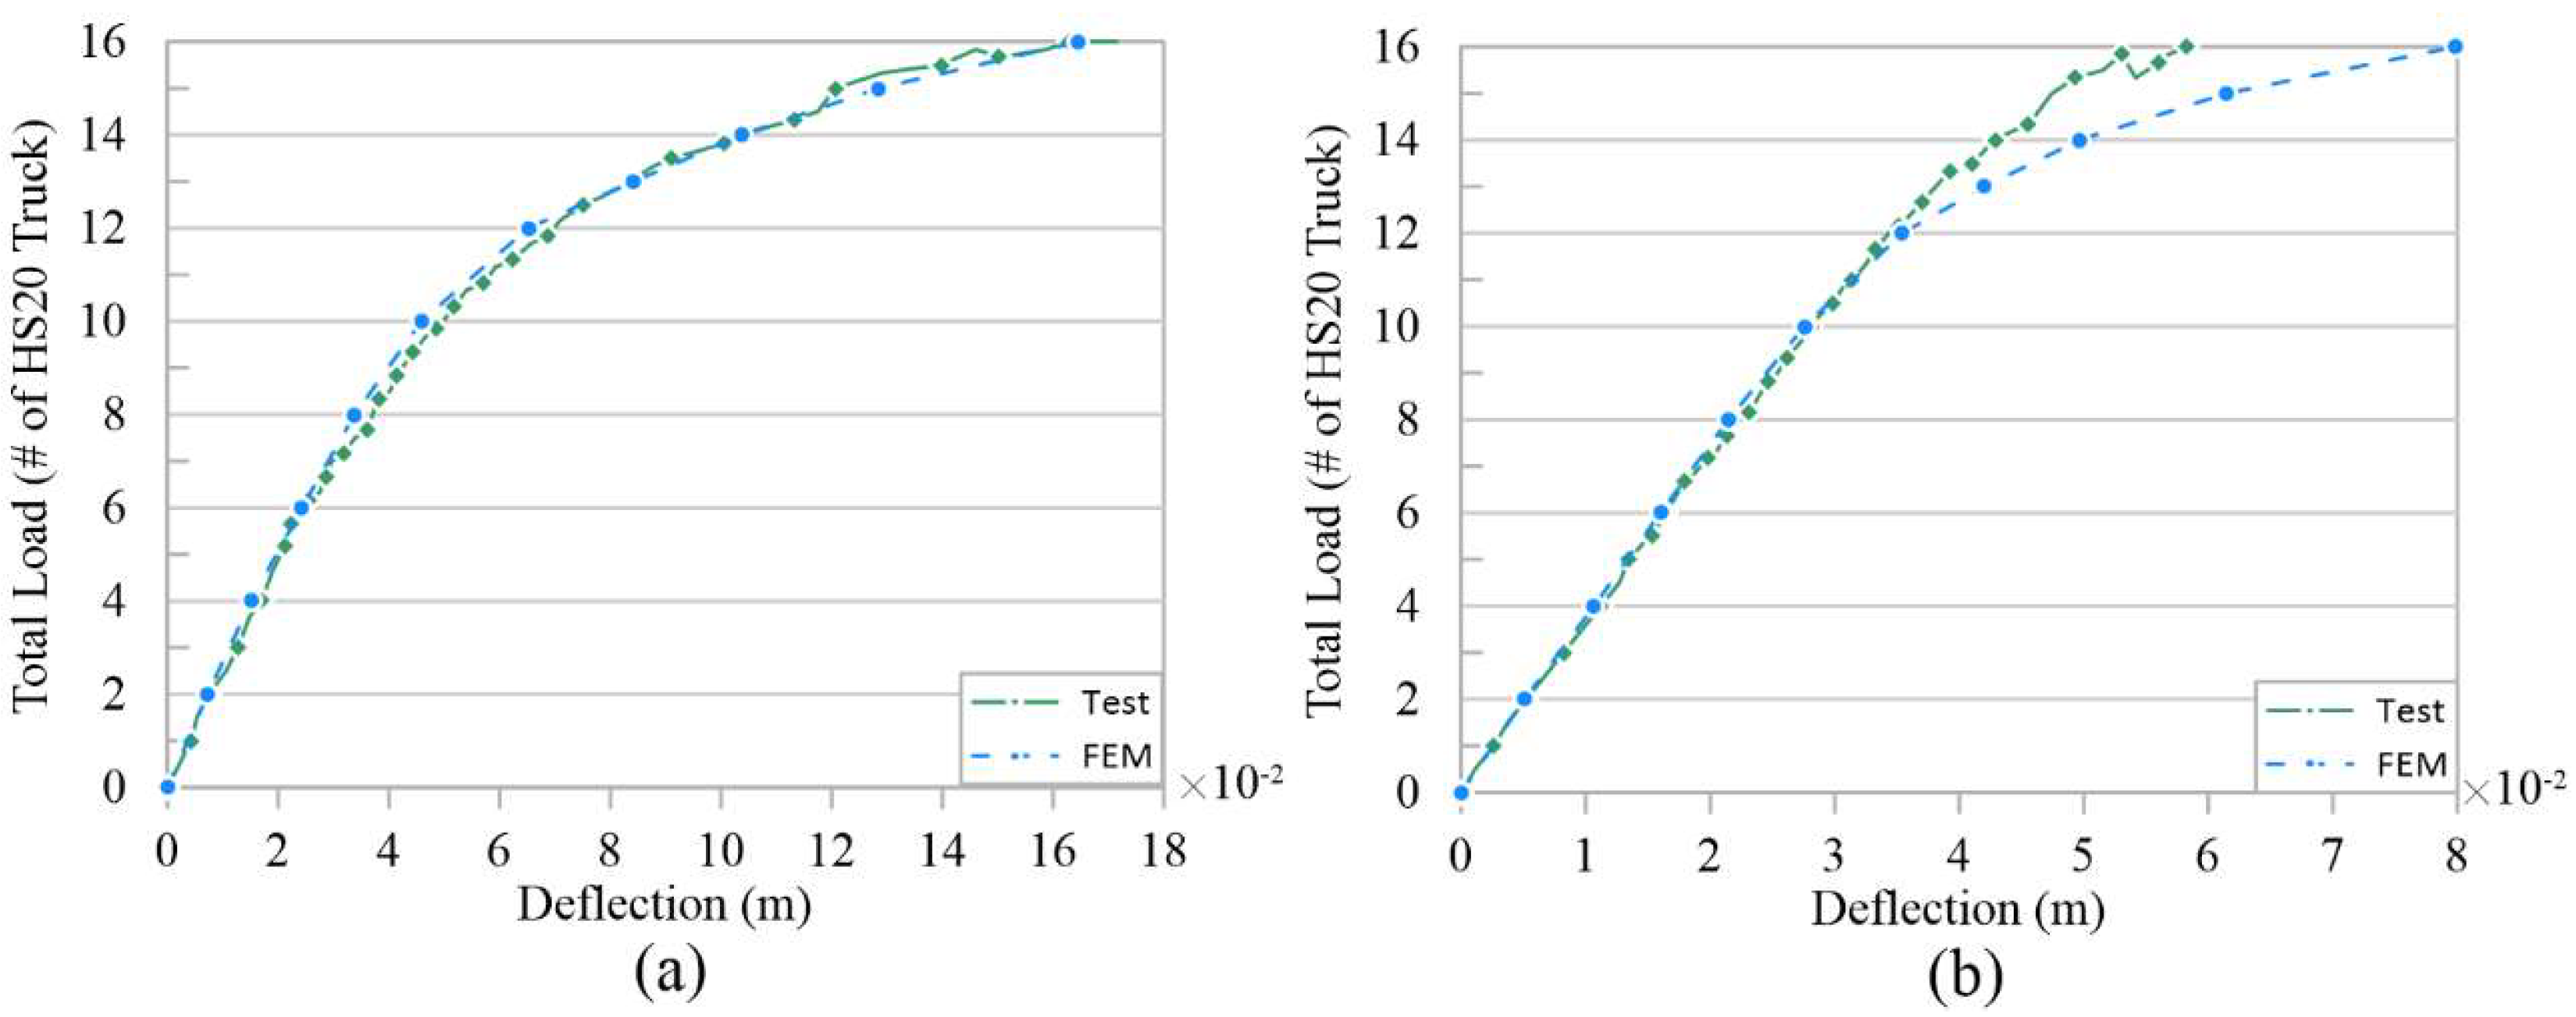
This bridge was a full-scale simple span bridge with a span length of 21.3 m (70 ft) and is 7.9 m (26 ft) wide accommodating two traffic lanes. The superstructure consists of three welded steel plate girders made composite with a 0.2 m (7 ½ in.) reinforced concrete deck as shown in Figure 4. The girders are spaced 3 m (10 ft) on center and the reinforced concrete deck has a 0.9 m (3 ft) overhang, and the railing system is a typical Nebraska Department of Road (NDOR) open concrete bridge rail with 0.3 × 0.3 m (11 × 11 in.) posts spaced 2.4 m (8 ft) on center. Several tests were conducted on this bridge to evaluate the effect of diaphragms, elastic behavior and ultimate load carrying capacity of the bridge. The ultimate test which consisted of loading the bridge (point loads in terms of simulating HS20 truck load) to collapse, was selected for validating the capability of FE modeling adopted in this study for predicting the elastic behavior and ultimate capacity and failure modes. The bridge failure in the laboratory testing was governed by local punching shear failure in the deck under the loading plates.
3.1. Finite Element Model
Multi-linear inelastic material model with isotropic hardening was used for the behavior of steel plates, diaphragms and reinforcement in both tension and compression. The linear elastic behavior was defined by the specification of the modulus of elasticity and Poisson’s ratio, which were 200,000 MPa (29,000 ksi) and 0.3, respectively. Yield and ultimate stress of steel material is considered as the typical value used in bridges. 345 MPa (50 ksi) for the steel plates and 414 MPa (60 ksi) for the concrete reinforcing bars was assumed as the yield strength of steel materials. An effective damping ratio of 3% was assumed for both steel and concrete materials. According to von Mises theory, the material yields when the equivalent stress exceeds the yield criterion. A linear elasticity with the concrete damage plasticity [35] was used for the concrete elements and for the initial elastic behavior, modulus of elasticity was calculated based on the ACI 318-14 [36] (for normal-weight concrete) and a Poisson ratio of 0.2 was used.
3.2. Finite Element Validation
For simulating the bridge behavior during construction, finite element analysis was divided into two main steps: bridge construction and final analysis for live loading. For the first step, an initial implicit static analysis was used to incorporate loading effect through the erection and construction phase when the concrete is not hardened yet and the section acts non-compositely with only the girders carrying the dead load. During the bridge construction, only the girders carry the deck, and the dead load deflections in the girders remain locked after the concrete deck hardens. For this reason, the stiffness and mass of the concrete and reinforcing rebar were reduced to a very low value during the construction phase and equivalent dead load of the deck was applied on the top flange of the girders based on the tributary area. Moreover, self-weight of the structural steel of the girder components was applied on the model at this stage. By reducing the stiffness of the deck to negligible, only girders carry the load and there will be no stress and strain on the concrete deck at the end of construction phase once the concrete deck has hardened.
The results of the first step was used as an initial predefined state for the final analysis step. In other words, initial states (stresses, strains, displacements and forces) for the final analysis step is the final state at completion of bridge construction. From this point on, the girder and slab sections act compositely together. Therefore, the initial equivalent uniform dead load of the concrete on the girders considered in the analysis for the previous step was removed and replaced by concrete with its actual stiffness and mass. The concrete damaged plasticity was also activated in this stage. Moreover, based on the construction procedure, railing elements were added at this step. At the final step, increasing loads were applied on the bridge by using the explicit dynamic solution method.
Figure 5 shows the comparison of load- deflection curves between experimental and FE results for the exterior and interior girders in the ultimate test which consisted of loading the bridge to collapse. Deflection refers to vertical displacement of the bottom flange of each (exterior or interior) girder at the mid-span and was measured using displacement transducers in the laboratory tests and calculated through analysis using finite element method (FEM) for the analytical simulation, and total load refers to point loads in terms of simulating HS20 truck load. As shown in these graphs, the FE model can predict the global behavior of the bridge during the elastic and plastic states. It was also able to simulate the local failure due to punching shear in the deck and cracking in the railing.
3.3. Dynamic Response of the Intact and Fractured Bridge
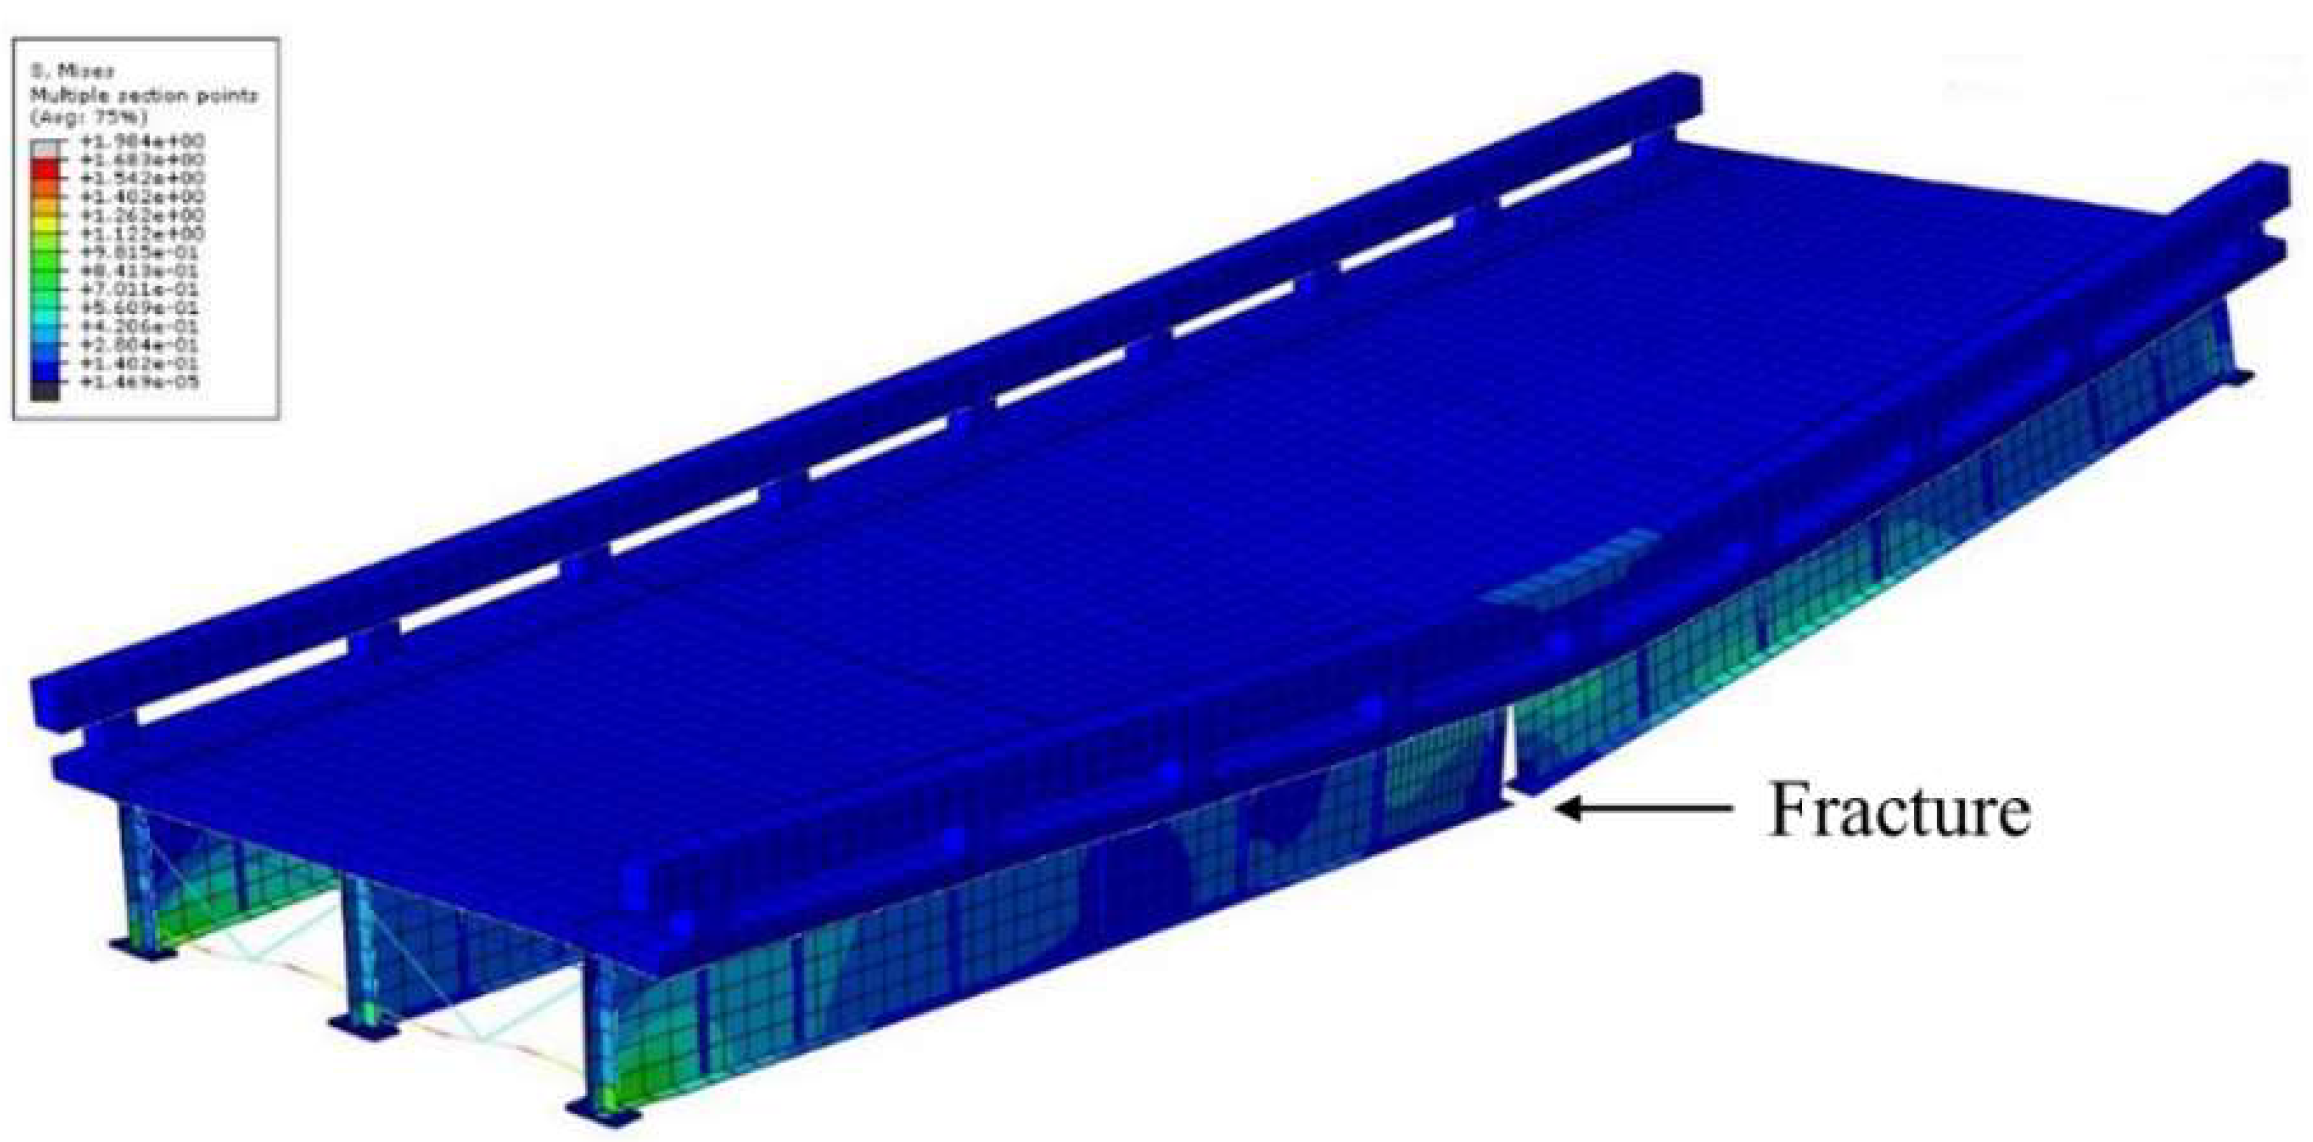
Once the FE model of the bridge was validated by comparing the results with the experimental tests, dynamic analyses were performed for the bridge in intact and fractured scenarios. These analyses used simulation of actual traffic loading to investigate the dynamic response of the bridge in these two scenarios. In the fractured scenario, one of the exterior girders was fractured through the bottom flange and web at the middle of the span to investigate the worst fractured scenario that may occur for the single span three steel plate girder bridge. The two-step analysis of the bridge construction and final analysis for live loading was conducted for the steel plate girder bridge as explained earlier. To model the sudden girder fracture, tie constraint was assigned between the elements of the girder web and flange on two sides of the fracture at the first step and was removed for the final analysis. Figure 6 shows simulation of damage (fracture of exterior girder) in the finite element model. Weigh-in-Motion (WIM) data from a station in the state of Florida collected throughout 4 years (2013–2016) was obtained from the United States Federal Highway Administration (FHWA) and was used for simulating the moving traffic loads. Truck weight data format was used as it contains information such as, but not limited to, number of axles, spacing between axles, axle weights and gross vehicle weight (GVW) and exact time of measurement for each recorded vehicle at each location.
Moving traffic load in the model was simulated by defining multiple tire contact area along the bridge only for the lane over the fractured girder (eccentric loading) and assigning amplitude intensity pattern to them based on the WIM data for a period of 60 s. Figure 7 shows the amplitude curve assigned to a one tire contact area during this 60-s time period based on the WIM data to simulate the actual traffic consisting of trucks and cars. Amplitude of one (1) on the vertical axis in this figure is equal to the average weight of heavier truck wheel over a month with the average truck weight of 205 kN (46 kips) and other amplitudes, proportioned with respect to the latter, are a representative of loading for a variety of cars and light trucks. It is worth noting that the amplitude of 0.1 in this figure is equal to the weight of Midsize SUV recorded in the field test.
4. Result and Discussion
The goal of this study was to demonstrate that dynamic characteristics of the fracture critical steel girder bridges would change significantly once a fracture occurs on one of the girders so that this variation can be used to detect the occurrence and location of the fracture, and that the frequency and displacement amplitude of the fractured bridge under the traffic load would be sufficient for feeding the continuous monitoring sensors by using energy harvesting techniques. Moreover, it was attempted to show that non-contact sensors such as laser vibrometer can be also used as an alternative method for periodic measurement of the bridge vibration with the purpose of damage detection.
A bridge with multiple steel plate girders located in downtown Miami, FL, was selected to investigate the bridge dynamic response under actual traffic for the intact scenario, and to verify that a laser vibrometer can be used for vibration data collection. Moreover, a similar bridge tested at the University of Nebraska-Lincoln was used for developing and validating the finite element model to study the bridge dynamic response for the intact and fractured scenarios. Finite element analyses were conducted using a model of this bridge under moving traffic load.
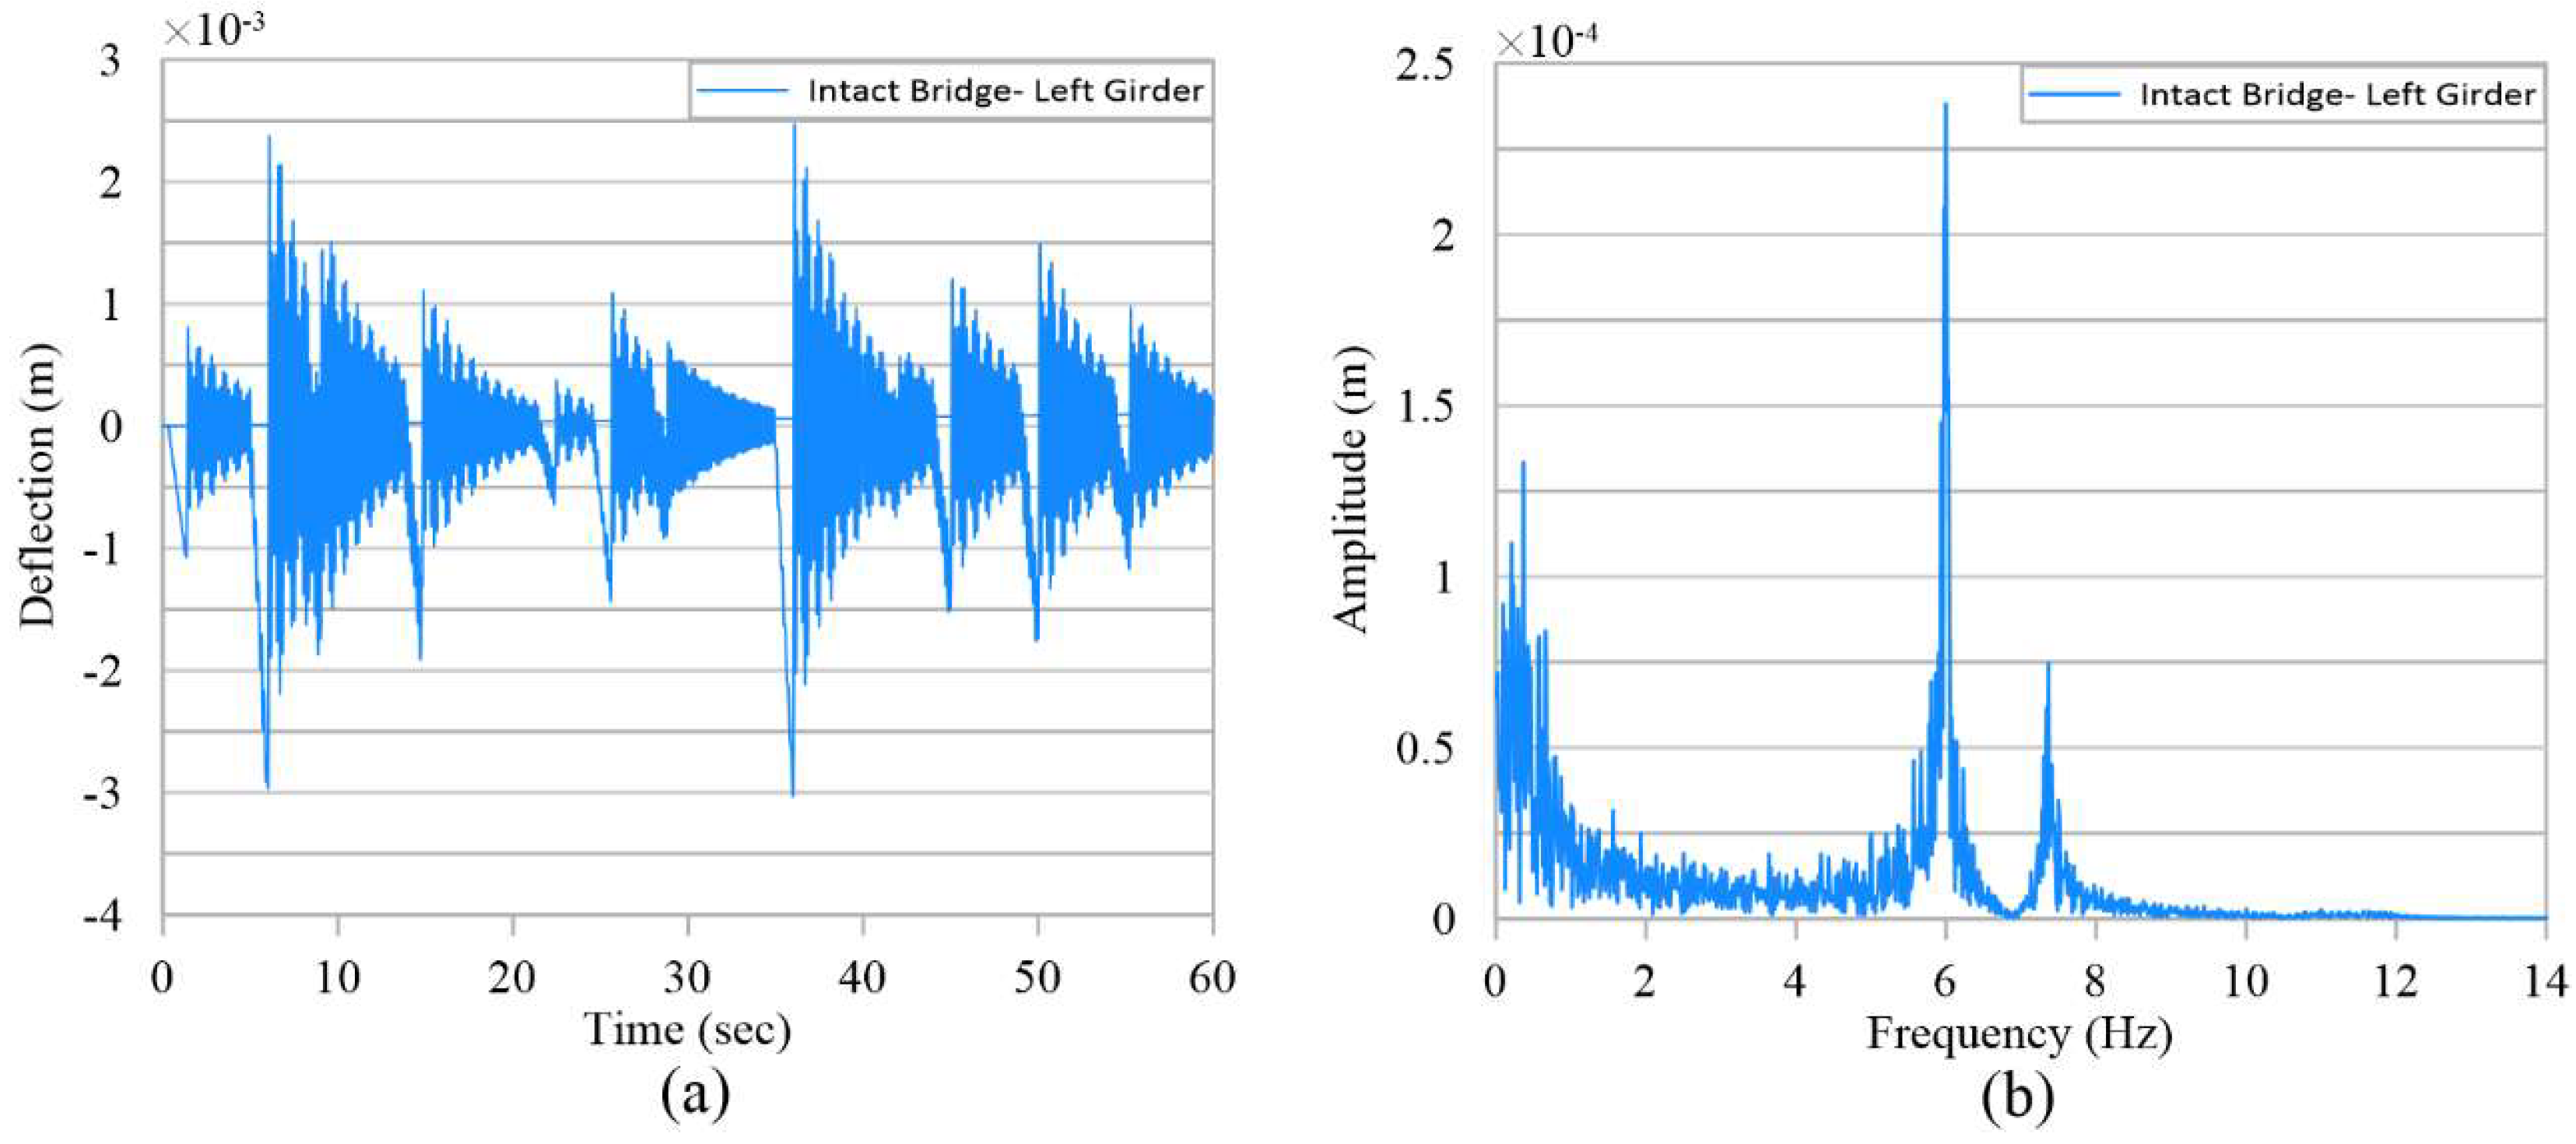
Figure 8 and Figure 9 show the time histories and frequency spectrum of girder deflection obtained from the FE model for intact and fractured scenarios at the middle of the exterior girder (fractured), respectively, under the moving traffic of 60 s duration. The simulation necessitated discretization for movement of the loads along the span. Moving a load from one point to the next is modeled by removing the load at one point and adding to the next, as it occurs in actual case with some continuity. Response of the bridge span to this moving load (one of several situated on the bridge) generates oscillations as it has also been measured in the similar bridge for actual traffic reported in this paper. It should be pointed out that, in practice, time history curves shown in these figures can be generated by instrumenting the intact bridge using several types of contacting sensors among which are strain gages, displacement transducers, and accelerometers, as well as non-contacting transducers including vision based equipment and laser vibrometers. However, bridge vibration for the fractured bridge needs to be generated using a finite element model.
Using FE analysis, the deflection at the mid-span of the exterior girder extracted from Figure 8a for the load amplitude of 0.1 (equivalent to a Midsize SUV at time 42 s in Figure 7) is determined to be a maximum of 0.56 mm and deflection of the mid-span of the exterior girder of the bridge subjected to field testing was determined under similar loading to be 0.6 mm (Figure 3c). The comparison of these two results, FE analysis and field testing, that are in the same order of magnitude validates two important inferences. First, the FE model has the ability to simulate the bridge dynamic responses with acceptable accuracy, and secondly, the results obtained in this study provides the order of magnitude for vibration of the bridge under service load. The latter will be used in this paper to verify the sufficiency of the vibration amplitudes in providing the required energy for self-powered sensors.
The time history results show that the vibration amplitude of the girder at the middle of the span has almost doubled and at quarter points increased in average about 60% under normal traffic load because of the fracture. Therefore, a threshold can be predefined for the girder bridge deflection amplitude, crossing which would be an indication of fracture in the girder. Furthermore, the results in frequency domain indicate two major changes after the fracture has occurred. One is a major shift in the fundamental/dominant mode vibration frequency of the bridge, and the other is a significant increase in the amplitude of the vibration. The major peak in the frequency spectra can be used to determine the frequency and its amplitude. For the intact condition, the frequency stands at 6 Hz with amplitude of 2.35 × 10⁻⁴ m. For the fractured condition, this frequency has shifted lower to 5 Hz with an increased amplitude of 7.15 × 10⁻⁴ m. This shift in dominant frequency and increase in amplitude can be exploited for signaling occurrence of a major event, in this case, fracture of the girder. In a continuous monitoring system, a safe buffer zone can be established and specified for the dominant modal frequency and amplitude based on expected minor variation in the frequency due to ambient effects. If the monitoring system indicates that the dominant frequency has fallen outside this buffer zone and/or amplitude of vibration has increased beyond the threshold, it will be indicative of a significant event, i.e., girder fracture.
4.1. Strains under Moving Traffic
To investigate the strain variation of the steel plate girders resulted from fracture of a girder, time histories of girders’ longitudinal strain were calculated through analysis using finite element method (FEM) for mid-and quarter-span along the bridge for the bottom flange. The strain record corresponding to the middle of the span for all three girders are presented in Figure 10. The strain results clearly show highly noticeable changes in the response of all girders for fractured scenario. The strains in the left girder (fractured) show the highest drop in the fractured scenario. This is indicative of presence of fracture in this girder where the strain near the fracture would relax because of significant reduction in stiffness and load distribution to other girders. As expected, the middle girder shows increase in the strain indicating absorbing some of the load from the fractured girder. The right girder shows the least of variation in strain. This pattern is indicative of firstly the occurrence of the fracture and secondly the girder and the location where the fracture is.
Table 1 summarize the test results for all three girders in different scenarios and in two locations along each girder; middle and quarter point. This table shows average of peaks in strain records shown in Figure 10. A pattern similar to that described above for strain changes can be seen in Table 1. Along the same girder, changes in the strains varies depending on the proximity of the measurement point to the fracture zone. Percentage of strain drop for location closer to the fracture is higher than farther points. Again providing valuable data on the occurrence and location of the fracture.
4.2. Adequacy of Vibration Energy for Powering Sensors
The results of the finite element analysis were also reviewed to investigate the feasibility of using self-powered wireless sensors for continuous monitoring of steel plate girder bridges for detection of fracture. Sazonov et al. [37] in their study demonstrated self-power operation of the bridge sensor in a short-term field test. Before application of the self-powered sensors, the vibration of girders was measured at 1/3 of the span length (Figure 11). As seen in this figure, the dominant displacement peaks are mostly below 1 mm. A simple electromagnetic energy harvester with a displacement mass of 0.09 kg was designed by Sazanov et al. [37] for harvesting energy of up to 12.5 mW at 10 mm displacement amplitude in the resonant mode with the frequency of excitation at 3.1 Hz (estimated first mode vibration frequency of the bridge). This generator could deliver up to 1 mW at a low amplitude of 3 mm, which is sufficient for trickle charging of storage.
These sensors were installed on one of the girders of a simple three span steel plate girder bridge and a linear electromagnetic generator was used to harvest vibration energy created by the passing traffic. The sensors were able to transmit between 25 and 480 measurements per day, average of 1 to 20 per hour, depending on the volume of daily traffic, which indicates the feasibility of self-powered operation for long-term monitoring of a rural highway bridge with low traffic volume. Better results are expected from roads with heavier traffic.
Comparing these results with those obtained from FE analysis (Figure 8 and Figure 9) and field test conducted in this study show that the vibration amplitude in the intact and fractured girders in this study is comparable and similar range to the results reported by Sazanov et al. [37]. Therefore, the results indicate the feasibility of designing electromagnetic generators (or a similar energy harvesting system) that could feed the monitoring sensors for detection of fracture in steel girders.
5. Conclusions
The successful use of the non-contact laser vibrometer for field testing demonstrated that this remote sensing method can be used effectively, economically, rapidly, and with no interruption to traffic for vibration measurement of the bridge girders and producing data required for detection of fracture or other damages in the bridge girder. Comparison between the vibration level of FE model for the intact bridge and the field test results shows that FE model can predict similar dynamic responses. The time history results from analysis of the intact bridge and bridge with one fractured girder showed that the vibration amplitude of the fractured girder at the middle of the span was almost doubled, and at quarter points increased in average about 160% under normal traffic load because of the fracture. Therefore, a threshold can be predefined for the girder bridge deflection amplitude, crossing which would be an indication of fracture in the girder. The results also showed that the shift in dominant frequency recorded for the bridge and increase in its amplitude can be exploited for signaling occurrence of a major event, in this case, fracture of the girder. In a continuous monitoring system, a safe buffer zone can be established and specified for the dominant modal frequency and variation in vibration amplitude based on expected minor variations due to ambient effects. If the monitoring system indicates that the dominant frequency and vibration amplitude has fallen outside this buffer zone, it will be indicative of a significant event, i.e., girder fracture.
When strain records for the bridge under moving traffic were compared for intact and one girder fractured scenarios, the results clearly demonstrated highly noticeable changes in the response of all girders for fractured scenario. The strains in the fractured girder showed the highest drop in the fractured scenario. This is indicative of presence of a fracture in this girder where the strain near the fracture would relax due to the significant reduction in stiffness and load distribution to other girders. As expected, the middle girder showed an increase in the strain indicating absorbing some of the load from the fractured girder. The right girder shows the least of variation in strain. This pattern can be used as indication of the occurrence of the fracture and determining the girder and location where the fracture is.
Comparing the time histories and frequency spectrum of girder displacement obtained from this study with the results of the field experiment conducted by others for investigating the energy required for harvesting techniques showed the feasibility of using self-powered wireless sensors for monitoring steel bridges for their fracture. The test results indicate that the amount of energy available for self-powered sensors depends on the sensor location along the span, and that the displacement amplitude and frequency are sufficient for energy harvesting in the middle of the simple span bridges.
A very important conclusion drawn from the FE analysis is that the self-powered sensors that may be dormant for the intact bridge for a long period of time (because of lower vibration amplitudes) can start monitoring once the bridge is fractured (with higher vibration amplitudes), and can send a warning to the owner for taking proper action. In summary, the results show a great potential for the use of non-contact laser vibrometer as well as self-powered wireless sensors for structural health monitoring (SHM) of fracture critical steel girder bridges with accuracy and economy as an alternative to detailed and costly inspection.
Author Contributions
Conceptualization, M.A. and A.B.M.; methodology, M.A. and A.B.M.; validation, M.A.; formal analysis, M.A.; investigation, M.A. and A.B.M.; resources, M.A. and A.B.M.; data curation, M.A; writing—Original draft preparation, M.A.; writing—Review and editing, A.B.M.; visualization, M.A.; supervision, A.B.M.
Funding
This research received no external funding.
Acknowledgments
The authors greatly acknowledge the internal support by the Department of Civil and Environmental Engineering at Florida International University. The contents of this paper reflect the views of the authors, who are responsible for the facts and the accuracy of the information presented herein.
Conflicts of Interest
The authors declare no conflict of interest.
References
- The American Association of State Highway Transportation Officials (AASHTO). AASHTO LRFD Bridge Design Specifications, 7th ed.; American Association of State Highway and Transportation Officials: Washington, DC, USA, 2012; ISBN 9781560515234. [Google Scholar]
- Yu, J.; Ziehl, P.; Zrate, B.; Caicedo, J. Prediction of fatigue crack growth in steel bridge components using acoustic emission. J. Constr. Steel Res. 2011, 67, 1254–1260. [Google Scholar] [CrossRef]
- Fisher, J.W.; Menzemer, C.C. Fatigue cracking in welded steel bridges. Transp. Res. Rec. 1990, 1282, 111–117. [Google Scholar]
- Connor, R.J.; Martín, B.; Francisco, J.; Varma, A.; Lai, Z.; Korkmaz, C. Fracture-Critical System Analysis for Steel Bridges; Transportation Research Board: Washington, DC, USA, 2018. [Google Scholar]
- Hebdon, M.H.; Singh, J.; Connor, R.J. Redundancy and Fracture Resilience of Built-Up Steel Girders. In Proceedings of the Structures Congress 2017, Denver, CO, USA, 6–8 April 2017; pp. 162–174. [Google Scholar]
- Shirani, N.; Doustmohammadi, M.; Haleem, K.; Anderson, M. Safety Investigation of Nonmotorized Crashes in the City of Huntsville, Alabama, Using Count Regression Models. In Proceedings of the Transportation Research Board 97th Annual Meeting, Washington, DC, USA, 7–11 January 2018. [Google Scholar]
- Li, B.; Ou, J. Optimal sensor placement for structural health monitoring based on K-L divergence. In Proceedings of the Safety, Reliability, Risk and Life-Cycle Performance of Structures and Infrastructures, New York, NY, USA, 16–20 June 2013; Volume 20, pp. 2535–2542. [Google Scholar]
- Yuen, K.; Kuok, S. Efficient Bayesian sensor placement algorithm for structural identification: A general approach for multi-type sensory systems. Earthq. Eng. Struct. Dyn. 2015, 44, 757–774. [Google Scholar] [CrossRef]
- Huang, H.B.; Yi, T.H.; Li, H.N. Canonical correlation analysis based fault diagnosis method for structural monitoring sensor networks. Smart Struct. Syst. 2016, 17, 1031–1053. [Google Scholar] [CrossRef]
- Sohn, H. Noncontact laser sensing technology for structural health monitoring and nondestructive testing (presentation video). In Proceedings of the Bioinspiration, Biomimetics, and Bioreplication 2014, San Diego, CA, USA, 10–12 March 2014; International Society for Optics and Photonics: Bellingham, WA, USA, 2014; Volume 9055, p. 90550W. [Google Scholar]
- Ebrahimkhanlou, A.; Salamone, S.; Ebrahimkhanlou, A.; Ghiami Azad, A.R.; Kreitman, K.; Helwig, T.; Williamson, E.; Engelhardt, M. Acoustic emission monitoring of strengthened steel bridges: Inferring the mechanical behavior of post-installed shear connectors. In Nondestructive Characterization and Monitoring of Advanced Materials, Aerospace, Civil Infrastructure, and Transportation XIII; International Society for Optics and Photonics: Bellingham, WA, USA, 2019. [Google Scholar]
- Antunes, P.; Lima, H.; Varum, H.; André, P. Optical fiber sensors for static and dynamic health monitoring of civil engineering infrastructures: Abode wall case study. Measurement 2012, 45, 1695–1705. [Google Scholar] [CrossRef]
- Ding, Y.-L.; Zhao, H.-W.; Li, A.-Q. Temperature effects on strain influence lines and dynamic load factors in a steel-truss arch railway bridge using adaptive FIR filtering. J. Perform. Constr. Facil. 2017, 31, 4017024. [Google Scholar] [CrossRef]
- Moschas, F.; Stiros, S. Noise characteristics of high-frequency, short-duration GPS records from analysis of identical, collocated instruments. Measurement 2013, 46, 1488–1506. [Google Scholar] [CrossRef]
- Masouleh, M.S.; Kaddour, A.-S.; Georgakopoulos, S. Recent Advances in Wireless Systems for Simultaneous Power and Data Transfer. In Proceedings of the 2019 International Applied Computational Electromagnetics Society Symposium (ACES), Miami, FL, USA, 14–19 April 2019; pp. 1–2. [Google Scholar]
- Khakpour, I.; Rabiei Baboukani, A.; Allagui, A.; Wang, C. Bipolar Exfoliation and In-situ Deposition of High-Quality Graphene for Supercapacitor Application. ACS Appl. Energy Mater. 2019. [Google Scholar] [CrossRef]
- Baboukani, A.R.; Khakpour, I.; Adelowo, E.; Drozd, V.; Wang, C. Red Phosphorous-Span Composite Anode through Electrostatic Spray Deposition for High Performance Lithium-Ion Batteries. In Meeting Abstracts; The Electrochemical Society: Pennington, NJ, USA, 2019; p. 304. [Google Scholar]
- Elvin, N.G.; Lajnef, N.; Elvin, A.A. Feasibility of structural monitoring with vibration powered sensors. Smart Mater. Struct. 2006, 15, 977. [Google Scholar] [CrossRef]
- Peigney, M.; Siegert, D. Piezoelectric energy harvesting from traffic-induced bridge vibrations. Smart Mater. Struct. 2013, 22, 95019. [Google Scholar] [CrossRef] [Green Version]
- McCullagh, J.J.; Galchev, T.; Peterson, R.L.; Gordenker, R.; Zhang, Y.; Lynch, J.; Najafi, K. Long-term testing of a vibration harvesting system for the structural health monitoring of bridges. Sens. Actuators A Phys. 2014, 217, 139–150. [Google Scholar] [CrossRef]
- Aono, K.; Hasni, H.; Pochettino, O.; Lajnef, N.; Chakrabartty, S. Quasi-Self-Powered Piezo-Floating-Gate Sensing Technology for Continuous Monitoring of Large-Scale Bridges. Front. Built Environ. 2019, 5, 29. [Google Scholar] [CrossRef]
- Alavi, A.H.; Hasni, H.; Jiao, P.; Borchani, W.; Lajnef, N. Fatigue cracking detection in steel bridge girders through a self-powered sensing concept. J. Constr. Steel Res. 2017, 128, 19–38. [Google Scholar] [CrossRef]
- Chatti, K.; Faridazar, F.; Hasni, H.; Lajnef, N.; Alavi, A.H. An intelligent structural damage detection approach based on self-powered wireless sensor data. Autom. Constr. 2015, 62, 24–44. [Google Scholar]
- Laefer, D.F.; Truong-Hong, L.; Carr, H.; Singh, M. Crack detection limits in unit based masonry with terrestrial laser scanning. Ndt E Int. 2014, 62, 66–76. [Google Scholar] [CrossRef] [Green Version]
- Berényi, A.; Lovas, T.; Barsi, Á.; Dunai, L. Potential of terrestrial laserscanning in load test measurements of bridges. Period. Polytech. Civ. Eng. 2009, 53, 25–33. [Google Scholar] [CrossRef]
- Anigacz, W.; Beben, D.; Kwiatkowski, J. Displacements monitoring of suspension bridge using geodetic techniques. In International Conference on Experimental Vibration Analysis for Civil Engineering Structures; Springer: Cham, Switzerland, 2017; pp. 331–342. [Google Scholar]
- Dei, D.; Pieraccini, M.; Fratini, M.; Atzeni, C.; Bartoli, G. Detection of vertical bending and torsional movements of a bridge using a coherent radar. Ndt E Int. 2009, 42, 741–747. [Google Scholar] [CrossRef]
- Pieraccini, M.; Fratini, M.; Parrini, F.; Atzeni, C.; Bartoli, G. Interferometric radar vs. accelerometer for dynamic monitoring of large structures: An experimental comparison. Ndt E Int. 2008, 41, 258–264. [Google Scholar] [CrossRef]
- Pieraccini, M.; Miccinesi, L. An Interferometric MIMO Radar for Bridge Monitoring. IEEE Geosci. Remote Sens. Lett. 2019. [Google Scholar] [CrossRef]
- Mehrabi, A.B.; Farhangdoust, S. A Laser-Based Noncontact Vibration Technique for Health Monitoring of Structural Cables: Background, Success, and New Developments. Adv. Acoust. Vib. 2018, 2018, 8640674. [Google Scholar] [CrossRef]
- Abedin, M.; Farhangdoust, S.; Mehrabi, A.B. Fracture detection in steel girder bridges using self-powered wireless sensors. In Proceedings of the 10th New York City Bridge Conference, New York, NY, USA, 26–27 August 2019. [Google Scholar]
- Farhangdoust, S.; Mehrabi, A.; Younesian, D. Bistable wind-induced vibration energy harvester for self-powered wireless sensors in smart bridge monitoring systems. In Nondestructive Characterization and Monitoring of Advanced Materials, Aerospace, Civil Infrastructure, and Transportation XIII; International Society for Optics and Photonics: Bellingham, WA, USA, 2019; Volume 10971, p. 109710C. [Google Scholar]
- Kathol, S.; Azizinamini, A.; Luedke, J. Strength Capacity of Steel Girder Bridges. Final Report; Transportation Research Board: Washington, DC, USA, 1995. [Google Scholar]
- Dassault ABAQUS Documentation. ABAQUS/CAE Doc.; Simulia: Providence, RI, USA, 2016. [Google Scholar]
- Lubliner, J.; Oliver, J.; Oller, S.; Onate, E. A plastic-damage model for concrete. Int. J. Solids Struct. 1989, 25, 299–326. [Google Scholar] [CrossRef]
- American Concrete Institute. Building Code Requirements for Structural Concrete (ACI 318–14) and Commentary (ACI 318R–14); American Concrete Institute: Farmington Hills, MI, USA, 2014. [Google Scholar]
- Sazonov, E.; Li, H.; Curry, D.; Pillay, P. Self-powered sensors for monitoring of highway bridges. IEEE Sens. J. 2009, 9, 1422–1429. [Google Scholar] [CrossRef]
Figure 1.
Side view of the I-95 NB to SE 1st Ave. highway bridge in downtown Miami, FL.

Figure 2.
The Laser vibrometer used in the field measurement.

Figure 3.
Time series and frequency spectrum of girder displacement and velocity. (a,c,e) Interior girder at mid-span. (b,d,f) Interior girder at quarter span.
Figure 3.
Time series and frequency spectrum of girder displacement and velocity. (a,c,e) Interior girder at mid-span. (b,d,f) Interior girder at quarter span.

Figure 4.
Cross section of the University of Nebraska-Lincoln Multiple Plate Girder Bridge. (All dimensions are in mm).
Figure 4.
Cross section of the University of Nebraska-Lincoln Multiple Plate Girder Bridge. (All dimensions are in mm).

Figure 5.
Comparison of load-deflection curves obtained from experiment and finite element (FE) model. (a) Interior Girder and (b) Exterior Girder.
Figure 5.
Comparison of load-deflection curves obtained from experiment and finite element (FE) model. (a) Interior Girder and (b) Exterior Girder.

Figure 6.
Simulation of damage (fracture of exterior girder) in the finite element model.

Figure 7.
Load amplitude curve of the moving traffic load.

Figure 8.
Intact Bridge. (a)Time histories and (b) frequency spectrum of girder deflection at the middle of exterior girder.
Figure 8.
Intact Bridge. (a)Time histories and (b) frequency spectrum of girder deflection at the middle of exterior girder.

Figure 9.
Bridge with Fractured Girder. (a) Time histories and (b) frequency spectrum of girder deflection at the middle of exterior girder (fractured).
Figure 9.
Bridge with Fractured Girder. (a) Time histories and (b) frequency spectrum of girder deflection at the middle of exterior girder (fractured).

Figure 10.
Time histories of girders strain. (a–c) Intact Bridge and (d–f) Fractured Bridge.

Figure 11.
(a) Time history and (b) frequency spectrum of girder displacement obtained from the study by Sazonov et al. [37].
Figure 11.
(a) Time history and (b) frequency spectrum of girder displacement obtained from the study by Sazonov et al. [37].


Table 1.
Summary of the test results.
| Average Peak Strain | Average Peak Deflection | |||||||||||
|---|---|---|---|---|---|---|---|---|---|---|---|---|
| mm/mm × 10−6 | mm | |||||||||||
| Quarter-Span | Mid-Span | Quarter-Span | Mid-Span | |||||||||
| L | M | R | L | M | R | L | M | R | L | M | R | |
| Intact Bridge | 6.0 | 5.5 | 4.6 | 8.6 | 8.1 | 7.3 | 0.9 | 0.7 | 0.8 | 1.6 | 1.1 | 0.9 |
| Fractured Bridge | 5.8 | 7.1 | 5.7 | 0.2 | 11.6 | 6.0 | 1.5 | 1.0 | 0.6 | 3.0 | 1.3 | 0.8 |
Note: L = Left Girder; M = Middle Girder; R = Right Girder.
© 2019 by the authors. Licensee MDPI, Basel, Switzerland. This article is an open access article distributed under the terms and conditions of the Creative Commons Attribution (CC BY) license (http://creativecommons.org/licenses/by/4.0/).
Share and Cite
MDPI and ACS Style
Abedin, M.; Mehrabi, A.B. Novel Approaches for Fracture Detection in Steel Girder Bridges. Infrastructures 2019, 4, 42. https://0-doi-org.brum.beds.ac.uk/10.3390/infrastructures4030042
AMA Style
Abedin M, Mehrabi AB. Novel Approaches for Fracture Detection in Steel Girder Bridges. Infrastructures. 2019; 4(3):42. https://0-doi-org.brum.beds.ac.uk/10.3390/infrastructures4030042
Chicago/Turabian StyleAbedin, Mohammad, and Armin B. Mehrabi. 2019. "Novel Approaches for Fracture Detection in Steel Girder Bridges" Infrastructures 4, no. 3: 42. https://0-doi-org.brum.beds.ac.uk/10.3390/infrastructures4030042