Article

From Theory to Field Evidence: Observations on the Evolution of the Settlements of an Earthfill Dam, over Long Time Scales

by
Stella Pytharouli
1,*,
Panagiotis Michalis
1,2 and
Spyridon Raftopoulos
3
1
Department of Civil and Environmental Engineering, University of Strathclyde, Glasgow G1 1XJ, UK
2
School of Engineering, University of Glasgow, Glasgow G12 8LT, UK
3
Power Public Corporation, Athens 104 36, Greece
*
Author to whom correspondence should be addressed.
Submission received: 3 September 2019 / Revised: 11 October 2019 / Accepted: 15 October 2019 / Published: 23 October 2019
(This article belongs to the Special Issue Advances in Dam Engineering)

Abstract

:
Unprecedented flooding events put dams and downstream communities at risk, as evidenced by the recent cases of the Oroville and Whaley bridge dams. Empirical models may describe expected ‘normal’ dam behaviour, but they do not account for changes due to recurring extreme weather events. Numerical modelling provides insights into this, but results are affected by the chosen material properties. Long-term field monitoring data can help with understanding the mechanical behaviour of earthfill dams and how this is affected by the environment over decades. We analyse the recorded settlements for one of the largest earthfill dams in Europe. We compare the evolution of these settlements to the reservoir level, rainfall, and the occurrence of earthquakes for a period of 31 years after first impoundment. We find that the clay core responds to the reservoir fluctuations with an increasing (from 0 to 6 months) time delay. This is the first time that a change in the behaviour of a central clay core dam, as observed from field data, is reported in the international literature. Seepage rates, as recorded within the drainage galleries, are directly affected by cumulative rainfall depths exceeding 67 mm per fortnight.

Graphical Abstract

1. Introduction

Recent cases of dam failures or near failures, e.g., the Oroville dam (2017) and Whaley bridge dam (2019), highlighted the fact that disruptive dam incidents, even when the structures remain safe, are the cause of cascading effects to other types of critical infrastructure [1]. This leads to substantial direct and indirect costs for asset owners, insurers, and maintainers, and significant disruption to civil society. Research on dams is crucial and timely, the main reasons for which are listed below:
  • Increasing population of ageing dams: According to the International Commission on Large Dams (ICOLD), worldwide, there are more than 58,000 registered large (with heights greater than 15 m) dams. However, there also exist thousands of smaller dams that are currently unregistered, which are usually not subject to proper maintenance and monitoring regimes. The European Environmental Agency (EEA) currently estimates that there exist over 7000 large dams in Europe, with thousands more planned to be constructed during the next decade. According to the National Inventory of Dams (NID) in the US, there are also in total 90,580 dams. The 2017 infrastructure report card published by the American Society of Civil Engineers (ASCE) estimates that the average age of existing dams in the US is 56 years old, and that by 2025, 70% of the existing dam infrastructure will exceed their ‘useful’ design lifespan. The number of high hazard dams is also on the rise, and currently accounts for almost 17%, while more than 2000 dams are listed as structurally deficient, requiring a repair investment of nearly $45 billion [2]. The vast majority of dam infrastructure worldwide was constructed during the period 1950–1970; therefore, higher failure rates are anticipated in these dams due to the lower quality design and construction methods. Investigating the time evolution of the response of ageing dams informs the early evaluation of risk and can help direct any necessary interventions.
  • Extreme climatic conditions: Recent climate change projections [3,4] indicate that the frequency of shifting weather events will substantially increase, and severe flooding incidents are anticipated to double in Europe by 2050 [5]. Extreme variations in seasonal rainfall patterns are expected to affect dam infrastructure [6], with an increasing magnitude of degradation processes related to the depth of rainfall infiltration inside the dam body, the increase in the fill’s saturation level, and changes in the shear strength and pore water pressure within saturated fill layers. For embankment dams, the hydrostatic pressure induced by flooding and the high permeability of the soil caused by desiccation can result in uncontrolled internal seepage [7]. Modern climatic conditions are expected to significantly affect the structural integrity of hydro-infrastructure due to the high potential of extreme drought and flood events, as evidenced by the incidents of Oroville dam (US) during February 2017 and the Whaley bridge dam (UK) in July 2019. Another main issue arises from the fact that past and existing methods that incorporate the risk of climatic hazards into dam design and assessment methods are based on historical records. This indicates that they do not capture both the current and projected significant climatic variability; therefore, ageing dam infrastructure is expected to be put under stress. Studying the effect that any deviations from historical precipitation records have on existing dams is crucial for the transition towards resilient infrastructure.
  • Gap in the knowledge about the long-term behaviour of dams: Relationships and models describing the short and long-term behaviour of dams are based on empirical equations. Such models are limited at times, as dams of similar size and type can behave differently, albeit still within safety limits. These empirical models, developed as far back as 30 years ago, are not incorporating the changing environmental conditions. As a result, investigating the behaviour of dams over long time scales can assist mitigate potential failures due to ageing and their (in) direct impact.
With the advances in computational power, numerical modelling has been used to assess and even predict the mechanical behaviour of dams. In the case of earthfill and rockfill dams, numerical modeling is particularly challenging. The success of a numerical model depends on the chosen material properties for the dam, which might or might not be correct. In situ material properties, such as hydraulic conductivity, which greatly influence numerical results, e.g., for pore pressures within the dam, can sometimes be significantly different to those obtained from lab tests. As a result, a numerical model that uses lab values could yield, for example, different results for the pore pressure inside the dam to those in reality.
Monitoring is an important tool in the assessment of the ongoing performance of earthfill/rockfill dams, which are currently considered the most well-instrumented infrastructures. It can provide information on the geometry changes of the dam body (geodetic monitoring) as well as changes within the dam body (geotechnical monitoring). The challenge is accessing these monitoring records, which in many cases are considered confidential. This is one of the reasons that studies based on real, long-term field dam monitoring data are sparse, e.g., [8], and predictions on the long-term behaviour of these structures are based either on empirical models, or in most cases, on numerical modelling.
In concrete dams, displacements are generally better described and occur at a definite rate, usually originated by degradation factors, such as temperature and water level variations [9,10]. Hydrostatic–Season–Time models are commonly used to describe the deformations of concrete dams [11]. These models have recently been modified and applied to earthfill dams [12,13,14]. The deformation rates are significantly higher for earthfill and rockfill dams and reach maximum values during or immediately after construction and first impoundment of the reservoir [8,15]. This makes the probability of a dam failure significantly higher during the first years of its operation [16]. The failure risk is estimated to be substantially decreased in the long-term for mature earthfill dam structures [9]; however, this does not take into account dams subjected to extreme flooding, for example, in an annual or biannual cycle, which is a situation that has become more and more frequent lately [4].
The deformation rates of earthfill and rockfill dams are affected by many factors, including internal erosion, slope stability, secondary consolidation of the core, the creep of shoulder fill, and stress changes due to varying reservoir water levels and seismic activity [17].
The relationship between the reservoir level fluctuations and the deformation patterns of earthfill dams has been the focus of a number of studies, e.g., [17,18,19,20]. A decrease of the reservoir level is followed by a decrease of vertical stresses and higher settlement rates, and as a result, a rapid drawdown could potentially result in slope instabilities due to the heave of the upstream slope. A decrease of lateral pressure due to the lower hydraulic head results in consolidation, horizontal movement, and time-dependent settlement. In the case of re-filling, the lateral pressure imposed by the water causes the heave of the core as it is deformed towards the downstream fill [17].
Empirical models have been employed to evaluate the deformation patterns of earthfill dams. Ref. [21] suggested the settlement index (SI) as presented below in Equation (1):
S I = s 1000 × H × log ( t 2 t 1 )
where s (mm) is the crest settlement between two different measurement periods t1 and t2 at each control point located at a height H (m) from the foundation level. In case the value of the dimensionless parameter SI is greater than 0.02, the crest settlement is attributed to mechanisms other than creep, requiring further investigation to be conducted [17].
The study by [19] indicated the relationship between environmental parameters and the deformation rates of the earthfill, with central core Kremasta dam in Greece. The authors concluded that the critical values of the settlement index are exceeded when the reservoir level is above a specific threshold value, and both the rate of change for the reservoir level and the precipitation exceeded 1 m/month and 130 mm/month, respectively.
Ref. [22] examined the behaviour of 15 rockfill dams and suggested the annual rate of settlement (Sa) as a percentage of the dam height to assess the deformations of the crest, as presented in Equation (2):
S a = ( S ii S i H ) × 100
where Sii and Si are consecutive yearly settlement measurements, and H is the height from the foundation level at each crest control point. The study concluded that when the (Sa) is equal or less than 0.02% of the height of the dam, the deformations were regarded as normal, and the dam was considered stabilised, with the stabilisation period varying from 24 to 30 months. However, other studies e.g., [8,23], indicated that the dam structural integrity is not necessarily at risk if the stabilisation period is not within the period suggested by [22], as dams of a similar size and type can behave differently and still operate within safety limits.
In this paper, we use a unique monitoring record consisting of the vertical movements of 32 control stations established on the crest and downstream shoulder of a central clay core earthfill dam. Our preliminary work on the same dam [8] has shown that there are no concerns regarding its structural integrity. This made the dam a favourable case study in our effort to better understand the response of earthfill dams with central clay cores to environmental factors such as reservoir level, rainfall, and earthquakes. Our methodology is based solely on field observations (geodetic measurements, reservoir level, rainfall depth, hydraulic head within the dam, seepage rates), and we focus on the time period starting at the end of the first filling and spanning for 31 years. The period between the end of construction and the first filling is not examined here, as it is outside the scope of this paper, which focusses on how the dam behaviour evolves in the long term.

2. Materials and Methods

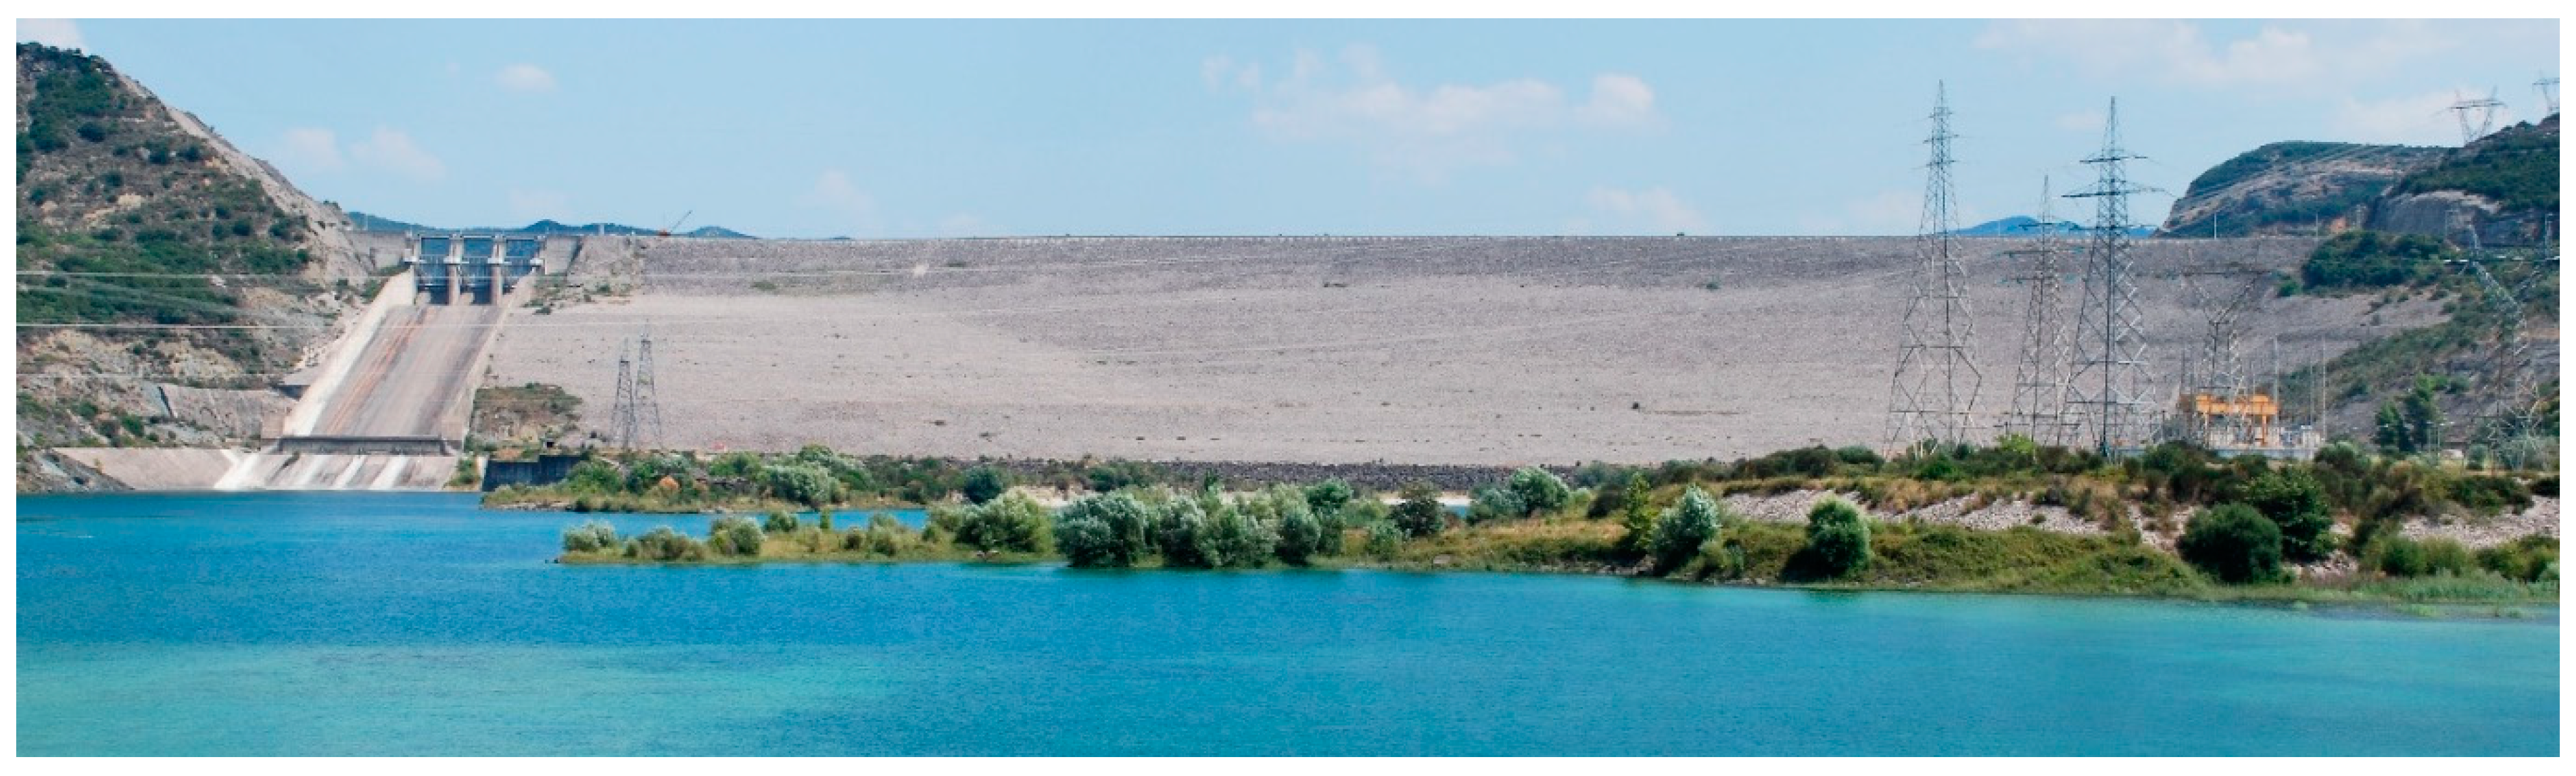
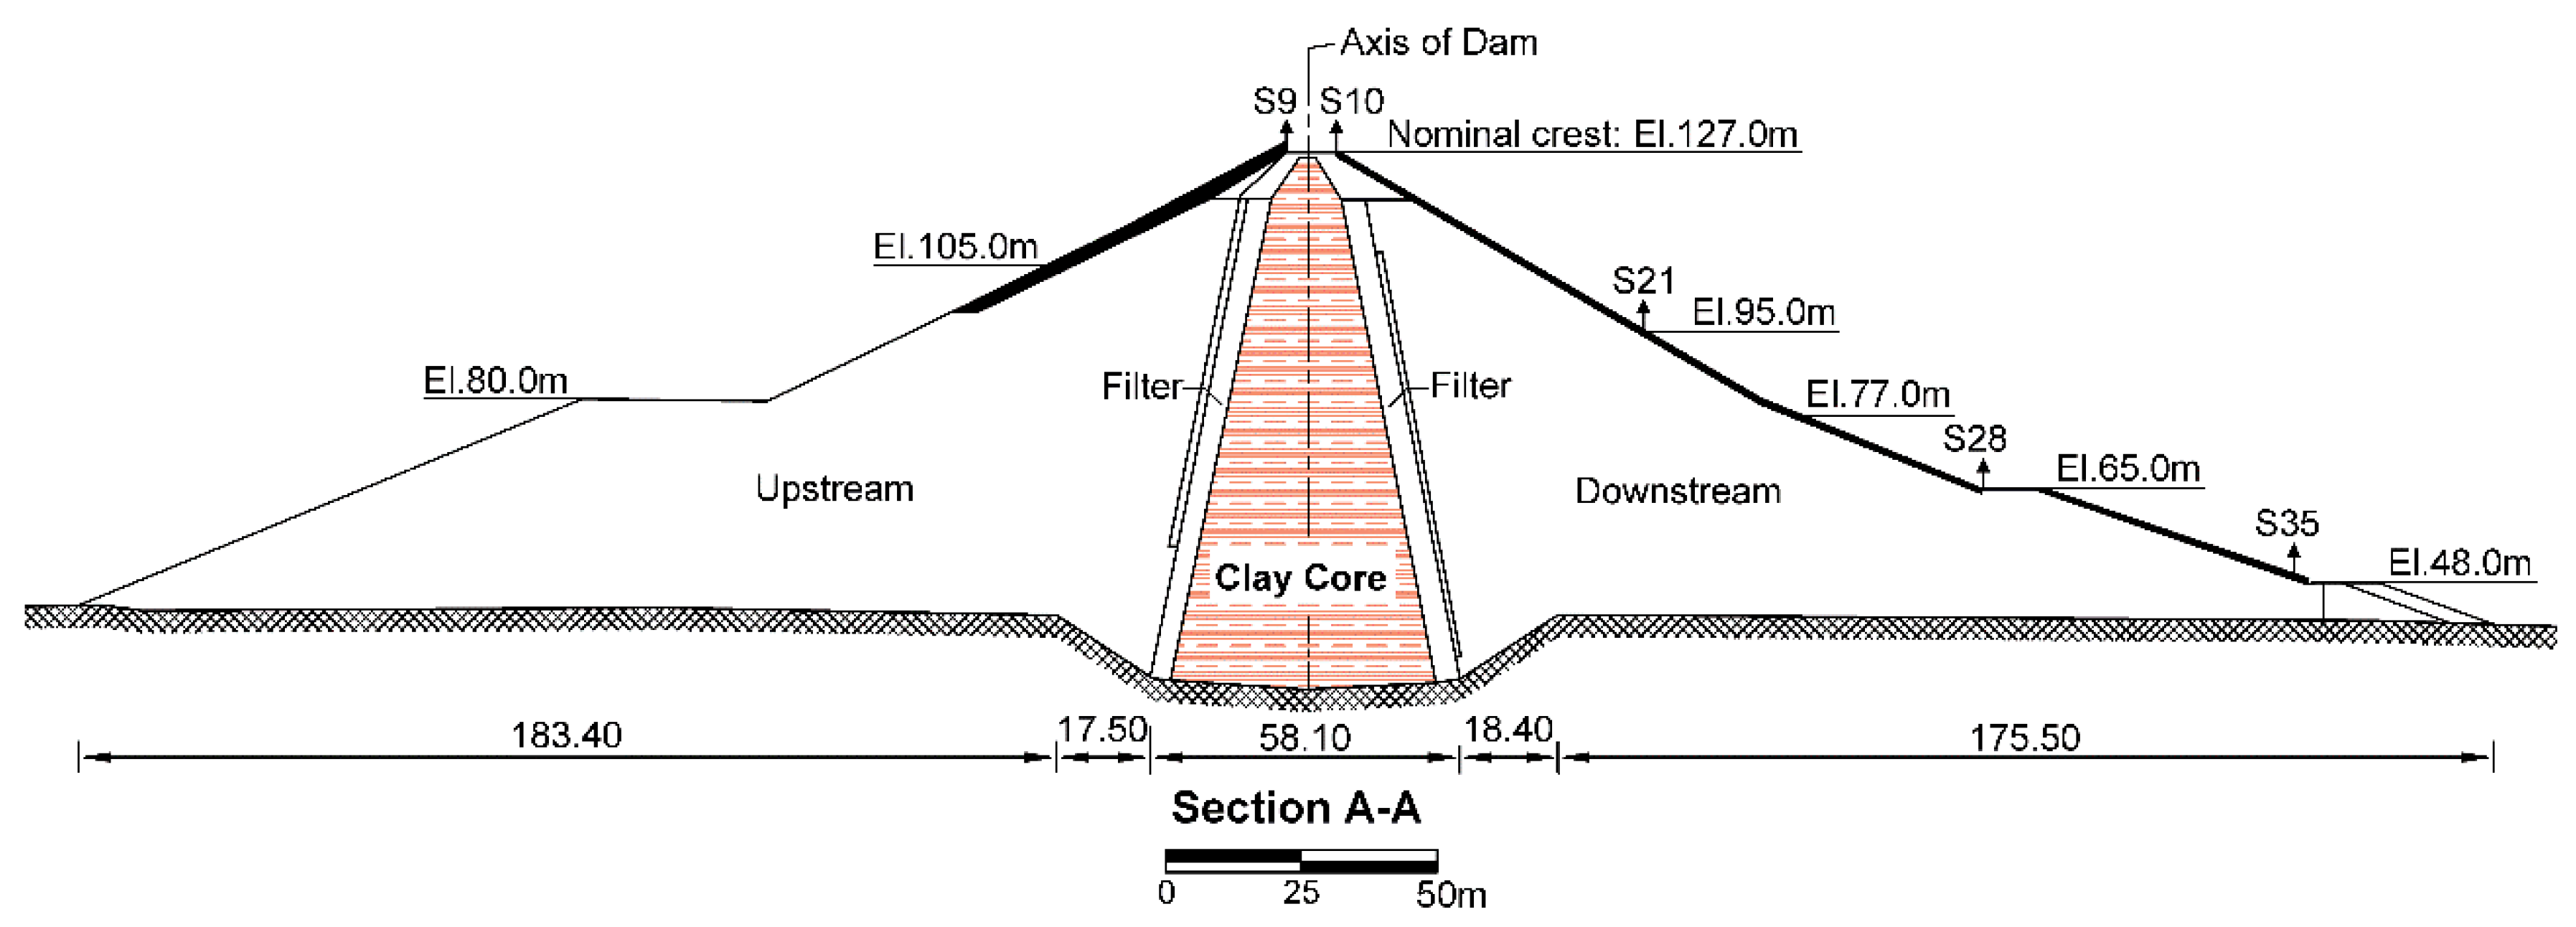
2.1. The Pournari I Dam

Pournari I (Figure 1) is an earthfill dam with a central clay core and sand gravel shoulders. The clay core is enclosed by transition filter zones, and the upper part of the upstream face of the shell is protected by rip-rap (Figure 2). The width at the base of the dam is 453 m and its maximum height is 103 m (superstructure from the foundation level), while the crest length and width is 580 m and more than 10 m, respectively [24]. The dam is owned by the Public Power Corporation of Greece (PPC S.A.). It is located in the regional unit of Arta (Western Greece) on the Arachthos River.
The Pournari I dam is the fifth largest dam in Greece (material volume of 9 × 10⁶ m3) and one of the largest dams in Europe. The construction of the dam was completed in 1981 and the first impoundment of the reservoir started immediately after, forming the artificial Arachthos reservoir with a maximum capacity of 865 × 106 m3 covering an area of 20.6 km2. The maximum and minimum water levels for hydroelectric power production are at elevations of 120 m and 100 m above mean sea level (AMSL), respectively, with the critical water level for the safety of the dam set at 126 m AMSL (nominal crest elevation: 127 m AMSL [24]). The main purpose of the dam is hydropower production and irrigation control. It is part of the Arachthos Hydroelectric Complex, which consists of four dams, the Pournari I dam being the largest both in size and electricity production capability.

2.1.1. Geology and Seismicity at the Dam Site

The dam has been founded on stratified sedimentary rocks (moderate to thickly bedded sandstones capping silty conglomerates above a sequence of thinly-bedded sandstone–siltstone) of flysch formations. At the dam site, beds strike N 30°W and dip NE at about 25°–45°, with no major faults. Most bedrock outcrops were found to be moderately to highly weathered. The unconfined compressive strength of the bedrock has values that range between 67 MPa and 118 MPa for the sandstones, and between 9.8 MPa and 49 MPa for the silty conglomerates and the sandstone/siltstone sequence. The modulus of elasticity was between 9.8 GPa and 19.6 GPa for all sequences. These values were considered adequate for the expected load on the foundations [25]. The area is also characterised by moderate to high seismicity. An increase of shallow seismicity (hypocentral depth  ≤5 km) in the vicinity of the reservoir up to a 10-km distance that potentially triggered and was associated with the reservoir level fluctuations has been reported in [26].

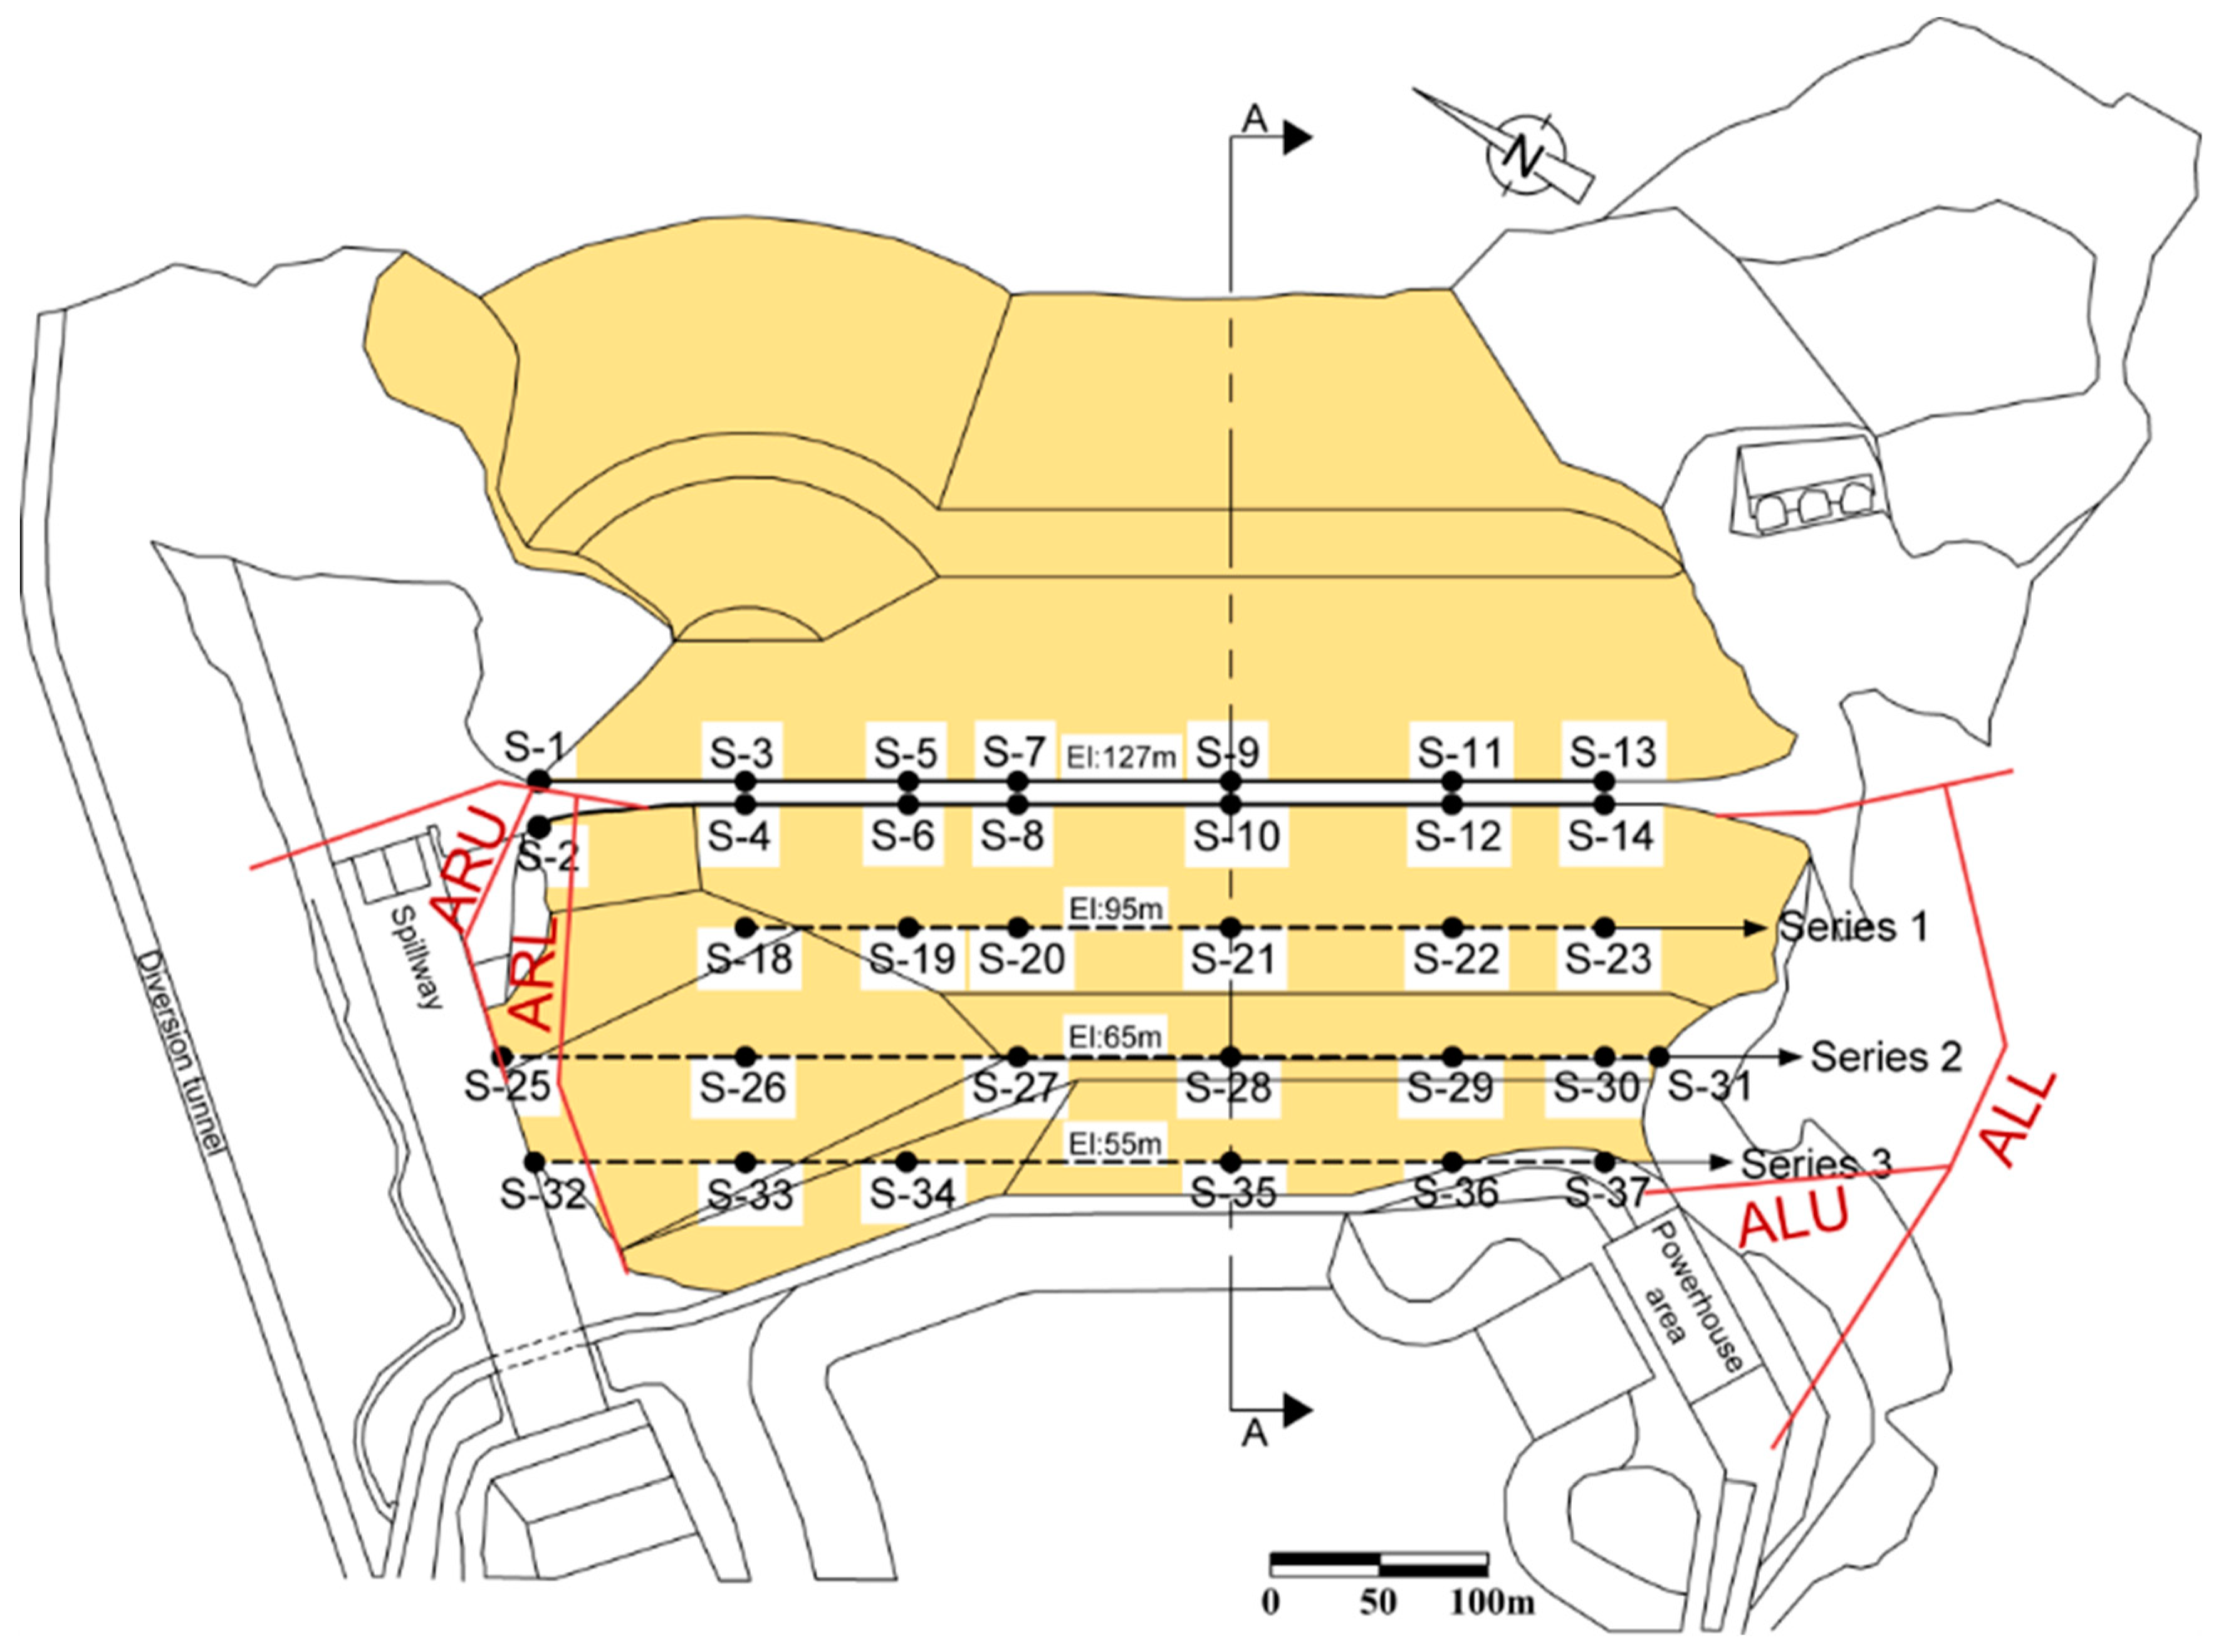
2.1.2. Monitoring at Pournari I dam

The Pournari I dam has been monitored since its construction. The monitoring systems installed at the dam site mainly consist of geodetic and geotechnical instruments and five accelerographs.
The geotechnical monitoring system comprises various instruments (e.g., inclinometers, piezometers, pressure cells) installed inside the body of the dam at different locations. Over the years, a number of geotechnical instruments were damaged, and as a result, not all are currently operational. In addition, the reference points for some of the inclinometers and lateral movement instruments had to change after a few years of operation.
The geodetic monitoring system consists of 79 control points in total located on the crest, the upstream shoulder, and the downstream shoulder of the dam as well as the left and right abutment and the power house area. Vertical (from a reference datum) and horizontal movements (deflections from a straight line) of the control points are measured using reference stations that are located on stable ground. From the 79 control stations, 35 are located on the crest and downstream shoulder, as shown in Figure 3.
Four drainage galleries (see Figure 3) were built and used for grouting during construction of the dam. Seepage rates within the four galleries have been measured every fortnight since the end of construction.

2.1.3. Available Monitoring Record

This study focuses on the analysis of the geodetic monitoring dataset. Only the vertical movements of control points established on the upstream (S-1 to S-13) and downstream (S-2 to S-14) side of the crest as well at the downstream shoulder of the dam (S-18 to S-37) were considered in this analysis due to the uncertainty and lack of metadata as it concerns the horizontal deflections. No data were available for control station S-4. Monitoring of control stations on the upstream shoulder stopped after the completion of construction in 1981, and because these control points have since been submerged under the water. Therefore, no data were available for the upstream shoulder. The monitoring data were provided by PPC S.A. and cover a period of 34 years, from February 1981 to April 2015. This study focusses solely on the long-term mechanical behaviour of the dam and uses data from 1984 to 2015, thus avoiding the first three cycles of filling of the reservoir. The sampling rate for the vertical movements during the period under investigation was one per year. The procedure followed for the measurements is the same as that described in [27]. A typical accuracy for precise levelling is a = 1 mm/km [28]. The maximum distance of the levelling surveys at the Pournari dam was approximately S = 1 km. This means that the available measurements were significant within σ = a*√(S) = 1 mm. Following the law of error propagation, we find that the accuracy of the settlement values is σs = σ*√2 = 1.4 mm. This value is an upper threshold as it refers to a single measurement. For repeated measurements, systematic errors are cancelled, as well as any gross errors that are identified, and the values are removed from the record. In this study, we adopt a very conservative threshold for any changes between consecutive measurements that are regarded as significant. This threshold takes into account a factor of safety equal to 2, i.e., ± 2.8 mm. This should suffice for any random errors such as misplacement of the levelling stuff during levelling, etc.
In addition, the record includes daily values of reservoir level and daily rainfall depths at the dam site for the period 1981–2015. Data that were also available were seepage rates, every fortnight, within the drainage galleries between 1987–2010 and monthly readings of the hydraulic head in four piezometric tubes installed within the upstream shoulder, the clay core, and the downstream shoulder of the dam between 1981 and 2010.

2.2. Methodology

Our methodology consists of the following steps:
Step 1: Time evolution of vertical movements for the control stations on the crest and downstream shoulder of the dam.
As a first step, the time evolution of the recorded vertical displacements is examined, aiming to identify the control points with maximum displacement on the crest and downstream shoulder, as well as compare the amplitude of settlements between the two sides of the crest.
In order to evaluate the amplitude of crest settlements, we calculate the settlement index (Equation (1)) and the annual rate of settlement (Equation (2)). We identify any time periods during which the settlement index and the annual rate of settlement exceed their threshold values equal to 0.02 [21] and 0.02% [22], respectively. We further examine these periods at a later stage of the analysis, as described in Step 2 of the methodology.
For the vertical movements of the downstream shoulder, we determine time periods that exhibit significant (above ± 2.8 mm as explained in Section 2.2) unexpected amplitude change, i.e., uplift. We compare these time periods with the records of the reservoir level and rainfall at the next step of the analysis.
Step 2: Effect of environmental factors on the observed settlements.
In this step, we examine the settlement values to identify any potential relationship with environmental factors, i.e., the reservoir level fluctuations, rainfall, and occurrence of seismicity. We choose the observed settlements for control stations S-9, S-10, S-21, S-28, and S-35 that are located along the maximum cross-section A-A (Figure 3) for further analysis.
Since the sampling rate for the observed settlements is one per year, we use average monthly values for the reservoir level and monthly rainfall depths, instead of the daily values for our comparisons. The monthly values are calculated using the available daily data.
In order to investigate the effect of any climatic changes on the settlements, we calculate the deviation of the calculated monthly rainfall depth from corresponding historical rainfall depths for the same month that are available from the National Meteorological Service (EMY) of Greece (www.hnms.gr/emy/en/climatology/climatology_month; accessed on 08/07/2019). These historical monthly rainfall depths refer to the greater Arta region where the Pournari dam is located. Using the historical monthly values, we calculate the cumulative historical rainfall depths for the periods between consecutive measurements. The deviation (%) of the calculated rainfall depths between consecutive rainfall from the corresponding historical values are estimated as:
deviation   of   rainfall   ( % ) = rainfall   depth ( i ) historical   depth ( i )   historical   depth ( i ) × 100
where rainfall depth(i) is the cumulative rainfall depth for the time period between measurement epoch i and i-1, as calculated from the available daily rainfall depth values. Historical depth(i) is the cumulative rainfall depth that refers to the same months of the year as those included in the calculation for the rainfall depth(i), and is calculated from the available historical monthly rainfall depth values.
Since Greece is a highly seismically active region, we also studied the effect of earthquakes on the observed dam settlements solely in a qualitative form. More specifically, we examine whether any increase in the rate of settlements can be correlated with the occurrence of earthquakes within a 50-km radius from the dam site. We used the earthquake catalogue available from the National Observatory of Athens for earthquakes with magnitudes >3 within a radius of 50 km from the Pournari I dam site during the period 1984–2015. In structural engineering, earthquakes of magnitudes of M5 or more are considered as being significant to infrastructure ([29] and references therein); therefore, we also looked at the occurrence of earthquakes with magnitudes ≥M5.

3. Results

3.1. Step 1: Time Evolution of Vertical Movements for the Control Stations on the Crest and Downstream Shoulder of the Dam

In this section, the recorded settlements on the crest and downstream shoulder of the dam are discussed without any reference to external factors that could have an effect on them, e.g., reservoir level, rainfall, etc.

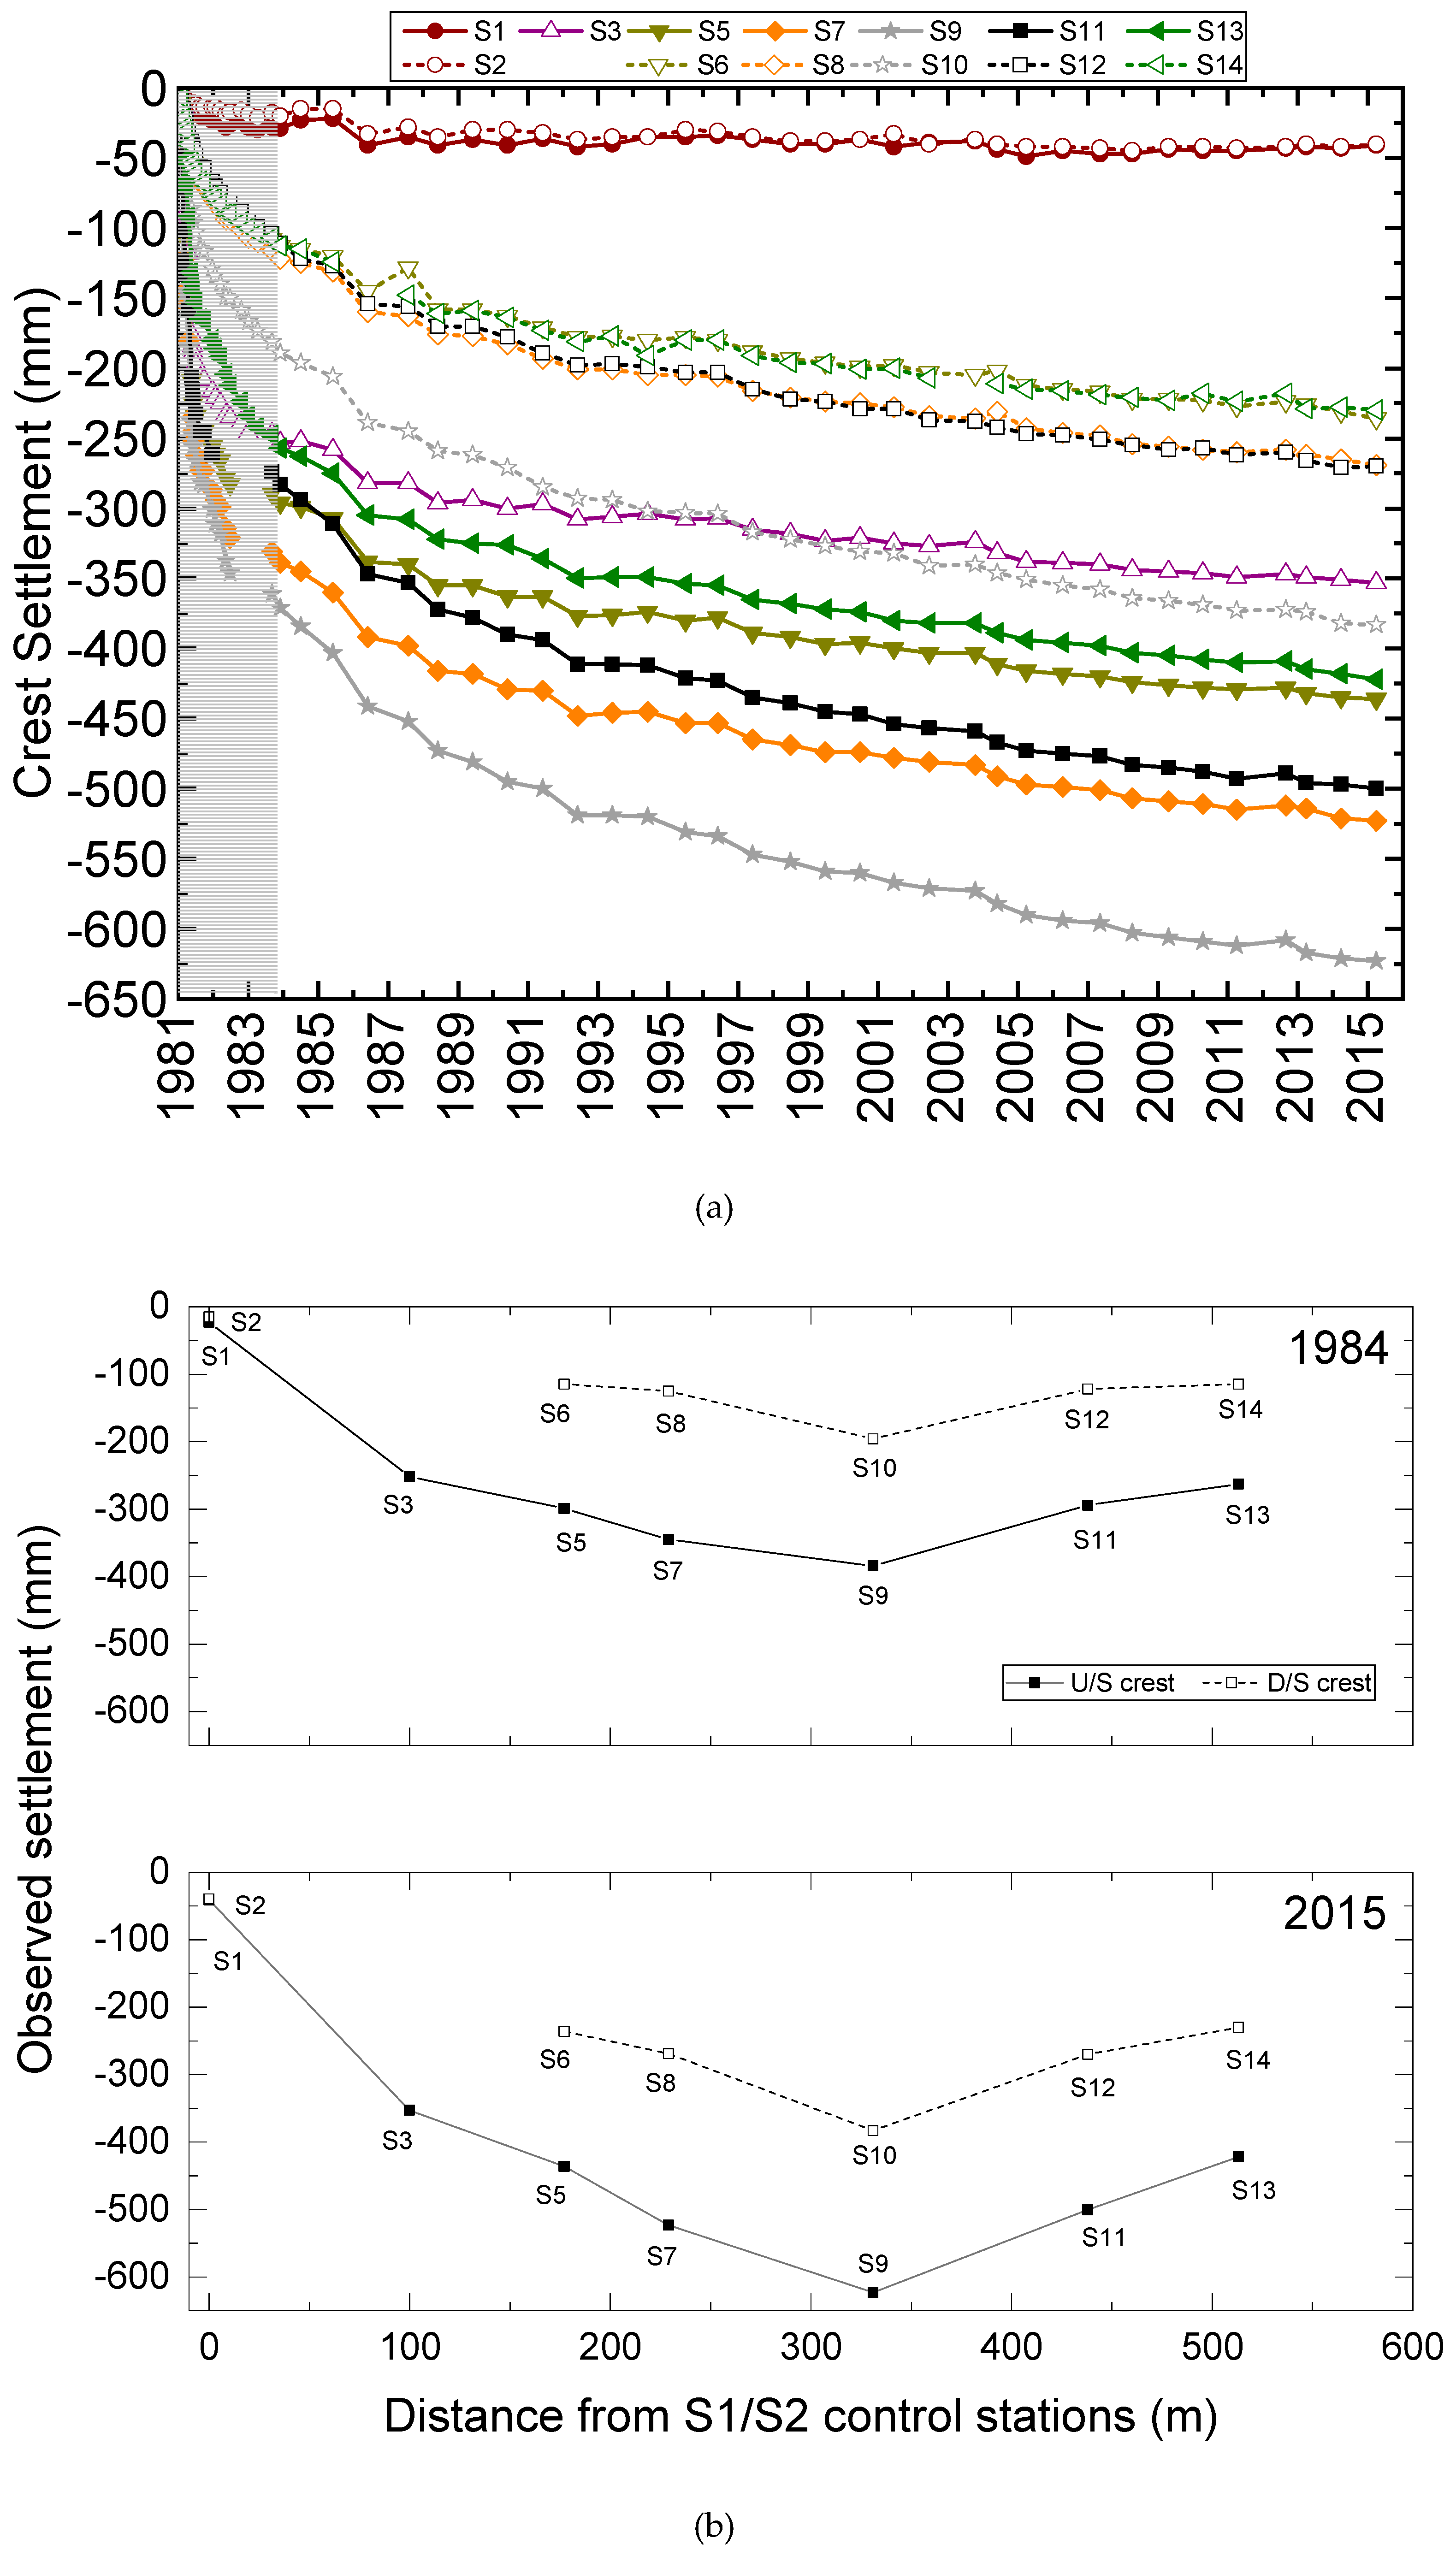
3.1.1. Crest Settlements

Figure 4a shows the time evolution of the crest settlements at the Pournari I dam. The solid lines with the filled symbols correspond to control stations at the upstream (U/S) side of the crest, while the dashed lines with the unfilled symbols correspond to control stations at the downstream (D/S) side of the crest. Symbols of the same shape and colour (filled and unfilled) correspond to points with locations facing each other, i.e., at the same distance along the crest but on different sides of the crest. From Figure 4a, it is observed that in general, settlement amplitudes are smaller closer to the abutments and increase as we move towards the middle of the crest. The maximum displacement up to 2015, equal to 623 mm, has been observed for control station S-9 on the U/S side of the crest. This corresponds to 0.6% of the dam height (from the foundation level).
Differential settlement is observed on the crest. In particular, the U/S side appears to consistently have larger settlements by approximately 200 mm over the whole time period examined (Figure 4b), compared to the D/S side, for all stations but S-1, next to the left abutment. The difference is slightly bigger, 250 mm, between S-9 and S-10 at the location of the maximum cross-section. The U/S side of the crest closer to the left abutment has slightly larger settlements (control stations S-5 and S-7), by approximately 20 mm on average, compared to the settlements of the same side of the crest closer to the right abutment (control stations S-11 and S-13, respectively).
We calculated the crest settlement index (Figure 5a, Equation (1)) and the annual rate of settlements for the points on the crest (Figure 5b, Equation (2)) following the methodology by [22]. From Figure 4a, it can be shown that up until 2015, the settlement index has not exceeded the threshold value of 0.02 suggested by [22]. The annual rate of settlements seems to have stabilized for all control stations on the crest after 1984 (within three years since construction, consistent with the time period suggested by [22]) with the exception of measurement epochs 1986, 1988, and 1992, where values exceeded the 0.02% threshold for all or some of the control points. More specifically, all control stations on the crest appear to have an annual settlement rate higher than 0.02% of the dam height in 1986. In 1988 and 1992, only the control stations that were located on the U/S side of the crest surpassed the threshold value. These periods are examined in more detail in the later sections of this paper.

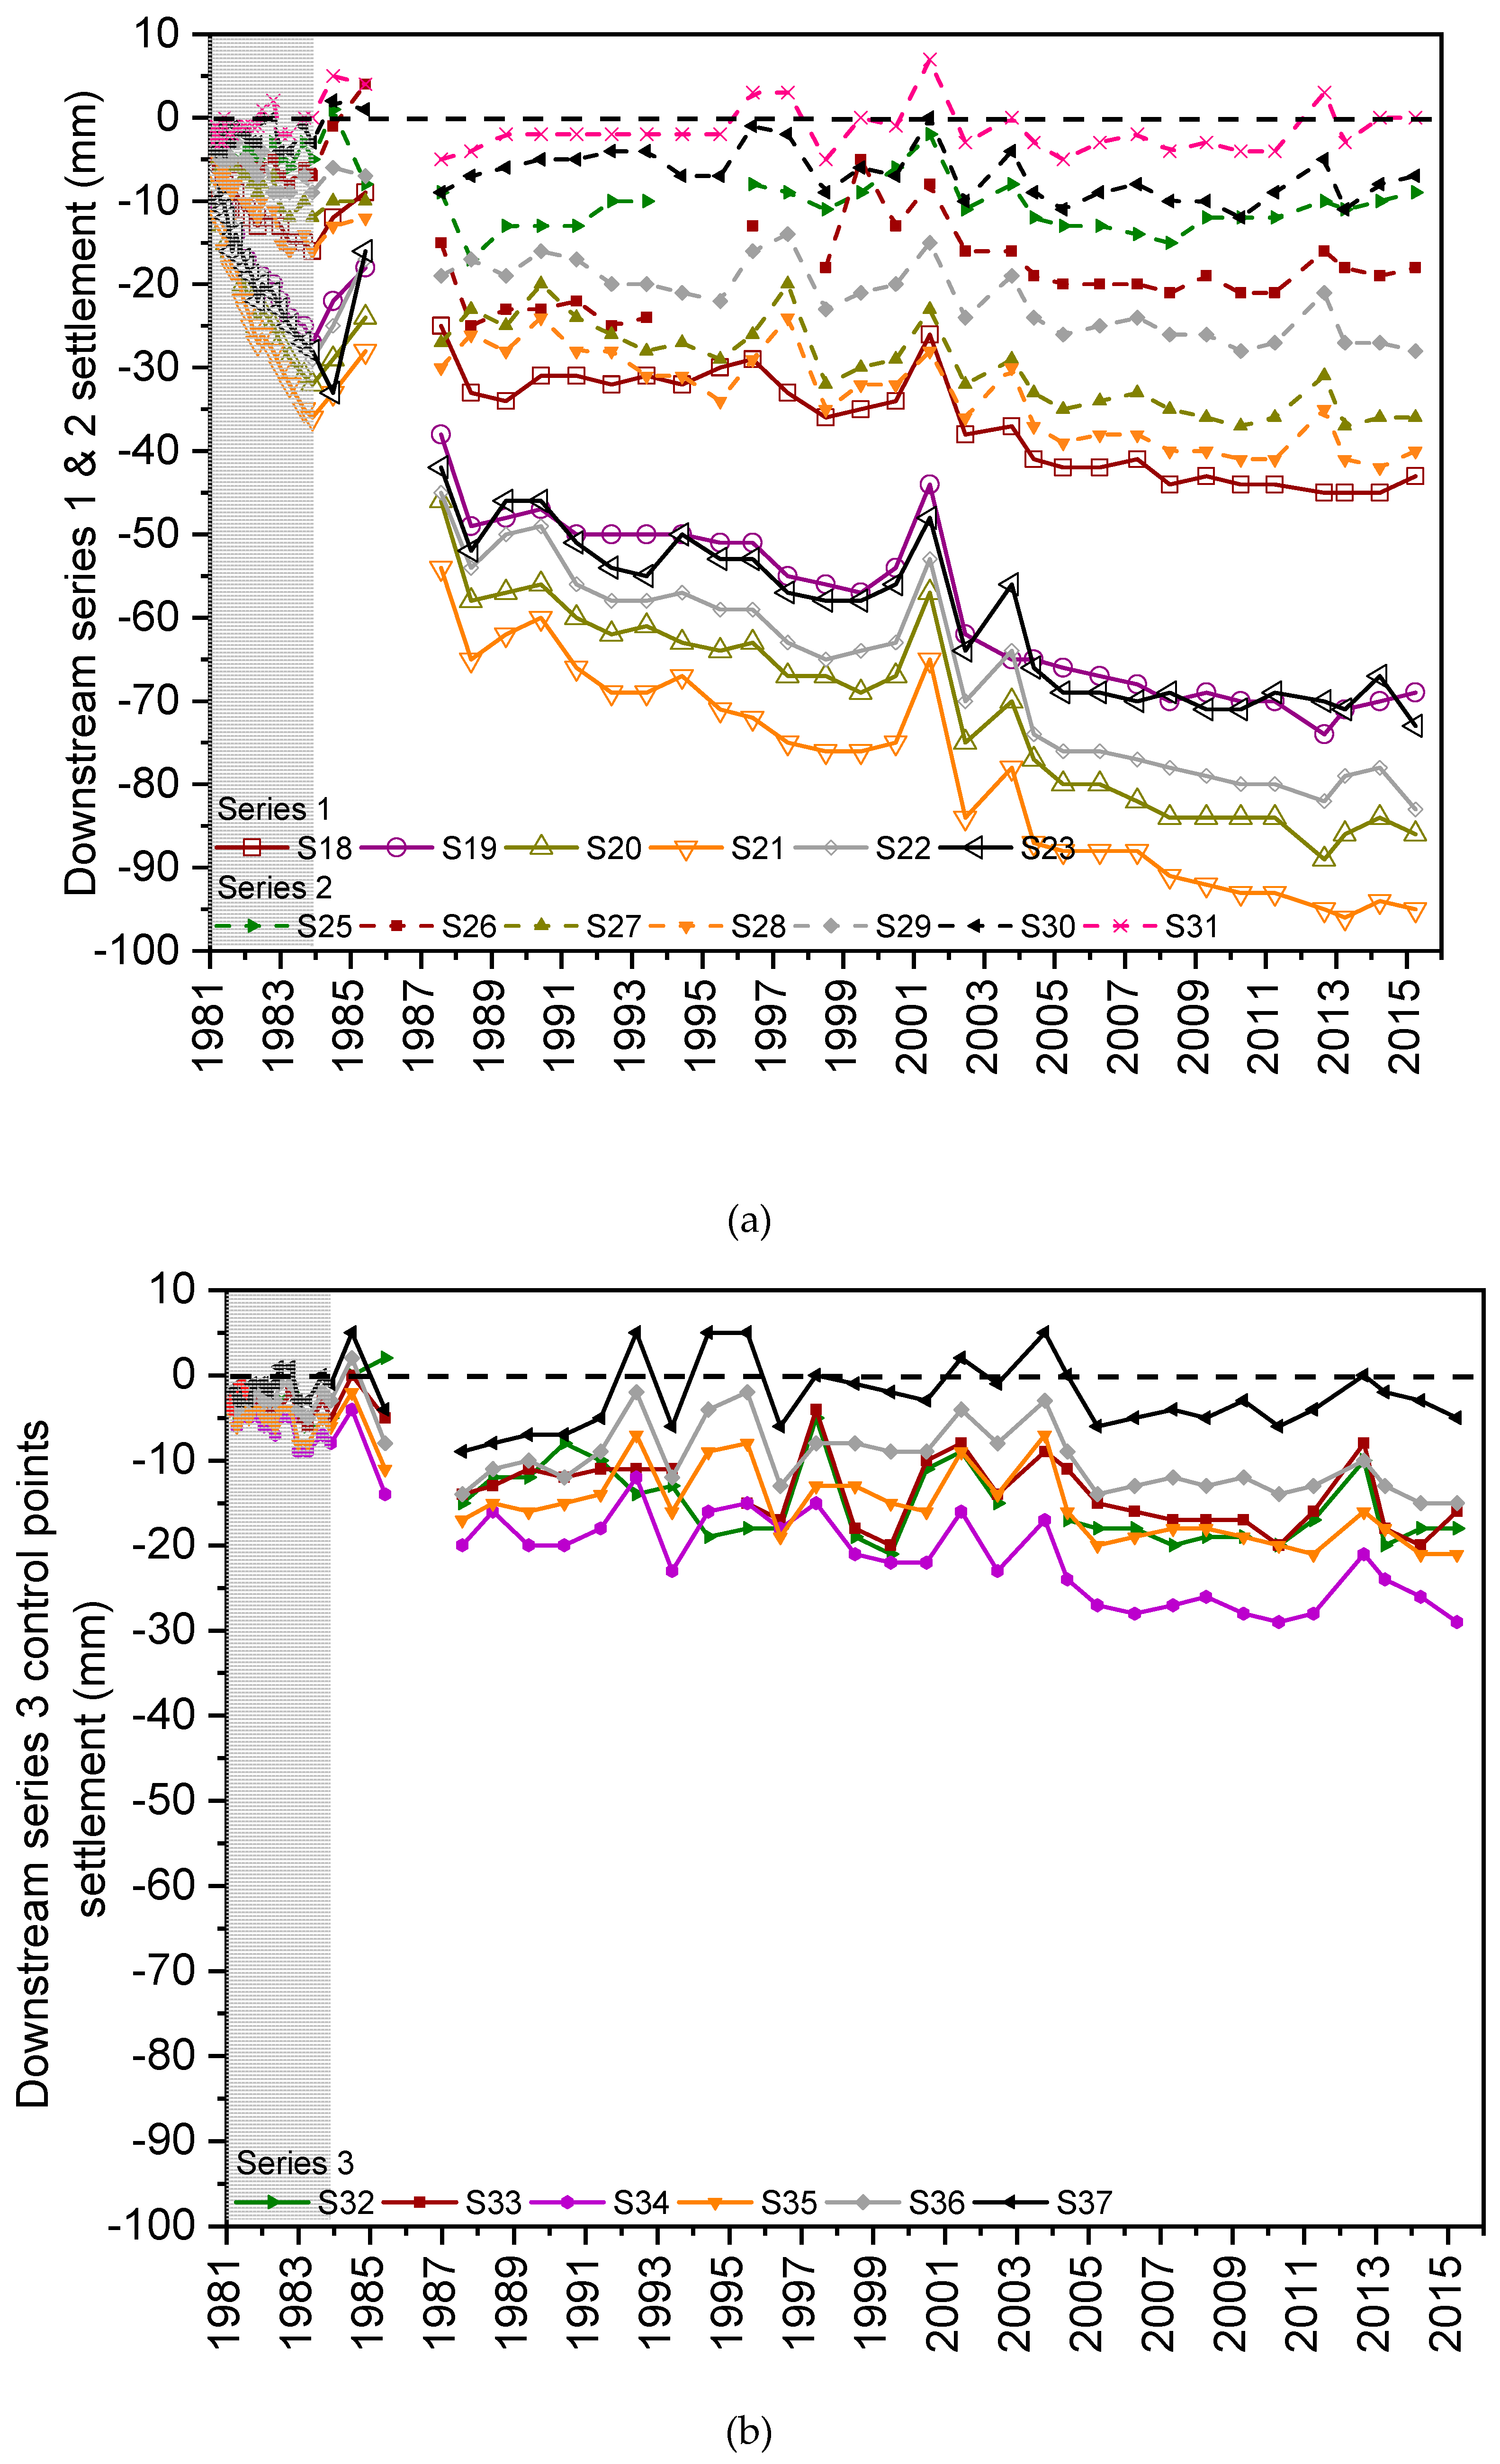
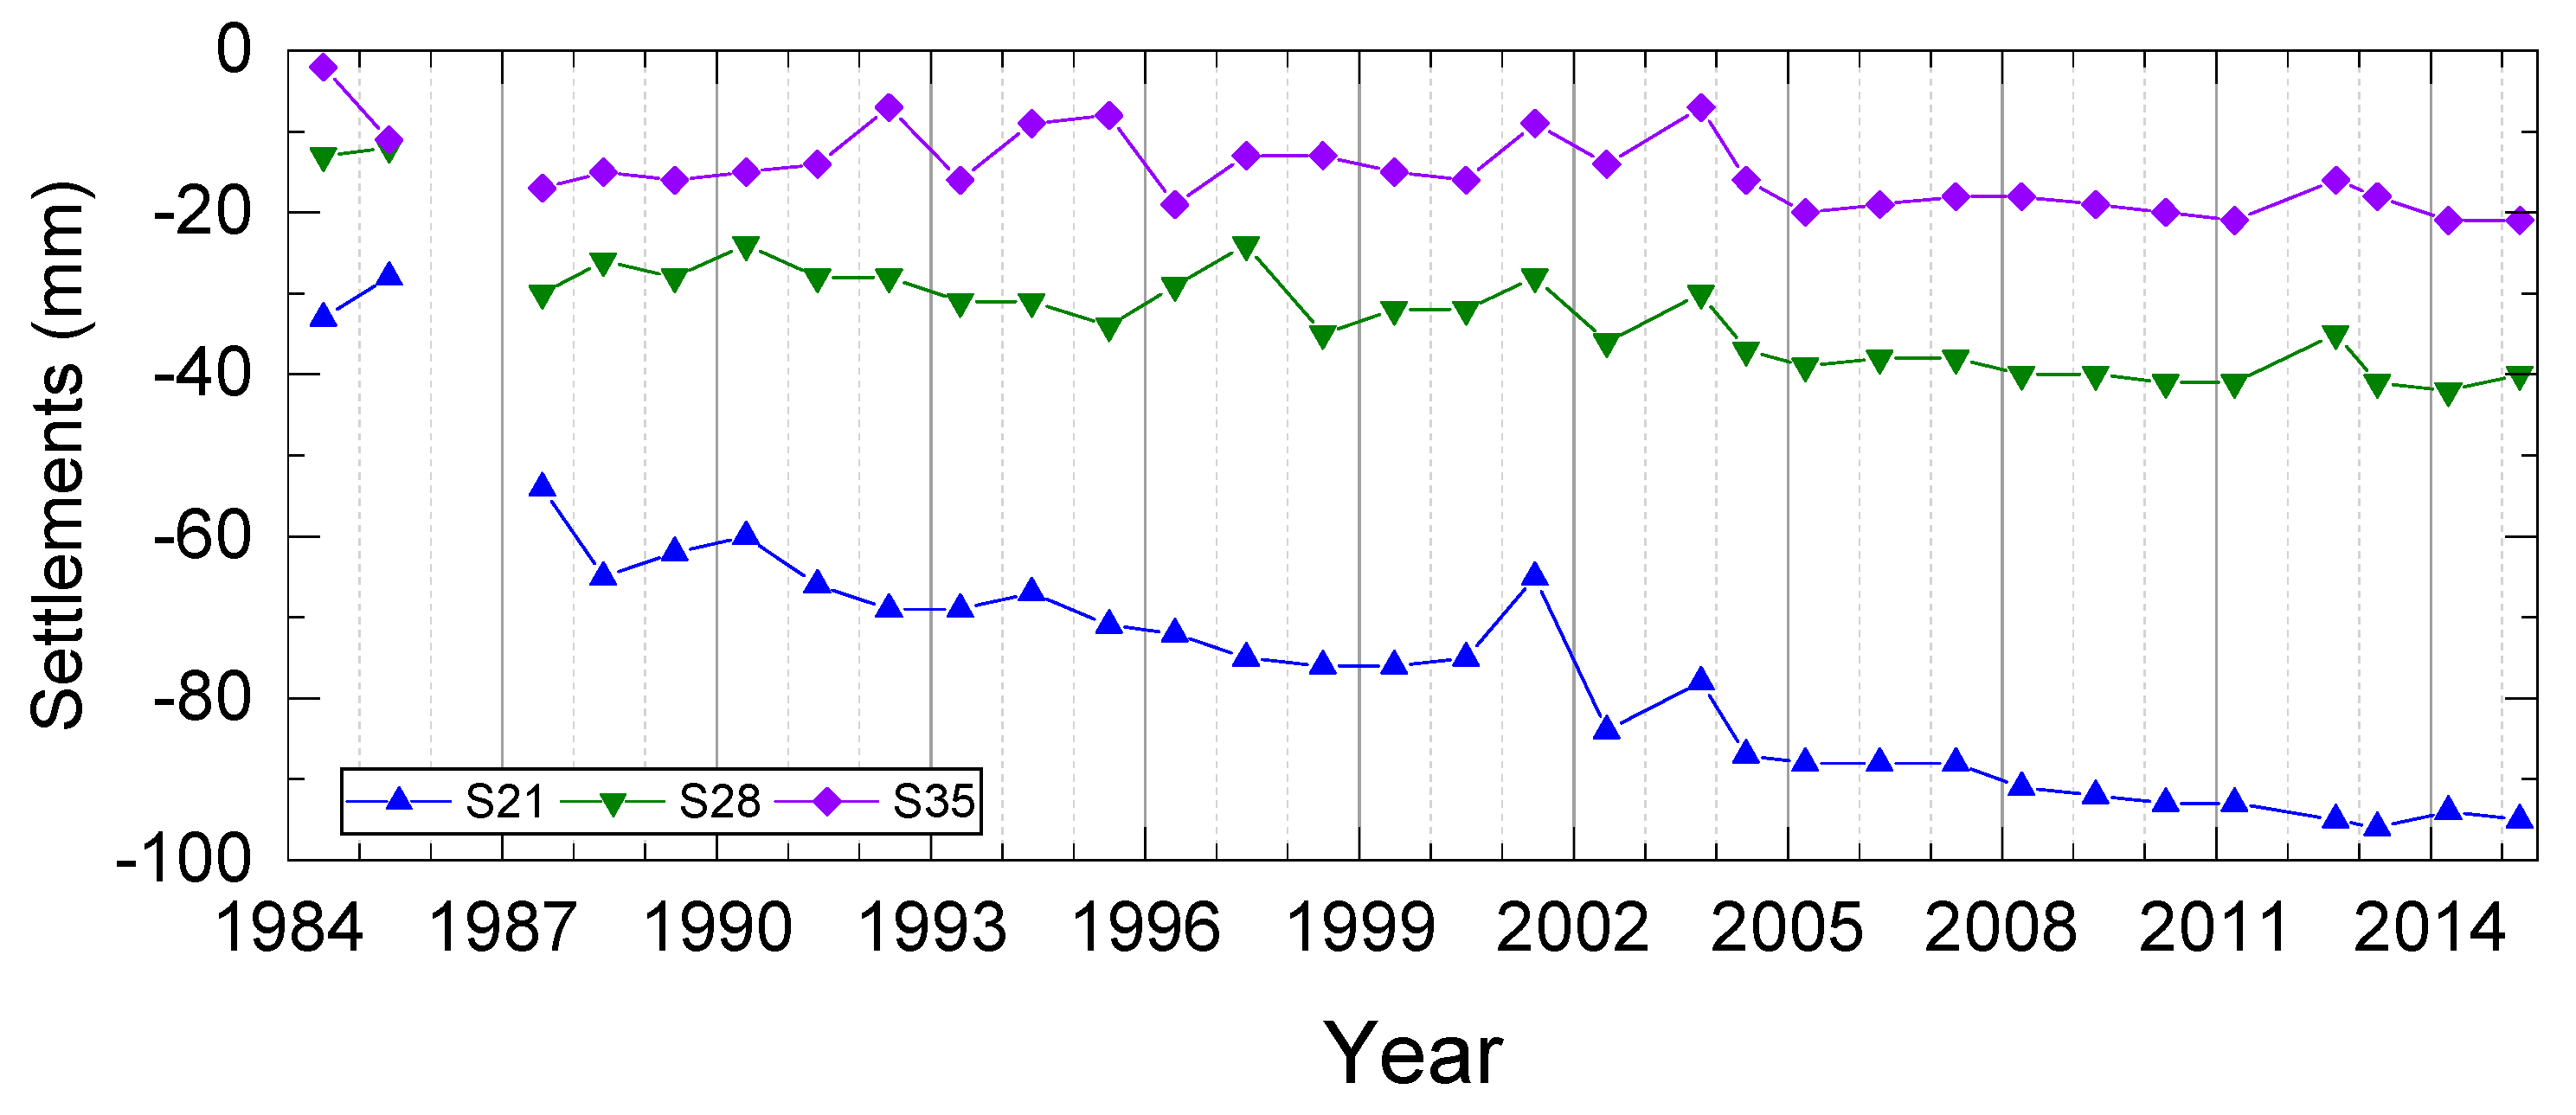
3.1.2. Settlements of the Downstream Shoulder

Figure 6 shows the evolution of the settlements for the control points on the downstream shoulder. No measurements were available for 1986. The amplitude of the settlements is smaller than that of the crest, as expected, with the maximum value of 95 mm recorded for station S-21 of Series 1 (for location of control points refer to Figure 3).
A number of time periods with uplift movements have been identified: 1989, 1992, 1994, 1996, 1997, 1999, 2001, 2003, and 2012. Table 1 shows which part of the downstream shoulder shows uplift and the corresponding uplift amplitude in mm.
It is worth comparing the behaviour of the control stations of the crest at the same time periods as those in Table 1. Table 2 shows the calculated maximum uplift for the control stations at the crest.
We examined two hypotheses: (1) the uplifts are due to gross errors, and (2) the uplifts are not real, but are due to instabilities of the reference benchmarks used for the levelling surveys, i.e., the settlement of the reference points. Hypothesis (1) was rejected as when uplift was observed, this was for either all or most of the control stations along a series (e.g., Series 2 or 3) or multiple series at the same measurement epoch. This minimises the possibility of observations being attributed to gross errors. Hypothesis (2) was also rejected. If the reference points were not stable, this would have been identified during the surveys of the control points that take place regularly. In addition, if this hypothesis was true, the effect on the recorded measurements would have been continuous, not on isolated time periods only.

3.2. Step 2: Effect of Environmental Factors on the Observed Settlements

In this step, the settlements are analysed in combination with the monthly average reservoir level values, the monthly cumulative rainfall depths, and the occurrence of seismicity. From Figure 4a, Figure 6a,b, it is evident that the settlements of control stations that lie along the same line and elevation (e.g., crest, Series 1, etc.), are following very similar patterns, although with different amplitudes. Hence, the settlements of only one station per monitoring line (U/S crest, D/S crest, Series 1-3), those along the maximum cross-section (A-A in Figure 3; S-9, 10, 21, 28 and 35), are examined further in this paper. These were the points that exhibit maximum settlements amongst the control points along the same elevation.

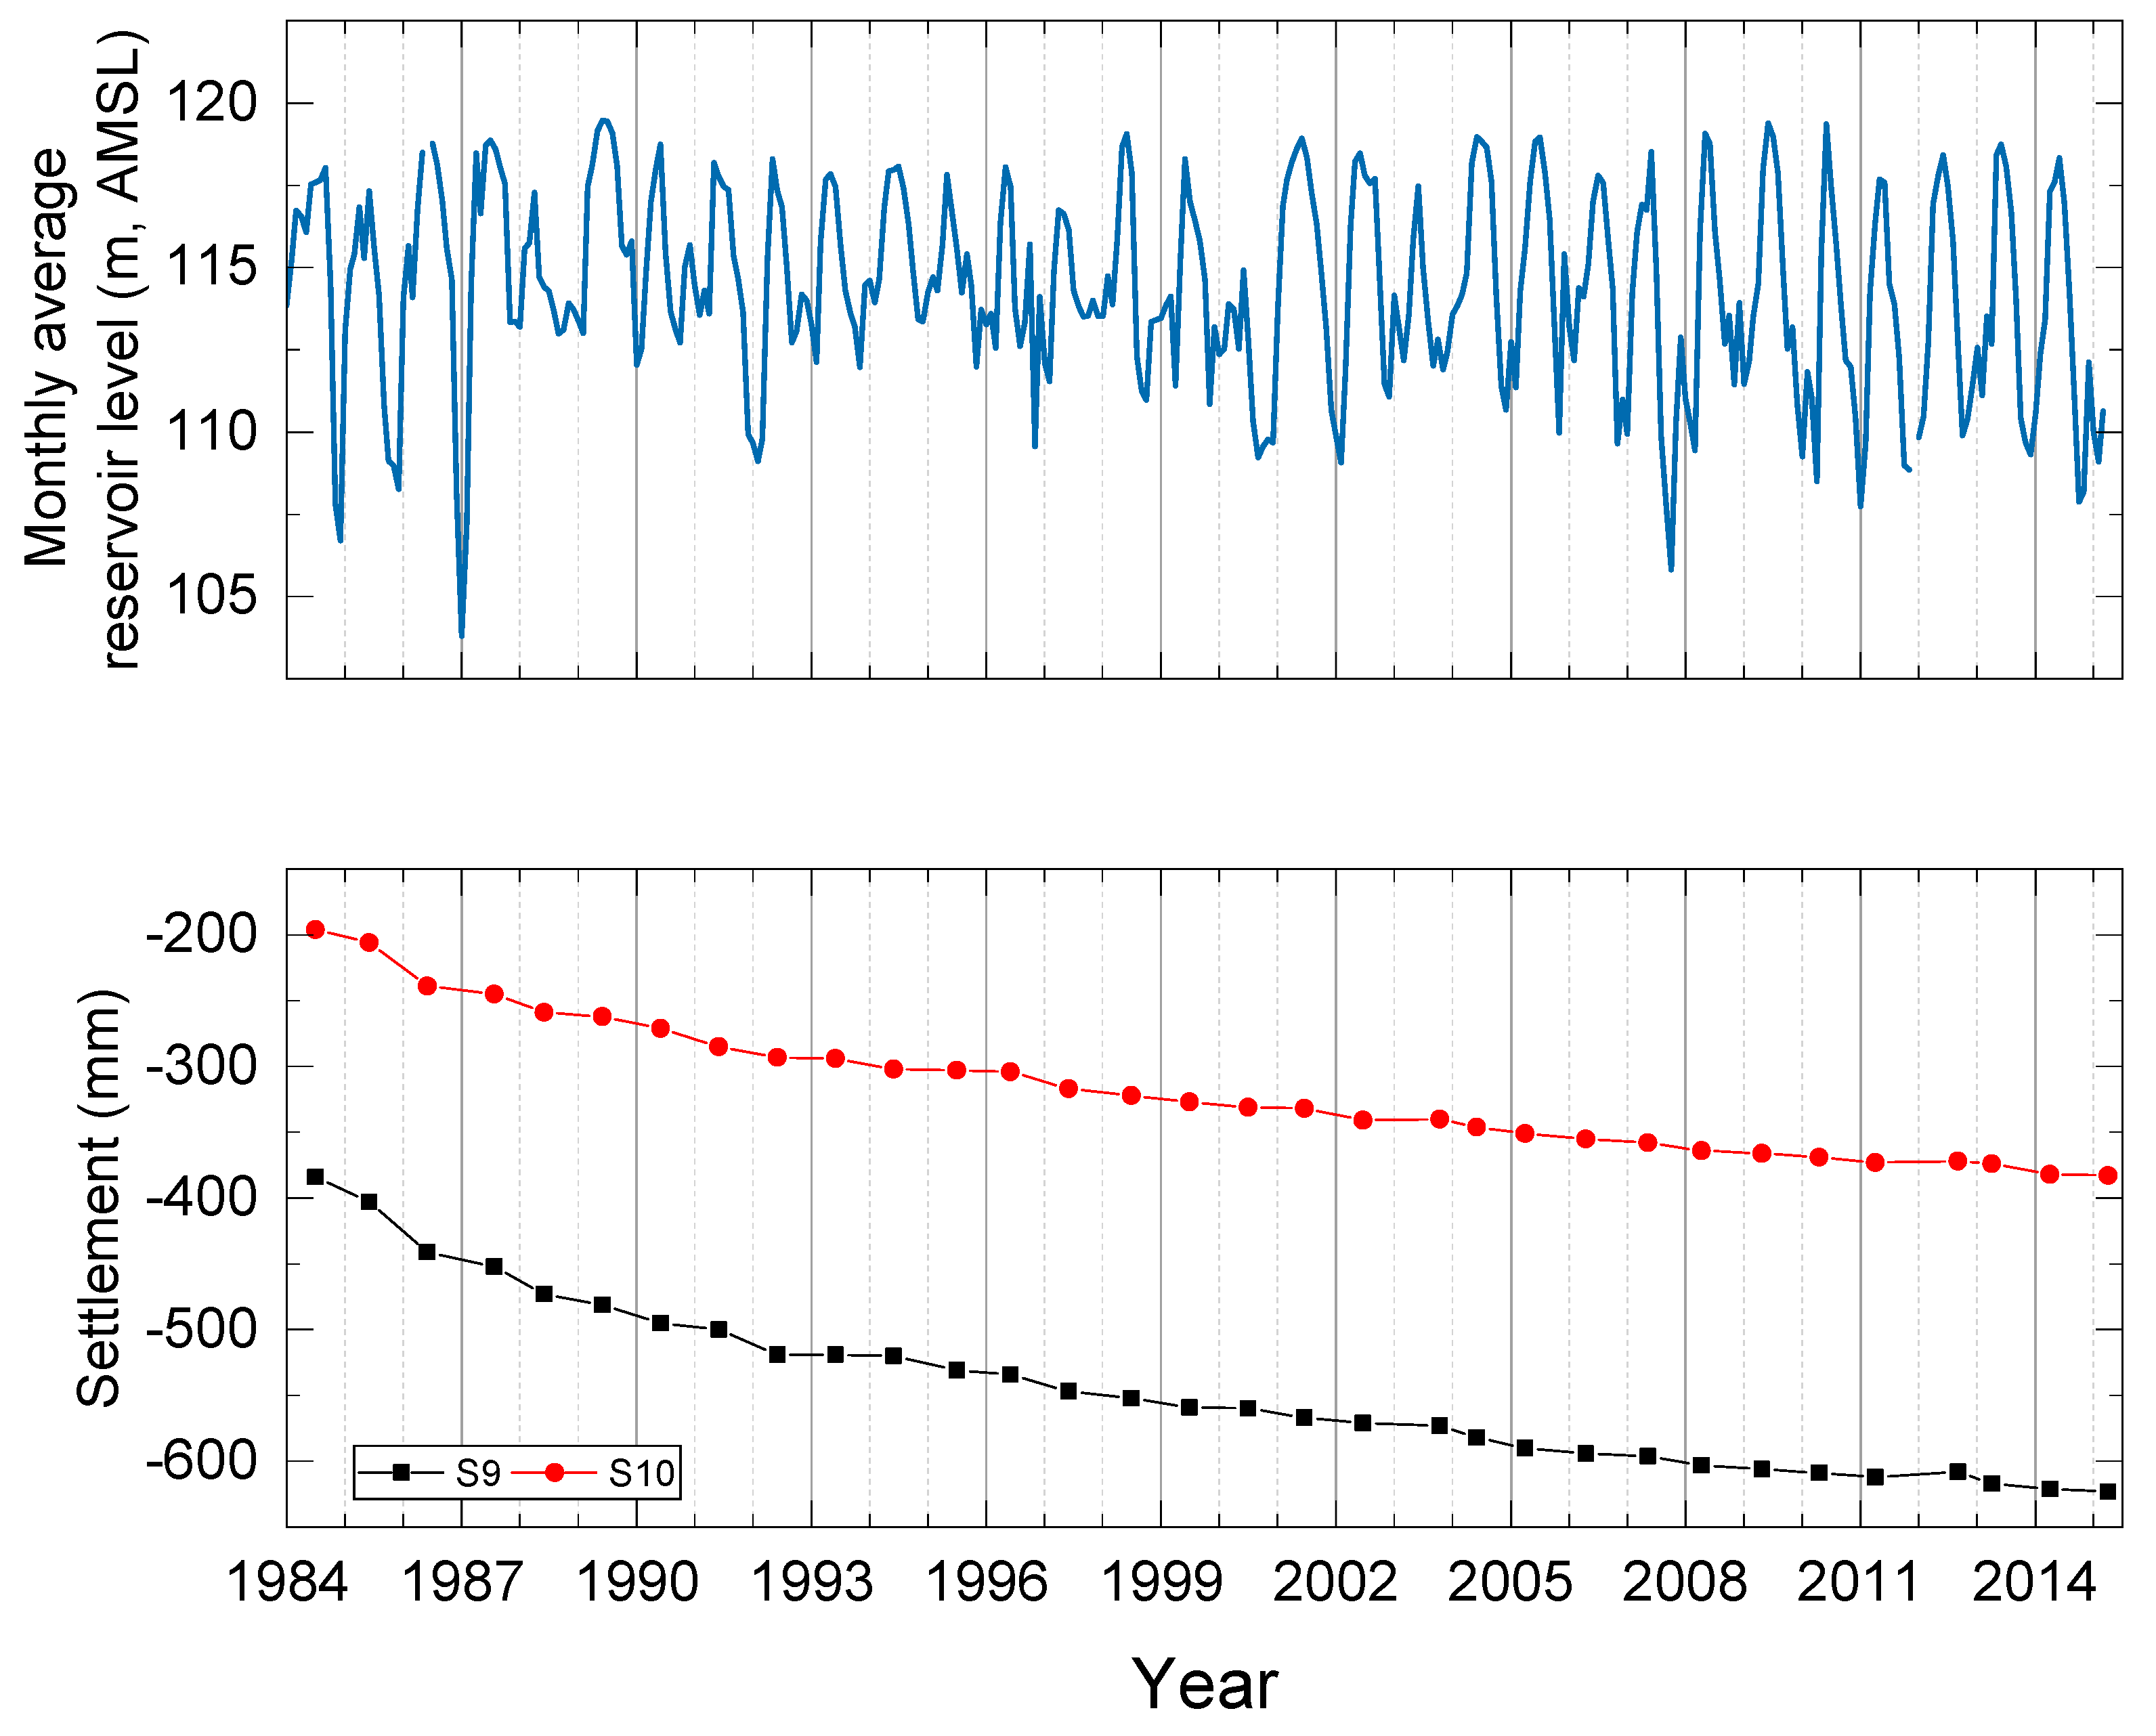
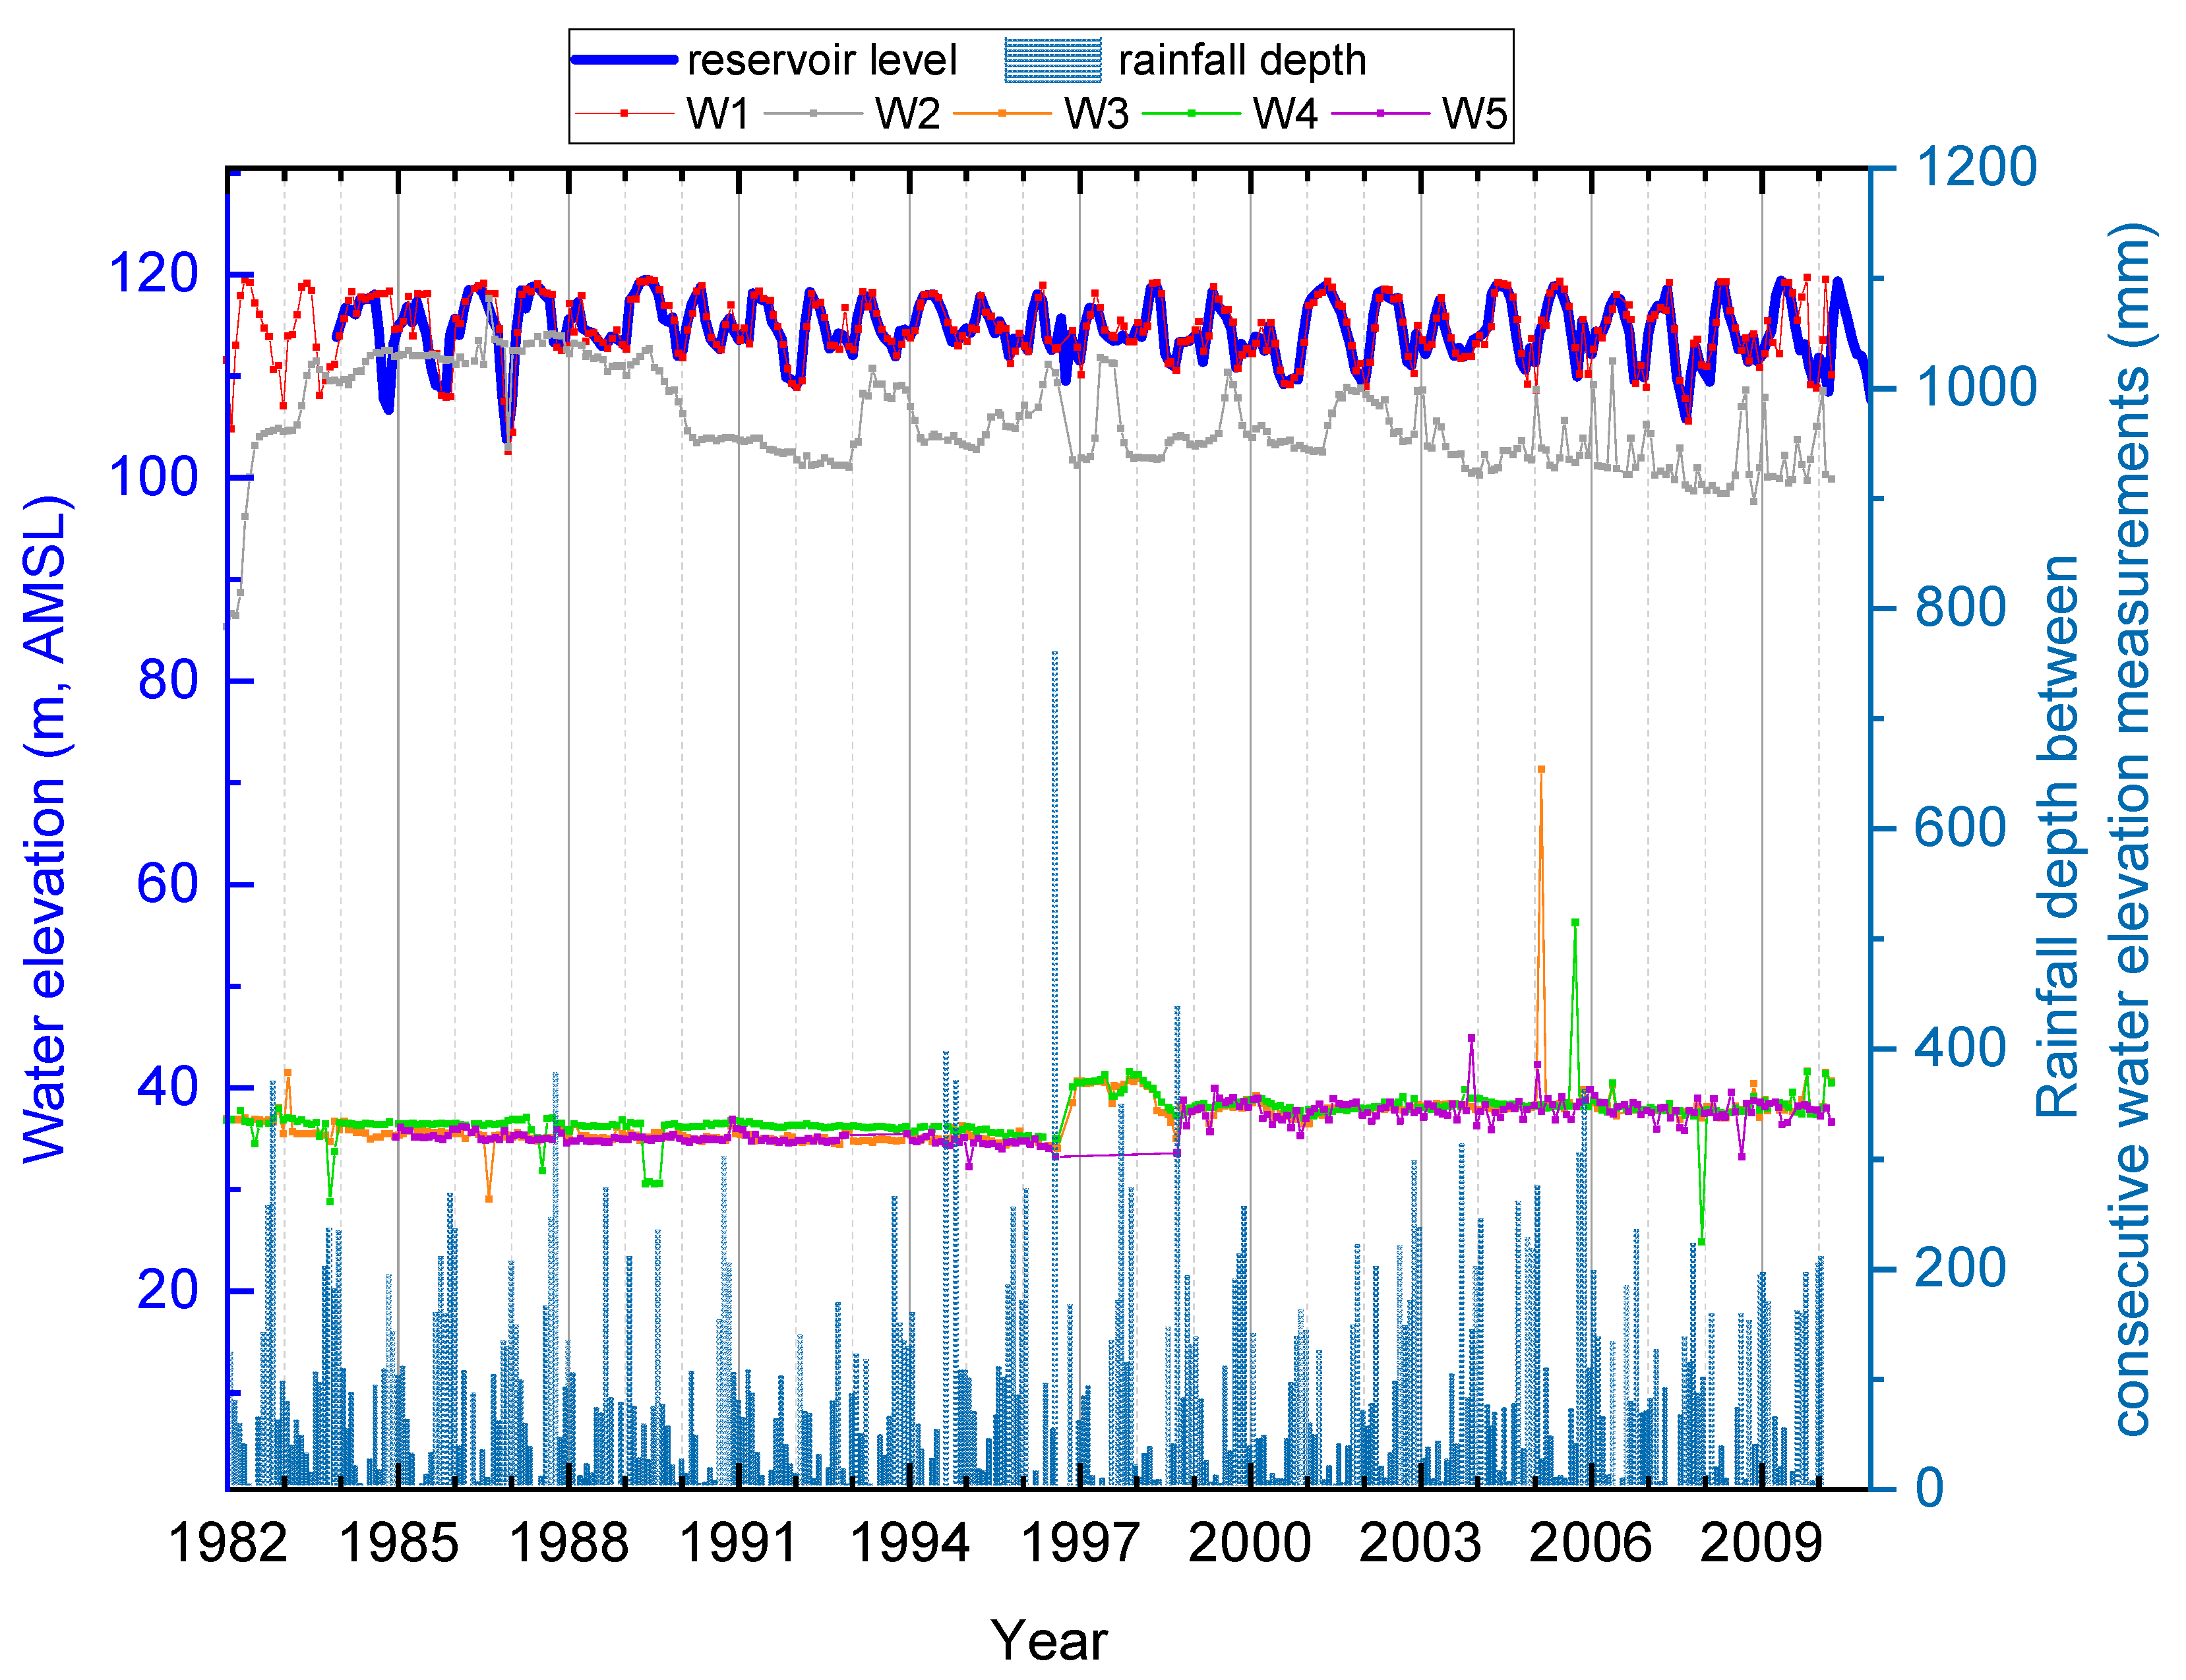
3.2.1. Settlements and Reservoir Level

Figure 7 shows the monthly average reservoir level and the observed settlements of the control stations along the maximum cross-section A-A (S-9, S-10, S-21, S28, S35). A first observation is that the rate of settlements of the control points on the crest does not increase following the reservoir drawdown in 1987. A change in the rate of settlements for the control points on the crest (S-9 and S-10) in 1986, 1992, 1997, and 2002 follows the lower level in the reservoir in December 1985, February 1992, November 1996, and February 2002, respectively (Figure 7). This could be a possibility if a time lag of 4 to 6 months between the two parameters, i.e., water level and settlements, exists.
For the D/S shoulder, the two distinct periods of recorded uplift in 2001 and 2003 visible in the records of all series could not be linked to the reservoir level from the analysis so far.

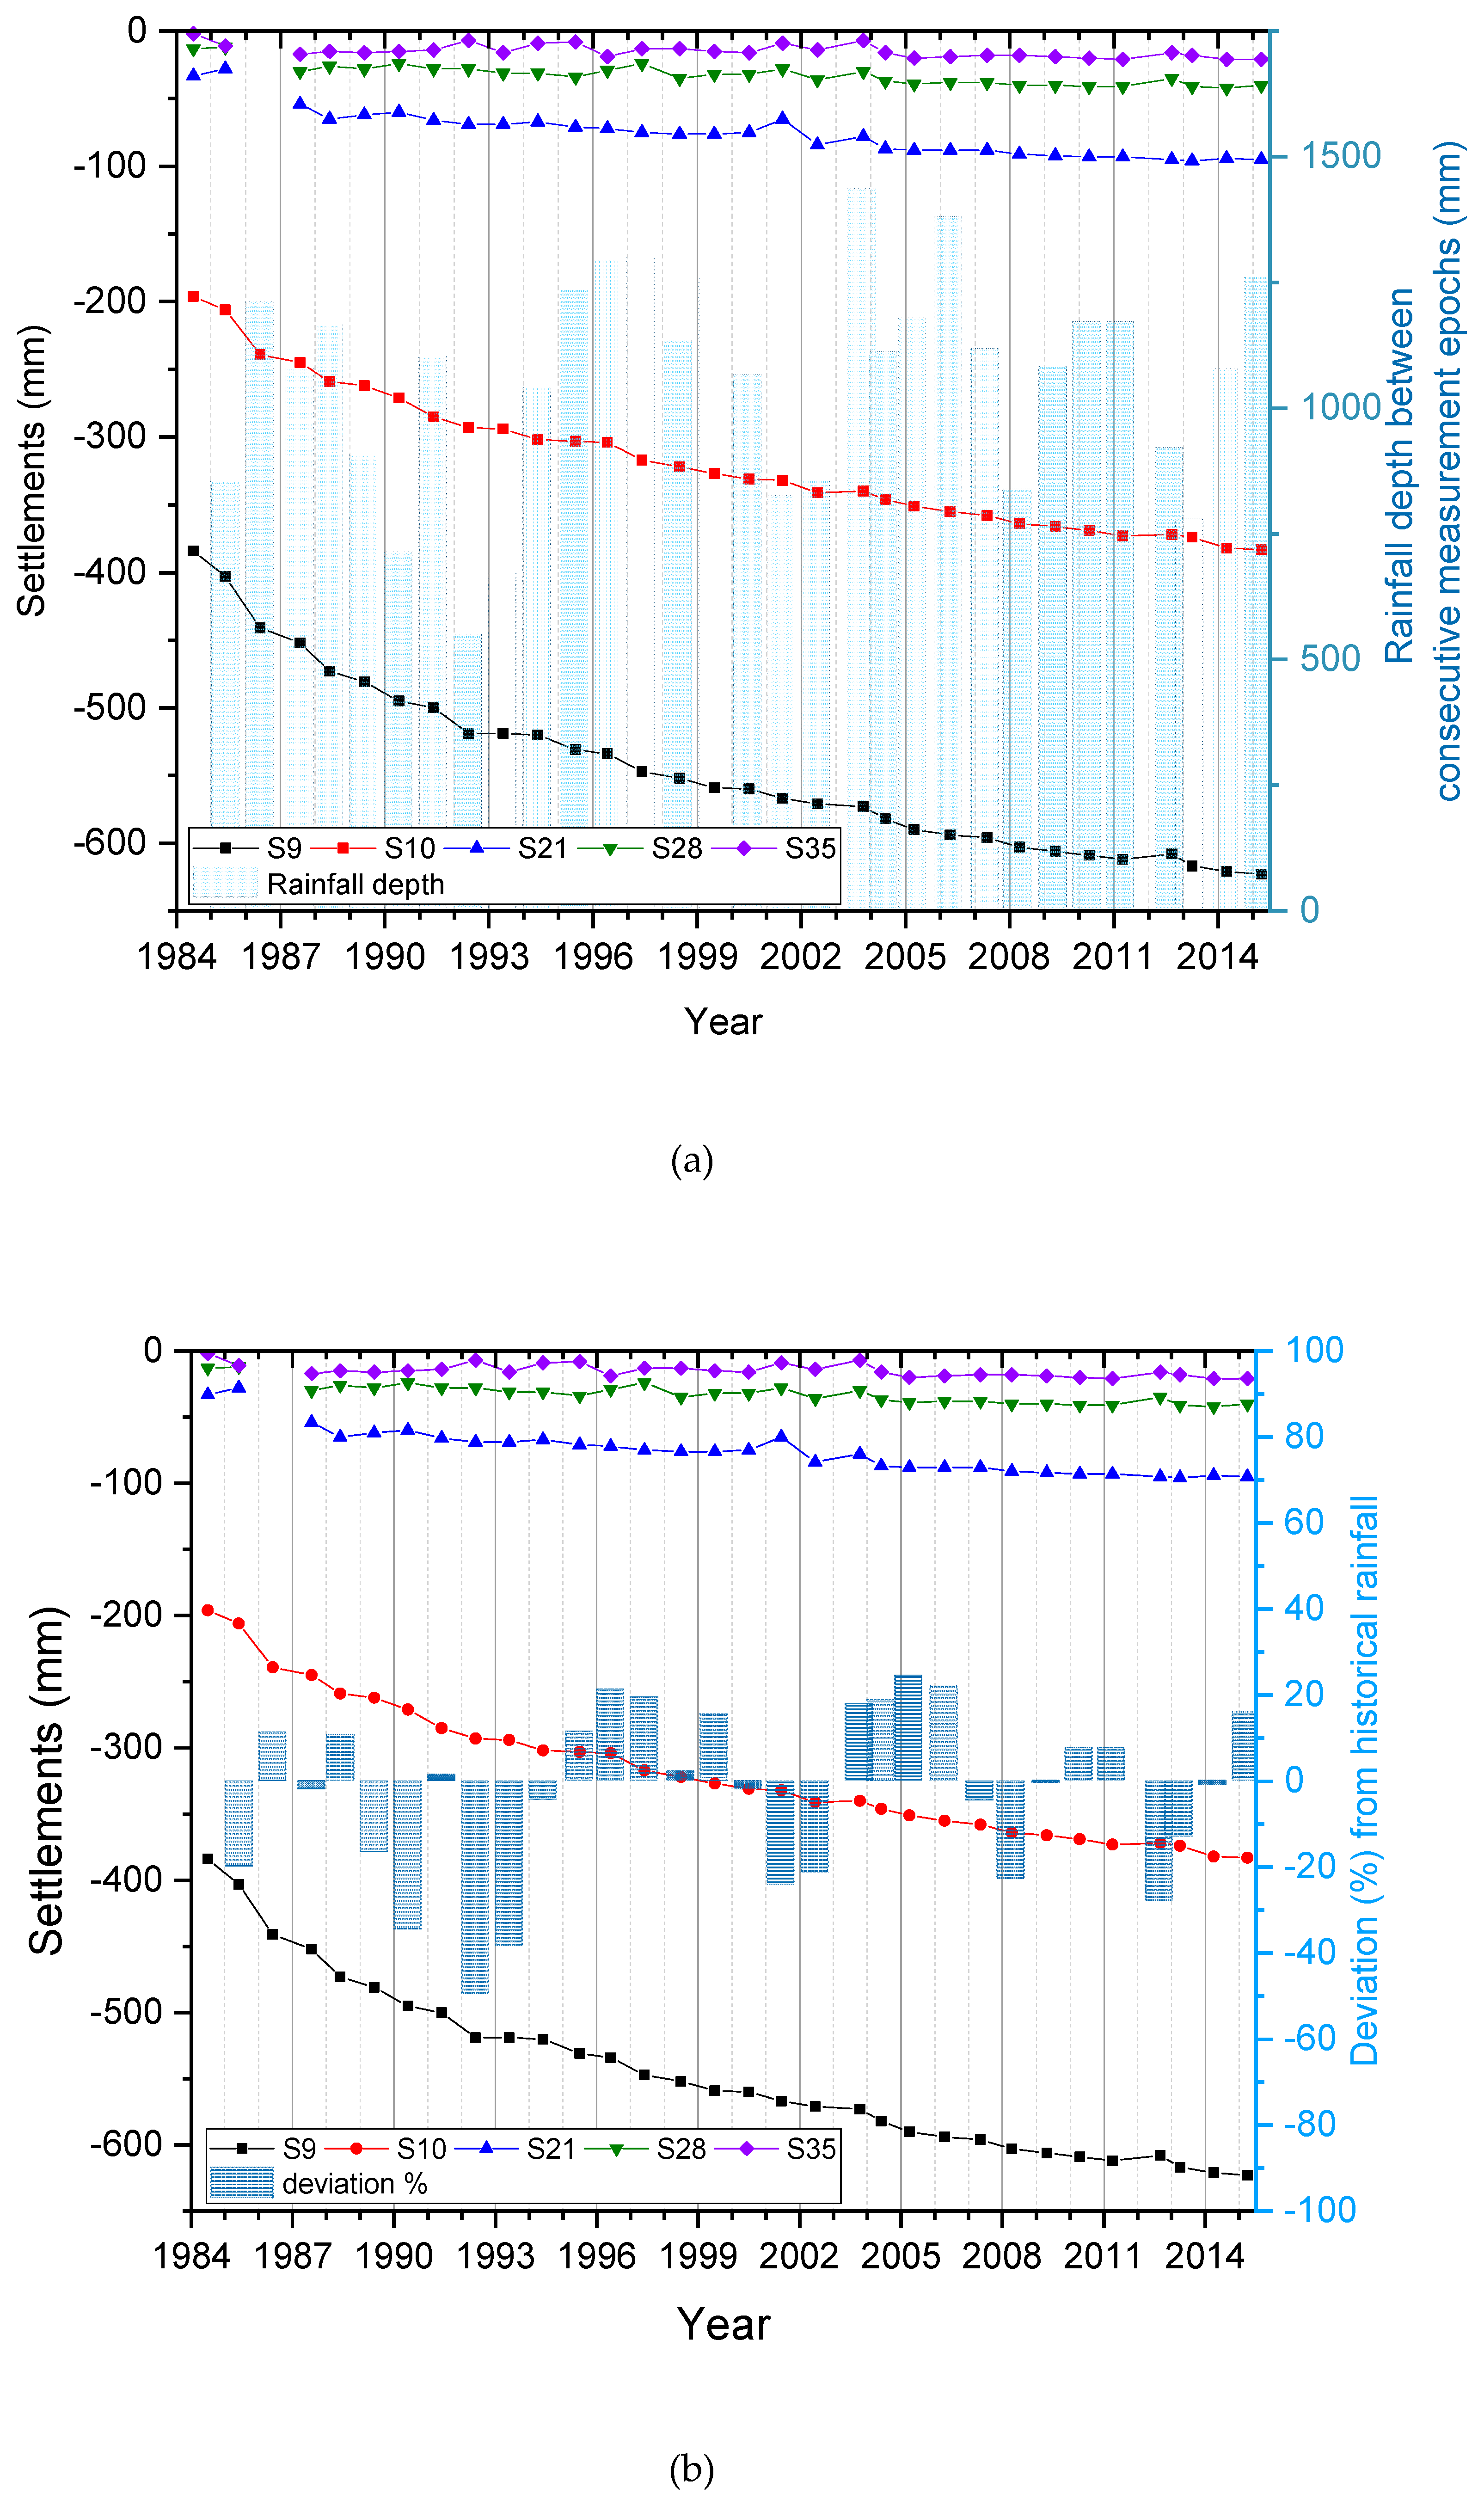
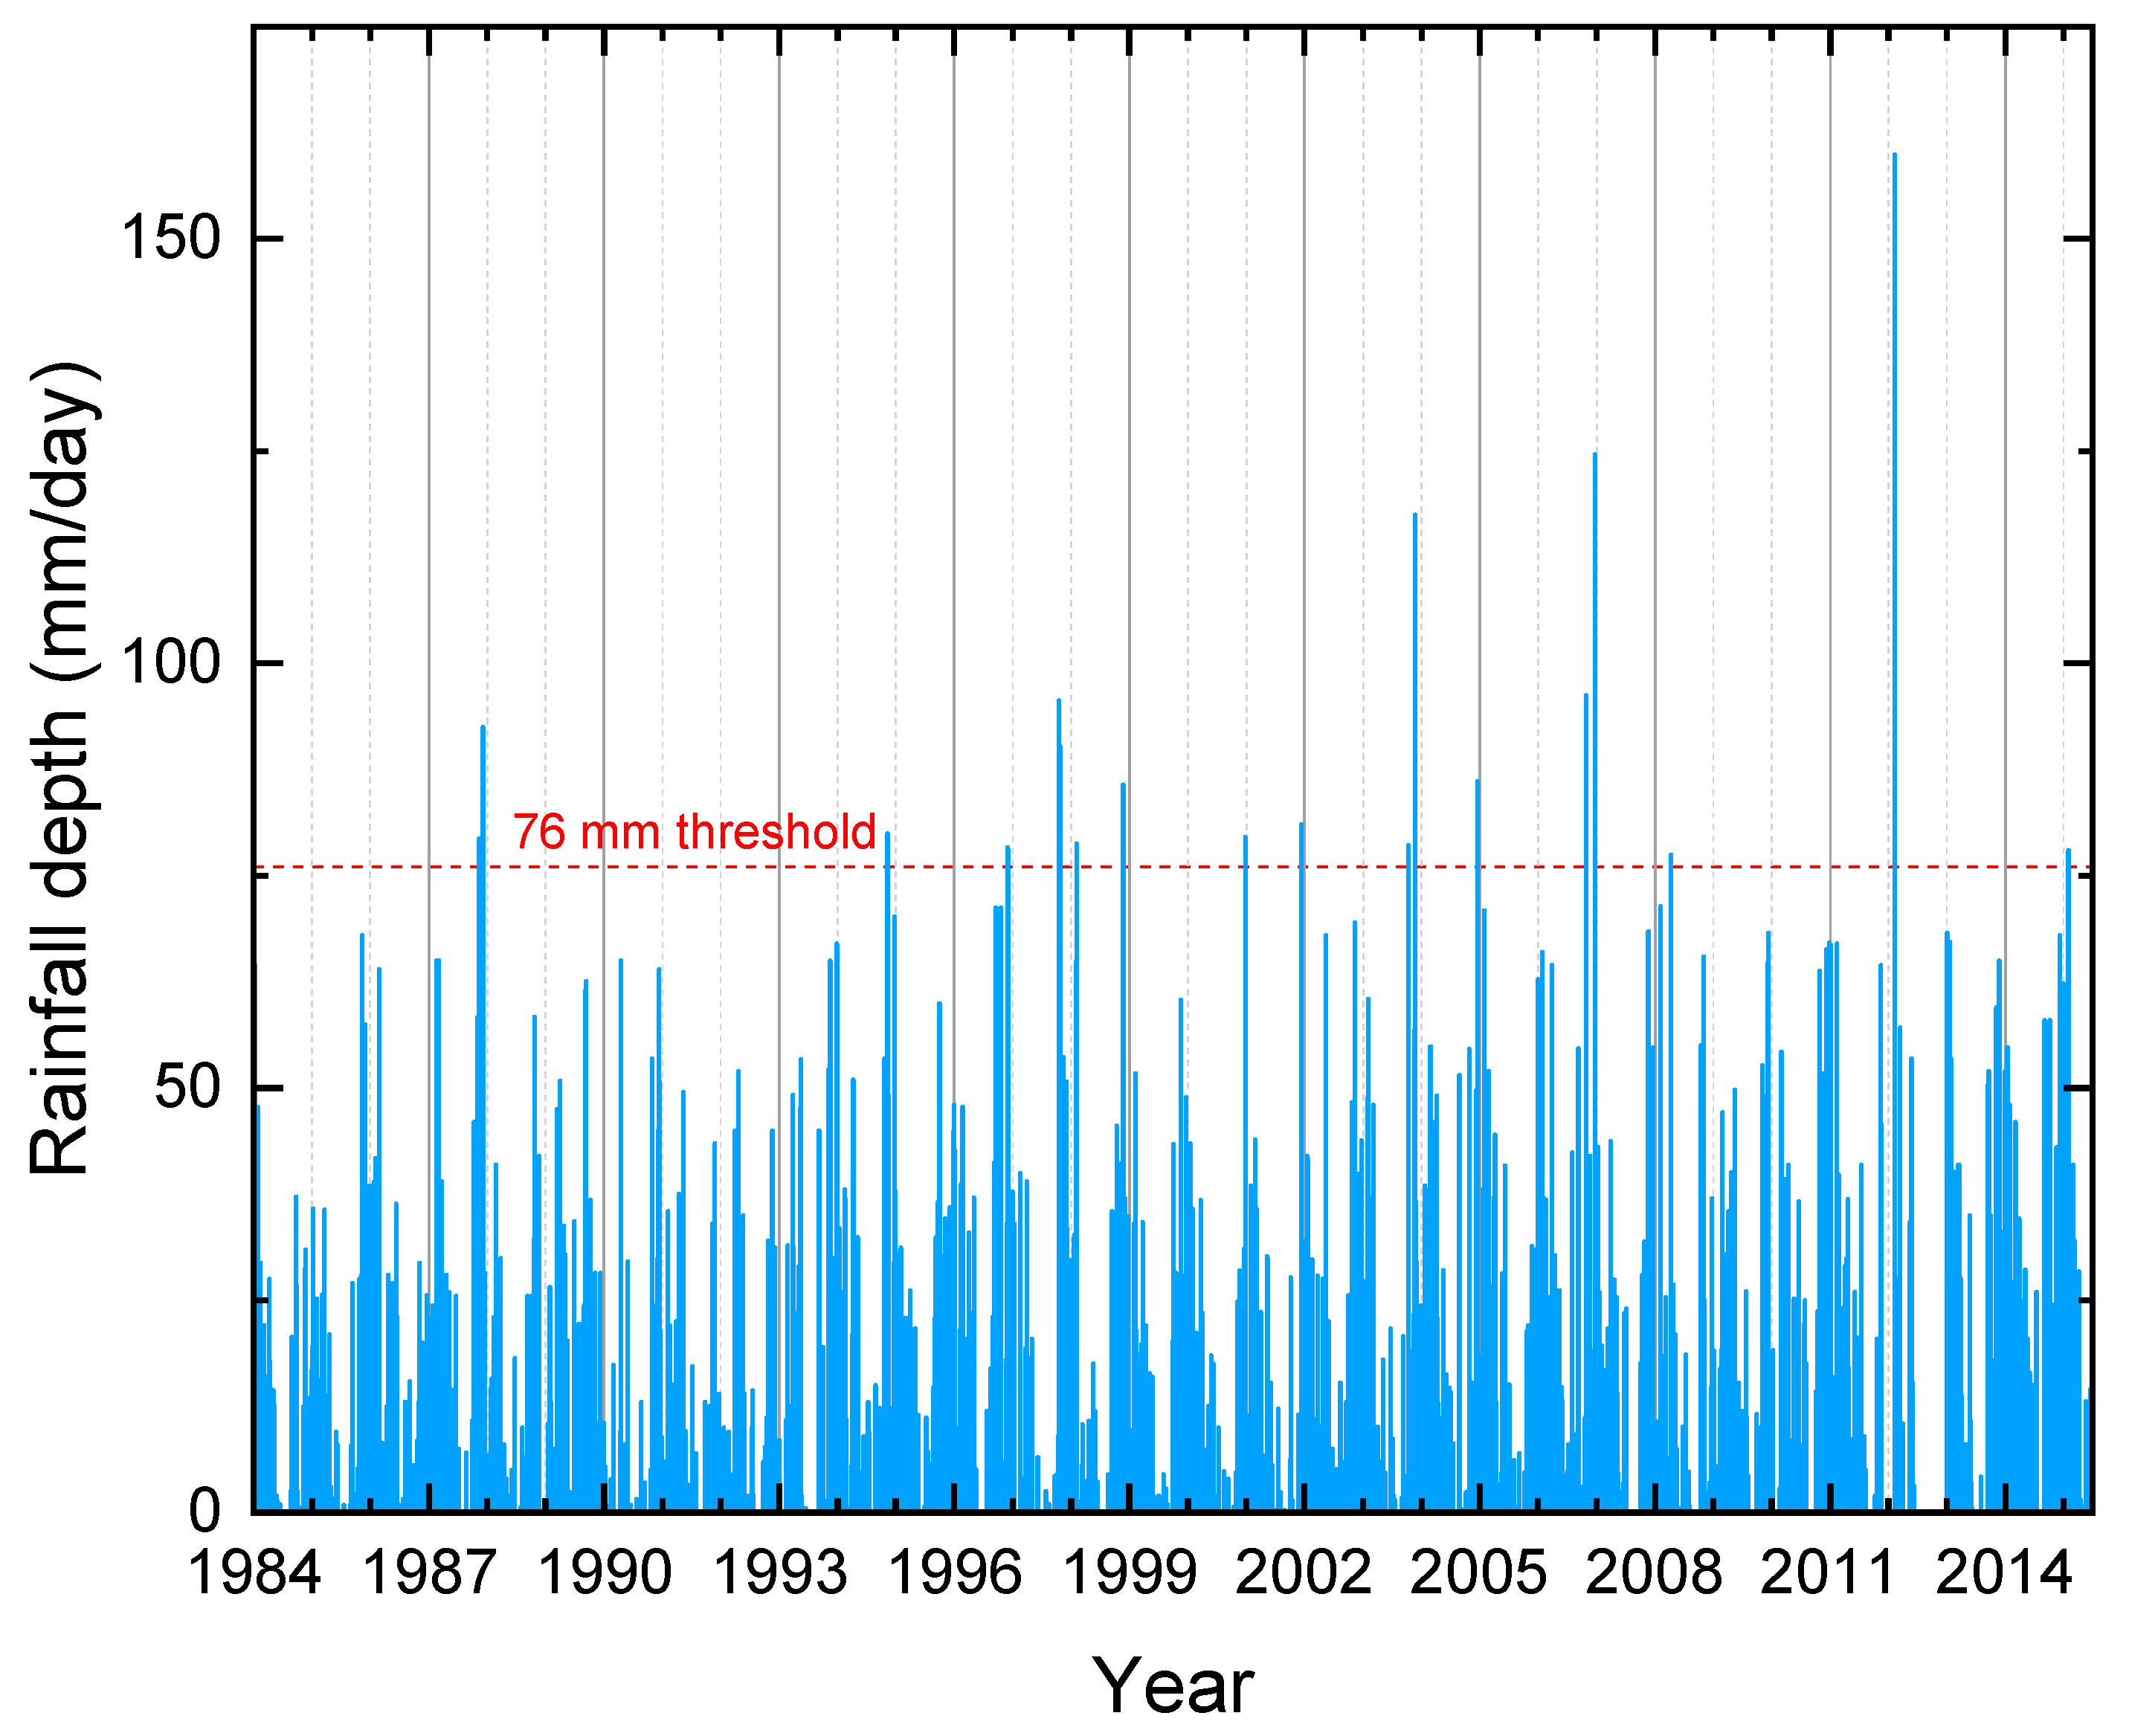
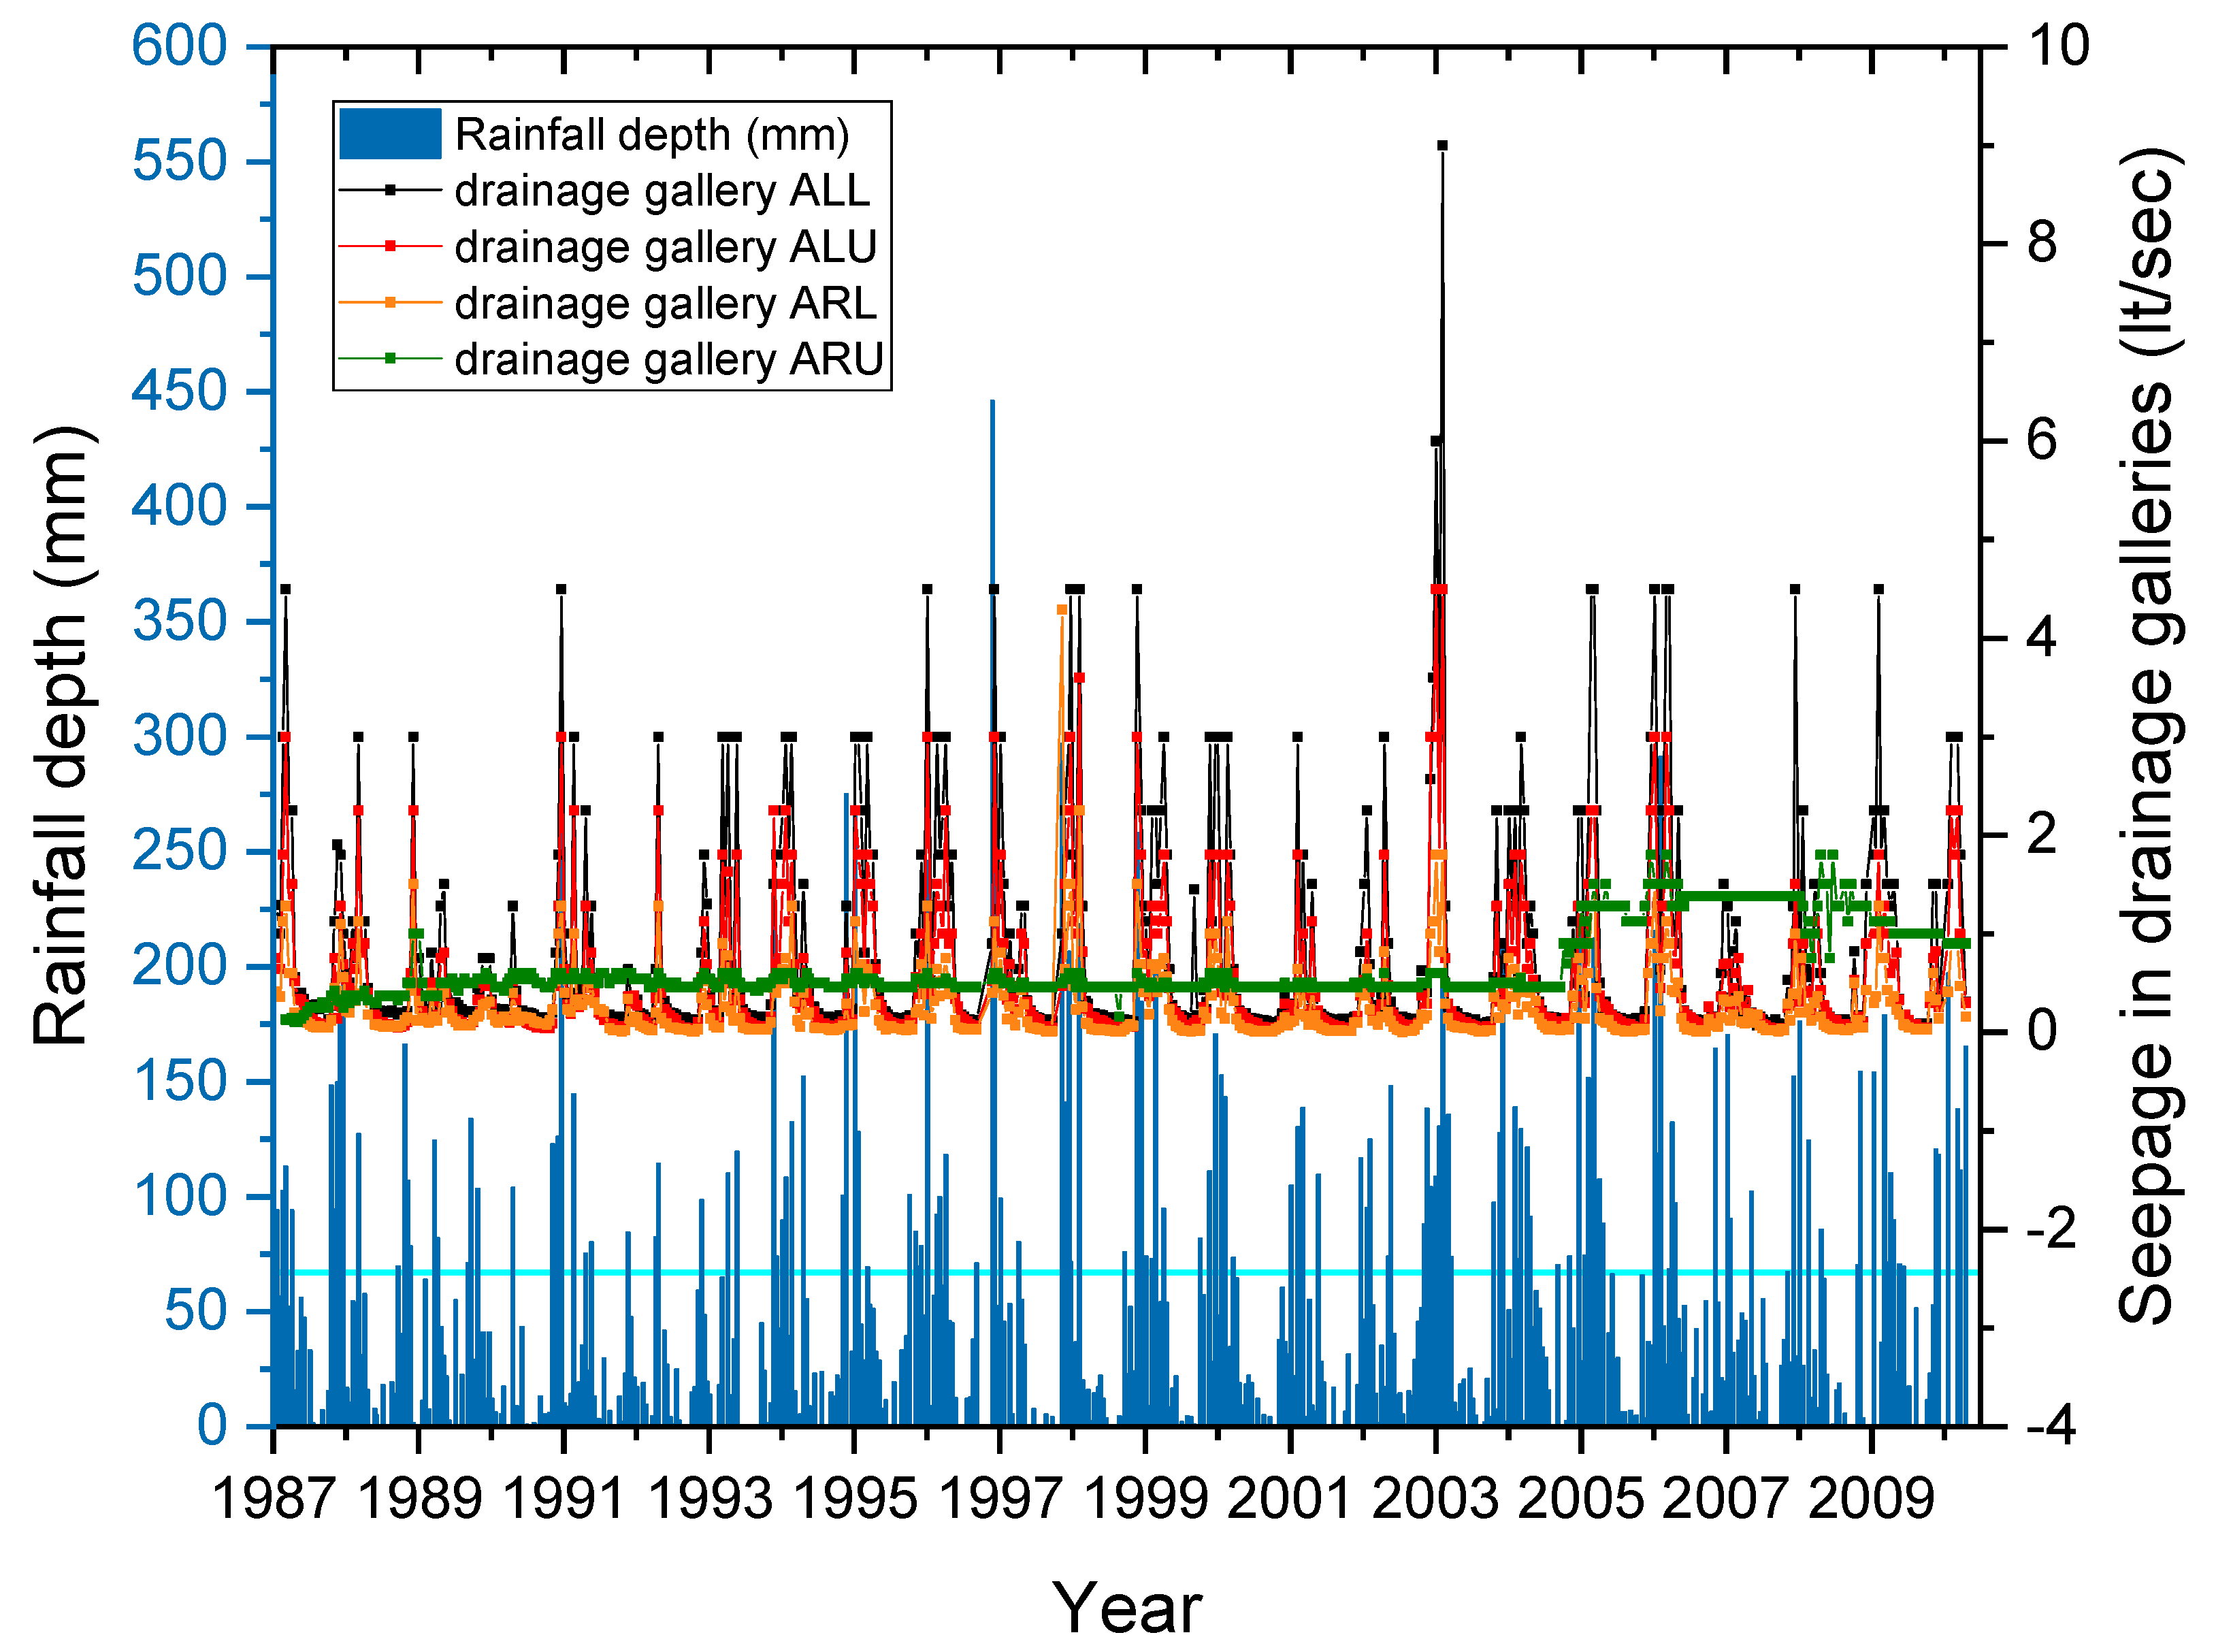
3.2.2. Settlements and Rainfall

Next, we investigate whether a relationship exists between settlements and rainfall at the dam site. Figure 8a shows the time history of the settlements and the annual rainfall depth. Here, the ‘annual’ rainfall depth corresponds to the amount of rainfall between consecutive measurement epochs (which is on average one year), not within a calendar year. In order to examine whether wet or dry years, i.e., changing climatic conditions, played any role in the evolution of settlements, we compare the observed settlements with the percentage of deviation of the rainfall depth between consecutive measurement epochs, to the corresponding historical depths.
One observation that can be made from Figure 8b is that the crest settlements do not have a direct relationship with the recorded rainfall events. On the other hand, there is some evidence that the D/S shoulder does. More specifically, uplift is observed when the amount of cumulative rainfall changes significantly either way (positive or negative) compared to the amount of rainfall that fell within the previous measurement epoch. In 1989, 1992, 2001, and 2012, the rainfall depth is substantially lower than in the 1988, 1991, 2000, and 2011 measurement epochs, respectively. The opposite stands for 1996, 1997, 1999, and 2003, with the rainfall depths being higher than in 1995, 1998, and 2002. These years correspond to times when uplift is observed at the D/S shoulder.

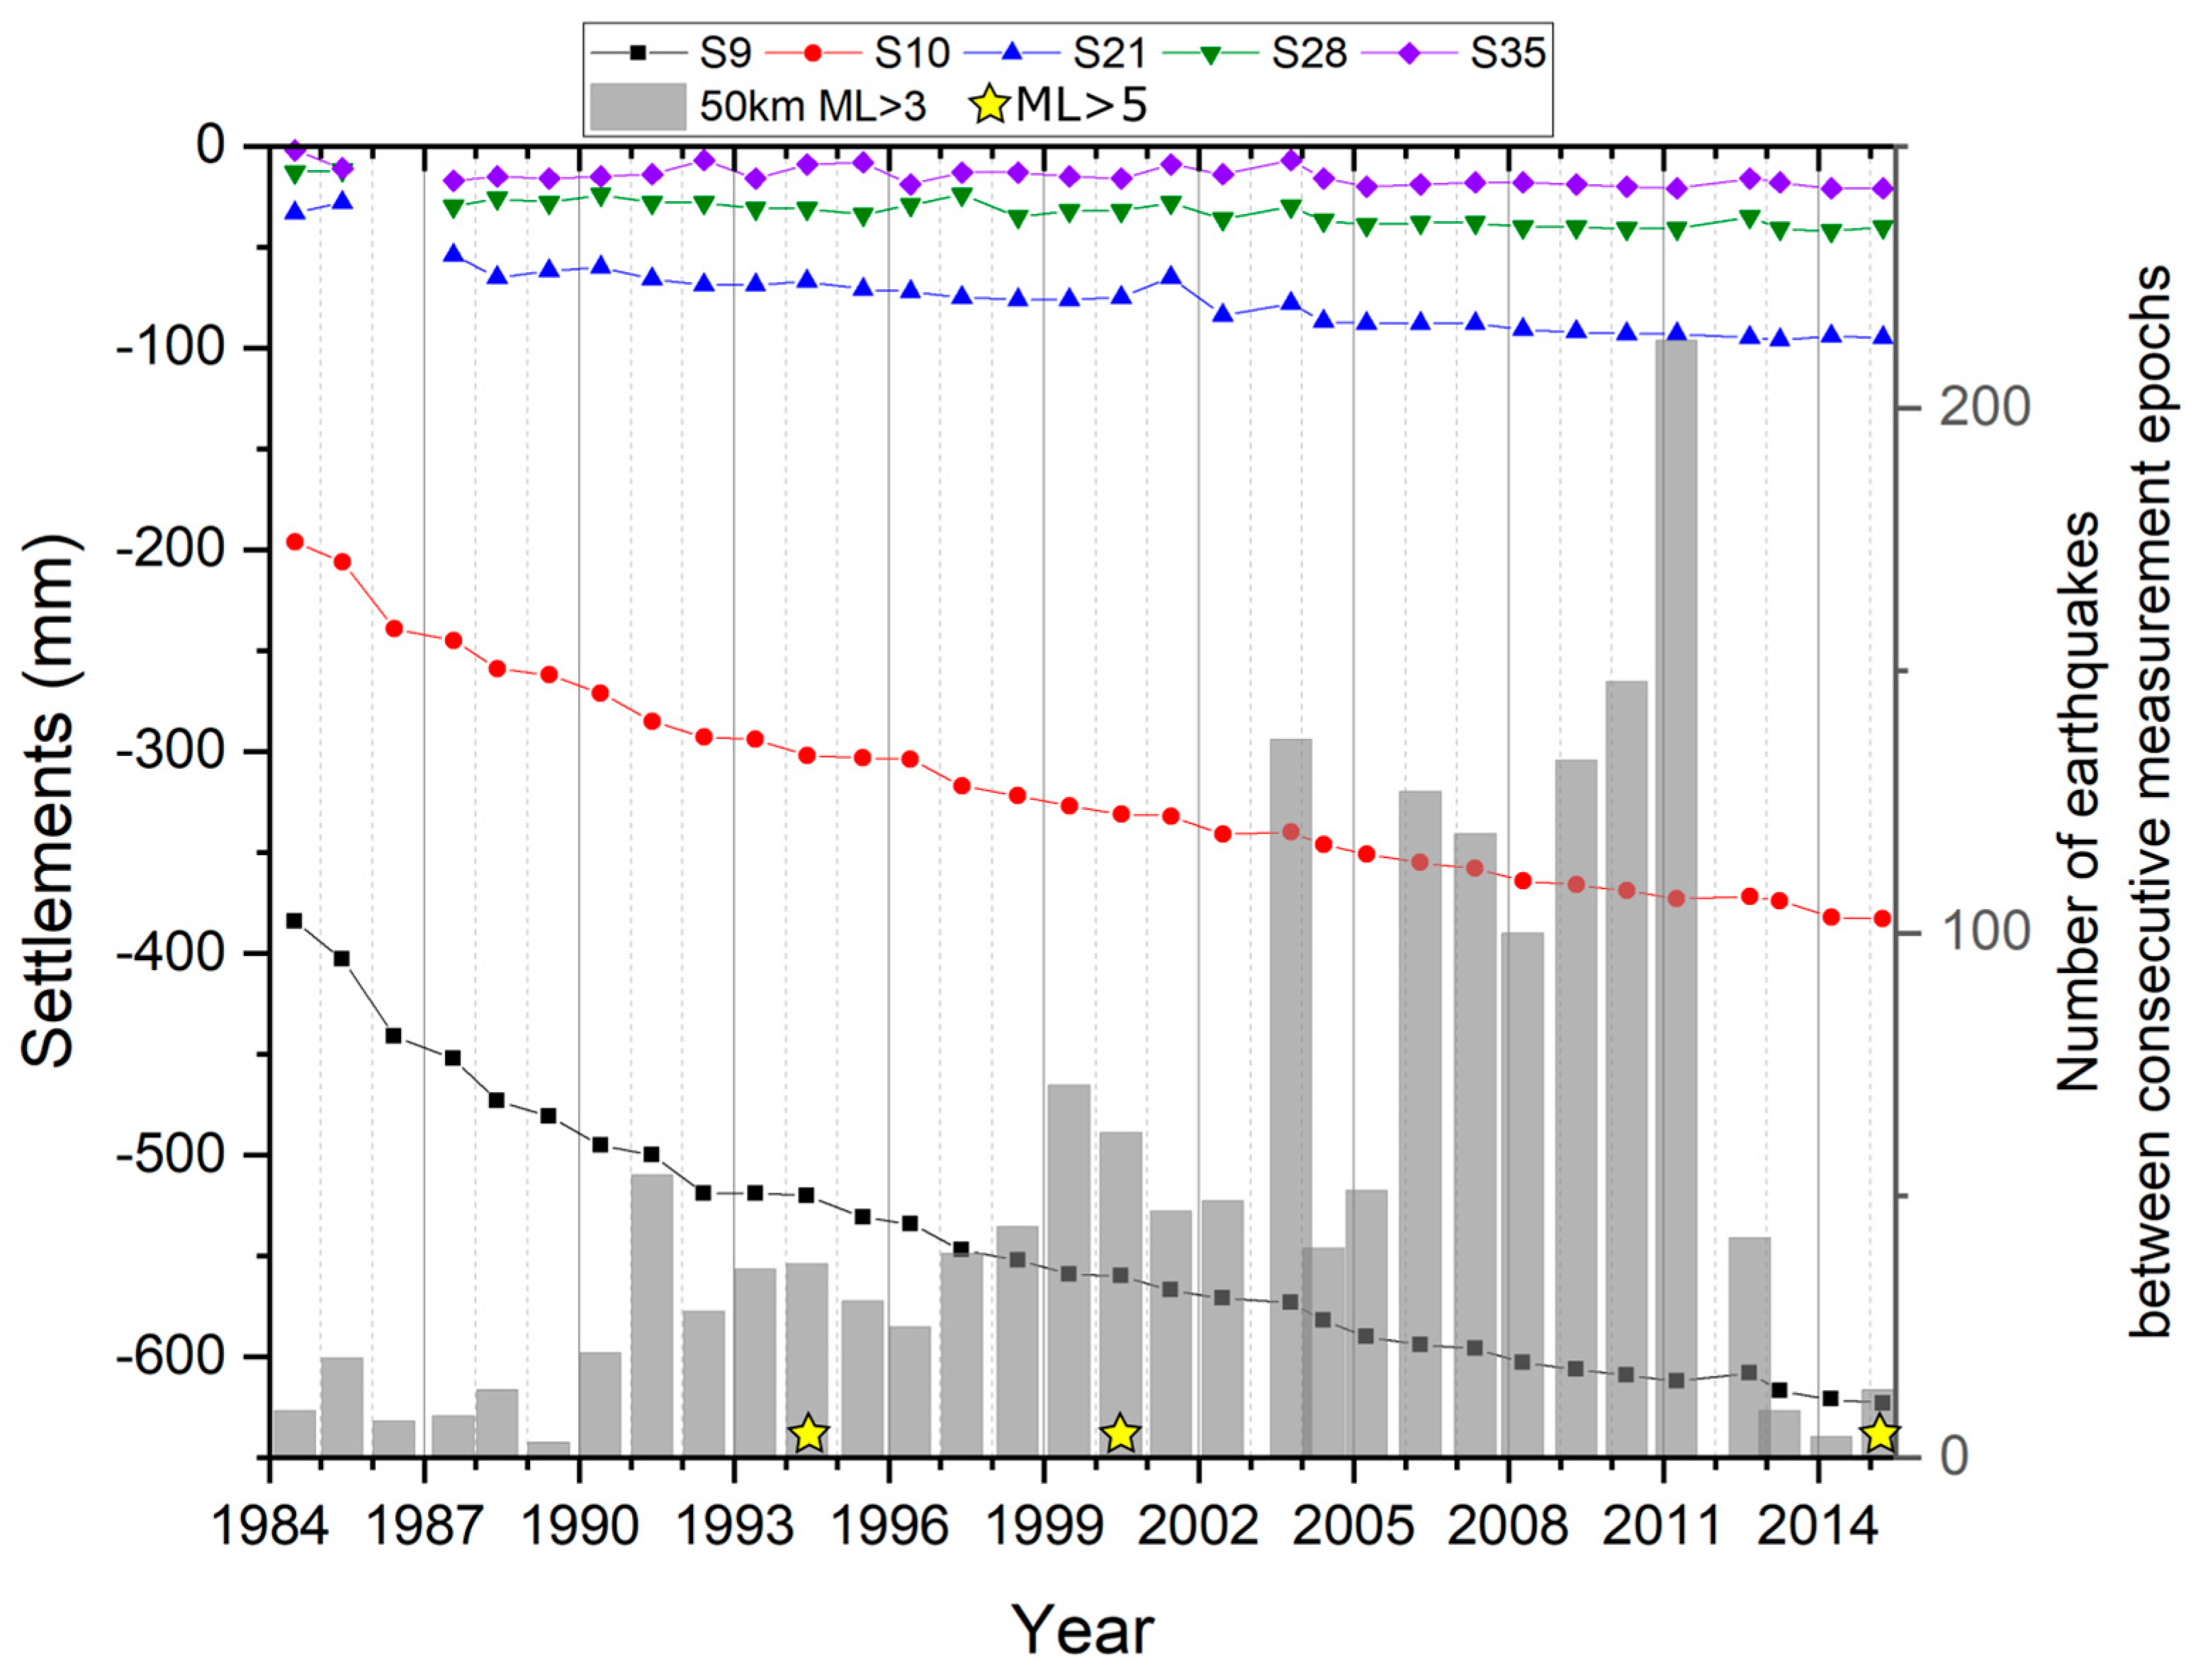
3.2.3. Settlements and Seismicity

We investigated, in a qualitative way, how/if the occurrence of seismicity affects the dam and whether the observed settlements at the times when higher rates are observed (1986, 1988, and 1992) could be earthquake-induced. Our study does not make use of any accelerometer data, as these were not available. Earthquakes are known to induce permanent settlements in earthfill dams, even failure, e.g., the Fujinuma dam [30]. Regarding the possible uplift, this could also be a response to earthquakes, which are known to cause an increase in water levels within wells [31] and/or an increase in the seepage rates [32], which could result in an increase in the pore pressures within the dam.
Figure 9 shows the settlements and the occurrence of earthquakes with magnitudes 3 or above, within 50 km from the dam between 1984 and 2015. The number of earthquakes for a specific measurement epoch corresponds to the number of earthquakes that occurred in the time period between that specific measurement epoch and the one preceding it. Earthquakes can have an impact on the geometry changes of the dam, especially on the settlements recorded at the crest [33]. No such significant effect can be seen from Figure 9 for the Pournari I dam. According to the earthquake catalogue from the Institute of Geodynamics, National Observatory of Athens, there have been three earthquakes with magnitudes of ML 5.4, ML 5.3, and ML 5.2 in 1993, 2000, and 2014, respectively (shown as stars in Figure 9) within a 50-km radius from the dam. The 13 June 1993 ML 5.4 earthquake appears under the 1994 measurement epoch in Figure 9. This is because it occurred after the 1993 measurement epoch (1 June 1993) had taken place. No earthquakes with magnitudes larger than the three reported occurred during the examined time period and within 50 km from the dam site. The notable increase of earthquakes at lower magnitudes over time could be due to the detection capability of the Greek National Seismic Network having improved since 2000. However, this should have had no impact on the earthquakes with numbers of magnitude of 5 or above.
The absence of evidence on the effect of earthquakes on Pournari I dam settlements is consistent with what is expected from the international literature. It has been observed that in general, earthfill and rockfill dams are quite resilient to earthquakes of magnitudes less than 6.5 [32]. All reported cases of dams having suffered severe damage in the form of longitudinal cracks or settlements following an earthquake refer to larger earthquakes than those that occurred close to the Pournari I dam area during the examined time period. Base sliding is another earthquake-induced failure, but it affects mainly concrete dams [34] rather than earthfill dams, and therefore is not examined in this paper. Liquefaction can occur for earthfill dams founded on alluvium. This is not the case for the dam under investigation. It can be concluded that the Pournari I dam has been unaffected by the seismic activity of the region (magnitudes up to ML 5.3), but this does not necessarily mean that the settlement rate won’t be affected in the case of earthquakes with larger magnitudes in the future.

4. Discussion

The analysis of the recorded crest settlements of the Pournari I dam following the methodology of [21] showed that the crest settlements are mainly due to the creep/secondary consolidation of the clay core. The annual rate of crest settlement as a percentage of the dam height dropped for the first time below the threshold of 0.02% [22] in 1985 and permanently after 1986, i.e., within 3 years (36 months) and 4 years (48 months) since the completion of the construction, respectively. Dascal [22] suggests that the annual rate of settlements of the crest should drop below 0.02% within 24–30 months since the completion of construction. The Pournari I dam appears to take longer to stabilise, but it is still within the maximum period of 8–10 years suggested by Lawton and Lester [35].
The maximum settlement observed at control station S9 at the U/S side of the crest corresponds to 0.6% of the dam height from the foundation. A number of studies have suggested threshold values below which the settlement, as a percentage of the dam height, is regarded expected/normal: [36] suggest the range 0.25–1% of the dam height. Dascal [22] gives a 0.35% threshold value, while [37] gives a range between 0.1% and 0.4%. The threshold values suggested by [22,37] were found to be conservative based on the evaluation of the crest settlements of more than 40 dams with a central clay core by [20]. More than 50% of these dams had a maximum recorded crest settlement higher that 0.4% of the dam height without these dams being at risk. The maximum settlement of the Pournari I dam, recorded 34 years since construction, is well below the 1% threshold, and does not pose any concerns for the dam’s structural integrity.
The differential settlement between the U/S and the D/S side of the crest is of the order of 250 mm, and can be attributed to the effect of the impoundment of the reservoir and the wetting of the U/S shoulder of the dam.

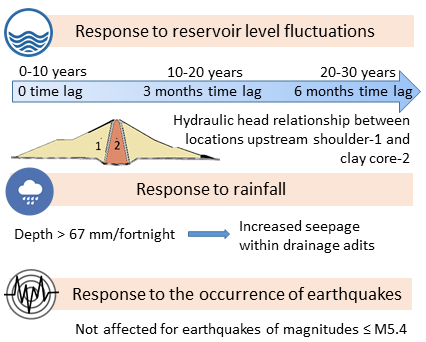
4.1. Observed Settlements and Reservoir Level Fluctuations

Our analysis provided no evidence of a direct relationship between the reservoir level fluctuations and the settlements of the crest and D/S of the Pournari I dam. The reservoir level fluctuations is expected to affect primarily the U/S shoulder [38]. The lack of direct relationship between reservoir level and crest settlements has been reported for other dams as well, e.g., [39]. Therefore, the absence of significant settlements at the crest and D/S shoulder at the Pournari I dam as a result of the reservoir fluctuations is not unexpected.
In the period under consideration, 1984–2015, the reservoir level fluctuates annually. The fluctuations are mostly within ± 5 m. Only once, in January 1987, was the reservoir level lowered significantly to 100.67 m AMSL (daily value), compared to levels before and after that date, reaching almost the minimum reservoir level for the production of electricity (100 m AMSL). This drawdown in July 1986 corresponded to 16% of the original reservoir depth (120 m AMSL). No significant settlements or settlement rates were observed for the crest and D/S shoulder immediately following this drawdown (Figure 7).
Tedd et al. [40] describe the effect of reservoir drawdown on the settlements of the U/S shoulder, the dam core, and the dam crest. They studied the crest settlements of the Ramsden dam, and concluded that crest settlements continued during drawdown, and while the reservoir was empty, this was reversed at some degree with refilling. For what they regarded as a minor reservoir drawdown (30% of the reservoir depth), they calculated a settlement of 12 mm for the U/S shoulder, which was equal to the measured value, while 50% of that settlement was reversed during refilling. The measured settlement of the crest was reported to be almost 1.5 times bigger than that of the U/S shoulder. They suggest that significant crest and U/S shoulder settlements take place every time the reservoir is lowered.
The fact that no significant settlements were recorded for the Pournari I dam following the 1987 reservoir drawdown does not necessarily mean that such settlements did not take place. A possibility could be that any settlements due to drawdown were partially reversed during refilling, and this is not evident in the settlement record because of the very low sampling rate (annual). By the time of measurement in June 1987, the reservoir level had already returned to 119 m elevation. The recorded settlements along the maximum cross-section could well reflect a net settlement. To investigate whether this hypothesis could be viable, we followed the approach and Equation (9) described in [40] to approximately calculate the expected settlement of the U/S shoulder at the Pournari I dam due to the drawdown in January 1987. We found it equal to 15 mm. Assuming that at least 50% of that settlement could have been recovered by June 1987 when measurements took place, a net settlement of 7–8 mm could be expected. We have no available observations for the U/S shoulder to validate this. According to [40], the crest settlements should have been bigger than our estimated 15 mm. Unfortunately, the approach of [40] cannot be used to estimate settlements on the crest due to reservoir drawdown. The measured settlement at control station S-9 on the U/S side of the crest in June 1987 was 11 mm. Assuming that a 50% recovery had taken place by that time, this would give a 22-mm settlement due to drawdown. This value is 1.5 times higher than the calculated settlement value for the U/S shoulder (15 mm) at the Pournari I dam, and is also consistent with the observations by [40] at Ramsden dam.

4.2. Observed Settlements and Rainfall

Prolonged extreme rainfall events have been identified in [41] as a potential factor affecting the crest and D/S shoulder through surface erosion. As extreme rainfall, the authors of [41] use examples of storms with rainfall depths from 76 mm to 210 mm/day. Figure 10 shows the recorded daily rainfall depths at the Pournari I dam during the time period 1984–2015. There are 19 occasions when this rainfall exceeded the lower threshold of what is characterised as extreme rainfall in [41]. None of these occasions could be directly related to the times when uplift was observed.
There are very few studies in the international literature that investigate the effect of rainfall on earthfill and rockfill dams. Most of the existing studies focus on the effect of rainfall or extreme rainfall events on the occurrence of flooding events and the risk of overtopping. Ref. [42] simulated the effect of rainfall on rockfill and suggested that long-term deformations of the rockfill are controlled by the wetting history of the dam shoulders. They showed that the settlement rate increases at times of extreme rainfall events with an indicative value of 300 mm/month (Figure 3 in [42]). Although there were occasions when the rainfall at the Pournari dam exceeded 300 mm/month, no increased settlement rates were observed at those times. This could be due to the material used for the Pournati I dam shell (sand and gravels), which is finer than the rockfill material of the dam in the study of [42], and hence the infiltration rate is lower. A higher infiltration rate and consequently increased pore pressure results in the decrease of the effective stress, i.e., weakening of the dam. This does not appear to be the case for the Pournari I dam.
Ref. [43] link rainfall and leakage as a possible mechanism for internal erosion with leakage being dominated by rainfall. Following the methodology on threshold correlation by [19], we compare the rainfall depths to leakage reported within four drainage galleries at the Pournari I dam (for location see Figure 3). We find that the volume recorded in the drainage galleries is strongly correlated to rainfall for cumulative rainfall depths over the same fortnightly period above 67 mm (horizontal line in Figure 11). This correlation is consistent with published literature [38], and taking into account that the recorded leakage rate in the drainage galleries is low, we do not expect the Pournari I dam to be at risk under the conditions examined in the present study.
The D/S shoulder can also be affected by inflow from seepage from springs, mainly at areas prone to karstification. At the Pournari I dam site, there are no springs (it is founded on flysch); however, the existence of small lenses of conglomerates within the sandstone strata exhibiting high weathering has been reported [25]. Our results on the correlation between rainfall depths and seepage are consistent with observations during the investigation of the foundation bedrock conditions that preceded grouting. It had been found that the ground water profile fluctuated over several meters annually, with some water inflow recorded in the drainage galleries after rainstorms. This was attributed to the presence of open joints and bedding planes [25].

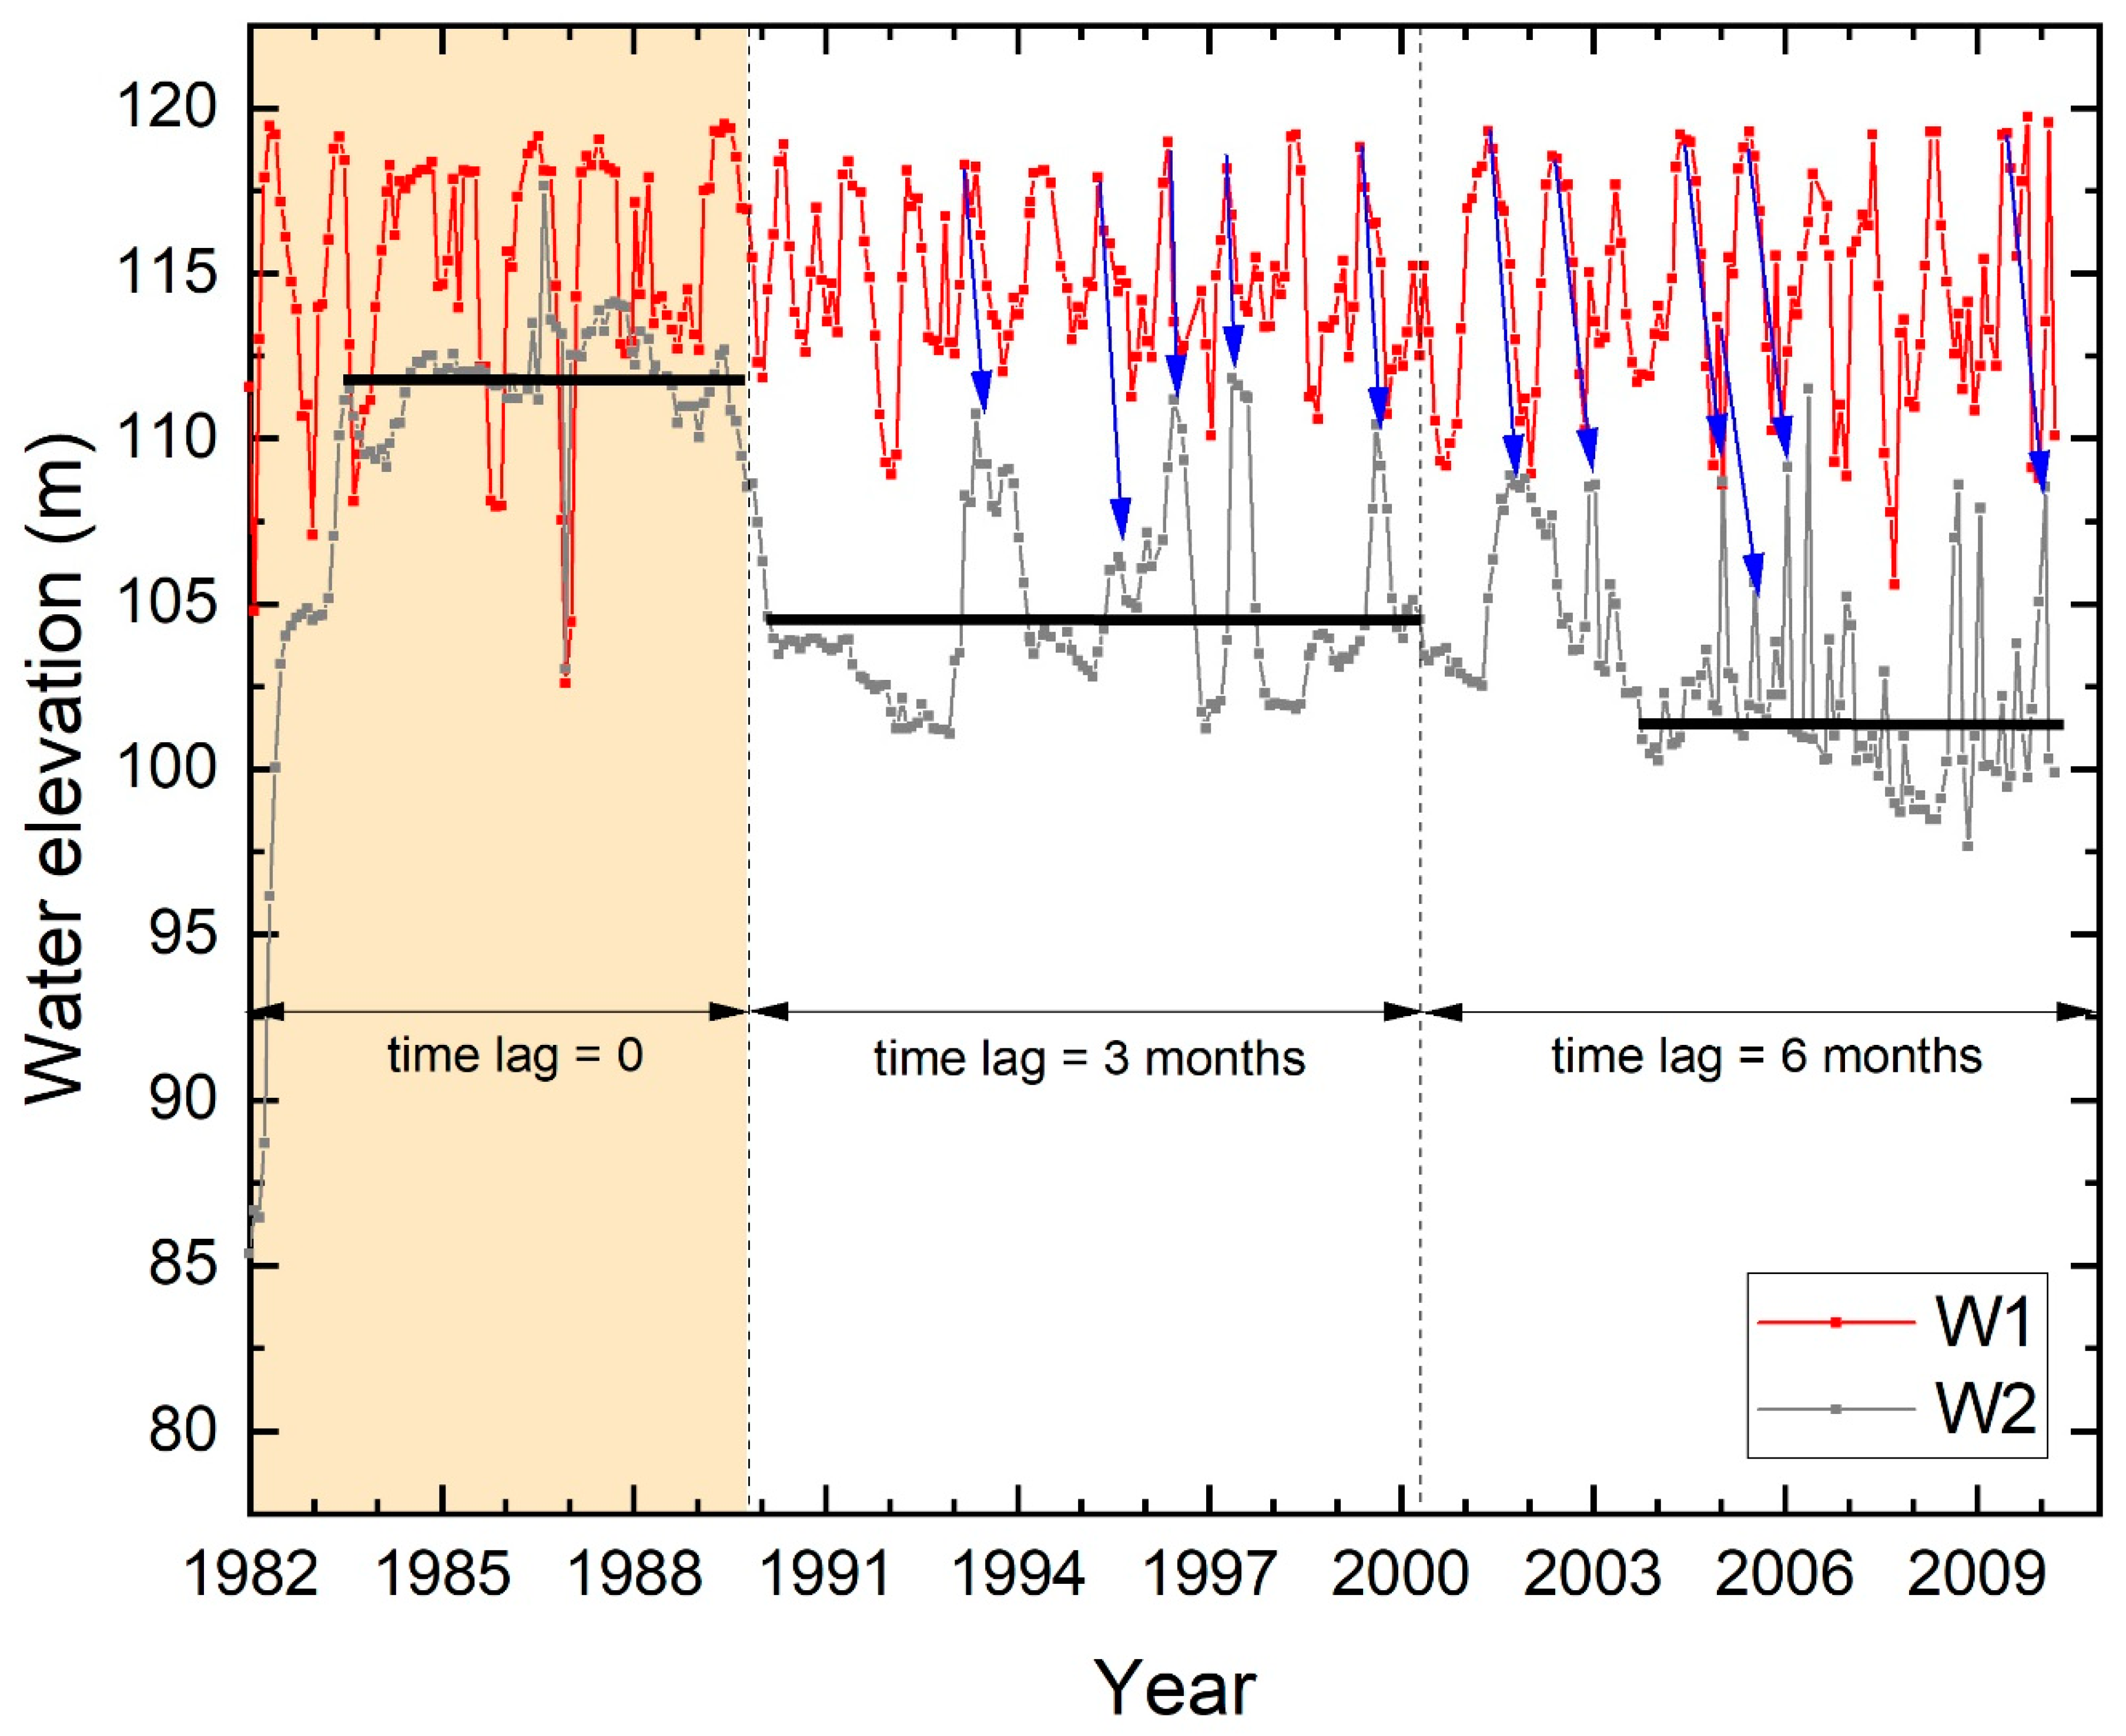
4.3. Time Lag between Recorded Settlements and Reservoir Level Fluctuations

In our analysis, we did not consider a time lag between the settlements and the reservoir level. A potential time lag could be due to either the hydraulic conductivity values of the material of the upstream shoulder and the core (in the case of steady state) or the storage capacity of the material [44]. Due to the different hydraulic conductivities of the dam materials, it should be expected that any potential changes in the geometry of the dam observed at the crest and D/S shoulder as a result of the reservoir level fluctuations occur with some delay. In the absence of information on the hydraulic conductivity of the U/S and D/S shoulder as well as the filter and the clay core, precise estimation of such a time lag is not possible. The investigation of the role of the storage capacity would require numerical modelling and unsaturated conditions, and this is outside the scope of this paper. Instead, we used available elevations of the water (hydraulic head) in four piezometers installed within the dam (for location, see Figure 12).
The time history between 1982 and 2010 of the hydraulic head in W1–W4 is shown in Figure 13. From Figure 13, it is evident that the upstream shoulder (W1) responds immediately to changes in the water level in the reservoir. The core (W2) was following the changes up to around late 1989 (see further for details), after which there appears to exist a time lag between the water elevation in W2 and the reservoir level fluctuations. For example, the local minimum in 1990 in W1 values appears slightly earlier than the 1990 local minima in W2 values (Figure 13 and Figure 14). This time lag appears to be getting bigger over time if one compares the W1 peaks with the W2 peaks and attempts to align them. Precise determination of this time lag has not been possible for the period 1982–2010 from the available data mainly because the two time series are not evenly spaced, and the traditional cross-correlation analysis [45] cannot be applied. Interpolation could be used to overcome this, but such an approach would increase the possibility of biased results.
Ref. [46] along with [47] suggest a methodology for the analysis of unevenly spaced time series in the frequency domain. This could have been an alternative approach in the case of the Pournari I dam, for a constant time lag between W1 and W2. Since the time lag varies over the examined time period, the different time lags could only be estimated graphically: We manually shifted the W2 time series over the W1 time series. By doing so, we were able to identify three time periods with different time lag characteristics, as described below. For clarity purposes and to help with the following discussion, we present again the evolution of the hydraulic head in W1 and W2 in Figure 14. In this figure, W1 record is used to compare W2 with the reservoir level fluctuations, as both W1 and W2 records share the exact same sampling times. We documented the almost perfect match between the reservoir-level fluctuations and the hydraulic head in W1 (see also Figure 13) earlier; therefore, the use of W1 instead of the reservoir level record is valid.
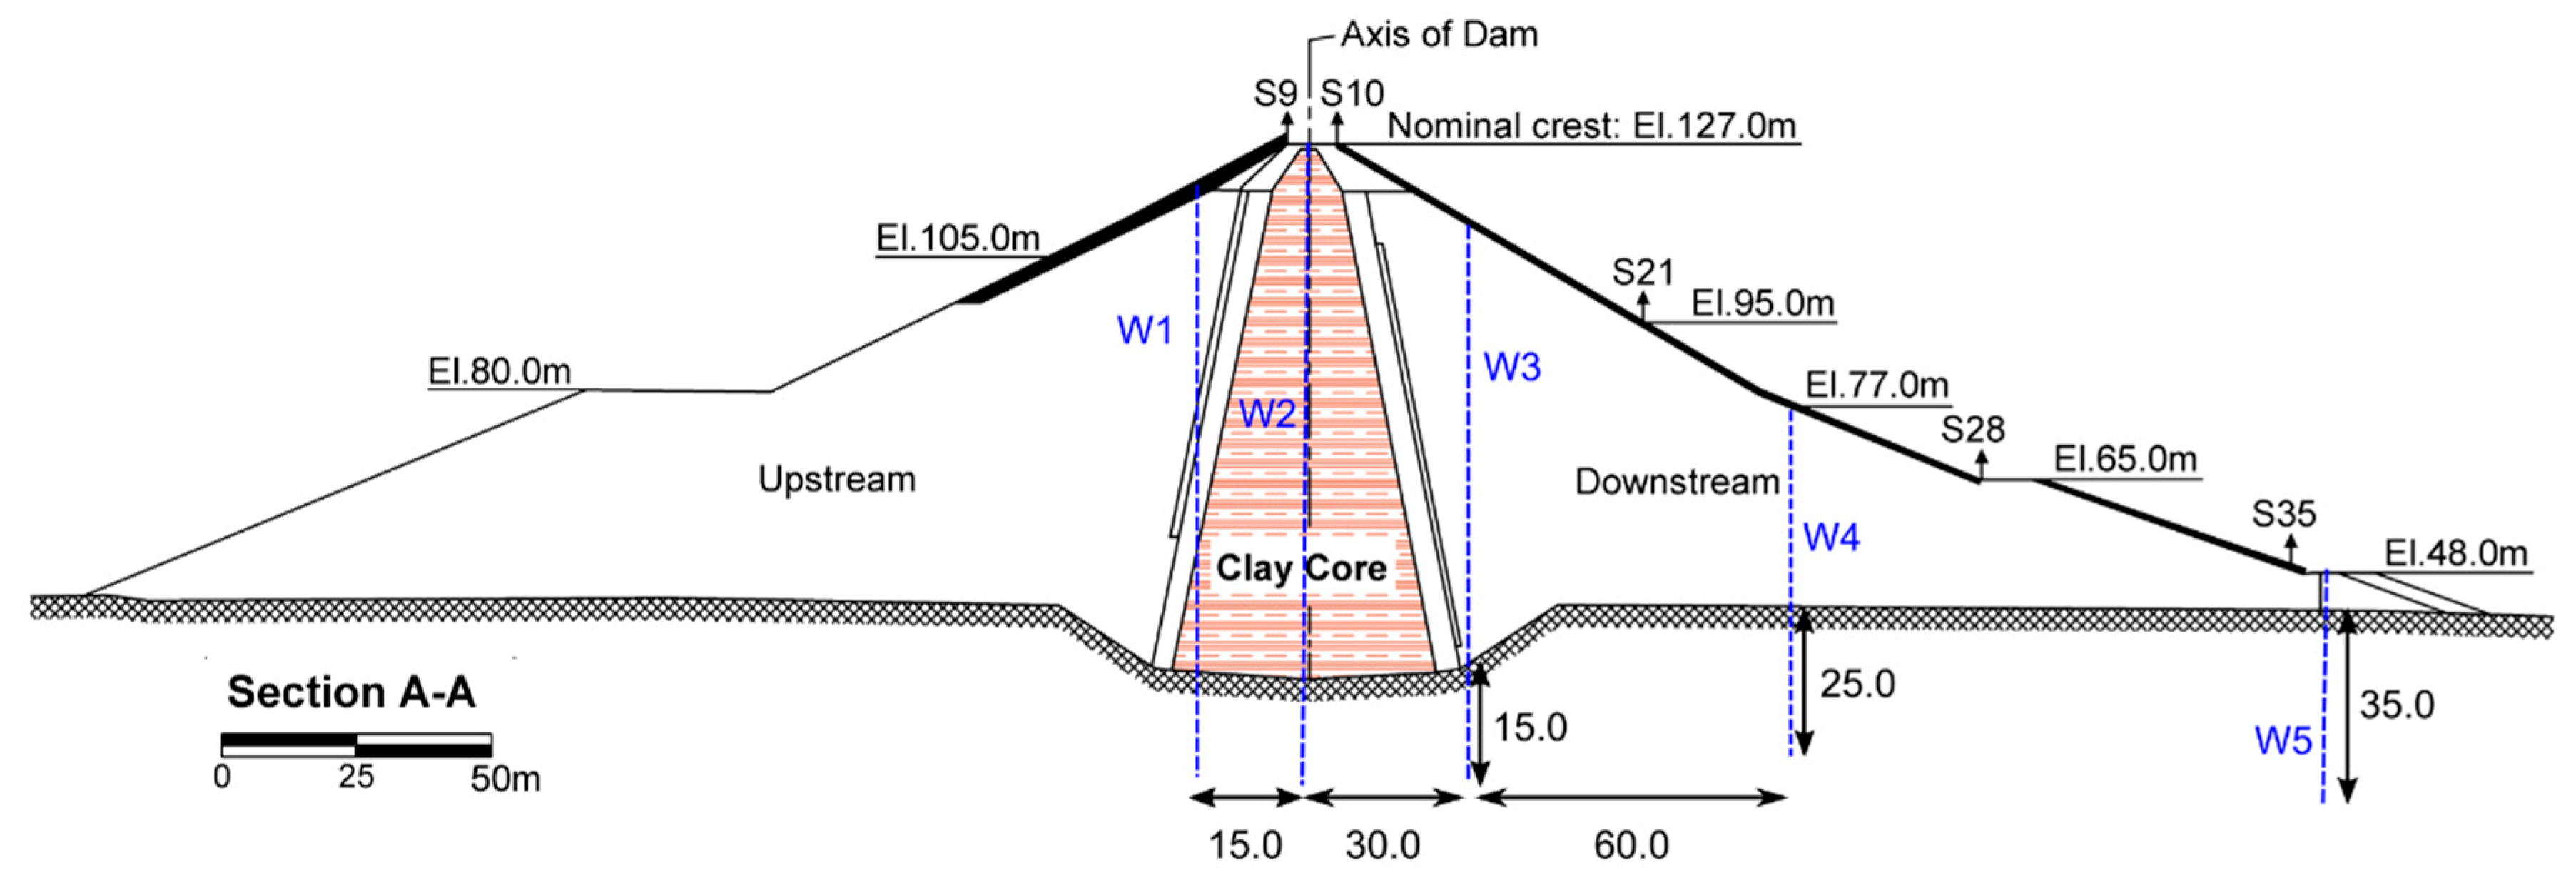
  • 1982 to December 1989: During this time period, the hydraulic head in the core (W2 location in Figure 12) does not appear to have a time lag with the reservoir-level fluctuations despite the fact that it does not exactly follow the fluctuation pattern. More specifically, both W1 and W2 appear to have a drop in the hydraulic head in January 1987, with the last simultaneous drop in July 1989 (first dashed line from the left in Figure 14). The shape of the W2 curve between 1982 and late 1989 (highlighted area in Figure 14) is characteristic for the period during which the clay core gets saturated: the hydraulic head increases, and then reaches a plateau, at which point the core is regarded as saturated. The latter has been observed in early studies on unsaturated clays, e.g., [39].
  • Early 1990 to mid 2000: During this period, the mean value (104.46 m) of the hydraulic head (second horizontal black line in Figure 14) is decreased compared to the previous time period (111.83 m). The observed peaks in the W2 values appear to have a time lag with the corresponding peaks in W1 (corresponding peaks shown with blue arrows in Figure 14). This time lag is 3 months.
  • Mid 2000 to end of record in 2010: During this time period, the mean of the hydraulic head values has dropped further (now at 101.84 m). The observed time lag has increased to 6 months.
The decreasing mean value of the hydraulic head over time has been reported in the literature (see [39]), and is expected. A time lag of a few days up to a few months, consistent with the time lag estimated for the Pournari I dam, between reservoir-level fluctuations and the downstream shoulder has also been observed and explained using the theory for unsaturated soils by [48]. The varying time lag, on the other hand, is not easy to interpret. A possible explanation is that the clay core was not entirely homogeneous when constructed, and that small heterogeneities, e.g., small fractures/fluid pathways, were present. These allowed for an immediate response of the core to the reservoir-level fluctuations. Over time, the swelling of clay during saturation resulted in the partial or complete closure of these pathways, and consequently, the observed time lags. However, this is something that needs to be further investigated, and is the subject of an ongoing study.
The downstream shoulder appears to be unaffected by the changes in the reservoir, which is consistent with our previous observations. Instead, the hydraulic head in W3, W4, and W5 is more consistent with the rainfall depth (Figure 13).

4.4. Observed Uplift at the Toe of the Dam

A few millimetres (up to 13 mm, see Table 1) uplift has been observed mainly at the Series 2 and Series 3 control stations. Earlier in the analysis (Section 3.1), we showed that this uplift is not likely to be an artefact, and that the recorded values are significantly different to the standard error of the measurements. Examining the recordings in the long-term, the overall trend for all control stations is to settle. The magnitude of the uplift movement is small: a maximum of 13 mm over a 30-year period. Whatever the causing effect, the response of the dam appears to be elastic, i.e., the vertical movement became a settlement by the next measurement epoch. Uplift movements at the toe of earthfill dams could be attributed to a number of possibilities, not all of which are applicable for the Pournari I dam:
  • Rotational slide of the downstream slope. This is not likely to be true, as uplift is not observed at all times, but rather at specific, not necessarily consecutive, measurement epochs. In addition, to the authors’ knowledge, no cracks have been reported from visual inspection, which is another sign that indicates a potential slide.
  • Effect of groundwater. This could be a likely factor; however, the absence of relevant data, e.g., pore pressures at the toe of the dam, do not allow any analysis to be made regarding its effect to the observed vertical movements.
  • Swelling rocks beneath the dam. Swelling of rocks resulting in deformations has been reported for tunnels. The main contributing factor is the presence of clays or clayey rocks [49]. Ref. [25] mentions the presence of some clay material at the dam foundation level. This could be a possible cause of the observed uplifts, although the fact that this uplift is reversed by the next measurement epoch makes this scenario unlikely.
  • Internal erosion that could result in uplift at the toe of the dam. From the available data used in this study, there is no evidence to support this.

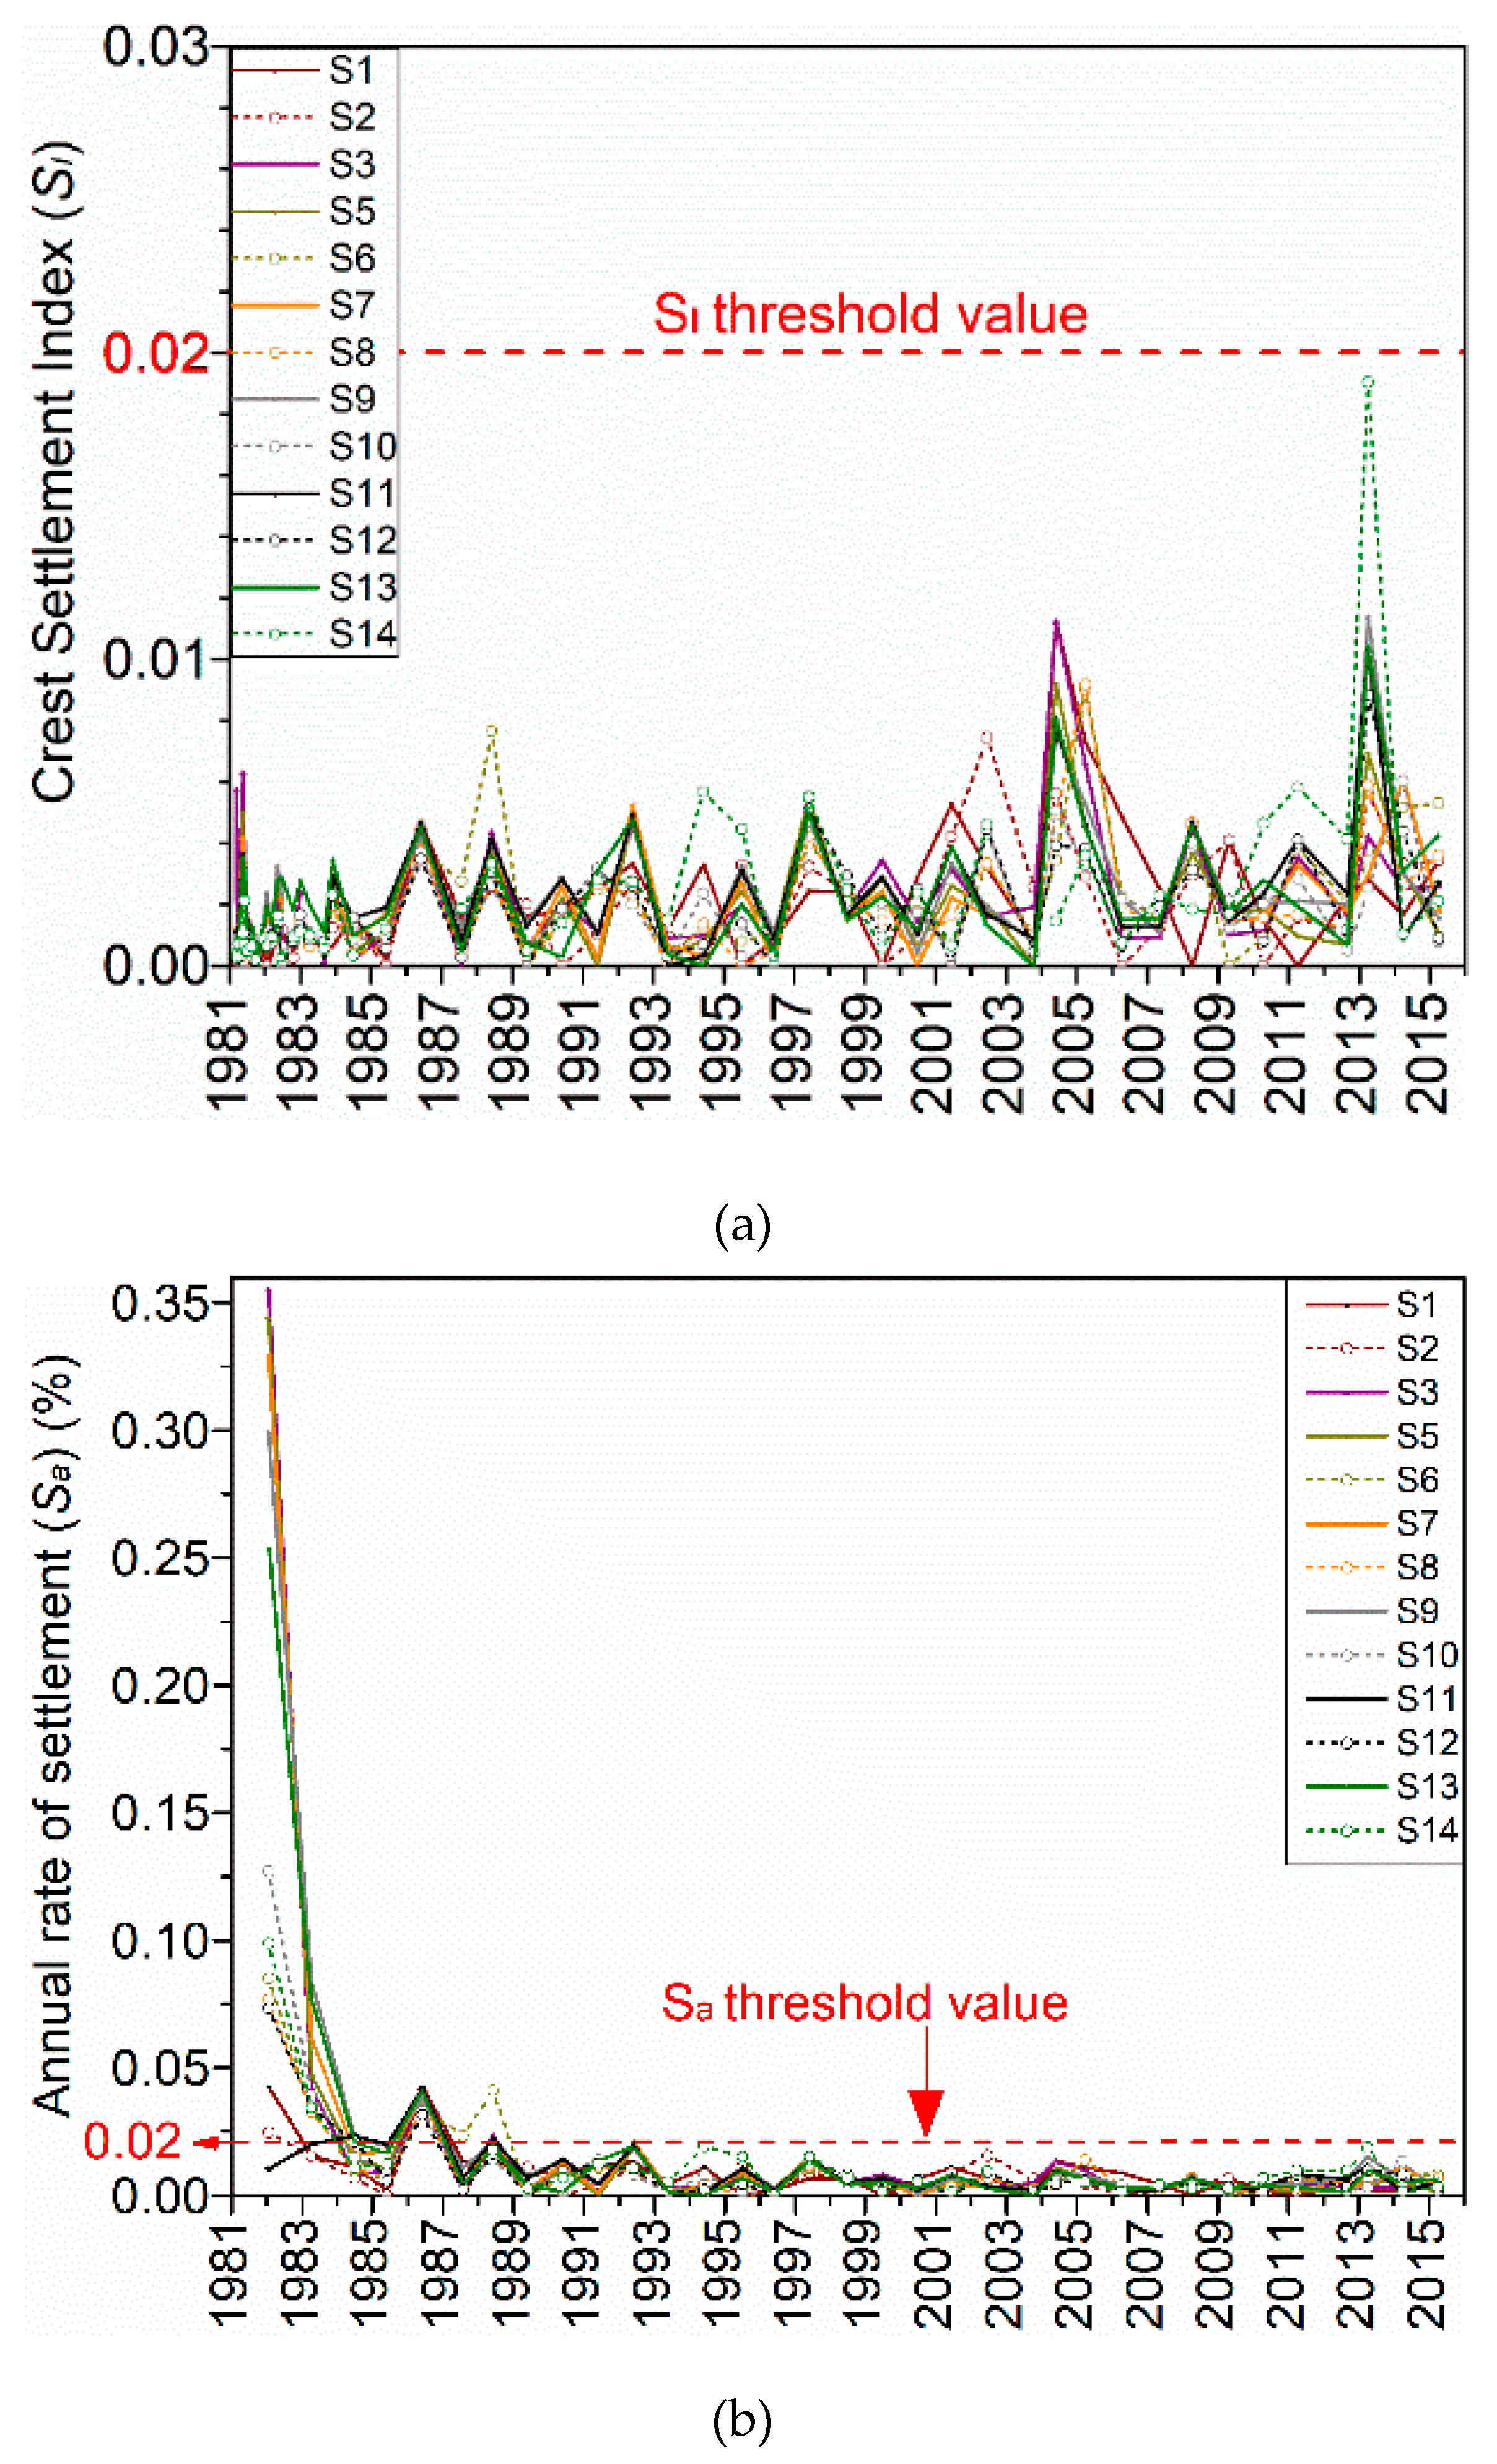
4.5. Time-Dependent Settlements

Figure 5a shows that the settlement index for the control points located at the dam crest has remained under the 0.02 threshold value since the settlement records begun. This indicates that the recorded settlements are due to the secondary consolidation/creep of the clay core [17]. At preliminary stages of the analysis presented in this paper, we attempted to remove the time-dependent component of the recorded settlements, aiming to continue the analysis with the residuals only. Initially, we attempted to fit an exponential model to the time series of settlements or even a linear model to the logarithmic time series of the settlements without success. As a last resort, we fitted, based on least-squares, a third-degree polynomial which resulted in satisfactory fits (correlation coefficient >0.93 for the vast majority of control points), although without a physical meaning for the fitted parameters [50]. However, the derived residuals were significantly affected by numerical effects; hence, any further analysis based on these values could result in biased outcomes.

4.6. Future Research Directions

A limitation of the available monitoring record is that settlement measurements only took place once per year. Annual epoch measurements for surface control stations have been a common long-term monitoring strategy for dams that do not show any evidence that their structural integrity is at risk, as is the case of the Pournari I dam. A higher sampling rate for the dam settlements, at least monthly, is required for more detailed studies. This can be an expensive exercise for the dam owner, but with new automatic monitoring technology that is now routinely used for dam monitoring (e.g., [11]). This should not be an onerous task, and in the long-term is cost-effective. The geotechnical instrumentation in old dams can be easily damaged within the first 5–10 years. Hence, geodetic measurements together with geophysical monitoring [7] could be, in many cases, the only source of information for continuous monitoring. Remote sensing (INSAR) can also be used; however, it is more expensive, the computational expense is high, and it requires photogrammetric expertise. In addition, nowadays, the accuracy of INSAR images is within a few mm. This could be sufficient for concrete dams, but is relatively low for the purposes of examining the response of earthfill dams to environmental factors.
Due to the limitations posed by the annual sampling of the settlements, and in the absence of any geotechnical observations, a causative relationship could not be quantified between the settlements and the reservoir level and rainfall. However, backward (data-driven) numerical modelling could assist interpret the geodetic observations further, and is the focus of an ongoing study.

5. Conclusions

Despite the limitations of the low sampling rate of the recorded settlements (one per year), our results provide evidence of the role of the reservoir-level fluctuations and the rainfall on an earthfill dam over 31 years of operation after its first filling. For the case of the Pournari I dam, the reservoir level seems to affect the recorded settlements on the crest up to a degree. A more interesting outcome is the increasing trend in the time lag between reservoir-level changes and the response of the dam core. This is the first time that observed changes in the long-term response of a central clay core dam to reservoir-level fluctuations, based on field data, are reported in the international literature. This time lag appears later in the life of the dam, after 8 years since construction, and has the tendency to increase with time. By 2010, this time lag was 6 months. This can be an indication of homogenisation of the dam core, i.e., existing small fractures that could have been present after construction have closed following saturation and swelling of the clay core. Such a behaviour would be difficult to predict solely based on numerical modelling, but the observations of this study could be used to inform future constitutive models for the engineering design of earthfill dams. The downstream shoulder is mainly affected by rainfall via effects on seepage. No evidence was found in the available data of the dam being affected by seismicity at the magnitudes (up to ML5.3) recorded within 50 km from the dam during the examined time period.
Overall, based on the available data and from the current analysis, without any numerical modelling, the Pournari I dam appears to respond satisfactorily to environmental changes. More frequent monitoring on dams, especially as they age and in view of the changing climatic conditions would allow for detailed studies of their long-term behaviour based on field evidence.

Author Contributions

All authors contributed to various aspects of this paper: conceptualisation, S.P.; methodology, S.P.; formal analysis, P.M. and S.P.; resources, P.M. and S.R.; data curation, P.M.; writing—original draft preparation, P.M. and S.P.; writing—final draft preparation, S.P.; visualisation, S.P. and P.M.; proof-reading, all.

Funding

This research received no external funding.

Acknowledgments

The authors would like to thank the Public Power Corporation (P.P.C. S.A.) of Greece for providing access to the data used on this study, and the management and personnel of the Hydroelectric Station of the Pournari I dam. Stathis Stiros, Alessandro Tarantino, and Alessia Amabile are thanked for useful discussions on the interpretation of results. This paper has benefitted by the comments and suggestions of three anonymous reviewers.

Conflicts of Interest

The authors declare no conflict of interest.

References

  1. Michalis, P.; Konstantinidis, F.; Valyrakis, M. The road towards Civil Infrastructure 4.0 for proactive asset management of critical infrastructure systems. In Proceedings of the 2nd International Conference on Natural Hazards & Infrastructure (ICONHIC), Chania, Greece, 23–26 June 2019. [Google Scholar]
  2. American Society of Civil Engineers 2017 Infrastructure Report Card. Available online: https://www.infrastructurereportcard.org/cat-item/dam (accessed on 31 July 2019).
  3. Rojas, R.; Feyen, L.; Bianchi, A.; Dosio, A. Assessment of future flood hazard in Europe using a large ensemble of bias-corrected regional climate simulations. J. Geophys. Res. Atmos. 2012, 117, D17109. [Google Scholar]
  4. Forzieri, G.; Bianchi, A.; e Silva, F.B.; Herrera, M.A.M.; Leblois, A.; Lavalle, C.; Aerts, J.C.J.H.; Feyen, L. Escalating impacts of climate extremes on critical infrastructures in Europe. Glob. Environ. Chang. 2018, 48, 97–107. [Google Scholar] [CrossRef]
  5. Jongman, B.; Hochrainer-Stigler, S.; Feyen, L.; Aerts, J.C.J.H.; Mechler, R.; Botzen, W.J.W.; Bouwer, L.M.; Pflug, G.; Rojas, R.; Ward, P.J. Increasing stress on disaster risk finance due to large floods. Nat. Clim. Chang. 2014, 4, 264–268. [Google Scholar] [CrossRef]
  6. Preziosi, M.-C.; Micic, T. An adaptive methodology for risk classification of small homogeneous earthfill embankment dams integrating climate change projections. Civ. Eng. Environ. Syst. 2014, 31, 111–124. [Google Scholar] [CrossRef] [Green Version]
  7. Michalis, P.; Sentenac, P.; Macbrayne, D. Geophysical assessment of dam infrastructure: The mugdock reservoir dam case study. In Proceedings of the 3rd Joint International Symposium on Deformation Monitoring (JISDM), Vienna, Austria, 30 March–1 April 2016. [Google Scholar]
  8. Michalis, P.; Pytharouli, S.; Raftopoulos, S. Long-term deformation patterns of earth-fill dams based on geodetic monitoring data: The Pournari I Dam case study. In Proceedings of the 3rd Joint International Symposium on Deformation Monitoring (JISDM), Vienna, Austria, 30 March–1 April 2016. [Google Scholar]
  9. He, X.Y.; Wang, Z.Y.; Huang, J.C. Temporal and spatial distribution of dam failure events in China. Int. J. Sediment Res. 2008, 23, 398–405. [Google Scholar] [CrossRef]
  10. Yigit, C.O.; Alcay, S.; Ceylan, A. Displacement response of a concrete arch dam to seasonal temperature fluctuations and reservoir level rise during the first filling period: Evidence from geodetic data. Geomat. Nat. Hazards Risk 2016, 7, 1489–1505. [Google Scholar] [CrossRef]
  11. Boudon, R.; Blin, S.; Pons, E.; Ajzenberg, A. Automatic follow-up of the tri-directional displacements of the Sainte-Croix arch dam (Verdon-France) by motorized total station. In Proceedings of the 4th Joint International Symposium on Deformation Monitoring (JISDM), Athens, Greece, 15–17 May 2019. [Google Scholar]
  12. Bonelli, S.; Royet, P. Delayed response analysis of dam monitoring data. In Proceedings of the ICOLD European Symposium on Dams in a European Context, Geiranger, Norway, 25–27 June 2001. [Google Scholar]
  13. Gamse, S.; Oberguggenberger, M. Assessment of long-term coordinate time series using hydrostatic-season-time model for rock-fill embankment dam. Struct. Control Health Monit. 2017, 24, e1859. [Google Scholar] [CrossRef]
  14. Gamse, S.; Zhou, W.-H. Adaptive parametric identification in dam monitoring by Kalman filtering. In Proceedings of the 4th Joint International Symposium on Deformation Monitoring (JISDM), Athens, Greece, 15–17 May 2019. [Google Scholar]
  15. Gikas, V.; Sakellariou, M. Settlement analysis of the Mornos earth dam (Greece): Evidence from numerical modeling and geodetic monitoring. Eng. Struct. 2008, 30, 3074–3081. [Google Scholar] [CrossRef]
  16. Baecher, G.B.; Christian, J.T. The practice of risk analysis and the safety of dams. In Proceedings of the Conference of Geotechnical Engineering, Cairo, Egypt, January 2000. [Google Scholar]
  17. Tedd, P.; Charles, J.A.; Holton, I.R.; Robertshaw, A.C. The effect of reservoir drawdown and long-term consolidation on the deformation of old embankment dams. Geotechnique 1997, 47, 33–48. [Google Scholar] [CrossRef]
  18. Guler, G.; Kilic, H.; Hosbas, G.; Ozaydin, K. Evaluation of the movements of the dam embankments by means of geodetic and geotechnical methods. J. Surv. Eng. 2006, 132, 31–39. [Google Scholar] [CrossRef]
  19. Pytharouli, S.I.; Stiros, S.C. Investigation of the parameters controlling crest settlement of a major earthfill dam based on the threshold correlation analysis. J. Appl. Geod. 2009, 3, 55–62. [Google Scholar] [CrossRef]
  20. Pytharouli, S. Study of the Long-Term Behaviour of Kremasta Dam Based on the Analysis of Geodetic Data and Reservoir Level Fluctuations. Ph.D. Thesis, University of Patras, Patras, Greek, August 2007. (In Greek). [Google Scholar]
  21. Charles, J.A. The significance of problems and remedial works at British earth dams. In Proceedings of the BNCOLD-IWES Conference on Reservoirs 1986, Edinburgh, UK, 3–6 September 1986; pp. 123–141. [Google Scholar]
  22. Dascal, O. Post-construction deformation of rockfill dams. J. Geotech. Eng. 1987, 113, 46–59. [Google Scholar] [CrossRef]
  23. Pytharouli, S.I.; Stiros, S.C. Estimation of a safety threshold for the crest settlements of embankment dams. In Proceedings of the 2nd National ICOLD Conference on Dams and Reservoirs, Athens, Greece, 7 November 2013. [Google Scholar]
  24. Public Power Corporation (P.P.C.) S.A. Brochure: Hydroelectric project Pournari. Available online: http://users.itia.ntua.gr/nikos/arx_int/CDfrag/scanarismena/POURNARI/Untitled.pdf (accessed on 1 August 2019).
  25. Papageorgiou, S.A. Engineering Geology of Dam Foundations in North-Western Greece. Ph.D. Thesis, Durham University, Durham, UK, 1983. [Google Scholar]
  26. Pavlou, K.; Drakatos, G.; Kouskouna, V.; Makropoulos, K.; Kranis, H. Seismicity study in Pournari reservoir area (W. Greece) 1981–2010. J. Seismol. 2016, 20, 701–710. [Google Scholar] [CrossRef]
  27. Pytharouli, S.; Stiros, S. Reservoir level fluctuations and deformation of Ladhon Dam. Int. J. Hydropower Dams 2004, 11, 82–84. [Google Scholar]
  28. Bannister, A.; Raymond, S.; Baker, R. Surveying, 7th ed.; Pearson Education Limited: London, UK, 1998; 512p. [Google Scholar]
  29. Bommer, J.J.; Crowley, H. The purpose and definition of the minimum magnitude limit in PSHA calculations. Seismol. Res. Lett. 2017, 88, 1097–1106. [Google Scholar] [CrossRef]
  30. Harder, L.F.; Kelson, K.I.; Kishida, T.; Kayen, R. Preliminary Observations of the Fujinuma Dam Failure Following the March 11, 2011 Tohoku Offshore Earthquake, Japan. Geotechnical Extreme Events Reconnaissance Report No. GEER-25e, 2011. Available online: http://www.geerassociation.org (accessed on 18 September 2019).
  31. Nespoli, M.; Todesco, M.; Serpelloni, E.; Belardinelli, M.E.; Bonafede, M.; Marcaccio, M.; Rinaldi, A.P.; Anderlini, L.; Gualandi, A. Modeling earthquake effects ongroundwater levels: Evidences from the 2012 Emilia earthquake (Italy). Geofluids 2016, 16, 452–463. [Google Scholar] [CrossRef]
  32. United States Society on Dams. Observed Performance of Dams During Earthquakes, Volume III. 2014. Available online: http://www.ussdams.org/wp-content/uploads/2016/05/EQPerfo2_v3.pdf (accessed on 18 September 2019).
  33. Swaisgood, J.R. Embankment Dam Deformations Caused by Earthquakes. In Proceedings of the 7 Pacific Conference on Earthquake Engineering, Christchurch, New Zealand, 13–15 February 2003; Available online: https://www.nzsee.org.nz/db/2003/View/Paper014s.pdf (accessed on 1 October 2019).
  34. Fiorentino, G.; Furgani, L.; Nuti, C.; Sabetta, F. Probabilistic evaluation of dams base sliding. In Proceedings of the COMPDYN 2015 5th ECCOMAS Thematic Conference on Computational Methods in Structural Dynamics and Earthquake Engineering, Crete Island, Greece, 25–27 May 2015; Papadrakakis, M., Papadopoulos, V., Plevris, V., Eds.; National Technical University of Athens: Athens, Greece, 2015. [Google Scholar]
  35. Lawton, F.L.; Lester, M.D. Settlement of rockfill dams. In Proceedings of the 8th International Congress on Large Dams, Edinburgh, UK, 4–8 May 1964; Volume III, pp. 599–613. [Google Scholar]
  36. Sowers, G.F.; Williams, R.C.; Wallace, T.S. Compressibility of Brocken rock and the settlement of rockfills. In Proceedings of the 6th International Conference on Soil Mechanics and Foundation Engineering, Toronto, ON, Canada, 8–15 September 1965; Volume 2, pp. 561–565. [Google Scholar]
  37. Fell, R.; McGregor, P.; Stapledon, D.; Graeme, B. Geotechnical Engineering of Dams; Taylor & Francis: London, UK, 2005; p. 900. [Google Scholar]
  38. Twort, C.A.; Ratnayaka, D.D.; Malcolm, J.B. 5-Dams, impounding reservoirs and river intakes. In Water Supply, 5th ed.; Twort, A.C., Ratnayaka, D.D., Brandt, M.J., Eds.; Eliane Wigzell: London, UK, 2000; pp. 152–195. [Google Scholar]
  39. Ventrella, C.; Pelekanos, L.; Skarlatos, D.; Pantazis, G. Finite element analysis of earth dam settlements due to seasonal reservoir level changes. In Proceedings of the XVII ECSMGE-2019 Geotechnical Engineering Foundation of the Future, Reykjavik, Iceland, 1–7 September 2019; ISBN 978-9935-9436-1-3. [Google Scholar]
  40. Tedd, P.; Charles, J.A.; Holton, J.R.; Robertshaw, A.C. Deformations of embankment dams due to changes in reservoir level. In Proceedings of the 13th International Conference on Soil Mechanics and Foundations Engineering, New Delhi, India, 5–10 January 1994; pp. 951–954. [Google Scholar]
  41. British Dams, Climate Change Impacts on the Safety of British Reservoirs. Available online: https://britishdams.org/assets/documents/defra-reports/200201Climate%20change%20impacts%20on%20the%20safety%20of%20British%20reservoirs.pdf (accessed on 1 August 2019).
  42. Alonso, E.E.; Olivella, S.; Pinyol, N.M. A review of Beliche dam. Geotechnique 2005, 55, 267–285. [Google Scholar] [CrossRef]
  43. Almog, E.; Kelham, P.; King, R. Delivering benefits through evidence: Models of dam failure and monitoring and measuring techniques. In Flood and Coastal Erosion Risk Management Programme; Project: SC080048/R1; Environment Agency: Bristol, UK, 2011. [Google Scholar]
  44. Chang, C.S.; Duncan, J.M. Analysis of Consolidation of Earth and Rockfill Dams, Volume I, Main Text and Appendices, A. and B.; U.S. Army Engineer Waterways Experiment Station, Contract Report S-77-4, 1977. Available online: https://apps.dtic.mil/dtic/tr/fulltext/u2/a045332.pdf (accessed on 2 October 2019).
  45. Davis, J.C. Statistics and Data Analysis in Geology, 3rd ed.; John Wiley & Sons: Hoboken, NJ, USA, 2002; p. 656. [Google Scholar]
  46. Schultz, M.; Stattegger, K. SPECTRUM: Spectral analysis of unevenly spaced paleoclimatic time series. Comput. Geosci. 1997, 23, 929–945. [Google Scholar] [CrossRef]
  47. Olafsdottir, K.B.; Schulz, M.; Mudelsee, M. REDFIT-X: Cross-spectral analysis of unevenly spaced paleoclimate time series. Comput. Geosci. 2016, 91, 11–18. [Google Scholar] [CrossRef]
  48. Bonelli, S.; Radzicki, K. Impulse response function analysis of pore pressures in earthdams. Eur. J. Environ. Civ. Eng. 2008, 12, 243–262. [Google Scholar] [CrossRef]
  49. Kontogianni, V.; Tzortzis, A.; Stiros, S.C. Deformation and failure of the Tymfristos Tunnel, Greece. J. Geotech. Geoenvironmental Eng. 2004, 130, 1004–1013. [Google Scholar] [CrossRef]
  50. Michalis, P. Pournari I dam (Greece): Analysis of Its Structural Integrity Based on Long-Term Monitoring Data. Master’s Thesis, University of Strathclyde, Glasgow, UK, August 2010. [Google Scholar]
Figure 1. Downstream shoulder of the Pournari I dam with the concrete spillway (left) and part of the hydroelectric station (right).
Infrastructures 04 00065 g001
Figure 2. Maximum cross-section A-A of the Pournari I dam. For location, see Figure 3 (after [8]).
Infrastructures 04 00065 g002
Figure 3. Part of the geodetic monitoring system at the Pournari I dam showing the control stations established on the crest and the downstream shoulder of the dam. In red are the four drainage galleries (i.e., Adit Right Abutment Upper - ARU, Adit Right Abutment Lower - ARL, Adit Left Abutment Upper - ALU, and Adit Left Abutment Lower - ALL) constructed at the dam to collect seepage. The location of the maximum cross-section A-A is also shown (modified after [8]).
Infrastructures 04 00065 g003
Figure 4. (a) Time evolution of the crest settlements of the Pournari I dam. The shadowed area corresponds to the first three filling cycles, and is not taken into account in this study. (b) Observed settlement for the control stations along the upstream (U/S) (solid line) and the downstream (D/S) (dashed line) side of the crest on 1 July 1984 (top) and on 1 April 2015 (bottom).
Infrastructures 04 00065 g004
Figure 5. Crest settlements: (a) Settlement Index SI and (b) Annual rate of settlement.
Infrastructures 04 00065 g005
Figure 6. Time evolution of settlements for the D/S shoulder: (a) Series 1 control stations S-18 to S-23, and Series 2 control stations S-25 to S-31; (b) Series 3 control stations S-32 to S-37. Both graphs have the same scale on the x and y-axis for comparison purposes. Points with the same symbols, filled or unfilled, lie along the same cross-section, perpendicular to the dam axis. The shadowed area corresponds to the first three filling cycles (1981–1984), and is not taken into account in this study.
Infrastructures 04 00065 g006
Figure 7. Monthly averages of reservoir level and observed settlements of control stations along cross-section A-A (see Figure 3 for location). The settlements of the control stations on the downstream shoulder (bottom plot) are plotted at a different y-axis scale for easier comparisons.
Infrastructures 04 00065 g007aInfrastructures 04 00065 g007b
Figure 8. Settlements across A-A section and (a) rainfall depth between consecutive measurement epochs, and (b) deviation (%) of rainfall depths between consecutive measurement epochs from historical rainfall depths.
Infrastructures 04 00065 g008
Figure 9. Settlements and occurrence of earthquakes (ML >3) within a radius of 50 km from the dam site between consecutive measurement epochs. Stars indicate the largest earthquakes during the examined period (ML 5.4 in 1993, ML 5.3 in 2000, and ML 5.2 in 2014 at distances of 36.8 km, 15.4 km, and 16.3 km from the dam, respectively). Earthquake data were sourced from the National Observatory of Athens.
Infrastructures 04 00065 g009
Figure 10. Daily rainfall at the Pournari I dam site between 1984 and 2015. The dashed line corresponds to a low threshold of 76 mm, above which the rainfall is regarded as a storm in [41].
Infrastructures 04 00065 g010
Figure 11. Left y-axis: rainfall depth between consecutive drainage measurement epochs. The light blue horizontal line corresponds to the threshold of 67 mm, above which a direct correlation between rainfall depth and seepage volume is observed. Right y-axis: Seepage recorded in the drainage galleries of the Pournari I dam.
Infrastructures 04 00065 g011
Figure 12. Location of piezometers W1–W5 along cross-section A-A.
Infrastructures 04 00065 g012
Figure 13. Variation of water level elevation along cross-section A-A. Changes of the reservoir level appear immediately at the D/S shoulder, the core (at centre axis) appears to respond with a varying time lag. The phreatic surface in the D/S shoulder is unaffected by the reservoir-level variations in the reservoir.
Infrastructures 04 00065 g013
Figure 14. Hydraulic head in W1 and W2 between 1982 and 2010. Horizontal thick black lines represent the mean value of the hydraulic head in W2 during periods 1983–1989, 1990–2001, and 2003–2010. The dashed lines indicate the approximate time periods when the time lag between W1 and W2 changes. The blue arrows are connecting corresponding peaks between W1 and W2. These peaks, when aligned, result in maximum correlation between sections of data. The time difference between corresponding peaks is equal to the time lag between W1 and W2 for that section of data.
Infrastructures 04 00065 g014
Table 1. Downstream shoulder: Time periods and control stations with uplift movements. The numbers in brackets show the max uplift movement in mm that has taken place between the measurement epoch on the year shown in the table and the previous year. If uplift is observed for only specific stations along a series, these are also shown.
19891992199619971999200120032012
Series 1 (6) Series 1 (10)Series 1 (8)
Series 2 (6, S27-31)Series 2 (13, S26-28)Series 2 (13)Series 2 (8)Series 2 (6)Series 2 (7)
Series 3 (10, S34-37) Series 3 (13) Series 3 (7)Series 3 (7)Series 3 (7)
Table 2. Crest: Time periods and control stations with uplift movements. The numbers in brackets show the max uplift movement in mm that has taken place between the measurement epoch on the year shown in the table and the previous year. If uplift is observed for only specific stations along the crest, these are also shown.
19891992199619971999200120032012
S1-2 (5)----S2 (4)S2-3 (3)(6)

