Aeroelastic Response of Suspended Pedestrian Bridges Made of Laminated Wood and Hemp

Department of Engineering and Geology, Gabriele D’Annunzio University, 65100 Chieti-Pescara, Italy
Infrastructures 2020, 5(7), 60; https://0-doi-org.brum.beds.ac.uk/10.3390/infrastructures5070060
Submission received: 21 June 2020
/
Revised: 8 July 2020
/
Accepted: 14 July 2020
/
Published: 20 July 2020
(This article belongs to the Special Issue Innovative Materials and Sustainable Infrastructure Construction)
Abstract
:The work described in this paper investigated, by calculating critical flutter speed, the aeroelastic response of suspended pedestrian bridges made of a laminated wood structure and hemp cables and compared them to bridges with a steel structure and harmonic steel cables. Critical flutter speed was estimated using a numerical two degree of freedom (2-DOF) generalized deck model based on finite-element modal analysis. The critical flutter speeds of two sets of 25 different structural configurations, obtained by varying the deck chord and the permanent deck loads, made of steel and of laminated wood respectively, were estimated using experimental flutter derivatives obtained from 30 wind tunnel experiments. One of the most significant results was that pedestrian bridges made of laminated wood and hemp have a higher torsional frequency than those made of steel and that this affects critical flutter speed. A case study was performed and discussed by analyzing the structural and aeroelastic response of a 250 m pedestrian bridge with a 12 m deck chord and two approximately 32 m tall towers.
1. Introduction
Advances in materials science and building technology permit the evaluation of new ecological solutions to reduce the environmental impact of constructions. This is common practice, now made mandatory by codes in the field of energy saving. In these specific cases it involves building envelopes, such as plaster or coatings. The goal is to extend this approach to the main structures of buildings or infrastructures in order to adopt a more sustainable approach to building construction.
Wooden structures, in this context, have a long history of being seen and accepted as leading materials in sustainable architecture and construction.
Timber, together with stone, dominated bridge construction materials for many years. It was only in the latter half of the 19th century that timber and stone encountered competition in the form of steel, with concrete becoming increasingly common later on. These new materials allowed bridges to be made longer, stronger, and more durable.
Several different construction typologies use wooden structures. These may be, for example, load-bearing walls, pole-framed elements, cross laminated timber, column-and-beam system, balloon-frame and grid shell structures [1]. These are used mostly for housing because of the efficient cost-benefit ratio in terms of seismic safety and energy savings and for large span roofs.
Relevant examples of wooden structures for housing include the fourteen-story wood building in the center of Kennecott for the Kennecott Mines, Alaska, built between 1911 and 1938, the four-story structure of the old Government Buildings, New Zealand, built in the late 1870s, the ten-story building in Forté, Australia built in 2012, the seven-story headquarters for the Tamedia media company in Zurich, Switzerland, built in 2013, and the Murray Grove timber skyscraper in London, built in 2009, which was the tallest modern timber structure when it opened. At nine stories it was the first of its kind to be built with load-bearing walls, floor slabs, stairs, and lifts built entirely from timber. A final example is the 170 foot tall Treet building, in Norway, built in 2014, made of cross-laminated timber modules stacked upon each other.
Significant examples of very large roofs made of wood include the Tillamook Air Museum, in Oregon (USA), which was the largest clear-span wooden structure in the world stretches when built, 1072 feet tall and 296 feet wide. Built in 1942 to store the U.S. Navy′s blimps, the Tillamook structure was one of more than 15 such hangars across the nation in use during World War II. The seven-acre site now serves as a museum, offering visitors to Tillamook, Oregon the chance to see not only historic warplanes but also a brilliant wooden colossus. A more recent example is the Superior Dome, built in Michigan (USA) in 1991 with a 536 foot diameter, just six feet more than the diameter of the Tacoma structure. The 14-story dome, covering a sports stadium located on the campus of the Northern Michigan University, spreads over 5.1 acres with 781 Douglas Fir beams and 108 miles of fir decking,
Timber is also of interest as a bridge construction material [2,3,4]. This is partly due to the “old” and classic qualities of timber: lightness, strength, and malleability. Today, the development of glulam is a primary reason factor behind timber materials that can be strong, rigid, and sustainable and offer quality far in excess of that offered by traditional sawn timber. Some examples of bridges made of wood are the U Bein Bridge, Myanmar, the world′s longest wooden bridge which has stood since around 1850, providing a passage about 15 feet above mud flats and Taungthaman Lake. The wooden toll bridge across the Oi River in the middle of Shizuoka Prefecture, Japan, made almost exclusively from teakwood, measures 897.422 m. Called the Horai Bridge, it was first built in 1867 and was rebuilt in the 1960s because of flooding. Sweden is one of the most active countries in the word in the field of wood bridge construction. The Älvsbackabron cable-stayed bicycle and pedestrian bridge was built there in 2010.
Most cable-stayed or suspended wood bridges are built using steel suspension cables, definitely the most commonly used material for tensile structures. However some studies have investigated the use of hemp for cables as an alternative to harmonic steel. For exxample, [5] gives a comparison of structural response in term of vertical displacements and natural frequencies between harmonic steel and hemp cables for tensile structures with hyperbolic paraboloid shapes. This study concluded that hemp cables are very efficient for large span roofs, because even if cable cross sections are larger than those for steel cables the lightness of hemp reduces vertical displacements.
The combination of a wooden structure and hemp cables can be found in some minor examples of pedestrian bridges, often used as temporary structures. This issue, however, deserves further study because it can be offer efficient solutions in terms of sustainable structures.
In the past many cities and towns in the world hosted industries producing hemp rope. Russia was the largest producer in the world and the best-quality manufacturer, supplying 80% of the hemp demanded by the Western world from 1740 until 1940. Until 1937, 70–90% of all rope, twine and cordage was made from hemp up [6]. Hemp, in this context of recyclable, antibacterial resources, represents an important resource [7].
Researchers have analyzed, through studies on hemp fiber, the high temperature resistance, heat resistance, and other properties [8,9,10,11], such as thermal conductivity, permeability, and other properties [12,13], that make hemp a very appealing material to be used for building and construction purpose. They explored, for example, the anti-radiation, anti-mildew and antibacterial performance of hemp fiber insulation.
Various applications of hemp in the field of building and construction materials have been proposed recently, such as hemp lime (HL), a sustainable low-carbon composite building material that combines hemp with formulated lime-based binders [14,15]. Hemp is also widely used for ropes. Ropes and cables for structural uses, similarly to the case of sailing ropes, require high stiffness values to maximize their effectiveness and enable precise control over displacements [16]. Hemp, theoretically based on these characteristics, can be used for all of those kinds of tensile structures, such as suspended bridges or cable nets, currently built using cables made of harmonic steel. Tensile structures, moreover, are particularly suited for use of hemp cables because of the good resistance to traction of this material.
Codes overlook hemp as a structural material, and there is a lack of information for designers to follow. This reduces the potential that hemp could have. However its excellent cost/benefit ratio encourages designers to investigate the use of hemp in the field of civil engineering.
This research investigated the use of hemp for suspended bridges cables in comparison to traditional steel cables. Critical flutter speed was assumed as a measure of structural dynamic reliability under wind induced vibration. A total of five different deck cross-section shapes and five different deck loads were combined to obtain 25 different configurations. Critical flutter speed of each configuration was estimated through a multi-modal approach for both steel and harmonic steel cables and wood and hemp cables, using aeroelastic experimental results given by [17]. Critical flutter speed was estimated using a set of 30 flutter derivatives given by [17].
2. Methodology
The dynamic response of a suspended bridge under wind stresses can be modeled through the multi-mode approach in the frequency domain.
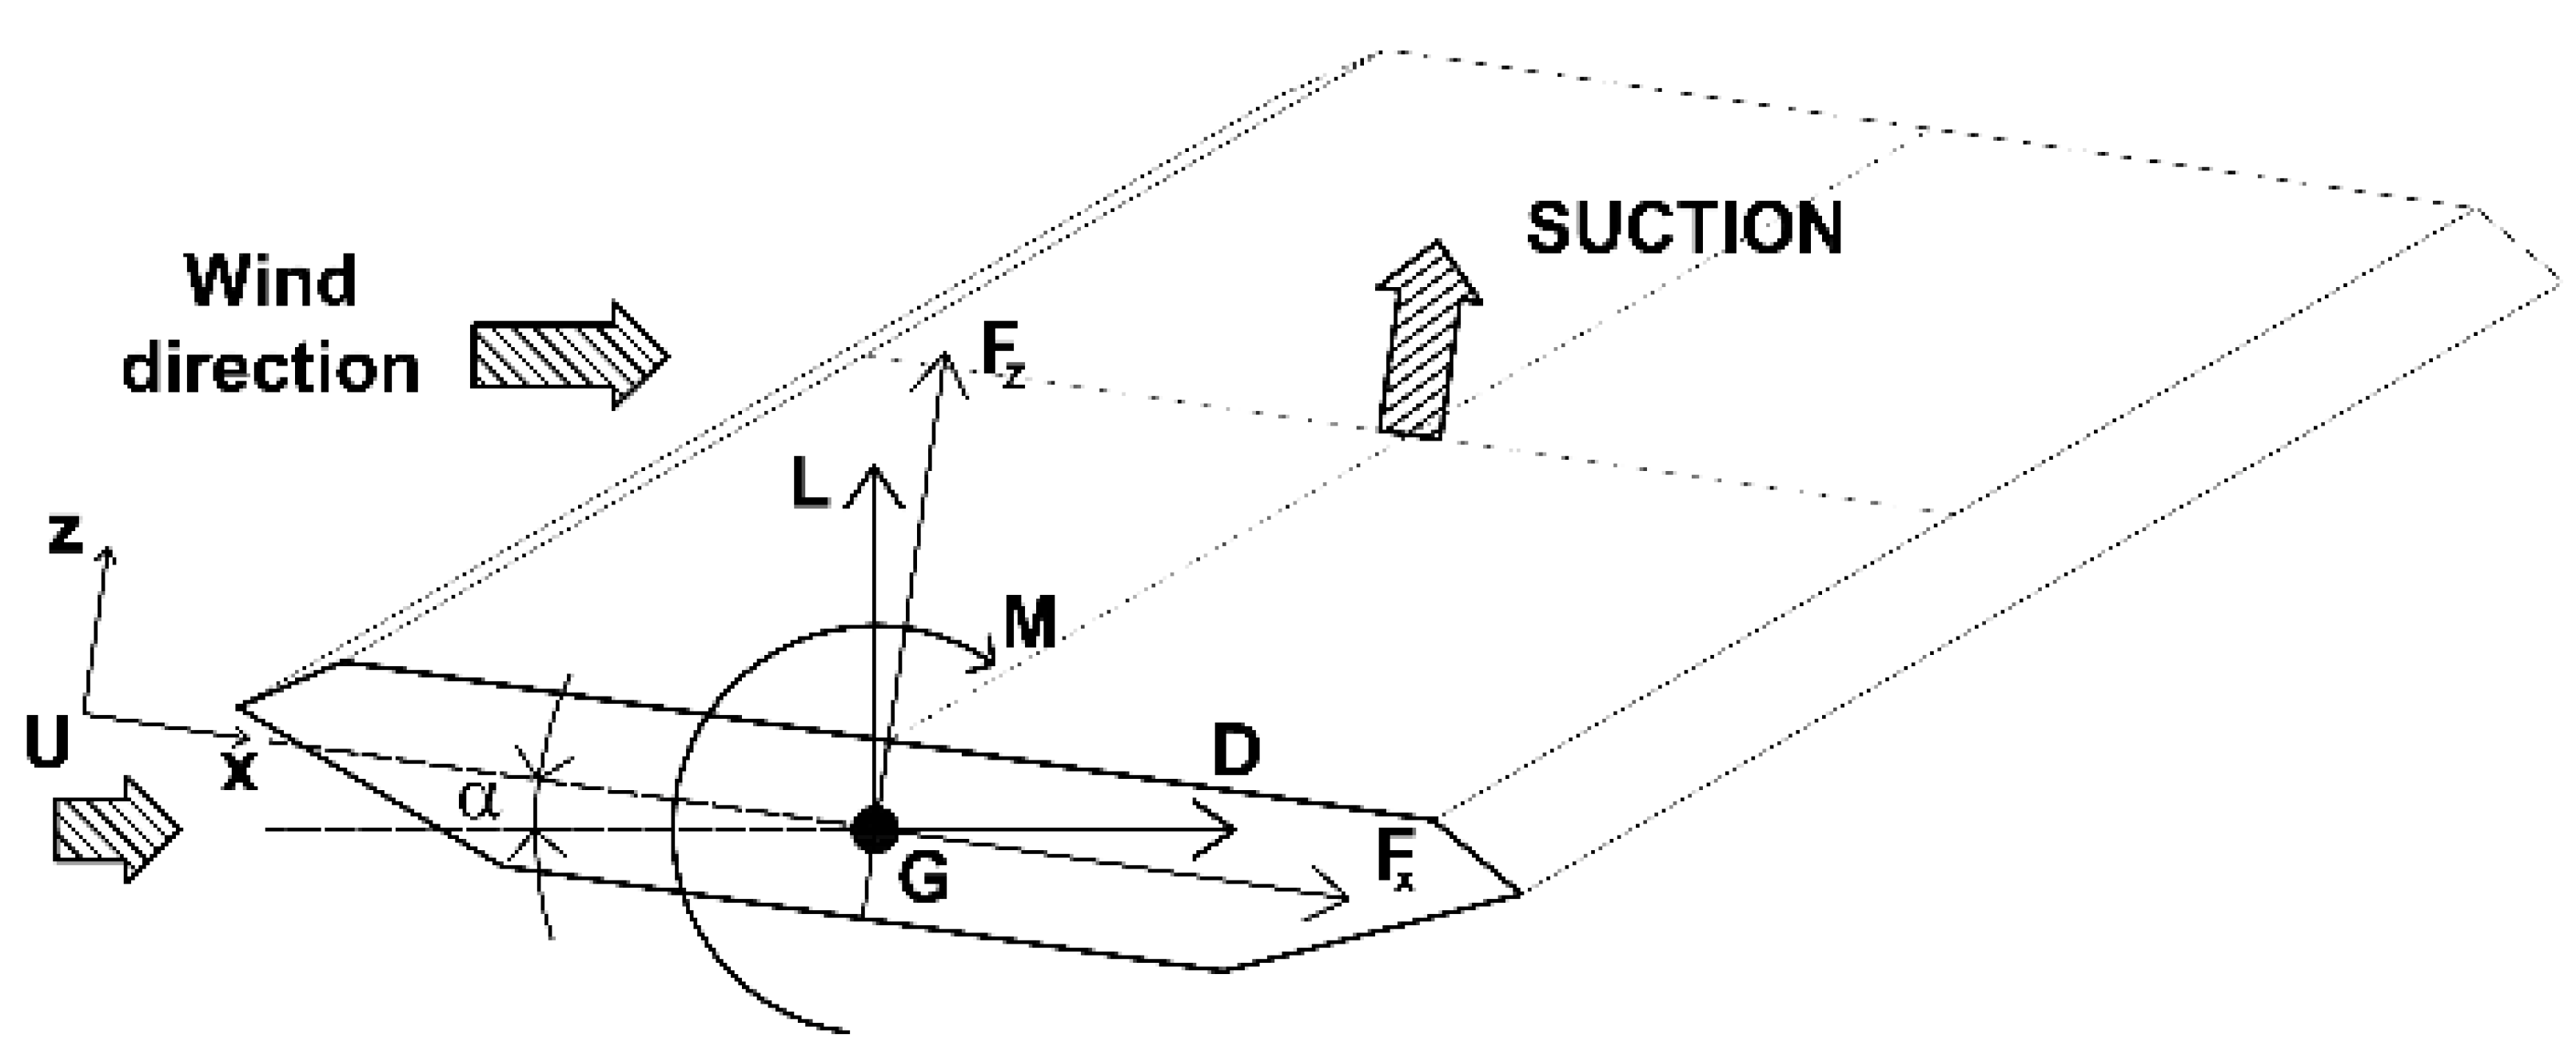
The dynamic component of the wind load, causing deck vibration, can be represented by superposition of aerodynamic forces and aeroelastic forces. Self-excited forces, acting on a unit-length section of the deck (Figure 1), are defined as lift (Lh), drag (Dp) and moment (Mα). These forces are commonly based on a first-order linear expansion of the h vertical displacement and α torsional rotation of the generic deck cross section, first introduced by [18].
Even though this model is strictly valid for simple-harmonic vibration of the deck, it is usually also acceptable for small-amplitude random vibration [17]. Aeroelastic lift and moment forces of the generic cross section per unit deck span were consequently defined according to Equations (1) and (2).
In the previous equations ρ is the air density, the mean wind speed perpendicular to the bridge longitudinal axis, B is the deck width; the “over-dot” symbol denotes derivation with respect to time . The quantities and (with i = 1,…,4) are the flutter derivatives [18]. These functions were experimentally found in the wind tunnel by testing a section model of the full-scale girder at a reduced scale as discussed in Section 4. The flutter derivatives depend on the reduced frequency , where is the angular vibration frequency of the deck in rad/s (the frequency in Hz is ).
The dynamic equilibrium equations of the 2-DOF system (Figure 1), which is tested in the wind tunnel, reproduce the vertical (h) and torsional (α) aeroelastic vibration of a representative finite-length section of the full-scale bridge deck. The lift force Lh and overturning moment Mα per unit length of the deck are measured over the span length l of the experimental model.
Equations (3) and (4) define the vibration of the apparatus tested in the wind tunnel, according to [18], reported in [19].
In Equations (3) and (4), M is the total mass of the model over the length l, which also accounts for the mass of the moving components of the experimental rig. Iα is the total mass moment of inertia; S is the static mass unbalance about the elastic axis, equal to the product of mass M and the distance (with appropriate sign) between the elastic center (center of stiffness) and the center of mass; l is the longitudinal length of the model; ωh and are the angular frequencies of vibration corresponding to the two DOFs; ζh and ζα are the corresponding structural damping ratios, assumed to be equal in this research.
Equations (3) and (4) were used, after experimental measurement of the flutter derivatives, to determine the critical flutter speed of the tested model. The solution to the flutter problem was based on the original 2-DOF flutter theory, proposed in [19], that is the common analytical approach used in the preliminary design stage to estimate the critical flutter velocity of a suspended bridge. Calculation of the flutter speed was based on the iterative procedure described by [19], simulating a 2-DOF dynamical system with mass, inertia, damping ratios and flutter derivatives corresponding to the actual setup.
3. Aerodynamic and Aeroelastic Tests
Aerodynamic and aeroelastic tests were carried out to estimate the deck loads of a benchmark pedestrian bridge with a closed-box bridge deck. Aerodynamic tests measured the pressure coefficients along the surface of the closed-box section and aeroelastic tests were conducted to estimate the flutter derivatives [20]. It is important to note that the deck guardrail was neglected in this study because it was assumed that it was made of cables and therefore would not affect aerodynamics and aeroelastic response.
3.1. Cross-Sectional Geometries and Properties of the Pedestrian Bridge
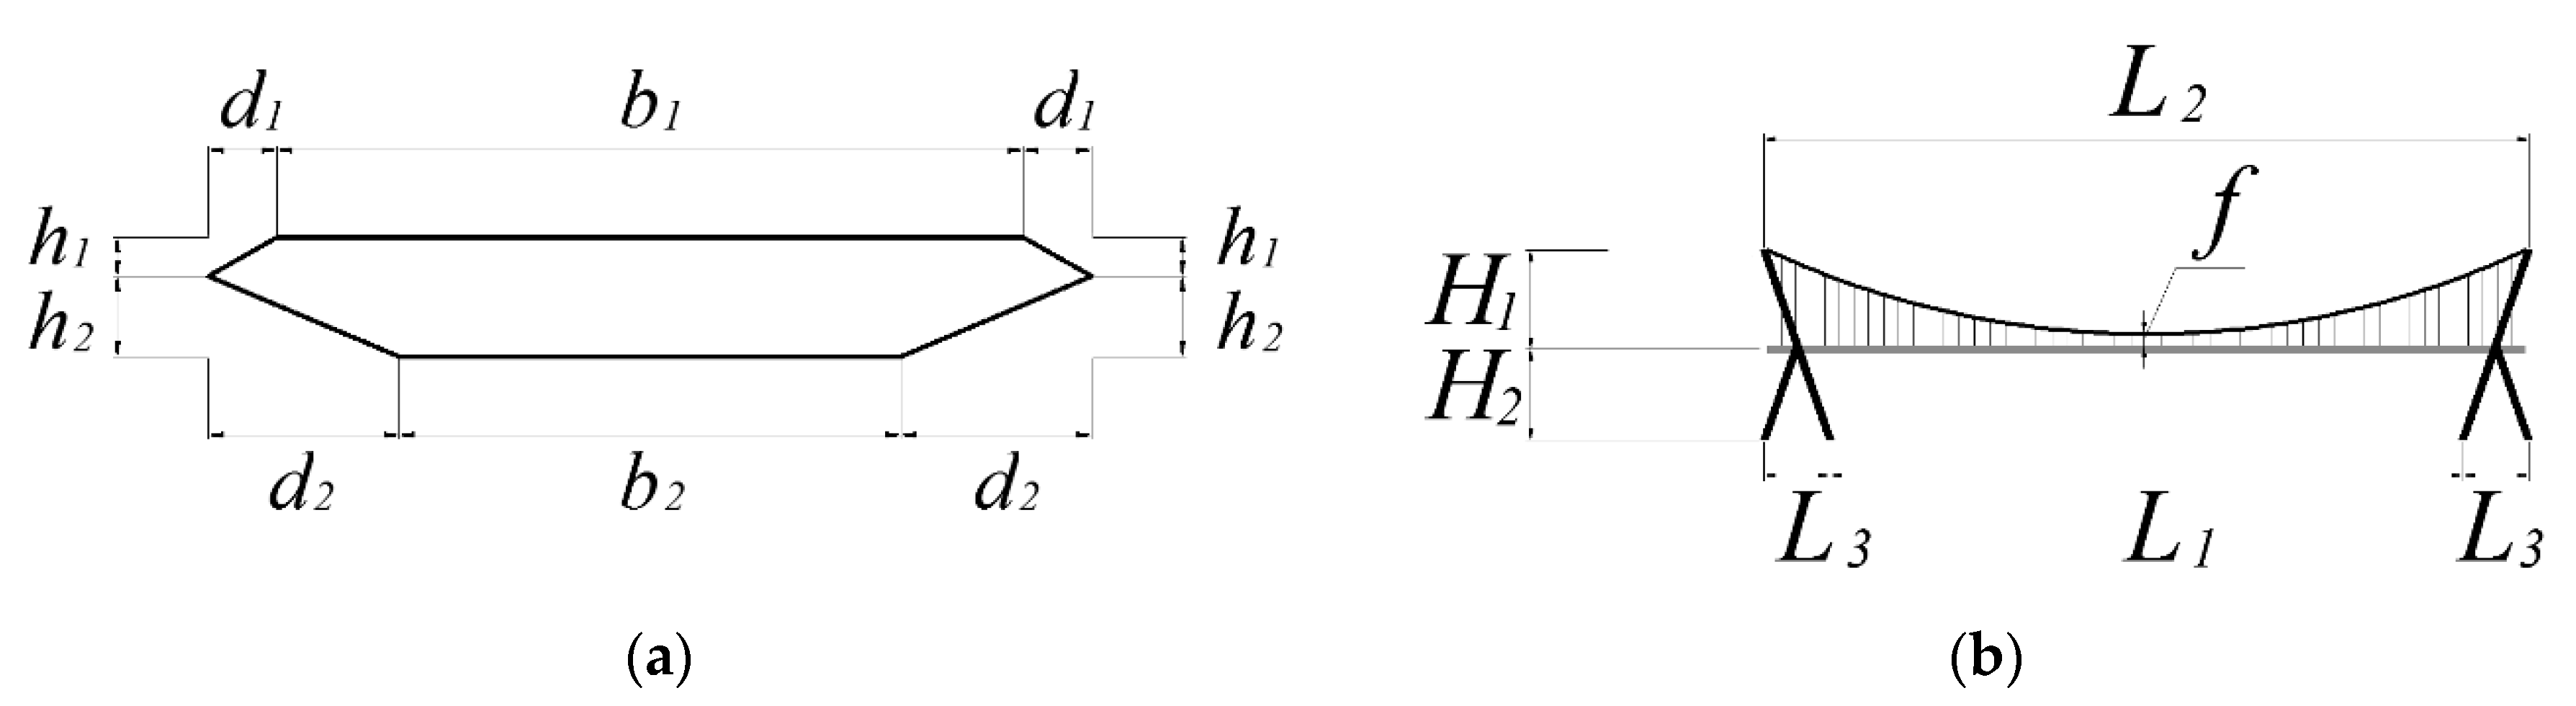
Five different deck cross-sections (in the following geometrical configurations) were designed with dimensions listed in Table 1 and according to Figure 2a. The global structure of the pedestrian bridge investigated in this research is illustrated in Figure 2b, and the dimensions are listed in Table 1. The center-to-center distance between the two main suspension cables is about 10 m for all geometries.
3.2. Wind Loads from Aerodynamic Tests
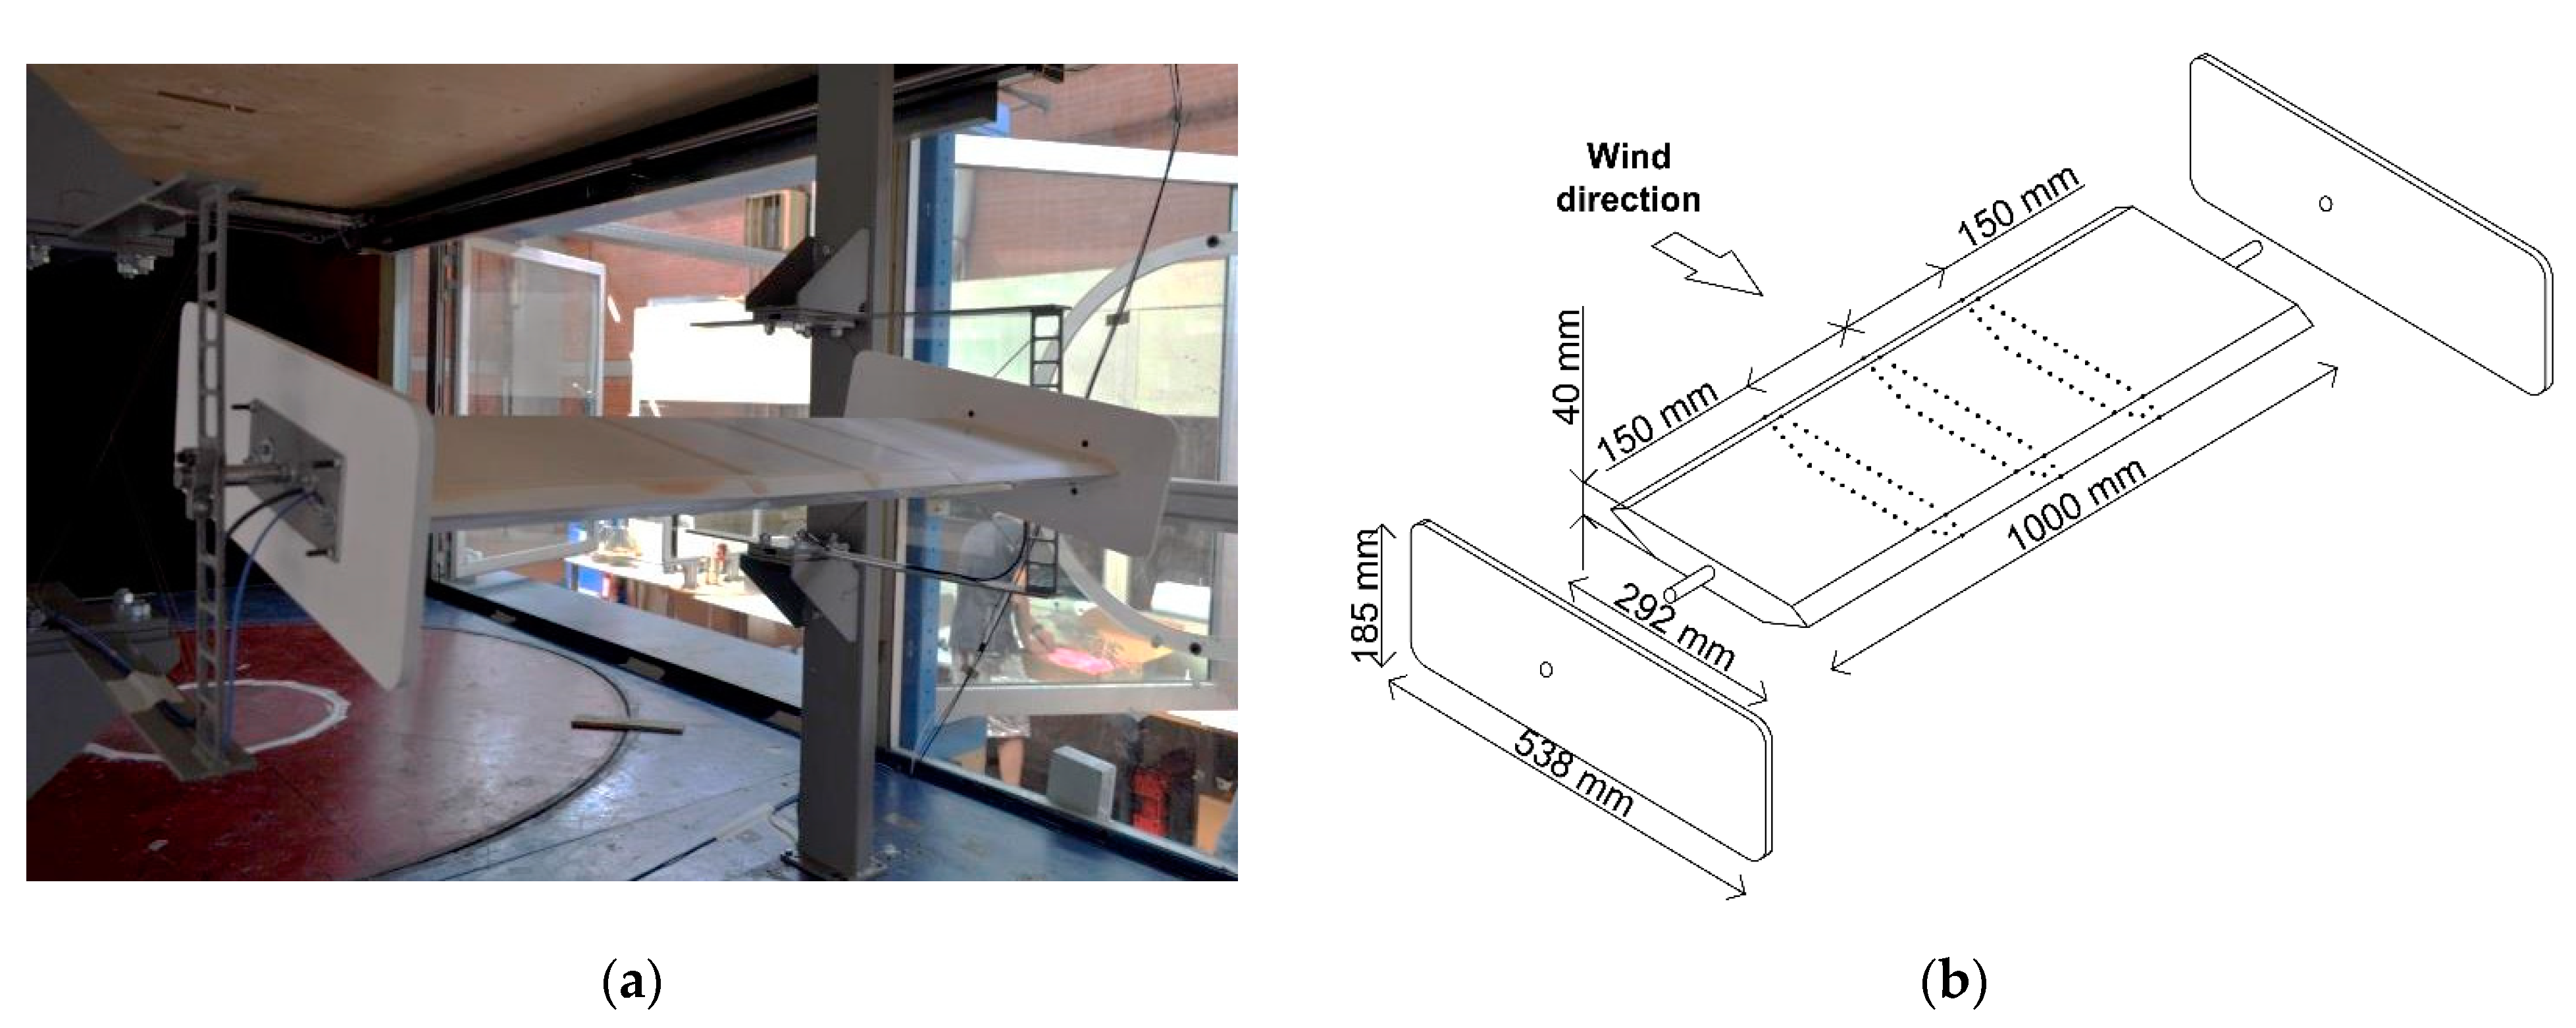
Aerodynamic tests were carried out in the Inter-University Research Centre for Wind Engineering and Building Aerodynamics (CRIACIV) boundary layer wind tunnel in Prato (Italy). This is an open-circuit wind tunnel with a reference test section, which is 2.42 m wide and 1.60 m high. The total length of the wind tunnel is about 22 m. Wind speed is regulated both by adjusting the pitch of the ten-fan blades and by controlling the angular speed of the motor [21]. The maximum wind speed is about 30 m/s. The models were placed horizontally in the wind tunnel, and they were rigidly connected to a support system, composed of rigid arms, as illustrated in Figure 3a. Sampling frequency during the tests was about 500 Hz and acquisition time was 60 s. Turbulence intensity has a mean value minor than 1%. More details of the pressure tests are given in [20].
Static pressures were evaluated and normalized in accordance with the reference dynamic pressure, as in Equation (5). The dimensionless pressure coefficient (Cp) was estimated from the difference between the static pressure measured at each pressure tap (pi) and the reference flow static pressure p0 [1].
Figure 3b illustrates the three-dimensional view of the pressure tap positions. A total of three strips of 40 pressure taps were used simultaneously for each model. The external pressure coefficient distributions for all the three models were evaluated at fifteen angles of attack (α): 0°; ±1°; ±2°; ±3°; ±4°; ±6°; ±8°; ±10°.
Two examples of mean pressure coefficient trends (Cp,m) for α = ±10° are illustrated in Figure 4a,b. The plotted values refer to the cross section located at the center of the model. A negative pressure coefficient represents suction, while a positive value represents overpressure. Experimental results were approximately the same, independent of mean flow speed.
Pressure coefficients estimated in the wind tunnel were used to estimate the wind loads according to [22] that were used to design the deck cross-section structure and, consequently, tower structural elements and cable cross-section dimensions. Structural dimensions and details are given in Section 4.
3.3. Flutter Derivatives from Aeroelastic Tests
Wind tunnel tests to estimate the flutter derivatives were conducted in the small-scale wind tunnel of the Northeastern University (Boston, Massachusetts, USA) [23,24]. The tunnel has a test section of 0.56 m by 0.56 m. It is capable of producing wind speeds of up to about 20 m/s with low turbulence. The main model dimensions, in mm, are equal to 530 (spanwise length) by 20 (H, height) by 148 (chord) and the geometrical scale respect to the geometrical configuration 1 (Table 1) is about 1:80. Model length l was 533.4 mm. Model dimensions were also chosen to limit the blockage effect in the chamber. This effect was estimated as less than 1% and was therefore negligible. The mean flow speed was varied in the wind tunnel between 2 m/s and 9 m/s and the reduced velocity Ur, based on the vibration frequency of the vertical DOF, was between 3.3 to 14.6. The experimental setup had two DOFs: vertical h, and torsional α. The design included an H-shaped rig for the suspension of the model (one on each side of the model), which could be vertically supported through a set of extension springs. The spring properties were selected to produce the desired stiffness (i.e., angular frequencies ωh and ). The distance between the two vertical supports and the springs was equal to 139.7 mm.
The free-vibration method [18] was employed for the extraction of the flutter derivatives. The experiments did not consider the use of the forced-vibration method (e.g., [25,26,27,28]). A description of both measurement methods may be found in [29]. The time histories of the free-decay displacements and were derived from the instantaneous force measurements recorded by three load cells, placed outside the test chamber at selected support anchorages. More detail of the experimental setup is provided in [20].
4. Structural Setup
Aerodynamic tests results were used to design the deck cross-section, the towers, and the cable structural elements for both steel structure and laminated wood and hemp structure. The structural weight for square meters, , depends on the deck chord dimension (Table 1) (i.e., a total of 5 geometrical configurations) and varies from 0.78 kN/m2 to 1.07 kN/m2 for the steel structures and from 0.63 kN/m2 to 0.94 kN/m2 for the laminated wood and hemp structures. The permanent load for square meters,, was assumed as variable from 2.88 kN/m2 to 4.20 kN/m2 (i.e., a total of 5 load configurations) for both steel and laminated wood and hemp structures. Finally, the live load for square meter, , was assumed equal to 2.5 kN/m2 for all configurations. The yield stress of the steel is assumed equal to 355 MPa and the laminated wood density was assumed equal to 400 kg/m3. Its fibre stress at elastic limit and modulus of elasticity were assumed equal to 32 MPa and 13,700 MPa, respectively.
Table 2 and Table 3 give the loads and corresponding Mass per unit length, m and the Mass moment of inertia per unit length, Iα, for all 25 configurations (i.e., 5 geometrical × 5 load configurations) for the steel and the laminated wood and hemp structures respectively. On average the mass per unit length of the laminated wood structure deck cross-section was 16% larger than that of the steel structures.
The two main cables illustrated in Figure 2b are made of two cables each (in the following sub-cables). Each sub-cable cross section was designed as a consequence of gravitational loads (Table 2 and Table 3) and wind action (Figure 4) and varied from 0.03 m2 to 0.06 m2 for the steel structures and from 0.06 m2 to 0.14 m2 for structures made of the wood and hemp. As expected, the cross section of cables made of hemp are much larger than that of cables made of steel. However the specific gravity of hemp is equal to 15 kN/m3, which is much smaller than the specific gravity of steel. Cable areas and strains were calibrated to obtain vertical displacements smaller than 1/1000 L1 (Figure 2b) under gravitational loads.
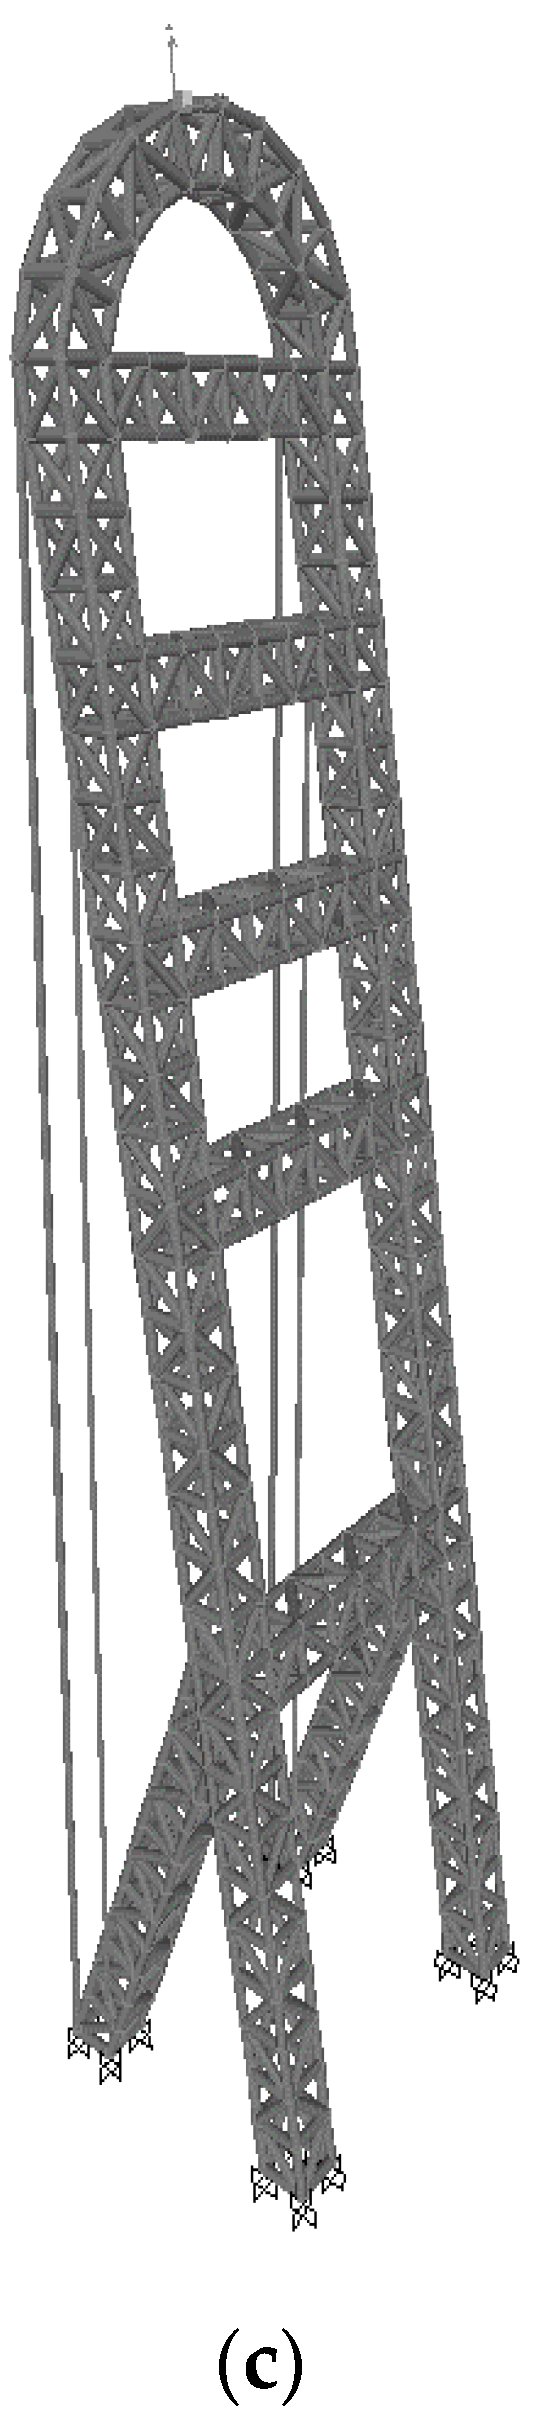
Structural FE models of the pedestrian bridge deck and tower are illustrated in Figure 6a,c.
Geometric non-linear analyses were carried out using a research and design software program (TENSO) [20]. TENSO software includes modules for simulating cable and beam finite element models and for the study of wind-structure interaction phenomena with generation of wind speed time histories and simulation of various aeroelastic loads. The main cables are discretized as rectilinear cable segments. The global stiffness matrix is updated at each load step by combination of the stiffness sub-matrices of the elements, updated to account for the strain found at the previous time step. In this way the software accounts for the geometric nonlinearity of the structure.
The TENSO software first solves for the static equilibrium of the structure under dead, gravity, and construction loads (prior to the application of the wind loads) by nonlinear static analysis. Two methods are used simultaneously: a step-by-step incremental method and a “subsequent interaction” method with variable stiffness matrix (secant method).
The secant method is a finite-difference approximation of Newton-Raphson’s modified method for systems of nonlinear algebraic equations. The solution under gravity loads is subsequently used as the initial step of the dynamic wind load analysis. The Newmark-Beta method with Rayleigh damping is used for numerical integration of the dynamic equations [30].
The bridge deck is simplified by a beam model located in the deck section’s center of gravity and two massless rigid links to simulate the connection of the deck to the hangers and cables. The pedestrian bridge global FE model is illustrated in Figure 6b.
Modal analysis was carried out to estimate natural angular frequencies. The angular frequencies of the first symmetric and asymmetric vertical and torsional modes are listed in Table 4 for load (Table 2 and Table 3) and geometrical (Table 1) configurations and for each material (i.e., steel and wood and hemp).
Results listed in Table 4 show that for the pedestrian bridge made of steel the first vertical angular frequency, ωh, ranges from 1.784 rad/s to 1.890 rad/s and the torsional angular frequency, , ranges from 2.656 rad/s to 3.134 rad/s. The angular frequency ratio ranges from 1.55 to 1.67.
For the pedestrian bridge made of laminated wood and hemp the first vertical angular frequency, ωh, ranges from 2.003 rad/s to 3.071 rad/s and the torsional angular frequency, , ranges from 3.611 rad/s to 4.032 rad/s. The angular frequency ratio ranges from 1.32 to 1.83.
Even if the Yang modulus of laminated wood is smaller than that of steel, the pedestrian bridge made of laminated wood is stiffer than the steel structure. This is because the cross sections of the laminated wood elements used for deck cross section and towers are larger than those used for steel structures. The reason for this is that the laminated wood fibre stress at elastic limit is much smaller than the yield stress of steel. Therefore pedestrian bridges made of laminated wood and hemp are lighter and stiffer than those made of steel.
5. Examination of Critical Flutter Speeds
As described in Section 2, the evaluation of critical flutter speeds can be carried out by independently examining the results of each experiment. This operation was repeated 30 times by assuming independence between the experiments at various U. For each set of derivatives, the critical flutter speed of the wind-tunnel section model was found in accordance with the procedure described in [19] and previously outlined (Section 2), and for each load and geometrical configuration listed in Table 3 and Table 4. Each solution, experiment by experiment, was converted to critical flutter speed (Uc).
The structural damping coefficient, ζ, for this kind of structure is usually low. In the numerical investigations, damping ratios equal to 0.3% and 1% [31] were used to study how damping influences the critical flutter speed of each structural configuration. The main results of the numerical simulations are summarized in Table 5 and Table 6. In particular the mean, , maximum, , minimum, , and standard deviation, σ of value is given in Table 5 for steel structures and in Table 6 for laminated wood and hemp structures.
For steel structures calculated with ζ = 1.0% (Table 5), the mean critical flutter speed ranges from 69.8 m/s to 105.9 m/s with a standard deviation σ that ranges from 6.2 m/s to 27.1 m/s. For laminated wood and hemp structures with ζ = 0.3% (Table 5), the mean critical flutter speed ranges from 90.5 m/s to 130.7 m/s with a standard deviation σ that ranges from 8.1 m/s to 39.3 m/s (Table 5). With ζ = 1.0% the laminated and hemp structures have a critical flutter speed on average 20% larger than steel structures. The standard deviation of critical flutter speed values with 30 repetitions is on average 63% larger with laminated wood and hemp structures than with steel structures.
The mean critical flutter speed for steel structures calculated with ζ = 0.3% (Table 6), ranges from 50.4 m/s to 99.9 m/s with a standard deviation σ that ranges from 15.7 m/s to 40.1 m/s. The mean critical flutter speed Uc,m for laminated wood and hemp structures with ζ = 0.3% (Table 6) ranges from 88.0 m/s to 128.1 m/s with a standard deviation σ that ranges from 23.6 m/s to 52.4 m/s. With ζ = 0.3% the laminated and hemp structures have a critical flutter speed on average 32% higher than steel structures. The standard deviation of critical flutter speed values with 30 repetitions is on average 48% higher with laminated wood and hemp structures than steel structures.
For steel structures, the mean value of critical flutter speed decreases on average 17%, with structural damping dropping from 1% to 0.3%. For laminated wooden structures, the mean value of critical flutter speed decreases on average of 2%, with structural damping dropping from 1% to 0.3%. These values show that laminated wood and hemp structures are less sensitive to structural damping variations and give higher critical flutter speeds than steel structures. This result is significant because it means that with the same geometry a pedestrian bridge made of laminated wood and hemp cables is more reliable than a steel structure in terms of flutter instability, even if they are lighter than the steel structures.
For a rough estimation of construction costs, referring to the European market, the laminated wooden structures cost about one third less than steel structures, boosting the cost/benefit ratio in favor of laminated wooden structures. Regarding maintenance of laminated wooden structures or steel structures, the number of protective cycles of painting during the bridge life is higher for laminated wooden structures even if this can be reduced using aluminum covers. It can be stated, comparing the maintenance required by harmonic cables and hemp cables, that both require protective covers and periodical inspections.
6. Case Study
The pedestrian bridge used as a case study was designed to cross the Vomano river in Roseto degli Abruzzi, Italy.
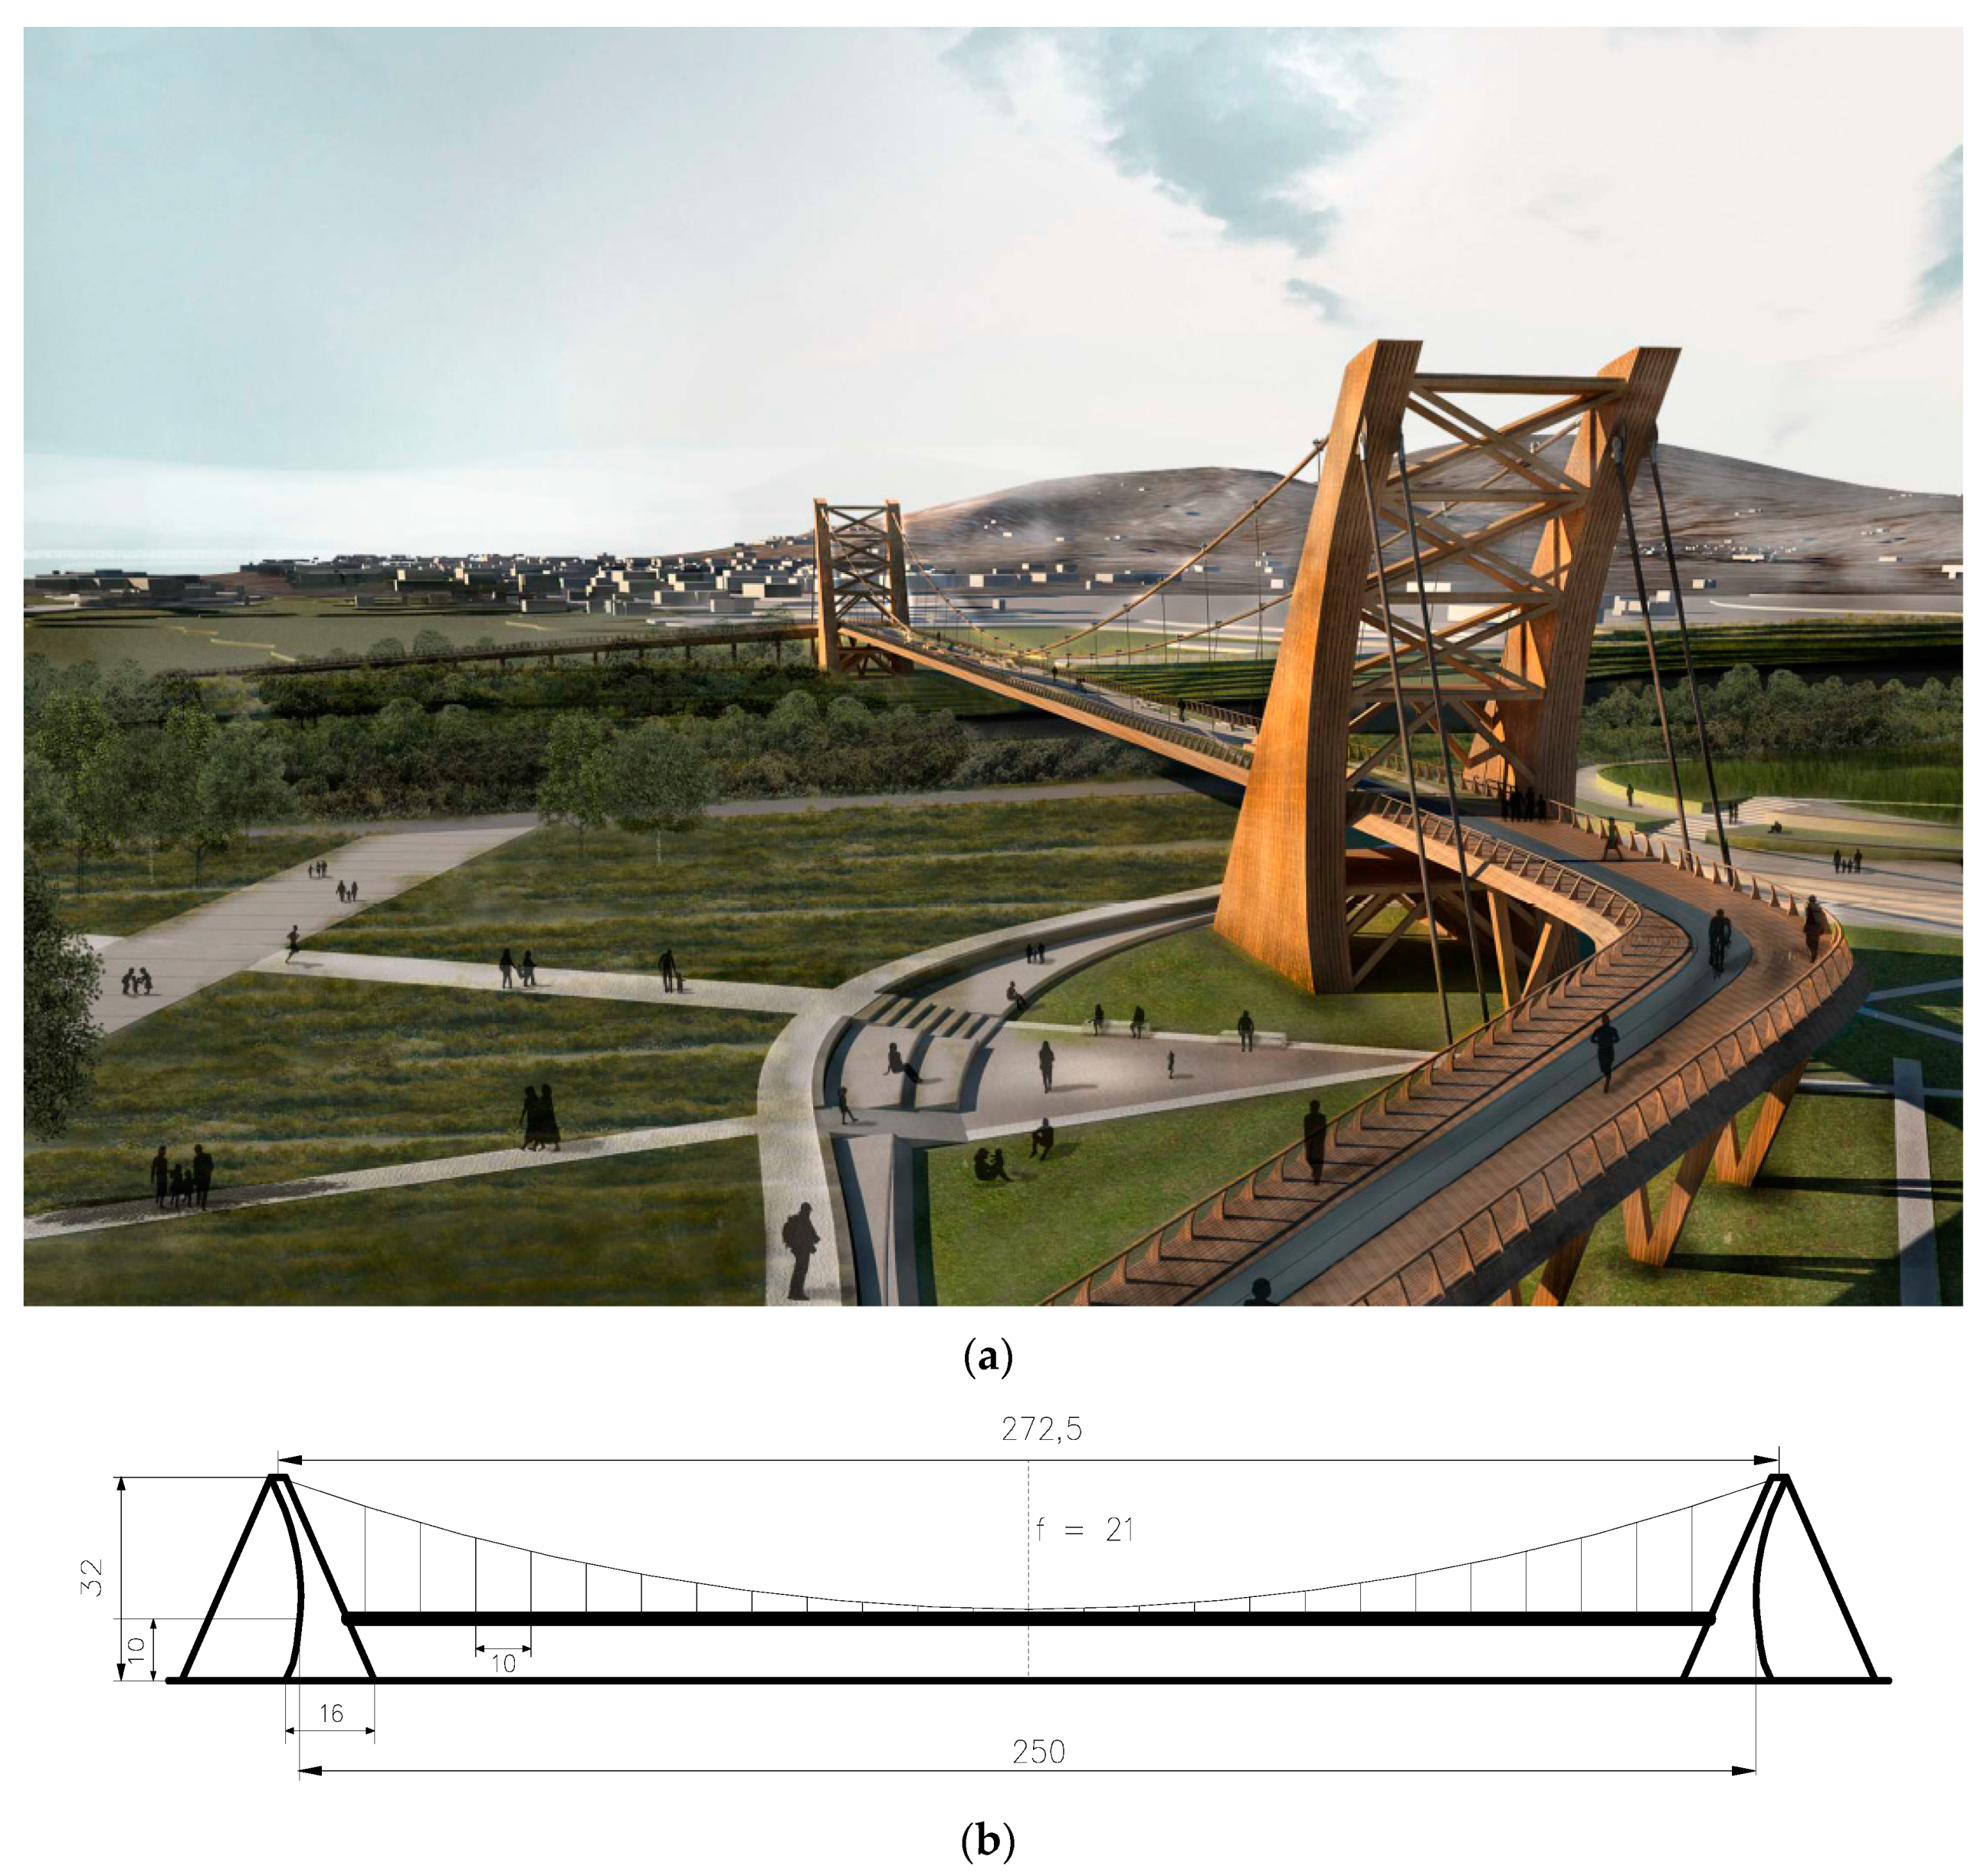
Figure 7a shows a virtual photograph of the pedestrian bridge design and Figure 7b shows the dimensions of the bridge. The main span length is 250 m, the tower height is 32 m, the distance between the deck and the water level is equal to 10 m, assumed as a limit for boat transit and the main cable sag is equal to 21 m. The closed box deck cross section chord is 12 m and its height is 1.64 m (Figure 2).
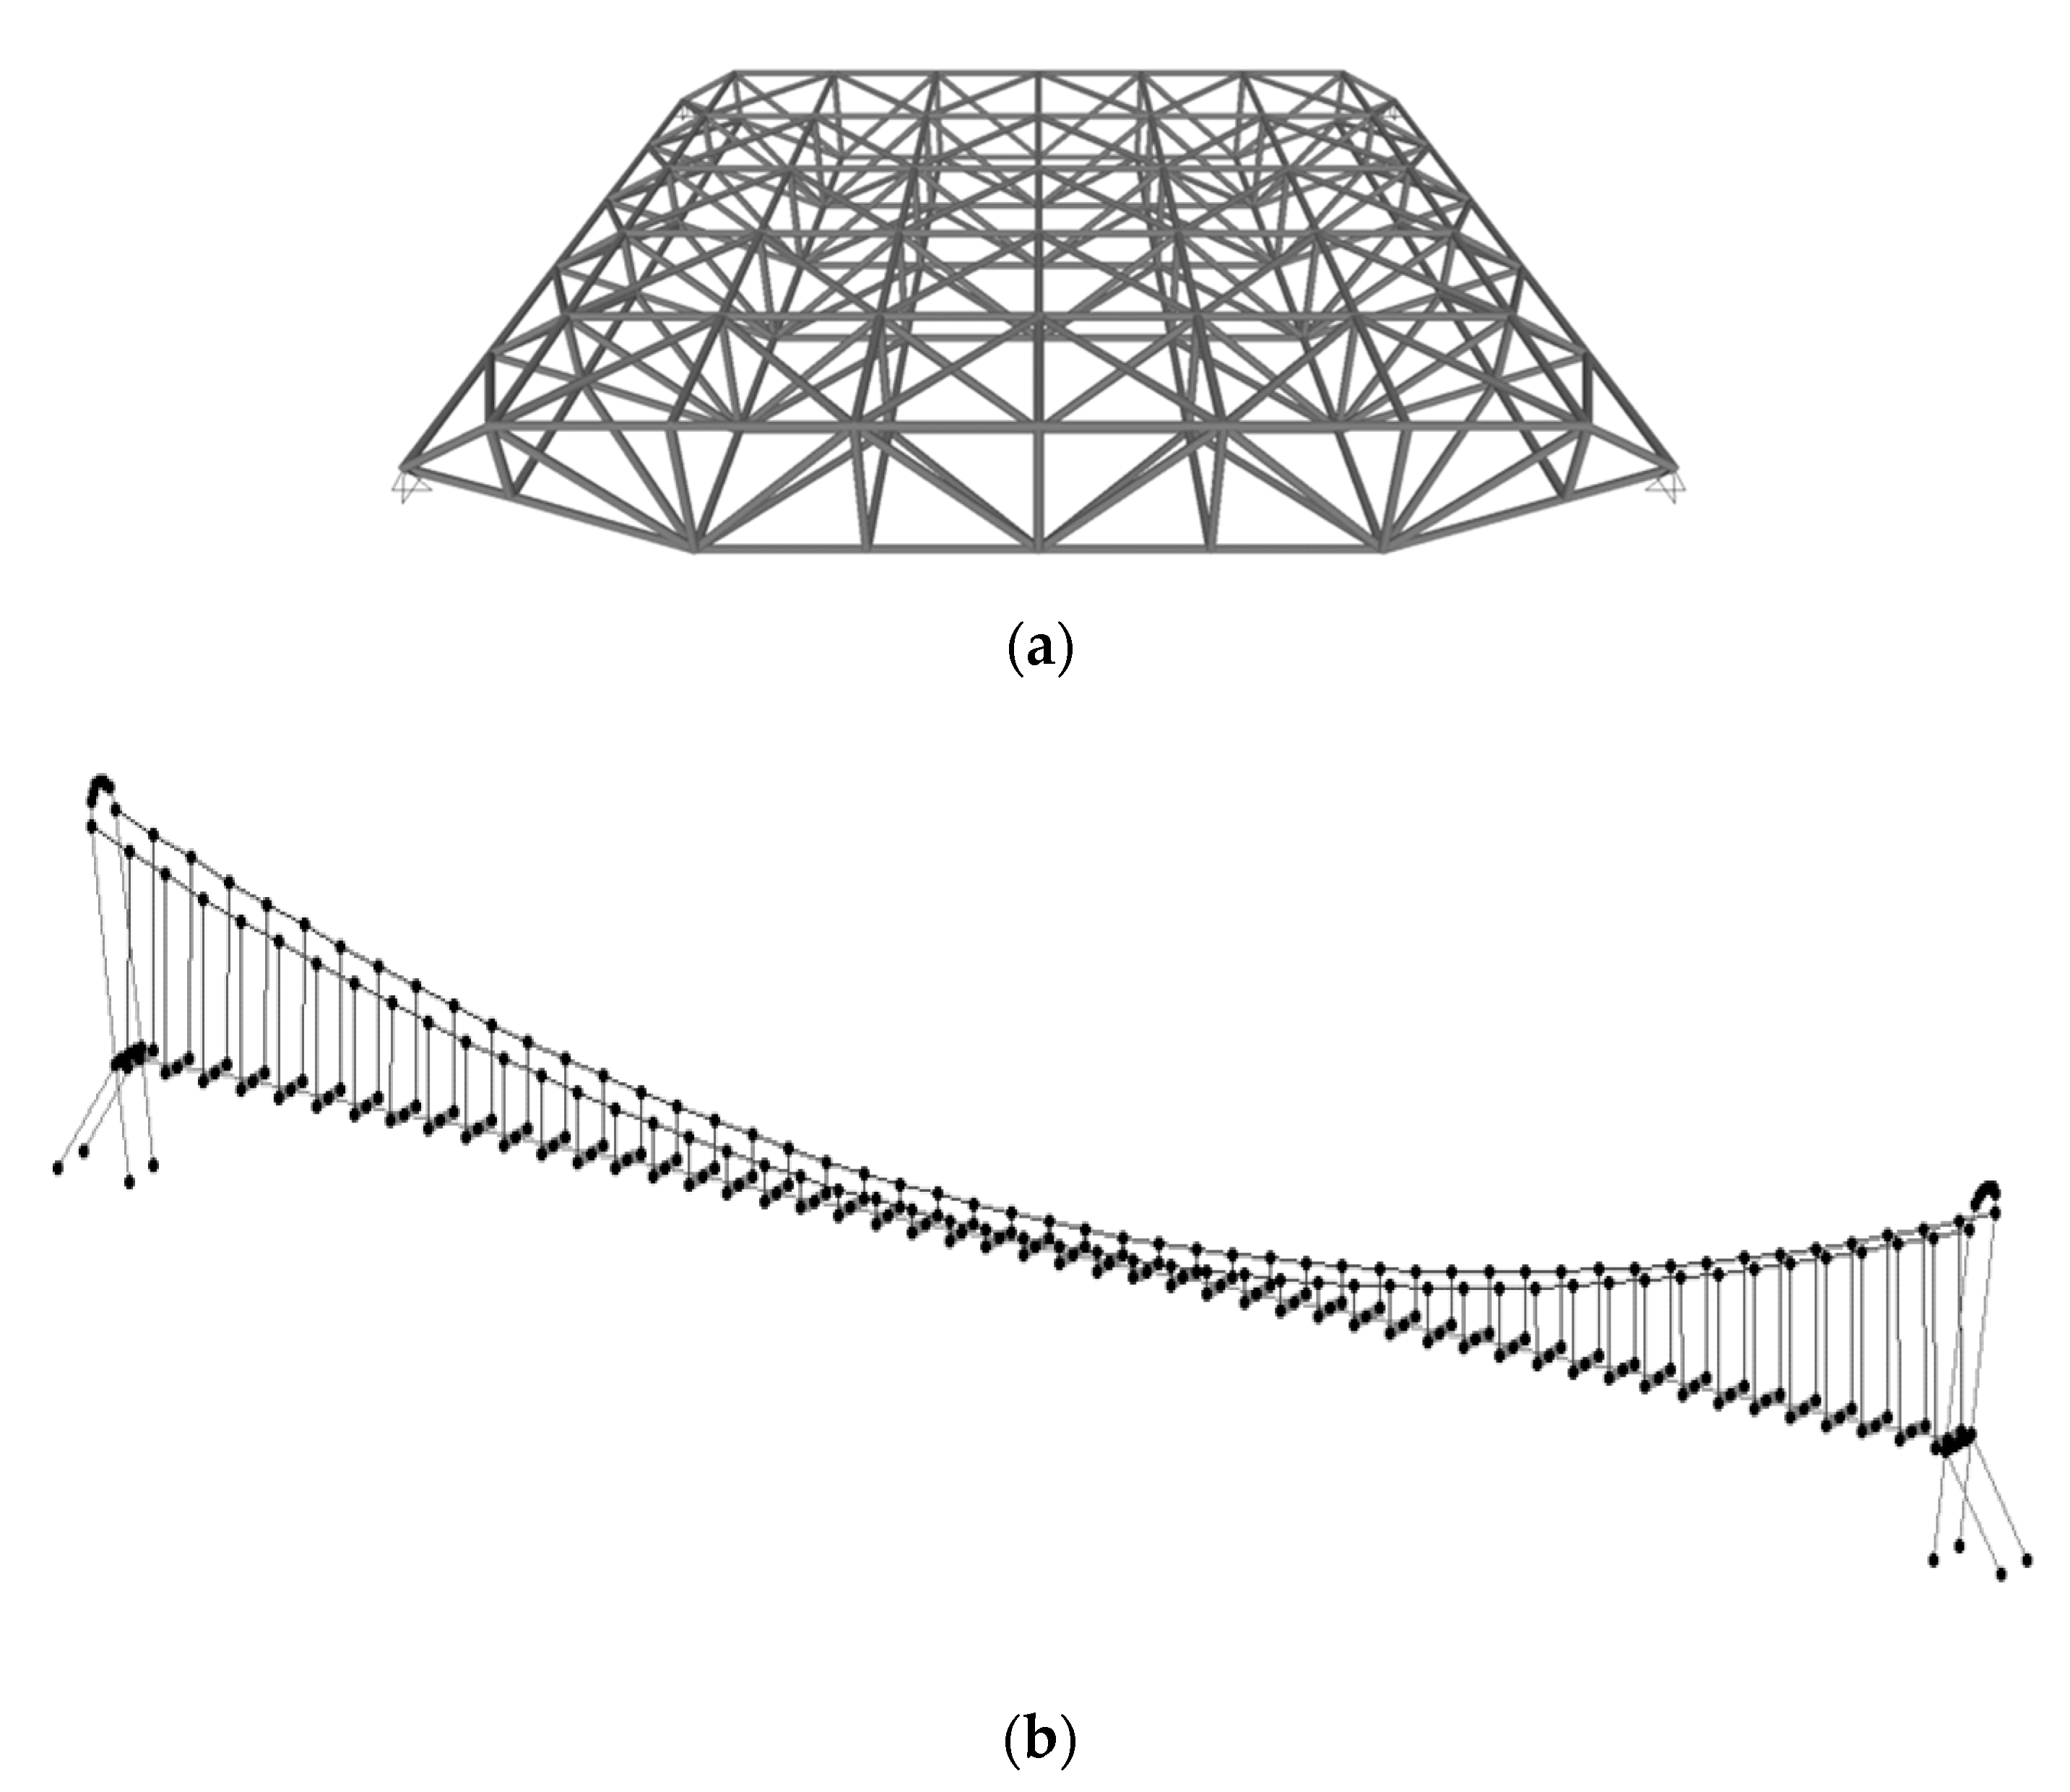
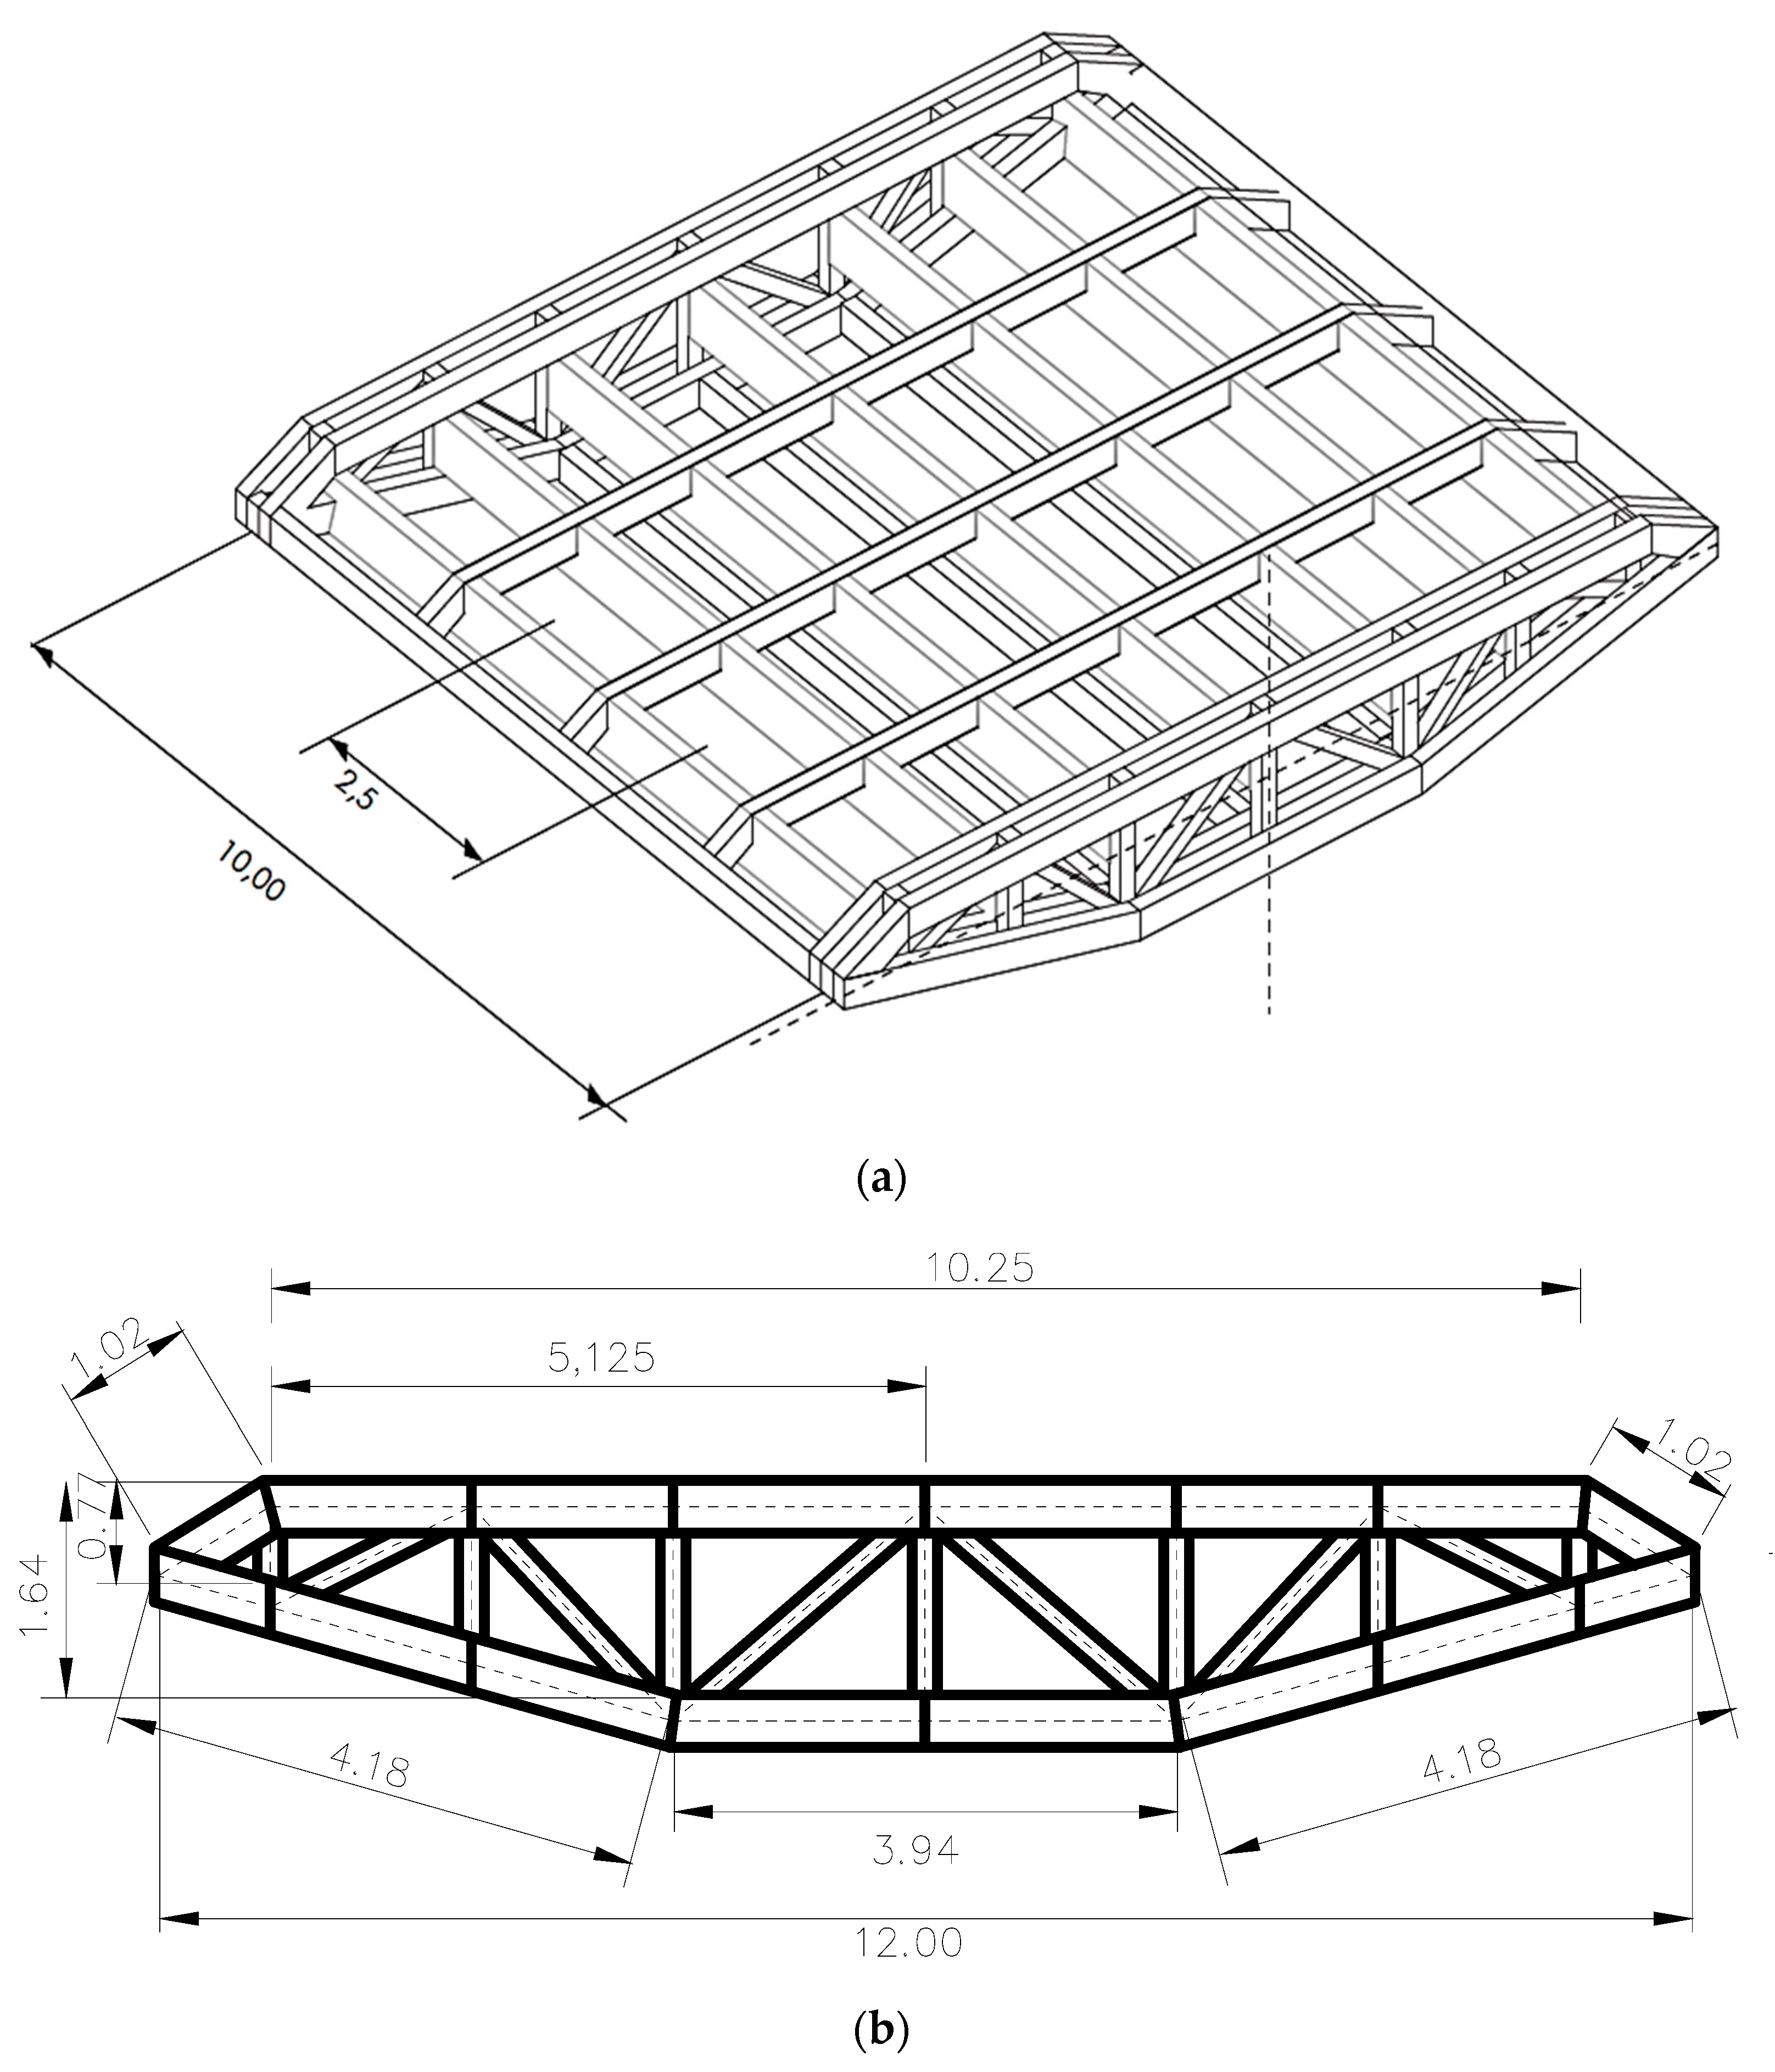
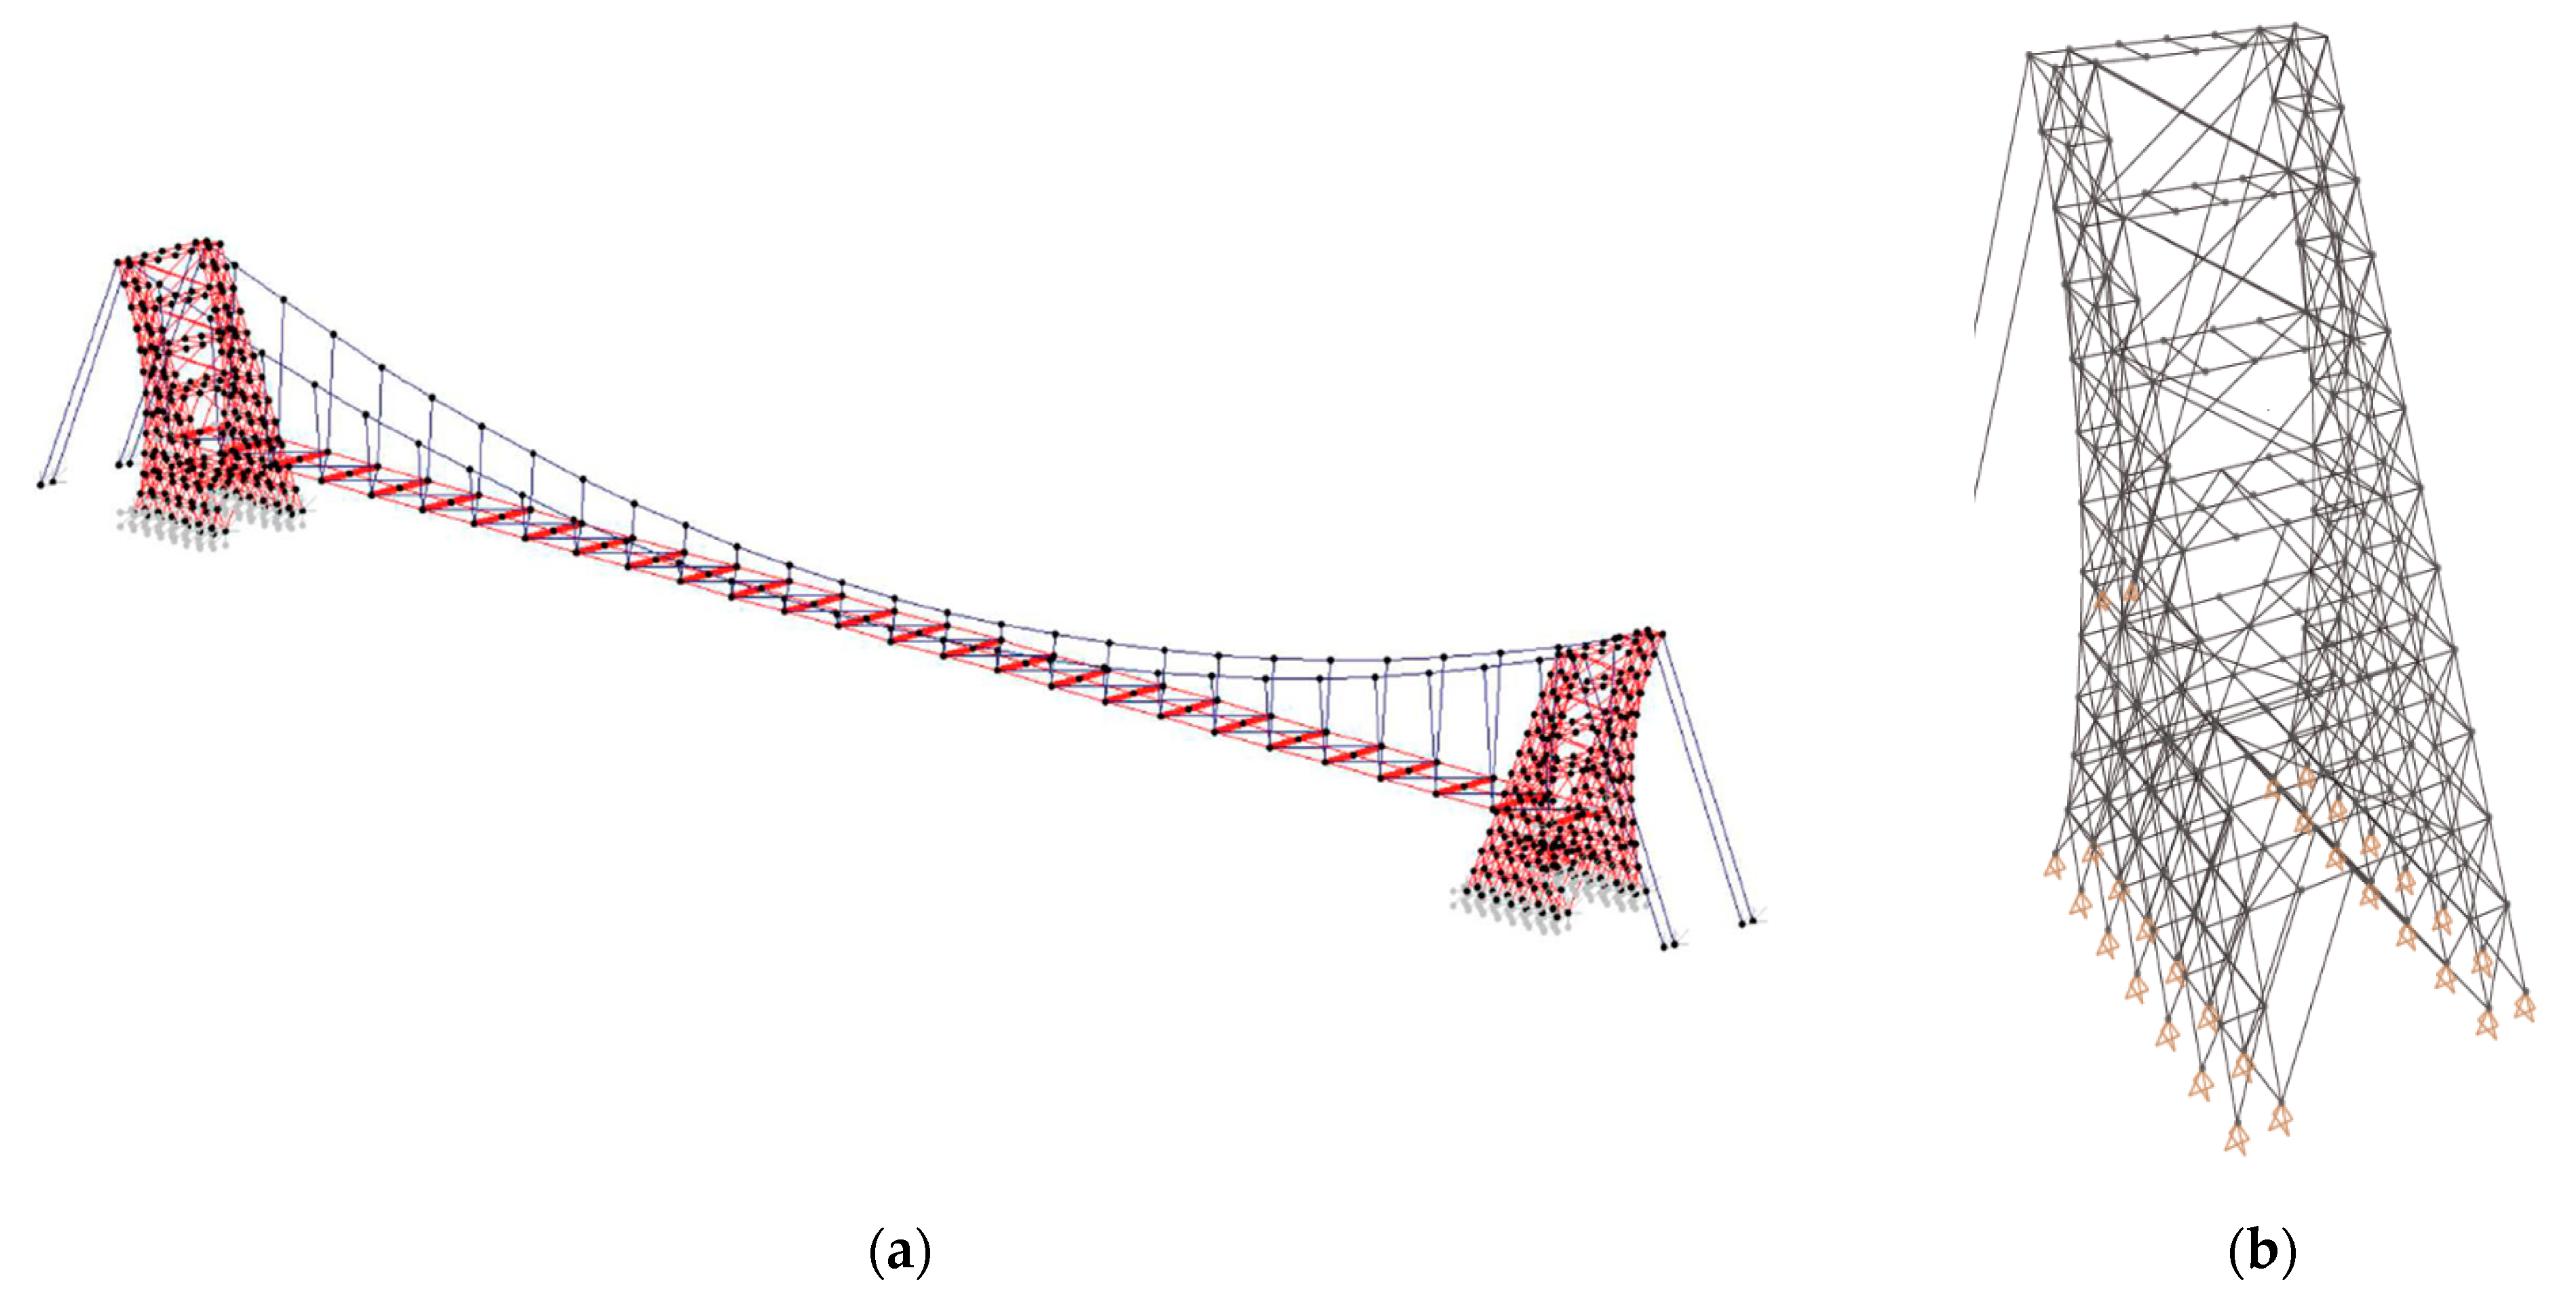
Laminated wood panels cover the underside to preserve the aerodynamics of the closed box section. The deck structure is made of 10 m long laminated wooden prefabricated parts. Figure 8a shows the typical prefabricated module for the deck. The laminated wooden deck trusses (Figure 8b) are made of 0.4 × 0.4 m laminated wood beams connected by galvanized steel plates and bolts. Structures were designed according to [32,33,34]. Figure 9a shows the global FE model and Figure 9b shows a detail of the FE model tower, designed as truss system structures.
The estimated mass per unit length and mass moment of inertia were equal to 3903 kg and 47,701 kgm, respectively. The first vertical and torsional angular frequencies estimated through modal analyses were estimated to be equal to 2.8 and 3.4 rad/s, respectively. The estimated critical flutter speed with a structural damping ratio equal to 0.3% was estimated to be equal to 67 m/s.
7. Conclusions
The aeroelastic response of pedestrian bridges made with steel (with harmonic steel cables) and with laminated wood (with hemp cables) was compared by varying the deck chord and the deck loads. It was estimated that laminated wooden structures are 16% lighter, but at the same time stiffer than steel structures, for two reasons: the smaller stress limit of wood and the higher specific gravity of steel.
The critical flutter speeds of a total of 50 different configurations of pedestrian bridges were assessed in the wind tunnel using the multi-mode approach in the frequency domain. It was estimated that structures made of wood and hemp cables have a critical flutter speed on average 32% and 20% higher than steel structures, applying structural damping equal to 0.3% and 1.0% respectively. In this paper, an example of a pedestrian bridge designed to cross the Vomano river in the center of Italy is discussed as a case study. Its critical flutter speed was estimated to be equal to 67 m/s.
Author Contributions
Author computed numerical analyses and carried out experimental tests. The author has read and agreed to the published version of the manuscript.
Funding
No founds to declare for this research.
Acknowledgments
Author would like to thank Professor Luca Caracoglia for his support through experimental tests.
Conflicts of Interest
The authors declare no conflict of interest.
References
- Breyer, D.; Fridley, K.; Pollock, D.; Cobeen, K. Design of Wood Structures, 8th ed.; McGraw-Hill Education: New York, NY, USA, 2019. [Google Scholar]
- Wacker, J.P.; Smith, M.S. Standard Plans for Timber Bridge Superstructures. Forest Products Laboratory. Madison: Department of Agriculture, Forest Service. Available online: https://www.fs.usda.gov/treesearch/pubs/9710 (accessed on 21 June 2020).
- Sheila, R.D.; Robert, C. Wood, The Federal Highway Administration Timber Bridge Program. 2012. Available online: https://www.fpl.fs.fed.us/documnts/pdf1996/duwad96a.pdf (accessed on 21 June 2020).
- James, W.; Mathew, S. Standard Plans for Timber Bridge Structures. Forest Products Laboratory. 2012. Available online: https://www.fs.usda.gov/treesearch/pubs/9710 (accessed on 21 June 2020).
- Viskovic, A. Hemp Cables, a Sustainable Alternative to Harmonic Steel for Cable Nets. Resources 2018, 7, 70. [Google Scholar] [CrossRef] [Green Version]
- Herer, J.; The Emperor Wears No Clothes. Text from “The Emperor Wears No Clothes” © Jack Herer. Available online: http://www.electricemperor.com/eecdrom/TEXT/TXTCH02.HTM (accessed on 1 November 2018).
- Zhang, H.; Zhong, Z.; Feng, L. Advances in the performance and application of hemp fiber. Int. J. Simul. Syst. Sci. Technol. 2016, 17. [Google Scholar] [CrossRef]
- Boesa, I.; Karus, M. The Cultivation of Hemp: Botan, Varieties, Cultivation and Harvesting; Hemptegh: Auckland, New Zealand, 1998; pp. 24–29. [Google Scholar]
- Cuissinat, C.; Navard, P. Swelling and dissolution of cellulose—Part III: Plant fibers in aqueous systems. Cellulose 2008, 12, 14–21. [Google Scholar] [CrossRef]
- Karus, M. Fibrin bandages include natural clotting agents—US Army and Navy tackle bleeding in different ways. MedText 1999, 9, 11–13. [Google Scholar]
- Pejic, B.; Vukcevic, M.; Kostic, M.; Skundric, P. Biosorption of heavy metal ions from aqueous solutions by short hemp fibers: Effect of chemical composition. J. Hazard. Mater. 2004, 23, 152–159. [Google Scholar] [CrossRef] [PubMed]
- Mwaikambo, L.Y.; Ansell, M.P. Chemical modification of hemp, sisal, jute, and kapok fibers by alkalization. J. Appl. Polym. Sci. 2002, 84, 2222–2234. [Google Scholar] [CrossRef]
- Ouajai, S.; Shanks, R.A. Composition, structure and thermal degradation of hemp cellulose after chemical treatments. Polym. Degrad. Stab. 2005, 89, 327–335. [Google Scholar] [CrossRef]
- CGA/R. West. Published by Warner Chappell Music. Environmental and Economic Benefits of Hemp. Available online: http://www.nemeton.com/static/nemeton/axis-mutatis/hemp.html (accessed on 1 November 2018).
- Hirst, E.; Walker, P.; Paine, K.; Yates, T. Characterization of Low Density Hemp-Lime Composite Building Materials Under Compression Loading. In Proceedings of the Second International Conference on Sustainable Construction Materials and Technologies, Acona, Italy, 28 June 2010. [Google Scholar]
- McLaren, A.J. Design and performance of ropes for climbing and sailing. Proc. Inst. Mech. Eng. Part. L J. Mater. Des. Appl. 2006, 220, 1–12. [Google Scholar] [CrossRef] [Green Version]
- Rizzo, F.; Caracoglia, L. Examining wind tunnel errors in Scanlan derivatives and flutter speed of a closed-box. J. Wind Struct. 2018, 26, 231–251. [Google Scholar]
- Scanlan, R.H.; Tomko, J.J. Airfoil and bridge deck flutter derivatives. J. Eng. Mech. Div. 1971, 97, 1717–1737. [Google Scholar]
- Simiu, E.; Scanlan, R.H. Wind Effects on Structures, 2nd ed.; John Wiley & Sons: New York, NY, USA, 1986. [Google Scholar]
- Rizzo, F.; Caracoglia, L.; Montelpare, S. Predicting the flutter speed of a pedestrian suspension bridge through examination of laboratory experimental errors. Eng. Struct. 2018, 172, 589–613. [Google Scholar] [CrossRef]
- Augusti, G.; Spinelli, P.; Borri, C.; Bartoli, G.; Giachi, M.; Giordano, S. The C.R.I.A.C.I.V. Atmospheric Boundary Layer Wind Tunnel. Proceeding of the 9th International Conference on Wind Engineering, New Delhi, India, 9–13 January 1995; Wiley Eastern Ltd.: Delhi, India, 1995. [Google Scholar]
- National Research Council of Italy (CNR). Guide for the Assessment of Wind Actions and Effects on Structures; CNR-DT 207/2008; CNR: Roma, Italy, 2008. [Google Scholar]
- Brito, R.; Caracoglia, L. Extraction of flutter derivatives from small scale wind tunnel experiments. In Proceedings of the 11th Americas Conference on Wind Engineering, American Association for Wind Engineering (AAWE), San Juan, Puerto Rico, 22–26 June 2009. [CD-ROM]. [Google Scholar]
- Seo, D.-W.; Caracoglia, L. Statistical buffeting response of flexible bridges influenced by errors in aeroelastic loading estimation. J. Wind Eng. Ind. Aerodyn. 2012, 129–140. [Google Scholar] [CrossRef]
- Matsumoto, M. Aerodynamic damping of prisms. J. Wind Eng. Ind. Aerodyn. 1996, 59, 159–175. [Google Scholar] [CrossRef]
- Matsumoto, M.; Abern, K. Role of coupled derivatives on flutter instabilities. Wind Struct. 1998, 1, 175–181. [Google Scholar] [CrossRef]
- Matsumoto, M.; Kobayashi, Y.; Shirato, H. The influence of aerodynamic derivatives on flutter. J. Wind Eng. Ind. Aerodyn. 1996, 60, 227–239. [Google Scholar] [CrossRef]
- Sato, H.; Murakoshi, J.; Fumoto, K. Benchmark Study on Flutter Derivatives–Measurements at PWRI, Japan; Unpublished Research Report, Structures Research Group; Public Works Research Institute: Tsukuba, Japan, 2004. [Google Scholar]
- Sarkar, P.P.; Caracoglia, L.; Haan, F.L.; Sato, H.; Murakoshi, J. Comparative and sensitivity study of flutter derivatives of selected bridge deck sections. Part 1: Analysis of inter-laboratory experimental data. Eng. Struct. 2009, 31, 158–169. [Google Scholar] [CrossRef]
- Rizzo, F.; Caracoglia, L. Artificial Neural Network model to predict the flutter velocity of suspension bridges. Comput. Struct. 2020, 233, 106236. [Google Scholar] [CrossRef]
- Gimsing, N.J.; Georgakis, C.T. Cable Supported Bridges: Concept and Design, 3rd ed.; Department of Civil Engineering, Technical University of Denmark: Chichester, UK, 2011. [Google Scholar]
- Comité Européen de Normalization (CEN). Eurocode 1: Actions on Structures—Part. 1–4: General Actions—Wind Actions; EN-1991-1-4; Comité Européen de Normalization: Brussels, Belgium, 2005. [Google Scholar]
- American Society of Civil Engineering (ASCE). Wind Tunnel Studies of Buildings and Structures; Isyumov, N., Ed.; Manuals of Practice (MOP) 67; ASCE: Reston, VA, USA, 1999. [Google Scholar]
- American Society of Civil Engineering (ASCE). Minimum Design Loads for Buildings and Other Structures; ASCE: Reston, VA, USA, 2010. [Google Scholar]
Figure 1.
Reference coordinate system.

Figure 2.
Geometry parameters: close box section (a), pedestrian bridge outline (b) [20].
Figure 2.
Geometry parameters: close box section (a), pedestrian bridge outline (b) [20].

Figure 3.
Aerodynamic tests: experimental setup (a), pressure tap positions (b) [20].
Figure 3.
Aerodynamic tests: experimental setup (a), pressure tap positions (b) [20].

Figure 4.
Example of pressure coefficients trend: α = −10° (a) and α = 10° (b) [20].
Figure 4.
Example of pressure coefficients trend: α = −10° (a) and α = 10° (b) [20].

Figure 5.
Aeroelastic tests: flutter derivatives (a), flutter derivatives (b) [20].
Figure 5.
Aeroelastic tests: flutter derivatives (a), flutter derivatives (b) [20].

Figure 6.
Finite element model details of the pedestrian bridges structure: deck structure (a), tower (b) and bridge (c) [20].
Figure 6.
Finite element model details of the pedestrian bridges structure: deck structure (a), tower (b) and bridge (c) [20].


Figure 7.
Pedestrian bridge virtual photograph (a) and longitudinal view (b).

Figure 8.
Deck structure: axonometric three-dimensional view (a) and cross-section view (b).

Figure 9.
Structural FE model: global view (a) and tower detail (b).


Table 1.
Geometric dimensions of the pedestrian bridge.
| Geometrical Configuration | ||||||||||||
|---|---|---|---|---|---|---|---|---|---|---|---|---|
| m | m | m | m | m | m | m | m | m | m | m | m | |
| 1 | 0.97 | 2.59 | 0.55 | 1.09 | 10.05 | 6.81 | 494.00 | 584.00 | 45.00 | 3.00 | 45.00 | 15.00 |
| 2 | 0.78 | 2.08 | 0.44 | 0.87 | 8.04 | 5.45 | ||||||
| 3 | 0.88 | 2.34 | 0.49 | 0.98 | 9.05 | 6.13 | ||||||
| 4 | 1.17 | 3.11 | 0.66 | 1.31 | 12.06 | 8.17 | ||||||
| 5 | 1.07 | 2.85 | 0.60 | 1.20 | 11.06 | 7.49 |
Table 2.
Dimensions, structural loads, masses and inertia for the closed box section made of steel.
| Configuration | m | m | kN/m2 | kN/m2 | kN/m2 | kg/m | kgm |
|---|---|---|---|---|---|---|---|
| 1 | 1.64 | 12.00 | 0.86 | 4.20 | 2.50 | 6187.56 | 75,637.60 |
| 2 | 1.64 | 12.00 | 0.86 | 3.85 | 2.50 | 5759.43 | 70,404.03 |
| 3 | 1.64 | 12.00 | 0.86 | 3.50 | 2.50 | 5331.29 | 65,170.46 |
| 4 | 1.64 | 12.00 | 0.86 | 3.15 | 2.50 | 4903.16 | 59,936.88 |
| 5 | 1.64 | 12.00 | 0.86 | 2.88 | 2.50 | 4572.88 | 55,899.55 |
| 6 | 1.31 | 9.60 | 1.07 | 4.20 | 2.50 | 5160.04 | 40,369.30 |
| 7 | 1.31 | 9.60 | 1.07 | 3.85 | 2.50 | 4817.53 | 37,689.71 |
| 8 | 1.31 | 9.60 | 1.07 | 3.50 | 2.50 | 4475.03 | 35,010.12 |
| 9 | 1.31 | 9.60 | 1.07 | 3.15 | 2.50 | 4132.52 | 32,330.53 |
| 10 | 1.31 | 9.60 | 1.07 | 2.88 | 2.50 | 3868.30 | 30,263.42 |
| 11 | 1.48 | 10.80 | 0.95 | 4.20 | 2.50 | 5673.80 | 56,179.43 |
| 12 | 1.48 | 10.80 | 0.95 | 3.85 | 2.50 | 5288.48 | 52,364.15 |
| 13 | 1.48 | 10.80 | 0.95 | 3.50 | 2.50 | 4903.16 | 48,548.87 |
| 14 | 1.48 | 10.80 | 0.95 | 3.15 | 2.50 | 4517.84 | 44,733.60 |
| 15 | 1.48 | 10.80 | 0.95 | 2.88 | 2.50 | 4220.59 | 41,790.39 |
| 16 | 1.97 | 14.40 | 0.72 | 4.20 | 2.50 | 7215.09 | 127,005.38 |
| 17 | 1.97 | 14.40 | 0.72 | 3.85 | 2.50 | 6701.33 | 117,961.77 |
| 18 | 1.97 | 14.40 | 0.72 | 3.50 | 2.50 | 6187.56 | 108,918.15 |
| 19 | 1.97 | 14.40 | 0.72 | 3.15 | 2.50 | 5673.80 | 99,874.53 |
| 20 | 1.97 | 14.40 | 0.72 | 2.88 | 2.50 | 5277.47 | 92,898.03 |
| 21 | 1.80 | 13.20 | 0.78 | 4.20 | 2.50 | 6701.33 | 99,120.65 |
| 22 | 1.80 | 13.20 | 0.78 | 3.85 | 2.50 | 6230.38 | 92,154.76 |
| 23 | 1.80 | 13.20 | 0.78 | 3.50 | 2.50 | 5759.43 | 85,188.88 |
| 24 | 1.80 | 13.20 | 0.78 | 3.15 | 2.50 | 5288.48 | 78,222.99 |
| 25 | 1.80 | 13.20 | 0.78 | 2.88 | 2.50 | 4925.18 | 72,849.31 |
Table 3.
Dimensions, structural loads, masses and inertia for the closed box section made of laminated wood.
Table 3.
Dimensions, structural loads, masses and inertia for the closed box section made of laminated wood.
| Configuration | m | m | kN/m2 | kN/m2 | kN/m2 | kg/m | kgm |
|---|---|---|---|---|---|---|---|
| 1 | 1.64 | 12.00 | 0.75 | 3.60 | 2.50 | 5321.10 | 65,045.85 |
| 2 | 1.64 | 12.00 | 0.75 | 3.30 | 2.50 | 4954.13 | 60,559.93 |
| 3 | 1.64 | 12.00 | 0.75 | 3.00 | 2.50 | 4587.16 | 56,074.01 |
| 4 | 1.64 | 12.00 | 0.75 | 2.70 | 2.50 | 4220.18 | 51,588.09 |
| 5 | 1.64 | 12.00 | 0.75 | 2.44 | 2.50 | 3902.14 | 47,700.29 |
| 6 | 1.31 | 9.60 | 0.94 | 3.60 | 2.50 | 4440.37 | 34,738.97 |
| 7 | 1.31 | 9.60 | 0.94 | 3.30 | 2.50 | 4146.79 | 32,442.18 |
| 8 | 1.31 | 9.60 | 0.94 | 3.00 | 2.50 | 3853.21 | 30,145.39 |
| 9 | 1.31 | 9.60 | 0.94 | 2.70 | 2.50 | 3559.63 | 27,848.59 |
| 10 | 1.31 | 9.60 | 0.94 | 2.44 | 2.50 | 3305.20 | 25,858.04 |
| 11 | 1.48 | 10.80 | 0.83 | 3.60 | 2.50 | 4880.73 | 48,326.82 |
| 12 | 1.48 | 10.80 | 0.83 | 3.30 | 2.50 | 4550.46 | 45,056.59 |
| 13 | 1.48 | 10.80 | 0.83 | 3.00 | 2.50 | 4220.18 | 41,786.35 |
| 14 | 1.48 | 10.80 | 0.83 | 2.70 | 2.50 | 3889.91 | 38,516.11 |
| 15 | 1.48 | 10.80 | 0.83 | 2.44 | 2.50 | 3603.67 | 35,681.91 |
| 16 | 1.97 | 14.40 | 0.63 | 3.60 | 2.50 | 6201.83 | 109,169.36 |
| 17 | 1.97 | 14.40 | 0.63 | 3.30 | 2.50 | 5761.47 | 101,417.69 |
| 18 | 1.97 | 14.40 | 0.63 | 3.00 | 2.50 | 5321.10 | 93,666.02 |
| 19 | 1.97 | 14.40 | 0.63 | 2.70 | 2.50 | 4880.73 | 85,914.35 |
| 20 | 1.97 | 14.40 | 0.63 | 2.44 | 2.50 | 4499.08 | 79,196.23 |
| 21 | 1.80 | 13.20 | 0.68 | 3.60 | 2.50 | 5761.47 | 85,219.03 |
| 22 | 1.80 | 13.20 | 0.68 | 3.30 | 2.50 | 5357.80 | 79,248.27 |
| 23 | 1.80 | 13.20 | 0.68 | 3.00 | 2.50 | 4954.13 | 73,277.51 |
| 24 | 1.80 | 13.20 | 0.68 | 2.70 | 2.50 | 4550.46 | 67,306.75 |
| 25 | 1.80 | 13.20 | 0.68 | 2.44 | 2.50 | 4200.61 | 62,132.09 |
Table 4.
First vertical and torsional natural frequencies [14].
Table 4.
First vertical and torsional natural frequencies [14].
| Configuration # | Steel and Harmonic Steel Cables | Laminated Wood and Hemp Cables | ||||
|---|---|---|---|---|---|---|
| rad/s | rad/s | rad/s | rad/s | |||
| 1 | 1.834 | 2.901 | 1.582 | 2.594 | 3.799 | 1.465 |
| 2 | 1.834 | 2.945 | 1.606 | 2.656 | 3.862 | 1.454 |
| 3 | 1.834 | 2.989 | 1.630 | 2.719 | 3.931 | 1.446 |
| 4 | 1.834 | 3.027 | 1.651 | 2.788 | 4.000 | 1.435 |
| 5 | 1.828 | 3.052 | 1.670 | 2.845 | 4.183 | 1.470 |
| 6 | 1.784 | 2.770 | 1.553 | 2.003 | 3.611 | 1.803 |
| 7 | 1.790 | 2.820 | 1.575 | 2.010 | 3.674 | 1.828 |
| 8 | 1.790 | 2.864 | 1.600 | 2.066 | 3.737 | 1.809 |
| 9 | 1.784 | 2.914 | 1.634 | 2.116 | 3.806 | 1.798 |
| 10 | 1.784 | 2.945 | 1.651 | 2.167 | 3.869 | 1.786 |
| 11 | 1.809 | 2.839 | 1.570 | 2.267 | 3.705 | 1.634 |
| 12 | 1.809 | 2.889 | 1.597 | 2.324 | 3.768 | 1.622 |
| 13 | 1.809 | 2.933 | 1.622 | 2.380 | 3.837 | 1.612 |
| 14 | 1.809 | 2.977 | 1.646 | 2.443 | 3.906 | 1.599 |
| 15 | 1.802 | 3.002 | 1.665 | 2.499 | 3.969 | 1.588 |
| 16 | 1.890 | 3.008 | 1.591 | 3.008 | 3.969 | 1.319 |
| 17 | 1.890 | 3.046 | 1.611 | 3.040 | 4.032 | 1.326 |
| 18 | 1.890 | 3.084 | 1.631 | 3.071 | 4.101 | 1.335 |
| 19 | 1.884 | 3.115 | 1.653 | 2.901 | 4.327 | 1.491 |
| 20 | 1.878 | 3.134 | 1.669 | 2.744 | 4.296 | 1.565 |
| 21 | 1.859 | 2.958 | 1.591 | 2.927 | 3.881 | 1.326 |
| 22 | 1.859 | 2.656 | 1.429 | 2.933 | 3.950 | 1.347 |
| 23 | 1.859 | 3.040 | 1.635 | 2.958 | 4.019 | 1.359 |
| 24 | 1.859 | 3.077 | 1.655 | 2.977 | 4.088 | 1.373 |
| 25 | 1.853 | 3.096 | 1.671 | 2.813 | 4.183 | 1.487 |
Table 5.
Critical flutter speed estimated with ζ = 1.0%.
| Configuration # | Steel and Harmonic Steel Cables | Wood and Hemp Cables | ||||||
|---|---|---|---|---|---|---|---|---|
| m/s | m/s | |||||||
| 1 | 103.8 | 91.5 | 56.6 | 11.5 | 132.1 | 114.9 | 62.0 | 20.0 |
| 2 | 103.2 | 91.1 | 52.5 | 13.2 | 136.8 | 113.8 | 62.4 | 23.2 |
| 3 | 103.3 | 90.0 | 48.8 | 15.5 | 139.5 | 111.7 | 63.5 | 25.7 |
| 4 | 105.0 | 87.7 | 48.9 | 17.9 | 138.2 | 106.4 | 64.6 | 26.5 |
| 5 | 107.8 | 86.2 | 49.3 | 19.9 | 146.2 | 109.5 | 67.5 | 29.8 |
| 6 | 75.2 | 69.8 | 35.8 | 7.1 | 101.1 | 90.5 | 66.2 | 8.1 |
| 7 | 78.4 | 70.8 | 36.4 | 7.7 | 102.9 | 91.7 | 61.2 | 10.1 |
| 8 | 78.8 | 72.8 | 52.9 | 6.2 | 106.9 | 92.9 | 56.4 | 12.6 |
| 9 | 81.9 | 73.6 | 47.9 | 8.3 | 106.6 | 92.6 | 52.0 | 14.5 |
| 10 | 84.7 | 73.8 | 44.8 | 9.7 | 109.2 | 91.1 | 50.4 | 16.8 |
| 11 | 88.6 | 81.3 | 58.9 | 6.9 | 118.4 | 104.5 | 62.9 | 13.9 |
| 12 | 91.7 | 82.6 | 54.5 | 9.0 | 119.3 | 104.3 | 58.3 | 16.1 |
| 13 | 94.9 | 83.1 | 50.1 | 11.0 | 120.9 | 102.6 | 56.4 | 18.5 |
| 14 | 94.8 | 82.5 | 45.7 | 13.1 | 124.5 | 101.6 | 56.8 | 21.7 |
| 15 | 93.0 | 80.1 | 44.0 | 14.5 | 125.6 | 99.5 | 57.7 | 23.8 |
| 16 | 126.6 | 105.9 | 58.7 | 21.1 | 165.4 | 130.7 | 76.9 | 31.7 |
| 17 | 129.4 | 103.7 | 59.0 | 23.2 | 166.2 | 127.3 | 78.0 | 33.9 |
| 18 | 126.4 | 100.0 | 59.8 | 24.3 | 172.6 | 124.0 | 79.4 | 36.1 |
| 19 | 133.3 | 98.5 | 60.3 | 26.5 | 180.5 | 126.4 | 83.7 | 39.3 |
| 20 | 131.2 | 96.5 | 60.6 | 27.1 | 180.3 | 124.9 | 83.0 | 38.4 |
| 21 | 113.7 | 99.9 | 55.1 | 15.9 | 149.1 | 121.6 | 69.0 | 25.7 |
| 22 | 102.8 | 87.0 | 47.7 | 16.2 | 154.7 | 122.3 | 70.2 | 29.0 |
| 23 | 116.8 | 95.8 | 54.0 | 20.5 | 152.7 | 115.5 | 71.4 | 29.7 |
| 24 | 115.7 | 92.3 | 54.7 | 22.0 | 156.8 | 115.9 | 72.6 | 31.6 |
| 25 | 120.1 | 91.0 | 55.0 | 23.0 | 164.3 | 113.4 | 74.2 | 35.0 |
Table 6.
Critical flutter speed estimated with ζ = 0.3%.
| Configuration # | Steel and Harmonic Steel Cables | Wood and Hemp Cables | ||||||
|---|---|---|---|---|---|---|---|---|
| m/s | m/s | |||||||
| 1 | 102.9 | 65.9 | 41.4 | 22.1 | 125.5 | 109.1 | 58.9 | 31.3 |
| 2 | 104.4 | 71.6 | 45.9 | 23.2 | 135.4 | 112.6 | 61.8 | 32.8 |
| 3 | 106.9 | 75.7 | 41.7 | 24.6 | 134.0 | 107.2 | 60.9 | 35.4 |
| 4 | 108.5 | 71.4 | 24.5 | 30.0 | 135.4 | 104.3 | 63.3 | 36.2 |
| 5 | 109.4 | 75.3 | 24.7 | 30.6 | 136.0 | 101.8 | 62.8 | 39.4 |
| 6 | 74.1 | 50.4 | 35.8 | 15.7 | 103.1 | 92.3 | 67.6 | 24.0 |
| 7 | 79.9 | 52.8 | 36.5 | 16.2 | 104.0 | 92.6 | 61.8 | 24.9 |
| 8 | 80.9 | 53.1 | 37.1 | 17.1 | 105.8 | 92.0 | 55.9 | 23.6 |
| 9 | 82.3 | 52.8 | 35.4 | 17.1 | 101.3 | 88.0 | 49.4 | 24.4 |
| 10 | 83.5 | 50.6 | 19.2 | 19.2 | 107.1 | 89.3 | 49.4 | 24.8 |
| 11 | 90.3 | 58.6 | 40.9 | 18.6 | 117.2 | 103.5 | 62.3 | 27.3 |
| 12 | 91.7 | 58.9 | 37.5 | 19.5 | 121.7 | 106.3 | 59.5 | 29.0 |
| 13 | 93.5 | 62.5 | 42.7 | 19.9 | 133.0 | 112.9 | 62.0 | 30.9 |
| 14 | 95.8 | 62.9 | 21.9 | 24.6 | 118.2 | 96.5 | 54.0 | 32.5 |
| 15 | 96.6 | 62.9 | 23.9 | 25.4 | 120.5 | 95.5 | 55.4 | 34.3 |
| 16 | 128.8 | 93.9 | 47.7 | 30.9 | 162.1 | 128.1 | 75.4 | 38.4 |
| 17 | 131.1 | 97.9 | 47.2 | 32.1 | 164.6 | 126.0 | 77.2 | 41.3 |
| 18 | 132.7 | 95.3 | 26.8 | 36.7 | 169.2 | 121.6 | 77.8 | 42.2 |
| 19 | 134.3 | 97.9 | 26.8 | 37.1 | 178.7 | 125.1 | 82.9 | 51.5 |
| 20 | 135.3 | 99.9 | 26.8 | 40.1 | 173.1 | 119.9 | 79.7 | 52.4 |
| 21 | 116.0 | 83.8 | 43.4 | 28.1 | 146.1 | 119.2 | 67.6 | 34.3 |
| 22 | 105.0 | 83.2 | 47.5 | 23.3 | 150.1 | 118.6 | 68.1 | 36.7 |
| 23 | 119.8 | 84.0 | 26.8 | 33.1 | 146.6 | 110.9 | 68.5 | 39.2 |
| 24 | 121.4 | 89.2 | 26.8 | 31.7 | 145.9 | 107.8 | 67.5 | 40.1 |
| 25 | 122.3 | 91.1 | 26.8 | 31.4 | 180.7 | 124.8 | 81.7 | 45.1 |
© 2020 by the author. Licensee MDPI, Basel, Switzerland. This article is an open access article distributed under the terms and conditions of the Creative Commons Attribution (CC BY) license (http://creativecommons.org/licenses/by/4.0/).
Share and Cite
MDPI and ACS Style
Rizzo, F. Aeroelastic Response of Suspended Pedestrian Bridges Made of Laminated Wood and Hemp. Infrastructures 2020, 5, 60. https://0-doi-org.brum.beds.ac.uk/10.3390/infrastructures5070060
AMA Style
Rizzo F. Aeroelastic Response of Suspended Pedestrian Bridges Made of Laminated Wood and Hemp. Infrastructures. 2020; 5(7):60. https://0-doi-org.brum.beds.ac.uk/10.3390/infrastructures5070060
Chicago/Turabian StyleRizzo, Fabio. 2020. "Aeroelastic Response of Suspended Pedestrian Bridges Made of Laminated Wood and Hemp" Infrastructures 5, no. 7: 60. https://0-doi-org.brum.beds.ac.uk/10.3390/infrastructures5070060