Article

Investigation into Recycled Rubber Aggregates and Steel Wire Fiber for Use in Concrete Subjected to Impact Loading

College of Engineering, The University of Georgia, Athens, GA 30602, USA
*
Author to whom correspondence should be addressed.
Submission received: 12 August 2020 / Revised: 2 October 2020 / Accepted: 4 October 2020 / Published: 10 October 2020
(This article belongs to the Special Issue Innovate, Research, and Maintain Transportation Infrastructure)

Abstract

:
This study investigated the potential use of tire derived rubber aggregates, particularly powdered rubber, and recycled steel-wire fibers in concrete subjected to impact loading. The fibers are approximately 0.4 mm in average diameter and 25 mm in length on average. There are two main portions to this study. The first phase of this study involved small-scale batching to investigate the fresh and hardened properties of concrete mixtures with powdered rubber up to 50% replacement of sand volume and recycled steel fibers up to 0.25% by mixture volume. Additional mixtures containing powdered rubber, crumb rubber, and tire chips were evaluated for their mechanical performance. Based on fresh concrete properties, compressive strength, modulus of rigidity, and impact resilience, mixtures were selected for a second investigative phase. In this phase, static and impact testing were performed on two sets of scaled beams. One beam set was produced with concrete containing 40% powdered rubber as a sand replacement and another beam set with a combination mixture incorporating rubber products of varying sizes (10% powdered rubber, 10% crumb rubber, and 10% tire chip) and 0.25% recycled steel fiber. Flexural performance improved initially with the inclusion of powdered rubber but decreased with increasing concentrations. Mixtures including recycled steel fibers at 0.25% outperformed industrial steel fiber mixtures in both flexural strength and impact resistance. For both the static and impact beams with the recycled powdered rubber and steel fibers in the combination demonstrated improved load distribution and load-carrying capacity, acting as a sufficient replacement for industrial steel fiber reinforcement.

1. Introduction

1.1. Background

The incorporation of waste stream materials into concrete is not a new concept. Blast furnace slag, silica fume, and fly ash have long been used as supplementary cementitious materials in concrete. These waste stream products offer environmental and economic benefits, and oftentimes even enhanced concrete properties. Recycled tires present another potential source for waste stream products in concrete. According to the U.S. Tire Manufacturers Association, 3,800,378,313 kg (4,189,200 tons) of scrap tires were generated in 2017 alone, and there were 60 million tires stockpiled in the United States in 2017 [1]. While this number is down from the 1000 million stockpiled in the US in 1990, continued efforts are required to eliminate stockpiled waste tires as the existing stockpiles continue to pose a threat to public health. According to a publication by the EPA in 2010, scrap tire stockpiles promote the spread of disease, posing as breeding grounds allowing disease-carrying organisms to spread diseases like yellow fever, West Nile virus, and malaria. When managed improperly, waste tires pose environmental problems, such as contamination and fire hazards. These tire fires generate toxic emissions, which have numerous negative effects to human health. Furthermore, air, groundwater, and surface water contamination may occur when water is used to extinguish tire fires [2].
Tires can include rubber, steel, nylon, polyester, petroleum, etc. Discarded tires can be processed at tire recycling facilities, often located near metropolitan areas, and broken down into their components, separating the rubber and steel fibers from the remaining tire components. The rubber can be broken down into numerous sizes, depending on the desired application. It can be incorporated into concrete in the form of rubber fibers or as a coarse aggregate replacement, based on particle size [3]. Rubberized concrete has been shown to have improved impact resistance properties and improved toughness compared to traditional concrete [4,5,6]. Suggested applications for rubberized concrete include architectural and low-strength applications, as well as crash barriers [6,7]. The steel fiber from recycled tires may also be incorporated into concrete, as an economic alternative to industrial fiber reinforcement. Recycled steel fiber reinforced concrete has been found to perform comparably to industrial steel fiber reinforced concrete, with improved flexural strength, tensile strength, and post-cracking behavior when compared to traditional concrete. Other relevant studies involving rubber and/or steel fibers exist [8,9,10,11,12,13]. The effects (e.g., increased shear capacity, tensile strength, and high-temperature structural stability) of steel fibers in normal concrete have been studied [14,15,16]. This study aims to investigate the use of recycled tire products in the Georgia Department of Transportation (GDOT)’s concrete mixtures, specifically for use in barrier walls.

1.2. Literature Review

Among the potential engineering applications for recycled tire rubber products is the use of the products in concrete. While researchers have used rubber fibers as a fiber reinforcement to concrete [3,17], many have investigated the potential of recycled tire rubber products as replacements for virgin aggregate in concrete. Many have replaced virgin coarse aggregate with tire chips, while some [18] replaced coarse aggregate with shredded tire chips. Fine aggregate has been replaced by waste rubber fibers [17], crumb rubber, and fine rubber powder [19], and most commonly, crumb rubber. Khaloo et al. [20] and Khatib and Bayomy [21] have investigated the use of crumb rubber and tire chips in the same mixture as fine aggregate replacement and coarse aggregate replacements, respectively. Despite the plethora of work on rubberized concrete, specifically tire chip concrete and crumb rubber concrete, there is little existing literature on concrete utilizing powdered rubber as a fine aggregate replacement.
The addition of waste tire products to concrete has the following effects on the fresh properties of concrete: decrease in slump with an increase in rubberized materials; mixtures with smaller rubber particles typically have higher slumps than mixtures with larger rubber particles; increase in air content with the increase in rubberized materials; and decrease in unit weight with increase in rubber particles, in part due to the increase of air content [3,4,21,22,23,24,25].
The addition of waste tire products to concrete has the following effects on the hardened properties of concrete: decrease in compressive strength with the increase in rubber concentrations; mixtures with smaller rubber particles typically have lower reductions in compressive strength than mixtures with larger rubber particles; flexural strength and tensile strength, like compressive strength, typically decrease with increase in rubber concentrations, but at a slower rate of reduction; Modulus of elasticity (MOE) typically decreases with increase in rubber concentration, with dynamic MOE demonstrating a decreased reduction compared with static MOE; and improved toughness and impact resistance with increase in rubber concentrations up to 25% [3,4,7,17,18,19,20,21,26,27].
There are a number of potential applications for rubberized concrete. Eldin and Senouci [7] recommended potential applications of rubberized concrete for architectural applications, low-strength applications like sidewalks, and crash barriers. Atahan and Sevim [18] suggested applications where fracture is desired for energy dissipation, and specifically mentioning crash cushions and end treatment applications. Khaloo et al. [20] recommended rubberized concrete for general lightweight concrete applications and mentioned it could be used to reduce earthquake damage.
The success of steel fiber reinforced concrete led many to investigate the use of recycled steel fibers (RSF) from scrap tires as reinforcement in concrete [28,29,30]. These studies generally demonstrated similar performance of RSF when compared to similar uses of industrial steel fiber (ISF). Concrete mixtures with the addition of industrial steel fibers (ISF) have generally been shown to have improved flexural strength and toughness [31,32,33]. There is debate regarding the effect that ISF have on the compressive strength of concrete. Some studies have reported as much as a 26% increase in compressive strength with the addition of steel fibers [32] while others have reported that compressive strength was not significantly affected by the presence of fibers, but that a shift from fragile to ductile failure modes was observed [33]. Centonze et al. [34] also showed that RSF improves the brittle behavior of plain concrete, showing good energy absorption and residual strength after cracking. There is some dispute about the effects of steel fibers on the tensile properties of concrete, with some studies reporting minimal increase in tensile strength, but a change of failure mode [31,33], with others observing an increase in split tensile strength with an increase in fiber content [32].

1.3. Scope and Objective

The overall objective of this investigation is to develop rubberized and fiber reinforced concrete that demonstrates improved impact resistance over traditional concrete while using powdered rubber and recycled steel fibers (RSF). Furthermore, this study seeks to investigate combination mixtures incorporating rubber products of varying sizes such as tire chip, crumb rubber, and powdered rubber as aggregate replacements, both with and without RSF. Upon the development of improved concrete mixtures, the design could be applied to traffic barrier walls, among other applications. Concrete that is more impact resistant will improve the safety of barrier walls for occupants of vehicles impacting the walls. The replacement of natural aggregate with recycled rubber products offers an environmental benefit. The incorporation of recycled steel fibers could provide a cost-effective alternative to traditional industrially available steel fibers, as well as providing additional environmental benefits. Furthermore, the improved impact resistance of the concrete will allow for more resilient barrier walls that do not require replacement after impacts, possibly resulting in additional economic benefits as well.
This study is conducted in two phases, in order to optimize mixtures for larger scale testing. Phase I involves the developing and batching of 12 mixtures, in order to determine optimum replacement rates and concentrations for powdered rubber, recycled steel fibers, tire chip, crumb rubber, and combination mixtures. These mixtures are tested for fresh properties, as well as compressive strength, modulus of rupture (MOR), and impact resistance. Results of these tests are analyzed in order to determine optimum concentrations, at which point a mixture containing both powdered rubber and recycled steel fibers is developed. In addition, Phase I investigates the potential for a combination mixture, utilizing tire chip as coarse aggregate replacement along with powdered rubber as fine aggregate replacement. Select mixtures will be used in Phase II scaled beam testing. Scaled beams are tested for static and impact loading, and the results are analyzed in order to determine the optimum rubber and steel fiber content for future work and transportation agency applications, particularly median traffic barrier walls considered for the Georgia Department of Transportation in the United States.

1.4. Significance and Motivation

Despite the improvements in scrap tire recycling in recent years, it is important to continue to develop new applications for tire waste material. While the number of stockpiled tires has plummeted in recent years, further effort is required to eliminate the stockpiling of tires and to divert all waste tires. Previous studies have demonstrated the improvements to the impact resistance of concrete through the addition of waste tire material. This study aims to evaluate rubberized concrete while investigating the potential use of new materials consisting of powdered rubber and recycled steel fibers. Additionally, combination mixtures incorporating tire chip, crumb rubber, and powdered rubber, both with and without recycled steel fiber will be investigated in a larger laboratory-scale beam test. Furthermore, mixtures incorporating industrial steel fiber will be batched with fiber concentrations matching those used in recycled steel fiber mixtures for comparison. The investigations conducted previously will function as a guide for applications of these materials, such as replacement rates of aggregates and concentrations of fiber reinforcements. Furthermore, the testing methods applied to determine characteristics such as impact resistance and toughness can be applied to mixtures with the new materials and compared to their counterparts using tire chips, crumb rubber, and industrial steel fibers. The significance of this investigation is to develop rubberized and fiber reinforced concrete that demonstrates improved impact resistance over traditional concrete while using powdered rubber and recycled steel fibers. Upon the development of improved concrete mixtures, the design could be applied to traffic safety barrier walls, among other applications. Concrete that is more impact resistant will improve the safety of barrier walls for occupants of vehicles impacting the walls.

2. Experimental Design

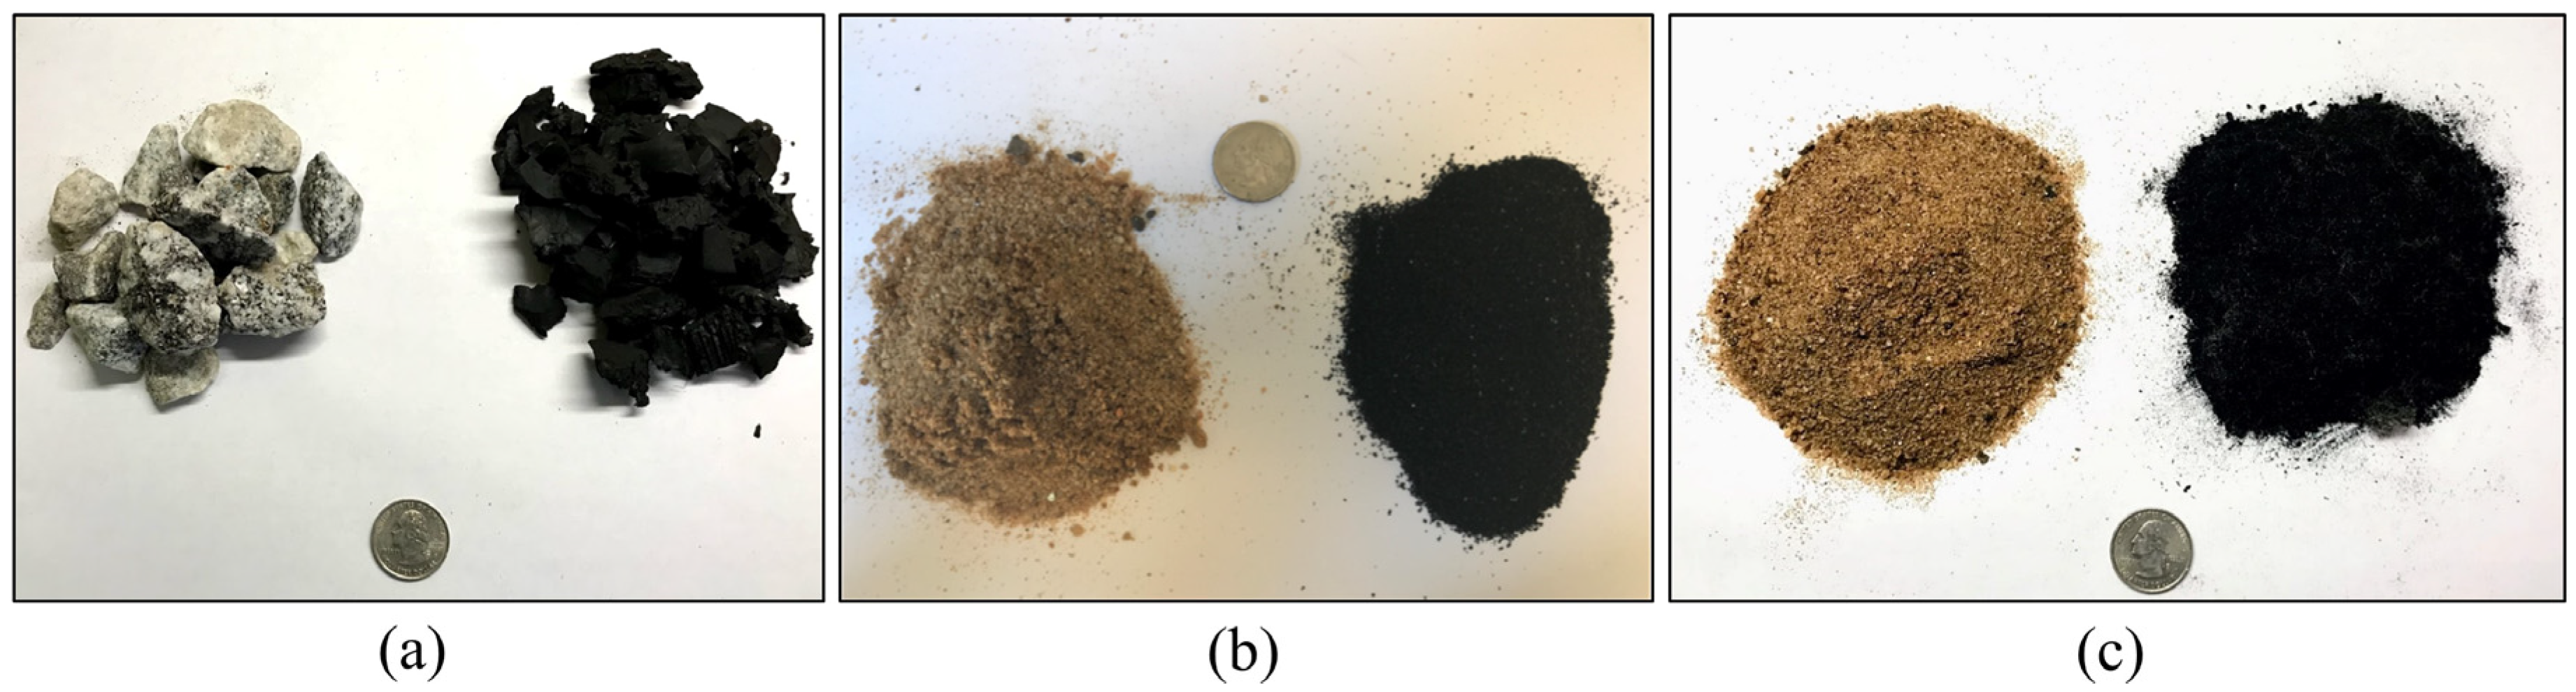
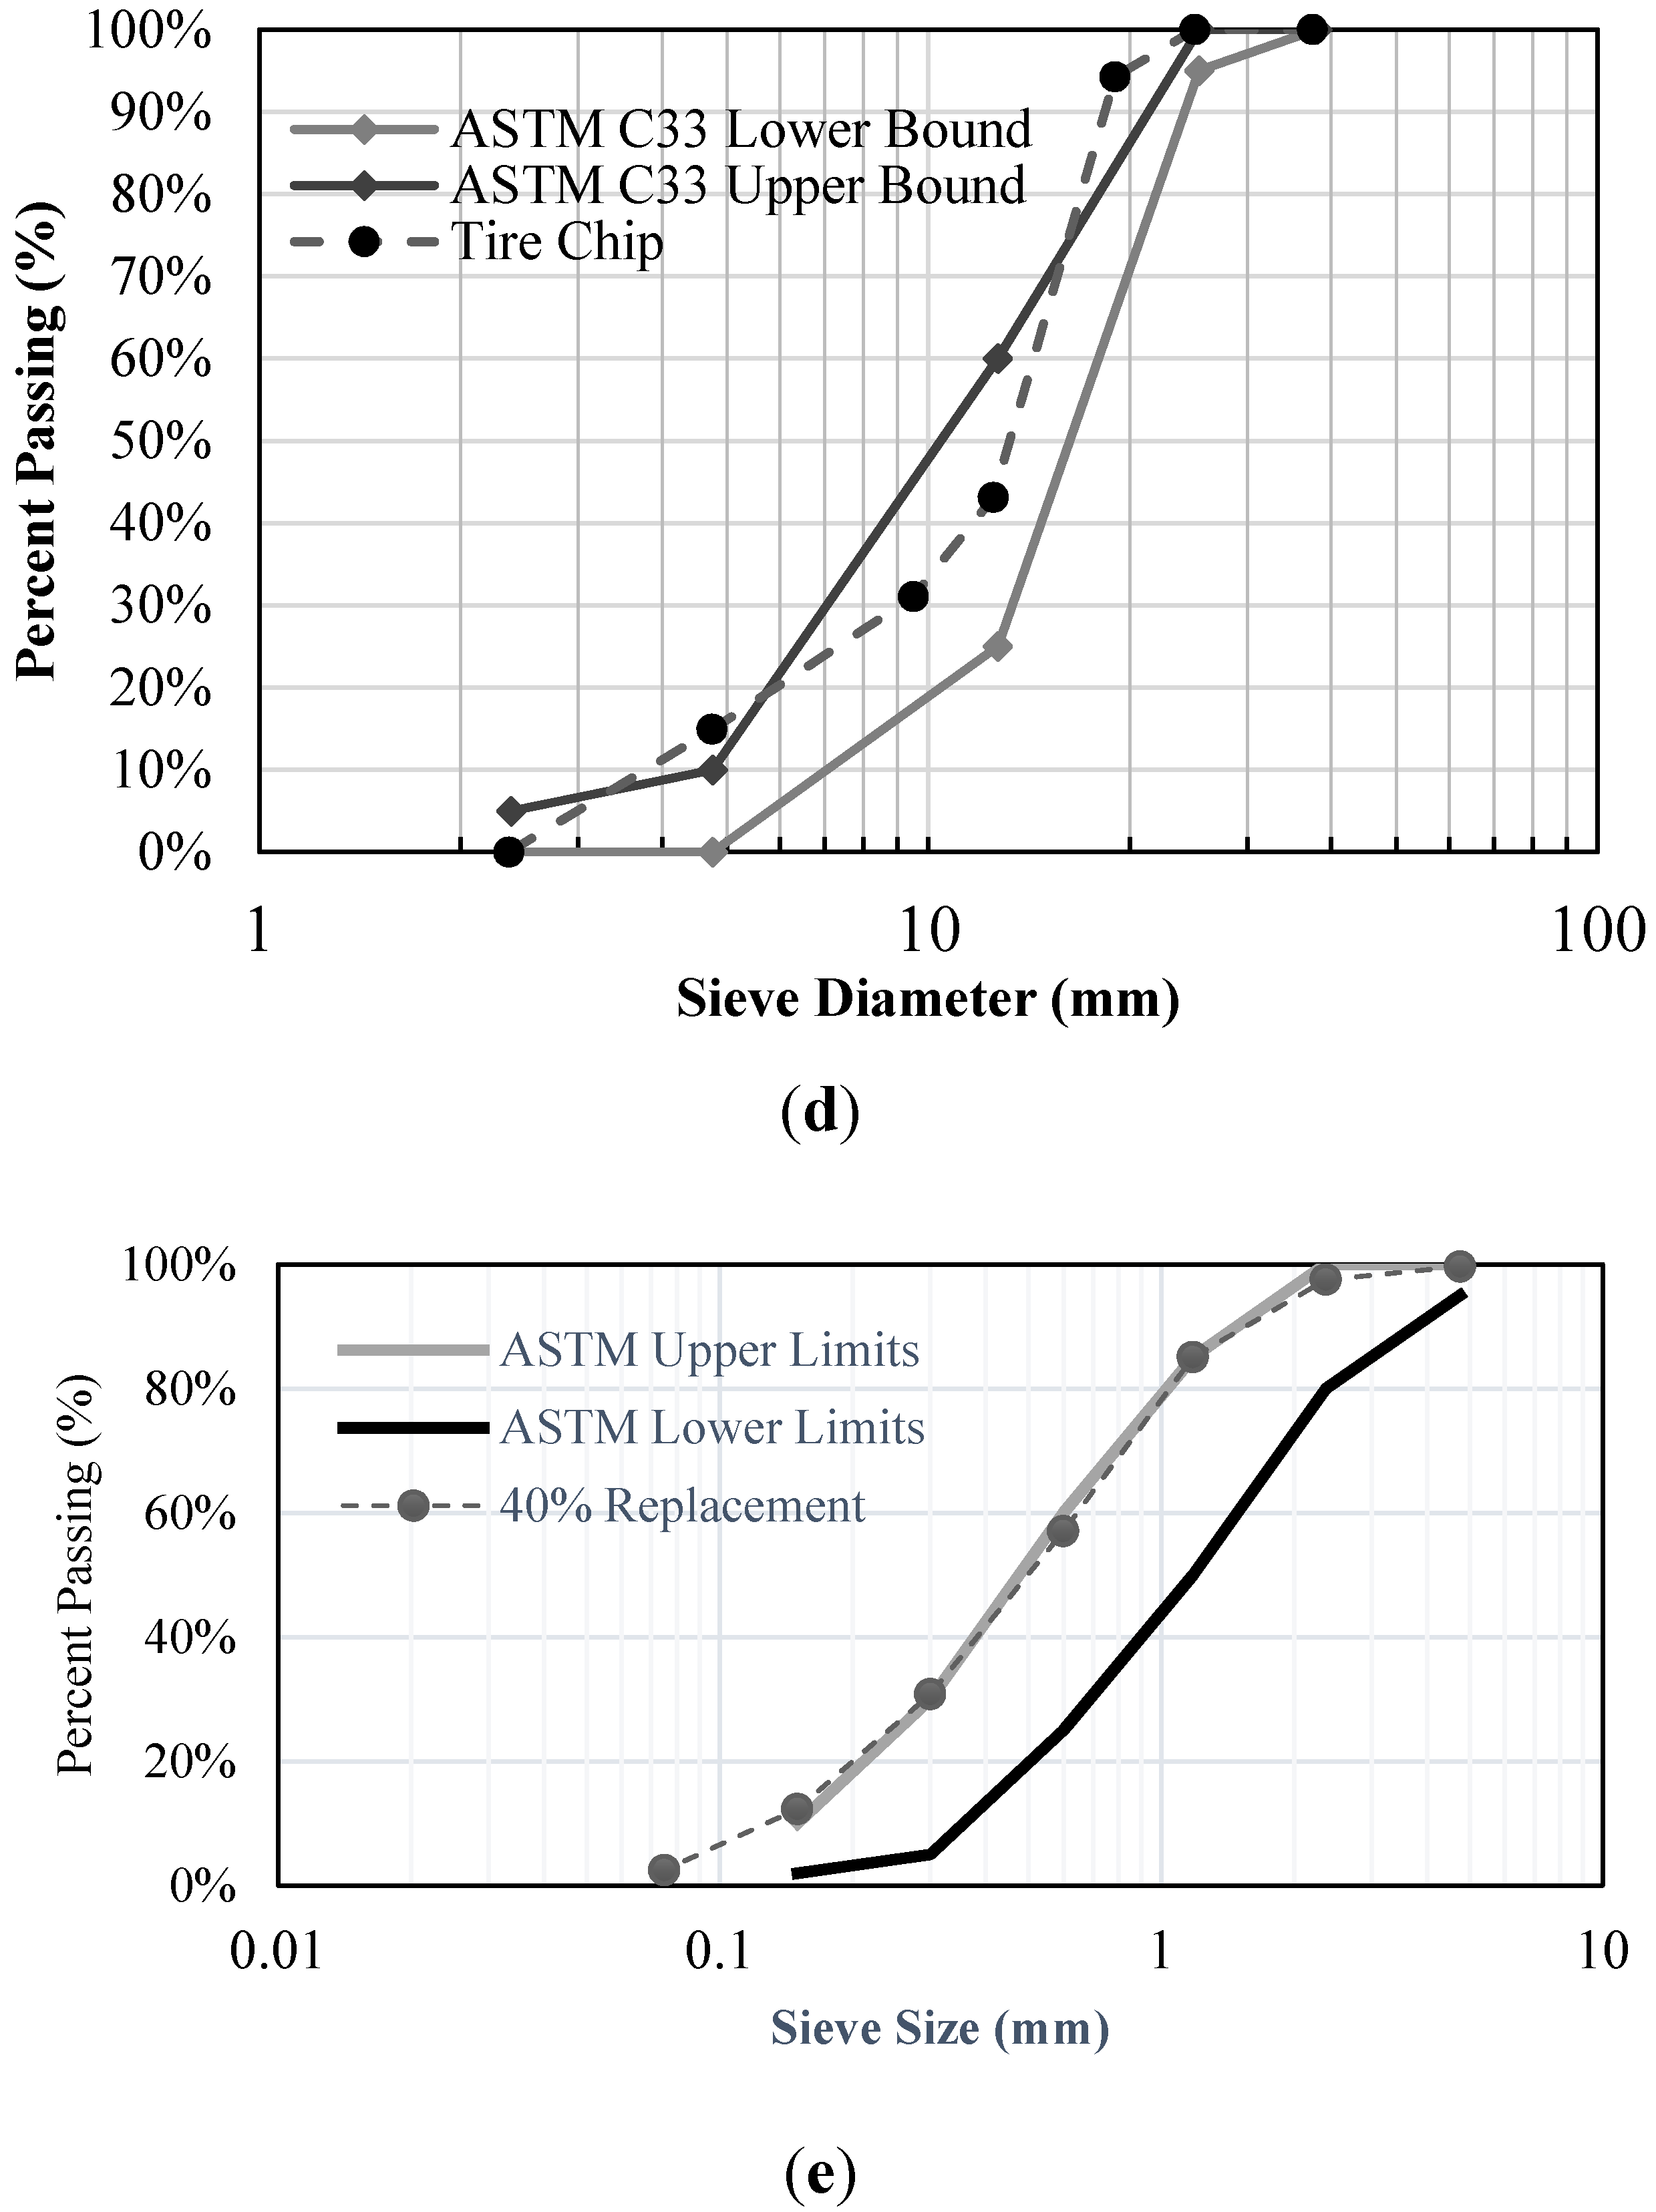
2.1. Concrete Materials

Mixtures for this research are made up of the primary constituents of Portland cement, natural coarse and fine aggregate, recycled tire chips, recycled powdered rubber, and recycled steel fiber (see Table 1). Type I/II Portland cement was exclusively used for this study, in compliance with ASTM C150/C150M-19 Standard Specification for Portland Cement. The physical and chemical properties of the Type I/II Portland cement used are not presented but are found in [5,6]. All natural aggregates used in this research meet ASTM C33/C33M-18 Standard Specification for Concrete Aggregate specifications [35]. A graded #57 stone granite gneiss/amphibolite coarse aggregate, provided by Hansen Aggregates East and sourced locally from Athens, Georgia, was used as coarse aggregate for this study. Alluvial sand sourced from Redland Sand, Inc. in Watkinsville, Georgia was used as fine aggregate for this study. Table 2 and Table 3 show mixtures with recycled steel fiber (RSF) and industrial steel fiber (ISF) additions as well as tire chip (TC), crumb rubber (CR), and powered rubber (PR) additions.
Tire chips, crumb rubber, and powdered rubber used in this study were obtained from Liberty Tire Recycling, LLC, in Calhoun, Georgia, and are in compliance with ASTM D6270 Standard Practice for Use of Scrap Tires in Civil Engineering Applications [36]. Tire chips (12 mm to 50 mm (0.47 in. to 1.96 in.)) were used as a partial coarse aggregate replacement. Crumb rubber was used as a partial fine aggregate replacement up to 10%, in combination with tire chip and powdered rubber as additional natural aggregate replacement. Powdered rubber was also used as a partial fine aggregate replacement (up to 50%). Figure 1 shows the tire chip next to the natural coarse aggregate, and crumb rubber and powdered rubber next to virgin fine aggregate. The majority of the tire-chip aggregate particle sizes remain within the upper and lower bounds for coarse aggregates per ASTM C33 (see Figure 1d) whereas the gradation curve for a partial replacement with 40% powdered rubber closely following the upper bound of the ASTM limits, as shown in Figure 1e.
Steel fiber recovered from scrap tires and provided from Liberty Tire Recycling, LLC in Calhoun, Georgia was used as fiber reinforcement. The recycled steel fibers are approximately 0.4 mm (0.016 in.) in average diameter and 25 mm (0.98 in.) in length on average. Aiello et al. [29] suggests that concentrations above 0.26% pose workability issues when used with traditional concrete mixers, so the maximum fiber concentration of 0.25% was used for this study. Dramix® 3D 45/35BL industrial steel fibers were used for comparison in this study. Additionally, these fibers are 0.75 mm (0.0295 in.) in diameter, 35 mm (1.378 in.) in length, and have a nominal tensile strength of 1230 MPa (177.67 ksi). Furthermore, they have a Young’s modulus of 200.0 MPa (29 ksi) and a 0.8% strain at ultimate strength. According to the manufacturer, suggested minimum dosages for these fibers are 30 kg/m3 (1.87 lb/ft3), which translates to about 1.3% of a standard weight mixture with a unit weight of 2400 kg/m3 (145 lb/ft3). Figure 2 shows the recycled steel fiber and the industrial steel fiber used in this study.

2.2. Batching of Concrete Mixtures and Curing of Concrete Specimens

Concrete mixtures utilizing rubber products and steel fibers at varying concentrations were batched and tested for fresh and hardened concrete properties. For consistency, all mixtures were developed with the same mixture design process following the specified procedures in ASTM C31/C31M-18 [37]. After sufficient mixing time, fresh concrete tests were performed immediately, while concrete was cast into cylinders and other mold for hardened properties tests. For batches with reduced workability, a vibrating plate was used to ensure sufficient compaction was attained.
After specimens were removed from the molds, approximately 24 h after mixing, specimens were placed in water storage tanks to cure. Specimens remained in the curing tanks until their testing day, at which point they were removed and allowed to dry prior to testing. For Phase II, scaled beam specimens were cured in burlap that was constantly wetted in a temperature-regulated environment, due to the size of the scaled beams exceeding the dimensional capacity of the curing tanks.

2.3. Mixture Design Proportioning

Concrete mixtures were designed with the goal of maintaining GDOT Class AA concrete standards. The minimum cement content for Class AA concrete is 375 kg/m3 (635 lbs/yd3), and the maximum water/cement ratio is 0.445. In addition, GDOT requirements specify the use of either Size No. 56, 57, or 67 coarse aggregates for Class AA concrete. Furthermore, GDOT specifies Class AA minimum compressive strengths of 25 MPa (3500 psi). For fresh properties, GDOT specifies a slump ranging from 50 mm to 100 mm (2 in. to 4 in.) and an entrained air content between 3.5 and 7.0% for Class AA concrete. The absolute volume method was used when replacing aggregate with recycled rubber aggregates to maintain consistent batch sizes. For mixtures containing steel fiber, the absolute volume method was also used in order to determine the amount of steel fiber required to obtain the desired fraction of the entire mixture.

2.3.1. Phase I—Investigative Mixtures

The first phase of the study aimed to assess the viability using of powdered rubber and recycled steel fiber in GDOT Class AA concrete. In addition, this phase investigated the potential of combination mixtures, incorporating powdered rubber, crumb rubber, and tire chips at 10% aggregate replacement levels. One of the two combination mixtures incorporated recycled steel fibers at 0.25% of the batch volume. Additionally, two mixtures incorporating industrial steel fiber were batched for comparison purposes. In total, twelve investigative mixtures were batched for Phase I, including a control mixture. Five mixtures were batched with powdered rubber as fine aggregate replacement by volume, at 10% increments up to 50%. Table 1 outlines the general mixture design matrix of these powdered rubber mixtures, as well as the control mixture. Two mixtures were batched with recycled steel fiber at 0.1% and 0.25% of the total volume of the mixture. Two mixtures were batched with industrial steel fiber, at 0.1% and 0.25% of the total volume of the mixture, for comparison. Table 2 outlines the general mixture design matrix for these steel fiber mixtures. Two combination mixtures were batched with 10% replacement of coarse aggregate with tire chips, 10% replacement of fine aggregate with crumb rubber, and 10% of fine aggregate with powdered rubber, as well 0.25% recycled steel fiber by total volume for one of the mixtures. Table 3 outlines the mixture design matrix for these combination mixtures. Aside from the varying replacement levels of aggregate by rubber or steel fiber concentrations, mixture design characteristics were held generally constant across mixtures. The exception of note is the admixture dosages, which were slightly modified from mixture to mixture to benefit fresh concrete properties such as workability and air content. Cement content was maintained at 375 kg/m3 (635 lb/yd3) and w/c was maintained at 0.42. Mixtures were designed with a target slump of 76 mm (3 in.) and target air content of 5%.
The maximum powdered rubber content was capped at 50%, as the literature [20] suggested that increased rubber content could lead to more significant decrease in compressive strength. Furthermore, this range of mixtures was selected in order to provide a more complete representation of the effects that increased powdered rubber contents have on the properties of concrete. Recycled steel fiber contents of 0%, 0.10%, and 0.25% of the total volume were selected. While 1% concentration of industrial steel fibers was most common, the literature suggested [20] that 0.25% was the maximum concentration of RSF when using a traditional mixer, due to workability constraints.

2.3.2. Phase II—Beam Mixtures

Based on their performance in Phase I testing, the 40% powdered rubber mixture and the second combination mixture were selected for Phase II beam testing. Table 4 outlines the general mixture design matrix for Phase II beam mixtures. As was the case in Phase I, powdered rubber was used as a fine aggregate replacement, by volume. For combination mixtures, crumb rubber and tire chip were used as fine and coarse aggregate replacement by volume, respectively. Recycled steel fiber was included as a percentage of the total volume of the mixture. Two beams were batched for each mixture, one static and one impact. In addition to the scaled beams, for each batch, fresh properties were measured and recorded, and 6 compressive cylinders were batched.

2.3.3. Mixture Design Identification

A mixture identification system was used in this study. For example, the first mixture’s identification is 0.42/635/100FA/0PR/0RSF. The first number represents the w/c of the mixture, 0.42 in this case. The second number represents the cement content, 375 kg/m3 (635 lb/yd3). The third number indicates the percentage of natural “FA” or fine aggregate in the mixture, 100% in this case. For the combination mixtures, “CA” is used to indicate the percentage of natural coarse aggregate in the mixture. The fourth number represents the percentage “PR”, or powdered rubber, used to replace fine aggregate in the mixture, 0% in this case. For the combination mixtures, “CR” is used to refer to crumb rubber, and “TC” is used to refer to tire chips. The final number in the mixture identification refers to the amount of “RSF” or recycled steel fiber in the mixture, calculated as a percentage of the total mixture volume, again 0% in this case. For mixtures incorporating industrial steel fiber, “ISF” is used to indicate industrial steel fiber in the mixture identification. Specimens were marked with only their distinguishing characteristics, such as “PR10”, “RSF.1”, or “C1” in order to refer to the 10% powdered rubber mixture, the 0.1% recycled steel fiber mixture, and the Combination 1 mixture, respectively.

2.4. Phase I and II Test Procedures for Determining Concrete Properties

The fresh concrete properties of slump, air content, unit weight, and temperature were tested and recorded for each mixture to check for compliance with GDOT Concrete Standards. For the first phase of this study, various hardened concrete properties tests were conducted in order to determine the compressive strength, flexural strength, and impact resistance of trial batches. Compressive cylinders measured 100 mm × 200 mm (4 in. × 8 in.) and four cylinders were tested at 1, 7, and 28 days per ASTM C39/C39M-18, AASHTO T22 M/T22 specifications [38,39]. Three MOR beams with dimensions of 150 mm × 150 mm × 560 mm (6 in. × 6 in. × 22 in.) were batched for each mixture. They were tested at 28 days of age with a span length of 460 mm (18 in.) per ASTM C78 specifications [40].

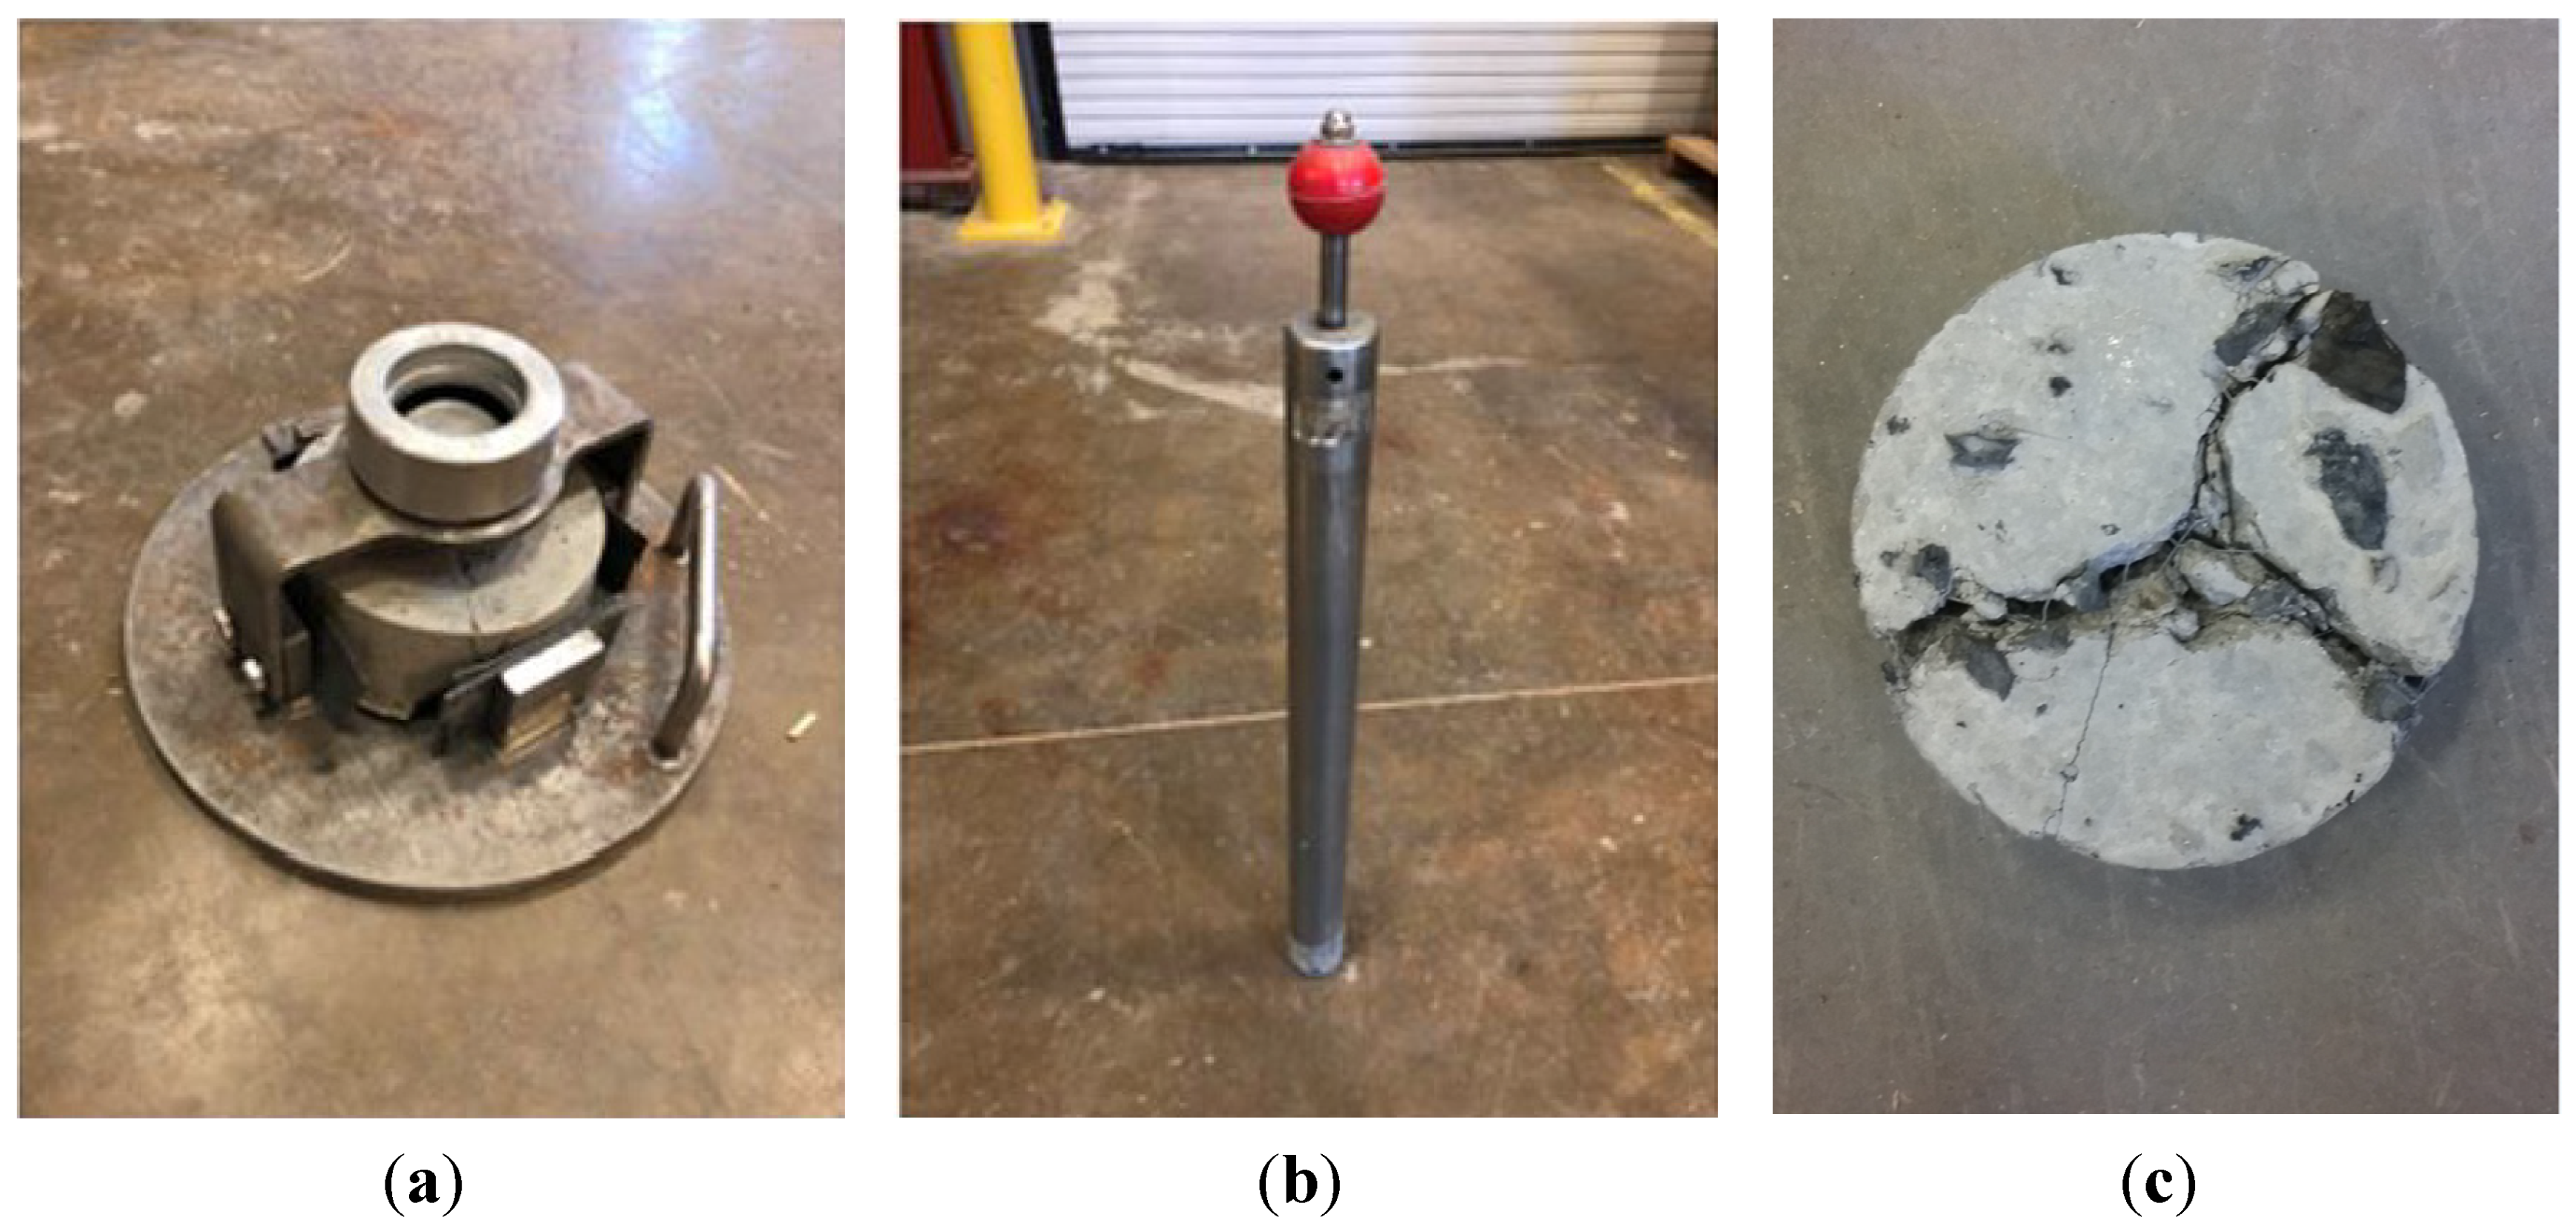
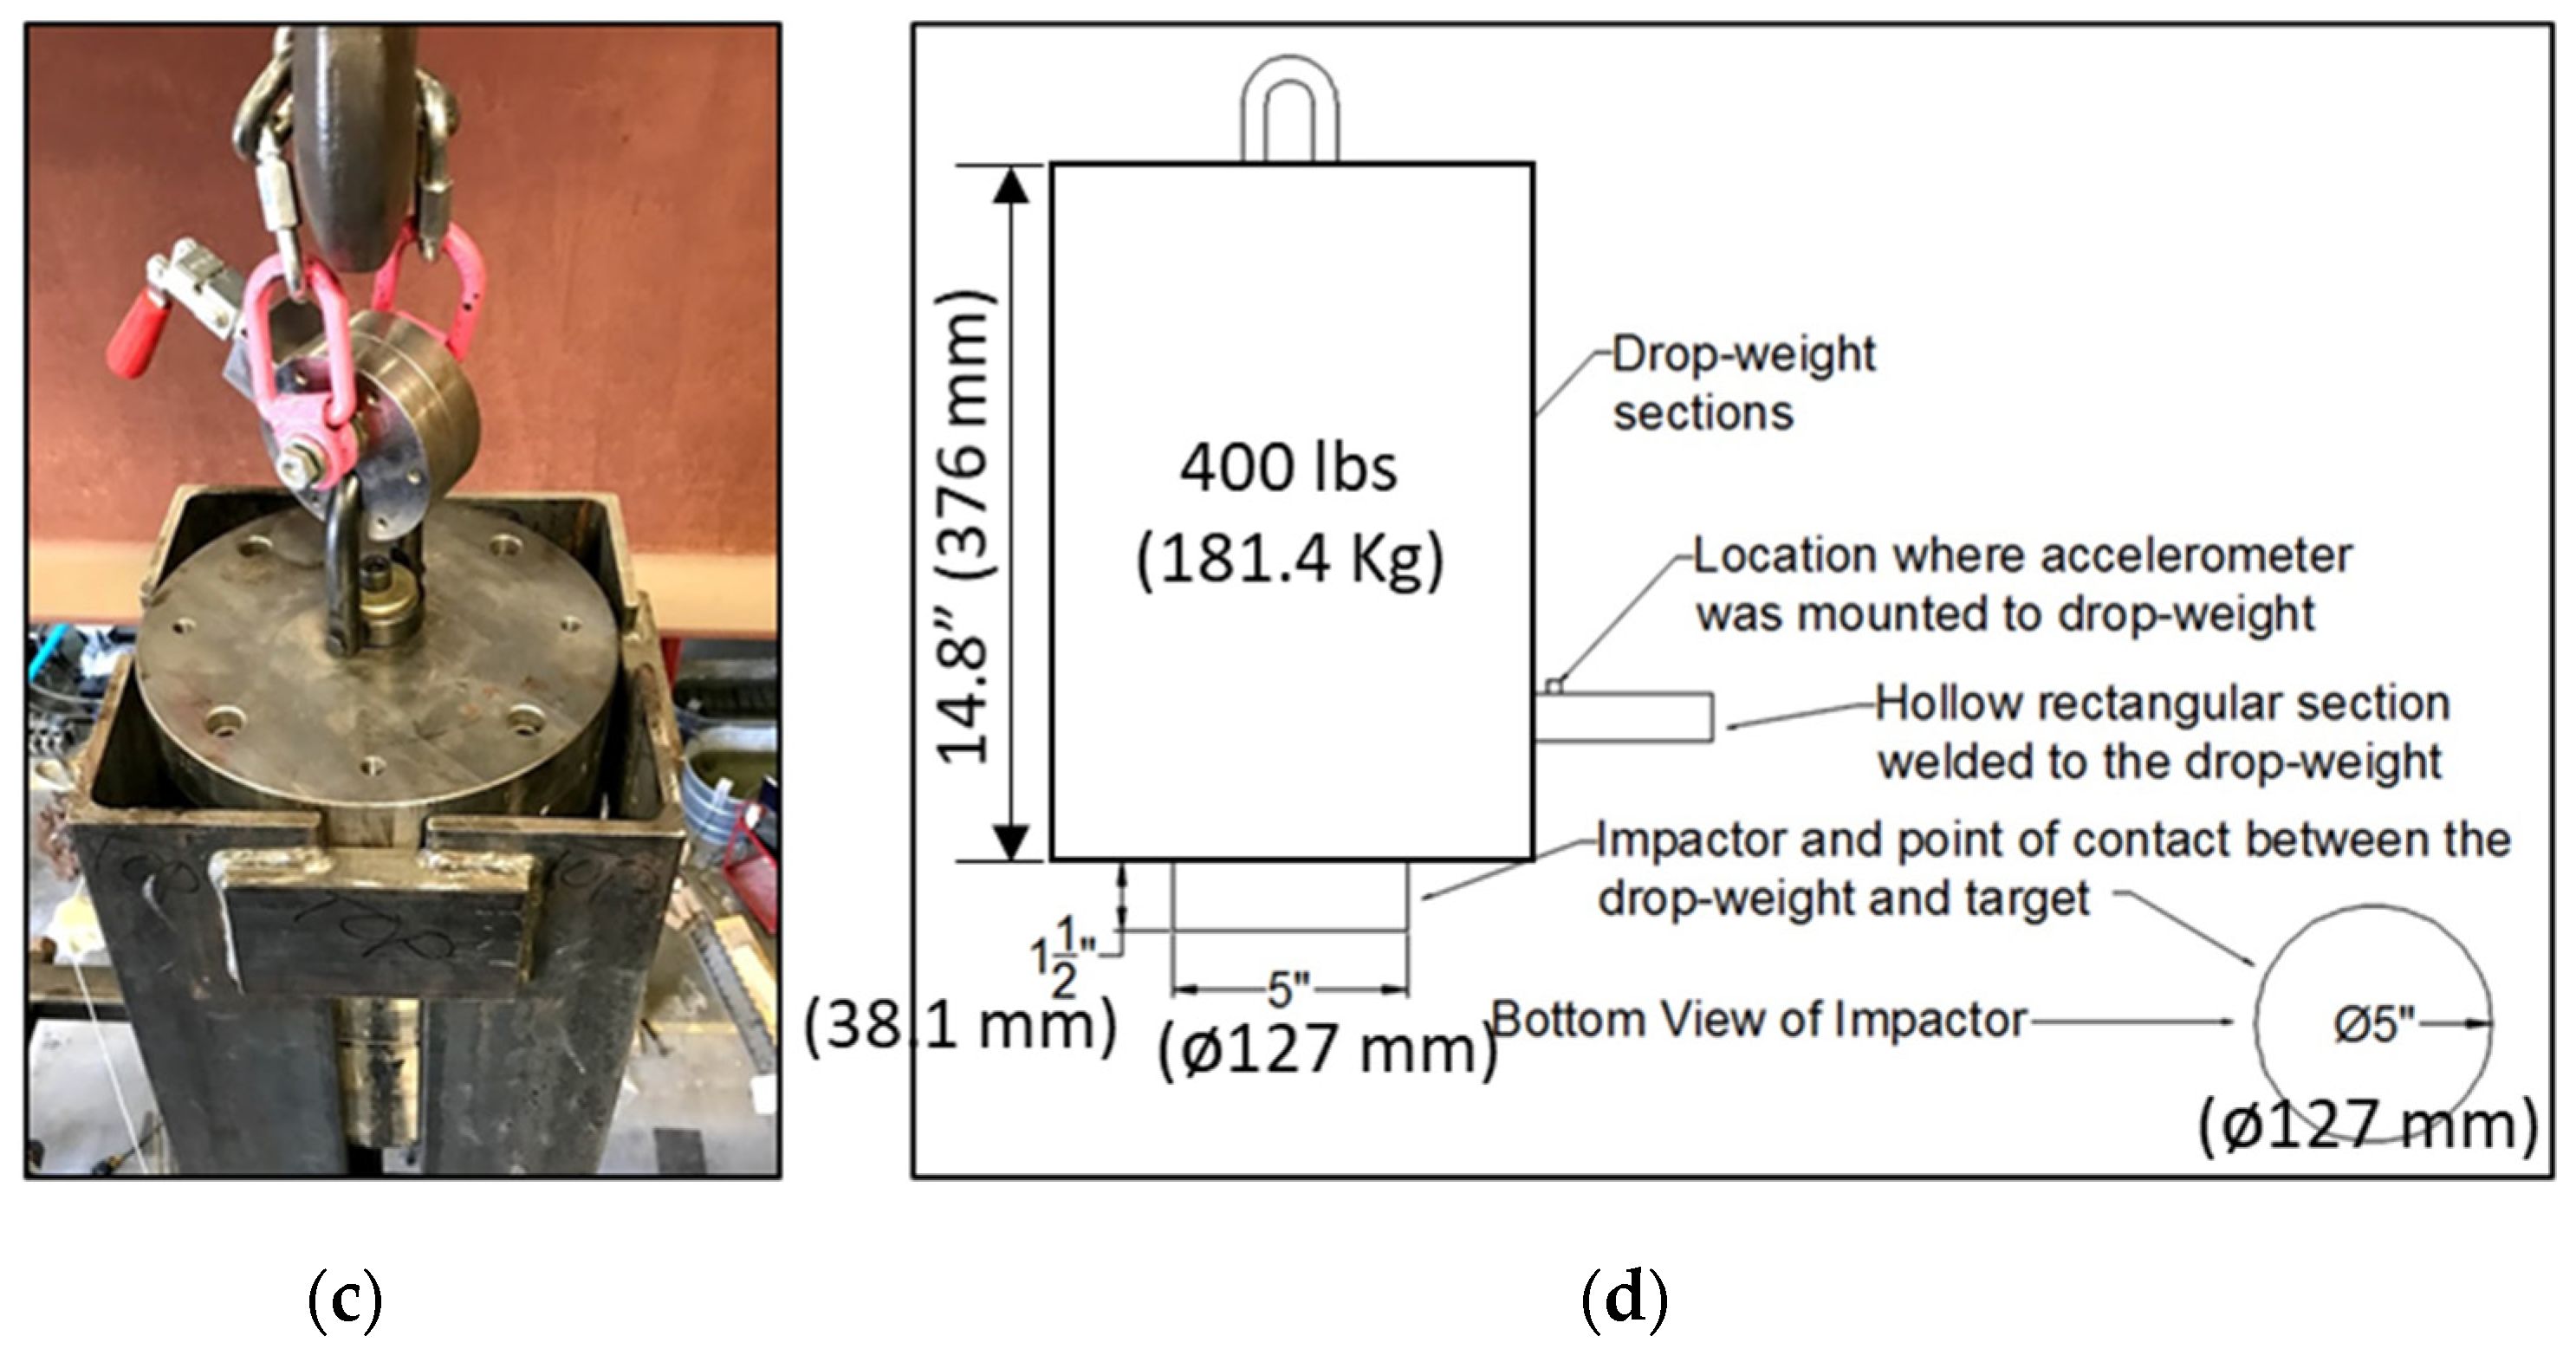
2.5. Phase I—Drop Weight Impact Disc Test Procedures

Five impact discs with 152 mm (6 in.) in diameter and 51 mm (2 in.) in height were batched for each mixture. They were tested, per ACI 544.2R specifications [41], using a steel testing apparatus to secure the specimen, along with a 4.5 kg (10 lb.) drop hammer with a 51 mm (2 in.) diameter face and a drop height of 457 mm (18 in.). Figure 3 shows the test apparatus and typical specimen.

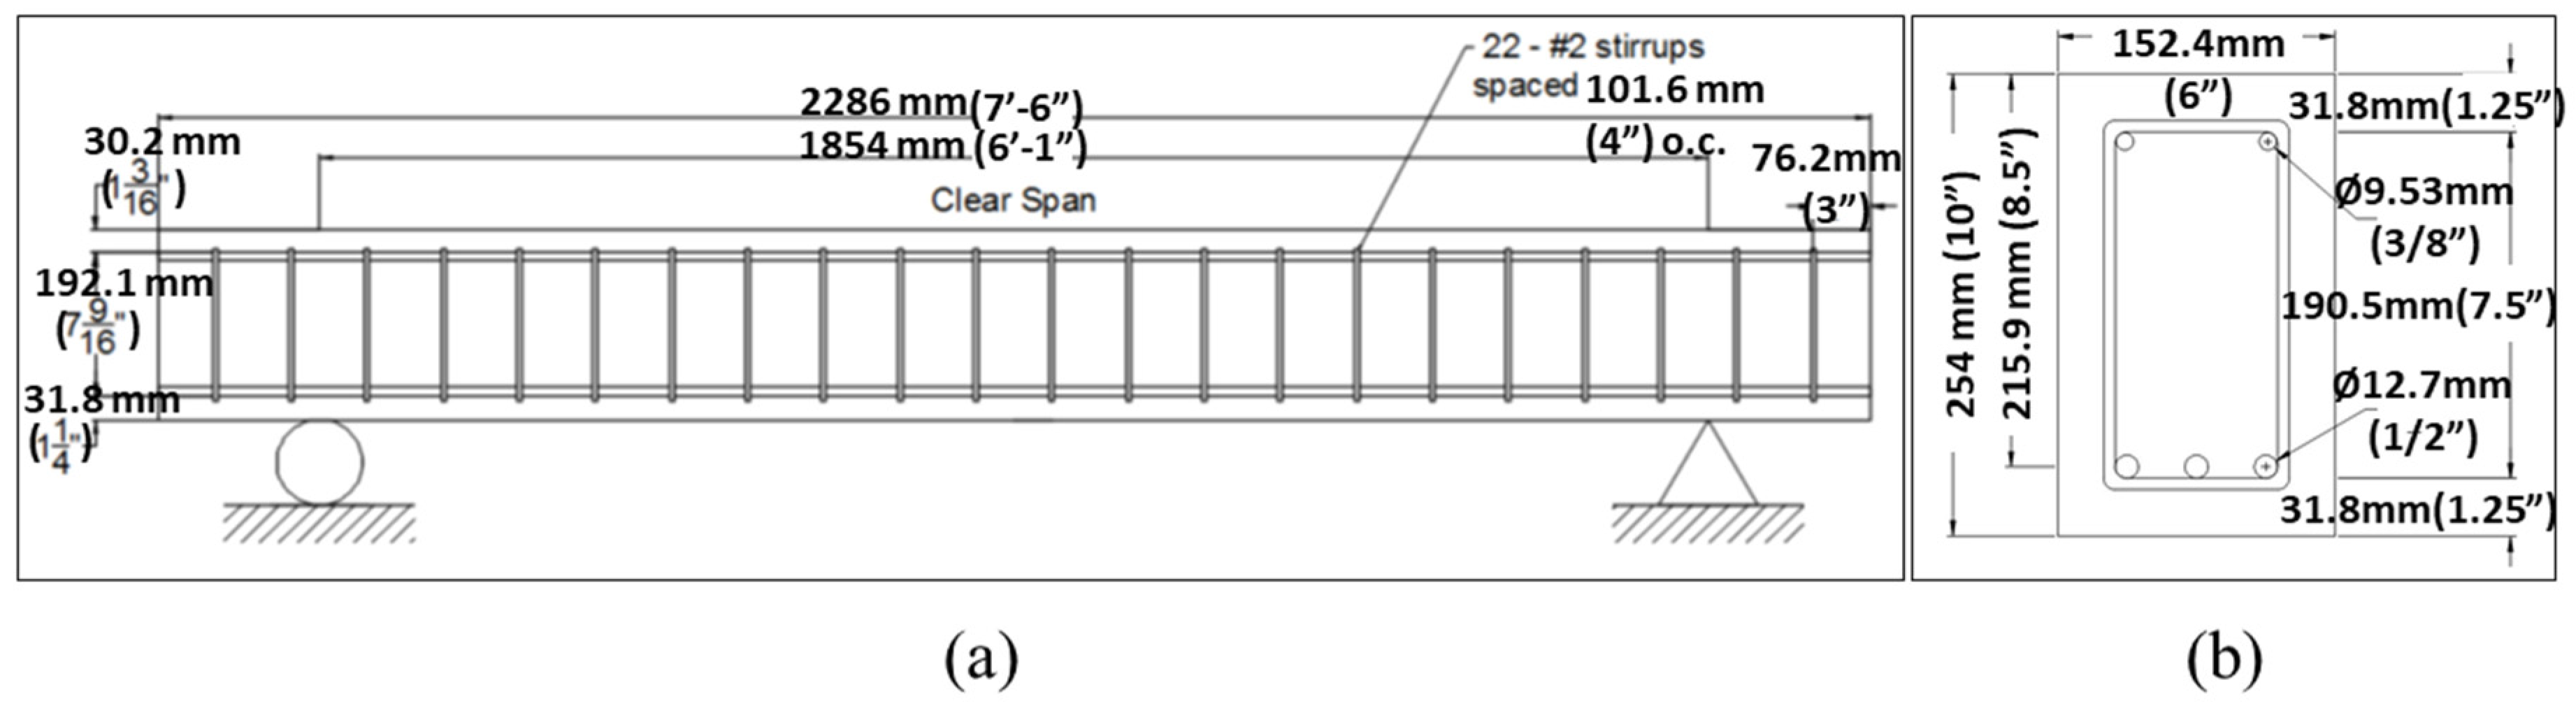
2.6. Phase II—Static and Imact Beam Test Procedures

Optimized mixtures were selected based on their results from Phase I for static and impact beam testing in Phase II. Similar to the work completed by Lopez [5], static beams were 2286 mm × 152.4 mm × 254 mm (90 in. × 6 in. × 10 in.), as shown in Figure 4. The previous study had much higher volume fractions of fibers, and thus it is not possible to compare the results with findings from this study. Impact beams were 2286 mm × 152 mm × 279 mm (90 in. × 6 in. × 11 in.). These beams incorporate reinforcing steel with a Young’s modulus of 200,000 MPa (29,000 ksi) and a minimum yield strength of 420 MPa (60 ksi). Beams included 2—U.S. No. 3 longitudinal bars and 3—U.S. No. 4 longitudinal bars for the compressive and tensile reinforcement, respectively, held together with U.S. No. 2 stirrups spaced 102 mm (4 in.) on center. Both static and impact beams were tested at a clear span of 1854 mm (73 in.). Impact beams were equipped with motion capture sensors, placed at mid-span, so that the displacement over time could be recorded with a motion capture camera. These sensors were located at mid-span on the side of the beam.

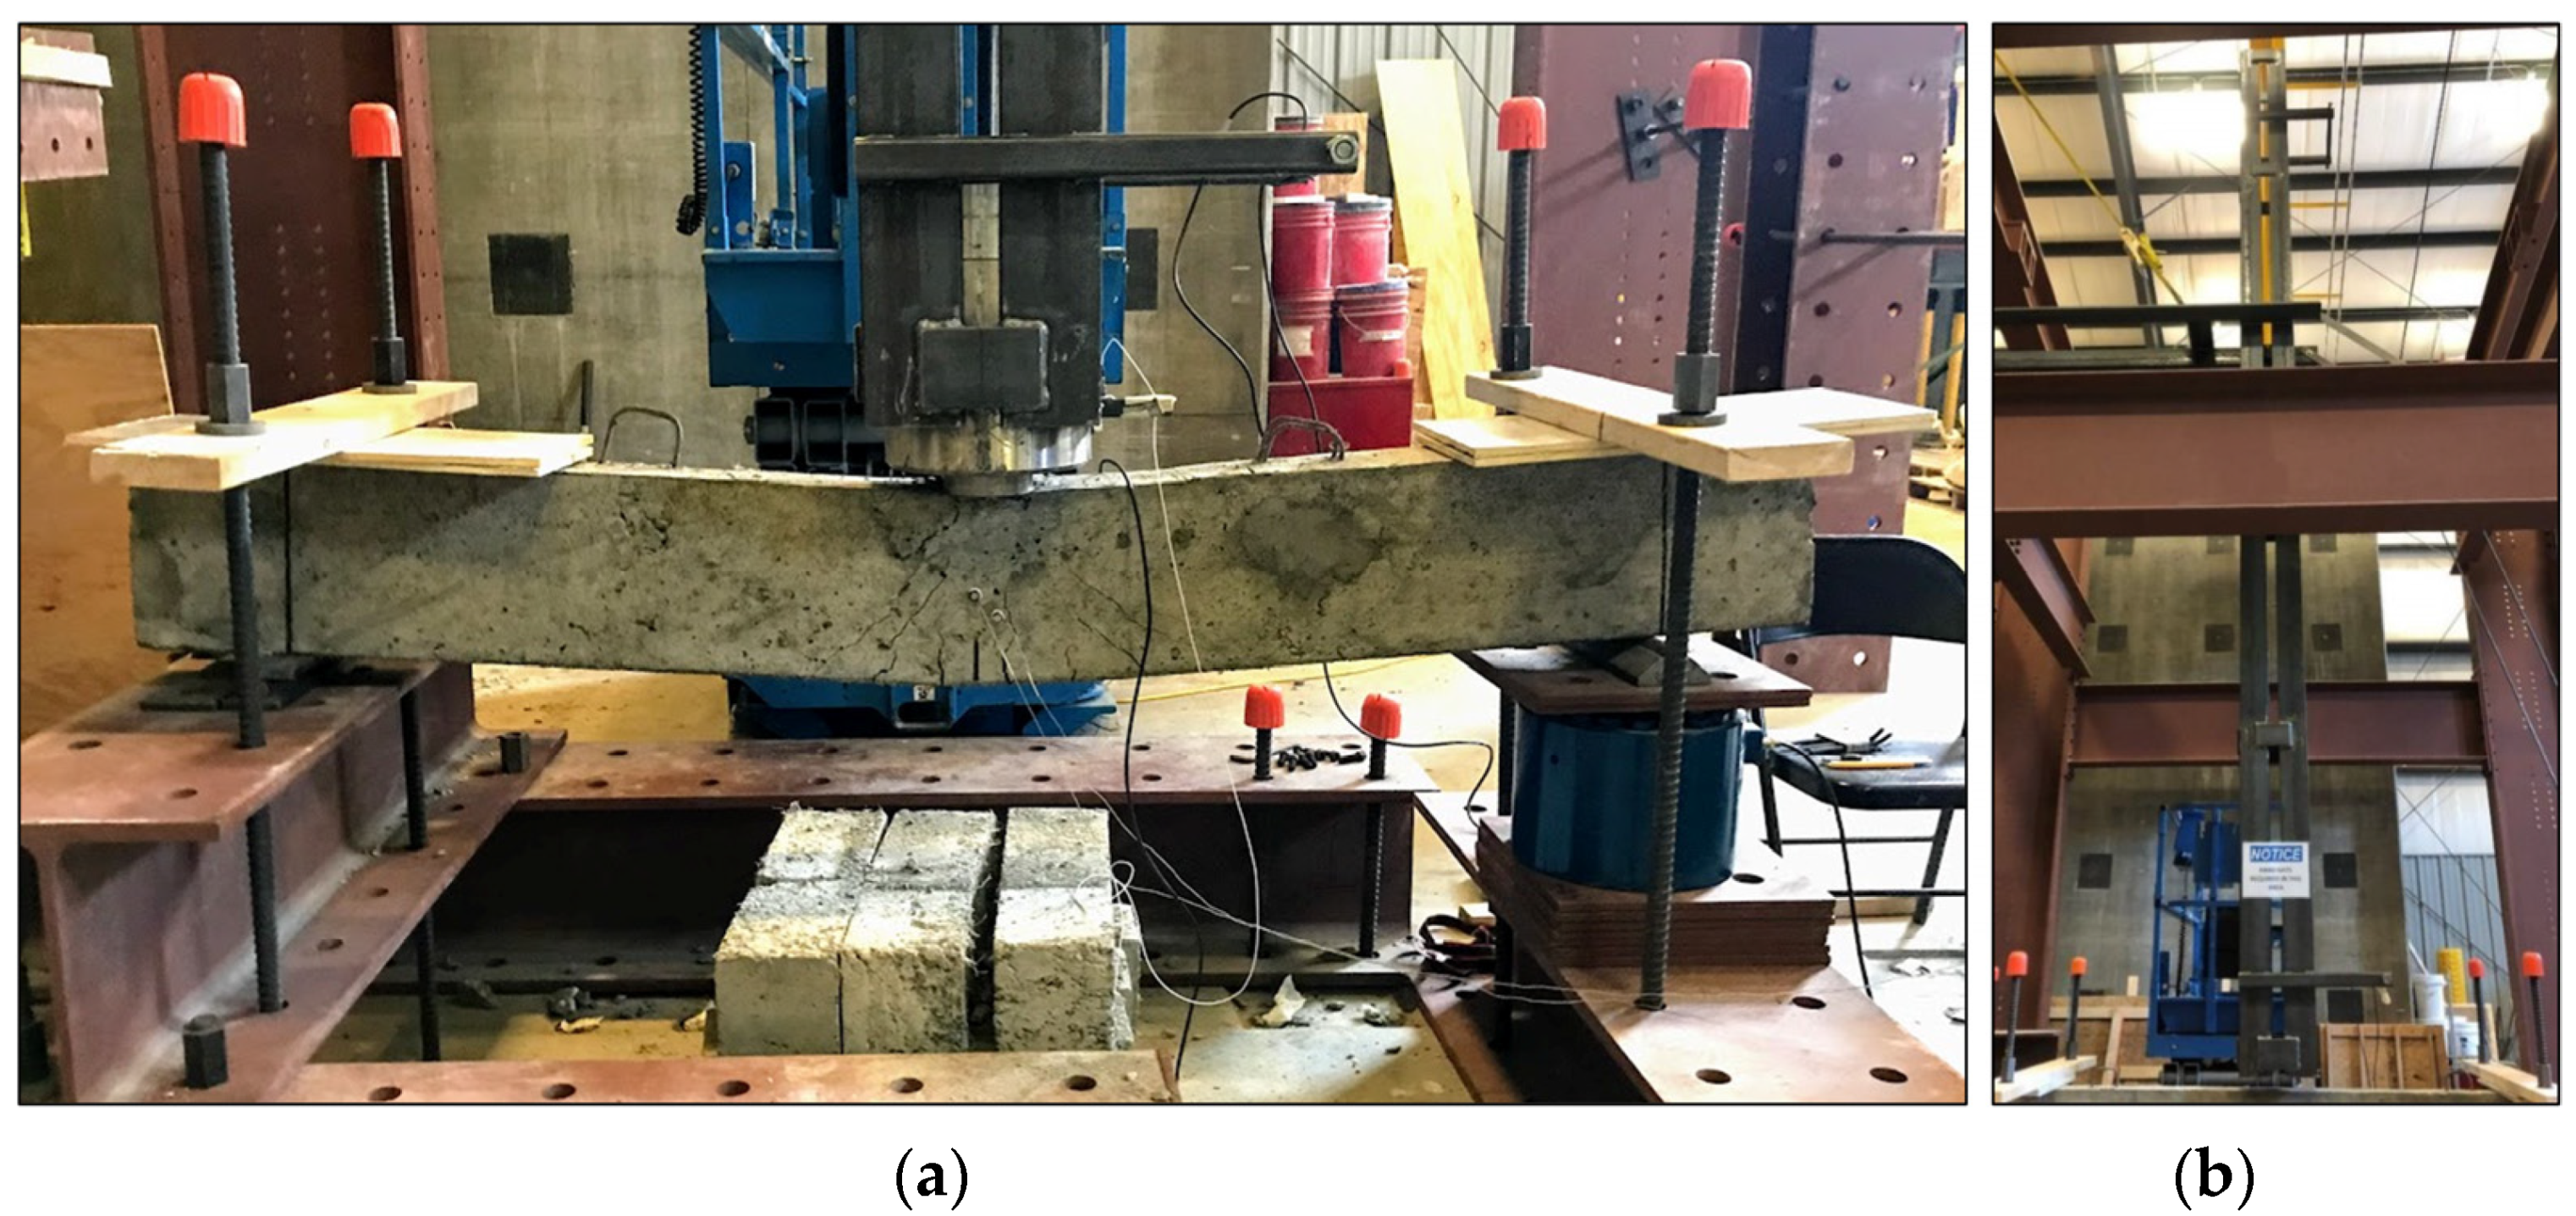
2.6.1. Static Beam Testing

Static testing of these beams included the use of a 978.6 kN (220-kip) hydraulic actuator, applying load at mid-span of the simply supported beam, with a 152 mm (6 in.) steel plate distributing the load, as shown in Figure 5. The hydraulic force transducer was displacement controlled, increasing at a rate of 0.127 mm (0.005 in.) per second, while the development of cracks was observed over time. Axial load and displacement were recorded by the actuator during the test. This data was exported and used to plot a load-displacement curve. The static test was conducted to quantify energy dissipation capacity of beams and compare the results with impact forces from a drop weight impact test (see Section 2.6.2).

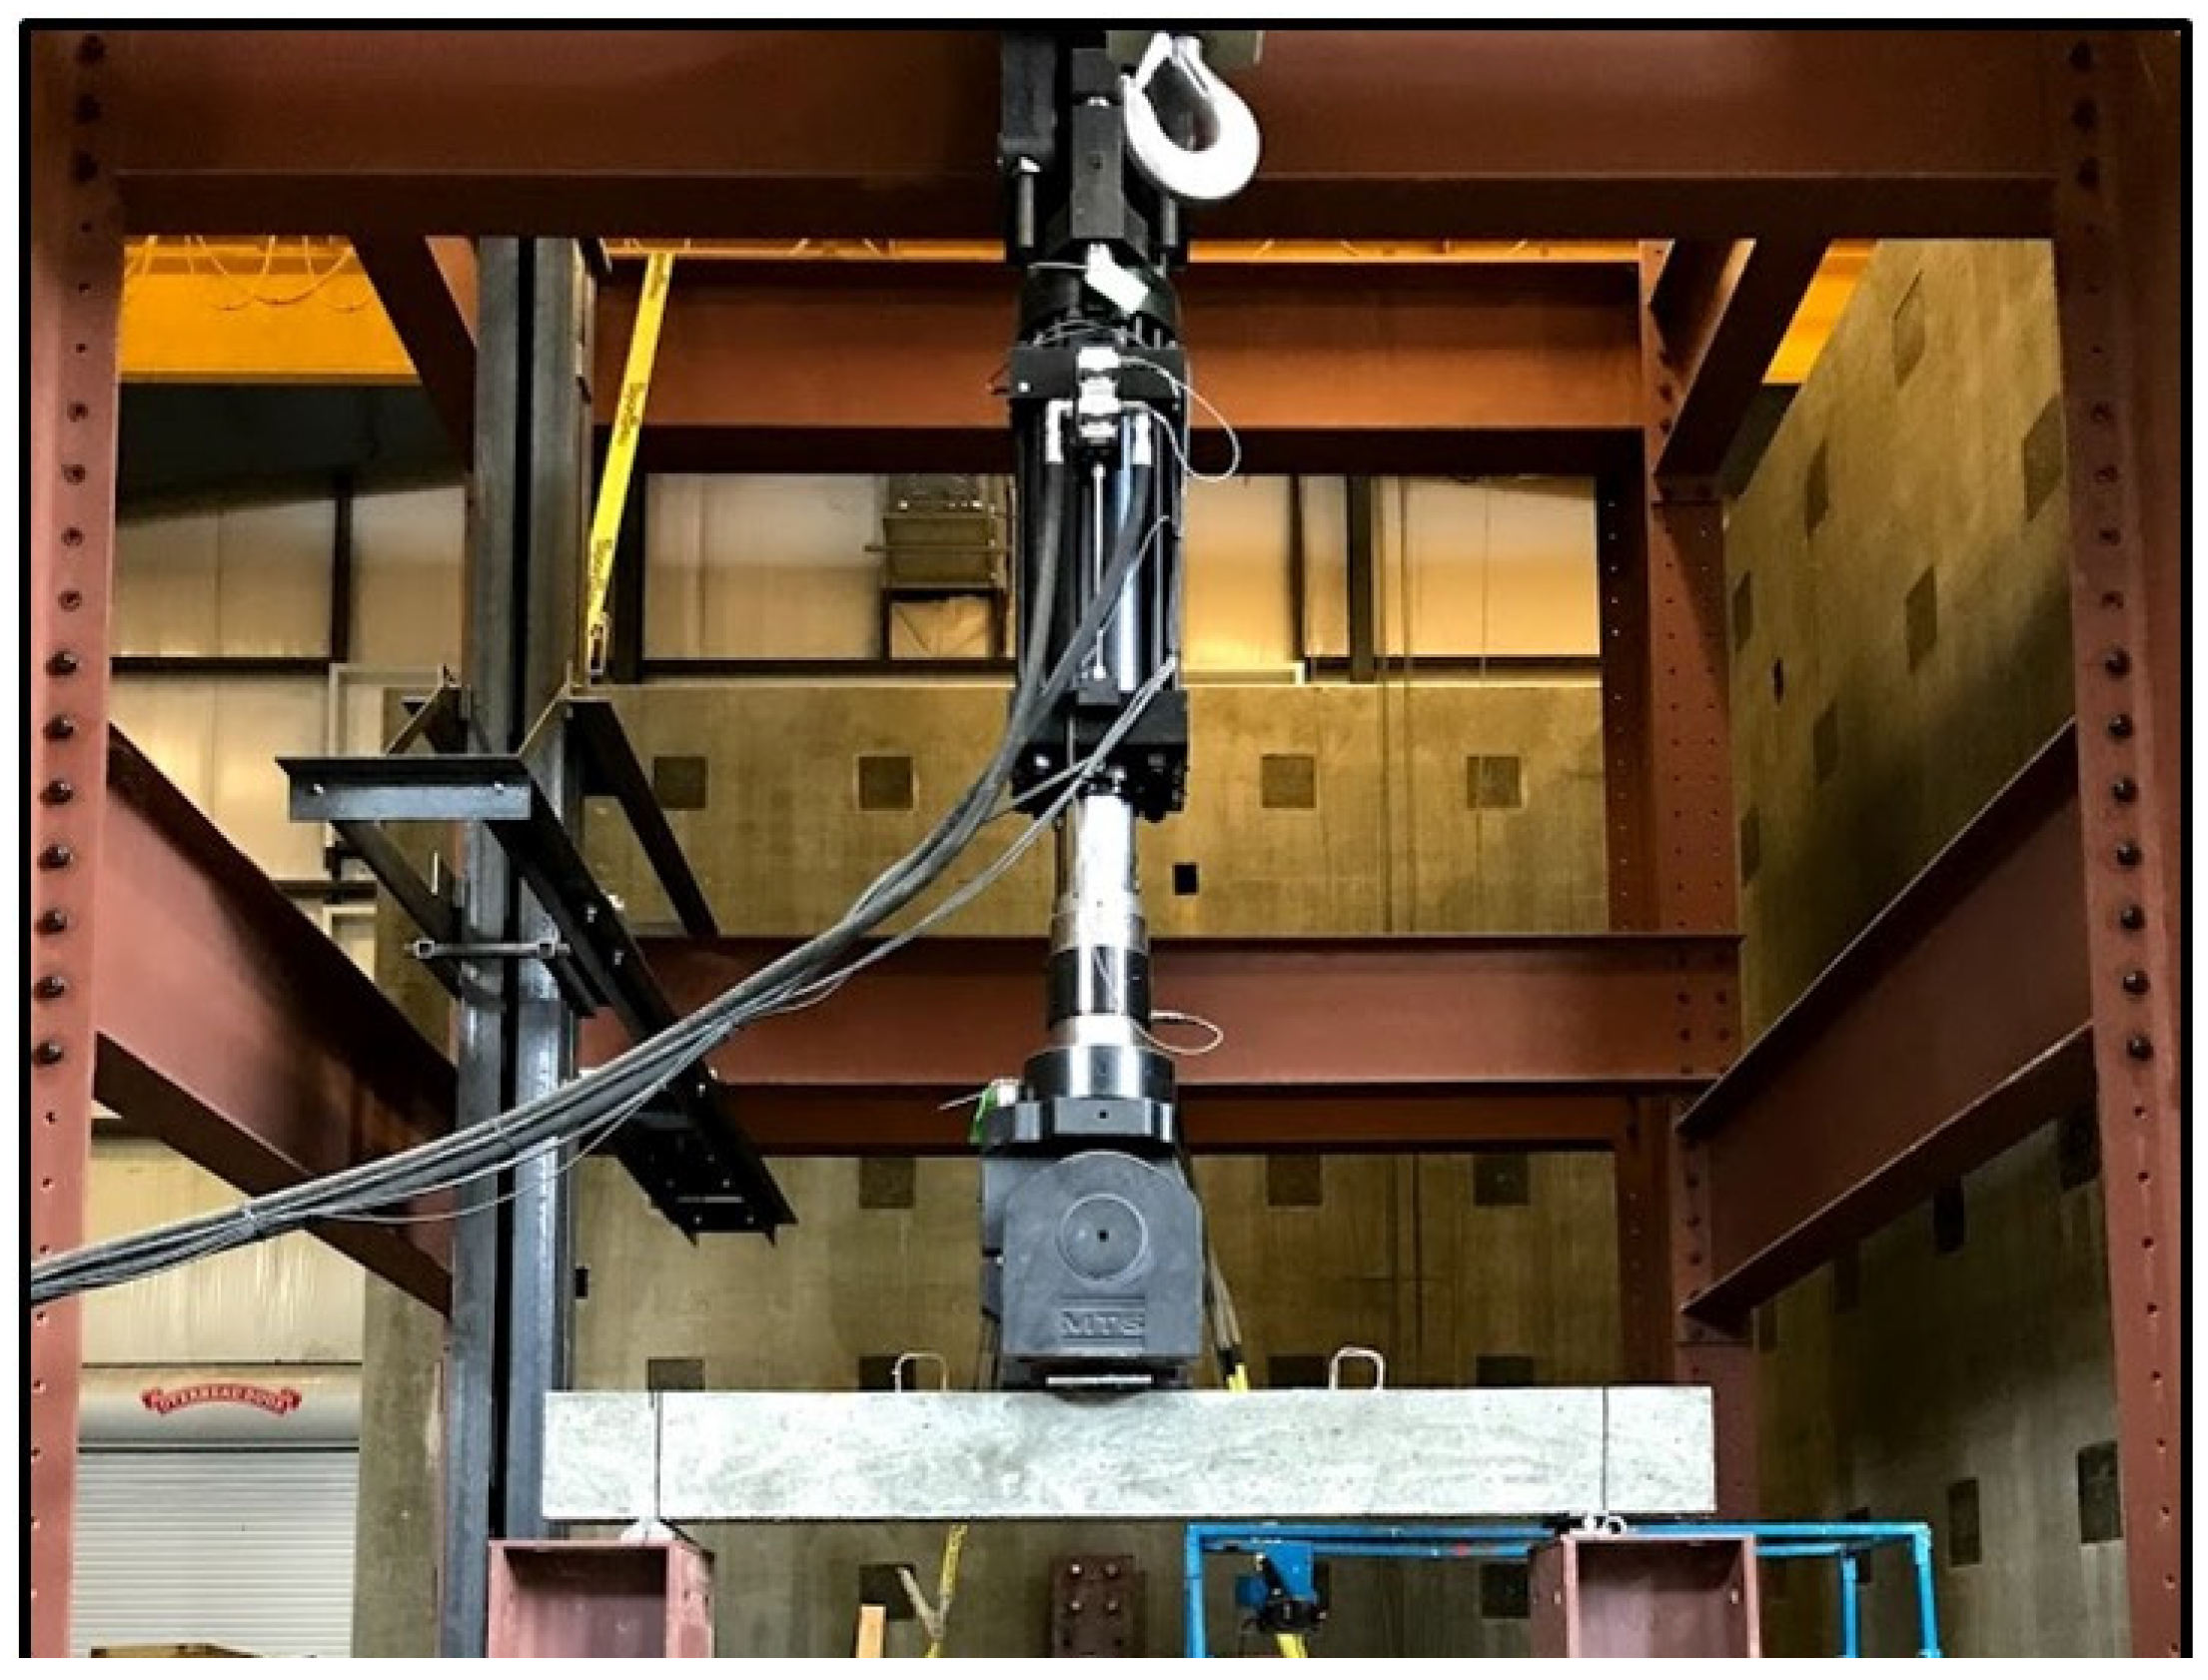
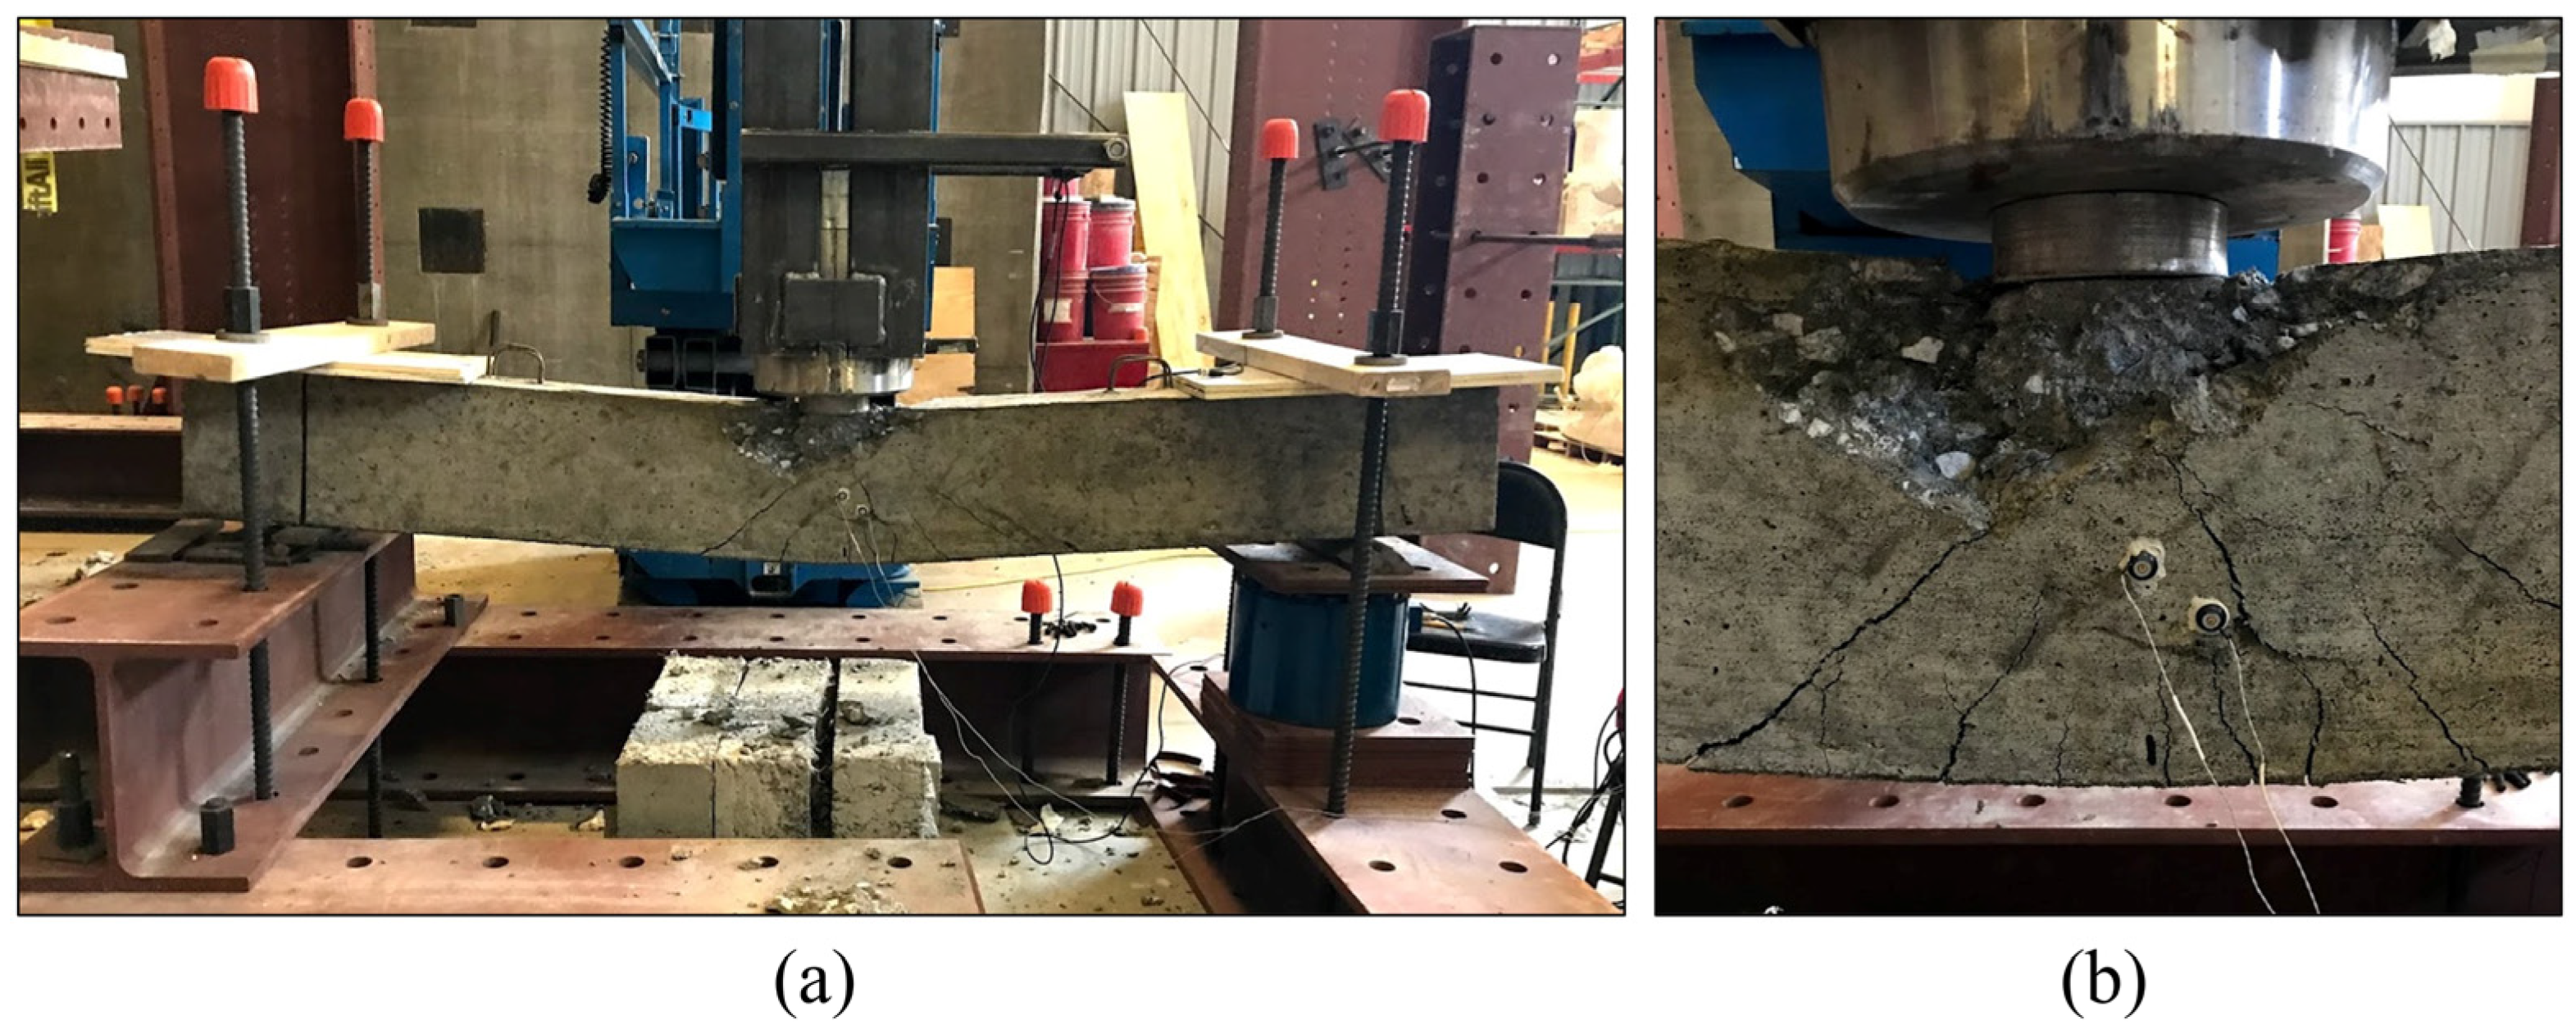
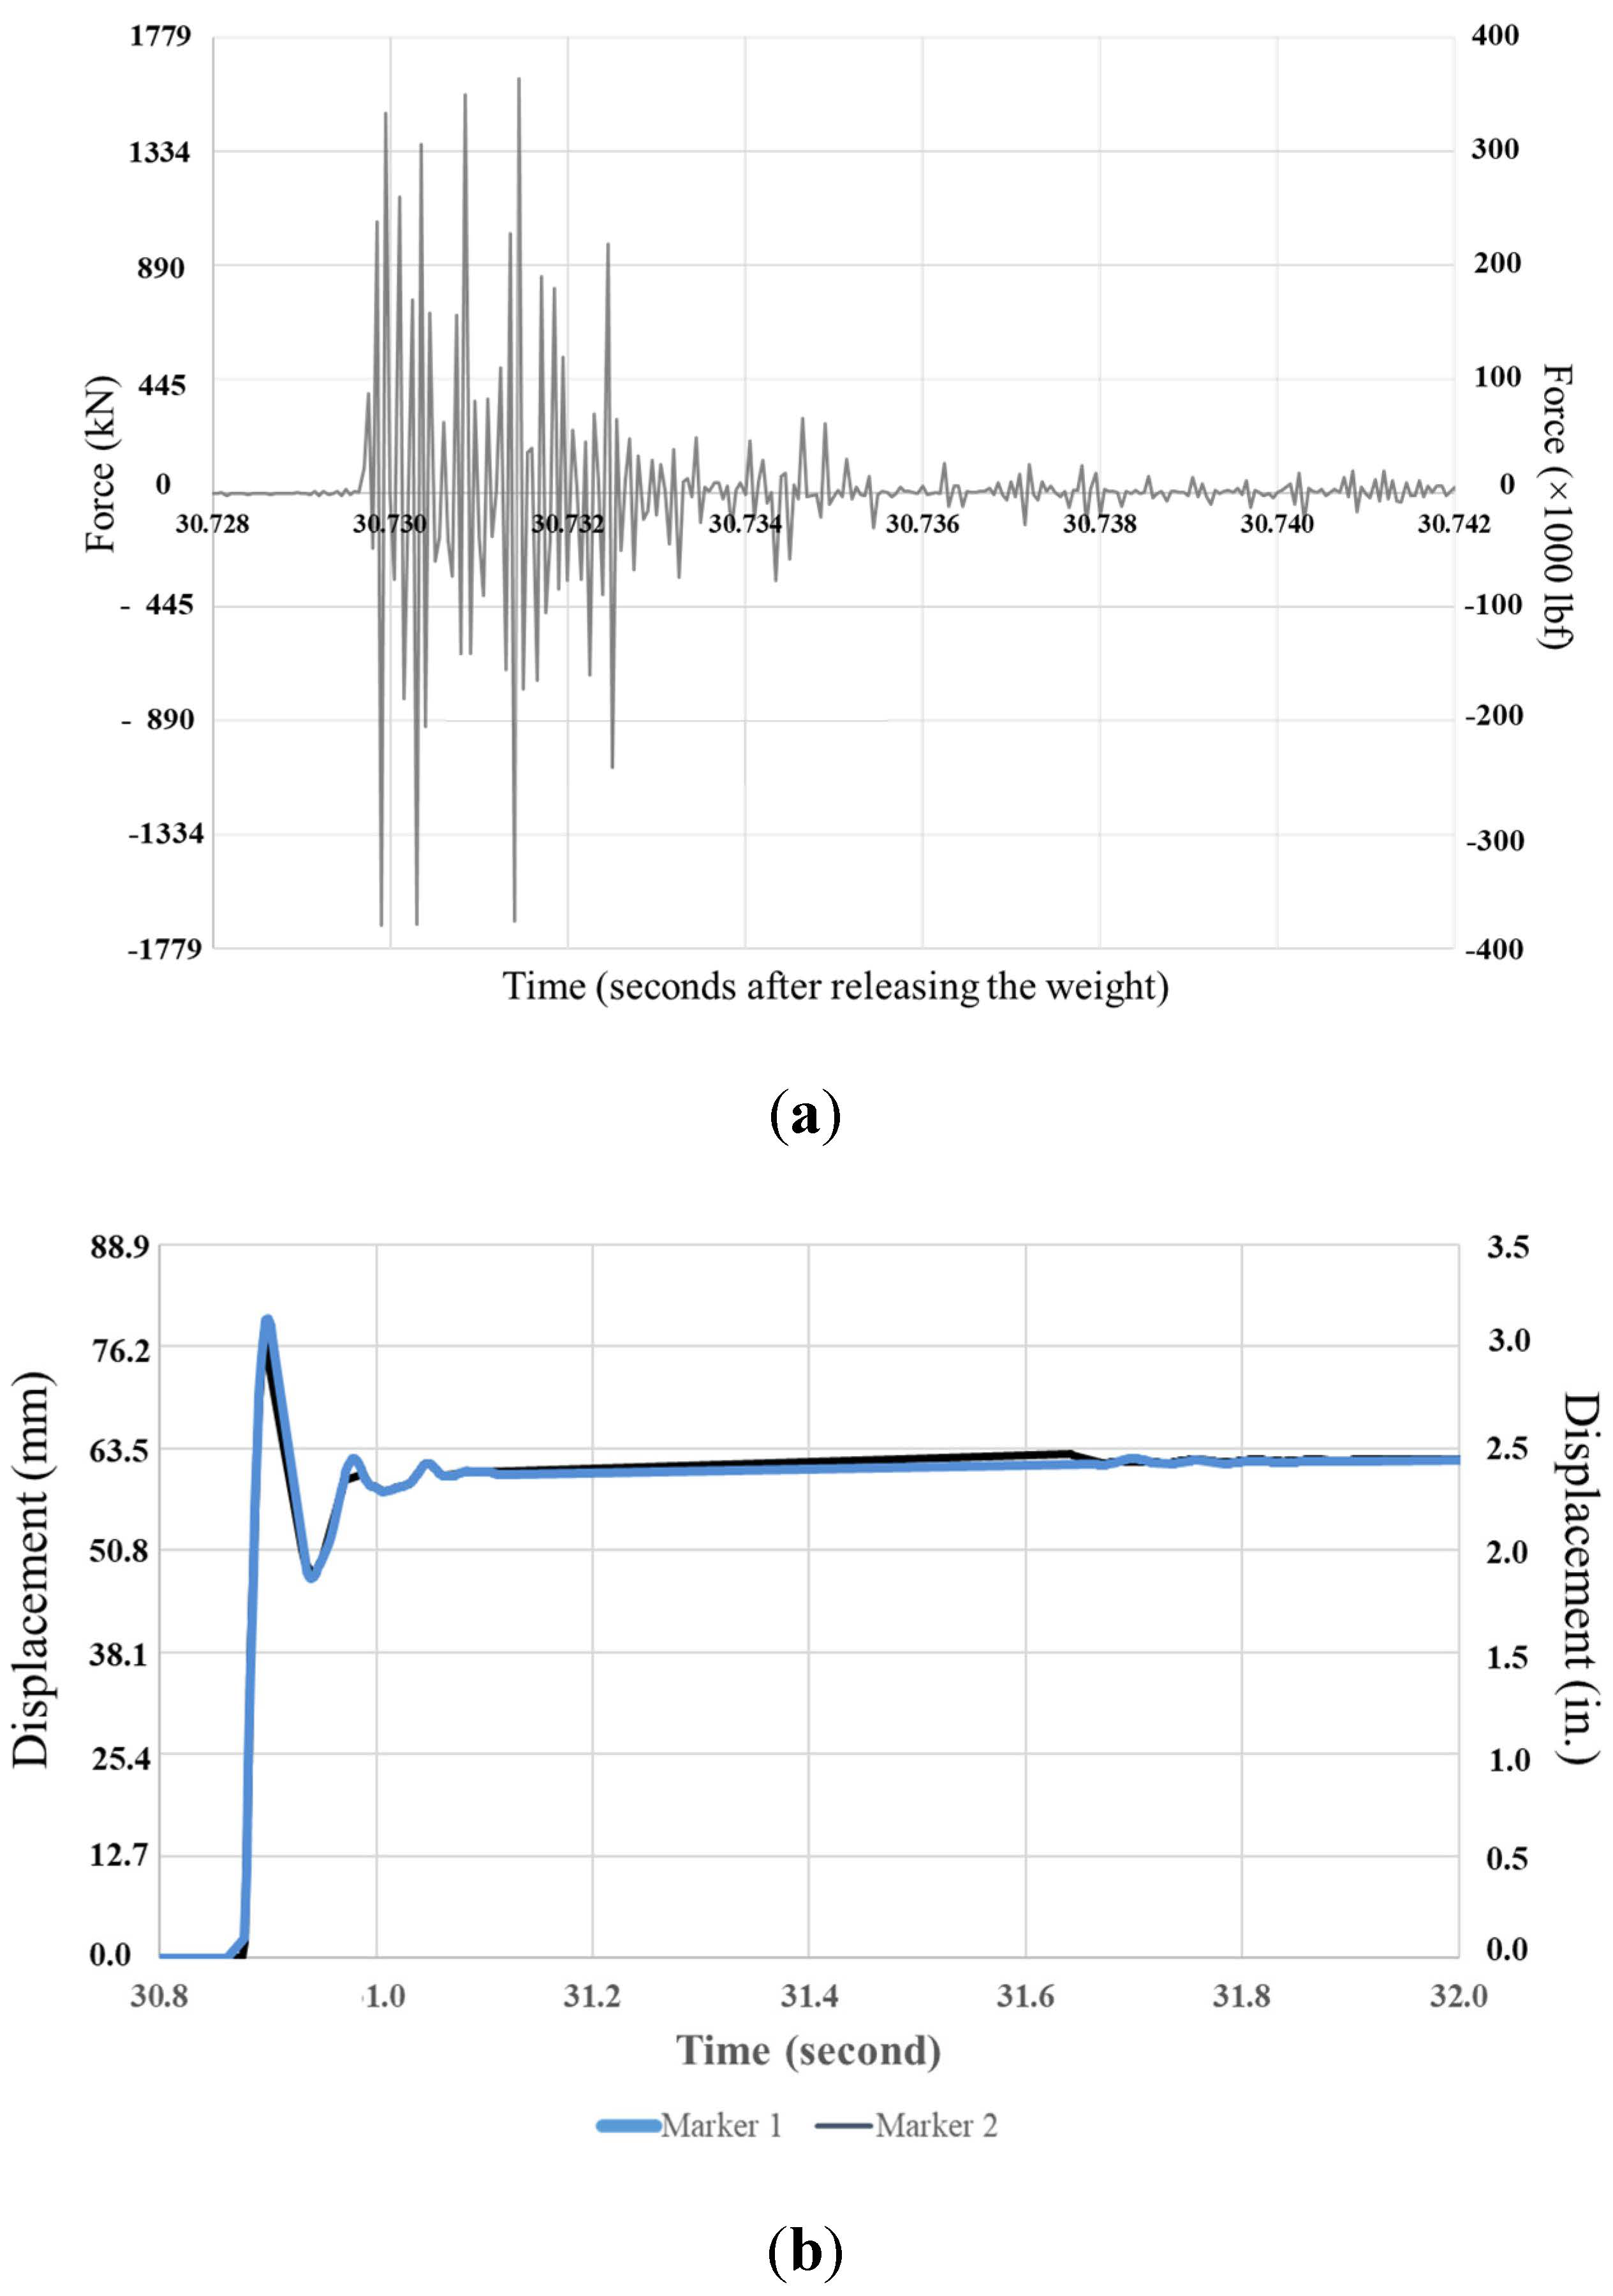
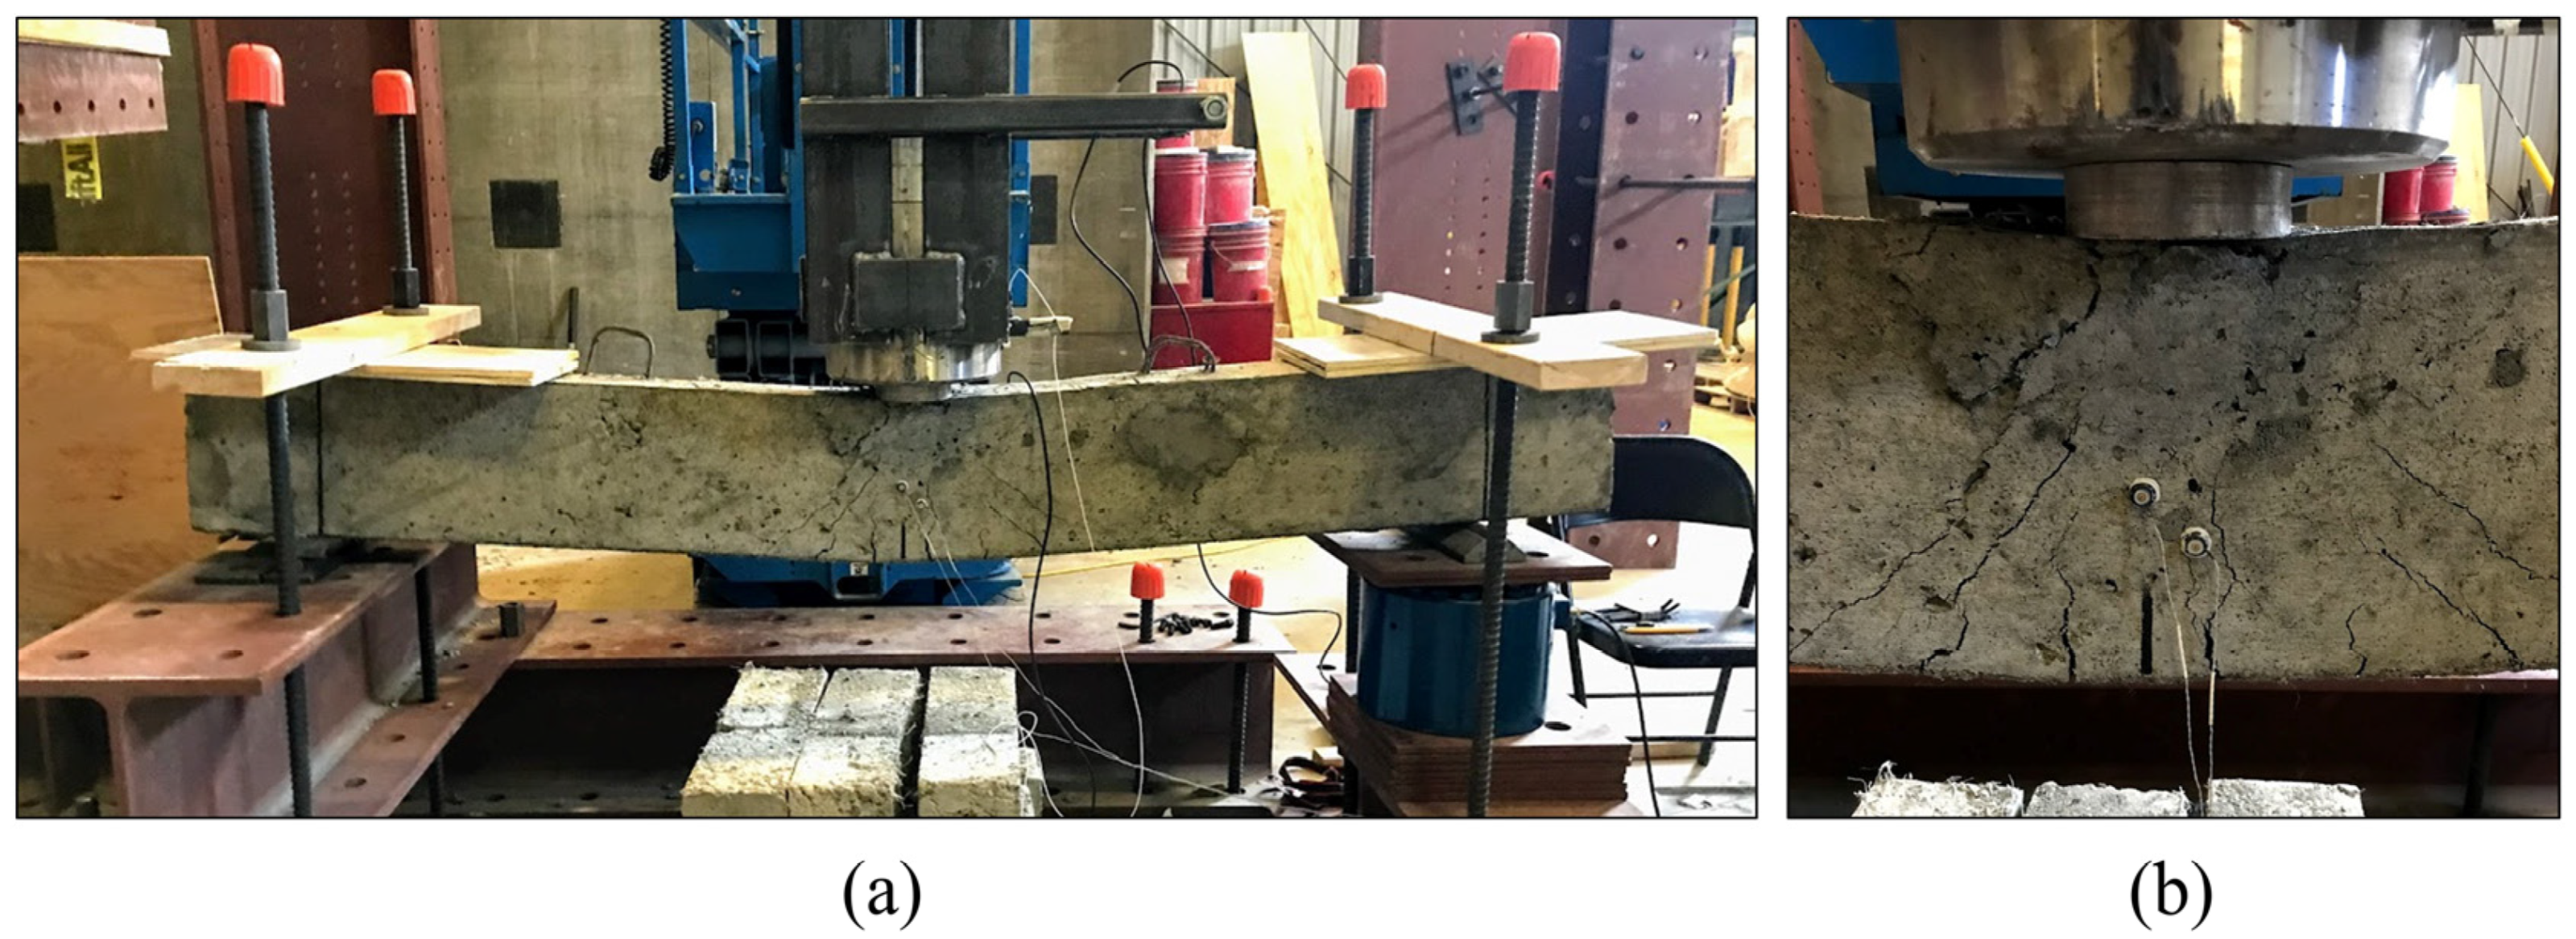
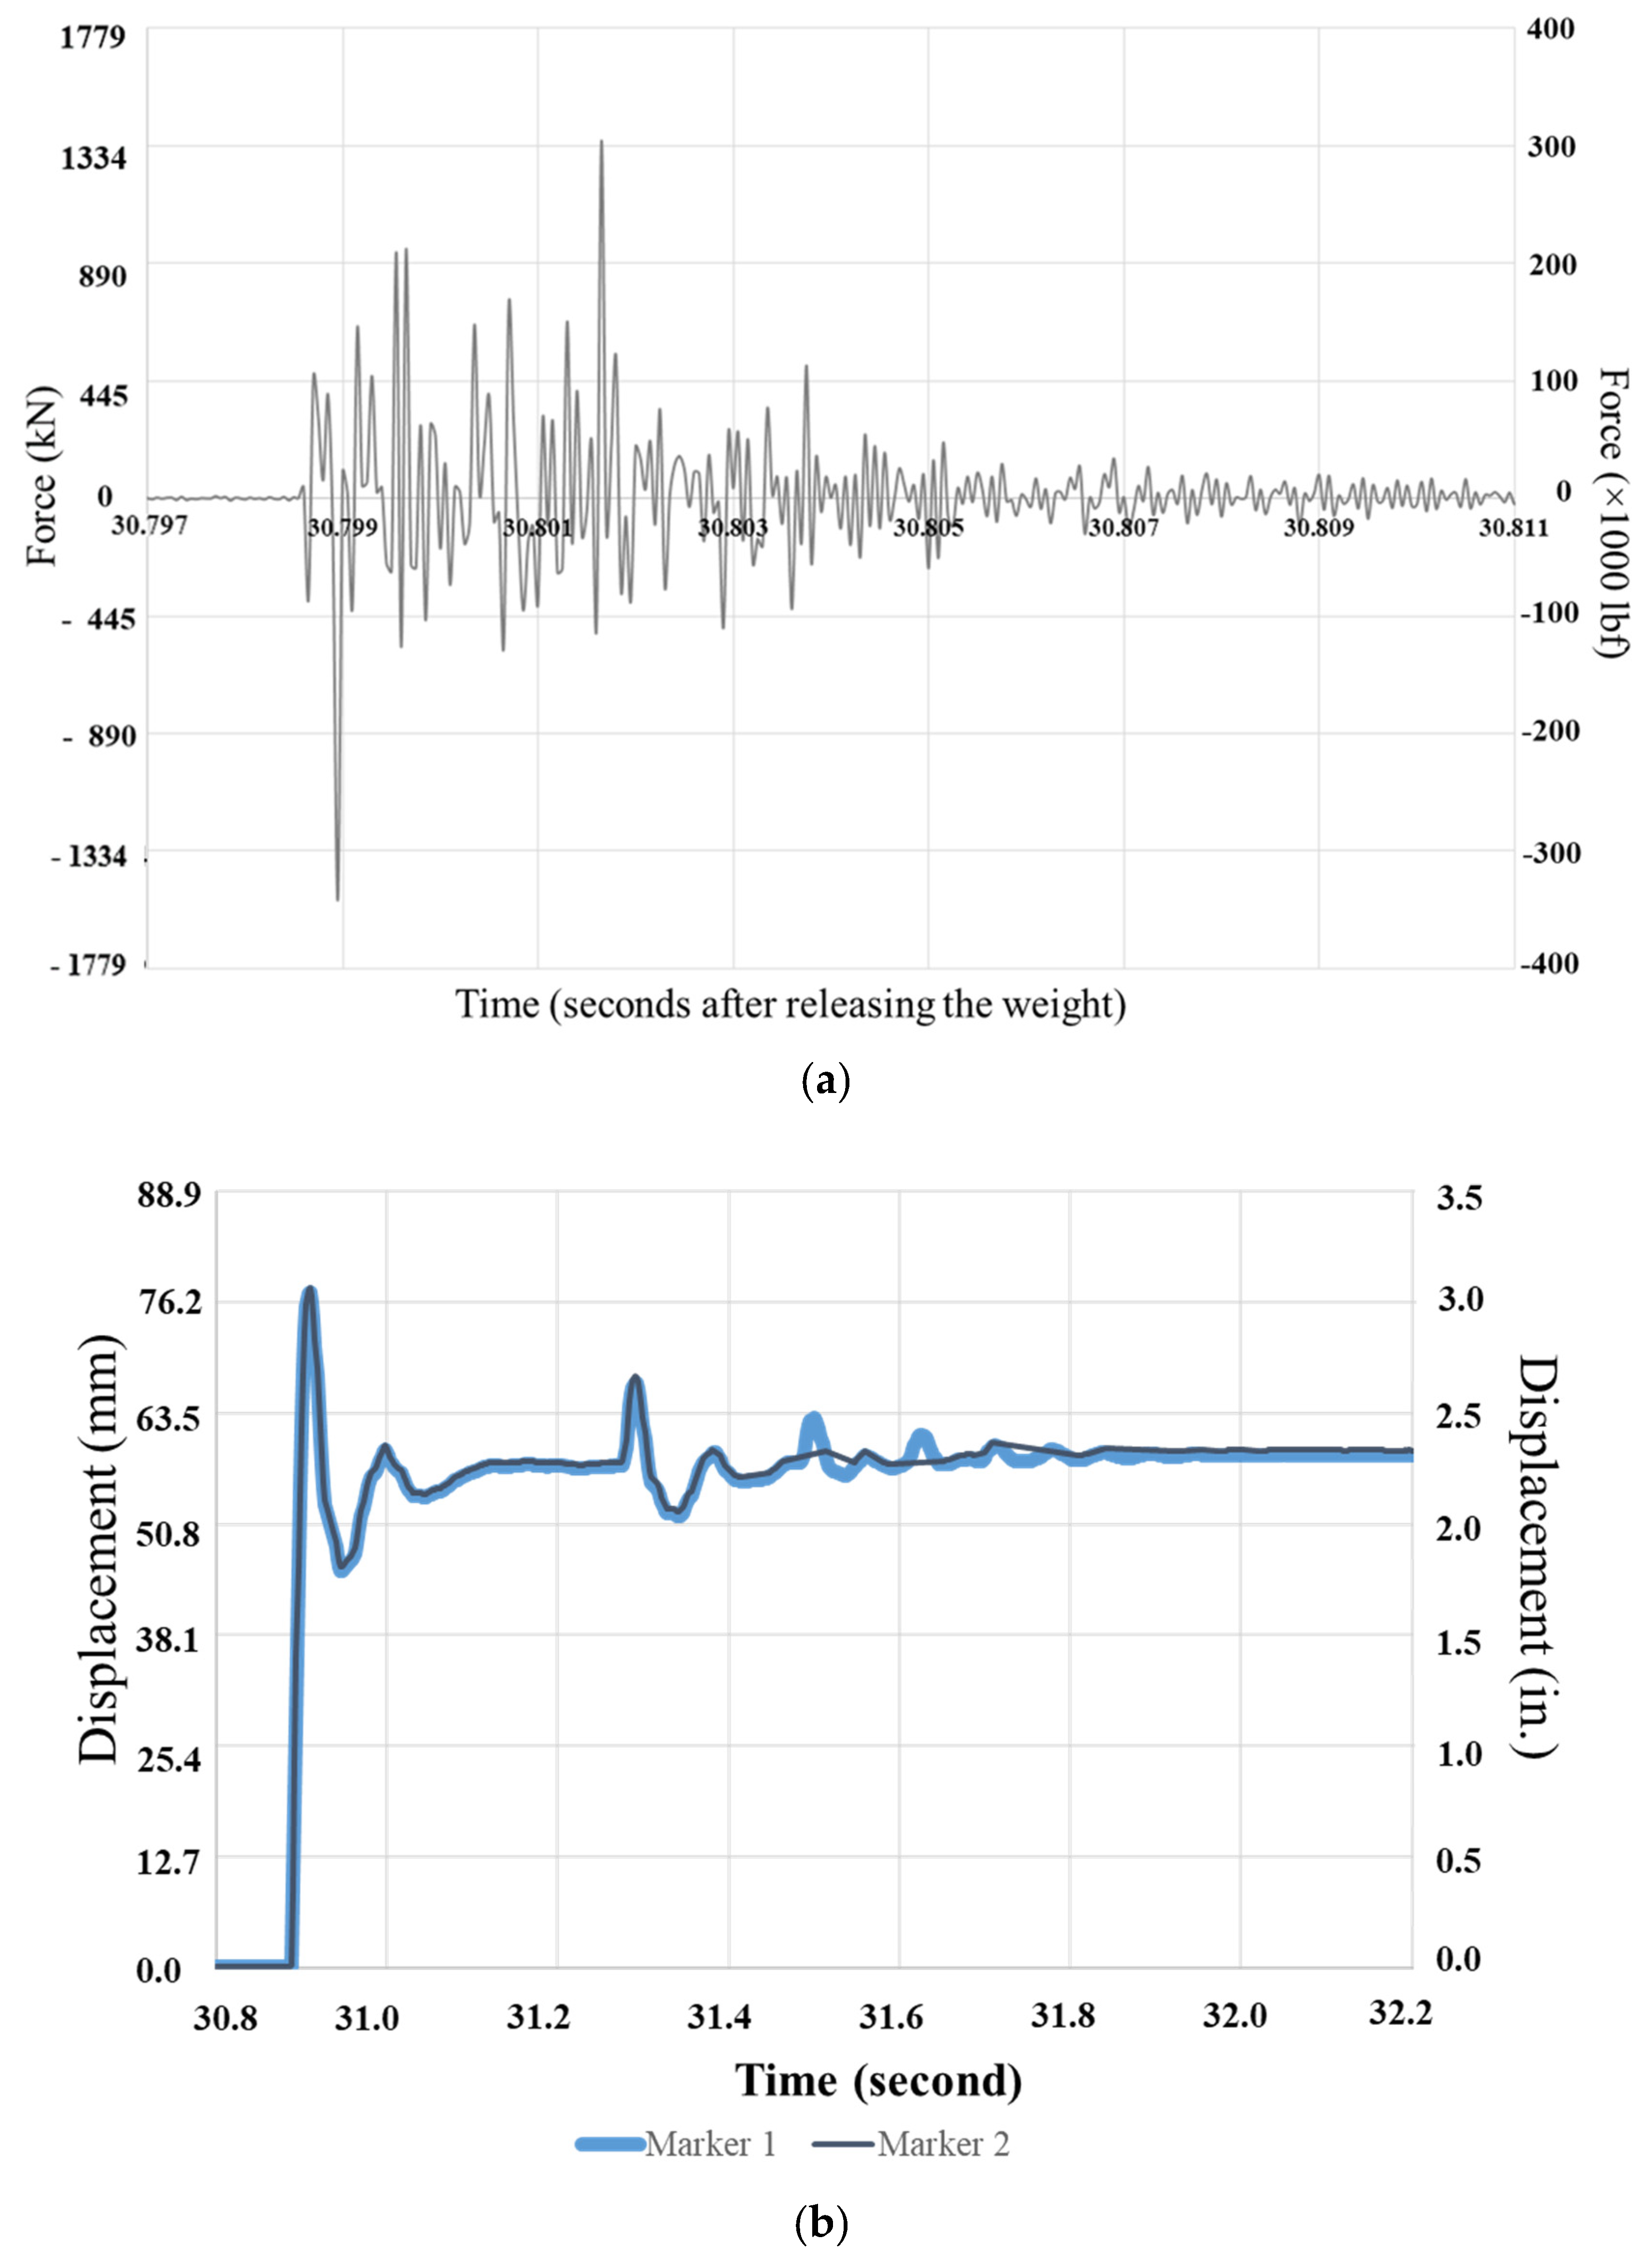
2.6.2. Impact Beam Testing

Impact tested beams were simply supported with vertical uplift restricted by two 0.25 in. (13 mm) thick sheets of insulation placed between the beam and 51 mm × 152 mm (2 in. × 6 in.) timber members restrained by 25 mm (1 in.) threaded rods and secured by hex nuts. These threaded rods were secured to steel beams, which were tied into the concrete strong floor in order to transfer the reaction forces. Beams were placed such that a 6.1 m (20 ft.) tall, 0.3 m × 0.3 m (1 ft. × 1 ft.) vertical sleeve was able to guide a 181 kg (400 lb.) steel drop-weight to impact directly at mid-span. Figure 6a,b show the impact test setup and the 6.1 m (20 ft.) sleeve. The drop weight was hoisted to the top of the vertical sleeve by a crane, and when centered, released with a lever. An accelerometer was attached to the arm of the drop-weight, to measure accelerations experienced by the drop-weight, and set at a sampling rate of 20,000 Hz. Figure 6c,d show the drop weight and its schematic, including the location of the accelerometer. These accelerations were converted to impact forces later on. Furthermore, a load cell was placed under the pinned support, with two 13 mm (0.5 in.) steel plates distributing the load. This was to compare reaction forces with impact forces quantified from the accelerations. Deflection was recorded with a motion capture camera and motion capture sensors (or makers) affixed on a beam specimen. Due to the constraints of the load cell, a sampling rate of 10,000 Hz was selected. While the accelerometer experiences the force on the drop-weight, the load cell captures the reactionary force of the beam.

3. Results

3.1. Phase I—Invetigative Mixture Properties and Disc Specimens

Twelve investigative mixtures were batched with varying concentrations of powdered rubber, recycled steel fiber, industrial steel fiber, as well as tire chip and crumb rubber. The testing of the preliminary investigative batches was used to determine the optimum mixtures selected for the next phase of testing, scaled static and impact beams.

3.1.1. Fresh Properties of Investigative Mixtures

The fresh properties of slump, temperature, unit weight, and air content were measured and recorded for each of the trial mixtures. For mixtures containing recycled steel fiber, slump was measured prior to the addition of steel fibers, as suggested in the literature review, as well as after the addition, for comparison. Table 5 lists the fresh concrete properties results for Phase I mixtures.
Mixtures containing powdered rubber showed reduced slump when compared to control mixtures. As seen in Table 5, the increased concentration of powdered rubber seemed to have minimal effects on the slump, with slump fairly consistent for 20% PR through 50% PR. While slump for these mixtures was below GDOT Class AA standards, the results were fairly close to the minimum slump of 50.8 mm (2 in.), and exhibited sufficient workability, especially with the aid of a vibrating plate. For mixtures containing both recycled and industrial steel fibers, slump tested before addition of fibers was within the GDOT standards, with the exception of 0.1% ISF, which was 12.7 mm (0.5 in.) above the limit of 101.6 mm (4 in.) For all but 0.25% RSF mixtures, slump measured after the addition of fibers was shown to increase. This was deemed to be due to the additional mixing time between the initial testing and the addition of fibers. For the 0.25% RSF mixture, slump measured after the addition of fibers was reduced, from 101.6 mm (4 in.) to 25.4 mm (1 in.). The higher concentration of the recycled fibers was deemed to be the controlling factor in the slump.
For the first combination mixture, slump was measured to be 76.2 mm (3 in.), within GDOT limits. For the second combination mixture, slump measured before the addition of fibers was measured to be 152.4 mm (6 in.), while slump measured after the addition of fibers was measured to be 139.7 mm (5.5 in.). Similar to the 0.25% RSF mixture, the RSF fiber concentration led to the reduction in slump. While the slump for the second combination mixture was above GDOT limits for Class AA concrete, High-Range Water-Reducing Admixture (HRWRA) dosages were reduced for Phase II mixtures in order to reduce slump to within the allowable limits.
The addition of rubber particles and steel fibers seemed to have negligible effects on the temperature of the concrete, with the ambient temperature having the most significant impact on the concrete temperature. However, it is important to note that rubber products should not be stored in direct sunlight prior to its addition into concrete, as they absorb and retain heat quite well and could lead to increased temperature and inadvertently expedite setting time.
As expected, the addition of powdered rubber leads to a nearly linear decrease in unit weight. On average, for each 10% increase in powdered rubber content, the unit weight decreased by 295 N/m3 (1.88 lb/ft3) or about 1.31%. This decrease can be attributed to the replacement of heavier fine aggregate with a higher specific gravity with rubber particles exhibiting a lower specific gravity. The addition of steel fibers seemed to have negligible effects on the unit weight, which could possibly be attributed to the relatively low concentration of steel fibers in the mixture, compared to the replacement levels of the powdered rubber. The unit weight for mixtures containing both recycled and industrial steel fibers were relatively similar to the unit weight for the control mixture, with the exception of the RSF 0.1% mixture. This was attributed to the higher air in this mixture due to the increased mixing time for this mixture. For combination mixtures, unit weight was reduced compared to the control mixtures, but remained relatively consistent between Combination 1 and Combination 2 mixtures. The lower unit weights were due to their considerably high rubber content.
Air content was consistent for all Phase I mixtures containing powdered rubber, regardless of concentration. It is possible that the smaller powdered rubber particles had negligible effects on the air content, unlike the much larger tire chips discussed in the literature [21] as entrapping air due to their hydrophobic properties. For mixtures containing steel fiber, air content was fairly consistent, with the exception of the 0.1% RSF mixture. For all but the 0.1% RSF mixture, air content was 3.5%, reduced from the air content of the control mixture’s 5.2% air. For 0.1% RSF air content was 9.0%. The higher air content for this mixture could possibly be attributed to the additional mixing time during the addition of RSF, as previously mentioned regarding slump. The admixture dosage could also be a contributing factor to the high air content. For the other steel fiber mixtures, the fibers were added quicker, in order to minimize over-mixing. Additionally, HRWRA admixture dosages were slightly increased (about 5% by volume), and as a result, air contents were much closer to the target air content. For the combination mixtures, the air content was generally close to that of the control mixture. The first combination mixture was a bit lower, at 4%, while the second combination mixture was a bit higher, at 5.5%. The differences between combination mixtures was attributed to the admixture dosages, similar to the slump.

3.1.2. Hardened Concrete Properties of Investigative Mixtures

Compressive cylinders, MOR beams, and impact disc specimens were constructed for each Phase I mixture to provide a general understanding of the hardened properties of concrete incorporating rubber products and steel fiber, especially powdered rubber and recycled steel fiber. Compressive cylinders were tested at 1, 7, and 28 days of age, while all other hardened concrete properties tests were conducted at 28 days of age. Table 6 outlines the average compressive strengths at 1, 7, and 28 days as well as the average flexural strength for all Phase I mixtures. The spread in the test results was relatively larger for mixtures with RSF and ISF as evident in the inconsistency in the average compressive and flexural strength shown in Table 6. This outcome is attributed to the number of repeat samples (3) and difficulty in evenly distributing fibers.
Impact discs were tested in order to determine the material’s ability to absorb impact without fracturing, and to better understand the effects that rubber products and steel fibers have on impact resistance. Discs were impacted with a 4.5 kg (10.0 lb.) drop-hammer, with blows counted until first crack, control failure, and ultimate failure. Control failure was deemed when a crack had travelled across the entire disc, and ultimate failure was deemed when the disc fell apart. Table 7 outlines the average drop hammer impact results of phase I mixtures.

Compressive Strength

As suggested by the literature, compressive strengths decreased with increase in rubber content, as shown in Table 6. Despite this, 28 day strengths for all powdered rubber mixtures except the 50% PR mixture met GDOT Class AA requirements for compressive strengths, and all mixtures met GDOT Class A compressive strength requirements. A majority of the strength is gained in the first 7 days. On average, roughly 82% of 28 day strength was gained in the first 7 days. This trend is most clearly shown in Figure 7, which outlines the total compressive strength gained of each mixtures by age. As a result of this trend, both 1 and 7 day strengths are relatively reliable indicators of 28 day strengths. This trend can be seen in the strength gain curves, not only for powdered rubber mixtures, but across all Phase I mixtures.
For mixtures containing steel fibers, all mixtures had higher compressive strengths than the control mixture and met GDOT Class AA compressive strength requirements, by a fair margin. In fact, all mixtures achieved required compressive strength by 7 days. Interestingly enough, the 0.25% RSF mixture had the highest average compressive strength, with 52.8 MPa (7654 psi), while the 0.1% RSF mixture had the lowest average compressive strength, with 35.3 MPa (5121 psi). This lower strength is likely attributed to the number of repeat samples (e.g., 3 for each test results reported in Table 6 and Table 7) and the spread in the test data, than the other steel fiber mixtures. In order to more accurately compare mixtures, compressive strengths were normalized based on the industry standard relationship, a 5% decrease in compressive strength for every 1% increase in air content [42]. After normalizing the control and steel fiber mixtures for 3.5% air, 0.1% RSF had a compressive strength of 45 MPa (6528 psi), in line with the other steel fiber mixtures, while showing a greater improvement over the control mixture.
Combination mixtures showed reduced compressive strengths compared to the control mixture, with the combination 1 mixture having an average compressive strength of 26.6 MPa (3861 psi), and combination 2 having an average compressive strength of 19.4 MPa (2819 psi). The higher rubber content in these mixtures was responsible for the reduction in compressive strength when compared to the control mixture. In fact, combination mixtures had lower compressive strengths than all but the 50% PR mixture. While the combination 2 mixture incorporated recycled steel fibers, this mixture also had higher slump and air content, which could be attributed to the lower compressive strength when compared to the combination 1 mixture. During Phase I, only the combination 1 mixture met GDOT Class AA requirements for compressive strength, but the combination 2 mixture was relatively close to Class A requirements.

MOR

For MOR testing, mixtures containing powder rubber up to 30% demonstrated improved flexural strength over the control mixture, as shown in Table 6. Interestingly, the mixture containing just 10% powdered rubber exhibited the highest flexural strength over all powdered rubber and control trial mixtures. While mixtures containing up to 30% replacement demonstrated higher flexural strengths than the control, each increase in powdered rubber content led to larger decreases in flexural strength.
Mixtures containing steel fibers all demonstrated improved flexural strength over the control mixture. For both industrial and recycled steel fiber, mixtures containing 0.25% steel fiber demonstrated improved flexural strength over their 0.1% content counterparts. Furthermore, mixtures incorporating recycled steel fibers showed higher flexural strengths, 2 to 11%, than their industrial steel fiber counterparts (see the average MOR values in Table 6).
Combination mixtures demonstrated reduced flexural strengths when compared to the control mixture. This is due to the high rubber content reducing the flexural strength of the beams. Unsurprisingly, the second combination mixture, which incorporated 0.25% recycled steel fiber, demonstrated higher flexural strength than the first combination mixture. Since they shared the same rubber content, this increase in flexural strength can be attributed to the recycled steel fibers.

Impact Discs

For powdered rubber mixtures, the line between control failure and ultimate failure was very thin, as the powdered rubber was not as effective in bridging the cracks as fibers and tire chips have shown in previous work. Some discs held together despite having cracks through them, for a brief period. The results, shown in Table 7, demonstrate the improvement in impact resistance the increase in powdered rubber content has, to a point. The discs demonstrated increased number of drops until first crack, control failure, and ultimate failure, for each powdered rubber mixture when compared to the control batch. Additionally, toughness improved as powder rubber content increased up to 40% replacement, after which there was a slight drop off. It is worth noting that while there is improvement shown in mixtures containing powdered rubber when compared to the control mixture, the improvements are much less significant than those shown in previous studies involving crumb rubber and tire chip mixtures.
Mixtures containing steel fibers showed improvements over control mixtures for first crack, control failure, and ultimate failure. The average number of drops until first crack showed minimal improvements across the board, with the 0.25% RSF mixture showing the greatest improvement. Similarly, the 0.25% RSF mixture showed the greatest improvement in the average number of drops until control failure, with 32 compared to the mere 6 required for the control. Furthermore, the 0.25% RSF mixture showed the greatest improvement in the average number of drops required until ultimate failure, with an average of 90 compared to the average of 6 for the control mixture. Unsurprisingly, the mixtures with higher fiber contents showed improved impact resistance than their lower fiber content counterparts. While fiber contents were maintained across the board, the recycled steel fibers, with their variety of fiber shapes and sizes, improved impact resistance at a greater level than their industrial fiber counterparts.
The combination mixtures demonstrated improved impact resistance when compared to the control mixture. While the combination 1 mixture demonstrated some improvements over the control mixture across the board, particularly in the ultimate failure category, the combination 2 mixture demonstrated considerable improvements in all categories. The most remarkable improvement the combination 2 mixture demonstrated was for ultimate failure, requiring 229 drops on average, compared to the mere 6 drops required for the control, or even the 90 drops required to achieve ultimate failure for the 0.25% RSF mixture. This outcome may be attributed to the combined effect of the energy dissipation ability of rubber and crack bridging ability of steel fibers. Finally, due to the limited number of specimens tested, the statistical significance of difference between the flexural and impact resistance of the different mixtures is tested by conducting a t-test at a 95% confidence level. This test with the t-statistic (−2.15) demonstrates the difference between the two is similar in observations.

3.2. Phase II—Beam Mixtures and Tests

Based on their performance in Phase I, it was decided that 40% powdered rubber and the second combination mixture would be used for Phase II. The PR40 mixture was the powdered rubber mixture with the highest replacement level that still met GDOT Class AA compressive strength requirements, and demonstrated improved impact resistance over the control mixture. The second combination (C2) mixture demonstrated the highest impact resistance among all investigative mixture, proving to be a promising mixture despite not meeting GDOT Class AA compressive strength requirements. One static and one impact beam was batched for each mixture.

3.2.1. Static Beam Test Results

The axial load and displacement, as recorded by the hydraulic actuator, were plotted in order to develop a load-displacement curve, shown in Figure 8. From this load-displacement curve, the toughness, or energy dissipation capacity, of each beam was determined. This was done by integrating the load-displacement curve over the testing period, stopping after capacities fell below 13 kN (4000 lbs.), for comparison. The C2 beam demonstrated a toughness of 8979 kN-mm (79.48 kip-in.) compared to the 3552 kN-mm (31.44 kip-in.) demonstrated by the 40% PR beam. Additionally, the failure modes for each beam were also observed, in order to better understand their performance. Figure 9 shows the 40% PR beam before and after testing as well as the fracture of the beam. Figure 10 presents testing of the Combination 2 beam and its corresponding failure mode.

3.2.2. Impact Beam Test Results

Two 2286 mm × 152 mm × 279 mm (90 in. × 6 in. × 11 in.) beams were tested for impact. The beams were impacted with a 181 kg (400 lb.) solid steel-weight dropped down a 6.1 m (20 ft.) vertical sleeve onto the midpoint of the beams. Figure 11 shows the 40% PR impact beam and a close up of the middle section of the beam, where failure occurred. The beam experienced a maximum impact force of 1687 kN (379.7 kips), according to the accelerometer data. Figure 12 shows the impact force and the displacement fluctuated over time for the 40% PR impact beam as recorded by the accelerometer. The Combination 2 impact beam, shown in Figure 13, experienced a maximum impact force of 1521 kN (341.9 kips), according the accelerometer. In addition to this maximum impact force, additional impact forces were experienced as the drop-weight rebounded and eventually settled to equilibrium. The impact force and displacement over time experienced by the impact beam is shown in Figure 14. Contrasting seismic load-displacement history plots for evaluating energy dissipation capacity, the load-deflection plots are not normally made for impact tests because the response peaks at a different time over a very short duration of time [43]. In Figure 12 and Figure 14, it takes approximately 29 s to completely release the weight (see Figure 6a) before it free falls at a speed of 11 m/s (36 ft/s) and impacts a beam within about a second.

4. Analysis of Phase-II Test Results and Discussion

4.1. Static Beam Test

The 40% PR beam demonstrated a load capacity of 55.4 kN (12,450 lbs.). Figure 9a,b show the 40% PR beam before and after testing, respectively. The 40% PR beam experienced compressive failure, including crushing failure at the contact area of the beam. Some small cracks formed at the base of the beam at mid-span, and propagated up towards the point of loading. A close up of the mid-span of the beam after failure is shown in Figure 9c. The high tensile reinforcing ratio combined with the low compressive strength led to a compressive failure, and eventually buckling of compressive steel, shown in Figure 9d. This was expected because of the 3-point bending test (vs. 4-point bending) in order to directly compare with the results with single-point drop weight impact tests. Additionally, significant section loss was experienced, as shown in Figure 9e.
The Combination 2 (TC10/CR10/PR10/RSF0.25) beam, shown in Figure 10a, demonstrated a load capacity of 78.1 kN (17,556 lbs.). It also experienced compressive failure, including crushing at the loading point. Larger and more frequent cracks formed for the C2 beam, originating at the bottom of the beam and propagating up towards the point of loading. Unlike the 40% PR beam’s cracks, which only travelled a small way up the beam, these cracks propagated much further up the beam, as shown in Figure 10b. Additionally, despite significant compressive failure, there was minimal section loss, due to the recycled steel fibers holding fractured sections together, visible in Figure 10c. Similar to the 40% PR beam, compressive steel yielded, due to the high tensile reinforcing ratio and lower compressive strengths, but unlike the 40% PR beam, no compressive steel buckling was observed. As the static load-displacement plot in Figure 8 demonstrates, as compressive failure occurred, the steel fibers were able to redistribute the loading and provide additional capacity. Even after maximum capacity, the fibers continued to redistribute loading and provide additional capacity. Furthermore, the fibers allowed for higher deflection by bridging cracks.
Both beams failed in compression rather than in tension, and did not reach the full capacity of the tensile reinforcement. However, the Combination 2 beam provided insight into the benefits that the inclusion of RSF has on the toughness of concrete, and distributing loading.

4.2. Drop Weight Impact Beam Test

The 40% PR impact beam, shown in Figure 11, experienced a maximum impact force of 1687 kN (379.72 kips), according to the accelerometer data. In addition to this maximum impact force, additional impact forces were experienced as the drop-weight rebounded and eventually reached equilibrium. As the impact force fluctuated over time, so did the displacement, as shown in Figure 12. The maximum displacement of 79 mm (3.11 in.) occurred at initial impact. As the drop weight rebounded and settled into equilibrium, so did the displacement. The final displacement was 61 mm (2.42 in.) as shown in the plot captured by the motion capture. Despite the large impact force, the maximum reaction force, as recorded by the load cell, was only 0.37 kN (83.66 lbf.). While it is possible that the load cell, with its lower sampling rate, may have simply missed the maximum reaction force, it is unlikely to have missed a significantly higher reaction force. The considerably lower reaction force is due to the majority of the impact force transferring to the impact zone, leading to the fracturing of the concrete as well as section loss. Figure 11b provides a close up of the middle section of the beam, where failure occurred. At the contact surface, the 40% PR beam experienced local crushing failure, as well as section loss in the compressive zone. Yielding in the tension steel led to the development of flexural cracks forming on the bottom of the beam which propagated from the point of impact. Despite yielding, there was no indication of rebar rupture.
The Combination 2 impact beam, shown in Figure 13, experienced a maximum impact force of 1521 kN (341.92 kips), according the accelerometer. In addition to this maximum impact force, additional impact forces were experienced as the drop-weight rebounded and eventually settled to equilibrium. The impact force and displacement over time experienced by the impact beam is shown in Figure 14. Again, the largest displacement is experienced at initial impact, in this case 78 mm (3.06 in.), and as the drop-weight rebounded and eventually settled into equilibrium, displacement fluctuated until eventually settling at the final displacement of 59 mm (2.33 in.). The maximum reaction force, as recorded by the load cell, was 212 kN (47,757 lbf.). While this reaction force is lower than the impact force, it is considerably higher than the maximum reaction force experienced by the 40% PR impact beam. This indicates that a significant portion of the impact force was distributed to the supports. Figure 14b provides a close up of the middle section of the beam, where failure occurred. At the contact surface, the C2 beam also experienced local compressive failure, including crushing, however, it did not experience section loss. Spalling occurred in the compression section of the beam. Yielding in the tension steel led to the development of flexural cracks forming on the bottom of the beam which propagated from the point of impact. The crack widths appeared to be smaller than the cracks seen in the 40% PR beam, due to the fibers holding the concrete together. There was no sign of rebar rupture.

4.3. Summary of Phase II Investigation

Phase II investigated two promising mixtures, 40% Powdered Rubber and Combination 2, on larger scales. One static and one impact beam were batched for each mixture, and their performances compared with one another, as well as with previous research. The static beams, while compression controlled, were able to provide insight into the toughness, capacity, and deflection of beams produced with each mixtures. Additionally, how cracks propagated through the beams was also observed. Impact testing provided information on impact forces and reaction forces experienced by the beams, as well as the deflection of each beam over time. Furthermore, the manner in which these beams failed was observed.
For both static and impact testing, the Combination 2 beams proved superior. For static testing, the C2 beam had higher capacity, allowed for higher deflection, and experienced minimal section loss. The recycled steel fibers were able to distribute the loading, resist cracking, and permit increased deflection without failure. For the impact testing, the C2 beam experienced a slightly lower maximum impact force, but distributed a significantly higher reaction force. Furthermore, the C2 beam experienced lower impact forces over a longer period of time than the 40% PR beam, and took longer to reach equilibrium after impact. This further indicates improved energy dissipation, compared to the 40% PR beam. Additionally, while the 40% PR beam experienced significant section loss, the C2 beam remained intact after testing, as shown in Figure 15.
The 40% PR beam with a section loss shown in Figure 15 may suggest that the weight might have fallen on one edge of the beam. However, because of the presence of a guide rail (see Figure 6a), it was not physically possible to impact one edge although it might have fallen closer to one edge of the beam. Based on the observation during the experiment, the section loss mainly occurred due to a crushing failure and is not a result of an asymmetric impact. Due to the section loss, the 40% PR beam may appear that it had an asymmetric impact.

5. Summary of Findings

The following findings are summarized from the Phases I and II tests.

5.1. Phase I Findings

5.1.1. Powdered Rubber Mixtures

  • Similar to other waste tire products, the addition of powdered rubber reduced slump and unit weight, although at a lower rate than larger particles.
  • The addition of powdered rubber leads to a reduction in compressive strength, however at a lower rate than larger waste tire particles. Mixtures containing up to 40% FA replacement by volume still met GDOT Class AA compressive strength requirements of 24.1 MPa (3500 psi).
  • Flexural strengths improved initially with the addition of powdered rubber, but each additional increase in rubber content led to higher reductions in flexural strength.
  • Impact resistance improved slightly with the addition of powdered rubber, up to 40% replacement, after which a drop off was observed.

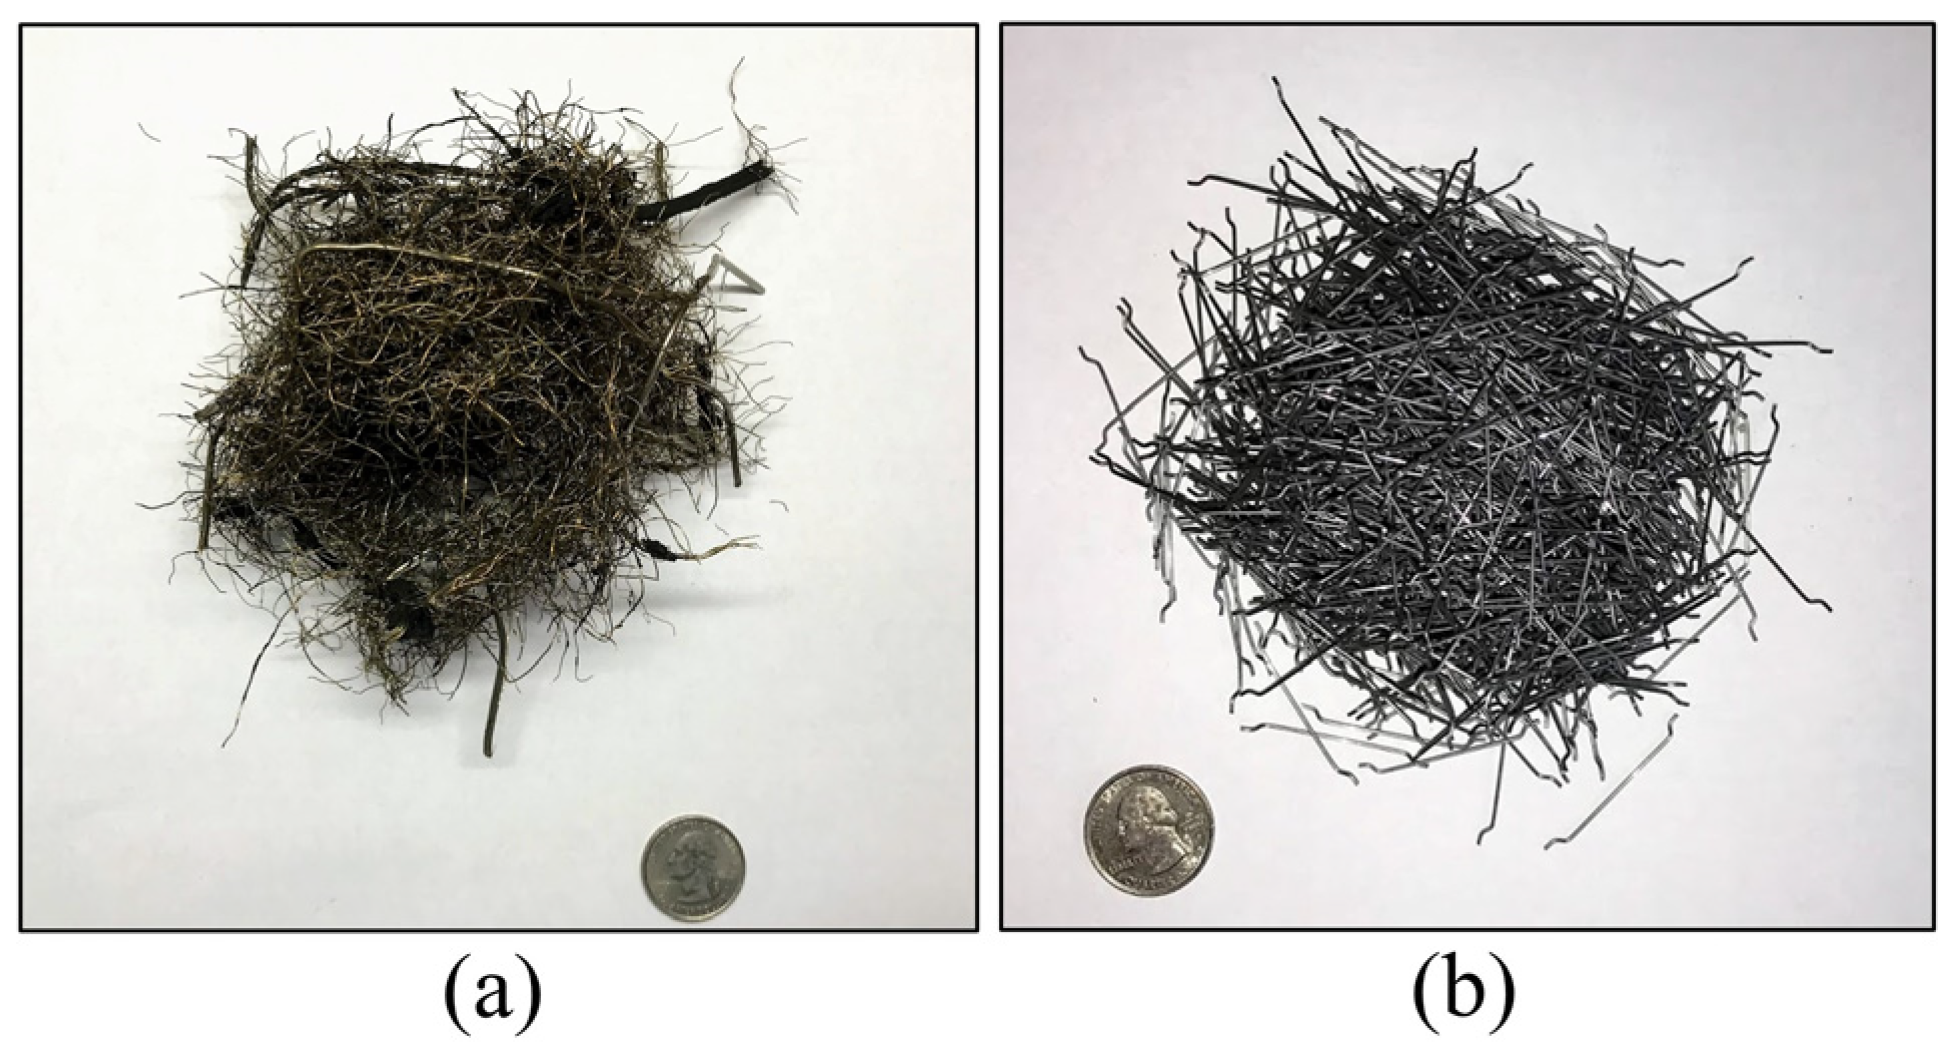
5.1.2. Recycled Steel Fiber Mixtures

  • Mixtures incorporating recycled steel fiber at 0.25% of the total batch volume saw considerable decrease in slump, due to the fibers clumping up and tangling.
  • Mixtures containing recycled steel fibers had similar flexural strengths to mixtures contacting industrial steel fibers at similar concentrations, with the 0.25% RSF mixture actually outperforming the 0.25% ISF mixtures by 11%.
  • Most notably, the impact resistance for mixtures containing recycled steel fibers was significantly better than mixtures containing industrial steel fibers at the same concentration. In this case, the 0.25% RSF mixture required 68% more drops than the 0.25% ISF mixtures.

5.1.3. Combination Mixtures

  • Combination mixtures, unsurprisingly, saw significant reductions in unit weight, due to their high rubber content. These mixtures also saw slight decreases in compressive strength and flexural strength, when compared to the control mixture.
  • Combination mixtures demonstrated improved impact resistance over control mixtures, due to their high rubber count. Combination 2, with its inclusion of RSF, saw the highest impact resistance of all mixtures, by a significant margin.

5.2. Phase II Findings

  • Despite showing some improvements in impact resistance on smaller scale testing, powdered rubber mixtures did not significantly improve impact resistance or energy dissipation for larger scale beams.
  • While the Combination 2 static beam had relatively low compressive strength, the recycled steel fibers were able to distribute a considerable amount of load, giving the beam a higher capacity and allowing for greater deflection.
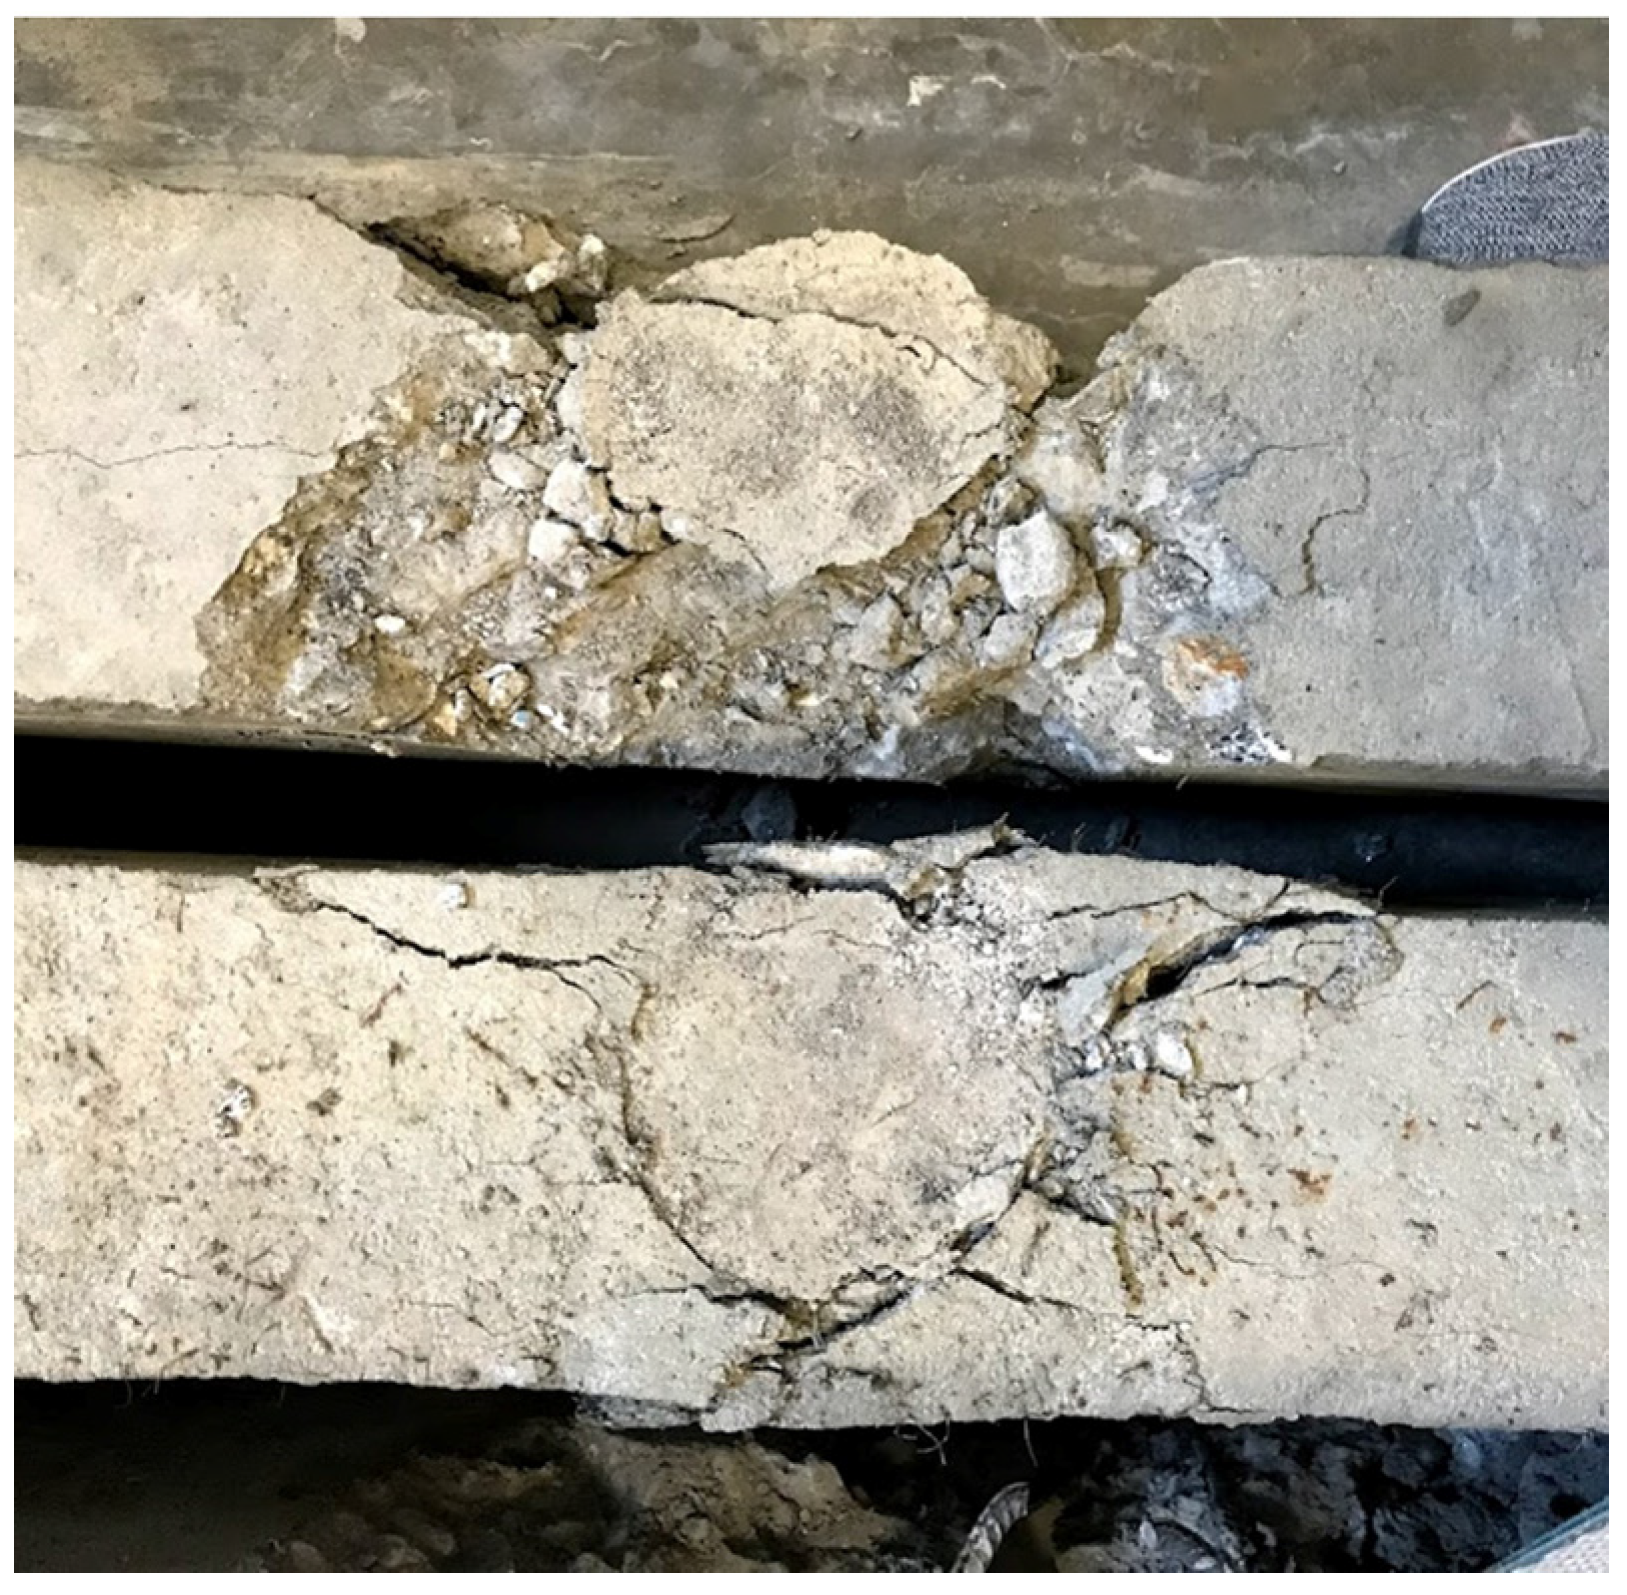
  • The Combination 2 impact beam, despite having lower compressive strength, demonstrated improved impact resistance over the 40% PR impact beam, distributing a significantly larger portion of the impact force. Additionally, the C2 beam did not suffer any significant section loss, due to the fibers bridging cracks that developed.

6. Conclusions

This study investigated the performance of Portland cement concrete incorporating powdered rubber, recycled and industrial steel fiber, and a combination of rubber products and steel fibers, particularly for the purpose of improving impact resistance. From a small-scale drop impact test, it is concluded that recycled fibers are more effective than industrial fibers when the 0.25% fiber volume fraction is used. It is also concluded that a combination mixture improved impact resistance over control mixtures, due to their high rubber count. In a larger-scale beam test including both the static and impact beam specimens, the recycled steel fibers in the combination (of rubber products) beam demonstrated improved flexural capacity and impact resistance, acting as a sufficient replacement for industrial steel fiber. The powdered rubber mixture, despite the 40% replacement of fine aggregate with the rubber product, did not improve impact resistance for larger beams.

7. Future Work

Further investigation of recycled steel fiber concrete, as well as mixtures incorporating a combination of recycled steel fiber and waste tire products, is recommended. It is also recommended that the modulus of elasticity is determined in the future. Investigative mixtures incorporating recycled steel fiber alone demonstrated improved impact resistance as well as compressive strength when compared to industrially available steel fiber at similar dosages. Additionally, recycled steel fibers present environmental benefits as well as economic benefits when compared to industrial steel fibers. Furthermore, while the second combination mixture, TC10/CR10/PR10/RSF0.25, demonstrated improved impact resistance, it also experienced reduced compressive strength. Future work should investigate combination mixtures with lower rubber concentrations, in an attempt to find a balance between improved impact resistance and sufficient compressive strength.

Author Contributions

The authors confirm contribution to the paper as follows: methodology, S.M.T., H.F.H., S.A.D., M.G.C.; laboratory tests, S.M.T., M.G.C., S.A.D.; data analysis & paper writing, S.M.T., H.F.H., S.A.D., M.G.C. All authors have read and agreed to the published version of the manuscript.

Funding

The study presented in this paper was conducted by the University of Georgia and was funded by the Georgia Department of Transportation (GDOT) RP 17-09.

Acknowledgments

The authors extend our sincere appreciation to GDOT staff and engineers that supported this research. The funding sponsors had no role in the design, analyzes, or interpretation of data. The opinions, findings, and conclusions may not reflect the views of the funding agency or other individuals.

Conflicts of Interest

The authors have no implicit or explicit conflict of interest of any kind in this study.

References

  1. U.S. Tire Manufacturers Association (U.S. TMA). 2017 U.S. Scrap Tire Management Summary. Available online: https://www.ustires.org/ (accessed on 12 August 2020).
  2. United States Environmental Protection Agency (U.S. EPA). Scrap Tires: Handbook on Recycling Applications and Management for the U.S. and Mexico. Available online: https://nepis.epa.gov/Exe/ZyPURL.cgi?Dockey=P100ACUU.TXT (accessed on 12 August 2020).
  3. Jones, K.; Durham, S.A. Benefical Uses of Buffed Rubber as Fiber Mesh in Concrete Mixtures. Int. J. Constr. Environ. 2013, 2, 113–124. [Google Scholar] [CrossRef]
  4. Stallings, K.A.; Durham, S.A.; Chorzepa, M.G. Effect of cement content and recycled rubber particle size on the performance of rubber-modified concrete. Int. J. Sustain. Eng. 2019, 12, 189–200. [Google Scholar] [CrossRef]
  5. Lopez, V. Impact Performance of Recycled Tire Chip and Fiber Reinforced Cementitious Composites for Use in Concrete. Master’s Thesis, The University of Georgia, Athens, GA, USA, March 2018. [Google Scholar]
  6. Darling, G. Structural Behavior of TL-4 Recycled Tire Chip and Fiber Reinforced Concrete Single Slope Barriers. Master’s Thesis, The University of Georgia, Athens, GA, USA, March 2019. [Google Scholar]
  7. Eldin, N.N.; Senouci, A. Rubber? Tire Particles as Concrete Aggregate. J. Mater. Civ. Eng. 1993, 5, 478–496. [Google Scholar] [CrossRef]
  8. Youssf, O.; Hassanli, R.; Mills, J.E.; Skinner, W.M.; Ma, X.; Zhuge, Y.; Roychand, R.; Gravina, R. Influence of Mixing Procedures, Rubber Treatment, and Fibre Additives on Rubcrete Performance. J. Compos. Sci. 2019, 3, 41. [Google Scholar] [CrossRef] [Green Version]
  9. Smarzewski, P. Study of Toughness and Macro/Micro-Crack Development of Fibre-Reinforced Ultra-High Performance Concrete after Exposure to Elevated Temperature. Materials 2019, 12, 1210. [Google Scholar] [CrossRef] [Green Version]
  10. He, L.; Ma, Y.; Liu, Q.; Mu, Y. Surface Modification of Crumb Rubber and Its Influence on the Mechanical Properties of Rubber-Cement Concrete. Constr. Build. Mater. 2016, 120, 403–407. [Google Scholar] [CrossRef]
  11. Noaman, A.T.; Abu Bakar, B.; Akil, H.M. The Effect of Combination Between Crumb Rubber and Steel Fiber on Impact Energy of Concrete Beams. Procedia Eng. 2015, 125, 825–831. [Google Scholar] [CrossRef] [Green Version]
  12. Zheng, L.; Huo, X.S.; Yuan, Y. Experimental Investigation on Dynamic Properties of Rubberized Concrete. Constr. Build. Mater. 2008, 22, 939–947. [Google Scholar] [CrossRef]
  13. Al-Tayeb, M.M.; Abu Bakar, B.H.; Ismail, H.; Akil, H.M. Impact Resistance of Concrete with Partial Replacements of Sand and Cement by Waste Rubber. Polym. Technol. Eng. 2012, 51, 1230–1236. [Google Scholar] [CrossRef]
  14. Alabduljabbar, H.; Alyousef, R.; Alrshoudi, F.; Alaskar, A.; Fathi, A.; Mohamed, A.M. Mechanical Effect of Steel Fiber on the Cement Replacement Materials of Self-Compacting Concrete. Fibers 2019, 7, 36. [Google Scholar] [CrossRef] [Green Version]
  15. Torres, J.A.; Lantsoght, E.O. Influence of Fiber Content on Shear Capacity of Steel Fiber-Reinforced Concrete Beams. Fibers 2019, 7, 102. [Google Scholar] [CrossRef] [Green Version]
  16. Bezerra, A.C.D.S.; Maciel, P.S.; Corrêa, E.C.S.; Junior, P.R.R.S.; Aguilar, M.T.P.; Cetlin, P.R. Effect of High Temperature on the Mechanical Properties of Steel Fiber-Reinforced Concrete. Fibers 2019, 7, 100. [Google Scholar] [CrossRef] [Green Version]
  17. Gupta, T.; Sharma, R.K.; Chaudhary, S. Impact resistance of concrete containing waste rubber fiber and silica fume. Int. J. Sustain. Eng. 2015, 83, 76–87. [Google Scholar]
  18. Atahan, A.O.; Sevim, U.K. Testing and Comparison of Concrete Barriers Containing Shredded Waste Tire Chips. Mater. Lett. 2008, 62, 3754–3757. [Google Scholar] [CrossRef]
  19. Elchalakani, M. High Strength Rubberized Concrete Containing Silica Fume for the Construction of Sustainable Road Side Barriers. Structures 2015, 1, 20–38. [Google Scholar] [CrossRef]
  20. Khaloo, A.R.; Dehestani, M.; Rahmatabadi, P. Mechanical Properties of Concrete Containing a High Volume of Tire–Rubber Particles. Waste Manag. 2008, 28, 2472–2482. [Google Scholar] [CrossRef]
  21. Khatib, Z.K.; Bayomy, F. Rubberized Portland Cement Concrete. J. Mater. Civ. Eng. 1999, 11, 206–213. [Google Scholar] [CrossRef]
  22. Raj, B.; Ganesan, N.; Shashikala, A. Engineering Properties of Self-Compacting Rubberized Concrete. J. Reinf. Plast. Compos. 2011, 30, 1923–1930. [Google Scholar] [CrossRef]
  23. Su, H.; Yang, J.; Ling, T.-C.; Ghataora, G.S.; Dirar, S. Properties of Concrete Prepared with Waste Tyre Rubber Particles of Uniform and Varying Sizes. J. Clean. Prod. 2015, 91, 288–296. [Google Scholar] [CrossRef] [Green Version]
  24. Kardos, A.J. Beneficial Use of Crumb Rubber in Concrete Mixtures. Master’s Thesis, University of Colorado at Denver, Denver, CO, USA, October 2011. [Google Scholar]
  25. Siddique, R.; Naik, T.R. Properties of Concrete Containing Scrap-Tire Rubber—An Overview. Waste Manag. 2004, 24, 563–569. [Google Scholar] [CrossRef]
  26. Kardos, A.J.; Durham, S.A. Strength, Durability, and Environmental Properties of Concrete Utilizing Recycled Tire Particles for Pavement Applications. Constr. Build. Mater. 2015, 98, 832–845. [Google Scholar] [CrossRef]
  27. Liu, R.; Zhang, L. Utilization of Waste Tire Rubber Powder in Concrete. Compos. Interfaces 2015, 22, 823–835. [Google Scholar] [CrossRef]
  28. Aiello, M.A.; Leuzzi, F. Waste Tyre Rubberized Concrete: Properties at Fresh and Hardened State. Waste Manag. 2010, 30, 1696–1704. [Google Scholar] [CrossRef] [PubMed]
  29. Aiello, M.A.; Leuzzi, F.; Centonze, G.; Maffezzoli, A. Use of Steel Fibres Recovered from Waste Tyres As Reinforcement in Concrete: Pull-Out Behaviour, Compressive and Flexural Strength. Waste Manag. 2009, 29, 1960–1970. [Google Scholar] [CrossRef]
  30. Tlemat, H. Steel Fibres from Waste Tyres to Concrete: Testing, Modelling and Design. Master’s Thesis, University of Sheffield, Sheffield, UK, May 2004. [Google Scholar]
  31. Buratti, N.; Mazzotti, C.; Savoia, M. Post-Cracking Behaviour of Steel and Macro-Synthetic Fibre-Reinforced Concretes. Constr. Build. Mater. 2011, 25, 2713–2722. [Google Scholar] [CrossRef]
  32. Mohammadi, Y.; Singh, S.P.; Kaushik, S. Properties of Steel Fibrous Concrete Containing Mixed Fibres in Fresh and Hardened State. Constr. Build. Mater. 2008, 22, 956–965. [Google Scholar] [CrossRef]
  33. Olivito, R.; Zuccarello, F. An Experimental Study on the Tensile Strength of Steel Fiber Reinforced Concrete. Compos. Part B Eng. 2010, 41, 246–255. [Google Scholar] [CrossRef]
  34. Centonze, G.; Leone, M.; Aiello, M. Steel Fibers from Waste Tires as Reinforcement in Concrete: A Mechanical Characterization. Constr. Build. Mater. 2012, 36, 46–57. [Google Scholar] [CrossRef]
  35. American Society for Testing and Materials (ASTM). ASTM C33/C33M-18, Standard Specification for Concrete Aggregates. Available online: https://www.astm.org/Standards/C33 (accessed on 12 August 2020).
  36. American Society for Testing and Materials (ASTM). ASTM D6270-17, Standard Practice for Use of Scrap Tires in Civil Engineering Applications. Available online: https://www.astm.org/Standards/D6270.htm (accessed on 12 August 2020).
  37. American Society for Testing and Materials (ASTM). ASTM C31/C31M-18b, Standard Practice for Making and Curing Concrete Test Specimens in the Field. Available online: https://www.astm.org/DATABASE.CART/HISTORICAL/C31C31M-18B.htm (accessed on 12 August 2020).
  38. American Society for Testing and Materials (ASTM). ASTM C39/C39M-18, Standard Test Method for Compressive Strength of Cylindrical Concrete Specimens. Available online: https://www.astm.org/DATABASE.CART/HISTORICAL/C39C39M-18.htm (accessed on 12 August 2020).
  39. American Association of State Highway and Transportation Officials (AASHTO). AASHTO T 22M/T 22 Standard Method of Test for Compressive Strength of Cylindrical Concrete Specimens. Available online: https://standards.globalspec.com/std/10159810/AASHTO%20T%2022 (accessed on 12 August 2020).
  40. American Society for Testing and Materials (ASTM). ASTM C78/C78M-18, Standard Test Method for Flexural Strength of Concrete (Using Simple Beam with Third-Point Loading). Available online: https://www.astm.org/Standards/C78 (accessed on 12 August 2020).
  41. American Concrete Institute (ACI). ACI 544.2R Report on the Measurement of Fresh State Properties and Fiber Dispersion of Fiber-Reinforced Concrete. Available online: https://www.concrete.org/store/productdetail.aspx?ItemID=544217&Language=English&Units=US_AND_METRIC (accessed on 12 August 2020).
  42. Mindess, S.; Young, J.F.; Darwin, D. Concrete, 2nd ed.; Prentice-Hall: Upper Saddle River, NJ, USA, 2003. [Google Scholar]
  43. Chorzepa, M.G.; Masud, M.; Yaghoobi, A.; Jiang, H. Impact Test: Multiscale Fiber-Reinforced Concrete Including Polypropylene and Steel Fibers. ACI Struct. J. 2017, 114, 1429–1444. [Google Scholar] [CrossRef]
Figure 1. A U.S. quarter with a dimeter of 24.26 mm (0.96 inches) compared with (a) coarse aggregate and tire chip; (b) virgin fine aggregate [4] and crumb rubber; and (c) fine aggregate and powdered rubber; (d) gradation of recycled tire-chip; and (e) gradation of powered rubber.
Infrastructures 05 00082 g001aInfrastructures 05 00082 g001b
Figure 2. A U.S. quarter with a dimeter of 24.26 mm (0.96 inches) compared with (a) Recycled Steel Fiber; and (b) Dramix® 3D 45/35BL Steel Fibers.
Infrastructures 05 00082 g002
Figure 3. Impact drop hammer test on a disc: (a) apparatus and specimen setup; (b) 10 lb. drop hammer; and (c) crack results.
Infrastructures 05 00082 g003
Figure 4. Static beam specimen: (a) longitudinal section [5]; and (b) cross section.
Infrastructures 05 00082 g004
Figure 5. Static 3-point bending test setup.
Infrastructures 05 00082 g005
Figure 6. (a) Impact beam test setup; (b) elevation view of 6.1 m (20 ft.) vertical sleeve; (c) Impact drop weight; and (d) drop weight schematic.
Infrastructures 05 00082 g006aInfrastructures 05 00082 g006b
Figure 7. Total compressive strength gain of Phase I mixtures.
Infrastructures 05 00082 g007
Figure 8. Load-displacement of static beams.
Infrastructures 05 00082 g008
Figure 9. 40% powered rubber (PR) static beam: (a) prior to static testing; (b) after static testing; (c) failure; (d) steel buckling fracture; and (e) section loss.
Infrastructures 05 00082 g009
Figure 10. Combination 2 static beam: (a) after static testing; (b) failure; and (c); top view.
Infrastructures 05 00082 g010
Figure 11. PR40 impact beam: (a) damage; and (b) close up (Left: Marker 1; Right: Marker 2).
Infrastructures 05 00082 g011
Figure 12. 40% PR beam: (a) impact force; and (b) displacement time histories.
Infrastructures 05 00082 g012
Figure 13. Combination 2 impact beam: (a) damage; and (b) close up (Left: Marker 1; Right: Marker 2).
Infrastructures 05 00082 g013
Figure 14. Combination 2 beam: (a) impact force; and (b) displacement time histories.
Infrastructures 05 00082 g014
Figure 15. Top view of 40% PR (top) and Combination 2 (bottom) impact beams.
Infrastructures 05 00082 g015
Table 1. Phase I powdered rubber mixture design matrix.
Mixture IDw/cCementitious Content
kg/m3 (lb/yd3)
% Sand Volume% Powdered Rubber Volume
0.42/635/100FA/0PR/0RSF0.42375 (635)1000
0.42/635/90FA/10PR/0RSF0.42375 (635)9010
0.42/635/80FA/20PR/0RSF0.42375 (635)8020
0.42/635/70FA/30PR/0RSF0.42375 (635)7030
0.42/635/60FA/40PR/0RSF0.42375 (635)6040
0.42/635/50FA/50PR/0RSF0.42375 (635)5050
Table 2. Phase I steel fiber mixture design matrix.
Mixture IDw/cCementitious Content
kg/m3 (lb/yd3)
% (Volume) Recycled Steel Fiber (RSF)% (Volume) Industrial Steel Fiber (ISF)
0.42/635/100FA/0PR/0.10RSF0.42375 (635)0.100.00
0.42/635/100FA/0PR/0.25RSF0.42375 (635)0.250.00
0.42/635/100FA/0PR/0.10ISF0.42375 (635)0.000.10
0.42/635/100FA/0PR/0.25ISF0.42375 (635)0.000.25
Table 3. Phase I Combination mixture design matrix.
Mixture IDw/cCementitious Content
kg/m3 (lb/yd3)
% Tire Chip% Crumb Rubber% Powdered Rubber% Recycled Steel Fiber
Combination 1: 0.42/635/90CA/80FA/10TC/10CR/10PR/0RSF0.42375 (635)1010100.00
Combination 2: 0.42/635/90CA/80FA/10TC/10CR/10PR/0.25RSF0.42375 (635)1010100.25
Table 4. Phase II beam mixture design matrix.
Mixture IDw/cCementitious Content
kg/m3 (lb/yd3)
% Tire Chip% Crumb Rubber% Powdered Rubber% Recycled Steel Fiber
0.42/635/100CA/60FA/0TC/0CR/40PR0.42375 (635)00400
0.42/635/90CA/80FA/10TC/10CR/10PR/0.25RSF0.42375 (635)1010100.25
Table 5. Fresh concrete property results for Phase I mixtures.
Mixture DescriptionSlump, mm
(in.)
Temperature, °C
(F°)
Unit Weight, kg/m3
(lb/ft3)
Air Content, %
Control139.7 (5.50)16.2 (61.2)2361.1 (147.4)5.2
10% PR152.4 (6.00)18.7 (65.7)2329.1 (145.4)4.5
20% PR31.75 (1.25)10.9 (51.6)2300.3 (143.6)4.5
30% PR44.45 (1.75)11.2 (52.2)2274.6 (142.0)4.5
40% PR44.45 (1.75)22.7 (72.9)2258.6 (141.0)4.5
50% PR44.45 (1.75)25.5 (77.9)2210.6 (138.0)4.5
0.1% RSF95.25 (3.75)13.2 (55.8)2239.4 (139.8)9.0
0.25% RSF101.6 (4.00)16.0 (60.8)2364.3 (147.6)3.5
0.1% ISF114.3 (4.50)25.9 (78.7)2377.1 (148.4)3.5
0.25% ISF76.2 (3.00)18.0 (64.4)2377.1 (148.4)3.5
Combination 176.2 (3.00)27.0 (80.6)2239.4 (139.8)4.0
Combination 2152.4 (6.00)28.3 (82.9)2220.2 (138.6)5.5
Table 6. Average compressive strength and flexural strength of Phase I mixtures.
Average Compressive Strength
MPa (psi)
Average MOR
MPa (psi)
Mixture Description1-Day7-Day28-Day28-Day
Control8.78 (1273) 26.86 (3895)31.45 (4562)4.56 (661)
10% PR10.16 (1474)28.76 (4171) 37.65 (5461)4.95 (718)
20% PR10.47 (1518)31.47 (4564)37.16 (5389)4.87 (707)
30% PR6.18 (896)25.15 (3647)28.77 (4173)4.63 (671)
40% PR7.49 (1086)22.46 (3257)28.12 (4078)4.09 (593)
50% PR3.77 (547)18.05 (2618)22.18 (3217)3.30 (479)
0.1% RSF15.91 (2307)31.87 (4622)35.31 (5121)5.36 (777)
0.25% RSF19.81 (2873)40.02 (5804)52.77 (7654)6.29 (912)
0.1% ISF23.95 (3473)40.78 (5914)48.97 (7102)5.23 (759)
0.25% ISF32.32 (4688)40.71 (5905)47.47 (6885)5.75 (834)
Combination 110.81 (1568)17.73 (2572)26.62 (3861)3.79 (549)
Combination 210.33 (1499)16.09 (2334)19.44 (2819)3.96 (574)
Table 7. Average drop hammer impact results (drop counts) of Phase I mixtures.
Mixture DescriptionInitial CrackControl FailureUltimate Failure
Control56.36.3
10% PR6.47.48.4
20% PR6.88.810.4
30% PR811.413
40% PR10.614.817.2
50% PR6.88.610
0.1% RSF5.5939
0.25% RSF14.333290
0.1% ISF6.339.3321
0.25% ISF9.6714.6758.33
Combination 15.3310.3327
Combination 216.3322.67229.33

