Experiences of Dynamic Identification and Monitoring of Bridges in Serviceability Conditions and after Hazardous Events


Abstract
:1. Introduction
2. Operational Modal Analysis and Applications to Bridges
2.1. Basics
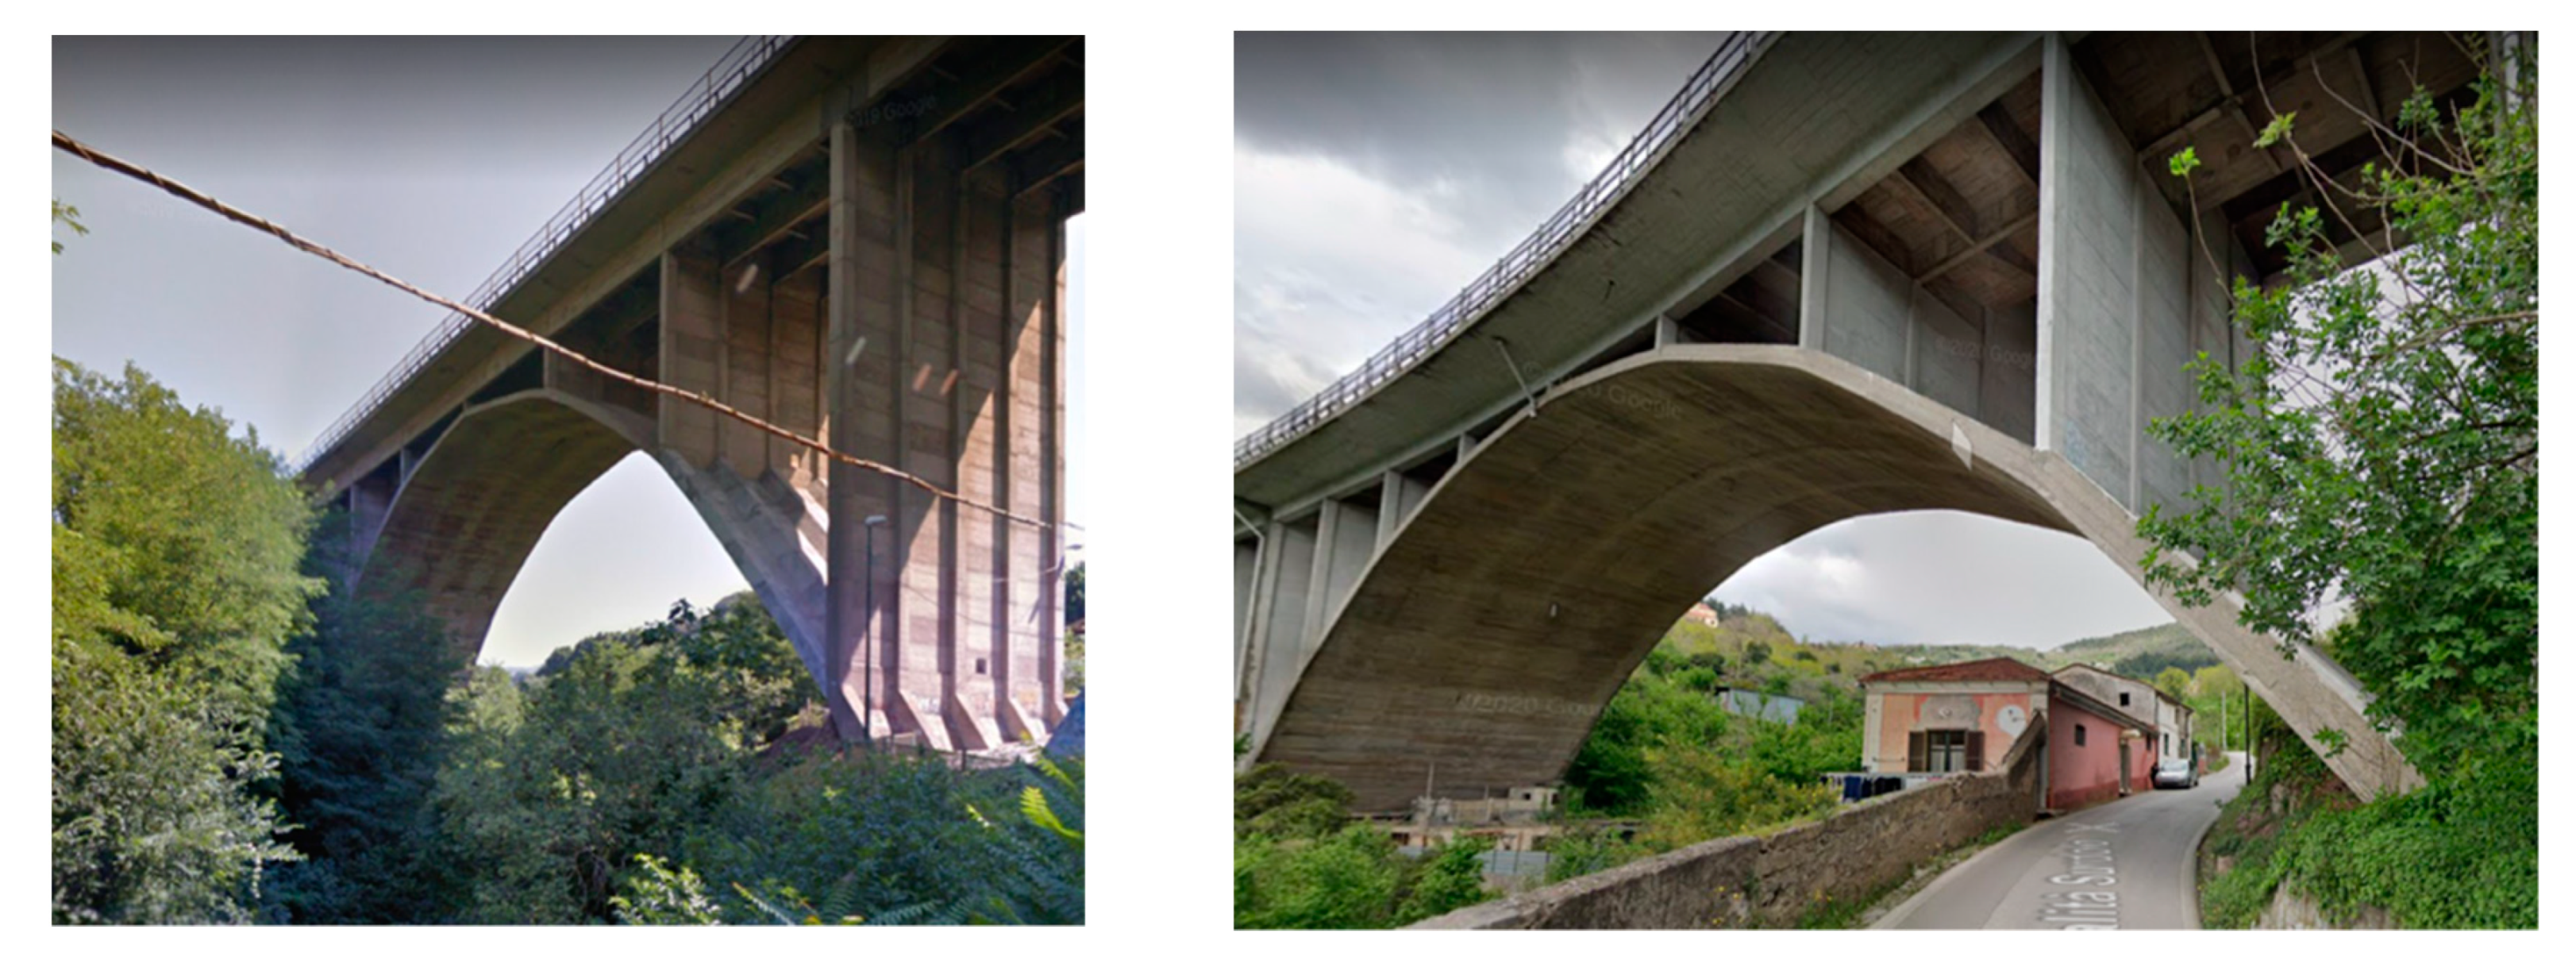
2.2. Output-Only Modal Identification of Arch Bridges
- Equation (1) relates the fundamental frequency and the span length s in m without any consideration of the associated mode shape (Figure 2a);
- Equation (2), based on a subset of the available data, applies to the bridges showing vertical antisymmetric mode shapes associated to the fundamental frequency (Figure 2b).
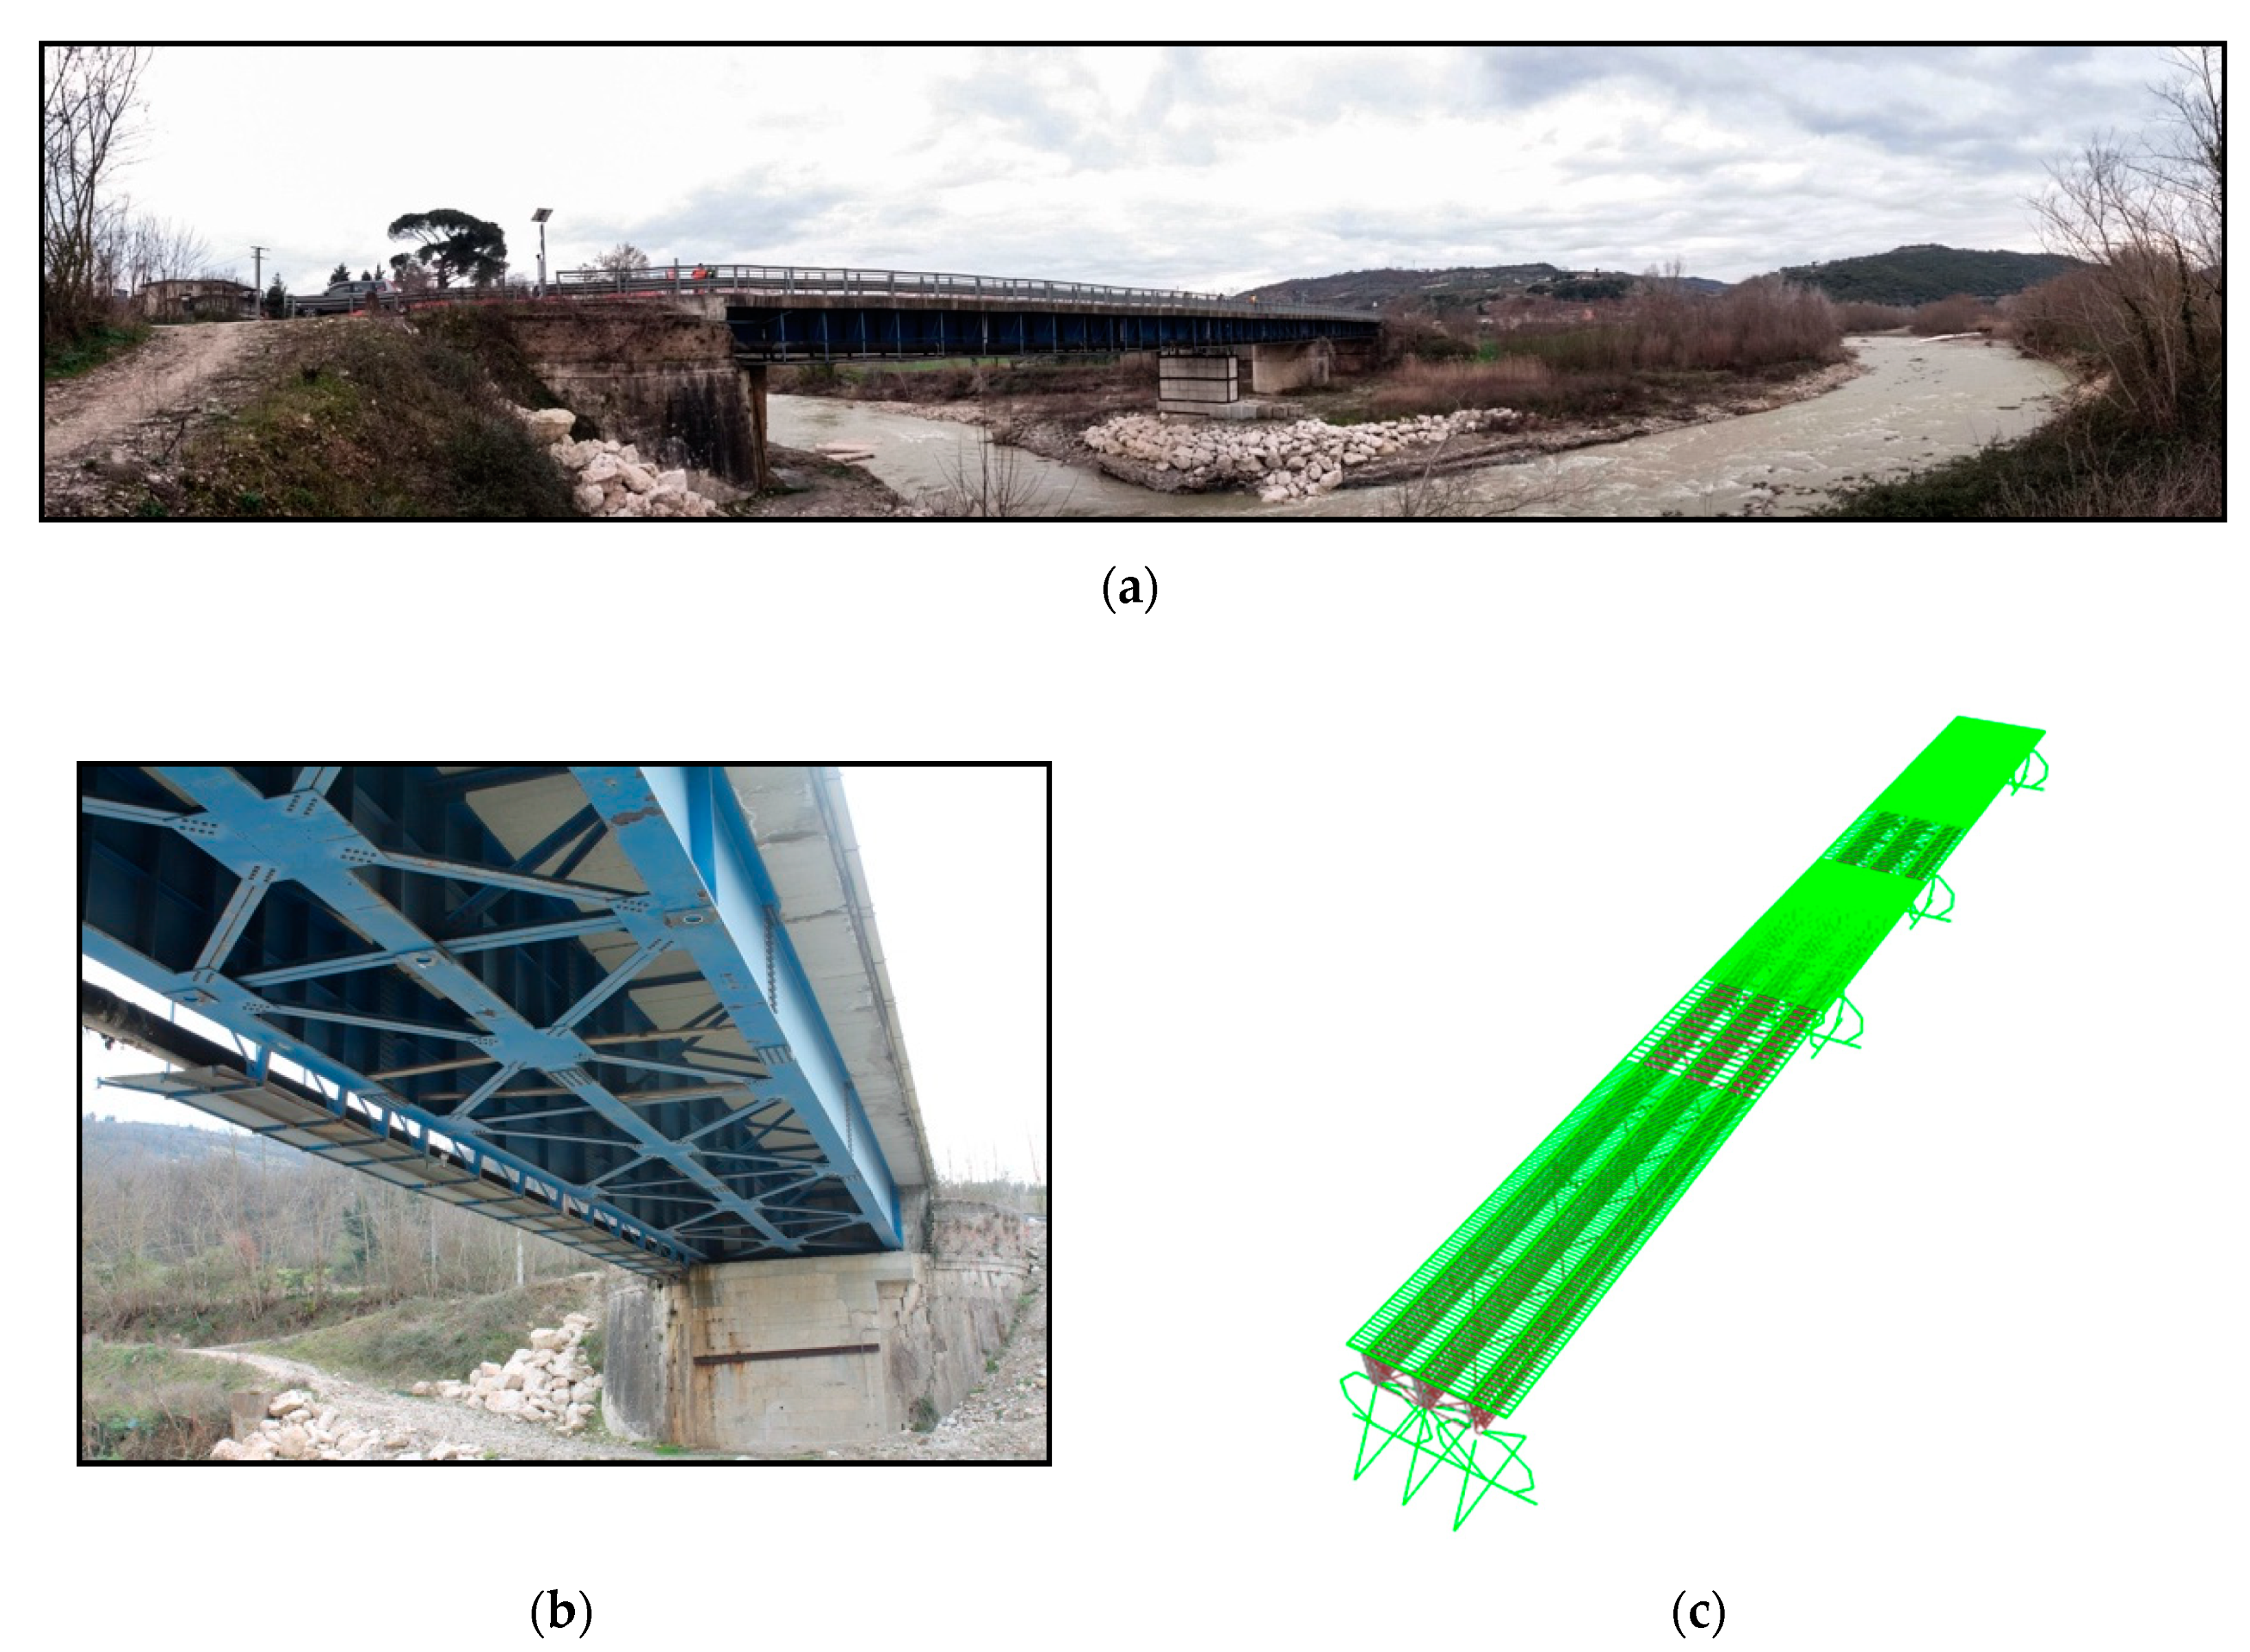
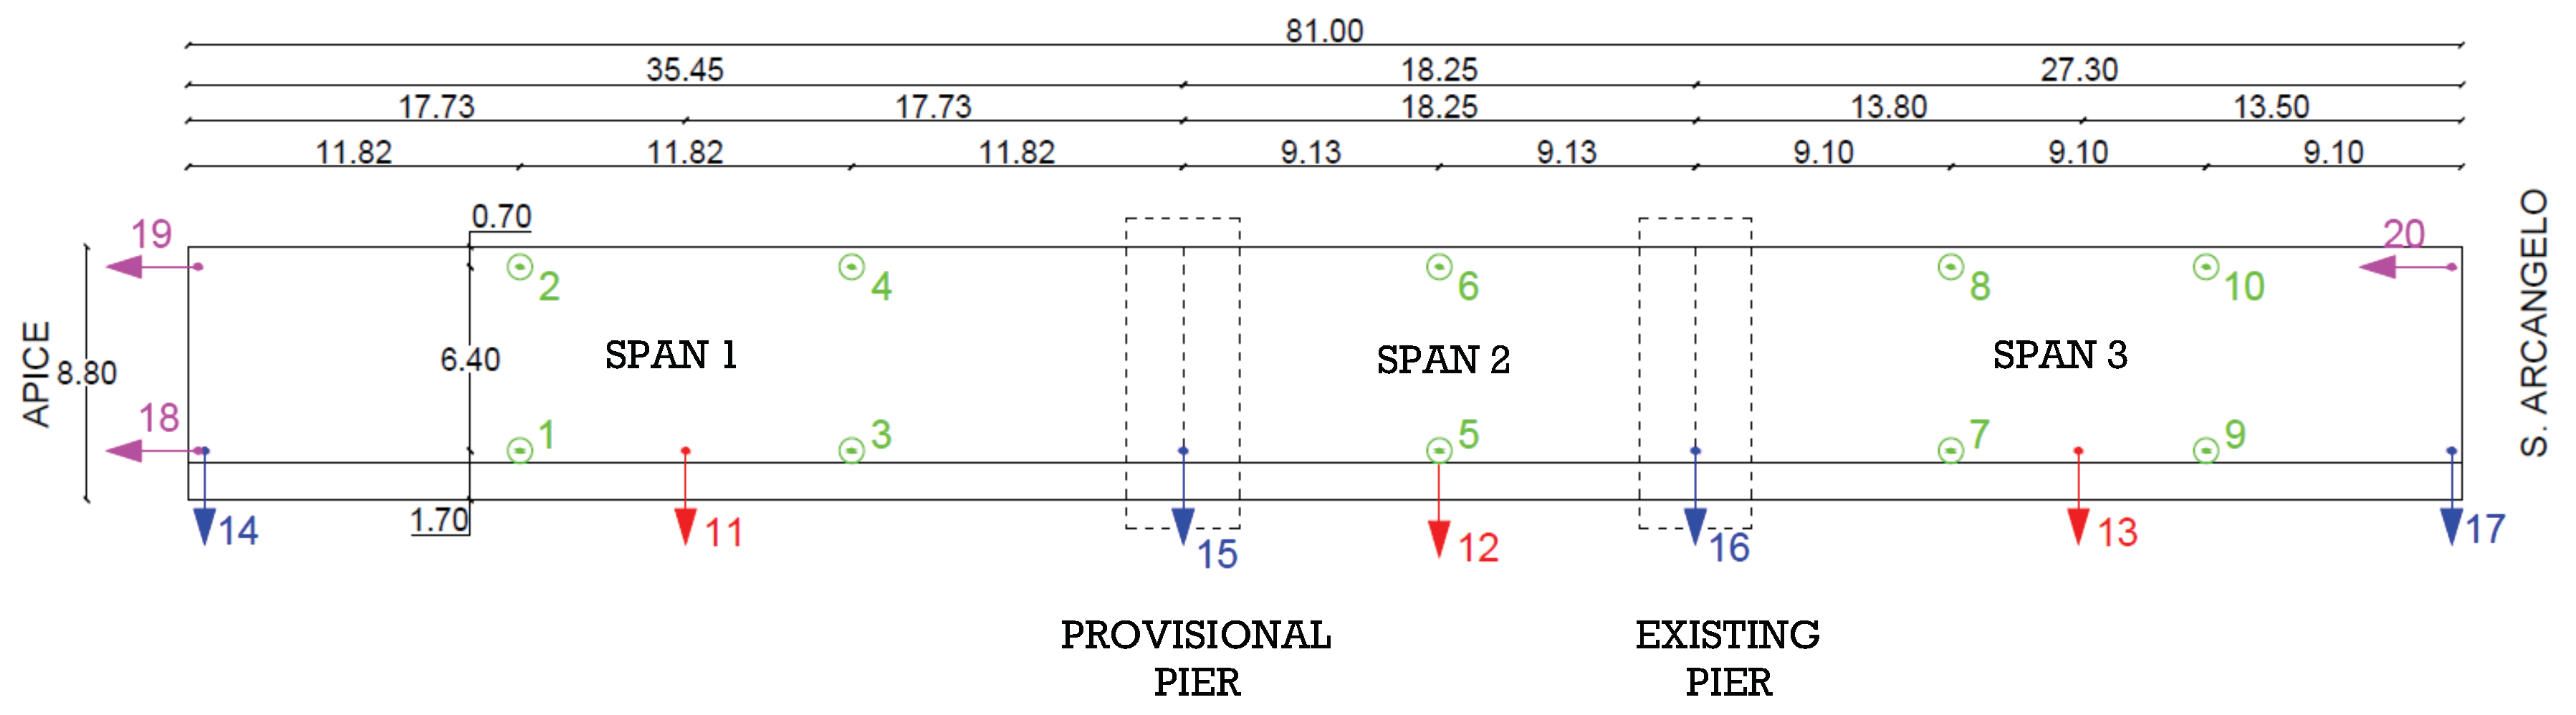
2.3. Model Validation
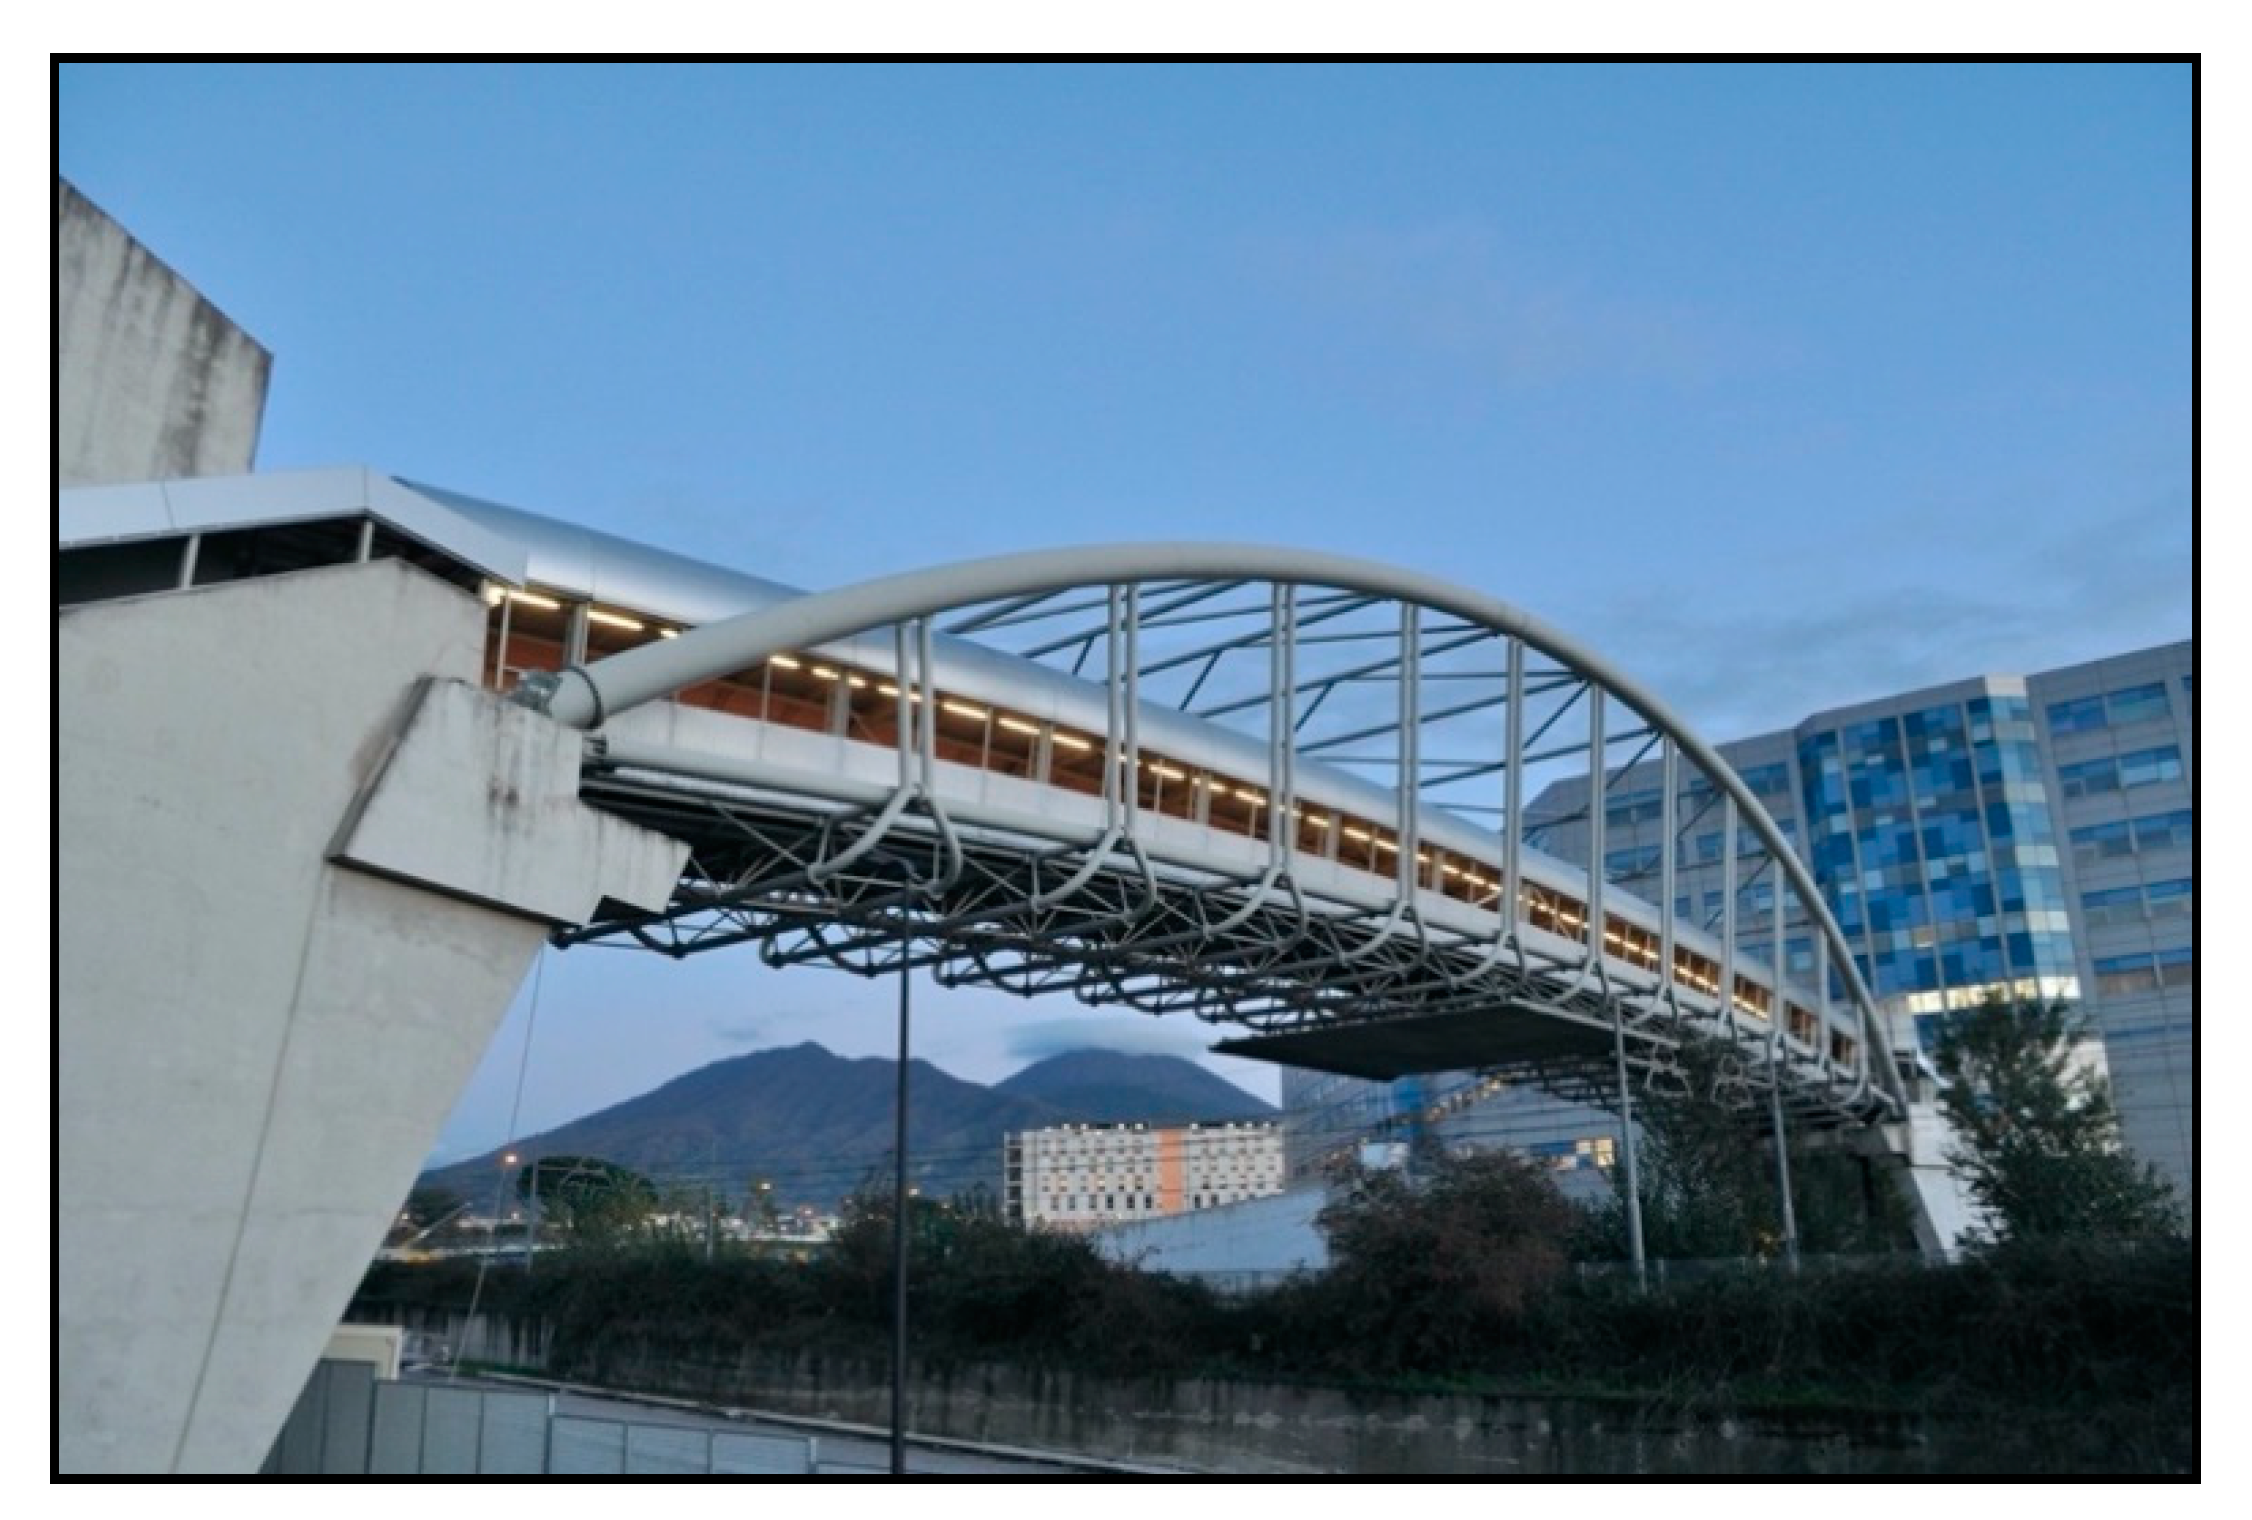
2.4. Vibration Serviceability Assessment of a Footbridge
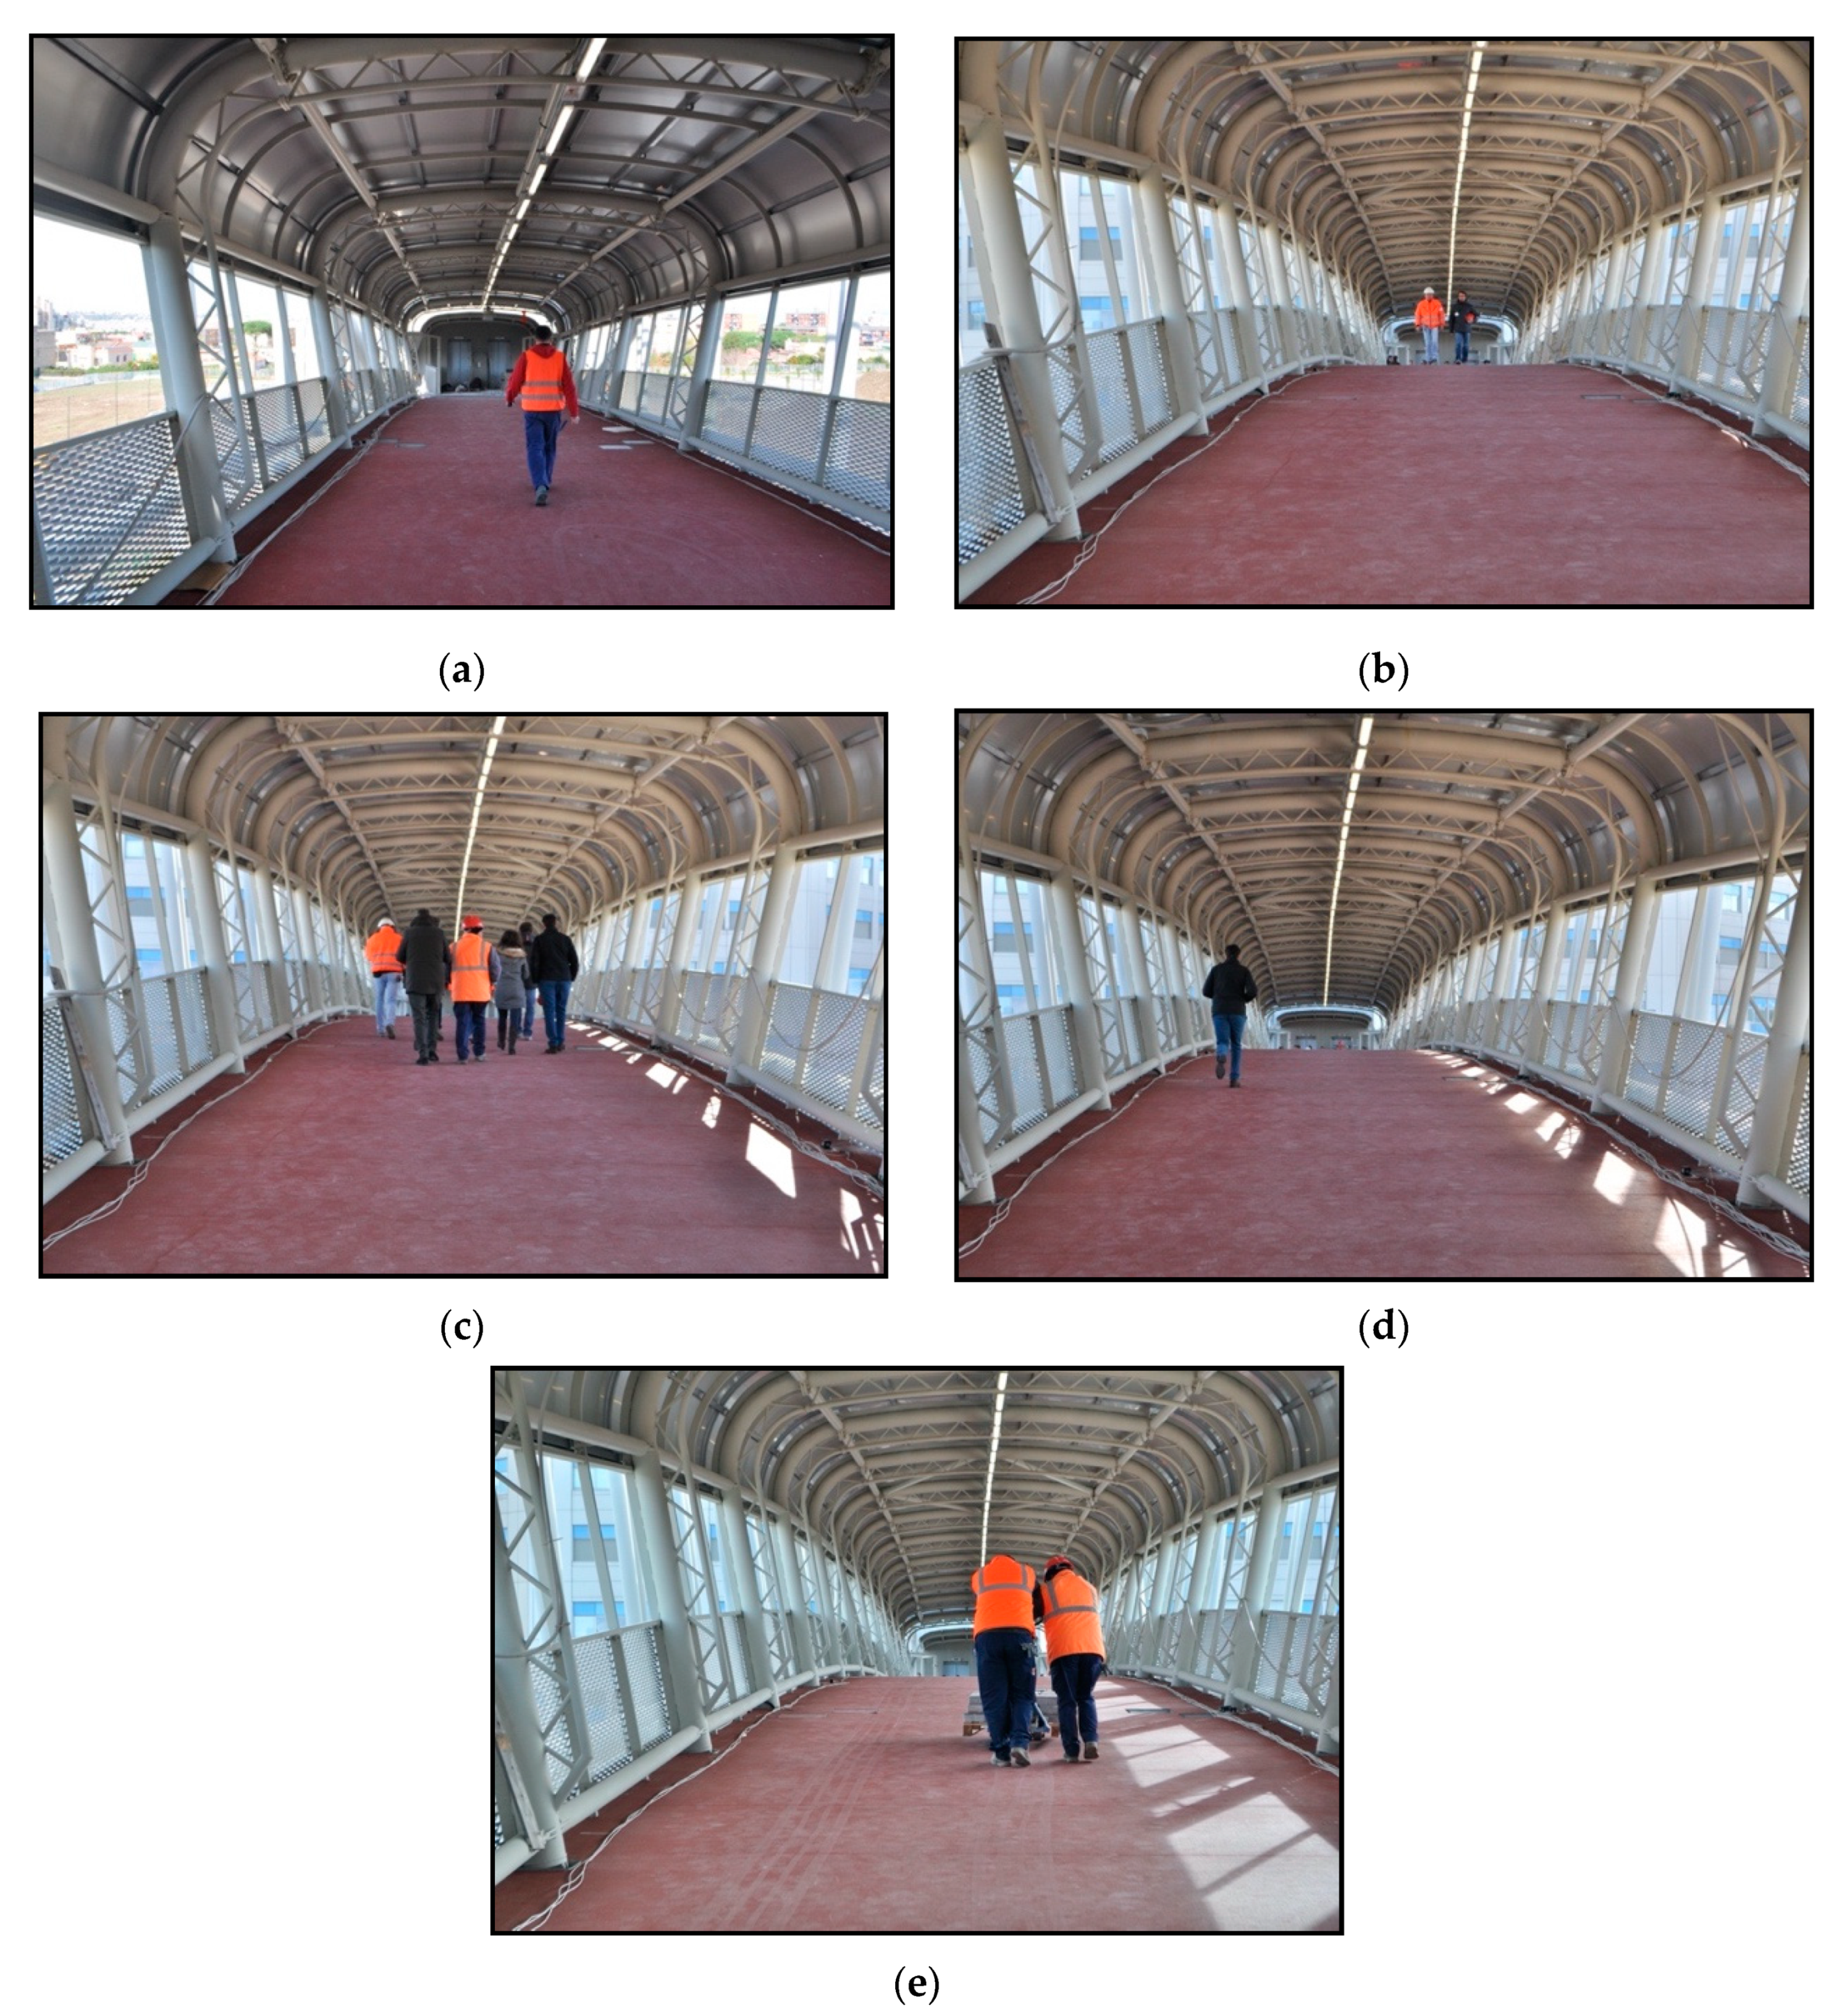
- 1 pedestrian walking along the middle of the deck—1p wm—(Figure 8a);
- 1 pedestrian walking along one side of the deck—1p ws;
- 2 pedestrians walking along the middle of the deck—2p wm—(Figure 8b);
- 2 pedestrians walking along one side of the deck—2p ws;
- 5 pedestrians walking along the middle of the deck—5p wm;
- 5 pedestrians walking along one side of the deck—5p ws;
- 10 pedestrians walking along the middle of the deck, one way—10p wo—(Figure 8c);
- 10 pedestrians walking along one side of the deck, return—10p wr;
- 1 pedestrian running along the middle of the deck—1p rm;
- 1 pedestrian running along one side of the deck—1p rs—(Figure 8d);
- 2 pedestrians with a loaded trolley walking along the middle of the deck to simulate the passage of stretcher bearers—2t wm—(Figure 8e);
- 2 pedestrians with a loaded trolley walking along one side of the deck to simulate the passage of stretcher bearers—2t ws;
- 2 pedestrians with a loaded trolley running along the middle of the deck to simulate the passage of stretcher bearers—2t rm;
- 2 pedestrians with a loaded trolley running along one side of the deck to simulate the passage of stretcher bearers—2t rs.
3. Modal-Based Structural Health Monitoring and Applications to Bridges
3.1. Basics
3.2. Modal-Based Damage Detection
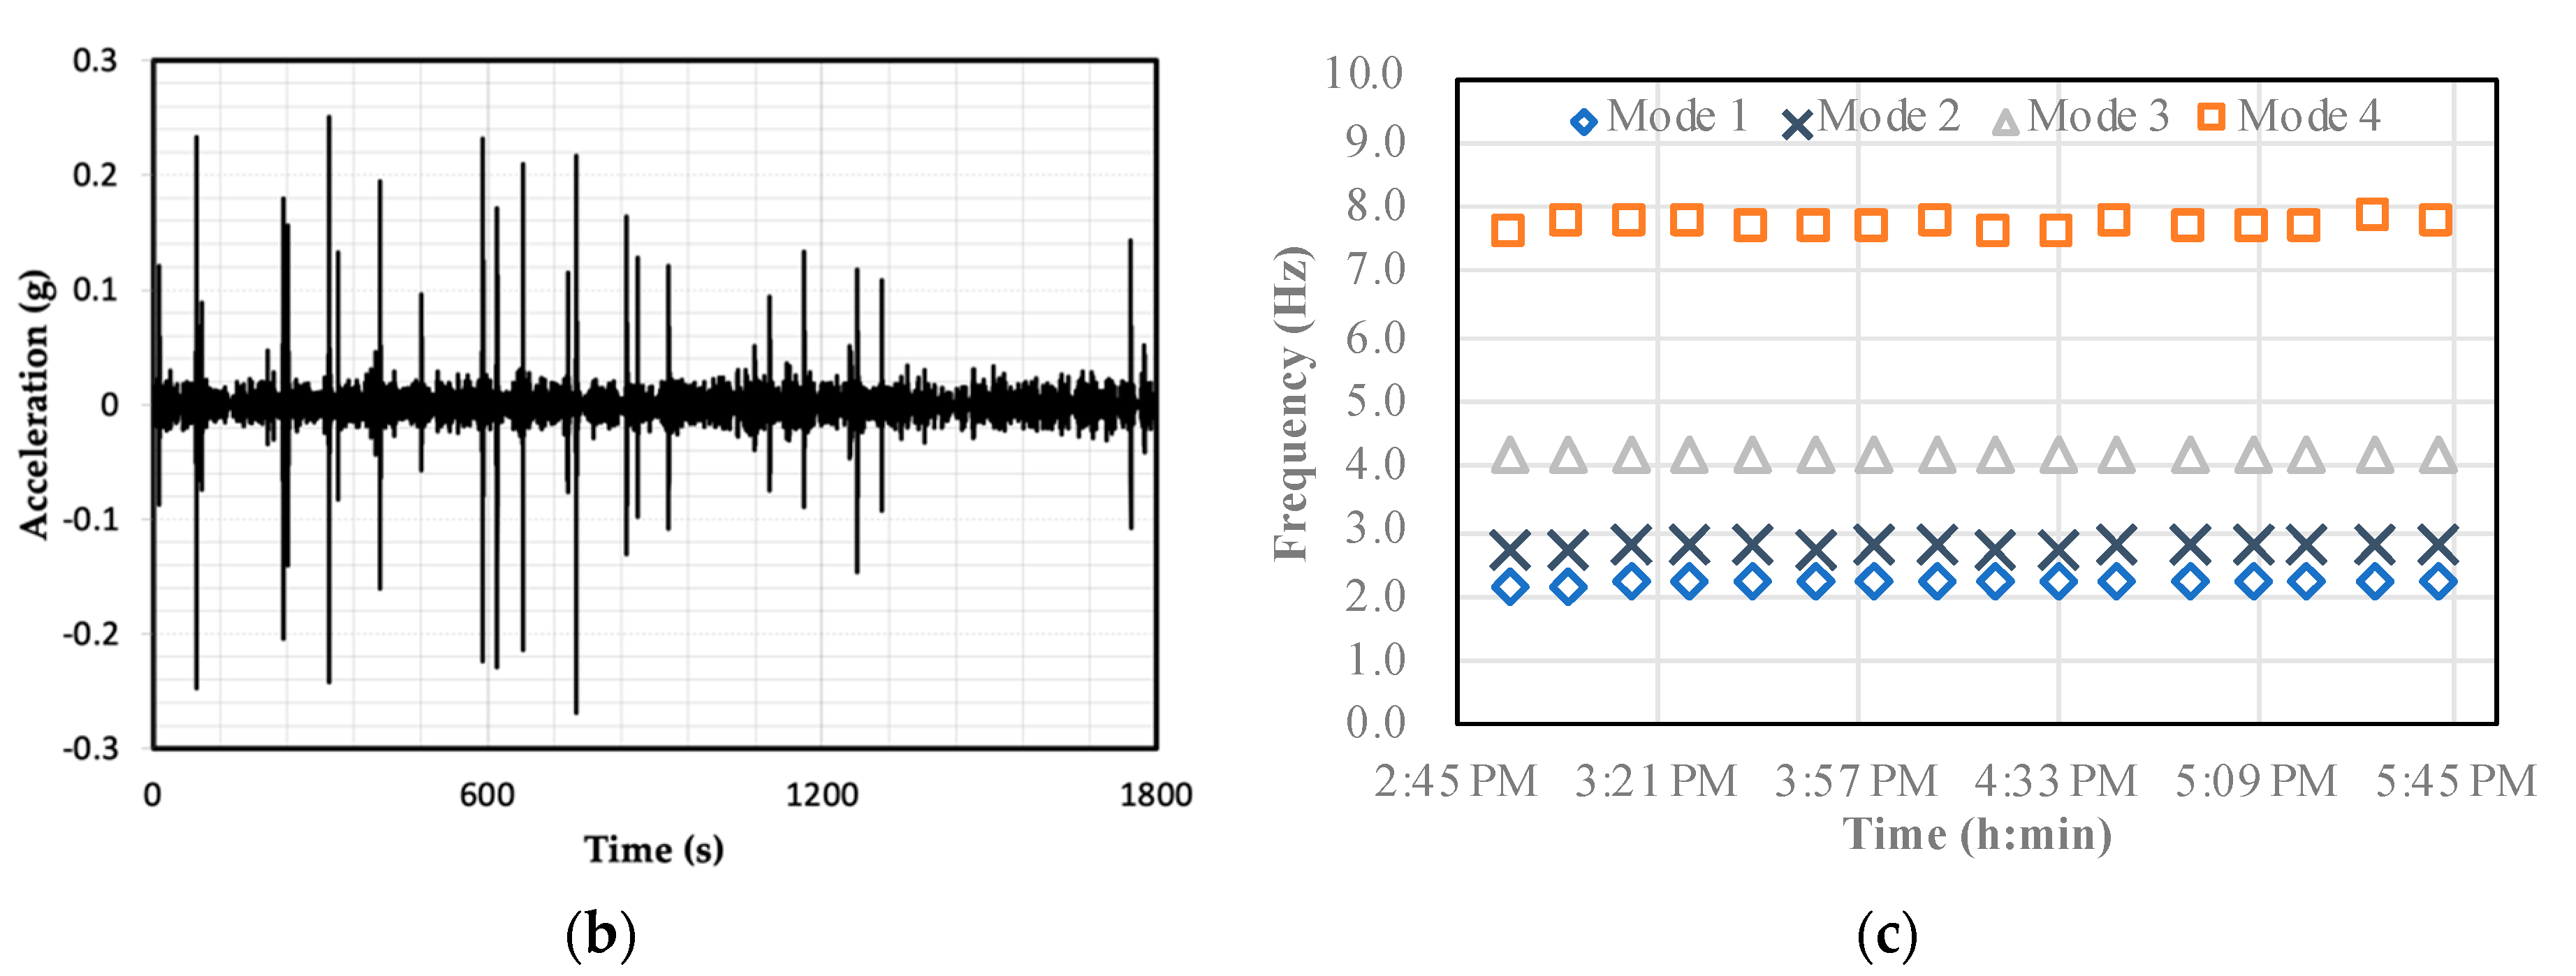
3.3. Traffic-Induced Transient Response
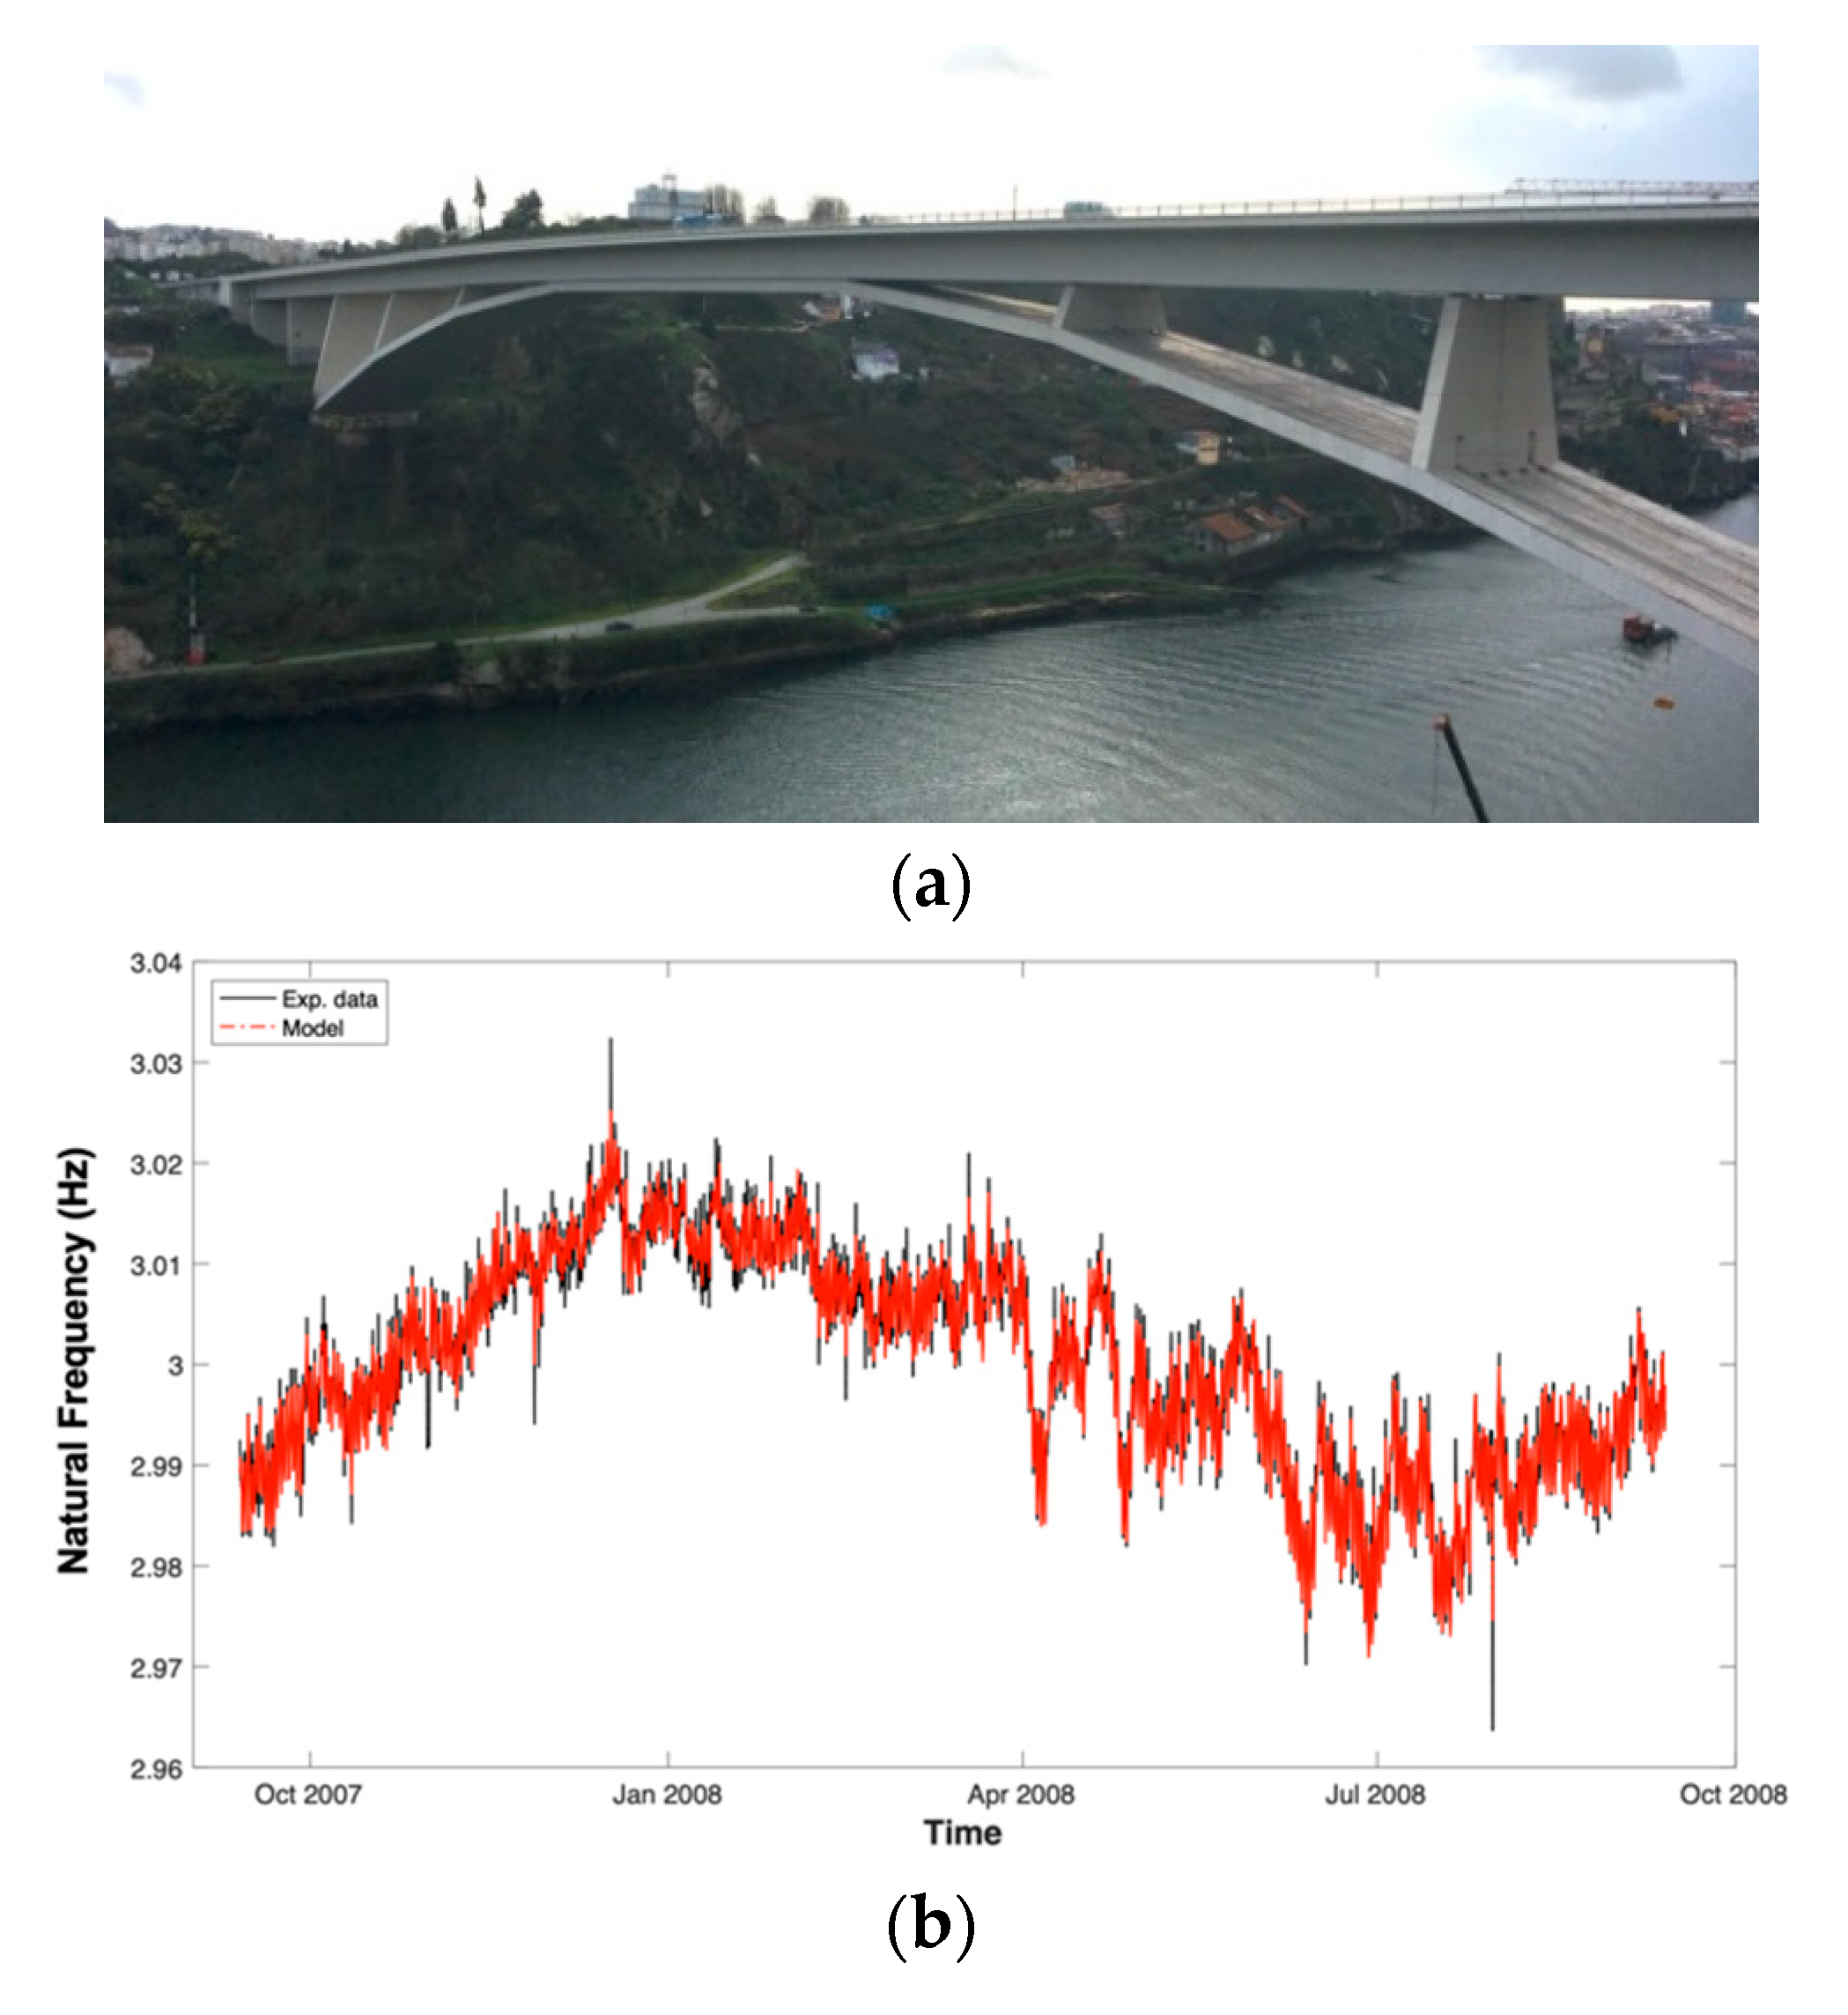
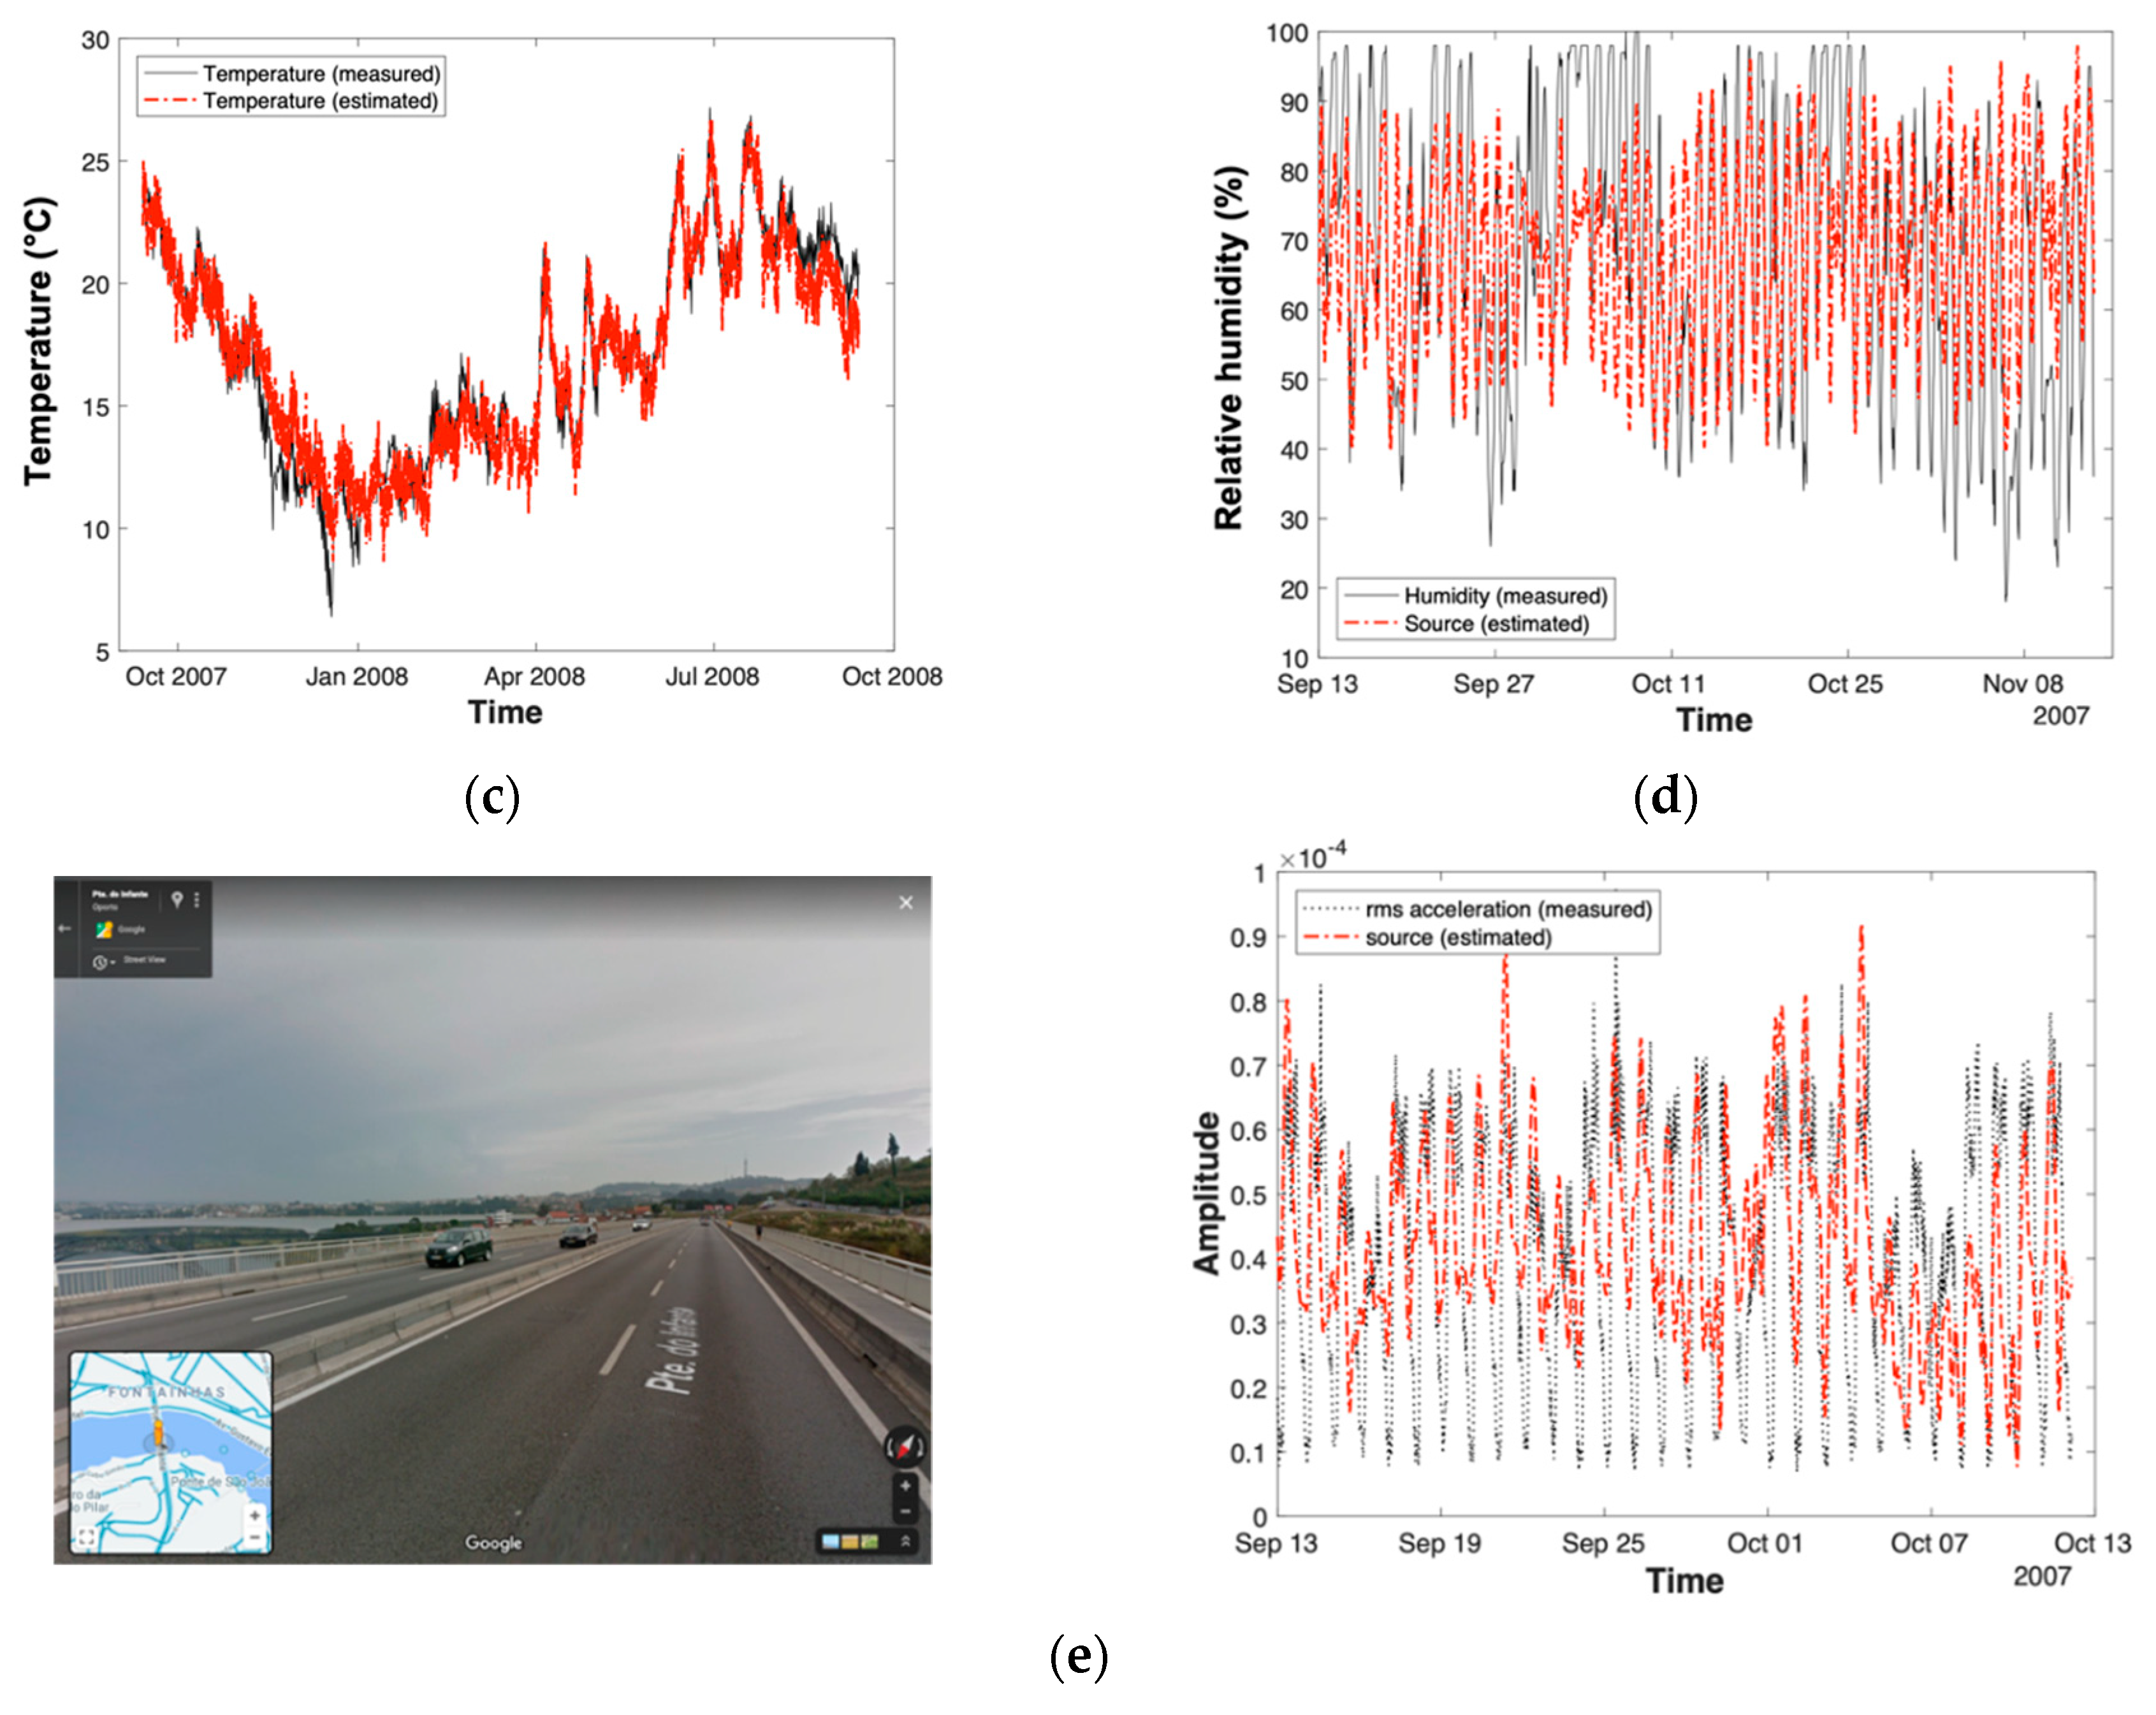
3.4. Compensation of Environmental Effects
4. Summary and Final Remarks
Author Contributions
Funding
Acknowledgments
Conflicts of Interest
References
- Rainieri, C.; Fabbrocino, G. Operational Modal Analysis of Civil Engineering Structures: An Introduction and Guide for Applications; Springer: New York, NY, USA, 2014. [Google Scholar]
- Magalhaes, F.; Cunha, A. Explaining operational modal analysis with data from an arch bridge. Mech. Syst. Signal. Process. 2011, 25, 1431–1450. [Google Scholar] [CrossRef] [Green Version]
- Reynders, E.; De Roeck, G. Reference-based combined deterministic-stochastic subspace identification for experimental and operational modal analysis. Mech. Syst. Signal. Process. 2008, 22, 617–637. [Google Scholar] [CrossRef]
- Magalhaes, F.; Cunha, A.; Caetano, E.; Brincker, R. Damping estimation using free decays and ambient vibration tests. Mech. Syst. Signal. Process. 2010, 24, 1274–1290. [Google Scholar] [CrossRef] [Green Version]
- Cunha, A.; Caetano, E.; Calcada, R.; De Roeck, G.; Peeters, B. Dynamic Measurements on Bridges. Design, Rehabilitation and Monitoring. Bridge Eng. 2003, 156, 135–148. [Google Scholar] [CrossRef]
- Brownjohn, J.M.W.; Moyo, P.; Omenzetter, P.; Lu, Y. Assessment of highway bridge upgrading by dynamic testing and finite-element model updating. J. Bridge Eng. 2003, 8, 162–172. [Google Scholar] [CrossRef]
- Ministero delle Infrastrutture e dei Trasporti–Consiglio Superiore dei Lavori Pubblici. Circolare n.7 del 21/01/2019–Istruzioni per l’applicazione dell’«Aggiornamento delle “Norme tecniche per le costruzioni”» di cui al decreto ministeriale 17 gennaio 2018; Ministero delle Infrastrutture e dei Trasporti: Rome, Italy, 2019. (In Italian)
- Caetano, E.; Cunha, A.; Magalhaes, F.; Moutinho, C. Studies for controlling human-induced vibration of the Pedro e Ines footbridge, Portugal. Part 1: Assessment of dynamic behaviour. Eng. Struct. 2010, 32, 1069–1081. [Google Scholar] [CrossRef]
- Caetano, E.; Cunha, A.; Moutinho, C.; Magalhaes, F. Studies for controlling human-induced vibration of the Pedro e Ines footbridge, Portugal. Part 2: Implementation of tuned mass dampers. Eng. Struct. 2010, 32, 1082–1091. [Google Scholar] [CrossRef]
- Van Nimmen, K.; Lombaert, G.; De Roeck, G.; Van den Broeck, P. Vibration serviceability of footbridges: Evaluation of the current codes of practice. Eng. Struct. 2014, 59, 448–461. [Google Scholar] [CrossRef]
- Saidou Sanda, M.; Gauron, O.; Turcotte, N.; Lamarche, C.-P.; Paultre, P.; Talbot, M.; Laflamme, J.-F. Efficient finite elements model updating for damage detection in bridges. In Proceedings of the 7th International Conference on Experimental Vibration Analysis for Civil Engineering Structures, San Diego, CA, USA, 12–14 July 2017; pp. 293–305. [Google Scholar]
- Teughels, A.; De Roeck, G. Structural damage identification of the highway bridge Z24 by FE model updating. J. Sound Vib. 2004, 278, 589–610. [Google Scholar] [CrossRef]
- Scozzese, F.; Ragni, L.; Tubaldi, E.; Gara, F. Modal properties variation and collapse assessment of masonry arch bridges under scour action. Eng. Struct. 2019, 199, 109665. [Google Scholar] [CrossRef]
- Ministero delle Infrastrutture e dei Trasporti–Consiglio Superiore dei Lavori Pubblici. Linee guida per la classificazione e gestione del rischio, la valutazione della sicurezza ed il monitoraggio dei ponti esistenti; Ministero delle Infrastrutture e dei Trasporti: Rome, Italy, 2020.
- Rainieri, C.; Fabbrocino, G. Automated output-only dynamic identification of civil engineering structures. Mech. Syst. Signal. Process. 2010, 24, 678–695. [Google Scholar] [CrossRef]
- Rainieri, C.; Fabbrocino, G. Development and validation of an automated operational modal analysis algorithm for vibration-based monitoring and tensile load estimation. Mech. Syst. Signal. Process. 2015, 60–61, 512–534. [Google Scholar] [CrossRef]
- Marques, F.; Cunha, A.; Caetano, E.; Moutinho, C.; Magalhaes, F. Analysis of dynamic and fatigue effects in an old metallic riveted bridge. J. Constr. Steel Res. 2014, 99, 85–101. [Google Scholar] [CrossRef] [Green Version]
- UNI Ente Italiano di Normazione. UNI/TR 11634–Linee Guida per il monitoraggio strutturale/Guidelines for Structural Health Monitoring; Ente Italiano di Normazione: Milan, Italy, 2016. [Google Scholar]
- Magalhaes, F.; Cunha, A.; Caetano, E. Vibration based structural health monitoring of an arch bridge: From automated OMA to damage detection. Mech. Syst. Signal. Process. 2012, 28, 212–228. [Google Scholar] [CrossRef]
- Gentile, C.; Saisi, A. Continuous dynamic monitoring of a centenary iron bridge for structural modification assessment. Front. Struct. Civ. Eng. 2014, 9, 26–41. [Google Scholar] [CrossRef]
- Herlufsen, H.; Andersen, P.; Gade, S.; Møller, N. Identification techniques for Operational Modal Analysis–An overview and practical experiences. In Proceedings of the 1st International Operational Modal Analysis Conference, Copenhagen, Denmark, 26–27 April 2005. [Google Scholar]
- Brincker, R.; Zhang, L.; Andersen, P. Modal identification of output-only systems using frequency domain decomposition. Smart Mater. Struct. 2001, 10, 441–445. [Google Scholar] [CrossRef] [Green Version]
- Van Overschee, P.; De Moor, B. Subspace Identification for Linear Systems: Theory–Implementation–Applications; Kluwer Academic Publishers: Dordrecht, The Netherlands, 1996. [Google Scholar]
- Jacobsen, N.-J.; Andersen, P.; Brincker, R. Applications of frequency domain curve-fitting in the EFDD technique. In Proceedings of the 26th International Modal Analysis Conference, Orlando, FL, USA, 4–7 February 2008. [Google Scholar]
- Peeters, B.; Van der Auweraer, H. PolyMAX: A revolution in operational modal analysis. In Proceedings of the 1st International Operational Modal Analysis Conference, Copenhagen, Denmark, 26–27 April 2005. [Google Scholar]
- Rainieri, C. Perspectives of Second-Order Blind Identification for Operational Modal Analysis of civil structures. Shock Vib. 2014, 2014. [Google Scholar] [CrossRef]
- Benedettini, F.; Zulli, D.; Alaggio, R. Frequency-veering and mode hybridization in arch bridges. In Proceedings of the XXVII International Modal Analysis Conference, Orlando, FL, USA, 9–12 February 2009. [Google Scholar]
- Benedettini, F.; Alaggio, R.; Manetta, P. Arch bridges in Provincia di Teramo: Tests, identification and numerical models. In Proceedings of the 1st International Operational Modal Analysis Conference, Copenhagen, Denmark, 26–27 April 2005. [Google Scholar]
- Bayraktar, A.; Turker, T.; Altunisik, A.C. Experimental frequencies and damping ratios for historical masonry arch bridges. Constr. Build. Mater. 2015, 75, 234–241. [Google Scholar] [CrossRef]
- Ubertini, F.; Materazzi, A.L.; Gentile, C.; Pelliccia, F. Automatic identification of modal parameters: Application to a reinforced concrete arch bridge. In Proceedings of the 5th European Conference on Structural Control, Genoa, Italy, 18–20 June 2012. [Google Scholar]
- Marrongelli, G.; Magalhaes, F.; Cunha, A. Automated Operational Modal Analysis of an arch bridge considering the influence of the parametric methods inputs. Procedia Eng. 2017, 199, 2172–2177. [Google Scholar] [CrossRef]
- Computers & Structures, Inc. CSI Analysis Reference Manual for SAP2000®; ETABS®, SAFE® and CSiBridge®: Walnut Creek, CA, USA, 2017. [Google Scholar]
- Pecce, M.R.; Ielardi, A.; Fabbrocino, G.; Rainieri, C. Modellazione dinamica e analisi modale operazionale di un ponte composto. In Proceedings of the Atti XXV Congresso Collegio dei Tecnici dell’Acciaio (CTA 2015), Salerno, Italy, 1–3 October 2015. (In Italian). [Google Scholar]
- Rainieri, C.; Fabbrocino, G. Influence of model order and number of block rows on accuracy and precision of modal parameter estimates in stochastic subspace identification. Int. J. Lifecycle Perform. Eng. 2014, 1, 317–334. [Google Scholar] [CrossRef]
- Živanovicć, S.; Pavicć, A.; Reynolds, P. Vibration serviceability of footbridges under human-induced excitation: A literature review. J. Sound Vib. 2005, 279, 1–74. [Google Scholar] [CrossRef] [Green Version]
- Cuevas, R.G.; Jimenez-Alonso, J.F.; Martinez, F.; Diaz, I.M. Assessment of the Lateral Vibration Serviceability Limit State of Slender Footbridges Including the Postlock-in Behaviour. Appl. Sci. 2020, 10, 967. [Google Scholar] [CrossRef] [Green Version]
- HIVOSS. Floor Vibrations–Human Induced Vibrations of Steel Structures. Design of Footbridges Guideline, RFS2-CT-2007–00033; Publications Office of the European Union: Luxembourg, UK, 2008. [Google Scholar]
- BSI – British Standards Institutions. UK National Annex to Eurocode 1: Actions on Structures–Part 2: Traffic Loads on Bridges, BS NAEN; 1991-2; BSI: London, UK, 2004. [Google Scholar]
- SETRA—The Technical Department for Transports, Roads and Bridges Engineering and Road Safety. Assessment of Vibrational Behavior of Footbridges under Pedestrian Loading; Technical Guide SETRA: Paris, France, 2006.
- Bendat, J.S.; Piersol, A.G. Random Data: Analysis and Measurement Procedures; John Wiley & Sons: New York, NY, USA, 1986. [Google Scholar]
- Farrar, C.R.; Worden, K. Structural Health Monitoring: A Machine Learning Perspective; John Wiley and Sons Ltd.: Chichester, UK, 2012. [Google Scholar]
- Ubertini, F.; Comanducci, G.; Cavalagli, N.; Pisello, A.L.; Materazzi, A.L.; Cotana, F. Environmental effects on natural frequencies of the San Pietro bell tower in Perugia, Italy, and their removal for structural performance assessment. Mech. Syst. Signal. Process. 2017, 82, 307–322. [Google Scholar] [CrossRef]
- Cross, E.J.; Koo, K.Y.; Brownjohn, J.M.W.; Worden, K. Long-term monitoring and data analysis of the Tamar Bridge. Mech. Syst. Signal. Process. 2013, 35, 16–34. [Google Scholar] [CrossRef] [Green Version]
- Mustafa, S.; Matsumoto, Y.; Yamaguchi, H. Vibration-Based Health Monitoring of an Existing Truss Bridge Using Energy-Based Damping Evaluation. J. Bridge Eng. 2018, 23, 04017114. [Google Scholar] [CrossRef]
- Allemang, R.J.; Brown, D.L. A Correlation Coefficient for Modal Vector Analysis. In Proceedings of the 1st International Modal Analysis Conference, Orlando, FL, USA, 8–10 November 1982; pp. 110–116. [Google Scholar]
- Lieven, N.A.J.; Ewins, D.J. Spatial Correlation of Mode Shapes, The Coordinate Modal Assurance Criterion (COMAC). In Proceedings of the 6th International Modal Analysis Conference, Kissimmee, FL, USA, 1–4 February 1988; pp. 690–695. [Google Scholar]
- Pandey, A.; Biswas, M.; Samman, M. Damage detection from changes in curvature mode shapes. J. Sound Vib. 1991, 145, 321–332. [Google Scholar] [CrossRef]
- Stubbs, N.; Kim, J.T.; Topole, K. An efficient and robust algorithm for damage localization in offshore platforms. In Proceedings of the ASCE Tenth Structures Congress, San Antonio, TX, USA, 13–15 April 1992; pp. 543–546. [Google Scholar]
- Pandey, A.; Biswas, M. Damage detection in structures using changes in flexibility. J. Sound Vib. 1994, 169, 3–17. [Google Scholar] [CrossRef]
- Limongelli, M.P. The interpolation damage detection method for frames under seismic excitation. J. Sound Vib. 2011, 330, 5474–5489. [Google Scholar] [CrossRef]
- Limongelli, M.P.; Giordano, P.F. Vibration--based damage indicators: A comparison based on information entropy. J. Civ. Struct. Health Monit. 2020, 10, 251–266. [Google Scholar] [CrossRef]
- Rainieri, C.; Gargaro, D.; Fabbrocino, G.; Maddaloni, G.; Di Sarno, L.; Prota, A.; Manfredi, G. Shaking table tests for the experimental verification of the effectiveness of an automated modal parameter monitoring system for existing bridges in seismic areas. Struct. Control. Health Monit. 2018, 25. [Google Scholar] [CrossRef]
- Soyoz, S.; Feng, M.Q. Long-term monitoring and identification of bridge structural parameters. Comput. Aided Civ. Infrastruct. Eng. 2008, 24, 82–92. [Google Scholar] [CrossRef]
- Magalhaes, F.; Cunha, A.; Caetano, E. Online automatic identification of the modal parameters of a long span arch bridge. Mech. Syst. Signal. Process. 2009, 23, 316–329. [Google Scholar] [CrossRef]
- De Roeck, G.; Maeck, J.; Michielsen, T.; Seynaeve, E. Traffic-induced shifts in modal properties of bridges. Proc. SPIE Int. Soc. Opt. Eng. 2002, 4753, 630–636. [Google Scholar]
- Sohn, H. Effects of environmental and operational variability on structural health monitoring. Philos. Trans. R. Soc. A 2007, 365, 539–560. [Google Scholar] [CrossRef]
- Brady, S.P.; O’ Brien, E.J.; Znidaric, A. Effect of Vehicle Velocity on the Dynamic Amplification of a Vehicle Crossing a Simply Supported Bridge. J. Bridge Eng. 2006, 11, 241–249. [Google Scholar] [CrossRef]
- Peeters, B.; Maeck, J.; De Roeck, G. Vibration-based damage detection in civil engineering: Excitation sources and temperature effects. Smart Mater. Struct. 2001, 10, 518–527. [Google Scholar] [CrossRef]
- Ni, Y.; Hua, X.; Fan, K.; Ko, J. Correlating modal properties with temperature using long-term monitoring data and support vector machine technique. Eng. Struct. 2005, 27, 1762–1773. [Google Scholar] [CrossRef]
- Sohn, H.; Dzwonczyk, M.; Straser, E.; Law, K.; Meng, T.; Kiremidjian, A. Adaptive modeling of environmental effects in modal parameters for damage detection in civil structures. Proc. SPIE Int. Soc. Opt. Eng. 1998, 3325, 127–138. [Google Scholar]
- Ni, Y.; Zhou, H.; Ko, J. Generalization capability of neural network models for temperature-frequency correlation using monitoring data. J. Struct. Eng. 2009, 135, 1290–1300. [Google Scholar] [CrossRef]
- Zhou, H.F.; Ni, Y.Q.; Ko, J.M. Constructing input to neural networks for modeling temperature-caused modal variability: Mean temperatures, effective temperatures, and principal components of temperatures. Eng. Struct. 2010, 32, 1747–1759. [Google Scholar] [CrossRef]
- Deraemaeker, A.; Reynders, E.; De Roeck, G.; Kullaa, J. Vibration-based structural health monitoring using output-only measurements under changing environment. Mech. Syst. Signal. Process. 2008, 22, 34–56. [Google Scholar] [CrossRef] [Green Version]
- Yan, A.-M.; Kerschen, G.; De Boe, P.; Golinval, J.-C. Structural damage diagnosis under varying environmental conditions—Part I: A linear analysis. Mech. Syst. Signal. Process. 2005, 19, 847–864. [Google Scholar] [CrossRef]
- Reynders, E.; Wursten, G.; De Roeck, G. Output-only structural health monitoring in changing environmental conditions by means of nonlinear system identification. Struct. Health Monit. 2014, 13, 82–93. [Google Scholar] [CrossRef]
- Rainieri, C.; Magalhaes, F.; Gargaro, D.; Fabbrocino, G.; Cunha, A. Predicting the variability of natural frequencies and its causes by Second-Order Blind Identification. Struct. Health Monit. 2019, 18, 486–507. [Google Scholar] [CrossRef]


| Bridge Number | Total Length (m) | Span Length (m) | Rise Until the Crown (m) | f1 (Hz) | ϕ1 | f2 (Hz) | ϕ2 |
|---|---|---|---|---|---|---|---|
| I | 76.4 | 60.8 | 15.4 | 2.78 | V | 3.62 | H |
| II | 76 | 76 | 19.3 | 2.95 | H | 3.04 | V |
| III | 60.8 | 60.8 | 18 | 2.85 | V | 3.82 | H |
| IV | 140 | 120 | 32.5 | 1.32 | H | 1.45 | V |
| V | 60 | 60 | 20.8 | 2.53 | V | 3.38 | H |
| Bridge | Span (m) | fexp (Hz) | fcorr (Hz)—Equation (1) | fcorr (Hz)—Equation (2) |
|---|---|---|---|---|
| Montecastelli bridge [30] | 68.7 | 3.18 | 2.89 | 3.01 |
| Arch bridge in Portugal [31] | 80 | 2.11 | 2.20 | 2.38 |
| Mode | f (Hz) | ξ (%) | Mode Shape Description |
|---|---|---|---|
| I | 3.75 | 0.7 | Out-of-plane bending |
| II | 4.39 | 2.4 | In-plane bending |
| III | 5.40 | 1.2 | Torsion |
| IV | 5.90 | 2.0 | Out-of-plane bending |
| Mode | fexp (Hz) | fFEM (Hz) | Δf (%) | MAC |
|---|---|---|---|---|
| I | 3.75 | 3.55 | −5 | 0.97 |
| II | 4.39 | 3.58 | −18 | 0.97 |
| III | 5.40 | 5.97 | 11 | 0.85 |
| IV | 5.90 | 6.03 | 2 | 0.87 |
| Mode | f (Hz) | ξ (%) | Mode Shape | CrossMAC |
|---|---|---|---|---|
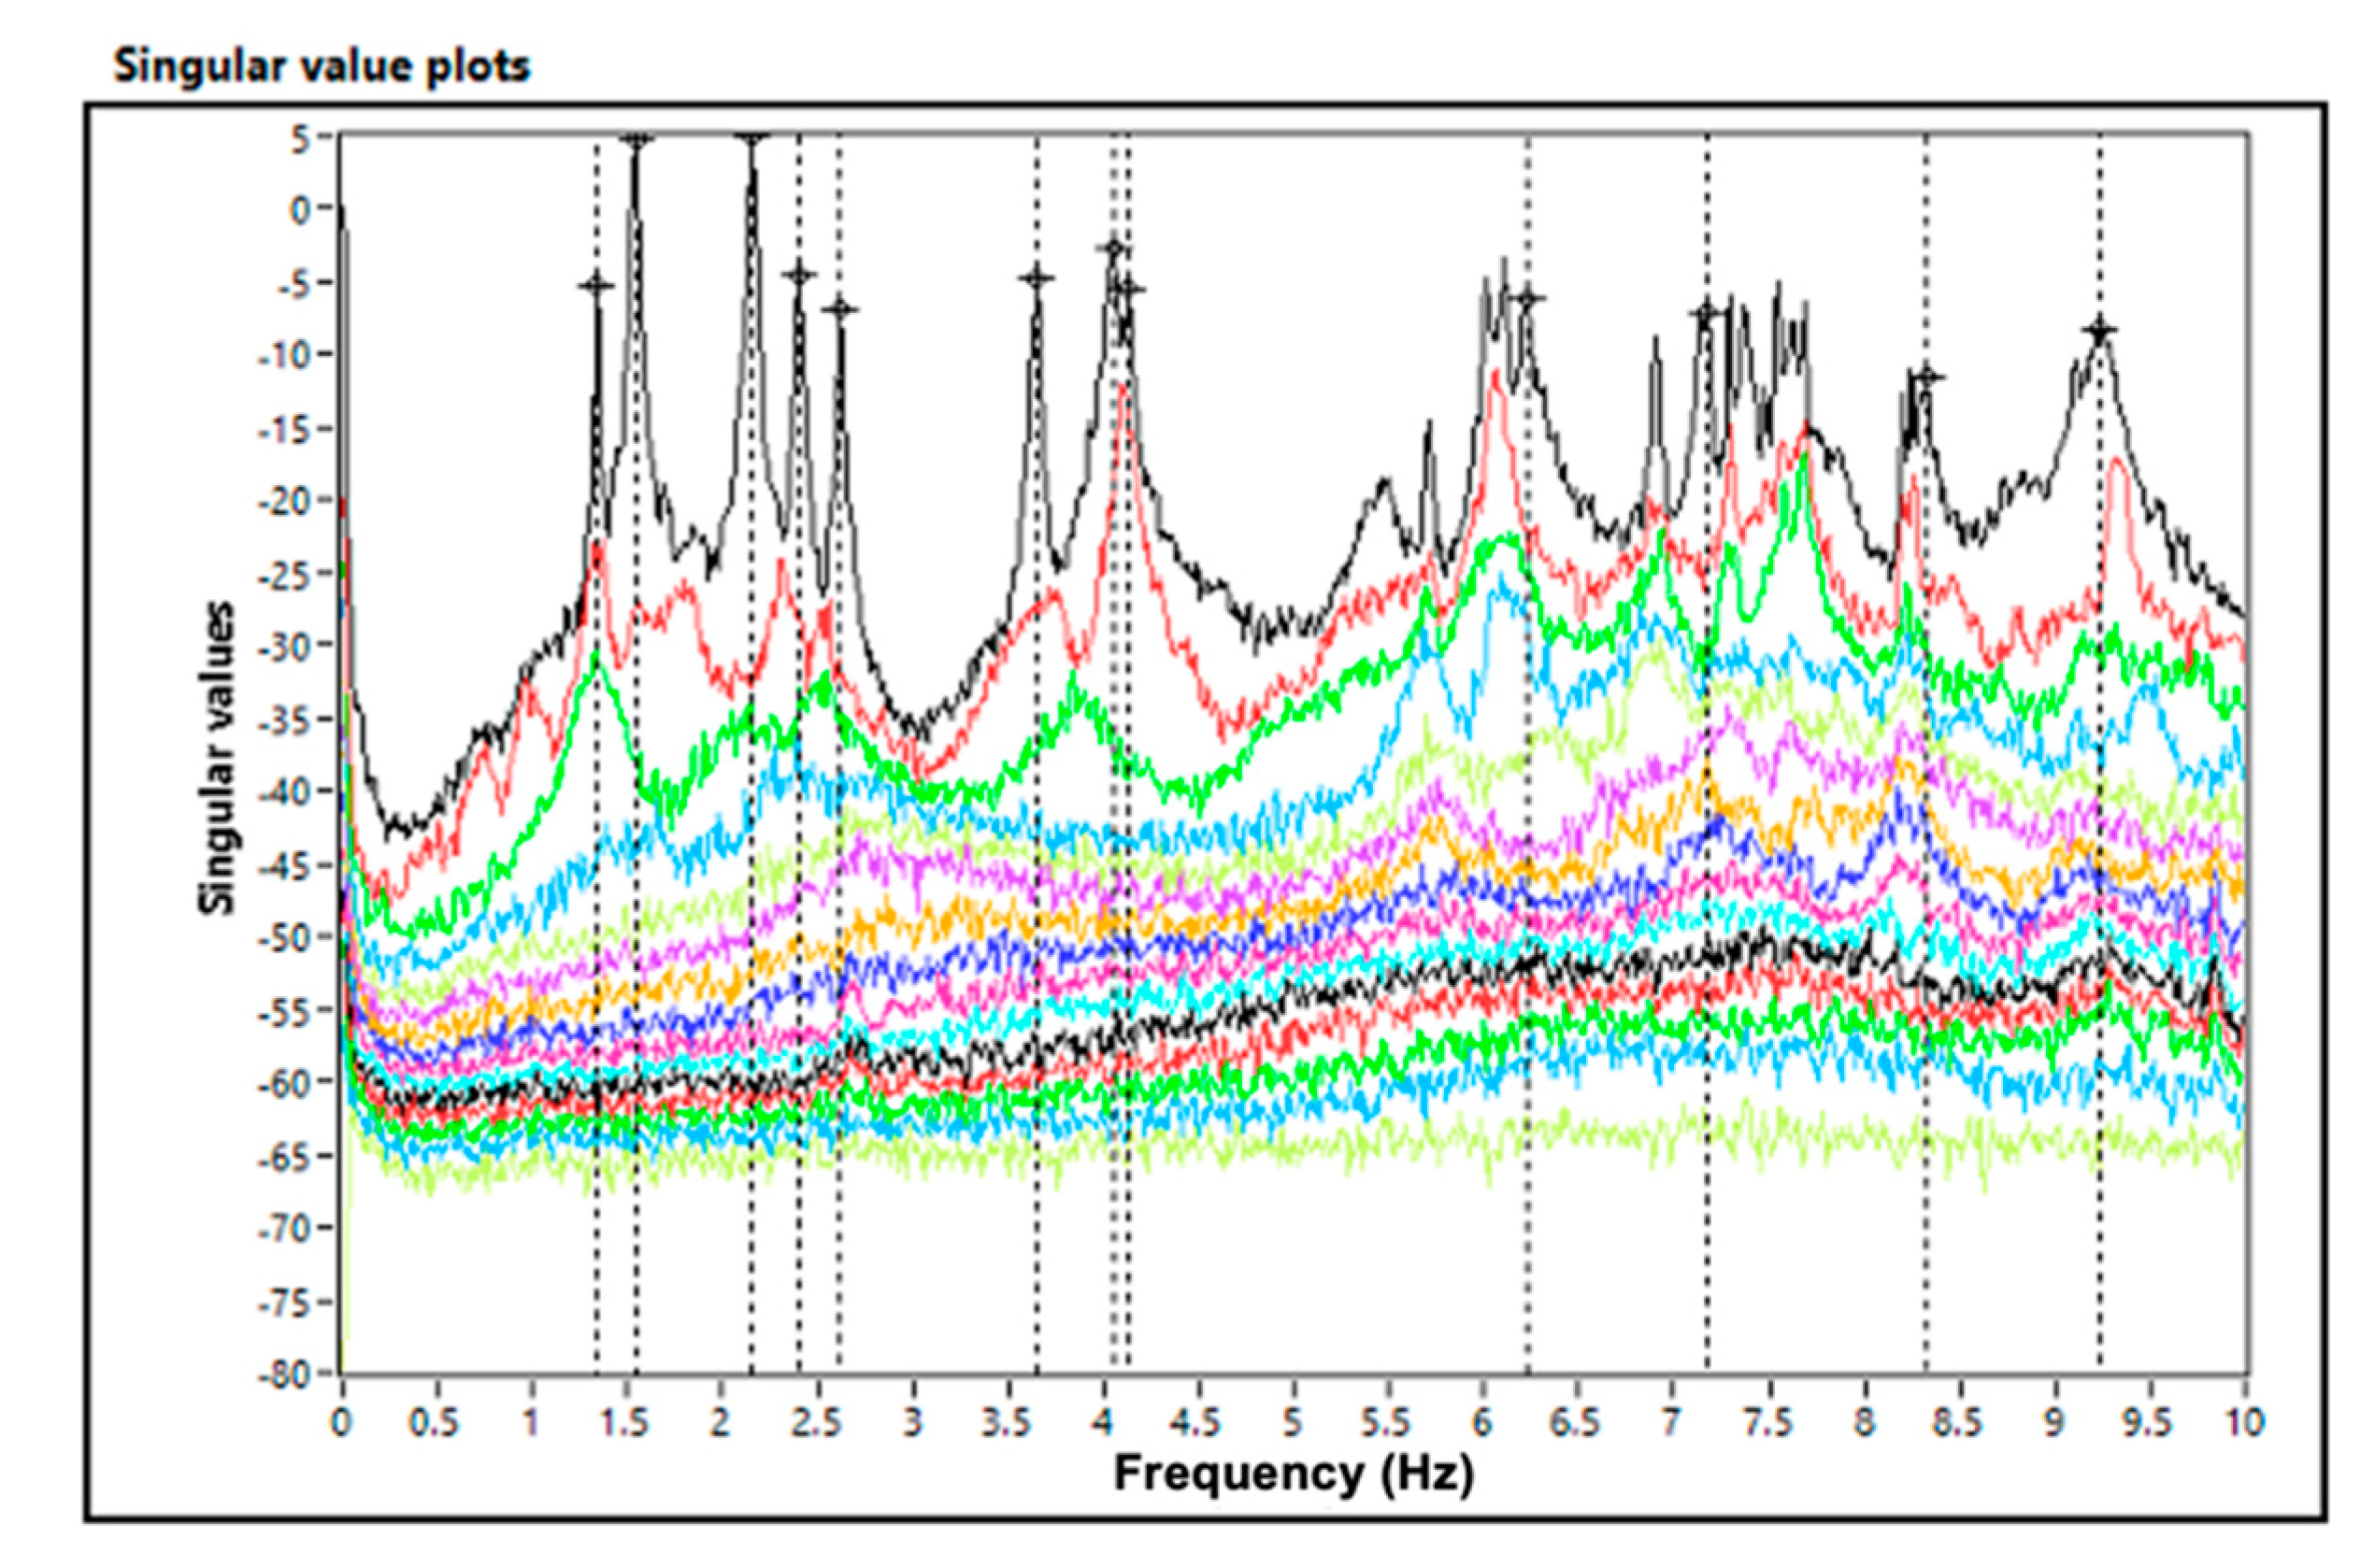
| I | 1.34 | 0.2 | Horizontal bending | ≈1 |
| II | 1.54 | 0.4 | Vertical bending | ≈1 |
| III | 2.16 | 0.2 | Vertical bending | ≈1 |
| IV | 2.40 | 0.3 | Torsion | ≈1 |
| V | 2.62 | 0.3 | Horizontal bending coupled with torsion | ≈1 |
| VI | 3.65 | 0.3 | Torsion coupled with transverse displacements | ≈1 |
| VII | 4.05 | 0.6 | Vertical bending | ≈1 |
| VIII | 4.13 | 0.4 | Vertical bending | 0.98 |
| IX | 6.22 | 0.6 | Vertical bending | 0.99 |
| X | 7.15 | 1.3 | Vertical bending | 0.99 |
| XI | 8.31 | 0.5 | Torsion coupled with transverse displacements | 0.98 |
| XII | 9.23 | 0.8 | Vertical bending | 0.99 |
| (a) | ||||||||||||||
| amax | 1p wm | 1p ws | 2p wm | 2p ws | 5p wm | 5p ws | 10p wo | 10p wr | 1p rm | 1p rs | 2t wm | 2t ws | 2t rm | 2t rs |
| ah | 0.8 | 1.1 | 1.0 | 1.1 | 1.6 | 2.0 | 2.0 | 1.5 | 1.1 | 2.8 | 1.3 | 2.0 | 1.8 | 2.3 |
| av | 4.3 | 3.6 | 6.1 | 4.8 | 6.2 | 8.8 | 8.8 | 11.4 | 15.8 | 16.1 | 12.1 | 13.5 | 24.8 | 21.2 |
| (b) | ||||||||||||||
| amax | 1p wm | 1p ws | 2p wm | 2p ws | 5p wm | 5p ws | 10p wo | 10p wr | 1p rm | 1p rs | 2t wm | 2t ws | 2t rm | 2t rs |
| ah | 0.9 | 1.1 | 0.8 | 1.1 | 1.6 | 2.2 | 2.1 | 2.5 | 1.2 | 1.6 | 1.6 | 1.8 | 1.8 | 2.0 |
| av | 3.4 | 3.4 | 4.7 | 4.6 | 5.9 | 7.1 | 7.6 | 8.6 | 16.6 | 17.7 | 12.3 | 13.6 | 21.6 | 22.8 |
| Comfort Level | Description | av,limit (cm/s2) | ah,limit (cm/s2) | ||
|---|---|---|---|---|---|
| HIVOSS [37] | SETRA [39] | HIVOSS [37] | SETRA [39] | ||
| CL 1 | Maximum | <50 | <50 | <10 | <15 |
| CL 2 | Medium | 50 ÷ 100 | 50 ÷ 100 | 10 ÷ 30 | 15 ÷ 30 |
| CL 3 | Minimum | 100 ÷ 250 | 100 ÷ 250 | 30 ÷ 80 | 30 ÷ 80 |
| CL 4 | Unacceptable | >250 | >250 | >80 | >80 |
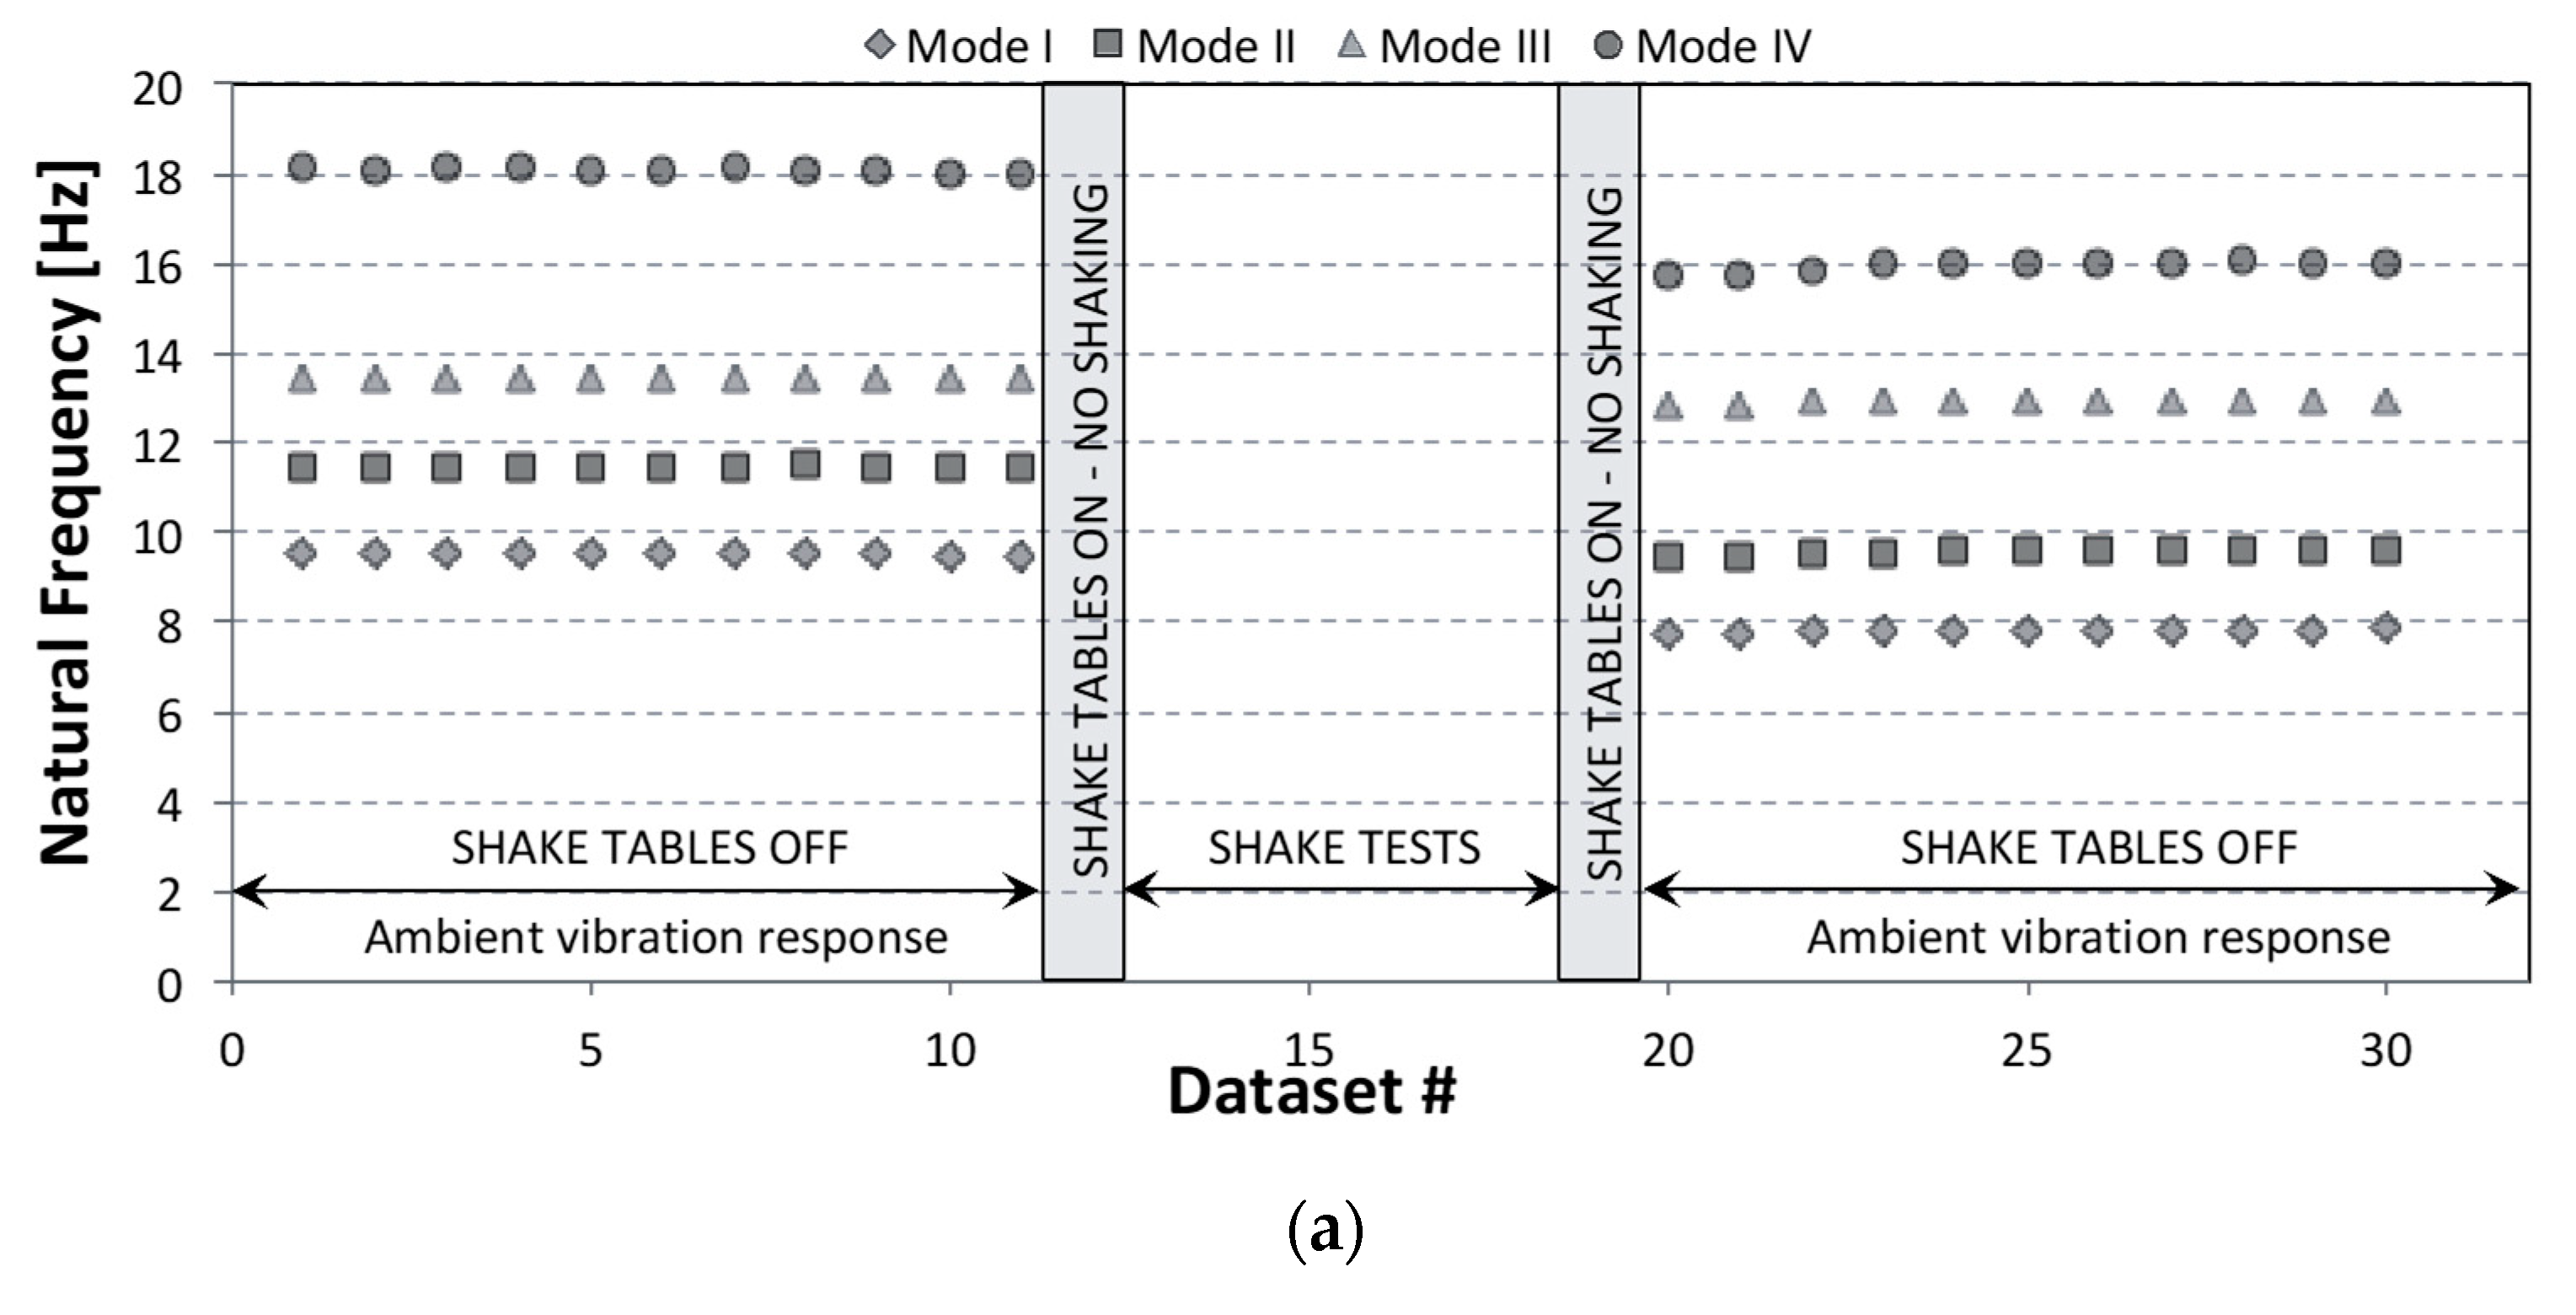
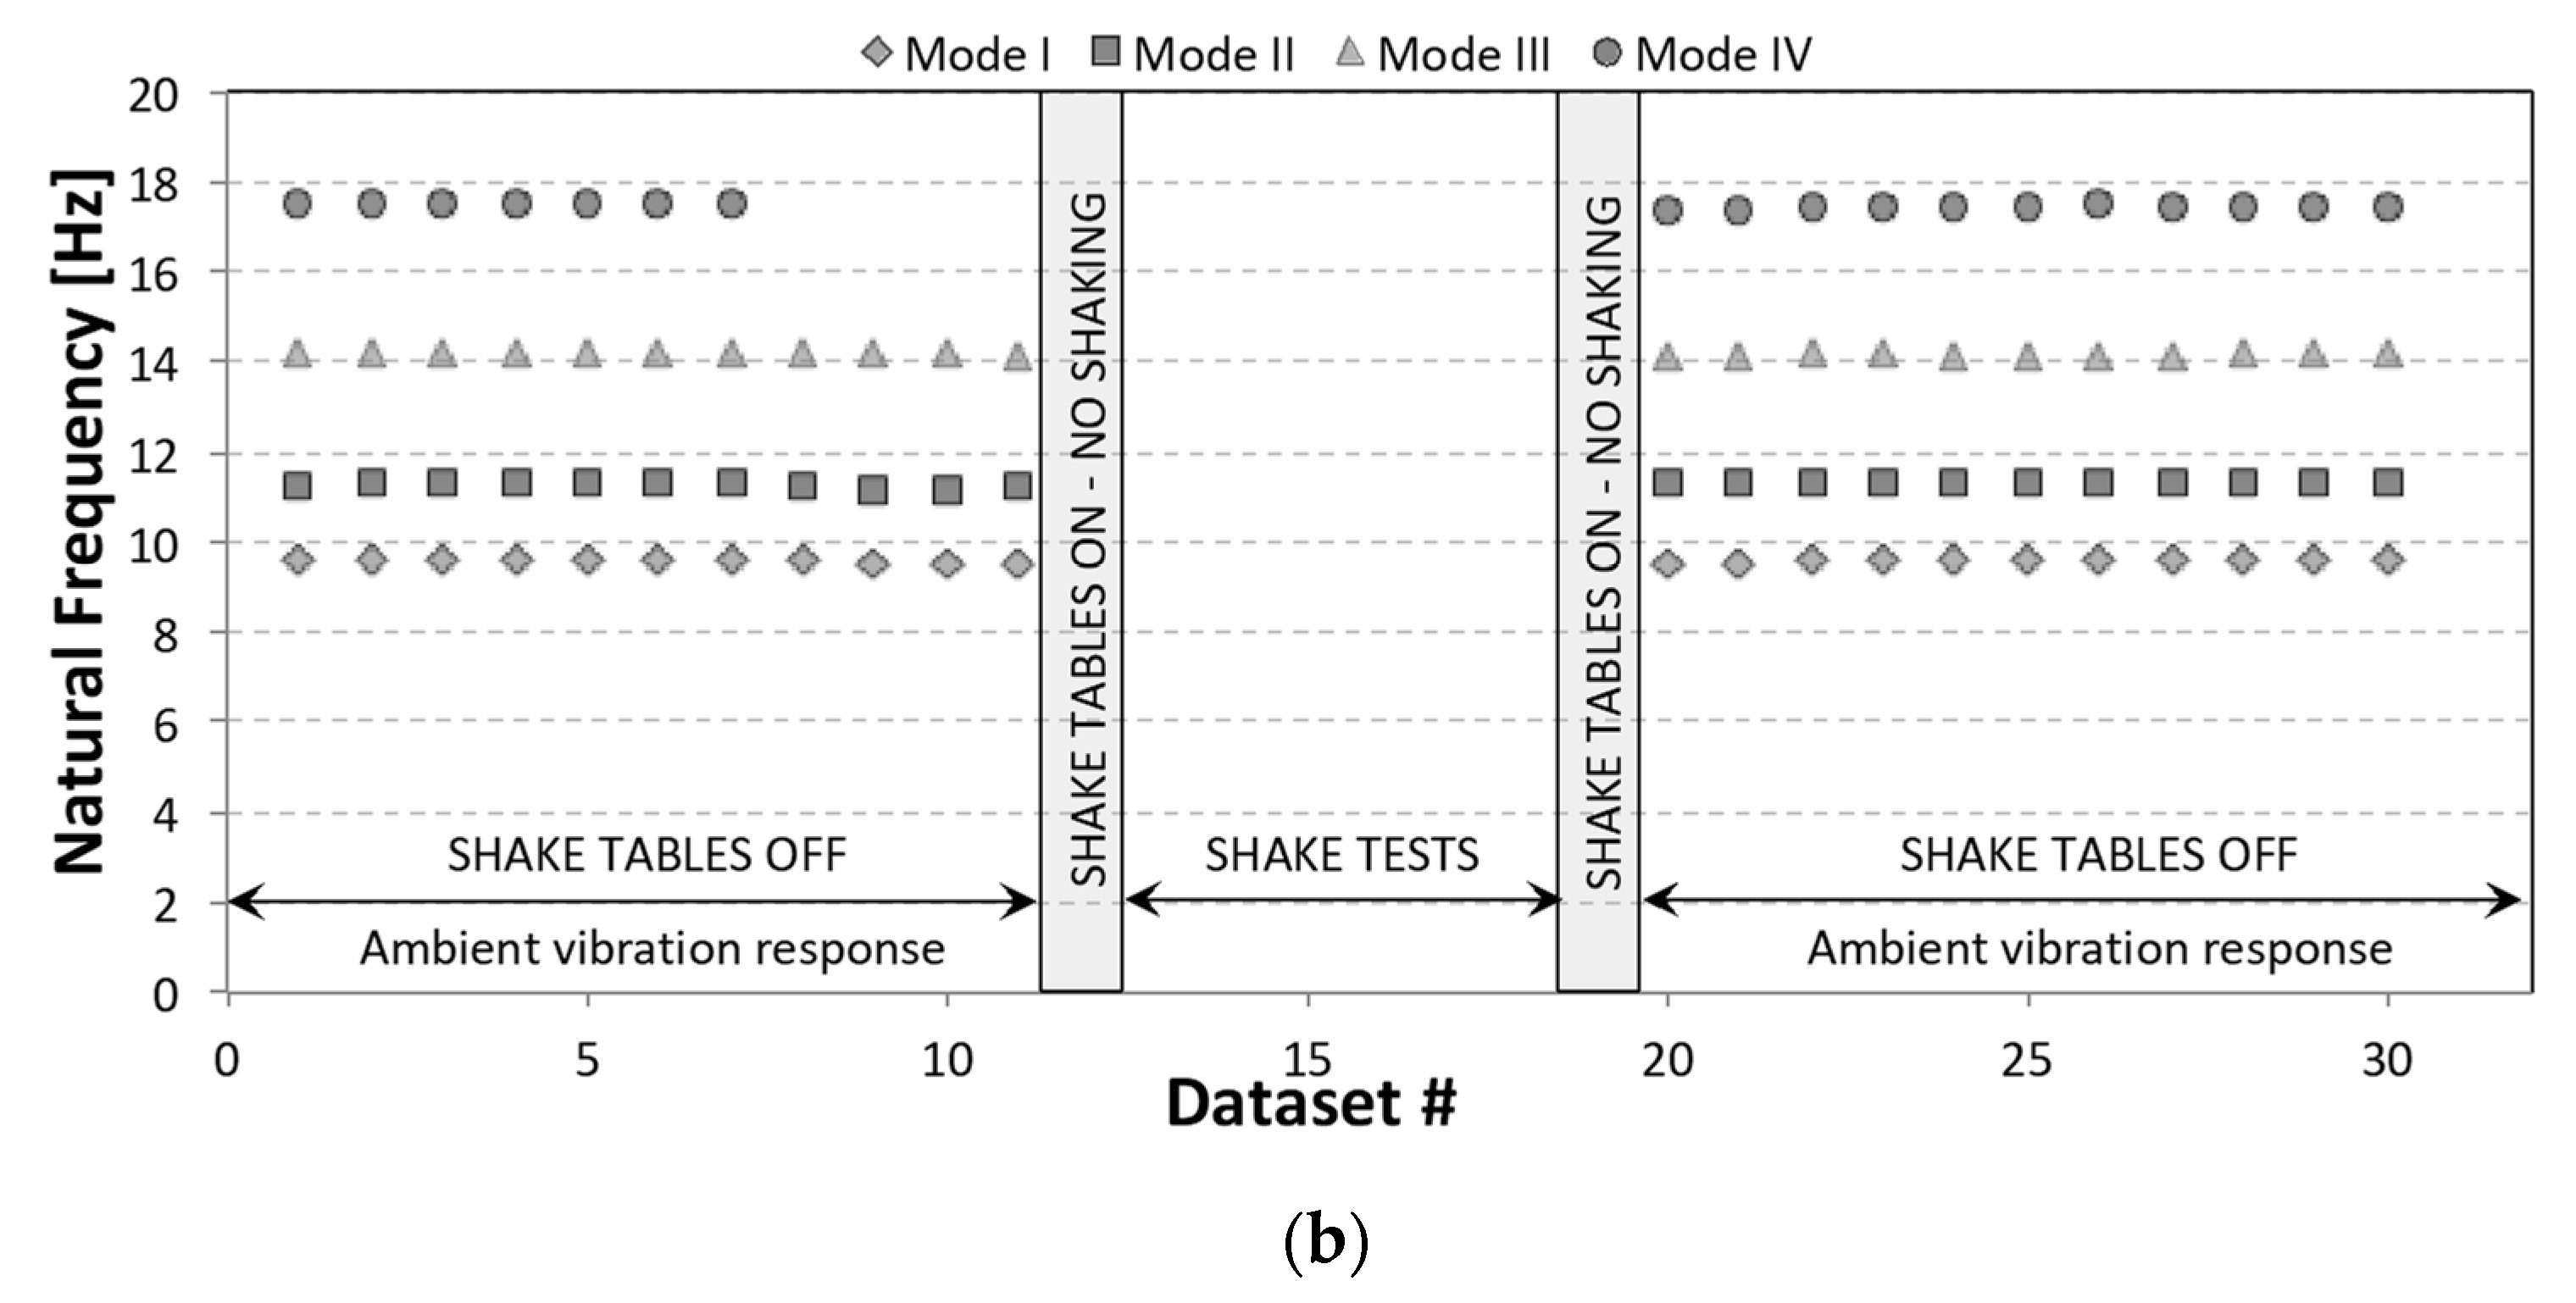
| Mode | Traditional OMA (Single Dataset) f (Hz) | Automated OMA (Multiple Datasets) fav (σf) (Hz) |
|---|---|---|
| 1 | 2.22 | 2.22 (0.02) |
| 2 | 2.70 | 2.77 (0.03) |
| 3 | 4.15 | 4.19 (0.02) |
| 4 | 7.77 | 7.70 (0.07) |
Publisher’s Note: MDPI stays neutral with regard to jurisdictional claims in published maps and institutional affiliations. |
© 2020 by the authors. Licensee MDPI, Basel, Switzerland. This article is an open access article distributed under the terms and conditions of the Creative Commons Attribution (CC BY) license (http://creativecommons.org/licenses/by/4.0/).
Share and Cite
Rainieri, C.; Notarangelo, M.A.; Fabbrocino, G. Experiences of Dynamic Identification and Monitoring of Bridges in Serviceability Conditions and after Hazardous Events. Infrastructures 2020, 5, 86. https://0-doi-org.brum.beds.ac.uk/10.3390/infrastructures5100086
Rainieri C, Notarangelo MA, Fabbrocino G. Experiences of Dynamic Identification and Monitoring of Bridges in Serviceability Conditions and after Hazardous Events. Infrastructures. 2020; 5(10):86. https://0-doi-org.brum.beds.ac.uk/10.3390/infrastructures5100086
Chicago/Turabian StyleRainieri, Carlo, Matilde A. Notarangelo, and Giovanni Fabbrocino. 2020. "Experiences of Dynamic Identification and Monitoring of Bridges in Serviceability Conditions and after Hazardous Events" Infrastructures 5, no. 10: 86. https://0-doi-org.brum.beds.ac.uk/10.3390/infrastructures5100086