On BRT Spread around the World: Analysis of Some Particular Cities


1
Faculty of Engineering and Architecture, Kore University of Enna, 94100 Enna, Italy
2
Department of Civil Engineering and Architecture, University of Catania, 95123 Catania, Italy
*
Author to whom correspondence should be addressed.
Infrastructures 2020, 5(10), 88; https://0-doi-org.brum.beds.ac.uk/10.3390/infrastructures5100088
Submission received: 31 August 2020
/
Revised: 22 September 2020
/
Accepted: 22 September 2020
/
Published: 20 October 2020
(This article belongs to the Special Issue Transport Systems: Safety Modeling, Visions and Strategies)
Abstract
:The goal of civil engineering has always been the research and implementation of methods, technologies, and infrastructures to improve the community’s quality of life. One of the branches of civil engineering that has the strongest effect on progress is transport. The quality of transport has a profound economic and social impact on our communities regarding trade (freight transport) and city livability (public transport systems). However, innovation is not the only way to improve the features above-mentioned, especially public transport, considering that it is usually beneficial to enhance and repurpose vehicles with appropriate adjustments to offer more efficient services. Other perspectives that influence public transport systems are the costs and times of design and construction, maintenance, operating costs, and environmental impact, especially concerning CO2 emissions. Considering these issues, among the various types of existing public transport systems, those of the so-called Bus Rapid Transit (BRT) offer worthwhile results. The BRT system is a type of public road transport operated by bus on reserved lanes, and it is significantly profitable, especially from an economic point of view, in areas where there are existing bus routes. Nonetheless, for the construction of works minimization, it is closely linked to other features that improve its usefulness, depending on the vehicles’ quality such as capacity, but above all, the propulsion or driving autonomy that would guarantee high efficiency. This paper introduces an analysis of some BRT systems operating worldwide, presenting the background, general technical features, and the correlation with autonomous vehicles.
1. Introduction
The implementation of a public transport system in a city is not a usual event. This is why, before construction begins, every component and feature has to be designed to ensure its efficiency for long periods. For these reasons, both for existing mass transit systems and new ones, the perspective of maintenance and retraining appears fundamental. It is worth considering that with existing buses and a few infrastructure adjustments, like what Bus Rapid Transit (BRT) requires, an efficient service would be guaranteed, and offers a convenient solution for city administrations. The BRT public transport system was introduced in 1974 in Curitiba (Brazil). The reasons that led the administrators and technicians to make this choice were economic—reduced funds to construct a rail system—and social—because of the population increase in the city—requiring a public transport system with high capacity vehicles. After Curitiba, BRT spread worldwide, especially in Bogotà, with the implementation of “TransMilenio” in the 1990s. Such a system still represents a model for all public transport arrangements, and mostly it also showed how BRT is efficient for complex urban layouts. Before 1990, BRT operated only in eighteen cities, while, nowadays, it is active in 173 cities and serves 34,026,459 daily passengers [1] (Table 1).
The benefits of a typical BRT system consist of dedicated lanes and proper vehicles and stations. Such a layout guarantees a significant advantage in terms of intermodality and interoperability. If such features are accessible to other specific vehicles, like emergency ones, then, due to reserved lanes, the congestion phenomena could be avoided for the public transport system and ordinary traffic, for instance, when users attracted by the efficiency of BRT give up using their private vehicles. Commonly BRT is considered an upgrade of existing bus mass transit systems that emulate rail systems but with reduced costs and construction times. For example, the construction costs for a single kilometer of BRT are only 52% of the costs of a light rail system and 8% of those of massive rail system construction [2]. A strategy that is commonly used to appeal to citizens consists in building stations or creating reserved lanes in places where there are parking areas for private vehicles. In this way, private vehicle users are more likely to find themselves caught up in congestion and less likely to find a parking place, thereby encouraging people to prefer the use of public transport systems. Some comparative data between BRT systems and more traditional transport systems are shown in Table 2.
Generally, when a new mass transit system has been implemented, the area where it is located must be subjected to requalification works, producing a relevant cost increase. Such a case appears conveniently when the local administration decides to create so-called transit-oriented development (TOD) areas to maximize public transport use. These places are characterized by people living near transit hubs, so there would be the need to invest in activities close to these areas [3], making an essential requalification with significant consequences in terms of property value increase.
The main aim of this paper was to review some of the BRT systems operating worldwide. The following subsections will present the background, general technical features, and the correlation with autonomous vehicles. This last section represents a viable distinguishing trait of the review carried out in this paper. The discussion examines the perspectives concerning autonomous vehicles and how they can enhance and influence mass transit and, mainly, BRT systems, in a positive way, creating meaningful profits for communities.
2. General Technical Aspects
To achieve the high efficiency of a BRT system, regardless of new construction or existing mass transit upgrades, several aspects must be taken into account to minimize future interventions. As for any other infrastructure, the design phase represents the central part of the implementation of a public transport system. This is why, before drawing the physical elements of a BRT system, it is necessary to carry out in-depth studies about city urban assets, a demand analysis of potential users, the identification of critical points, analysis of existing mass transit systems, and corridor selection [4,5]. Once the design phase has been concluded, it is possible to begin building and installing the following main elements that characterize a BRT system:
- Running lanes;
- Vehicles;
- Stations;
- ITS, passenger information, and control systems.
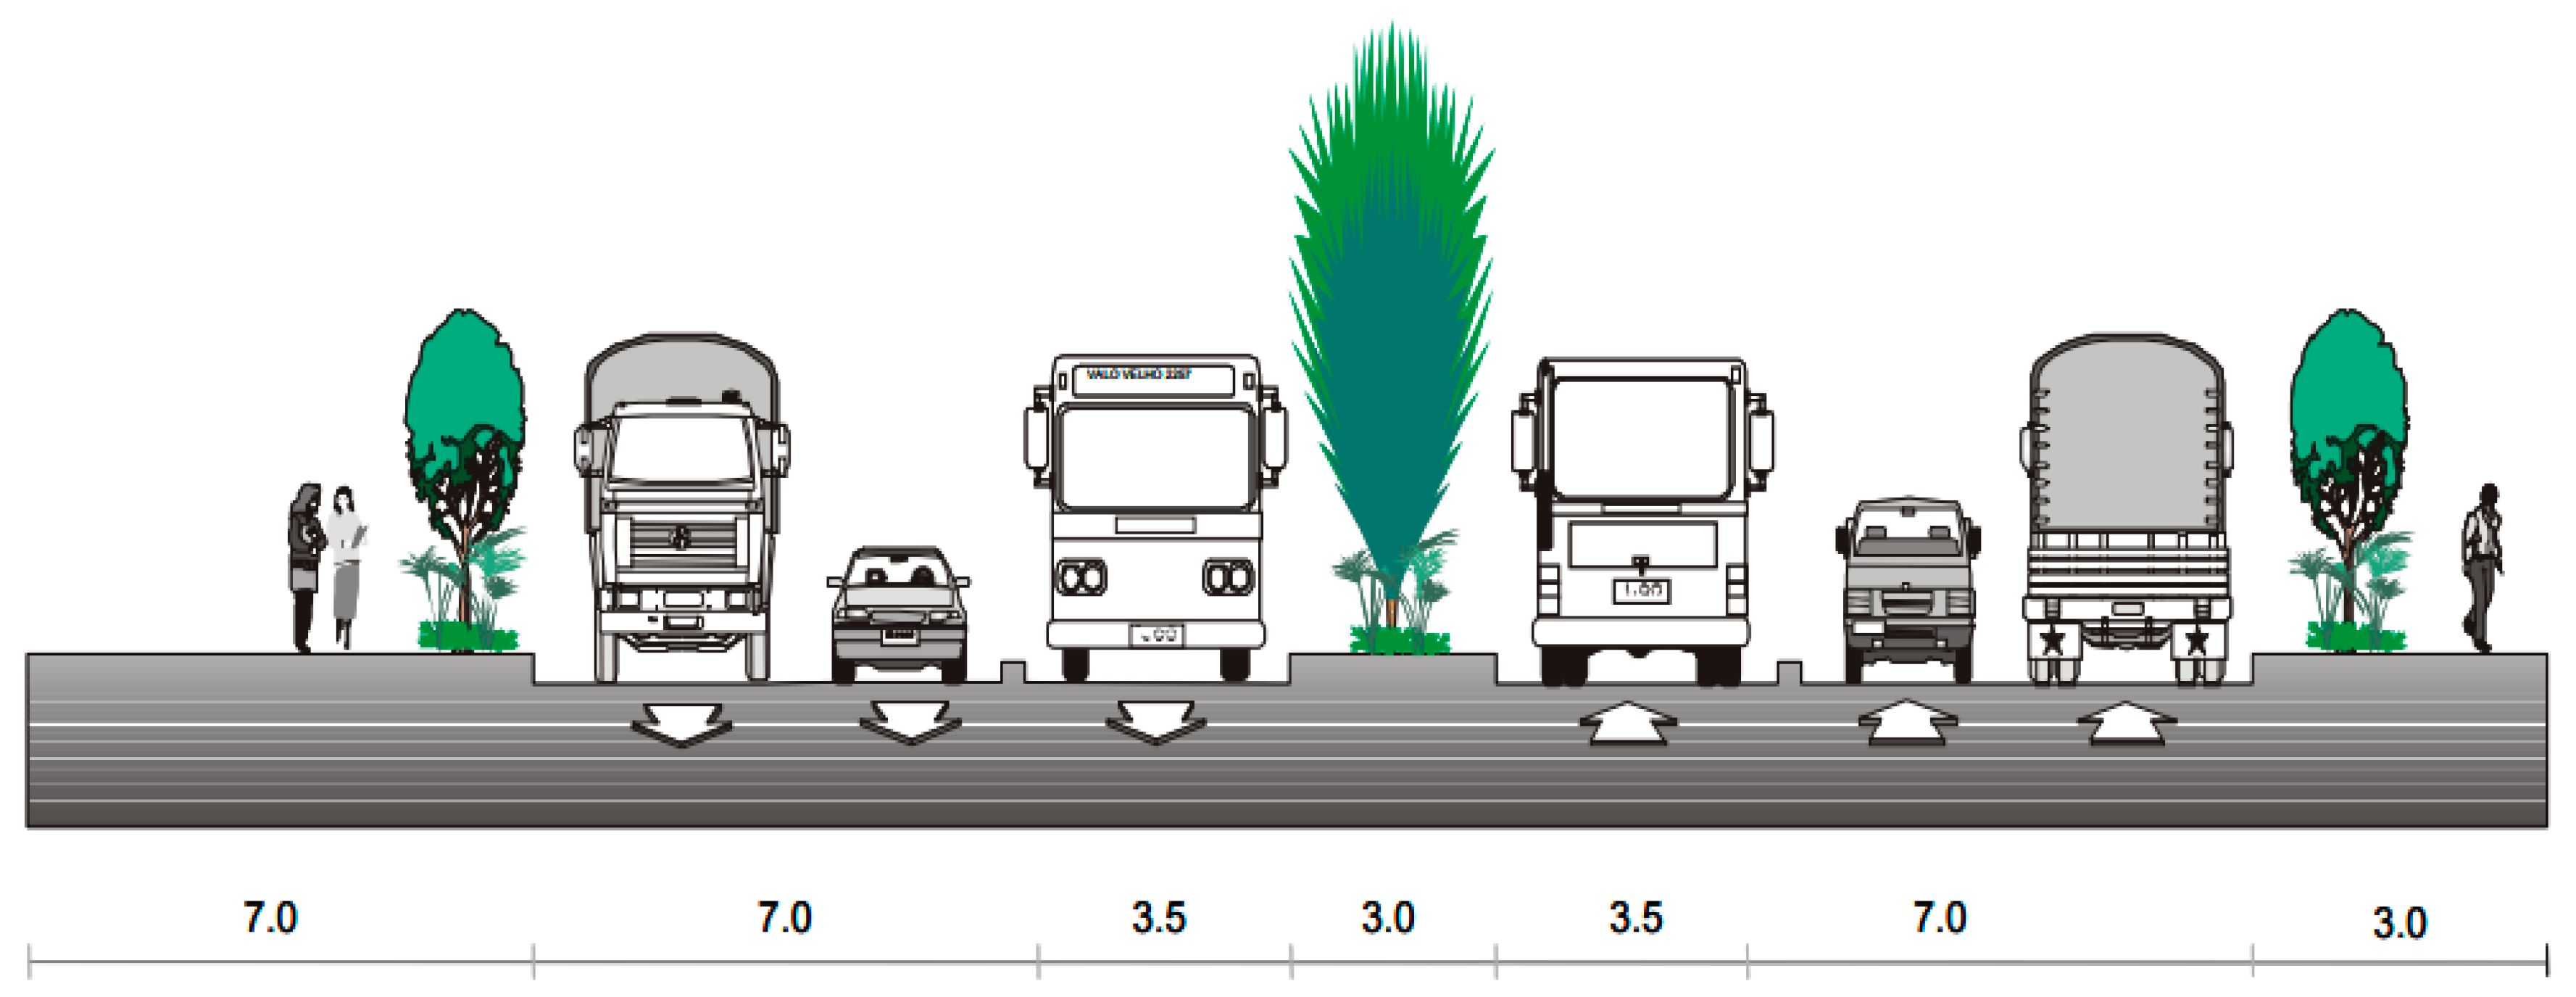
Running lanes represent the main characteristic of BRT systems, for economic reasons. Their construction generally amounts to 50% of infrastructure costs; concerning their asset and dimensions that strongly affect the efficiency of the BRT service, usually the standard width of a BRT runway is 3.5 m, as shown in Figure 1. However, this width is reduced to 3 m to guarantee a lower speed, decreasing accident risks for safety reasons. Regarding the lane’s position in a road section, it is preferable to locate them at the edges. In this way, passengers do not need to cross the street to reach the station. This is why lanes are often located in the middle of the road section only when that part of the itinerary is without stops. The construction of barriers at the edges of the lanes is a solution that guarantees only public service vehicles. However, the absence of barriers proves useful when, in the case of accidents or dangerous situations, other vehicles need a recovery place, or to facilitate access to ambulances that need to avoid congested areas. Nevertheless, in that case, the lane must maintain a correct width that allows the presence of more than one vehicle.
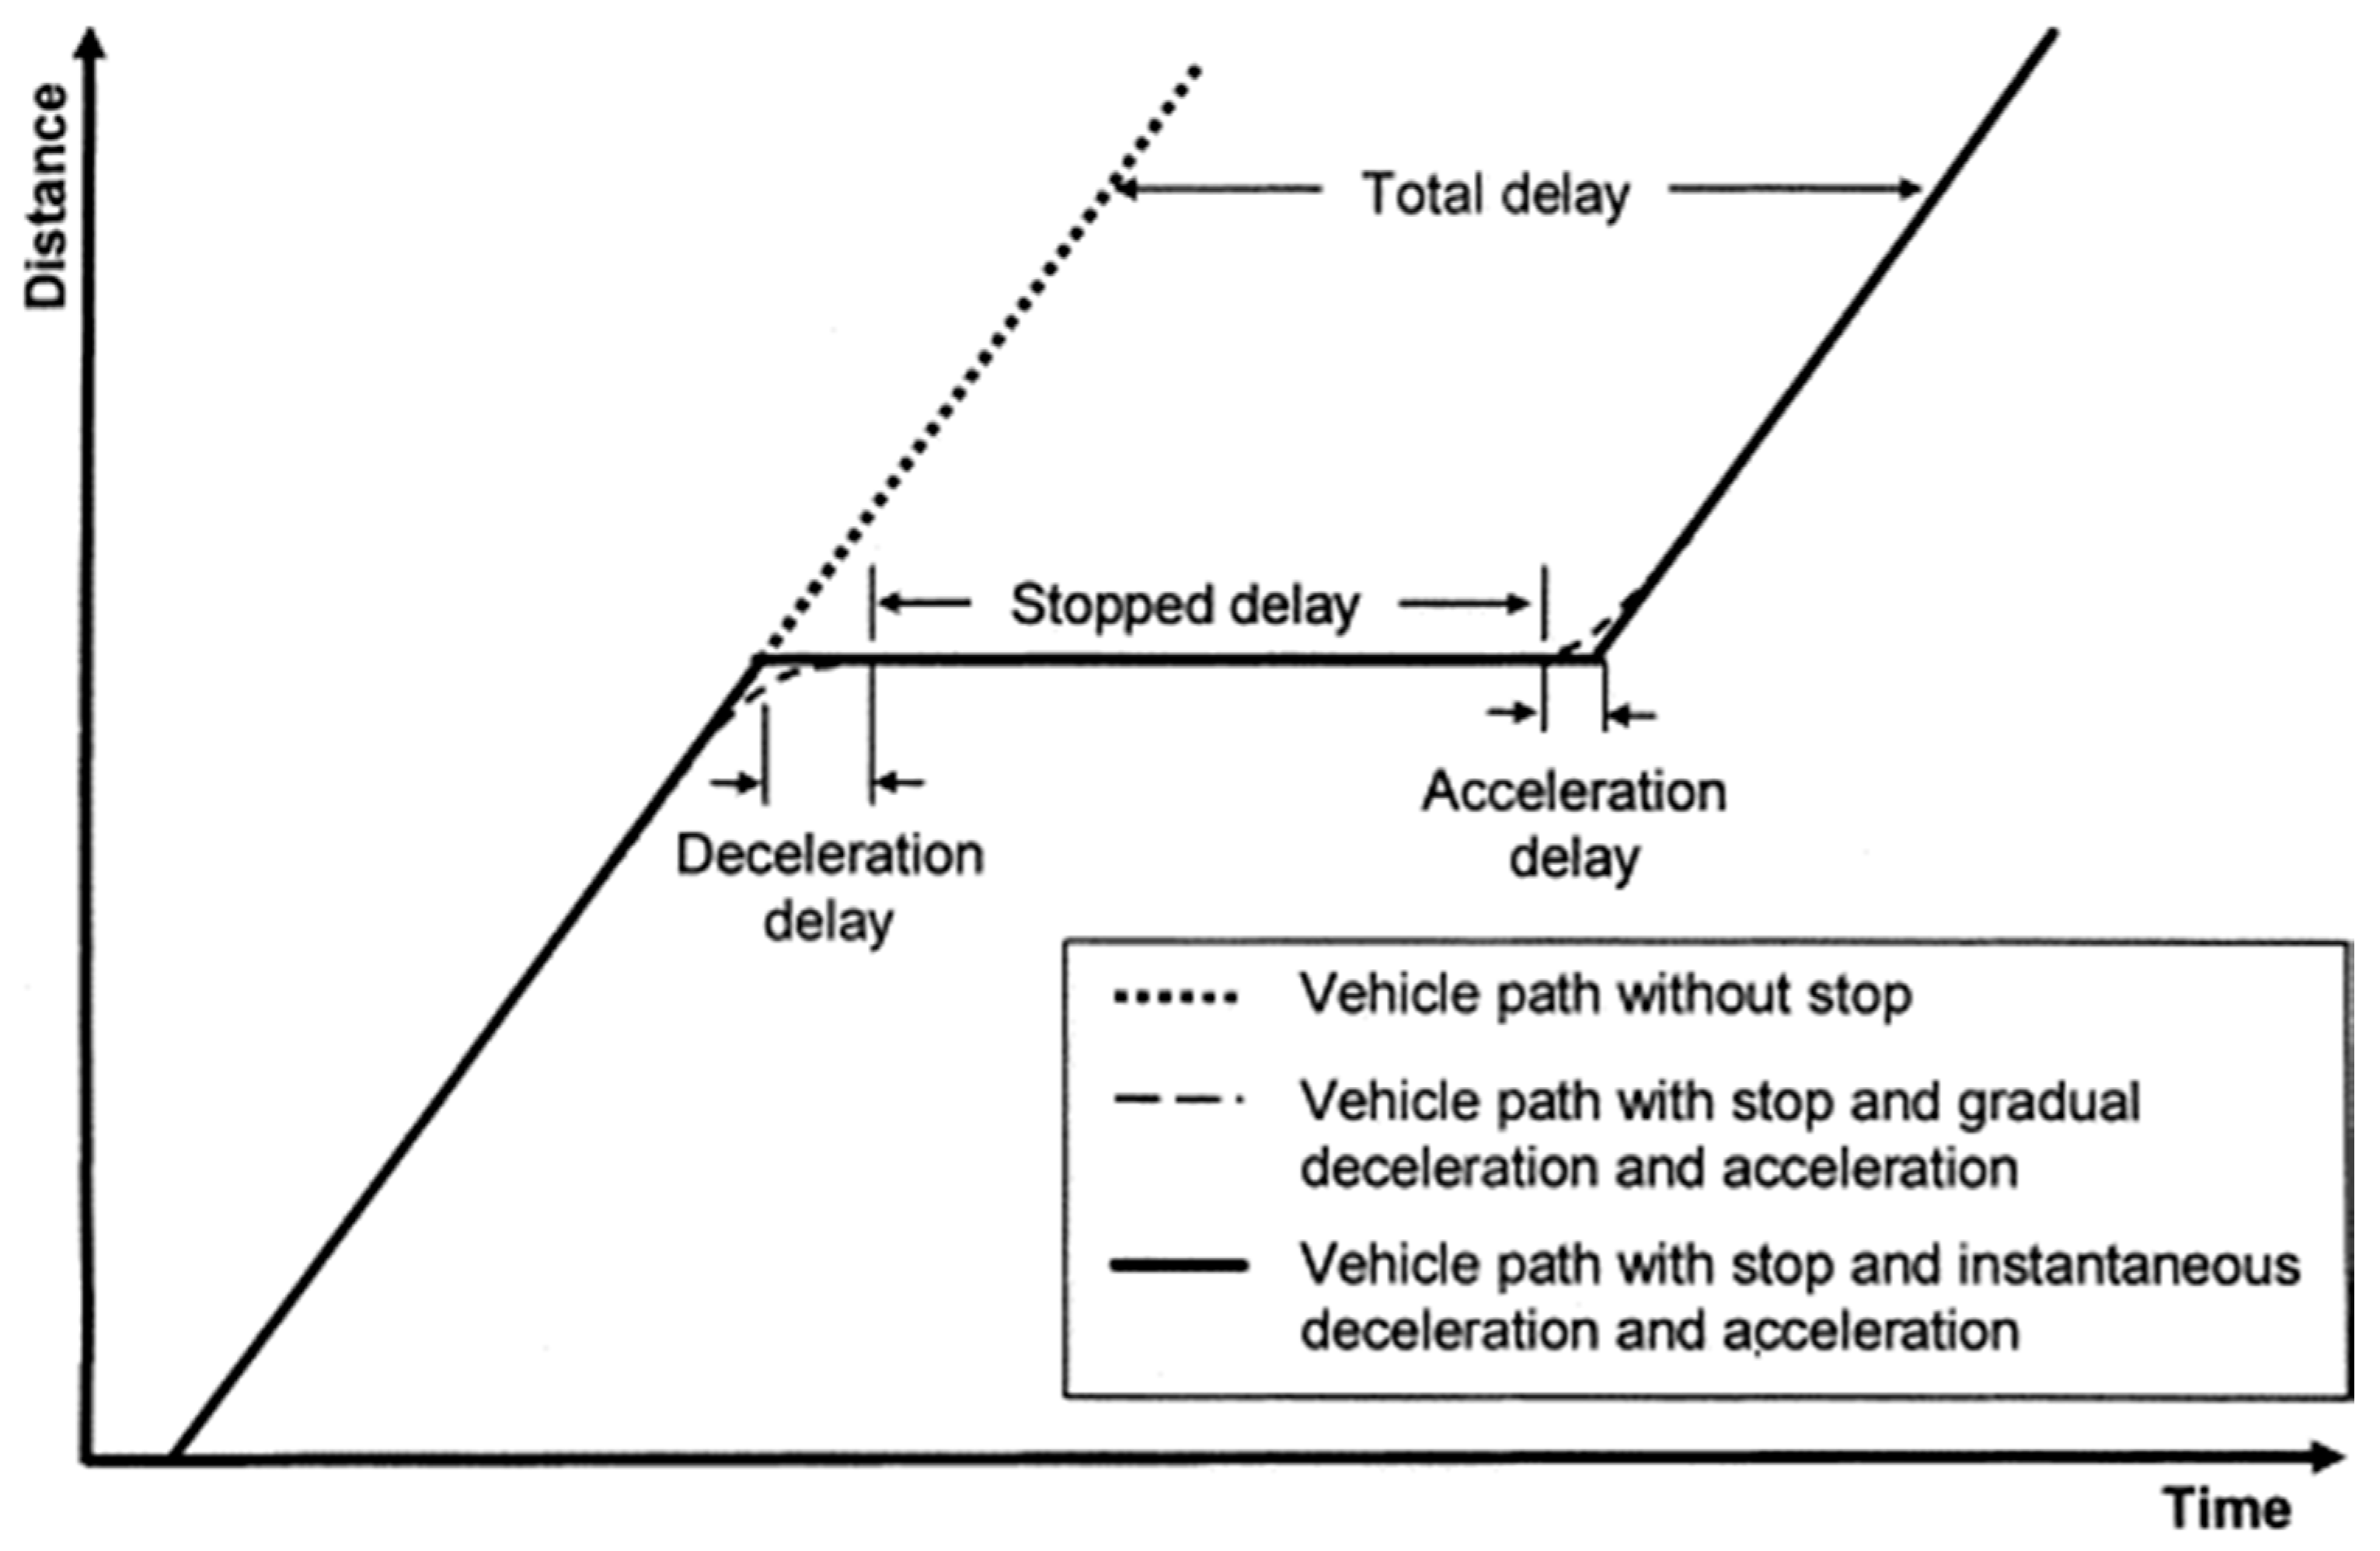
For these reasons, running lane dimensions are strongly affected by vehicle characteristics that mainly depend on two parameters: size and propulsion. The first is related to driver labor costs per passenger, user comfort, service capacity, and frequency. In contrast, the second has consequences concerning emissions and environmental impact. In lower-demand corridors, it is suggested that large buses are avoided to reduce waiting times for users. It has been noted that typical BRT efficiency is attributed to vehicles, but the operation quality is significantly affected by stations. Such infrastructures may be configurated in several different ways according to their role. Generally, it is possible to distinguish open stations (preferred for stops) or closed stations, and their size depends on lines and user quantity. Stations are positioned in relation to the adjacent urban layout, but the system is optimized if they are close to pedestrian areas due to safety reasons. The processing speed does not depend only on vehicles, stations, or runways, because it is the exchange of information that guarantees a correct and timely operation. Such characteristics relate mainly to two contexts: user information and operators and systems information. The first is fundamental to allow passengers to choose between the BRT system’s services concerning their needs. The second one affects the operation of the entire system, so it essential to communicate accidents, vehicles, and route data. The public transport system is equipped with high efficiency IT and electronic telecommunication devices, the so-called intelligent transport systems (ITS), to ensure such capabilities. These devices allow real-time traffic data and communication network control. With regard to technological characteristics, there are several types of traffic light systems, satellite navigators, or speed detectors; moreover, thanks to recent innovations, sensor device systems have been implemented that can be installed both in vehicles and in infrastructure (stations, lanes). Nonetheless, the accuracy and precision of all the decisions in the design phase and concerning the aspects above-mentioned can be complicated to avoid delays at 100%, which for users represent the most significant inconvenience. Such events occur for several reasons, and not always attributable to public transport systems. These depend on variable parameters that are impossible to predict. The case of a BRT system that bases its efficiency on reserved lane intersections represents the most critical point. For safety reasons, BRT vehicles are constrained to operate maneuvers (valid also for non-public transport vehicles) of deceleration, braking, and acceleration, respectively, before, in correspondence, and after the intersection. The aggregation times for such maneuvers create the delay, as shown in Figure 2.
Strategies to manage and maximize such discomfort are various, so the prioritization of BRT vehicles at intersections can be managed passively, with the absence of signal priority and operating according to a pre-defined schedule. Consequently, it is possible to achieve a vehicle detection strategy both in an active and adaptive way with the aim to detect in real-time BRT and traffic vehicles. However, it is commonly preferred to use transit signal priority due to its efficiency. With recent innovations, many other solutions have been studied. One of them consists of implementing an algorithm named TSPAT (Transit Signal Priority for Actuated Timing), which was tested on a real scenario (intersection in Isfahan, Iran) with Verkehr In Städten-SIMulationsmodell (VISSIM) traffic simulation. Such study objects were the “Freiburg intersection” in Isfahan, where there is a BRT station, and in the street, where it is wider, there are two BRT runways positioned at the edges that carry buses in opposite directions. The results of the algorithm above-mentioned showed a more positive trend regarding off-peak hours. For off-peak hours in both for BRT system operation and environmental-economic impact, outputs were all positive. In these cases, delays were reduced by 51% with a reduction in air pollutants and fuel consumption, respectively, by 6.9% and 6.5%, and average speed increased by 78%. In contrast, peak hours of positive outcomes saw a 21% reduction in delays, the average speed increased by 26%, average fuel consumption increased by 2%, and air pollutants by 2.9% [6]. In conclusion, it has to be underlined that among the several parameters that affect the BRT system configuration, the demand analysis is the most significant. This planning phase provides the number of users, so, according to these data, the BRT system will assume various assets. The BRT configuration solutions referring to the number of passengers are shown in Table 3.
3. Bus Rapid Transit (BRT) and Autonomous Vehicles
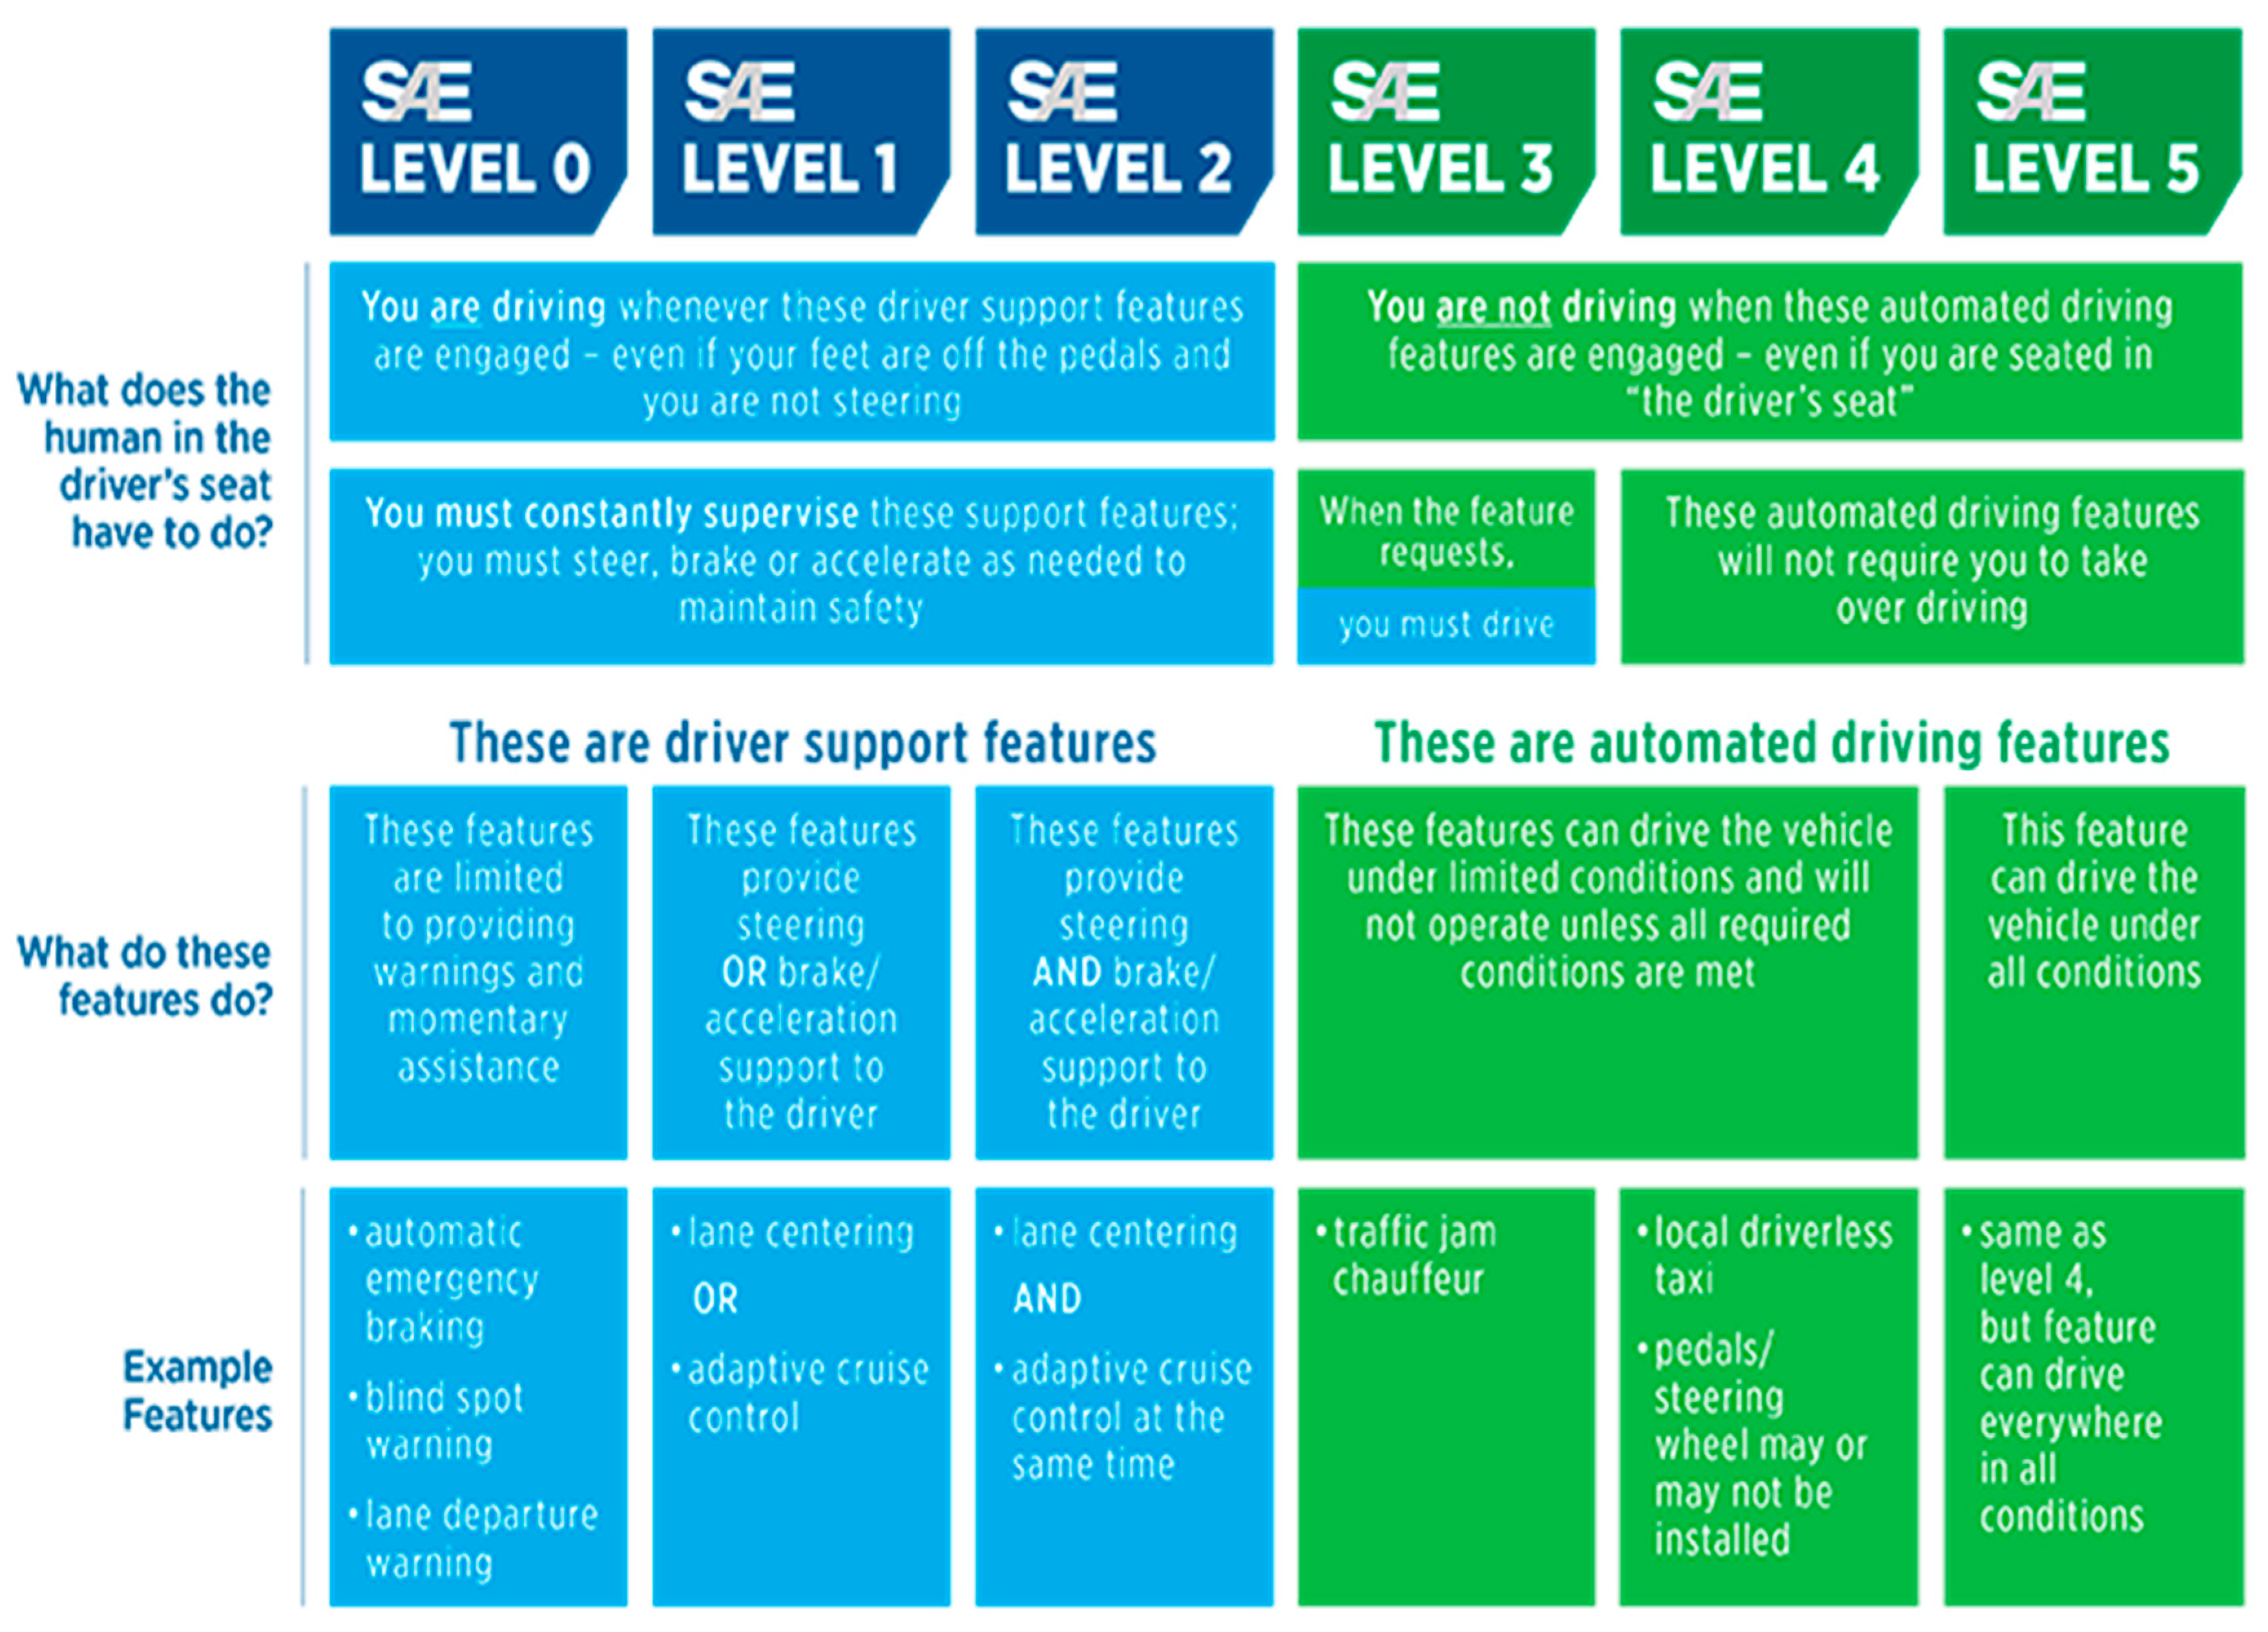
The most important innovations that affect the transport and automotive sectors nowadays are represented by autonomous vehicles whose equipment can replace driver intervention. To highlight several autonomous vehicle types that have been implemented, it is possible to refer to the classification, depicted in Figure 3, established by SAE (Society of Automotive Engineers). There are six levels of classification: from level zero to level two, there are vehicles with full manual control (level zero) and those with some features that allow driver assistance and partial automation (level one and level two); then level three to level five indicates vehicles that are equipped with the so-called ADAS (Advanced Driver-Assistance System) that permits autonomous performances. In these cases for a third and fourth level, a driver is required. The vehicles operate autonomously only in some circumstances, while, for level five, the vehicle can achieve full autonomy [7]. Among several benefits that would be provided by autonomous vehicles, the main ones are related to safety, considering that a high-tech system would manage driving maneuvers with shorter reaction times compared to human drivers, but also to public transport services that would achieve high efficiency due to the accuracy of the IT systems. With regard to public transport, it has to be pointed out how the ADAS operation would be more relevant for road vehicles such as buses instead of rail vehicles (trains, trams) because while this one is hooked to a platform (predetermined trajectory), the trajectory of autonomous road vehicles would be utterly dependent on ADAS.
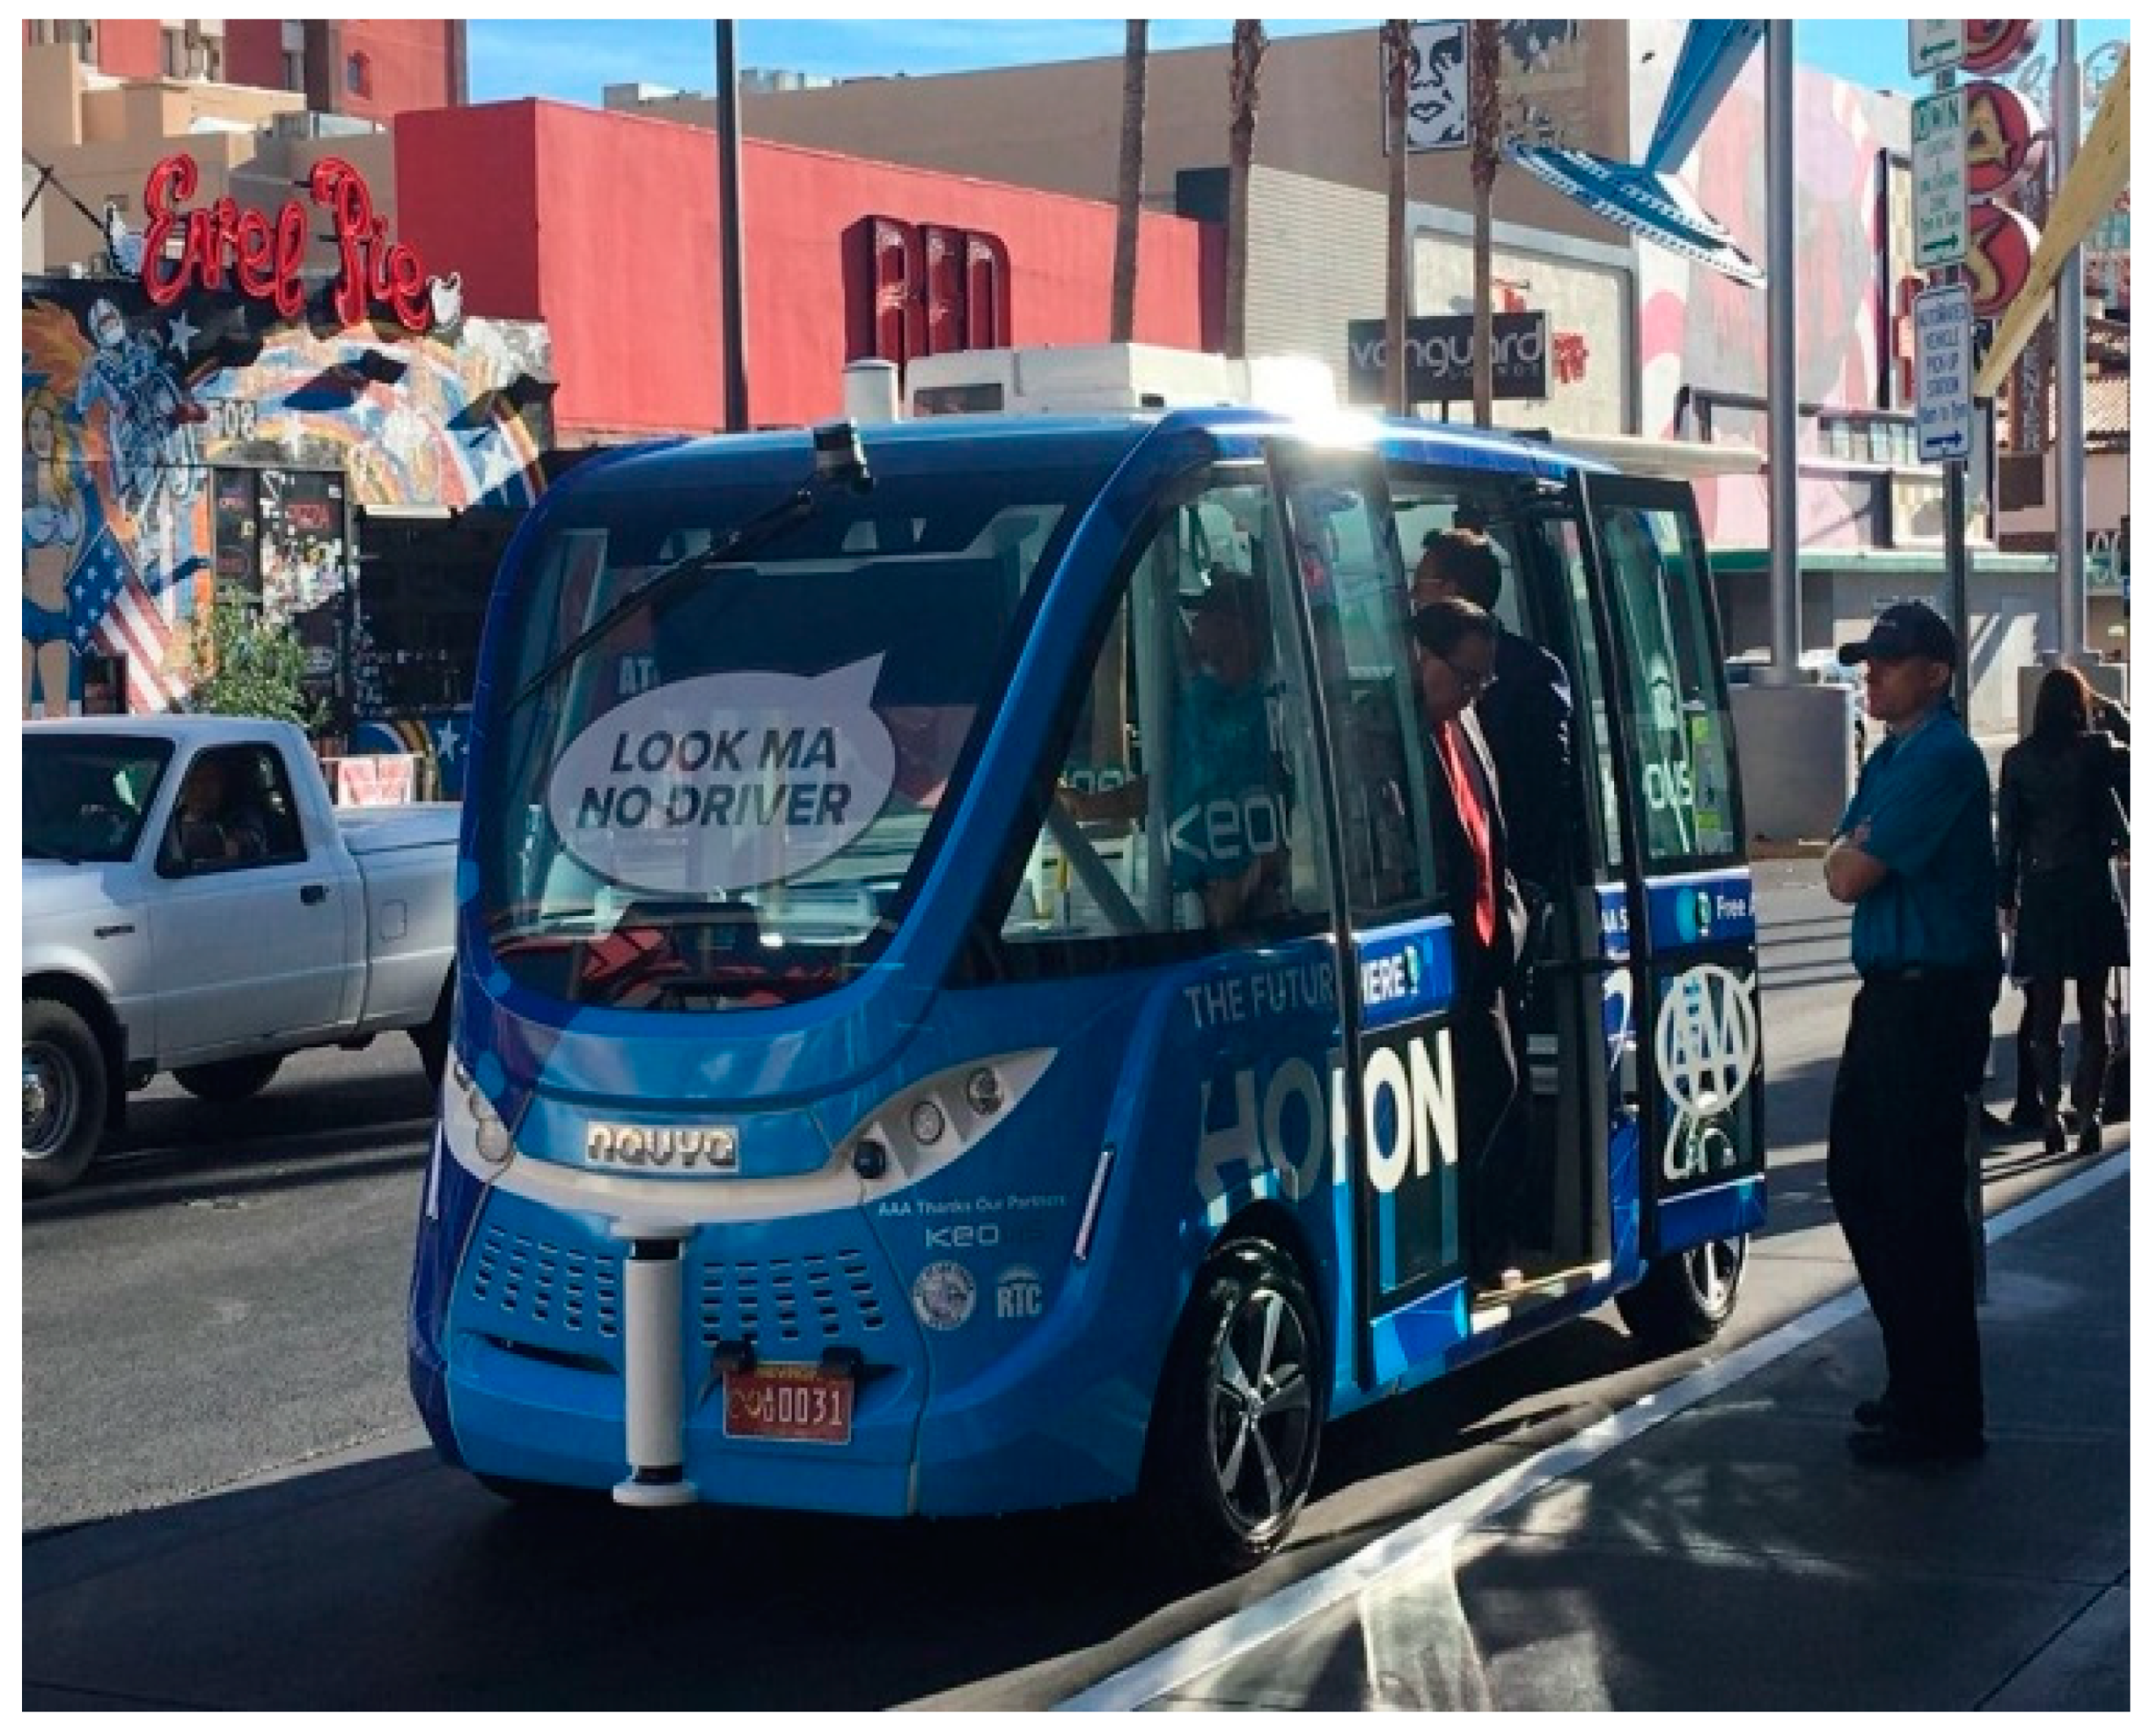
Taking into account the advantages that autonomous vehicles could give to a BRT system, many companies have launched tests with autonomous buses like, for instance, the East Japan Railway Company’s (JR East’s) Bus Rapid Transit (BRT) lines [8], aiming to analyze self-driving technologies when applied to bus transit primarily focusing on aspects such as keeping in lane and speed control, which strongly affect BRT efficiency or the buses’ decision capabilities when managing several scenarios. The cooperation of an efficient system like BRT and the technological capability of ADAS would provide an ultimate low-cost solution for critical traffic issues and emissions reduction in cities, especially considering that it is expected that in 2050, more than two-thirds of the world’s population will live in cities [9]. Examples of autonomous bus services consist mainly of autonomous minibuses with a capacity of a maximum of 15 people. They operate in several contexts like hospitals, parks, universities, airports, and public roads. However, with such reduced capacity, it would be complicated to implement a BRT system that is mainly valued for its high capacity buses. Therefore, to guarantee a high capacity system, the solution would be to use a high number of minibuses that are already able to drive on a public road, and to operate them in reserved lanes, thus ensuring a significant efficiency considering that with a high quantity of vehicles, the waiting time would be decreased due to the high frequency and flexibility. Crucially, to ensure the correct operation of an autonomous BRT system, the infrastructures will need to be upgraded with ITS and sensors able to allow the following types of communications: V2I (vehicles to infrastructure), V2V (vehicle to vehicle), and V2X (vehicle to everything) [10]. In Figure 4, it is possible to see an autonomous bus that works on a street in California.
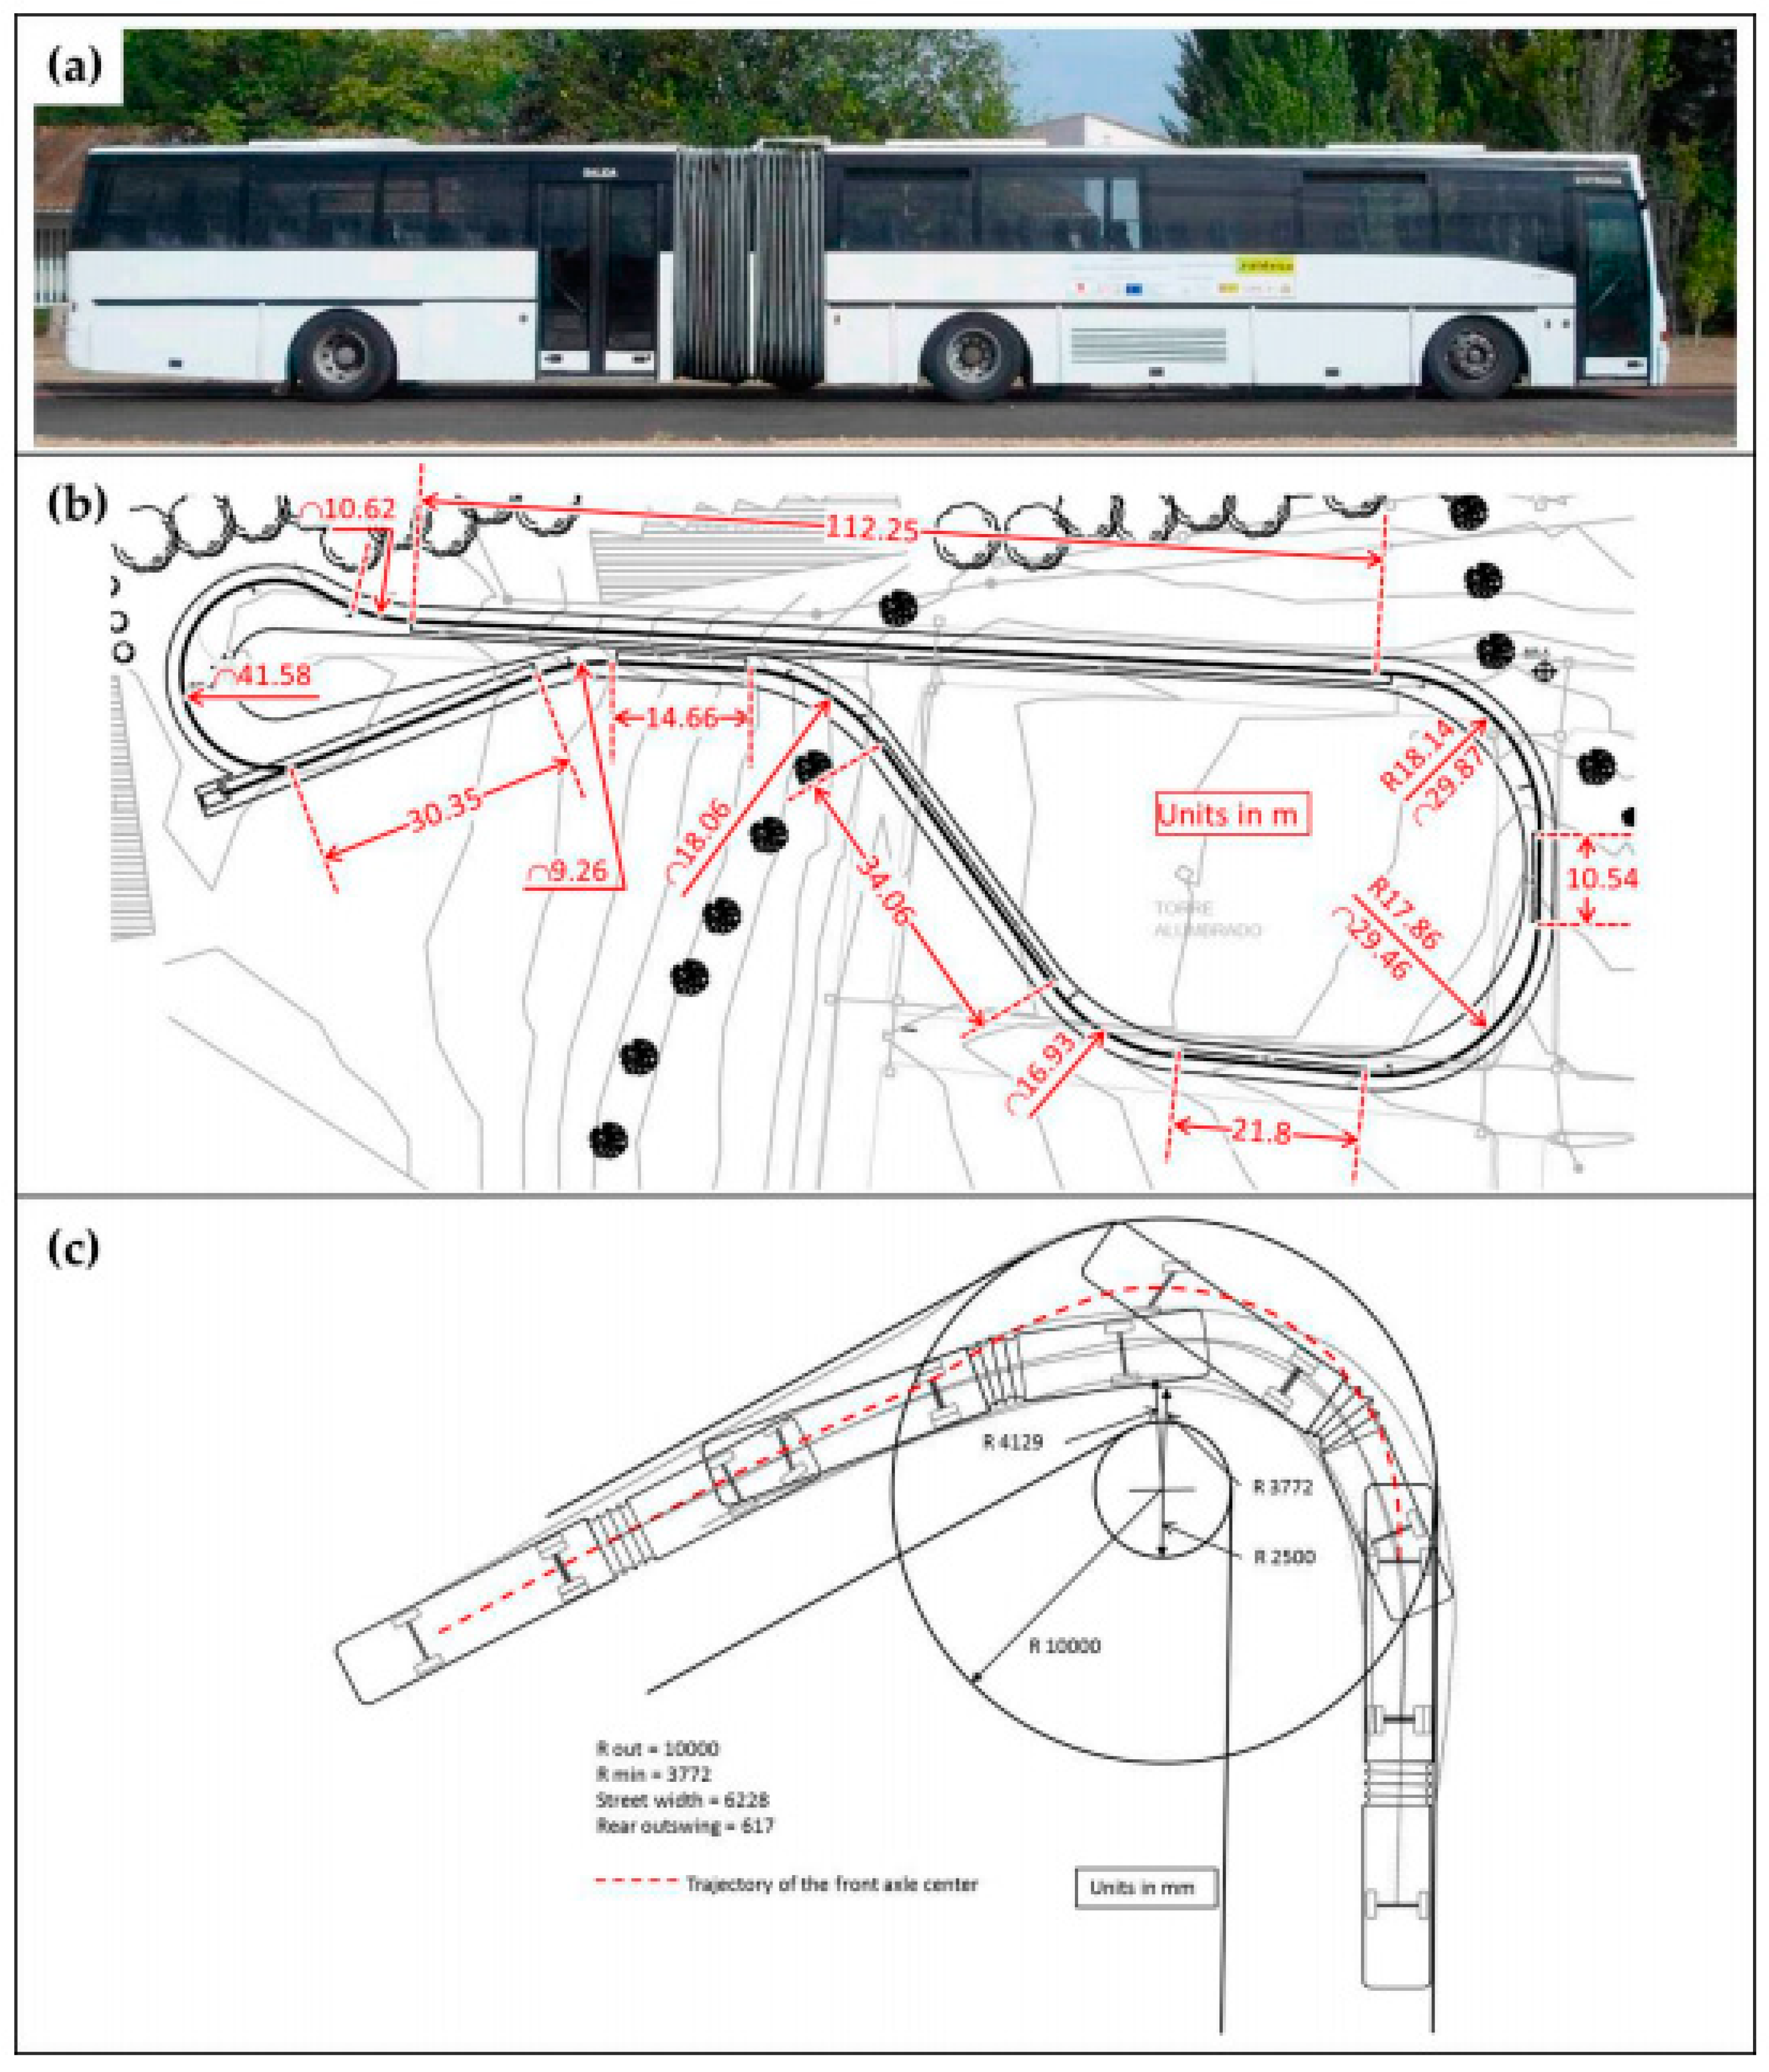
The fact that autonomous minibuses are already operating, despite the higher capacity of autonomous buses, can be attributed to their dimensions, safety, maintenance, and other complex reasons. Moreover, there are several tests of high capacity and articulated buses equipped with ITS and sensors that allow them to operate autonomously. A test of this kind was carried out with a Volvo B10M-ART-RA-IN articulated bus [11]. One such 18 m long bus was fully equipped and tested on a 385 m long private road in Arganda del Rey (Spain). To control speed and brakes, an electronically connected I/O board was used. At the same time, the steering was equipped with a 24-volt DC motor (150 watts) that also had an incremental optical encoder (2000 ppr) and a gear reduction box (74:1). Finally, obstacle detection was allowed, thanks to two Laser Imaging Detection and Ranging (LIDAR) systems (LMS-221 and LMS-291). The average speed during the test was between 10 km/h and 25 km/h. In comparison, 60 km/h was reached only in a straight section. It has been observed that the main challenge for autonomous systems in such cases is represented by the high mass and, consequently, the greater inertia, which is why the main observations showed longitudinal and lateral maneuvers of breaking and acceleration. Test results showed that the maximum error that exceeded trajectory tracking was at least 35 cm on curves with a reduced radius, while the all trajectory error was at least 10 cm. It can be assumed that such errors are considered acceptable, taking into account the bus’s elevated dimensions [12] (Figure 5).
Beyond performance, another essential benefit linked to a potential BRT autonomous system is with regard to capacity increase. This achievement is a consequence of the headway reduction between buses, which is allowed thanks to the CACC (cooperative adaptive cruise control). This system can perceive sudden changes in the speed of adjacent vehicles faster than a human driver. In this way, taking into account that vehicles will be able to brake promptly, the required safety distance while they are moving will be shorter compared to that of the human-driven vehicles. Together with shorter headway, this will form the so-called platooning, and with this asset, the BRT system will increase its capacity, emulating that of rail transit systems [13].
4. BRT Systems Applications
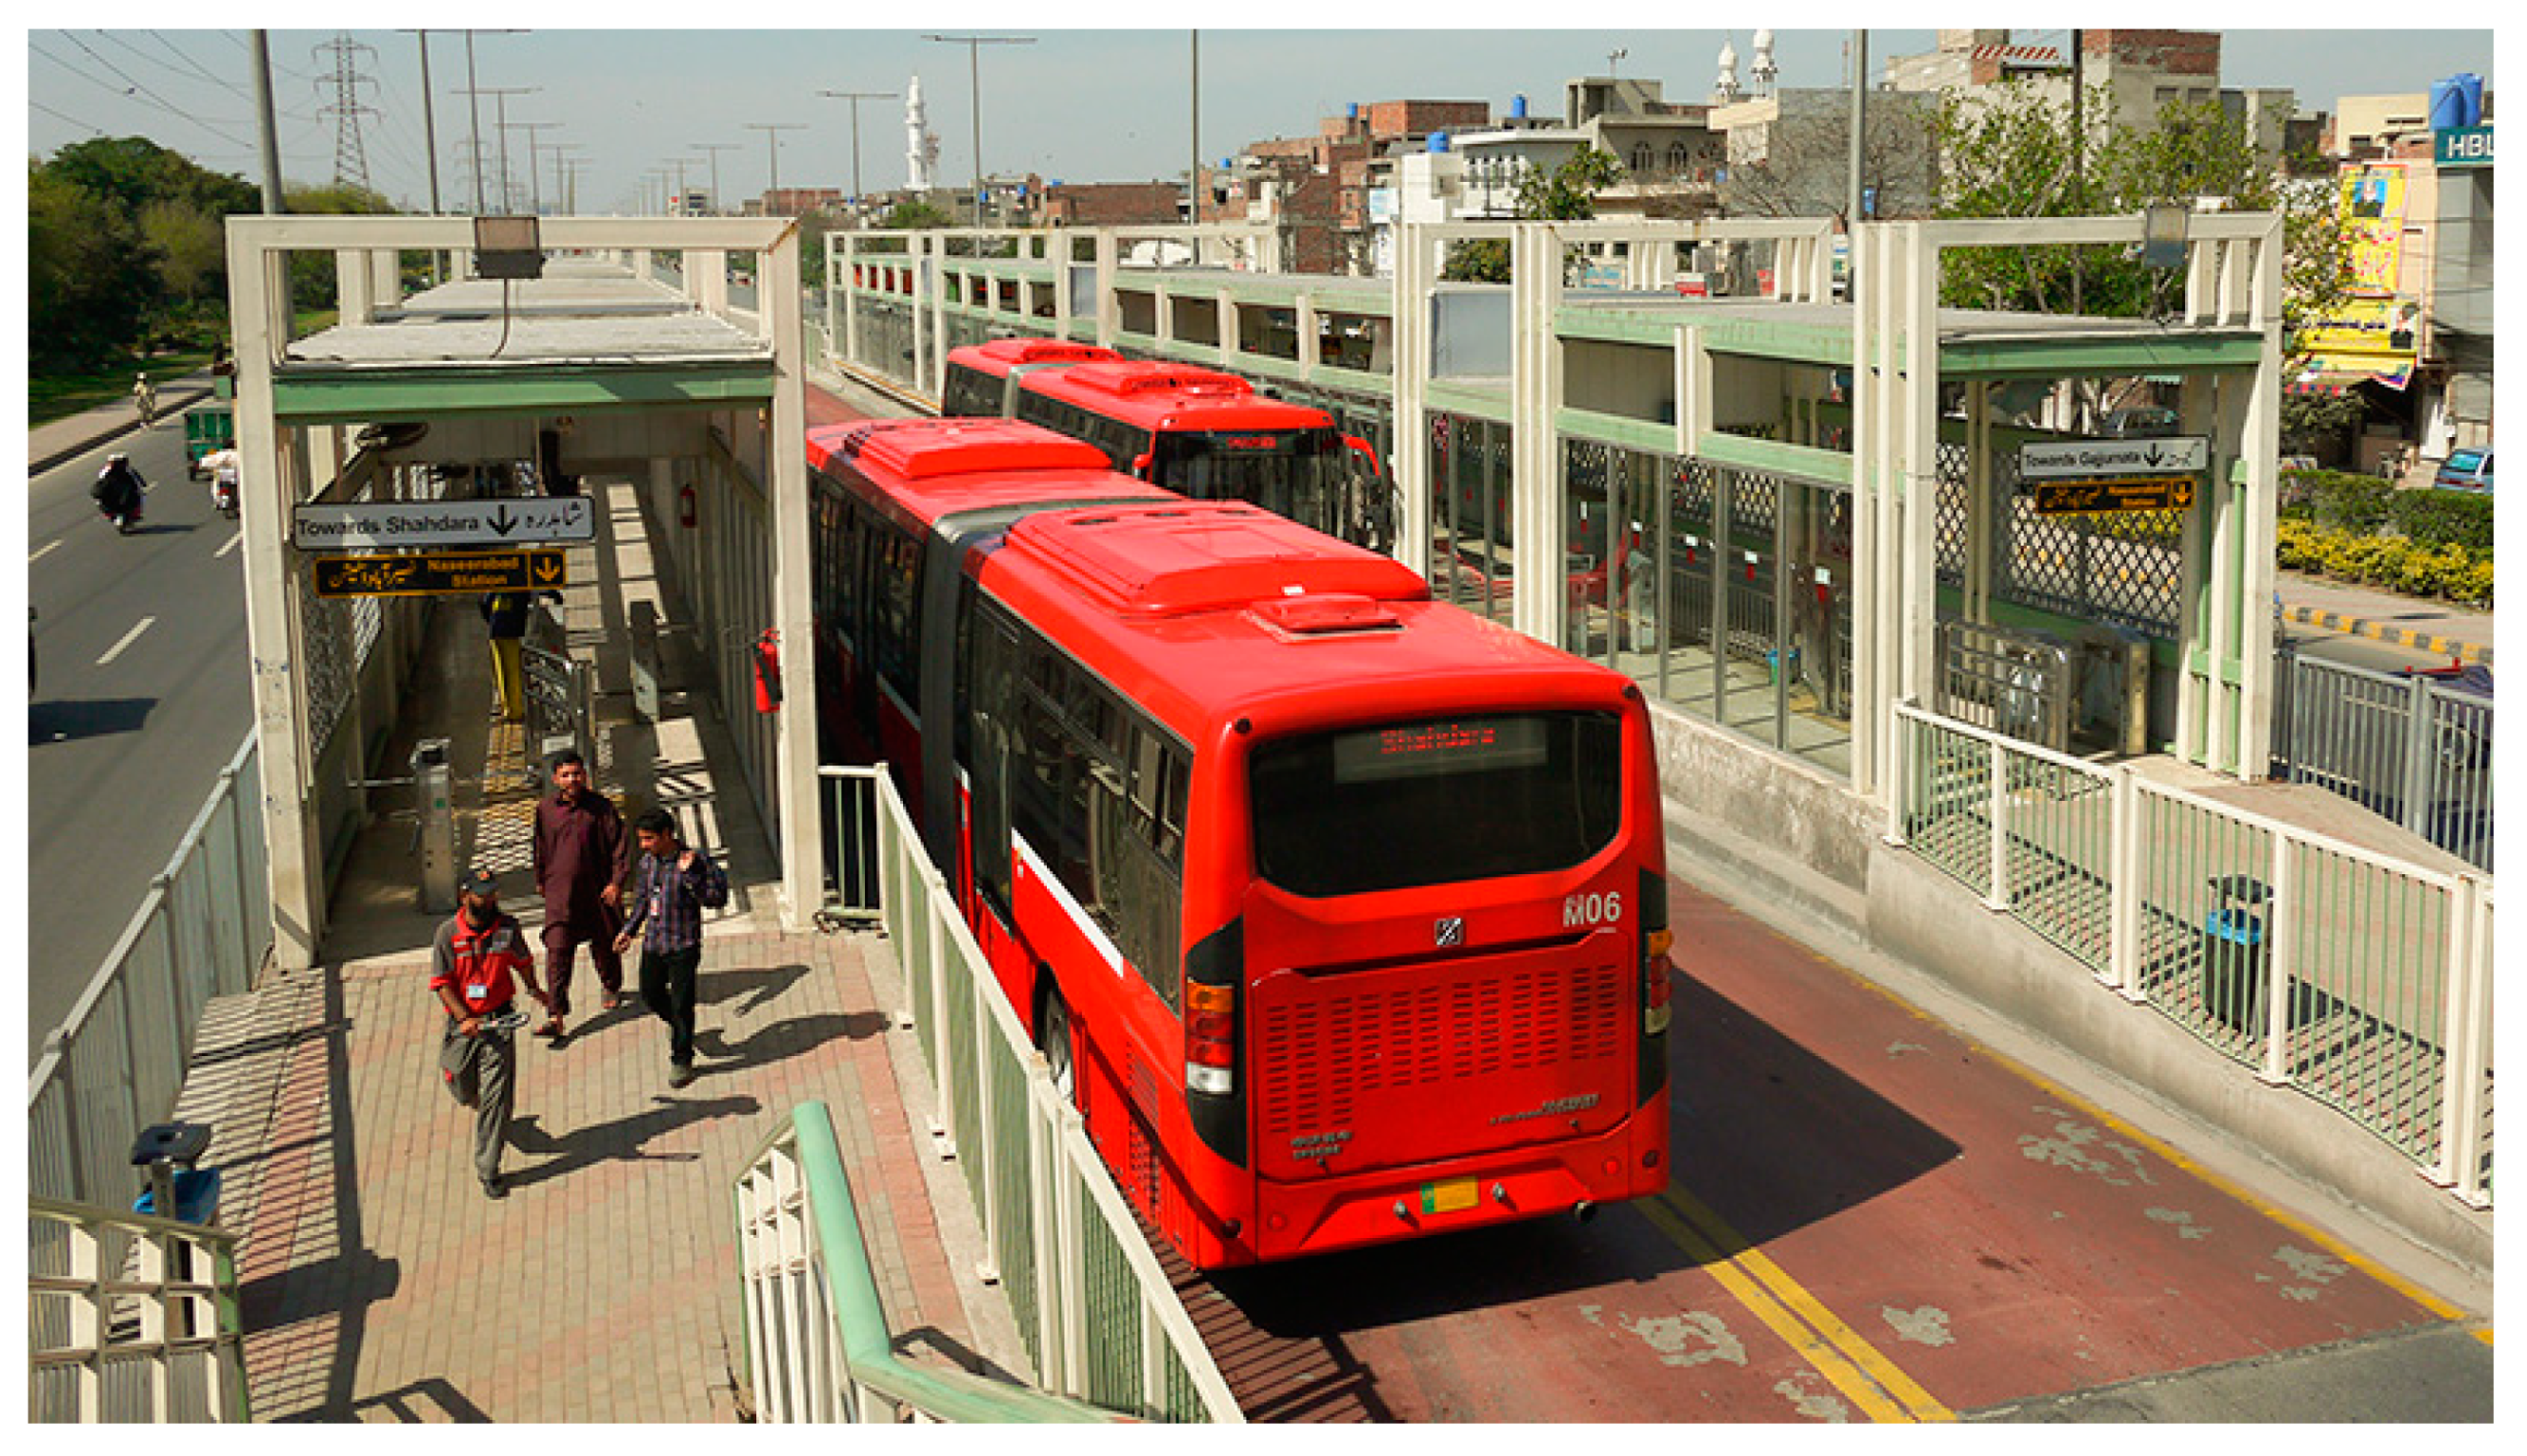
The reduced cost–benefit ratio of implementing BRT systems represents a significant turning point for several communities, not only in terms of livability, but also economic gain, since cities also consider the urban redevelopment brought by BRT systems to increase their international attractiveness with consequent positive implications from a tourist point of view. A typical example of BRT’s benefits in a developing country is represented by the Lahore case in Pakistan, a city of at least eleven million inhabitants where a BRT system was activated in 2013. It operates in a reserved lane located on a 27 km long corridor with an operational speed of 26 km/h and 25 stations, and manages a quantity of 180,000 daily passengers [14,15]. With regard to performance, due to a fleet of sixty-four buses, there is a headway of three minutes. In terms of Lahore’s benefits, the population density passed from 268 persons/acre to 299 persons/acre due to the increase in new construction in areas close to stations.
In conclusion, from an economic point of view, there were investments of almost $140 million, creating 800 new employees [16,17]. In Pakistan, the city of Lahore (Figure 6) is not the only case where BRT has provided significant benefits from an economic point of view and an environmental one. For instance, Multan’s BRT system was studied to evaluate the skills and performances of hybrid energy-based buses. Based on DEA (data envelopment analysis), the efficiency range of 21 stations (except one for the hybrid bus system) was almost equal to 1, where the only exception was at a stop where the value was 0.77 [18].
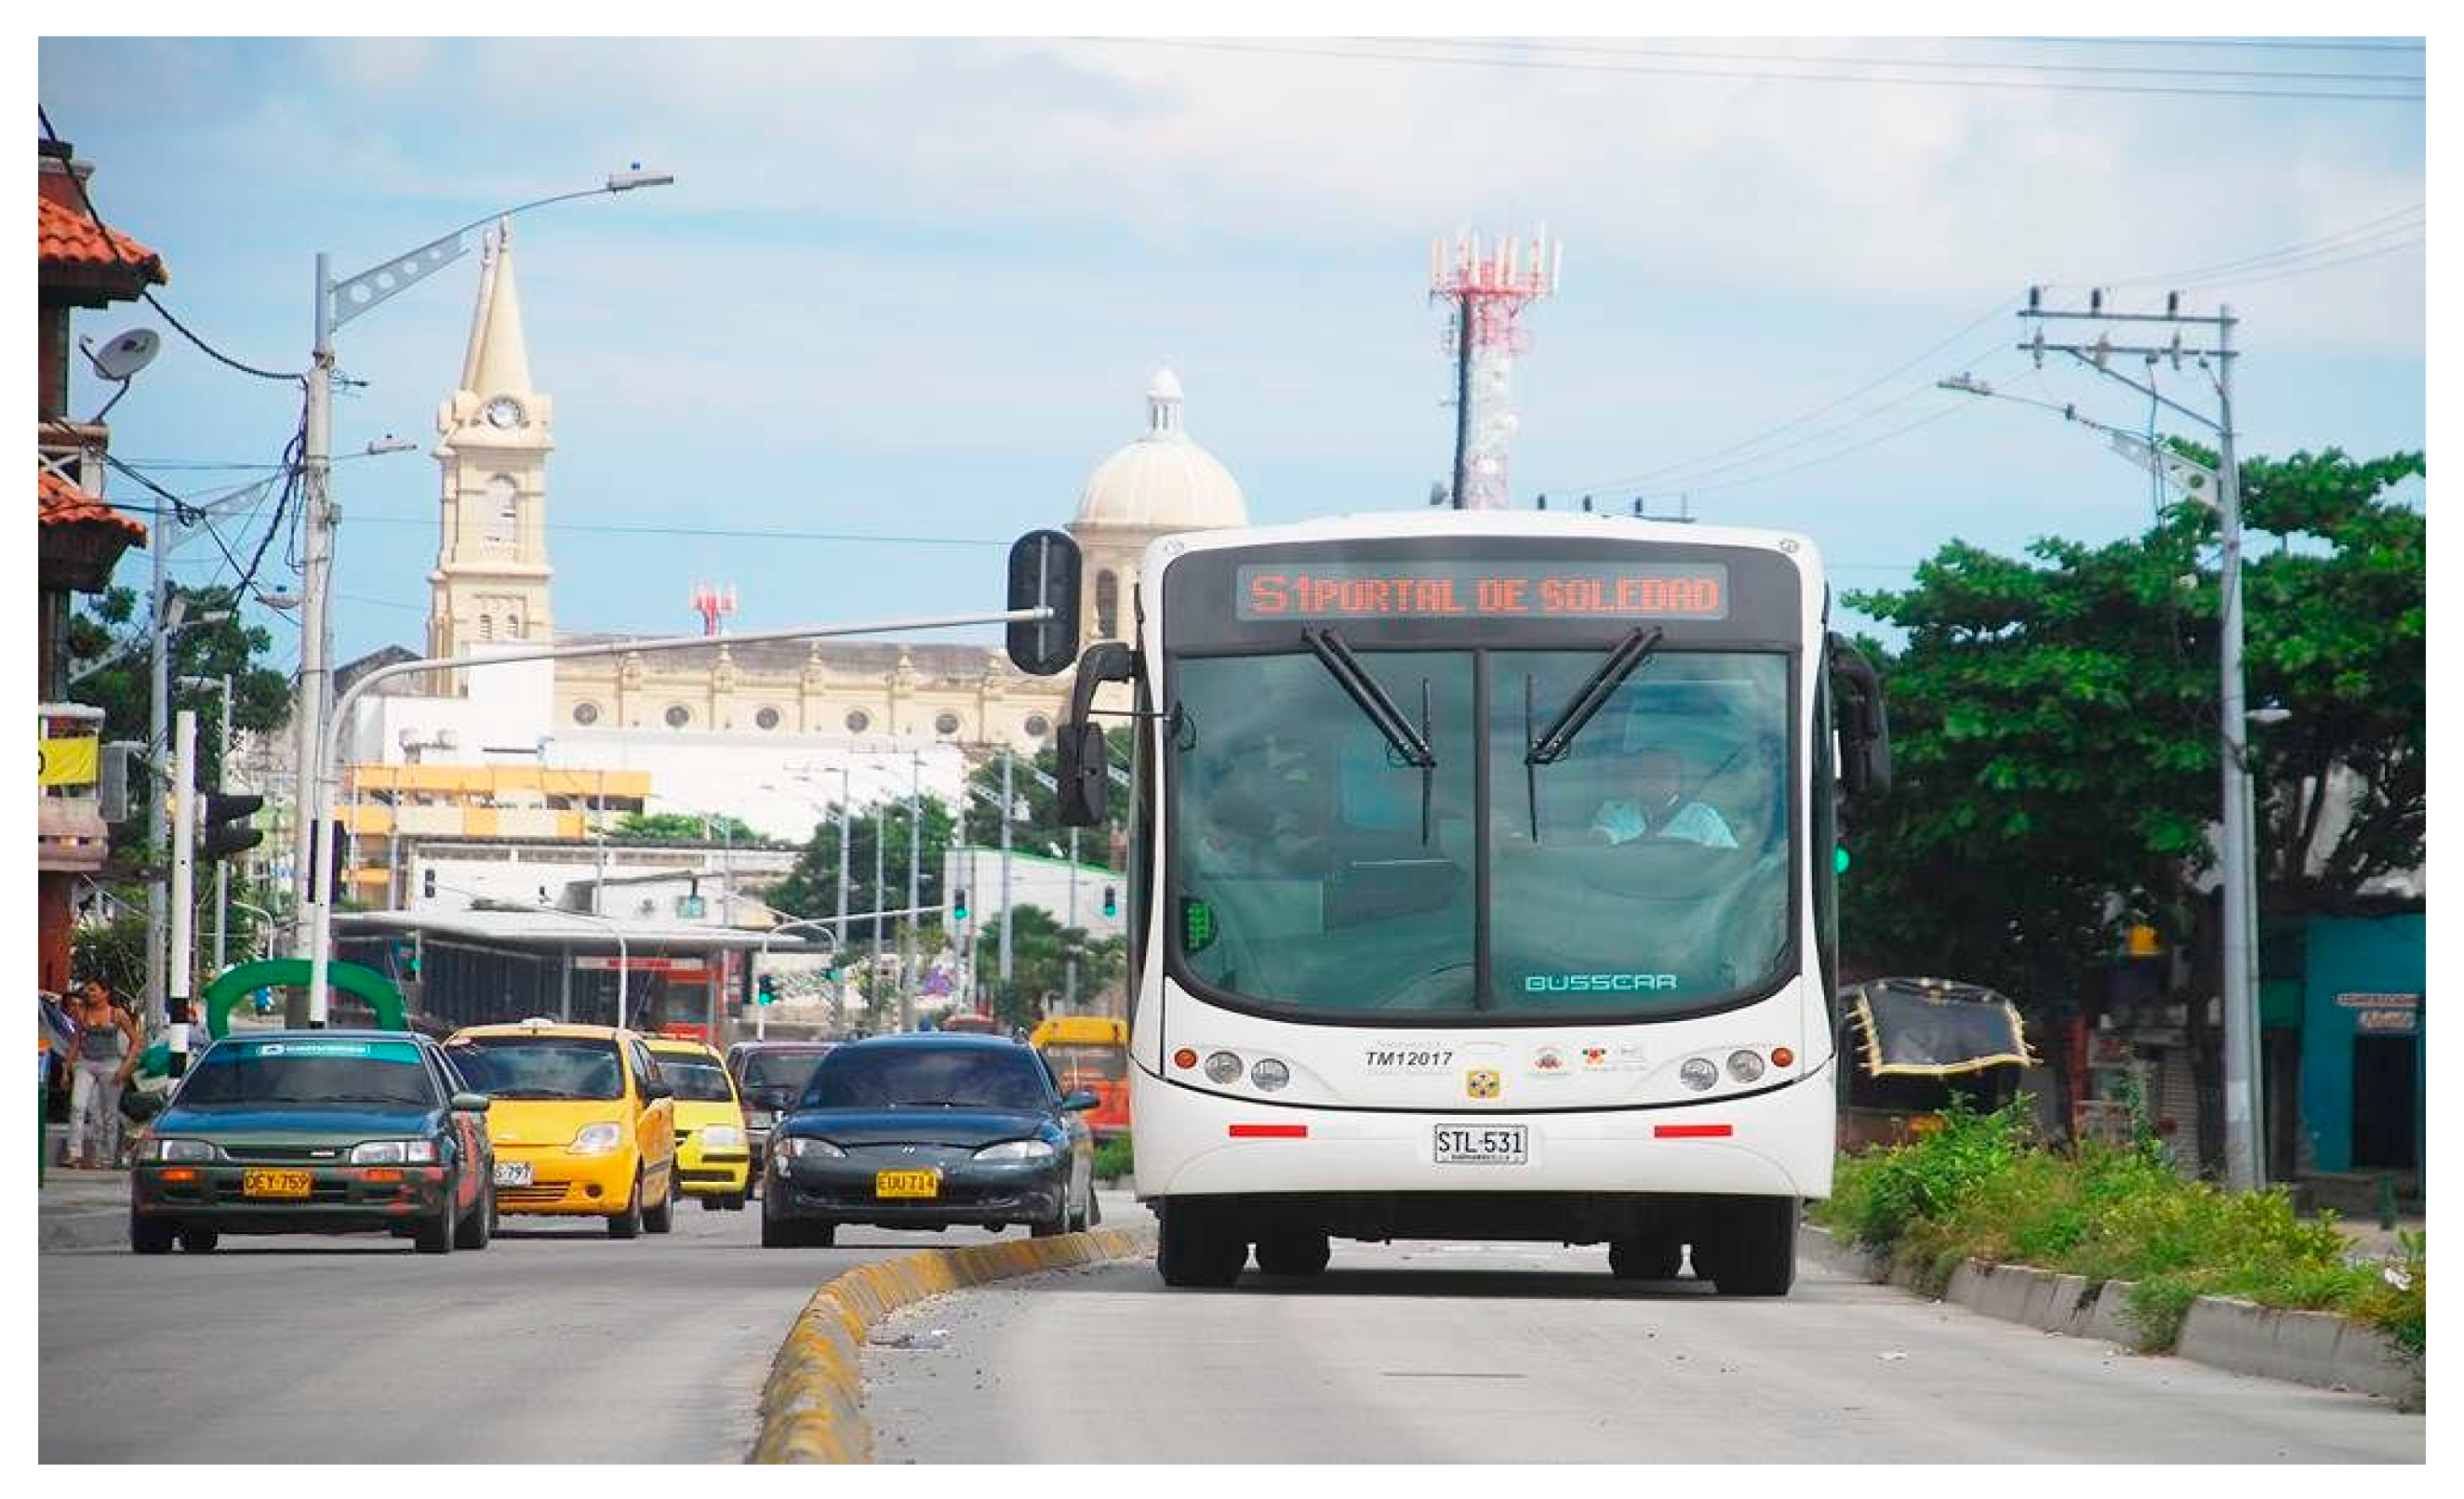
Taking into account the data about South America, considering that it is the continent where the BRT system was first established, it is still the one in which there are more significant examples of such travel networks; moreover, it hosts and is also the often-cited system that acts as a model at an international level, for instance, the “TransMilenio” of Bogotà (Colombia) [19]. The success of TransMilenio is related to the optimal outcomes in terms of profits during the first years that covered the expenses of planning and service provision easily with privately-operated buses. Such advantages led to the implementation of other interesting BRT systems in Colombia, like the one in Barranquilla [20,21]. This metropolitan area had significant urban segregation and inequality that also affected the transportation systems (Figure 7). Due to the rapid economic and urban growth, there was a relevant increase in congestion phenomena attributed to the quantity of private vehicles. A trunk-feeder BRT service was activated to manage such a situation, connecting Barranquilla and Soledad along a 14 km corridor with exclusive right-of-way. This system, named “Transmetro”, was also characterized by several feeder routes (190 km). One of the advantages of Transmetro is the free service offered for vehicles moving from the feeder to trunk route. To demonstrate how BRT systems attract private investment, this type of BRT system is characterized by a public-private partnership where the public part deals with operational and organizational aspects while private companies manage delivery service [22].
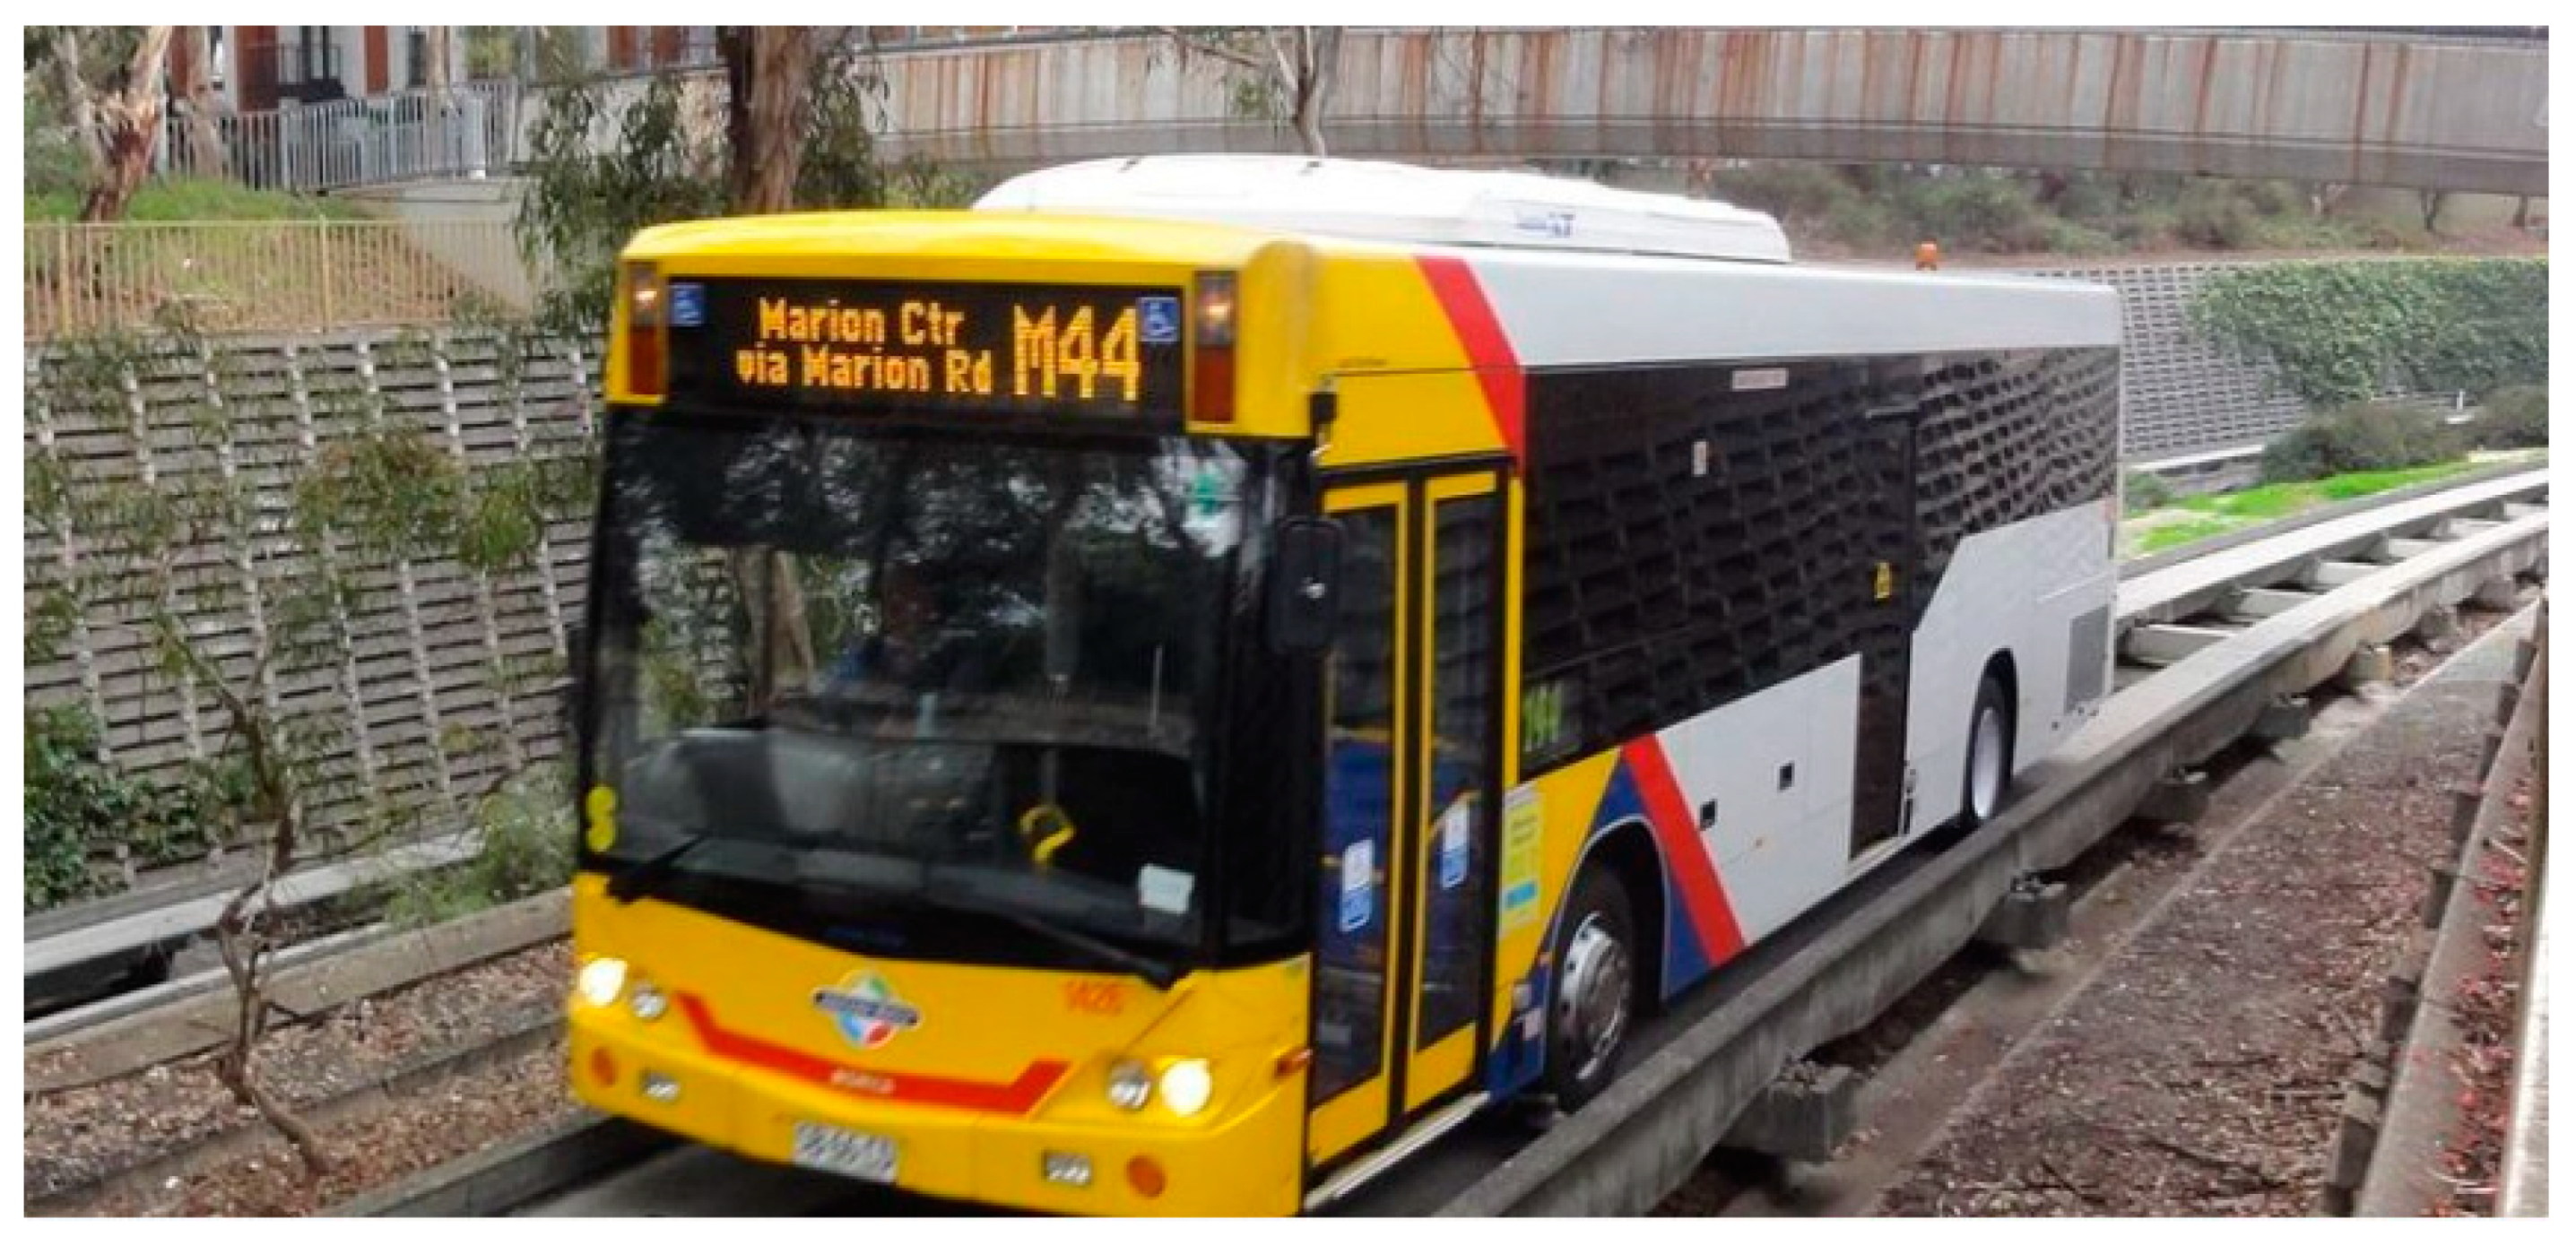
North America has one of the most recently inaugurated BRT, for example, Albuquerque (USA), which is a city with 560,218 inhabitants. It is characterized by two priority lanes 20.2 km and 21.97 km long, respectively, each one with twenty stations and serves 8100 daily passengers. It is not the most comprehensive system in the USA. It is useful to note that its peak frequency reaches eight bus/hour [23]. Moreover, the highest use of BRT systems is not always linked to the size of continents. North America has several cities with significantly lower passenger numbers than European ones. In Europe, BRT is most widespread in France, being active in 21 cities and with a total extension of 342 km, respectively 47.72% and 39.09% of all Europe. France’s most comprehensive system is in Lille (67 km), while the most recent is in Le Mans [23]. Considering its extension in Africa, BRT was not taken up as much as in other countries since it is only established in five cities. However, in Dar-es-Salaam, the most recently inaugurated system dates from 2016 and consists of just one corridor that is 21 km long, but with the highest number of daily passengers in Africa, equal to 180,000. In Oceania, BRT is mainly used in Australia, where it has an extension of 90 km and operates in three cities: Adelaide, Brisbane, and the metropolitan area of Sydney. The BRT system in Adelaide (Figure 8) is the smallest one with just one 12 km corridor. However, it is one of the first to be implemented globally, and its line is mainly characterized by the track-guided bus, a system composed of a specific platform where only the bus can drive. This type of intervention has been used to avoid the introduction of private vehicles altogether [24].
5. Discussion
Considering what has been discussed in previous sections, it is valuable to note that the combination of autonomous vehicles and BRT public transport systems would bring many benefits. The mere application of driverless vehicles would guarantee every citizen the ability to move freely in the city, reducing the number of vehicles by at least 80%. The potential success of this strategy is based on the concept of vehicle sharing by users, which must be promoted and facilitated mainly from an economic point of view, and subsequently, with intermodal platform implementation. It is well known that automation is not a new concept in metropolitan public transport operation. Therefore, their application to potential BRT systems with autonomous vehicles would not require lengthy delays, considering that globally, in 2016, there were already 37 cities with automated metro systems [25]. Furthermore, it is estimated that the spread of autonomous vehicles will occur quickly, facilitated by existing automation systems and technological innovations. Nowadays, the same thing cannot be assumed for BRT systems. This situation can be thoroughly explained with a comparison between case studies in Istanbul and Cairo. In Cairo, the BRT system was proposed as a solution to redevelop the inner city that was characterized by a high population density of at least 21,700 persons/sq.km, thus heavily inclined to congestion. It also aimed to provide an efficient connection with growing communities settled in the periphery. BRT was regarded as an additional solution achievable in three years and with low costs. However, the project was not realized due to a lack of user trust in the bus sector and skepticism regarding the placement of reserved lanes in an area subject to congestion. In Istanbul, due to a demographic increase of 38.3% and a high number of private vehicles in circulation (4.17 million private vehicles registered), there was a serious problem linked to congestion phenomena. Accordingly, a BRT system was developed by dedicating two lanes of the city’s main highway to buses, thus ensuring a considerable daily capacity (30,000 passengers per hour in peak hours) with headways of 20 s. It is important to remark that the first 18.5 km long stretch of the BRT line was implemented in 2007 in just 77 days. Analyzing such cases, considering that both cities are similar in terms of demographics and urban planning, it appears that, while for Cairo the lack of user trust has blocked development, in Istanbul, where the BRT system was implemented in a context of innovation and significantly as a solution to the continuous deferrals of the realization of LRT systems, BRT has achieved excellent results. For these reasons, taking into account that in some communities such as Cairo, BRT was not successful, the application of driverless systems would make it more attractive, especially considering that there are already autonomous vehicles (level 4) capable of operating in mixed traffic. Thus, the BRT system’s operational context with reserved lanes and right-of-way would be perfectly suitable [26,27,28,29,30].
6. Conclusions
This paper has offered an examination of some BRT systems developed worldwide, summarizing the background, general technical peculiarities, and the relationship with autonomous vehicles. Considering that, in infrastructure and civil engineering, efficiency is not the only requirement but is necessary to guarantee economic advantages, minimal environmental impacts and flexibility must be taken into account carefully. The BRT is a public transport system that reflects the requirements above-mentioned. It has developed mainly in South America, where it was implemented for the first time. Taking into account the positive implications, it has spread globally, especially in Europe. Among the innovations that have most strongly characterized BRT systems as part of the automotive sector is undoubtedly the advent of autonomous vehicles, which would amplify the already efficient and robust performance of the aforementioned public transport systems, even if only in relation to the precisions of maneuvers, and the consequent possibility to reduce the safety distances between vehicles while traveling, thus increasing their frequency. ADAS systems are now used more often for minibuses with a maximum capacity of around 15 people. Therefore, it is possible to use them in a BRT system, the advantage of which is also its high capacity. This implication could be relevant even for small communities. Nevertheless, ADAS systems have been tested with excellent results, even in high capacity and bi-articulated buses. BRT can be an upgrading solution for existing bus line systems that allow contexts with limited economic means to guarantee high-efficiency services, with significant positive implications both in economic and livability terms.
Author Contributions
The authors contributed equally to this work. All authors have read and agreed to the published version of the manuscript.
Funding
This research received no external funding.
Acknowledgments
This work was related to the D.D. 407 of 27 February 2018 “AIM—Attrazione e Mobilitaà Internazionale” issued by the Italian Ministry of Education, University, and Research in the implementation of Action I.2 “Mobilitaà dei Ricercatori” Asse I—PON R&I 2014–2020, taking into account the written amendment procedure of the PON R&I 2014–2020, pursuant to articles 30 and 90 of Regulation (EU) 1303/2013 started on 21 February 2018 as well as the relevant implementation regulations.
Conflicts of Interest
The authors declare no conflict of interest.
References
- Global BRTData. Available online: brtdata.org (accessed on 27 August 2020).
- Chatman, D.; Rayle, L.; Palacios, M.S.; Cervero, R. Sustainable and Equitable Transportation in Latin America, Asia and Africa: The Challenges of Integrating BRT and Private Transit Services; UC Berkeley Center for Future Urban Transport Institute of Transportation Studies Institute for Urban and Regional Development Department of City and Regional Planning University of California: Berkeley, CA, USA, 2019. [Google Scholar]
- Prayogi, L.; Sari, Y. The Approaches on Assessing the Influence of a Bus Rapid Transit System on Urban Development. Int. J. Built Environ. Sci. Res. 2019, 3, 105–110. [Google Scholar] [CrossRef]
- The Online BRT Planning Guide. Available online: https://brtguide.itdp.org/branch/master/guide/ (accessed on 27 August 2020).
- Dion, F.; Rakha, H.A.; Kang, Y.-S. Comparison of delay estimates at under-saturated and over-saturated pre-timed signalized intersections. Transp. Res. Part B Methodol. 2004, 38, 99–122. [Google Scholar] [CrossRef]
- Tamannaei, M.; Fazeli, M.; Dana, A.C.F.; Mansourianfar, H. Transit Signal Priority: Proposing a Novel Algorithm to Decrease Delay and Environmental Impacts in BRT Route Intersections. Int. J. Transp. Eng. 2019, 7, 153–169. [Google Scholar]
- Society of Automotive Engineers. Available online: www.sae.org (accessed on 27 August 2020).
- Intelligent Transport. Available online: www.intelligenttransport.com (accessed on 27 August 2020).
- Forbes. Available online: www.forbes.com (accessed on 27 August 2020).
- Arena, F.; Pau, G.; Severino, A. An Overview on the Current Status and Future Perspectives of Smart Cars. Infrastructures 2020, 5, 53. [Google Scholar] [CrossRef]
- Navya: Self-Driving Made Real. Available online: navya.tech (accessed on 27 August 2020).
- Montes, H.; Salinas, C.; Fernández, R.; Armada, M. An Experimental Platform for Autonomous Bus Development. Appl. Sci. 2017, 7, 1131. [Google Scholar] [CrossRef] [Green Version]
- Lutin, J.; Consultant, I. Not If, but When: Autonomous Driving and the Future of Transit. J. Public Transp. 2018, 21, 92–103. [Google Scholar] [CrossRef]
- Shah, S.A.R.; Shahzad, M.; Ahmad, N.; Zamad, A.; Hussan, S.; Aslam, M.A.; Khan, A.R.; Asif, M.A.; Shahzadi, G.; Waseem, M. Performance Evaluation of Bus Rapid Transit System: A Comparative Analysis of Alternative Approaches for Energy Efficient Eco-Friendly Public Transport System. Energies 2020, 13, 1377. [Google Scholar] [CrossRef] [Green Version]
- Far Est Mobility—BRT & Urban Transport Planning. Available online: www.fareast.mobi (accessed on 27 August 2020).
- Wirasinghe, S.C.; Kattan, L.; Rahman, M.M.; Hubbell, J.; Thilakaratne, R.; Anowar, S. Bus rapid transit—A review. Int. J. Urban Sci. 2013, 17, 1–31. [Google Scholar] [CrossRef]
- Prayogi, L.; Jakarta, U.M. Bus Rapid Transit-oriented Development: A Review of Built Environment Qualities Potentially Triggering Bus Rapid Transit Passengers’ Modal Shift. Int. J. Eng. Res. 2018, 7, 302–305. [Google Scholar]
- Bogumil, V. Quantitative Assessment of the Bus Rapid Transit Efficiency in Solving the Problems of Motorization of Modern Cities. Glob. J. Manag. Bus. Res. 2019. Available online: https://journalofbusiness.org/index.php/GJMBR/article/view/2718 (accessed on 27 August 2020).
- Nikitas, A.; Kougias, I.; Alyavina, E.; Njoya Tchouamou, E. How Can Autonomous and Connected Vehicles, Electromobility, BRT, Hyperloop, Shared Use Mobility and Mobility-As-A-Service Shape Transport Futures for the Context of Smart Cities? Urban Sci. 2017, 1, 36. [Google Scholar] [CrossRef] [Green Version]
- Basheer, M.A.; Boelens, L.; Bijl, R. Bus Rapid Transit System: A Study of Sustainable Land-Use Transformation, Urban Density and Economic Impacts. Sustainability 2020, 12, 3376. [Google Scholar] [CrossRef] [Green Version]
- Ardila, D.S. Global policies for moving cities: The role of think tanks in the proliferation of Bus Rapid Transit systems in Latin America and worldwide. Policy Soc. 2020, 39, 70–90. [Google Scholar] [CrossRef] [Green Version]
- National Academies of Sciences, Engineering, and Medicine. Analysis of Recent Public Transit Ridership Trends; The National Academies Press: Washington, DC, USA, 2020. [Google Scholar] [CrossRef]
- Arena, F.; Ticali, D. The development of autonomous driving vehicles in tomorrow’s smart cities mobility. AIP Conf. Proc. 2018, 2040, 140007. [Google Scholar] [CrossRef]
- Arena, F.; Pau, G.; Severino, A. V2X Communications Applied to Safety of Pedestrians and Vehicles. J. Sens. Actuator Netw. 2020, 9, 3. [Google Scholar] [CrossRef] [Green Version]
- UITP-Advancing Public Transport, Policy Brief-Autonomous Vehicles: A Potential Game Changer for Urban Mobility; UITP: Brussels, Belgium, 2017.
- UITP-Advancing Public Transport-Transforming Cities with Bus Rapid Transit (BRT) Systems; UITP: Brussels, Belgium, 2019.
- Lindau, L.A.; Hidalgo, D.; Lobo, A.D.A. Barriers to planning and implementing Bus Rapid Transit systems. Res. Transp. Econ. 2014, 48, 9–15. [Google Scholar] [CrossRef]
- Nguyen, M.H.; Pojani, D. Chapter Two—Why Do Some BRT Systems in the Global South Fail to Perform or Expand? Elsevier: Amsterdam, The Netherlands, 2018. [Google Scholar]
- TCRP. Report 90-Volume 1: Case Studies in Bus Rapid Transit. Available online: https://nacto.org/docs/usdg/tcrp_rpt_90_case_studies_volume_1_levinson.pdf (accessed on 27 August 2020).
- Hidalgo, D.; Graftieaus, P. Bus Rapid Transit Systems in Latin America and Asia: Results and Difficulties in 11 Cities. Transp. Res. Rec. J. Transp. Res. Board 2008, 2072, 77–88. [Google Scholar] [CrossRef]
Figure 1.
General Bus Rapid Transit (BRT) corridor section, u.m. = meters.

Figure 2.
Vehicle delay at intersection.

Figure 3.
Vehicle automation levels.

Figure 4.
Example of an autonomous minibus.

Figure 5.
(a) Tested articulated bus, (b) inner road dimensions, (c) bus trajectory analysis.

Figure 6.
Lahore BRT system.

Figure 7.
Baranquilla’s BRT system.

Figure 8.
Adelaide’s BRT system.


Table 1.
Global Bus Rapid Transit (BRT) data.
| Regions | Passengers per Day | Number of Cities | Length (km) |
|---|---|---|---|
| Africa | 491,578 (1.44%) | 5 (2.89%) | 131 (2.52%) |
| Asia | 9,471,593 (27.83%) | 44 (25.43%) | 1625 (31.26%) |
| Europe | 1,613,580 (4.74%) | 44 (25.43%) | 875 (16.84%) |
| Latin America | 21,032,465 (61.81%) | 55 (31.79%) | 1829 (35.19%) |
| Northern America | 981,043 (2.88%) | 20 (11.56%) | 627 (12.06%) |
| Oceania | 436,200 (1.28%) | 5 (2.89%) | 109 (2.09%) |
Table 2.
Comparison of the public transport systems parameters.
| Type of Transit Mode | Capital Costs (Million US$/km) | Capacity (pphpd) | Operating Speed (km/h) |
|---|---|---|---|
| Standard bus | - | 3180–6373 | 10–30 |
| BRT | Up to 15 | Up to 55,710 | 18–40+ |
| LRT | 13–40 | Up to 30,760 | 18–40 |
| Heavy rail system | 40–350 | 52,500–89,950 | 20–60 |
Table 3.
Typical BRT configuration according to demand level.
| Transit Passengers per Hour per Direction | Type of BRT Solution |
|---|---|
| Less than 2000 | Simple bus priority, normally without physical segregation, possible part-time bus lane. |
| 2000 to 8000 | Segregated median busway used by direct services reducing the need to transfer. |
| 8000 to 15,000 | Segregated median busway used by trunk services requiring transfers but benefiting from fast boarding and operating speeds. Transit priority at intersections. |
| 15,000 to 45,000 | Segregated median busway, with overtaking at stops; possible use of express and stopping services. Use of grade separation at some intersections and some form of signal priority at others. |
| Over 45,000 | This level of demand is very rare on existing bus systems. It is possible, however, to design a BRT system that would serve up to even 50,000 passengers per hour per direction. This can be achieved with full segregation, double busway, a high proportion of express services and multiple stops. This capacity could also be handled by spreading the load through two or more close corridors. |
Publisher’s Note: MDPI stays neutral with regard to jurisdictional claims in published maps and institutional affiliations. |
© 2020 by the authors. Licensee MDPI, Basel, Switzerland. This article is an open access article distributed under the terms and conditions of the Creative Commons Attribution (CC BY) license (http://creativecommons.org/licenses/by/4.0/).
Share and Cite
MDPI and ACS Style
Trubia, S.; Severino, A.; Curto, S.; Arena, F.; Pau, G. On BRT Spread around the World: Analysis of Some Particular Cities. Infrastructures 2020, 5, 88. https://0-doi-org.brum.beds.ac.uk/10.3390/infrastructures5100088
AMA Style
Trubia S, Severino A, Curto S, Arena F, Pau G. On BRT Spread around the World: Analysis of Some Particular Cities. Infrastructures. 2020; 5(10):88. https://0-doi-org.brum.beds.ac.uk/10.3390/infrastructures5100088
Chicago/Turabian StyleTrubia, Salvatore, Alessandro Severino, Salvatore Curto, Fabio Arena, and Giovanni Pau. 2020. "On BRT Spread around the World: Analysis of Some Particular Cities" Infrastructures 5, no. 10: 88. https://0-doi-org.brum.beds.ac.uk/10.3390/infrastructures5100088