Assessing Transportation Patterns in the Azores Archipelago
by
 , , and
Rui Alexandre Castanho
1,2,3,4,5,* ,
,
José Manuel Naranjo Gómez
3,4,6 ,
,
Ana Vulevic
3,7,
Arian Behradfar
8 and
and
Gualter Couto
1 1
School of Business and Economics and CEEAplA, University of Azores, 9500 Ponta Delgada, Portugal
2
Faculty of Applied Sciences, WSB University, 41-300 Dabrowa Górnicza, Poland
3
VALORIZA-Research Centre for Endogenous Resource Valorization, 7300 Portalegre, Portugal
4
CITUR-Madeira-Centre for Tourism Research, Development and Innovation, 9000-082 Madeira, Portugal
5
CNPQ Research Group Aquageo Ambiente Legal, University of Campinas (UNICAMP), Campinas, SP 13083-970, Brazil
6
Agricultural School, University of Extremadura, 06007 Badajoz, Spain
7
Department of Urban Planning and Architecture, Institute of Transportation—CIP, 11000 Belgrade, Serbia
8
Department of Geomatics and Spatial Information Engineering, College of Engineering, University of Tehran, Tehran 1439957131, Iran
*
Author to whom correspondence should be addressed.
Infrastructures 2021, 6(1), 10; https://0-doi-org.brum.beds.ac.uk/10.3390/infrastructures6010010
Submission received: 1 December 2020
/
Revised: 10 January 2021
/
Accepted: 11 January 2021
/
Published: 15 January 2021
Abstract
:It is well-known that the ultra-peripheral territories as Islands present several limitations such as the lack of resources, restricted land, mass tourism, and barriers to movement, and connectivity between urban centers. These obstacles make ultra-peripheral regions suitable case studies considering their territorial governance and consequently, sustainable development and growth. Thus, transportation and infrastructure sustainability in these regions are not an exception. Considering all the obstacles present in these regions, the accessibility and connectivity patterns that the local population has in these territories should be assessed and monitored. Thereby, through exploratory tools, the present research assumes to examine, using accessibility and connectivity indicators, the consequences across the social-economic dimension that the regional transportation and infrastructure should convey to the Azores Islands Archipelago populations. Therefore, this article allows us to set the present situation regarding this region’s accessibility and connectivity patterns, creating an additional tool for supporting the main actors’ design and implementation of these territories’ future plans and strategies. Besides, this study enables us to recognize that Pico, Flores, and São Miguel are the ones with better accessibility patterns within the Azores Archipelago.
1. Introduction
Accessibility is a concept mostly used in transport and infrastructure planning researches. It is also a key term in all socio-economic models with a spatial-temporal sphere [1]. Proper accessibility is a significant and impressive part of financial and economic competitiveness and social sustainability, fostering growth, and leading to greater cohesion in both socio-economic and territorial dimensions [2].
The dynamics in the intensity of developments at various locations in an area affect travel demand and the transport services’ performance and alter the accessibility of several areas of a region. The controversial association between transport services and spatial possibilities affects both accessibility and spatial distribution levels [3].
In this regard, there has been a growing interest in the concept of accessibility over the past decades, with many studies discussing the measurement tools and assessment approaches of accessibility in a spatio-temporal framework. This framework resulted in the development of accessibility models and various accessibility-based methodologies used in planning and design approaches, adequate monitoring and enforcement of existing services, policy improvement, regional knowledge contribution, and alternative transport forms. The proposed cases are the main topics in transforming mobility studies representing opportunities to accelerate the creation and deployment of sustainability in territorial development [4].
In this manner, the transportation and infrastructure sustainability in insular regions is not an exception. Recognizing this typology of development, especially for islands with specific socio-economic bases and disparate spatial distribution, sustainable infrastructure planning through accessibility measures is a critical factor in regional development. Accessibility plays a remarkable role in infrastructure efficiency due to the significant spatial limitations of insular territories. Integrated connectivity regarding the regional level of accessibility and potential dynamics based on territorial impact assessment is vital for the proposed regions [5]. Although the accessibility measurement applied is not different from the conventional method of calculating accessibility.
In the view of remote low-density territory features shown by the Azores Autonomous Region (AAR), insular territories constitute a unique situation distinct from other regions. The contribution of spatial separation, geographical barriers, heterogeneous social elements, and insufficient transport facilities and communication links resulted in structural constraints that seriously prejudice this region’s territorial development [6]. Furthermore, improvement of regional infrastructure networks linked to the level of accessibility is one of the main priorities in the “Convergence Objective,” which aims to ensure efficiency in cohesion and balance in the AAR. This regional operational plan contributes to providing access to a higher level of qualification and improving the local infrastructure network [7].
The evidence provided from this case study supports the judgment that in sparsely populated areas such as sparsely populated parts of the island as the most remote areas, accessibility to traffic and infrastructure is of particular importance. The secondary transport network in scarcely inhabited parts of the island is vital, and these are the so-called. “Vital links” for rural areas for the delivery of essential goods and services to the population in remote settlements, as well as their logistical function in regional economies that are often highly dependent on continuous exports Natural Resources. Also, the mismatch in transport accessibility affects the potential to reduce housing attractiveness, resulting in accelerating existing depopulation trends. On the other hand, in unpredictable disasters caused by climate change, even the temporary loss of access to emergency services and disaster relief services can pose severe problems for remote settlements.
The evaluation includes the transport infrastructure and accessibility to develop a measurement method that uses the vital measures to properly analyze the accessibility based on the insular features and relevant principles [8]. In this manner, this study aims to identify and investigate the indicators to assess the subsequent accessibility dynamics in the AAR as an insular region since the accessibility indicator used provides us vital information to identify isolated areas and more connected areas. The first ones have more problems in order to get socioeconomic development.
Contextually, this article, besides the actual introductory section, covers a brief state-of-the-art regarding the insularity and transportation infrastructure and a brief description of the case study. After, it follows with the methodological framework as well as with the consequent results and their discussion. Finally, this article ends with the study’s main conclusions, their limitations, and some future research lines on this topic.
2. Insularity and the Transportation Infrastructure: A Brief Review
From the functional perspective, transportation infrastructure is a large-scale public work that influences regional politics, economy, society, technology development, environmental protection, public health, and security [9]. Based on the studies by Grimsey et al. [10], it is more significant to classify infrastructure than to establish it, and the key to classifying the infrastructure is designating its specific features. Transport infrastructure has the key features of general infrastructure—i.e., high investment, income and return volatility, diversification, or long-term liability adoption [11,12].
Insular areas constitute a special category of space because of their particular features, which make them different from other spatial entities and which become reasons for geographical and socio-economic isolation and for increasing inequities on a local and trans-regional level. Indubitably, we are discussing about an exceptionally fragile environment of multi-factorial peripheralization. Such a peripheralization is related to distances from central areas, level of accessibility, dynamics of the collaboration relationships through developing networks, as well as the level of the developments and degree to which they are depended on the planning process of insular regions.
In several situations, it is hard to share the economic and social life standards on an equal basis for the island communities, confronting critical barriers and insulation due to their distinct position and specifics. Islands transport policies are influenced by insularity and vice versa. Thus, “insularity” implies a particular location and characteristics related to several islands along with several other features. The socio-economic and demographic dynamics and trends that arise from these regions are sensitively linked with economic and social isolation, resource insufficiency, land management restrictions, and expensive operational costs. The mentioned issues can be considered as the main challenges of infrastructure sustainability in these regions [13].
Island transport policy has to ensure the long-term sustainability of services, an attribute that mandates the necessity for a dynamic approach that provides the ability to identify and assess the effectiveness of transport services regularly and a level of accessibility that promotes their sustainability the territorial cohesion objectives [14].
It has already been noted that the insular areas and islands have a low level of accessibility at the regional scale because of simple conventional measures [15]. This issue is mainly caused by significant insularity limitation due to geographical context of these regions. Furthermore, the autonomous regions of the Azores are classified as outermost regions (ORs). These territories have to deal with several particular obstacles such as remoteness, smallness, and vulnerability that are considered as the three main interconnected characteristics: challenging topography and climate and economic dependencies. The combination of these factors causes the accessibility gap in the ORs. A better understanding of accessibility can stimulate sustainable infrastructure planning with greater socio-economic inclusion in these regions [16].
While many studies and practical approaches are continuously emerging on this subject, there are still many challenges about the impact of the accessibility level on transport infrastructure in insular areas. The accessibility modules are mostly connected with land use patterns, transport infrastructure, transient elements, and unique features and tendencies. Some economic indicators are used to display quantifiable from the stakeholder’s perspective [5].
Numerous researchers have analyzed the relationship between transport infrastructure accessibility and insularity. Hierarchies in transport infrastructures of insular territories [17], competitive transport mode choice [18], routing issues for freight transport [19], and strategic infrastructure comparison in insular territories [20] can be considered as accessibility assessment based on the mobility studies in these regions. Congestion evaluation of regional accessibility is available to study congestion effects in insular areas [21]. Travel time and behavior analysis based on accessibility scores derived from suitable indicators was conducted to ascertain the limited transport infrastructure [22]. There has been great diversity in accessibility studies to determine the provision of transport infrastructure in insular areas, such as the level of accessibility measurements at regional scale [14], stakeholder accessibility to island transport services [23], and daily accessibility impact of high-speed transport [24]. Performance indicators have evaluated the relation between mobility distribution and insularity and regional transportation and infrastructure planning for insular areas [25]. Furthermore, several density indicators and analysis have been taken into account to investigate insularity’s economic challenges [26] and social sustainability design for insular territories [27].
As above-mentioned, the specific properties of isolation constrain regional mobility and transport infrastructure in insular territories. Therefore, the analysis of accessibility measurement and logistical infrastructure would be done based on indicators or measures reflecting the ORs’ socio-economic and transport infrastructure characteristics. The geographic meaning of insularity, transport infrastructure plan represents a significant role in accessibility, regional cohesion, and sustainable growth [27].
Consequently, it is necessary to recognize the indicators that are as comparable as possible to enable a careful observation of the resulting accessibility to evaluate the demographic dynamics and urban agglomerations. In this manner, we will use an analytical approach that performs the necessitated indicators to assess the accessibility in a profoundly appropriate way based on the properties and essential criteria concerning insular territories. These accessibility measures have to be sensitive to challenges, needs, and trends of transport infrastructure and systems [5].
When the proposed theoretical strategies and approaches enclose transport infrastructure and accessibility in the insular territories and islands, this study’s primary purpose is to fill the gap regarding the practical analysis of the level of accessibility and geographical limitation of insularity in Azores islands. The development of such a special category of region, as that of insular regions, necessitate a specific methodology that is focusing on parameters for the simultaneous approach of matters of particular features of accessibility. This study aims to provide comparative statistics on transport infrastructure accessibility to explain the relationship between accessibility level and settlement distribution in insular areas. Moreover, this study intended to answer whether island Azores’ geographic specificity affects the accessibility in this area and which accessibility routes to urban agglomeration and markets be identified.
The Azores Islands
The Azores is defined as an Autonomous Region since 1976 by the Constitution of the Portuguese Republic and by the Administrative Political Statue of the Autonomous Region of the Azores. The archipelago is located in the middle of the Atlantic Ocean, dispersing along a southeast-northwest axis slightly over 600 km and covering a total area of 2322 km2. The region has its government with executive power and a regional legislative assembly, elected by direct universal suffrage, composed of nine islands of very heterogeneous and relatively small dimensions, just over 3300 km from Boston (United States of America) and roughly 1400 km from Lisbon. This framework defines it as the outermost region (OR) of the European Union (EU), in parallel with Madeira, Canaries, Guadeloupe, French Guiana, Martinique, Réunion, Saint-Barthélemy, and Saint-Martin. Some of the Azores’ significant development challenges come from this distancing from decision-making centers aggravated by its internal market fragmentation and dispersion.
The Azorean islands have particular edaphoclimatic conditions, which have directly influenced, over time, the socio-economic development of the region.
The region’s environmental and landscape richness, characterized by the abundance of green color, is also influenced by a temperate maritime climate, mild temperatures throughout the year (and consequent reduced thermal amplitude), regular rainfall, and significant variability of climatic conditions. This last aspect is one of the most distinctive characteristics of the Azores, inducing obvious repercussions in several economic sectors, namely, tourism, agriculture and livestock, fishing, transport (predominantly maritime and air), and energy.
From the geological point of view, in addition to the particularity of its location in a convergence zone of three tectonic plates, the Azores are experiencing ongoing volcanic activity. This context causes evident pressures on the population and, therefore, on the regional socio-economic development.
The archipelago’s location and geographical conditions have produced inherent structural challenges for its development, as historically proven. The small size of the islands and their dispersion result in significant fragmentation of the market, with natural repercussions on resource efficiency, economic activity, and the multiplication of productive structures and equipment. This situation is aggravated by the islands’ heterogeneous size, with direct impacts on population concentration and the degree of economic development. Nevertheless, the location of the islands has given the region, since the time of the discoveries, strategic importance in several domains, namely logistical and military, through the confluence of transatlantic routes, the development of services and support structures for navigation and aviation and support for military maneuvers in major world conflicts. On Terceira Island, the use of the Lajes Base revealed this importance in relations between the United States of America and Europe, which may be even more notorious if the Transatlantic Trade and Investment Partnership Agreement is signed (commonly known as the free trade agreement).
According to data from population and housing censuses (Census), the AAR resident population differed 2.1% between 2001 and 2011, meaning an increase of 5009 individuals (Table 1).
It is relevant to underline that the AAR still has a considerably young population, contrary to what is verified in the country. In fact, this is one of the relevant assets of the region, ensuring some stability in the medium and long term of the balance in the renewal of the active population.
At the end of the 90s of the 20th century and the first decade of the 21st century, there was an effective convergence of the country’s regional economy and the European Union. The dynamics of growth in that period led the Azores to a close approximation to the values of creating national and community wealth. However, this momentum slowed down, and compared to Portugal, between 2010 and 2018, it did not show any evolution, even showing a setback compared to the European Union. Nevertheless, there was an approximation to the Autonomous Region of Madeira’s results, a reality more similar and more easily comparable with that of the Azores—once Madeira is also an Insular autonomous region of Portugal.
In the year 2000, the regional GDP only represented 1.9% of the country’s wealth, while in 2018, this value reached 2.1%. The variation in GDP per capita is more expressive since, at the beginning of the century, this indicator in the Azores (9979 €) corresponded to 80% of the national value (12,480 €) and currently reaches 88% (17,514 €). If we go further back in time, it appears that in 1995 the GDP per capita in the Azores was only 6894 euros compared to 8880 euros at the national level (78%). Thus, there is a significant evolution in the capacity to create wealth, even in a period of significant economic instability, such as that experienced between 2007 and 2012, whose impact on small and fragile economies—such as the Azorean—is amplified. Because of this impact, there was a stagnation in the region’s evolution vis-à-vis national results.
In terms of purchasing power parity (PPP), the AAR’s GDP per capita has historically remained below 75% of the EU average of 28. This performance classifies the region as one of the least developed regions in the community space, configuring criteria for allocating resources from the structural and investment funds, which have proved to be a fundamental lever for the regional economy.
Transport is recognized as one of the fundamental instruments for achieving the objectives set out in the EU Treaties, especially concerning the development of the internal market, eliminating border barriers, and matters of convergence, cohesion, and solidarity between the Member States. According to the documents “Cohesion and Transport” and “Keeping Europe moving—Sustainable mobility for our continent,” it appears that this fact justified the channeling of large investments for the expansion and improvement of infrastructure and in the reorganization of services in the last decades. Despite this reality, it can also be concluded from reading these documents that there are still many shortcomings and inefficiencies that occur in this area—i.e., goods and services, or funding are just a few examples. In the Azores, given the existing logistical complexity, this situation is evident.
Sea and air transport between islands and connections with the archipelago’s exteriors currently have an interesting offer that was fundamentally achieved by the sector’s development policies implemented in the last government periods.
Air transportation of passengers between islands is provided by the company SATA Air Azores. As for air passenger transport between the Azores and abroad, until the first quarter of 2015, it was provided under a codeshare regime by SATA International and TAP Air Portugal to destinations on the Portuguese Mainland, under an exclusivity regime covered by obligations of public service, and Madeira. Connections with other destinations outside the Azores have never been restricted and can operate any airline. This situation led to the immediate appearance of two low-cost airlines, Ryanair and Easy Jet, which is an initial phase, started to regularly connect São Miguel to Lisbon and Porto and a new offer from TAP. In December 2016, Ryanair started operations on the island of Terceira. The expectation is to extend connections to other European destinations and expand the contact point in the Azores. Nevertheless, Easy Jet stopped operating in the Azores in October 2017.
This liberalization of air routes between the Azores and abroad has brought new opportunities to the local economy, with an increase in passengers’ flow, including many tourists, with effects on other economic activities, such as hotels, a-car, catering, tourist entertainment, among many others. This measure’s potential benefits from the fact that the region’s air connections with the outside are the only regular entry and exit door for people. More than bringing two new airlines to operate the Azores destination, liberalization has allowed the Azores to be placed on the world map of low-cost connections. This is a recent business model, associated with the new consumer trends of the masses and the close relationship of the new generations with the information and communication technologies, which has been growing in viral way in recent years.
Transport plays a fundamental role in the economic and social development of a region. It is the mobility capacity of people and goods that enhances the dynamization of economic transactions, which translates into an increase in companies’ competitiveness and an improvement in people’s quality of life. In this way, low-cost airlines have boosted production and consumption, enabling a more economical circulation of people and goods.
3. Methodology
Initially, data were obtained for the Azores islands’ official administrative delimitation corresponding to Sao Jorge, Faial, Flores, Graciosa, Pico, Santa Maria, Sao Miguel, and Terceira, from the National Geographic Information System of Portugal.
Subsequently, because of the difficulty in obtaining data regarding roads and different urban settlements on each of the islands, the Open Street Maps (OSM) digital platform was used, a collaborative project to create editable and free maps. The maps offered are generated using geographic information captured with mobile Global Positioning System (GPS) devices, orthophotographs, and other free information sources. This mapping, both the images created and the vector data stored in the database, are distributed under the Open Database License (ODbl).
In this regard, the free QuantumGIS Desktop 3.8.0 software was also used. This software was one of the first eight projects of the Open Source Geospatial Foundation located in Beaverton (United States). It is a non-governmental organization whose mission is to support and promote the collaborative development of geospatial technologies and open data. Where the Quick Map Services (QMP) plugin was installed, this one was made by Limited liability company (NEXTGIS), Novoryazanskaya str., 26, building 1, Moscow, 105066, Russia, allowing us to access an updated list of services to add maps to a Geographic Information System (GIS), including Open Street Map (OSM), afterward, it was necessary to install the OSM Downloader plugin that enabled us to download information from OSM. So, it was possible to obtain the layers of information corresponding to roads and urban settlements.
The roads made it possible to unload all tracks corresponding to primary, secondary, and tertiary roads, bridleway, cycleway, footway, living Street, path, pedestrian, residential, service, steps, track trunk. However, only those roads where car movement was possible were selected. Subsequently, linear graphical features used to evoke roads were associated as alphanumeric information the speed of each of them using different sources of information corresponding to the web portal “estradas”, the Michelin Guide, and the Geospatial Information Center of the Portuguese Army.
Concerning urban settlements once downloaded and represented by point graphic entities, it was necessary to associate the population as alphanumeric information. In this case, we have used the National Statistical Institute to access the information regarding the population census of 2011.
After obtaining the information, using ArcGis 10.5 software made by Environmental Systems Research Institute (ESRI) placed in United States, Redlands, California. In this regards, by means of this software was obtained the arc-node topology of the roads to run spatial network analysis. This step was critical to calculating the origin-destination matrix that consisted of analyzing the minimum time to reach from each urban settlement to all the urban settlements existing on each of the islands.
The next step was to determine the absolute accessibility Index i):
IRij is the minimum time between node ij across the network, and PCAEj is the population of major urban areas in each of the Azores Islands. The population was used once it is an expected value of the importance of an urban settlement. Therefore, the index determines the weighted average of each urban settlement’s shortest access time over the network, taking into account a weighting factor of the current demographic size. As a consequence, the weighted impedance considering the population of each destination. Hence, it is possible to determine each urban settlement’s importance regarding the rest of the urban settlements. Accordingly, it is possible to know how strong the network is, each settlement’s position regarding the rest of the settlements, and the amount of population in each settlement on each island.
An accessibility indicator allows evaluating the interaction of the different nodes joined by an arc-node type network. The road network connecting different population centers would equate the respective nodes to the arc-node network and population centers. In particular, the absolute accessibility indicator calculates the average of the impedances separating each node from the different population centers across the network weighted by one or more variables. In this case, having used the population, it tells us the capacity of each population center to attract compared to the rest of the population centers according to the population resident in each of them and the time of access from one population center to another that is influenced by the type or types of roads to use.
This accessibility measure allows us to determine each node’s degree of connectivity according to its importance in the network. It allows us to determine the degree of connectivity of each population center to the rest according to the population resident in each of them. In this way, it is possible to identify which population centers are better and worst communicated.
The main limitation is that depending on the variable or variables used to determine the impedance between the arcs and weighing the importance of each node. The indicator can yield different results. For this reason, the use of these variables has been justified in this work. As for each node’s importance, the variable population weighs each urban center’s attraction. The more population an urban center has, the more useful services it will offer. Therefore, the greater the attractiveness it will have for residents of other urban centers. The impedance was considered the time to cross each arc obtained from the maximum running speed of the track and the length of each of the sections to be covered.
Besides, once a specific value for each settlement was determined, it got punctual values but not for every island territory. In other words, although the road network connects urban centers only on the island where they are located, values of the same accessibility indicator were obtained for all urban centers on all islands. Still, IAAi is a fixed value for all-region, since the values were obtained in the same way for all the islands and comparable between the islands. An equal interval of five classes was employed to obtain a detailed classification of each island’s whole territory. Thus, the classification of the alphanumeric information obtained and the thematic cartography produced was easily understandable, using the categories very low, low, medium, high, and very high.
Moreover, a thematic map was acquired for each island—allowing us to analyze the geographical information in more detail.
Consequently, it was possible to get the percentage of settlements and population for each category, even by using graphics.
4. Results
The current section presents the outcomes obtained from the analysis of the eight of nine Islands of Azores Archipelago. The results are presented in the following Table 2, Table 3, Table 4, Table 5, Table 6, Table 7, Table 8 and Table 9. Additionally, the thematic cartography regarding the three most representative islands of the Azores Region is presented in Figure 1, Figure 2 and Figure 3.
Through Table 2, it is reasonable to confirm the various levels of accessibility of potential destinations (population) in town and settlements in the Island of Faial:
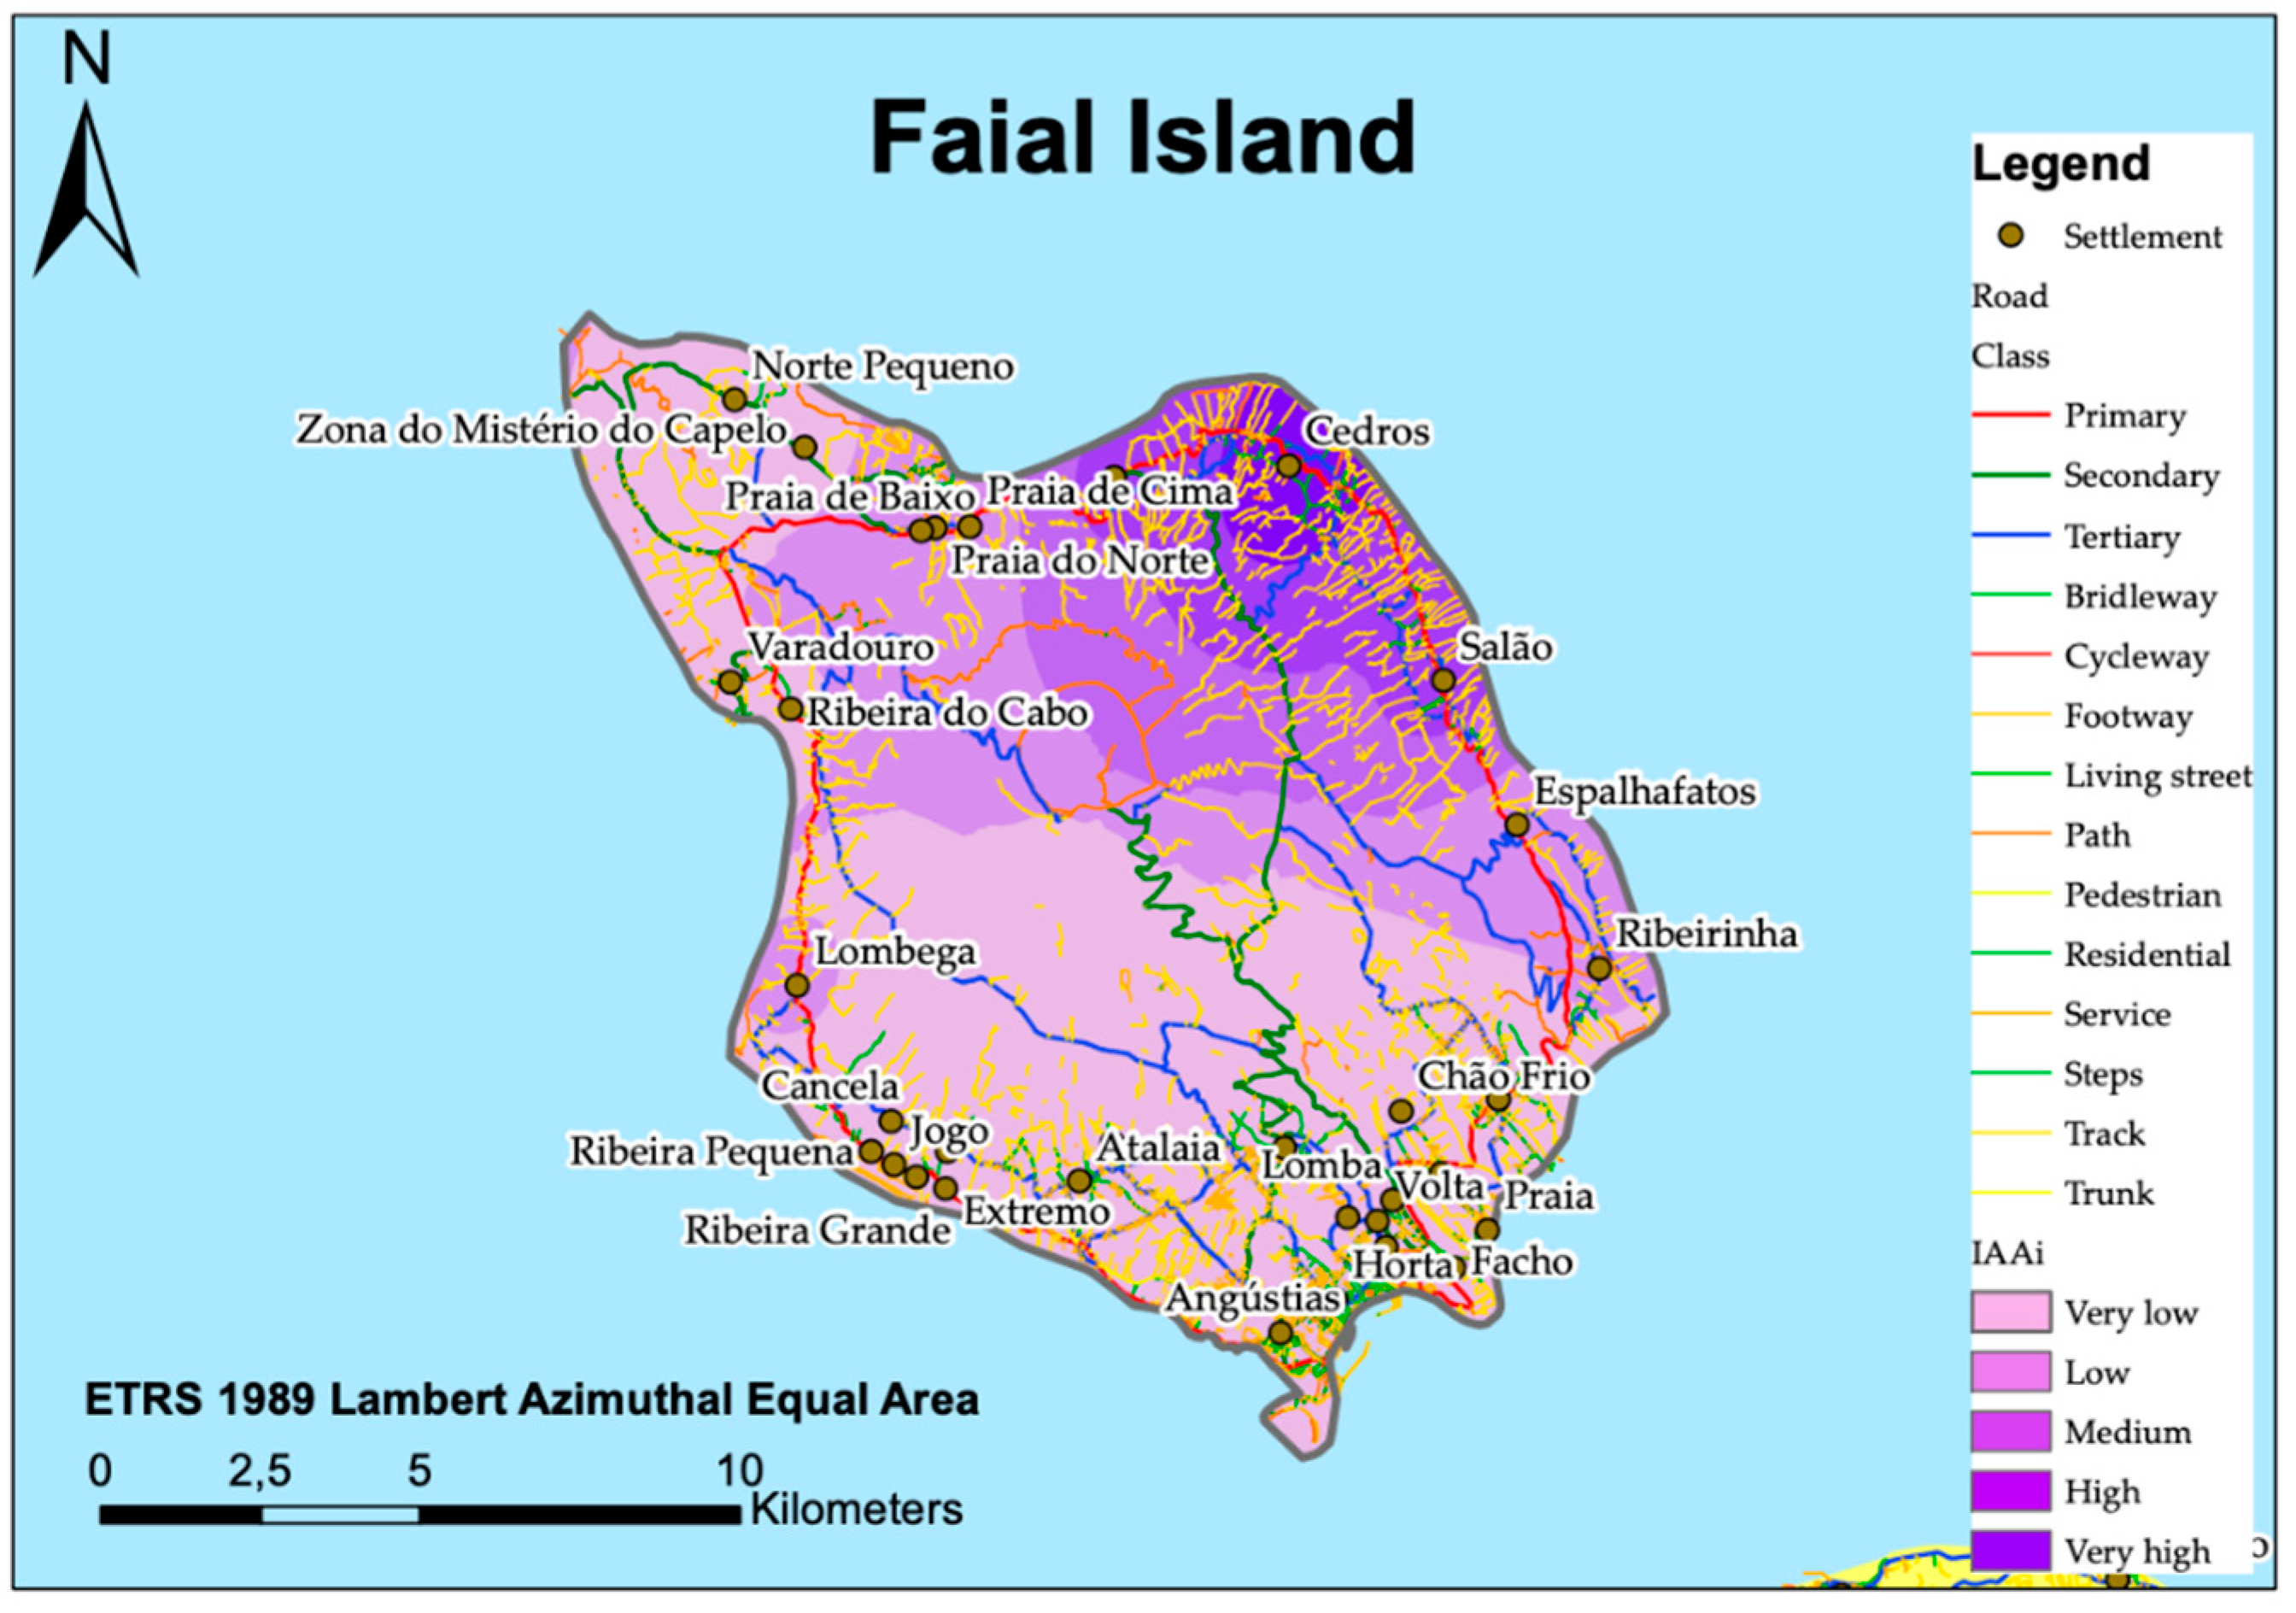
Accessibility values are gradually increasing from the central parts of the island to the north and northeast (Figure 3). The northern parts of the island have the highest accessibility values. The other half of the island and the northwestern part of the island have the lowest accessibility values. About 81.70% of the population lives in 72.73% of settlements of the island’s total number of settlements.
Flores Island population (about 46.12%) has a high level of accessibilities in 26.67% settlements, and about 34.31% population has a very high level of accessibility in the eight analyzed towns (53.3% settlements).
Pico Island population (about 22.89%) has very high accessibilities levels in 17 settlements (47.22%), with 22.89% of all population. In five settlements, 49.36% population has a very low level of accessibility (Table 4).
Graciosa Island has very low accessibility values in 7 towns, with a 45.21% population (Table 5). Very high values of accessibility have only 9.41% population in 2 urban settlements.
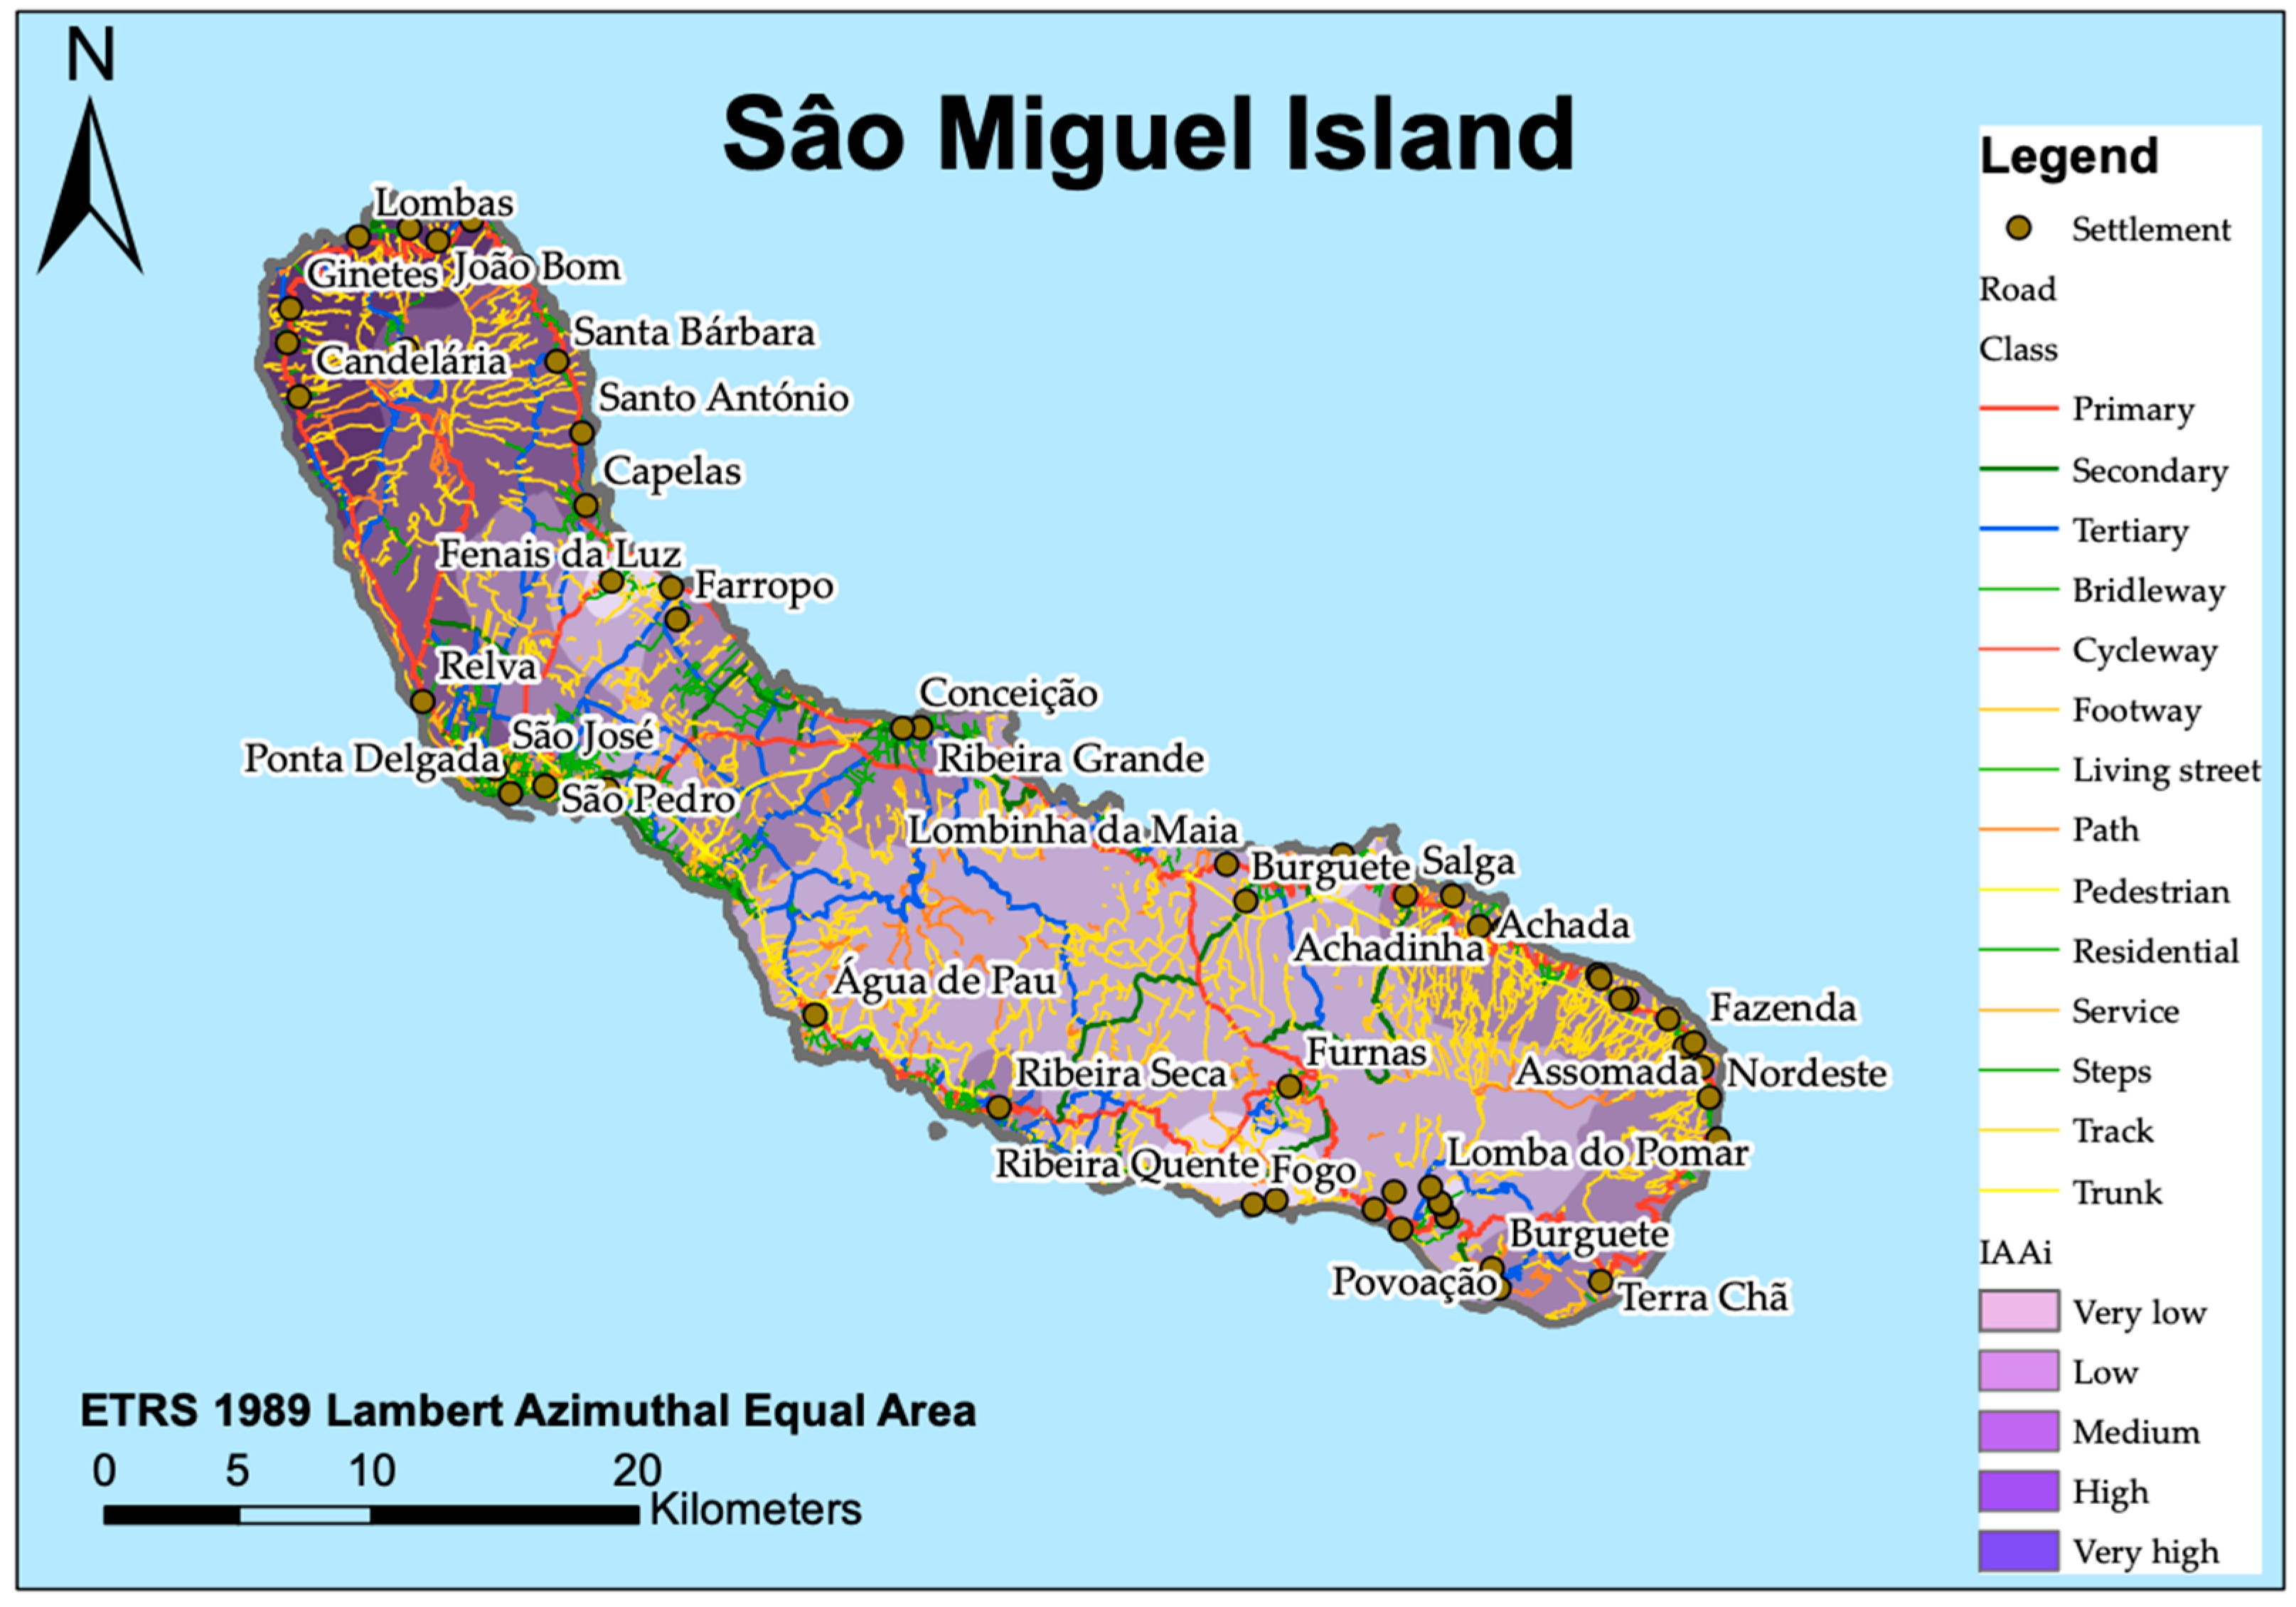
On the Island of São Miguel, 72.09% population has a medium level of accessibilities in 41,82% settlements or 23 analyzing towns (Table 6). On the Map of Figure 1, this Island has a very good primary road network through the north coastal belt of the Island with main road arteria (motorway), and a well-developed secondary and the other roads, where the towns are principally established. The Island’s heart is sparsely populated with one main road in longitudinal and transversal direction and few settlements. High and very high level of accessibility has a population in towns on the north side of the Island. Accessibility value is unevenly distributed.
The most significant part of Terceira Island has a very low level of accessibility. Only six towns with 19.82% of the population have high accessibility levels. Accessibility is monotonically distributed along a corridor of a primary road. Nevertheless, it shows discontinuities with different areas of the island. An excellent density network of main roads with secondary systems satisfies the northern and northeast part of the island, where accessibility values range from medium to very high. Low accessibility level has 13.99% of the population, which dominates in the middle of the island, southeast, and east parts of the island (Figure 2).
São Jorge Island has a very low level of accessibility in 10 towns, with 52.85%population, more than half the population of the Island. Very high accessibility level has only six towns with 20.25% population in 22.22% settlements. The same number of towns with a 21.44% population has a low level of accessibility.
In the Island of Santa Maria, 40% of settlements with a 34.09% population have a very low level of accessibility. Medium level has 25.71% settlements with 37.7% population. Very high and high accessibility has only six settlements (Table 9), with a low percentage for all the rest of the Island population.
5. Discussions
The notion of the island is very connected to that one of insularity. According to Royle [29], the isolation and inaccessibility of a place surrounded by sea. Multiple islands are ultra-peripheral to each other and conditioned on political, social, and economic activity hearts. In fact, we found the same self-administration level, and also, they tend to have little political power at higher levels. Nonetheless, in this regard, situations are very diverse. It is crucial to recognize the levels of autonomy of island states, island regions, and different islands and the distinct concepts of “mainland” that prevail in each situation [30].
Throughout the present research, it should be consider that the nine Azores islands cross 600 km in a mid-point of the Atlantic Ocean [31]. Also, transportation demand is weak and very fragmented. As a consequence of the dual insularity, there are 13 ports and nine airports/airfields, requiring high costs on the regional public funds. Yet, the freight access by sea is commercial (except for one link). The only link controlled by a Public Service Obligation (PSO), supported by the regional funds, is among the two smallest islands (Flores and Corvo) [31,32]. Nonetheless, in the 2000s, maritime services carrying goods amidst the Azores and Portugal mainland are listed as “public services” without funding. So, S. Jorge, Faial, and Pico Islands have moderately good links by ferry, and the other islands are also linked by boat, however, with lower frequencies [32].
São Miguel and Terceira have more regular bus services with more regular buses than the rest of the islands. There is a need for unification among transportation forms. Sparsely populated regions offer the private car, the most suitable form of transport [32].
There are financial demands for transport infrastructure to keep many ports (river ports), and airports/airstrips can be very expensive. Thereby, the financial resources possible to cover the accessibility gap created by dual insularity may not be enough. In this regard, the EC Operational Programme is currently promoting the airport infrastructure development program in the Azores. Besides, some “particular extra compensation” European Regional Development Fund (ERDF) funding has been ready for inter-island transportation services [32]. Yet, those funds have been weakened only three years inside the Programme, claiming the Region to implement full support from 2017. In some ORs, the Regional authorities finance all investments; in others, “specific additional compensation” compensation is used. The particular funding has also been awarded for river and harbor dredging processes to maintain access on rivers estuaries and provide ferry access to the tinier ports—i.e., Guadeloupe.
Therefore, the Azores Islands present a good example of dual insularity access obstacles. The maritime transport of assets to the Azores islands is improved and operates on a commercial basis to 13 commercially used ports. The exception is the set among the two smallest islands, subsidized by supporting a PSO [32]. It provides the Portuguese state to promote commercial shipping assistance to the Azores, charging the exporters to meet specific responsibilities entering the market that address the critical obstacles of the Region. Additionally, in 2015, the Azores started a new type of air transport that connects the trickery of PSO in the gateways of Santa Maria, Faial, and Pico with the liberalization of the entrance to the market of planned air services connecting the Portuguese mainland and the gateways of San Miguel and Terceira [32].
These following routes are presently fully expanded and have excited new low-cost airlines. In fact, this new business model could be transferred to other ORs. For example, in Guadeloupe, the objective is to set inter-island public air assistance to subdue the dependence on ferries from some islands and promote tourism to all of the archipelago, supported beneath the “particular extra compensation” within ERDF. If we focus on transport procedures, the primary difficulty is fostering engagement and new kinds of transport services and business forms to develop intra and inter-island accessibility and overcome public budgets pressures [32].
According to ESPON INTERCO [33]: “Remote regions (islands) have by far higher disparities compared to urban regions or regions located close to a city.” Accessibility by road fades toward towns positioned in the core of islands. Furthermore, most territories have some parts of their regions with very low accessibility. In those islands, accessibility continuously increases when a new infrastructure is built. Nonetheless, limitations can be areas where the population decreases when reflecting the cost of employing infrastructure establishing [5,34,35].
Fair and affordable access to general interest services, information, data, and mobility is fundamental for regional cohesion. Provisioning services and reducing infrastructure limitations can increase competitiveness and the EU’s sustainable and suitable territorial growth [34,35]. Thus, it means that accessibility, transport infrastructure, and logistics are recognized as pivotal for territorial cohesion and integration. This is the principal goal, particularly for out remotes territories as islands [5]. It represents a crucial part in service provision and accessibility in a broader sense since they are indispensable for territorial connectivity and unification. The purpose is to guarantee that every region profits from well-being patterns and equal growth potentials, mainly for remote, isolated, or sparsely populated regions [33,36].
Regarding transport operations, in Azores Region, the principal difficulty is how to promote competition and new kinds of transport services and business forms to improve intra and inter-island accessibility and overcome the tensions on public budgets. Here, “Start-up aid” can be granted to new operators reentering the market for three years. In some instances, where the starts up uncertainties are significant, this period is too short of creating a sustainable demand from a low base. The tool has to be engaging enough to produce enthusiasm among possible transport operatives and plan investors. In facing this difficulty, it is essential to pick on the best practice and innovation both from within the ORs and elsewhere in the globe [36].
6. Conclusions
Through the present research, it was possible to realize the transportation logistics and infrastructures’ sustainability and accessibility patterns in the Azores Islands and provide some information on the comparative statistics on population and the overall transport accessibility situation. Besides, this study intended to answer whether island Azores’ geographic specificity affects accessibility in this area and which accessibility routes to urban agglomeration and markets be identified.
Besides, throughout the study, it was possible to identify urban settlements classified according to the accessibility levels in the islands of Azores. So, it is reasonable to affirm that two of the three most representative islands of the Azores Region have a low level of accessibility in more than half part of island territory (Faial Island and Terceira Island). Sao Miguel Island dominates a middle level of accessibility. Regarding the number of settlements, Pico Island has a very high accessibility level in 17 towns, but only 22.89% of the population.
Air transportation is especially relevant for remote island regions. The contrast between the road and air accessibility is characteristic of the islands. It is indeed difficult to predict in which direction air accessibility will develop. It is not only a question of infrastructure in terms of airports, but it is also a question of future strategies of airlines that offer flight services, which complicates our assumptions about market behavior. It is also a question that depends on political decisions—i.e., possible price changes due to more robust environmental and climate policies. Indeed, when it comes to double insularity areas as these islands and air accessibility, they are in a good position due to future flight services. They would even improve their relative position regarding flight services [33,36,37].
An attractive island needs an airport connecting it with potential tourists. In contrast, the sparsely populated island should increase ferry accessibility to neighboring islands and travel accessibility to the islands themselves. Contextually, it is necessary to invest in the improvement of secondary cross-links on the islands. Thus, it will increase the availability of goods and services to the population, especially on islands with low availability values. More of the total island population lives (Faial Island and Terceira Island) on other islands where accessibility value is unevenly distributed. Road accessibility is also a relevant factor related to the connection of airports and ports with both the inner part of the island and the coastal belt.
In the long run, local island authorities would have to impact increasing ferry transport differently. This is important for the island population because the ferry line is their only connection with the mainland. They provide a large influx of tourists—i.e., the primary source of income for the island. So the ferry connection can be offered to different service providers in the future, especially on the islands with the least accessibility. This may require the use of smaller boats or different solutions such as “taxis” (smaller boats may be more environmentally friendly). With the increase of tourism on these islands, this option may become relevant and cover costs in the future. This could also increase inter-island accessibility with minimal investment. Public authorities should develop a bus network as part of an integrated transport offer, providing this service in different modes of operation in the inner territory of islands with low accessibility level.
A quantitative description of accessibility features on these islands has been attempted. It is essential to consider that a reasonable threshold for distance is different for the local population than for the population living in highly populated areas.
Also, these islands have a more limited potential for the growth of agglomeration economies; besides, their local economies’ small size and remote location means that they are more susceptible and more specific than other areas. Thereby, these territories are more conditioned by outside forces, changes in interest in the global commodity market, and seasonal activities as tourism.
In this regard, the whole area requires local authorities to have a serious transport study that will increase accessibility to the islands. Therefore, it is expected to increase the possibility of tourism development, but also be in line with the great potential of sustainable development in terms of the nature of environmental and climate policies as well as careful planning of the development of such remote and attractive destinations.
7. Research Limitations and Prospective Studies
One of the main limitations of the study is depending on the variable or variables used to determine the impedance between the arcs and weighing the importance of each node. The indicator can yield different results. For this reason, the use of these variables has been justified in this work.
Also, even if the performed analysis has provided us with some relevant perspectives on the accessibility patterns and dynamics in Azores Region if more indicators and variables were selected and crossed and the accessibility means and typologies, it would give us more accurate results. Furthermore, for more particular difficulties and opportunities definition and to disclose the logical guidelines, other subjects, disciplines, and prospects should be considered.
Author Contributions
All the authors contributed equally in the development of the present paper. All of the phases of the paper development proper have been discussed and worked on by the authors. All authors have read and agreed to the published version of the manuscript.
Funding
This paper is financed by Portuguese national funds through FCT—Fundacão para a Ciência e a Tecnologia. I.P. project number UIDB/ECO/00685/2020 and also by the project GREAT—Genuine Rural Experiences in the Azores Tourism with the code: ACORES-01-0145-FEDER-000089.
Institutional Review Board Statement
Not applicable.
Informed Consent Statement
Not applicable.
Data Availability Statement
“MDPI Research Data Policies” at https://0-www-mdpi-com.brum.beds.ac.uk/ethics.
Conflicts of Interest
The authors declare no conflict of interest.
References
- Maroto, A.; Zofío, J.L. Accessibility gains and road transport infrastructure in Spain: A productivity approach based on the Malmquist index. J. Transp. Geogr. 2016, 52, 143–152. [Google Scholar] [CrossRef]
- González-González, E.; Nogués, S. Long-term differential effects of transport infrastructure investment in rural areas. Transp. Res. Part. A Policy Pract. 2019, 125, 234–247. [Google Scholar] [CrossRef]
- Karou, S.; Hull, S. Accessibility modelling: Predicting the impact of planned transport infrastructure on accessibility patterns in Edinburgh, UK. J. Transp. Geogr. 2014, 35, 1–11. [Google Scholar] [CrossRef]
- Albacete, X.; Olaru, D.; Paül, V.; Biermann, S. Measuring the accessibility of public transport: A critical comparison between methods in Helsinki. Appl. Spat. Anal. Policy 2015, 10, 161–188. [Google Scholar] [CrossRef] [Green Version]
- Castanho, R.A.; Behradfar, A.; Vulević, A.; Gómez, J.M.N. Analyzing transportation sustainability in the Canary Islands Archipelago. Infrastructures 2020, 5, 58. [Google Scholar] [CrossRef]
- Cruz, J.V.; Soares, N. Groundwater governance in the Azores Archipelago (Portugal): Valuing and protecting a strategic resource in small islands. Water 2018, 10, 408. [Google Scholar] [CrossRef] [Green Version]
- Naranjo, J.M. Impacts on the social cohesion of mainland Spain’s future motorway and high-speed rail networks. Sustainability 2016, 8, 624. [Google Scholar] [CrossRef] [Green Version]
- Eliasson, J.; Kopsch, F.; Mandell, S.; Wilhelmsson, M. transport mode and the value of accessibility-A potential input for sustainable investment analysis. Sustainability 2020, 12, 2143. [Google Scholar] [CrossRef] [Green Version]
- Correia, A.G.; Winter, M.; Puppala, A. A review of sustainable approaches in transport infrastructure geotechnics. Transp. Geotech. 2016, 7, 21–28. [Google Scholar] [CrossRef] [Green Version]
- Grimsey, D.; Lewis, M.K. Evaluating the risks of public private partnerships for infrastructure projects. Int. J. Proj. Manag. 2002, 20, 107–118. [Google Scholar] [CrossRef]
- Flyvbjerg, B. The Oxford Handbook of Megaproject Management; Oxford University Press: Oxford, UK, 2017. [Google Scholar]
- Theodora, Y. Aegean Sea-Challenges and dilemmas in management and planning for local development in fragmented insular regions. Heritage 2019, 2, 1762–1784. [Google Scholar] [CrossRef] [Green Version]
- Jinjoo, B.; Youngsang, K. Comparable measures of accessibility to public transport using the general transit feed specification. Sustainability 2016, 8, 224. [Google Scholar]
- Cross, M.; Nutley, S. Insularity and accessibility: The small island communities of Western Ireland. J. Rural. Stud. 1999, 15, 317–330. [Google Scholar] [CrossRef]
- Pickup, L.; Mantero, C. Transport. Accessibility for the EU Outermost Regions (ORs); European Union: Luxembourg, 2017. [Google Scholar]
- Cimou, M. Insularity and urban hierarchies: The case of La Reunion. In Proceedings of the 46th Congress of the European Regional Science Association: Enlargement, Southern Europe and the Mediterranean, Vlos, Greece, 30 August–3 September 2006. [Google Scholar]
- Tsiotas, D.; Polyzos, S. Analyzing the maritime transportation system in Greece: A complex network approach. Netw. Spat. Econ. 2015, 15, 981–1010. [Google Scholar] [CrossRef]
- Arnold, P.; Peeters, D.; Thomas, I. Modelling a rail/road intermodal transportation system. Transp. Res. Part. E: Logist. Transp. Rev. 2004, 40, 255–270. [Google Scholar] [CrossRef]
- Rigas, K.; Sambracos, E.; Gatzoli, A. Air and Sea Transport: Competition strategies under normal and economic crisis environments. J. Econ. Bus. 2011, 61, 65–84. [Google Scholar]
- Dimou, M. Commuting Trips and Traffic Congestion in Insular Regions: Case of Reunoin Island; Ceresur, University of Reunion: Reunion Islands, France, 2014. [Google Scholar]
- Coccossis, H.; Nijkamp, P. Overcoming Isolation, Information and Transportation Networks in Development Strategies for Peripheral Areas; Coccossis, H., Nijkamp, P., Eds.; Springer: Berlin/Heidelberg, Germany, 1995. [Google Scholar]
- Chlomoudis, C.; Kostagiolas, P.; Papadimitriou, S.; Tzannatos, E.S. A European perspective on public service obligations for island transport services. Marit. Econ. Logist. 2011, 13, 342–354. [Google Scholar] [CrossRef]
- Gutiérrez, J. Location, economic potential and daily accessibility: An analysis of the accessibility impact of the high-speed line Madrid-Barcelona-French border. J. Transp. Geogr. 2001, 9, 229–242. [Google Scholar] [CrossRef]
- Cubero-Irizarry, C.A. Mobility and Insularity in the Caribbean: Island Identities of Culebra; University of Manchester: Manchester, UK, 2006. [Google Scholar]
- Armstrong, H.W.; Read, R. Insularity, remoteness, mountains and archipelagos: A combination of challenges facing small states? In Proceedings of the Europe at the Margins: EU Regional Policy, Peripherality and Rurality Regional Studies Association Conference, Angers, France, 15–16 April 2004. [Google Scholar]
- Vezzani, V.; Gonzaga, S. Design for Social Sustainability. An educational approach for insular communities. Des. J. 2017, 20, S937–S951. [Google Scholar] [CrossRef] [Green Version]
- Delgado Aguiar, G.; Hernández Luis, J.Á. Maritime transport, Atlantic and Mediterranean port networks the example of the Canary Islands. Rev. Estud. Andal. 2019, 38. [Google Scholar]
- INE-Instituto Nacional de Estatística. Instituto Nacional de Estatística. 2020. Available online: www.ine.pt (accessed on 17 December 2020).
- Royle, S. (Ed.) A Geography of Islands: Small Island Insularity; Routledge: Abingdon-on-Thames, UK, 2001; ISBN 1-857-28865-3. [Google Scholar]
- ESPON GEOSPECS Project. European Perspective on Specific Types of Territories Applied Research 2013/1/12 Final Report. Version 20/12/2012; European Commission (EC): Luxembourg, 2013; ISBN 978-2-919777-14-3.
- Pimentel, P.; Oliveira, A.; Couto, G.; Ponte, J.C.; Castanho, R. The Azores Archipelago as a region with vast potential for the development of adventure and slow tourism. In Peripheral Territories, Tourism, and Regional Development; Intech Open: London, UK, 2020. [Google Scholar]
- European Commission. Transport Accessibility for the EE Outermost Regions (ORS); Final Report; Prof. Laurie Pickup, Claudio Mantero. 2020. Available online: https:www.ec.europa.eu/regional_policy/sources/policy/themes/outermost-regions/pdf/transport_report_en.pdf (accessed on 30 November 2020).
- ESPON. INTERCO Indicators of territorial cohesion, Scientific Platform and Tools Project 2013/3/2 Indicators Factsheets; European Commission (EC): Luxembourg, 2013. [Google Scholar]
- Hernandez, Y.; Barbosa, P.; Corral, S. Scenarios for Resilience and Climate Adaptation Strategies in Tenerife (Canary Islands): Three Pathways towards 2040; European Commission: Luxembourg, 2017. [Google Scholar]
- Klink, F.A. Discurso y praáctica de los grupos empresariales y poliáticos: Megaproyectos y megamentiras. In Economiáa, Poder y Megaproyectos; Naredo, J.M., Klink, F.A., Eds.; Fundacioán Ceásar Manrique: Lanzarote, Spain, 2009; pp. 53–77. [Google Scholar]
- ESPON. Accessibility by the Sea Indicators D2-Final Report; Spiekermann & Wegener Urban and Regional Research (S&W); European Commission (EC): Luxembourg, 2017. [Google Scholar]
- Shaping new policies in specific types of territories in Europe: Islands, mountains, sparsely populated and coastal regions. In ESPON Policy Brief; European Commission (EC): Luxembourg, 2017.
Figure 1.
Thematic cartography regarding the accessibility levels in the Island of São Miguel (Source: authors).
Figure 1.
Thematic cartography regarding the accessibility levels in the Island of São Miguel (Source: authors).

Figure 2.
Thematic cartography regarding the accessibility levels in the Island of Terceira (Source: authors).
Figure 2.
Thematic cartography regarding the accessibility levels in the Island of Terceira (Source: authors).

Figure 3.
Thematic cartography regarding the accessibility levels in the Island of Faial (Source: authors).
Figure 3.
Thematic cartography regarding the accessibility levels in the Island of Faial (Source: authors).


Table 1.
Number of the resident population by place of residence (Source: authors, based on [28]).
Table 1.
Number of the resident population by place of residence (Source: authors, based on [28]).
| 2001 | 2011 | Variation | 2001 | 2011 | |
|---|---|---|---|---|---|
| Total | Total | % | Density | Density | |
| Santa Maria (Island) | 5.578 | 5.552 | −0.5% | 57.6 | 57.3 |
| Vila do Porto | 5.578 | 5.552 | −0.5% | 57.6 | 57.3 |
| São Miguel (Island) | 131.609 | 137.856 | 4.7% | 176.8 | 185.1 |
| Lagoa | 14.126 | 14.442 | 2.2% | 311.1 | 316.8 |
| Nordeste | 5.291 | 4.937 | −6.7% | 52.5 | 48.7 |
| Ponta Delgada | 65.854 | 68.809 | 4.5% | 281.8 | 295.3 |
| Povoação | 6.726 | 6.327 | −5.9% | 63.2 | 59.5 |
| Ribeira Grande | 28.462 | 32.112 | 12.8% | 157.8 | 178.3 |
| Vila Franca do Campo | 11.150 | 11.229 | 0.7% | 143.1 | 144.0 |
| Terceira (Island) | 55.833 | 56.437 | 1.1% | 139.5 | 141.0 |
| Angra do Heroísmo | 35.581 | 35.402 | −0.5% | 148.9 | 148.1 |
| Praia da Vitória | 20.252 | 21.035 | 3.9% | 125.6 | 130.4 |
| Graciosa (Island) | 4.780 | 4.391 | −8.1% | 78.7 | 72.4 |
| Santa Cruz da Graciosa | 4.780 | 4.391 | −8.1% | 78.7 | 72.4 |
| São Jorge (Island) | 9.674 | 9.171 | −5.2% | 39.7 | 37.6 |
| Calheta | 4.069 | 3.773 | −7.3% | 32.2 | 29.9 |
| Velas | 5.605 | 5.398 | −3.7% | 47.7 | 46.0 |
| Pico (Island) | 14.806 | 14.148 | −4.4% | 33.3 | 31.8 |
| Lajes do Pico | 5.041 | 4.711 | −6.5% | 32.5 | 30.3 |
| Madalena | 6.136 | 6.049 | −1.4% | 41.7 | 41.1 |
| São Roque do Pico | 3.629 | 3.388 | −6.6% | 25.5 | 23.8 |
| Faial (Island) | 15.063 | 14.994 | −0.5% | 87.0 | 86.6 |
| Horta | 15.063 | 14.994 | −0.5% | 87.0 | 86.6 |
| Flores (Island) | 3.995 | 3.793 | −5.1% | 28.4 | 26.9 |
| Lajes das Flores | 1.502 | 1.504 | 0.1% | 21.5 | 21.5 |
| Santa Cruz das Flores | 2.493 | 2.289 | −8.2% | 35.2 | 32.3 |
| Corvo (Island) | 425 | 430 | 1.2% | 24.9 | 25.1 |
| Corvo | 425 | 430 | 1.2% | 24.9 | 25.1 |
| Azores (Total) | 241.763 | 246.772 | 2.1% |
Table 2.
Obtained results regarding the demographic dynamics and urban agglomerations classified according to the accessibility levels in the Island of Faial.
Table 2.
Obtained results regarding the demographic dynamics and urban agglomerations classified according to the accessibility levels in the Island of Faial.
| Faial Island | Very Low | Low | Medium | High | Very High |
|---|---|---|---|---|---|
| Number of settlements | 24 | 6 | 0 | 2 | 1 |
| Number of settlements (%) | 72.73% | 18.18% | 0.00% | 6.06% | 3.03% |
| Population (%) | 81.70% | 9.41% | 0.00% | 3.10% | 5.79% |
The highest values found are in bold.
Table 3.
Obtained results regarding the demographic dynamics and urban agglomerations classified according to the accessibility levels in the Island of Flores.
Table 3.
Obtained results regarding the demographic dynamics and urban agglomerations classified according to the accessibility levels in the Island of Flores.
| Flores Island | Very Low | Low | Medium | High | Very High |
|---|---|---|---|---|---|
| Number of settlements | 1 | 1 | 1 | 4 | 8 |
| Number of settlements (%) | 6.67% | 6.67% | 6.67% | 26.67% | 53.33% |
| Population (%) | 12.19% | 0.32% | 7.05% | 46.12% | 34.31% |
The highest values found are in bold.
Table 4.
Obtained results regarding the demographic dynamics and urban agglomerations classified according to the accessibility levels in the Island of Pico.
Table 4.
Obtained results regarding the demographic dynamics and urban agglomerations classified according to the accessibility levels in the Island of Pico.
| Pico Island | Very Low | Low | Medium | High | Very High |
|---|---|---|---|---|---|
| Number of settlements | 5 | 6 | 2 | 6 | 17 |
| Number of settlements (%) | 13.89% | 16.67% | 5.56% | 16.67% | 47.22% |
| Population (%) | 49.36% | 16.92% | 2.39% | 8.44% | 22.89% |
The highest values found are in bold.
Table 5.
Obtained results regarding the demographic dynamics and urban agglomerations classified according to the accessibility levels in the Island of Graciosa.
Table 5.
Obtained results regarding the demographic dynamics and urban agglomerations classified according to the accessibility levels in the Island of Graciosa.
| Graciosa Island | Very Low | Low | Medium | High | Very High |
|---|---|---|---|---|---|
| Number of settlements | 7 | 5 | 5 | 0 | 2 |
| Number of settlements (%) | 36.84% | 26.32% | 26.32% | 0.00% | 10.53% |
| Population (%) | 45.21% | 25.57% | 19.81% | 0.00% | 9.41% |
The highest values found are in bold.
Table 6.
Obtained results regarding the demographic dynamics and urban agglomerations classified according to the accessibility levels in the Island of São Miguel.
Table 6.
Obtained results regarding the demographic dynamics and urban agglomerations classified according to the accessibility levels in the Island of São Miguel.
| São Miguel Island | Very Low | Low | Medium | High | Very High |
|---|---|---|---|---|---|
| Number of settlements | 7 | 10 | 23 | 7 | 8 |
| Number of settlements (%) | 12.73% | 18.18% | 41.82% | 12.73% | 14.55% |
| Population (%) | 4.78% | 7.13% | 72.09% | 10.12% | 5.89% |
The highest values found are in bold.
Table 7.
Obtained results regarding the demographic dynamics and urban agglomerations classified according to the accessibility levels in the Island of Terceira.
Table 7.
Obtained results regarding the demographic dynamics and urban agglomerations classified according to the accessibility levels in the Island of Terceira.
| Terceira Island | Very Low | Low | Medium | High | Very High |
|---|---|---|---|---|---|
| Number of settlements | 13 | 5 | 2 | 6 | 1 |
| Number of settlements (%) | 48.15% | 18.52% | 7.41% | 22.22% | 3.70% |
| Population (%) | 64.99% | 13.99% | 0.33% | 19.82% | 0.86% |
The highest values found are in bold.
Table 8.
Obtained results regarding the demographic dynamics and urban agglomerations classified according to the accessibility levels in the Island of Sâo Jorge Island.
Table 8.
Obtained results regarding the demographic dynamics and urban agglomerations classified according to the accessibility levels in the Island of Sâo Jorge Island.
| São Jorge Island | Very Low | Low | Medium | High | Very High |
|---|---|---|---|---|---|
| Number of settlements | 10 | 6 | 2 | 3 | 6 |
| Number of settlements (%) | 37.04% | 22.22% | 7.41% | 11.11% | 22.22% |
| Population (%) | 52.85% | 21.44% | 4.69% | 0.77% | 20.25% |
The highest values found are in bold.
Table 9.
Obtained results regarding the demographic dynamics and urban agglomerations classified according to the accessibility levels in the Island of Santa Maria.
Table 9.
Obtained results regarding the demographic dynamics and urban agglomerations classified according to the accessibility levels in the Island of Santa Maria.
| Santa Maria Island | Very Low | Low | Medium | High | Very High |
|---|---|---|---|---|---|
| Number of settlements | 14 | 6 | 9 | 5 | 1 |
| Number of settlements (%) | 40.00% | 17.14% | 25.71% | 14.29% | 2.86% |
| Population (%) | 34.09% | 23.99% | 37.77% | 2.59% | 1.55% |
The highest values found are in bold.
Publisher’s Note: MDPI stays neutral with regard to jurisdictional claims in published maps and institutional affiliations. |
© 2021 by the authors. Licensee MDPI, Basel, Switzerland. This article is an open access article distributed under the terms and conditions of the Creative Commons Attribution (CC BY) license (http://creativecommons.org/licenses/by/4.0/).
Share and Cite
MDPI and ACS Style
Castanho, R.A.; Naranjo Gómez, J.M.; Vulevic, A.; Behradfar, A.; Couto, G. Assessing Transportation Patterns in the Azores Archipelago. Infrastructures 2021, 6, 10. https://0-doi-org.brum.beds.ac.uk/10.3390/infrastructures6010010
AMA Style
Castanho RA, Naranjo Gómez JM, Vulevic A, Behradfar A, Couto G. Assessing Transportation Patterns in the Azores Archipelago. Infrastructures. 2021; 6(1):10. https://0-doi-org.brum.beds.ac.uk/10.3390/infrastructures6010010
Chicago/Turabian StyleCastanho, Rui Alexandre, José Manuel Naranjo Gómez, Ana Vulevic, Arian Behradfar, and Gualter Couto. 2021. "Assessing Transportation Patterns in the Azores Archipelago" Infrastructures 6, no. 1: 10. https://0-doi-org.brum.beds.ac.uk/10.3390/infrastructures6010010