Article

Assessing the Effects of Forest Fires on Interconnected Critical Infrastructures under Climate Change. Evidence from South France

1
EREL, NCSR Demokritos, 15310 Agia Paraskevi, Greece
2
Entente pour la forêt Méditerranéenne|Valabre, 13120 Gardanne, France
3
ARTELIA SAS, 38130 Echirolles, France
4
Center for Security Studies, 10177 Athens, Greece
5
Fraunhofer IVI, 01069 Dresden, Germany
*
Author to whom correspondence should be addressed.
Submission received: 11 December 2020 / Revised: 12 January 2021 / Accepted: 19 January 2021 / Published: 21 January 2021

Abstract

:
The present work introduces a case study on the climate resilience of interconnected critical infrastructures to forest fires, that was performed within the framework on H2020 EU-CIRCLE project (GA 653824). It was conducted in South France, one of the most touristic European regions, and also one of the regions at the highest forest fire risk that is projected to be amplified under future climate conditions. The case study has been implemented through a co-creation framework with local stakeholders, which is critical in moving beyond physical damages to the infrastructures, introducing the elements of infrastructure business continuity and societal resilience. Future forest fires extremes are anticipated to impact the interconnections of electricity and transportation networks that could further cascade to communities throughout South France. The work highlighted the benefits of enhancing co-operation between academia, emergency responders, and infrastructure operators as a critical element in enhancing resilience through increased awareness of climate impacts, new generated knowledge on fire extremes and better cooperation between involved agencies.

1. Introduction

It is presently understood that climate related hazards have the potential to substantially affect the lifespan, serviceability, or even devastate critical infrastructures (CI), such as the energy, transportation, telecommunications, buildings, health, and water management facilities [1,2]. As CI constitute a major functional element of modern societies; their partial unavailability or complete destruction may result in significant impacts to people, environment and society as well as economic losses. As recent events demonstrate, CIs are inherently interconnected and interdependent systems, and even small disruptions could be cascaded to significant societal effects. CI have a critical role in maintaining smooth societal functioning and contributing to healthy cities, combating energy poverty, and increasing the wellbeing of the European citizens.
All critical infrastructures have lifetimes that span over several decades; thus, it is imperative to generate scientifically validated knowledge on the potential risks of climate change and future extreme weather events. Scientific knowledge of future climate pressures (such as forest fires, flooding, storms, winds, and extreme temperatures) is the foundation for making climate resilient infrastructures, allowing how patterns of frequency, intensity, magnitude, and the dynamics of hazardous events may change. The impacts of extreme events on CI include direct damage to the infrastructure leading to multi-scale and multi-level effects which not only affect the capability of the CI to operate but also result in secondary effects that could severely disrupt normal societal operations. Furthermore, resilient CI able to resist and/or quickly recover from climate hazards are critical components of emergency management and thus their availability is central for societal response to disasters.
CI and especially electricity networks and roads are highly vulnerable to climatological threats and especially forest fires. During the last few years, Europe faced significant hazards, such as intensifying forest fires in the South (66 dead in Portugal 2017, and 99 dead in Greece 2018) and in North Europe (Germany 2018, and Sweden 2018). An overview of expected single- and multi-hazard damages to energy, transport, industrial, and social critical infrastructures in Europe until the year 2100 is presented in [3]. They report varying degrees of change across regions concerning forest fires and higher but uneven economic losses for the industry, transport, and energy sectors. In the US, California is frequently exposed to severe wildfires [4], their cost is anticipated to be in the order of 42 cents/kWh (2030) [5] and projected operational capacity loss of generators, substations, and transmission lines in the order of 20% [6]. Carlini [7] describes the operational procedures for operating the Italian Grid during dangerous climate and extreme events. In the Western US, post-fires debris flows pose a major hazard to infrastructure, particularly roadways [8], also linked to a greater than 50% probability of in locations where recent fires have occurred.
Cascading and compound events are also considered within this framework. Moftakhari [9] studied the impact of concurrent or consecutive events, such as a wildfire followed by intense precipitation event, which could lead to amplified societal impacts through the damaging of natural gas infrastructure. A strategic planning and decision-making framework to predict the inoperability of electric utilities in face of several types of natural disasters is presented in [10]. Pourghasemi [11] developed individual and collective multi-hazard risk maps for floods, landslides, and forest fires to visualize the spatial distribution of risk with emphasis on CI. Additionally, a factor not frequently addressed in related literature is that CI are also vital parts of the emergency response process, and their capability to operate even in the most adverse conditions is an important element of societal resilience [12]. The sustainability, resilience and safety of road networks to forest fires is linked to wildfires prevention and mitigation according to [13]. Church [14] addresses the localization issue of emergency response infrastructures, to optimize guarding, protection or response in an emergency. Ronchi [15] discusses the evacuation in WUI fires and quantifies the importance of infrastructures in the emergency planning process, whereas [16] highlights the need to study almost unexplored issues, such as design of road networks and accessibility, dimension of water supply networks, role of construction methods and materials, and the wildland–industrial interface.
Modern CI are complex entities with many interactions and interdependencies, between and across the various CI systems, which manifest themselves in many ways, including operational, economic, physical, cyber, geographical, and legal [17]. Risk assessment and management within the frame of infrastructure modelling requires the comprehension of how and to what degree CI’s assets are interdependent and interconnected. Initially, it is necessary to identify types of connections, which should be capable to cover the resilience and degradation of a CI system and the cascading effects into the connected networks. Four types of interdependencies have been proposed by [18]; Physical, Cyber, Geographic, and Logical, whereas [19] considers decision making and policy instead of the logical type, and [20] the Physical, Logical and Information, Inter-Regional Economic, and Inter-Sector Economic Coupling. Crowther [21] proposed six types focusing on transportation network: Emergency Response and Recovery, Intermodal, Physical, Economic, Functional, and Users.
Recently [22,23], recognized a lack of quantitative approaches in measuring resilience, across various types of infrastructures, and addressed dependencies and infrastructure dependencies. Resilience-based models have been discussed for critical infrastructures [24], although the focus is presently limited to a single asset or CI type and lack apprehension of human and or decision-making processes, which are a fundamental in restoration activities. Empirical studies of infrastructure interdependencies, have also been studied [25,26]. Network-based models for vulnerability and recovery of interdependent networks are in [27,28,29], although frequently analysis is restricted to a topological perspective [30]. In works wherein functional relationships is focal, usually instantaneous failure propagation is considered [31] ignoring buffers.
Understanding interdependencies of the CI life cycle is a highly challenging task [32] not only limited during emergencies, and an excessively high detail assessment is needed to capture service demand and provision to users. Lomba-Fernández [33] introduce methods to carry out interdependencies analysis as part of the city resilience framework, considering cascading effects to avoid major disruptions, although the complex issues of governance of urban CIs, in particular of interdependencies, is one of the most challenging issues [34,35] also due to different owners (private and public). [36] denotes that planning for infrastructure interactions is compounded when considering long-term adaptation plans due to the different timescales in integrating analyses of multiple systems, and [37] studies the pressures on CI from displaced people from neighboring communities as appeared in the 2018 California Camp fire.
The present work demonstrates a case study of the EU-CIRCLE H2020 project (GA 653824) that identified how anticipated changes in the future climate and an increased probability of occurrence of disastrous events may impact the operation of key assets and essential services that interconnected CI deliver. At the center of the EU-CIRCLE approach is the concept of “service flow continuum”, where the resilience of CI is linked to how they can better understand the evolving nature of hazards due to climate change and implement early warning systems (anticipatory capacity), be exposed to lower levels of risk or reduce their climate vulnerabilities (absorbing capacity), be able to respond faster and collaborate more efficiently with other CI and emergency responders (coping capacity), and return to normality and full operational levels (restoration capacity). Finally, the adaptation capacity of CI is equally important and thus a policy shift towards resilience-based adaptation is proposed (Figure 1). The resilience framework in this report also provides an outline of how business continuity can be considered especially through the preventative measures and adaptation options being considered in the model.
EU CIRCLE introduces a novel four layered approach to critical infrastructure (CI) resilience which determines what constitutes CI resilience with their key components briefly summarized below:
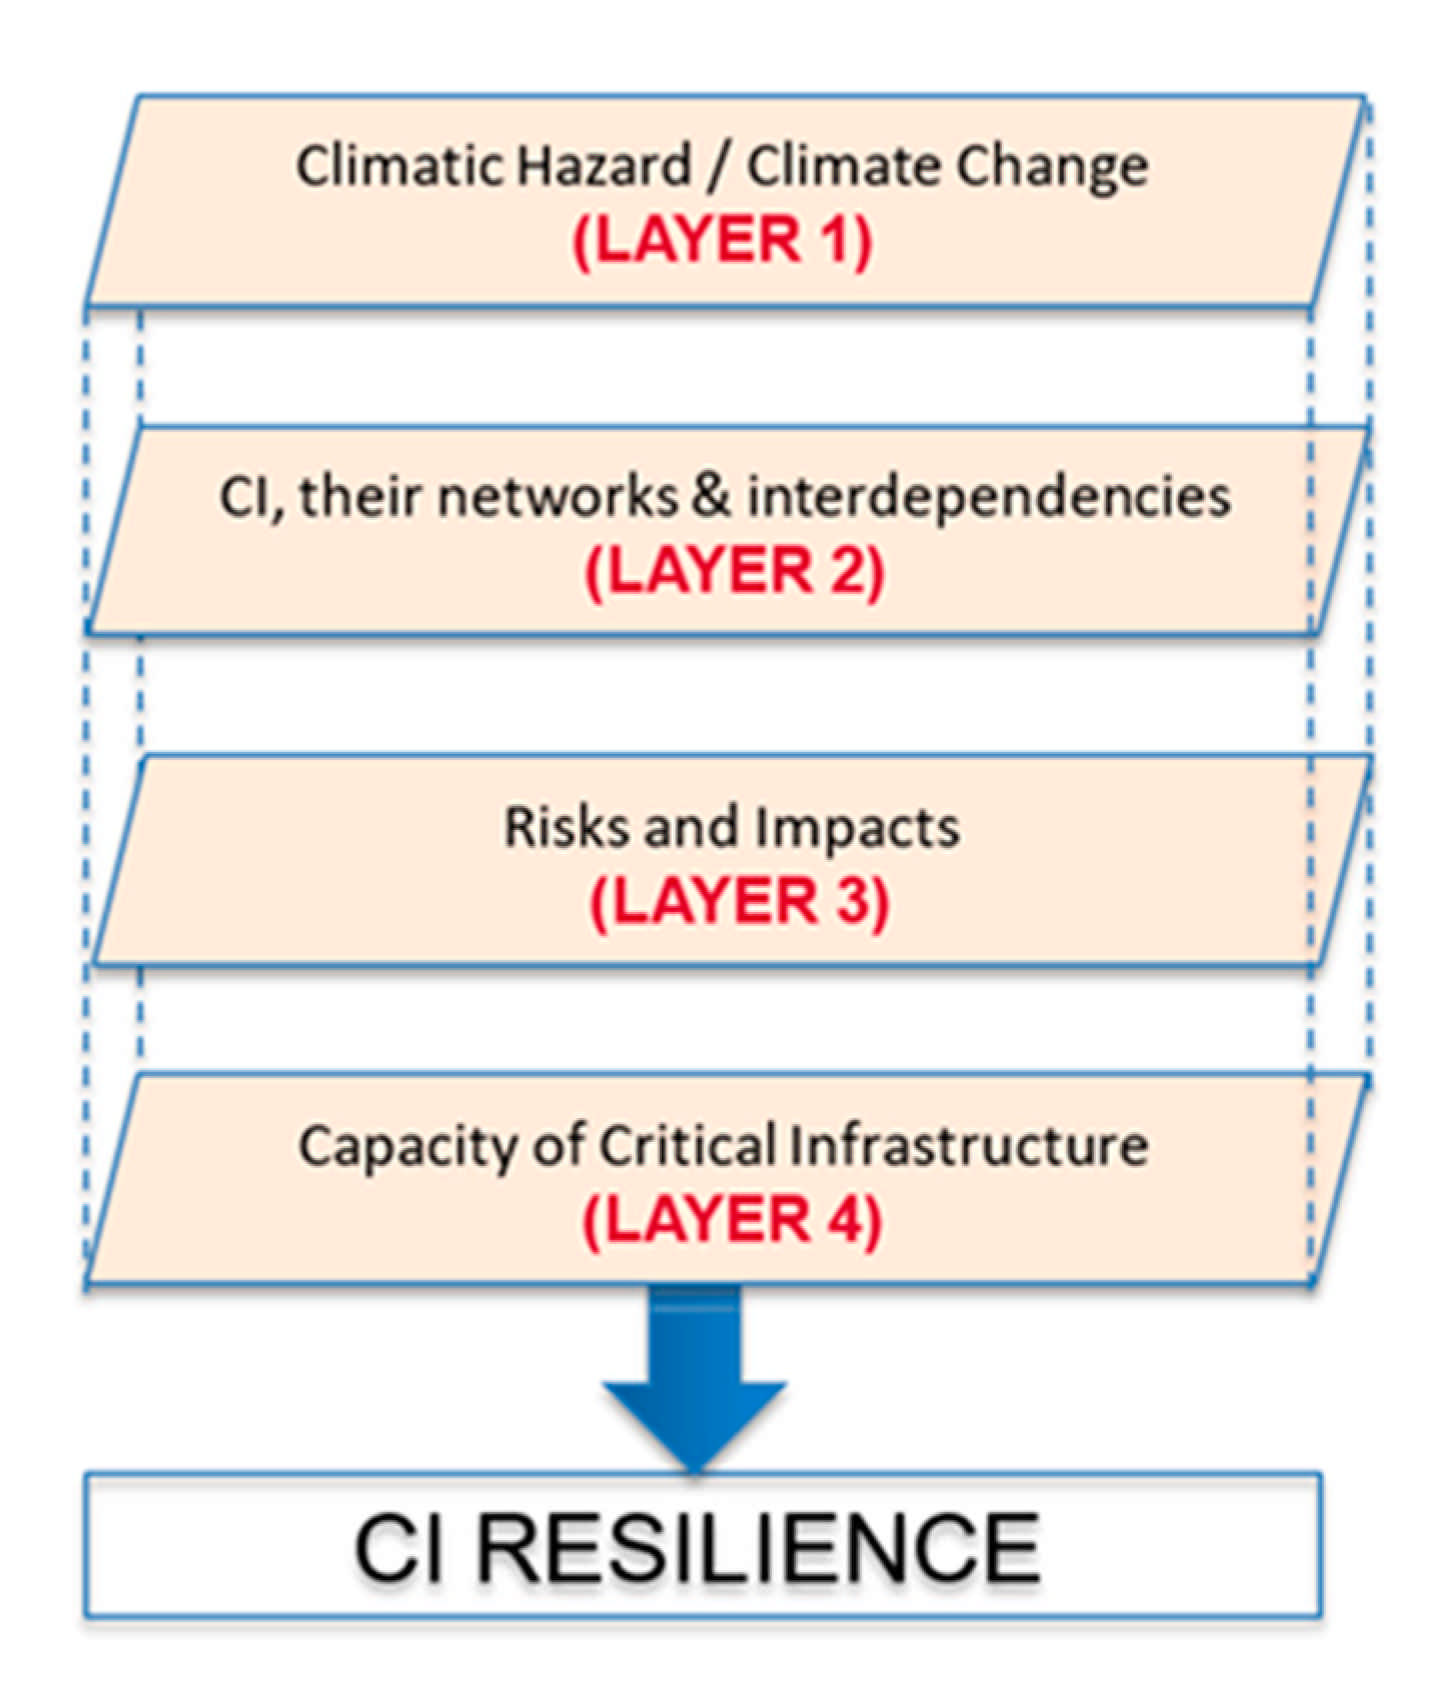
Resilience for what—the disturbances which are caused by natural hazards which may be exacerbated due to climate change represented in Layer 1, such as forest fires, flooding, extreme winds, storms, lightning, and also their compound events.
Resilience of what—the context which is CI, their networks and interdependencies as incorporated in Layer 2. These require a detailed description of their assets, including specific attributes and also their interconnections and bidirectional dependencies.
Risks and Impacts—which includes the consequences of a hazard and the likelihood of the occurrence, detailed in Layer 3.
Capacities of CI, such as the ability to anticipate and reduce the impact; ability to buffer and bear; ability to be repaired easily and efficiently included in the final Layer 4. Resilience parameters, i.e., properties that indicate different capacities, also included in Layer: anticipatory the climate hazard, absorbance of the impacts, coping with the impacts, restoration to normality, and adaptive capacity.
The present work focuses on a case study implemented within the framework of the EU-CIRCLE project with emphasis on heat wave and forest fire impacts on electric and road transport networks, in the Provence-Alpes-Côte d’Azur Region (southern of France). This case study presented the unique concept of organizing a diverse civil protection types of exercises Table Top Exercise and a real crisis event, with the involved CI operators and the Provence Alpes Cote d’Azur (PACA) area emergency responders. The scope of the case study is to analyze and quantify the evolution of forest fire risk under climate change and critically appraise the acceptable level of interconnected CI risk in a climate change context.
This case study aims to contribute to the identification of relevant prevention and adaptation measures and also with an assessment of their sustainability and cost effectiveness under changing conditions. It focused of the climate period of the 2040s focusing on the assessment of the number, location and characteristics of the forest fires such as rate of spread and intensity. CI are considered under the “service continuum” concept where both physical damages and functional impact on the infrastructures and the society are accounted for. Additionally, the operational objectives for emergency responding organizations under climate change are to minimize the response and recover time and also leverage inter-organizational work during crisis.
Europe and especially its southern parts are increasingly exposed to forest fires, especially for the near-term climatology. Reference [38] reports increase of up to six times in recurrent large fires also documenting the impact of spatial variability and local forest resilience actions. Fargeon [39] assessed the potential climate change impacts on fire danger over France through the projection of the widely used Fire Weather Index (FWI) and projected it with a summer elevated fire danger three times more by mid-twenty-first century. Sutanto [40] investigated the spatio-temporal patterns of compound and cascading hazards using historical data for dry hazards, namely, heatwaves, droughts, and fires across Europe and found a considerable increase in future. Forest fires is also partly attributed to anthropogenic factors, e.g., [41] that showed a 20-fold increase in annual probability of extreme fire risk by isolating signals from multiple global models and [42].
The paper is structured as follows. Section 2 describes the generic framework employed to conduct the case study, with the active participation of stakeholders from diverse organizations. Section 3 presents the case study area of application, whereas Section 4 introduces the projected forest fire risk evolution and selected extreme scenario for the case study. Section 5 presents the identified impacts to the region.

2. Case Study Conduction Methodology

Under the framework of the EU-CIRCLE project, the case study was implemented by CEREN with the support of ARTELIA following a civil protection style exercise (Figure 2). This sequential scheme was used to ensure and assess the quality the proposed framework to the case study scenarios, following a stepwise procedure, with the continuous interaction of the stakeholders. To our best knowledge, this was the first time in the European civil protection context (https://ec.europa.eu/echo/funding-evaluations/financing-civil-protection/civil-protection-exercises_en) that a case study was focusing on a climate change scenario. It highlighted the challenges lying ahead for the involved agencies in firefighting and critical infrastructure operators.
More specifically, the following activities were performed (Figure 3).
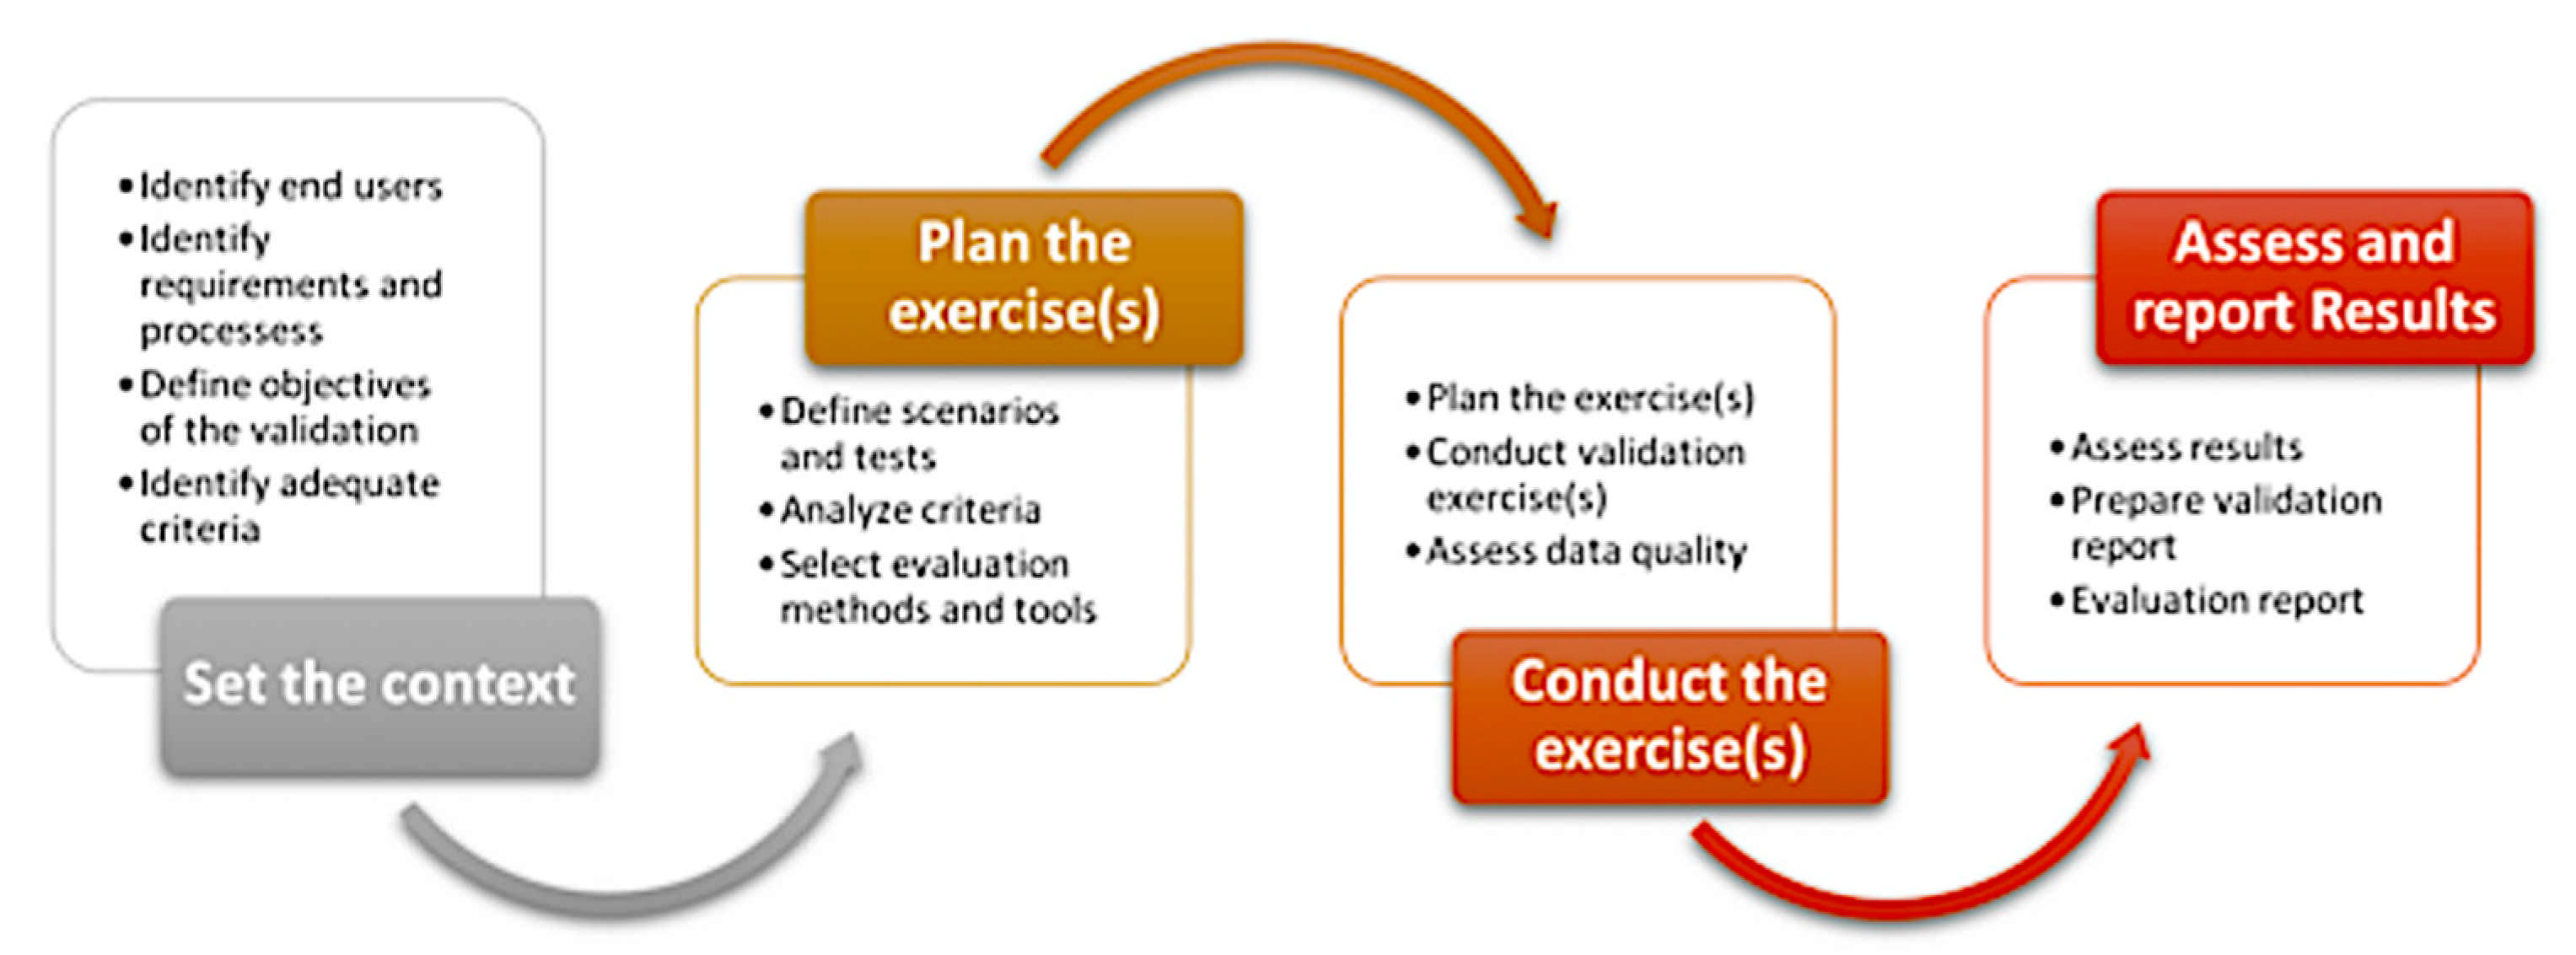
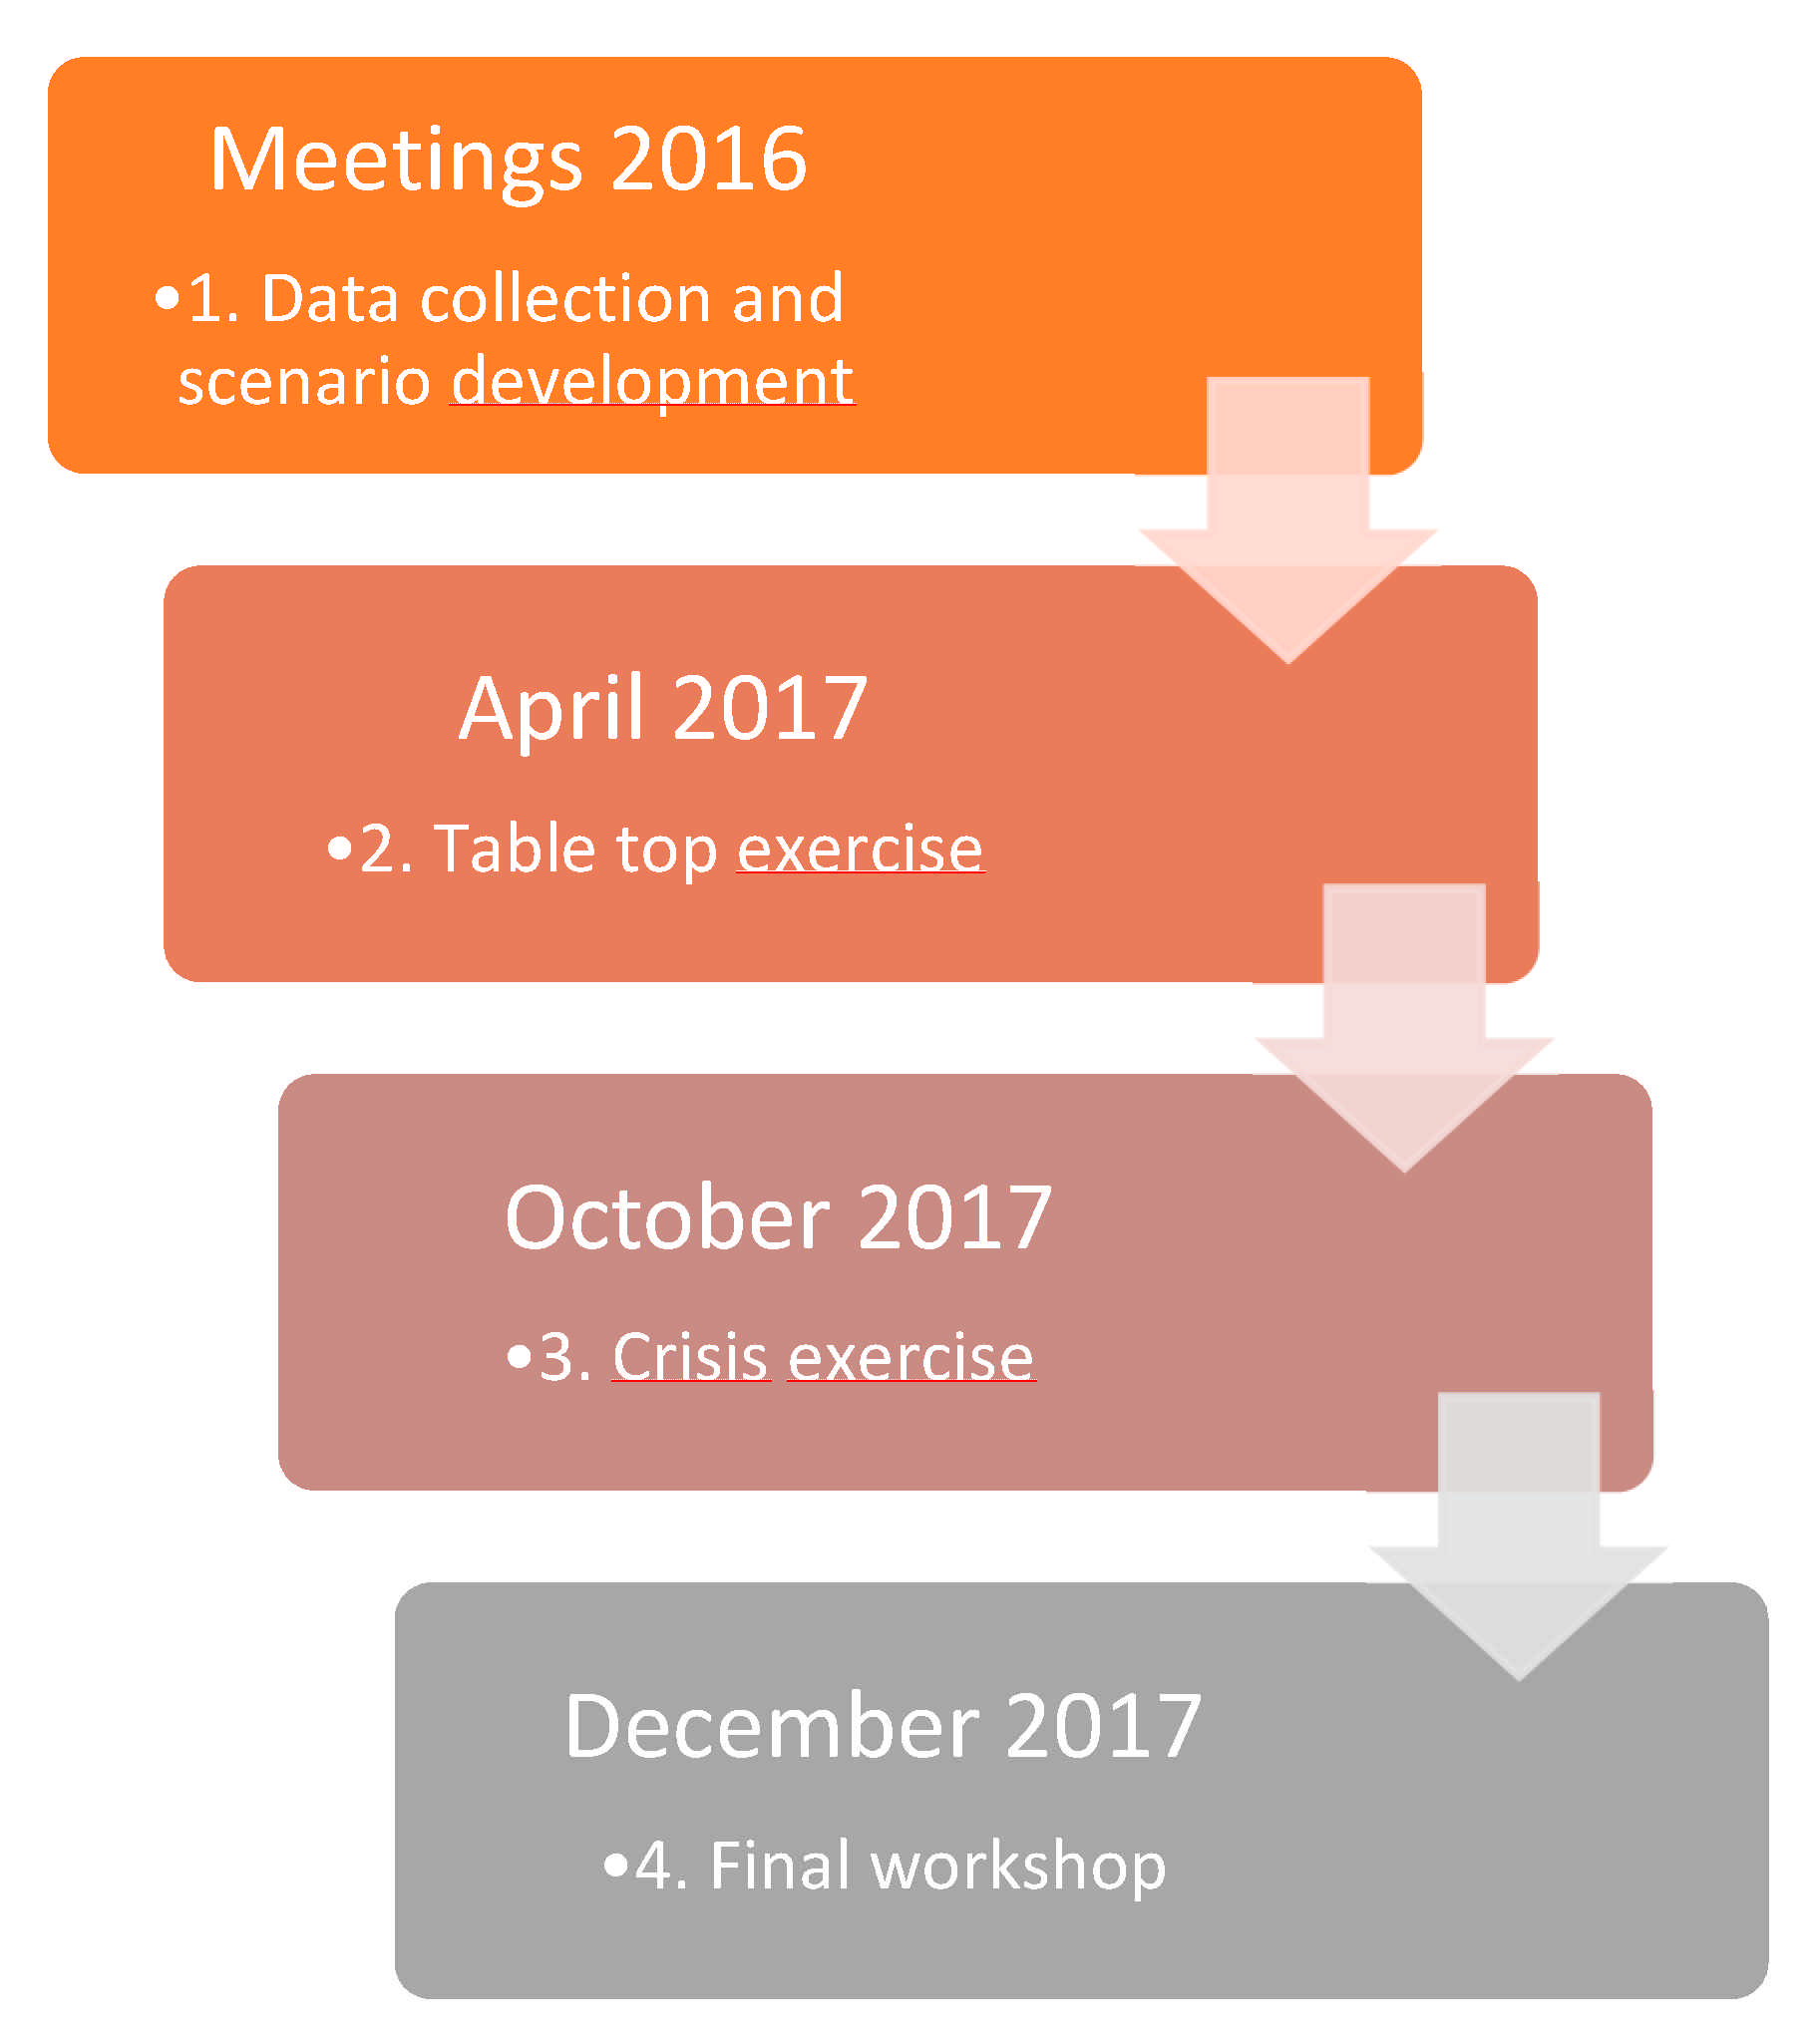
  • Contact with CI operators (and emergency responders in the region. The ones that are most likely to be affected by heatwave and forest fires were targeted. Both infrastructure operators (RTE for electricity transmission network, ENEDIS for local distribution electricity, and ESCOTA as the highway operator) and public authorities (zonal prefect authorities responsible for deployment of aerial means for fire-fighting, prefect authorities related to decision to cut the electric lines, firefighter units SDIS13 and SDIS 83, and the regional coordination center EMIZ) were contacted and participated.
  • A table top exercise was followed, involving the same participants, with main priorities to (a) identify the main cascading effects between the CI; (b) validate the developed scenario in terms of location, reference meteorological conditions, and linkage to the climate change scenario.
  • At the request of the operators and with the coordination of the authorities, a crisis command post exercise was organized based on the developed scenario. The event took place in October 2017 in the Zonal Civil Protection Coordination Center of South of France (CeZOC).
  • A final workshop where the scenario and software tools were tested and climate change adaptation and risk mitigation tools were demonstrated and evaluated.
The global objectives that were targeted under this user engagement process are the following:
  • Raise awareness on vulnerabilities and interdependencies across CI and organizations.
  • Analyze the impacts of network failures and develop the corresponding countermeasures.
  • Advance resilience across inherently interdependent critical infrastructure systems and communities.
  • Test and generate knowledge with their respective internal tools in particular stressing situations.

3. Presentation of the Case Study

The case study was unfolded using the following steps: 1. identify future forest fires characteristics as defined by pertinent indicators (FWI) based on projections from the IPCC scenarios RCP4.5 (a medium stabilization scenario) and RCP8.5 (high emission scenario); 2. select high end scenario based on extreme value analysis and local characteristics (ignition point and vegetation); 3. perform detailed modeling of the local conditions on the selected event at very high resolution, fires spreading, the emitted smoke estimation and its dispersion, 4. determine the impact on electricity and transportation networks, also accounting for their possible interconnections and 5. examine emergency response options, in addition to adaptation and prevention measures.

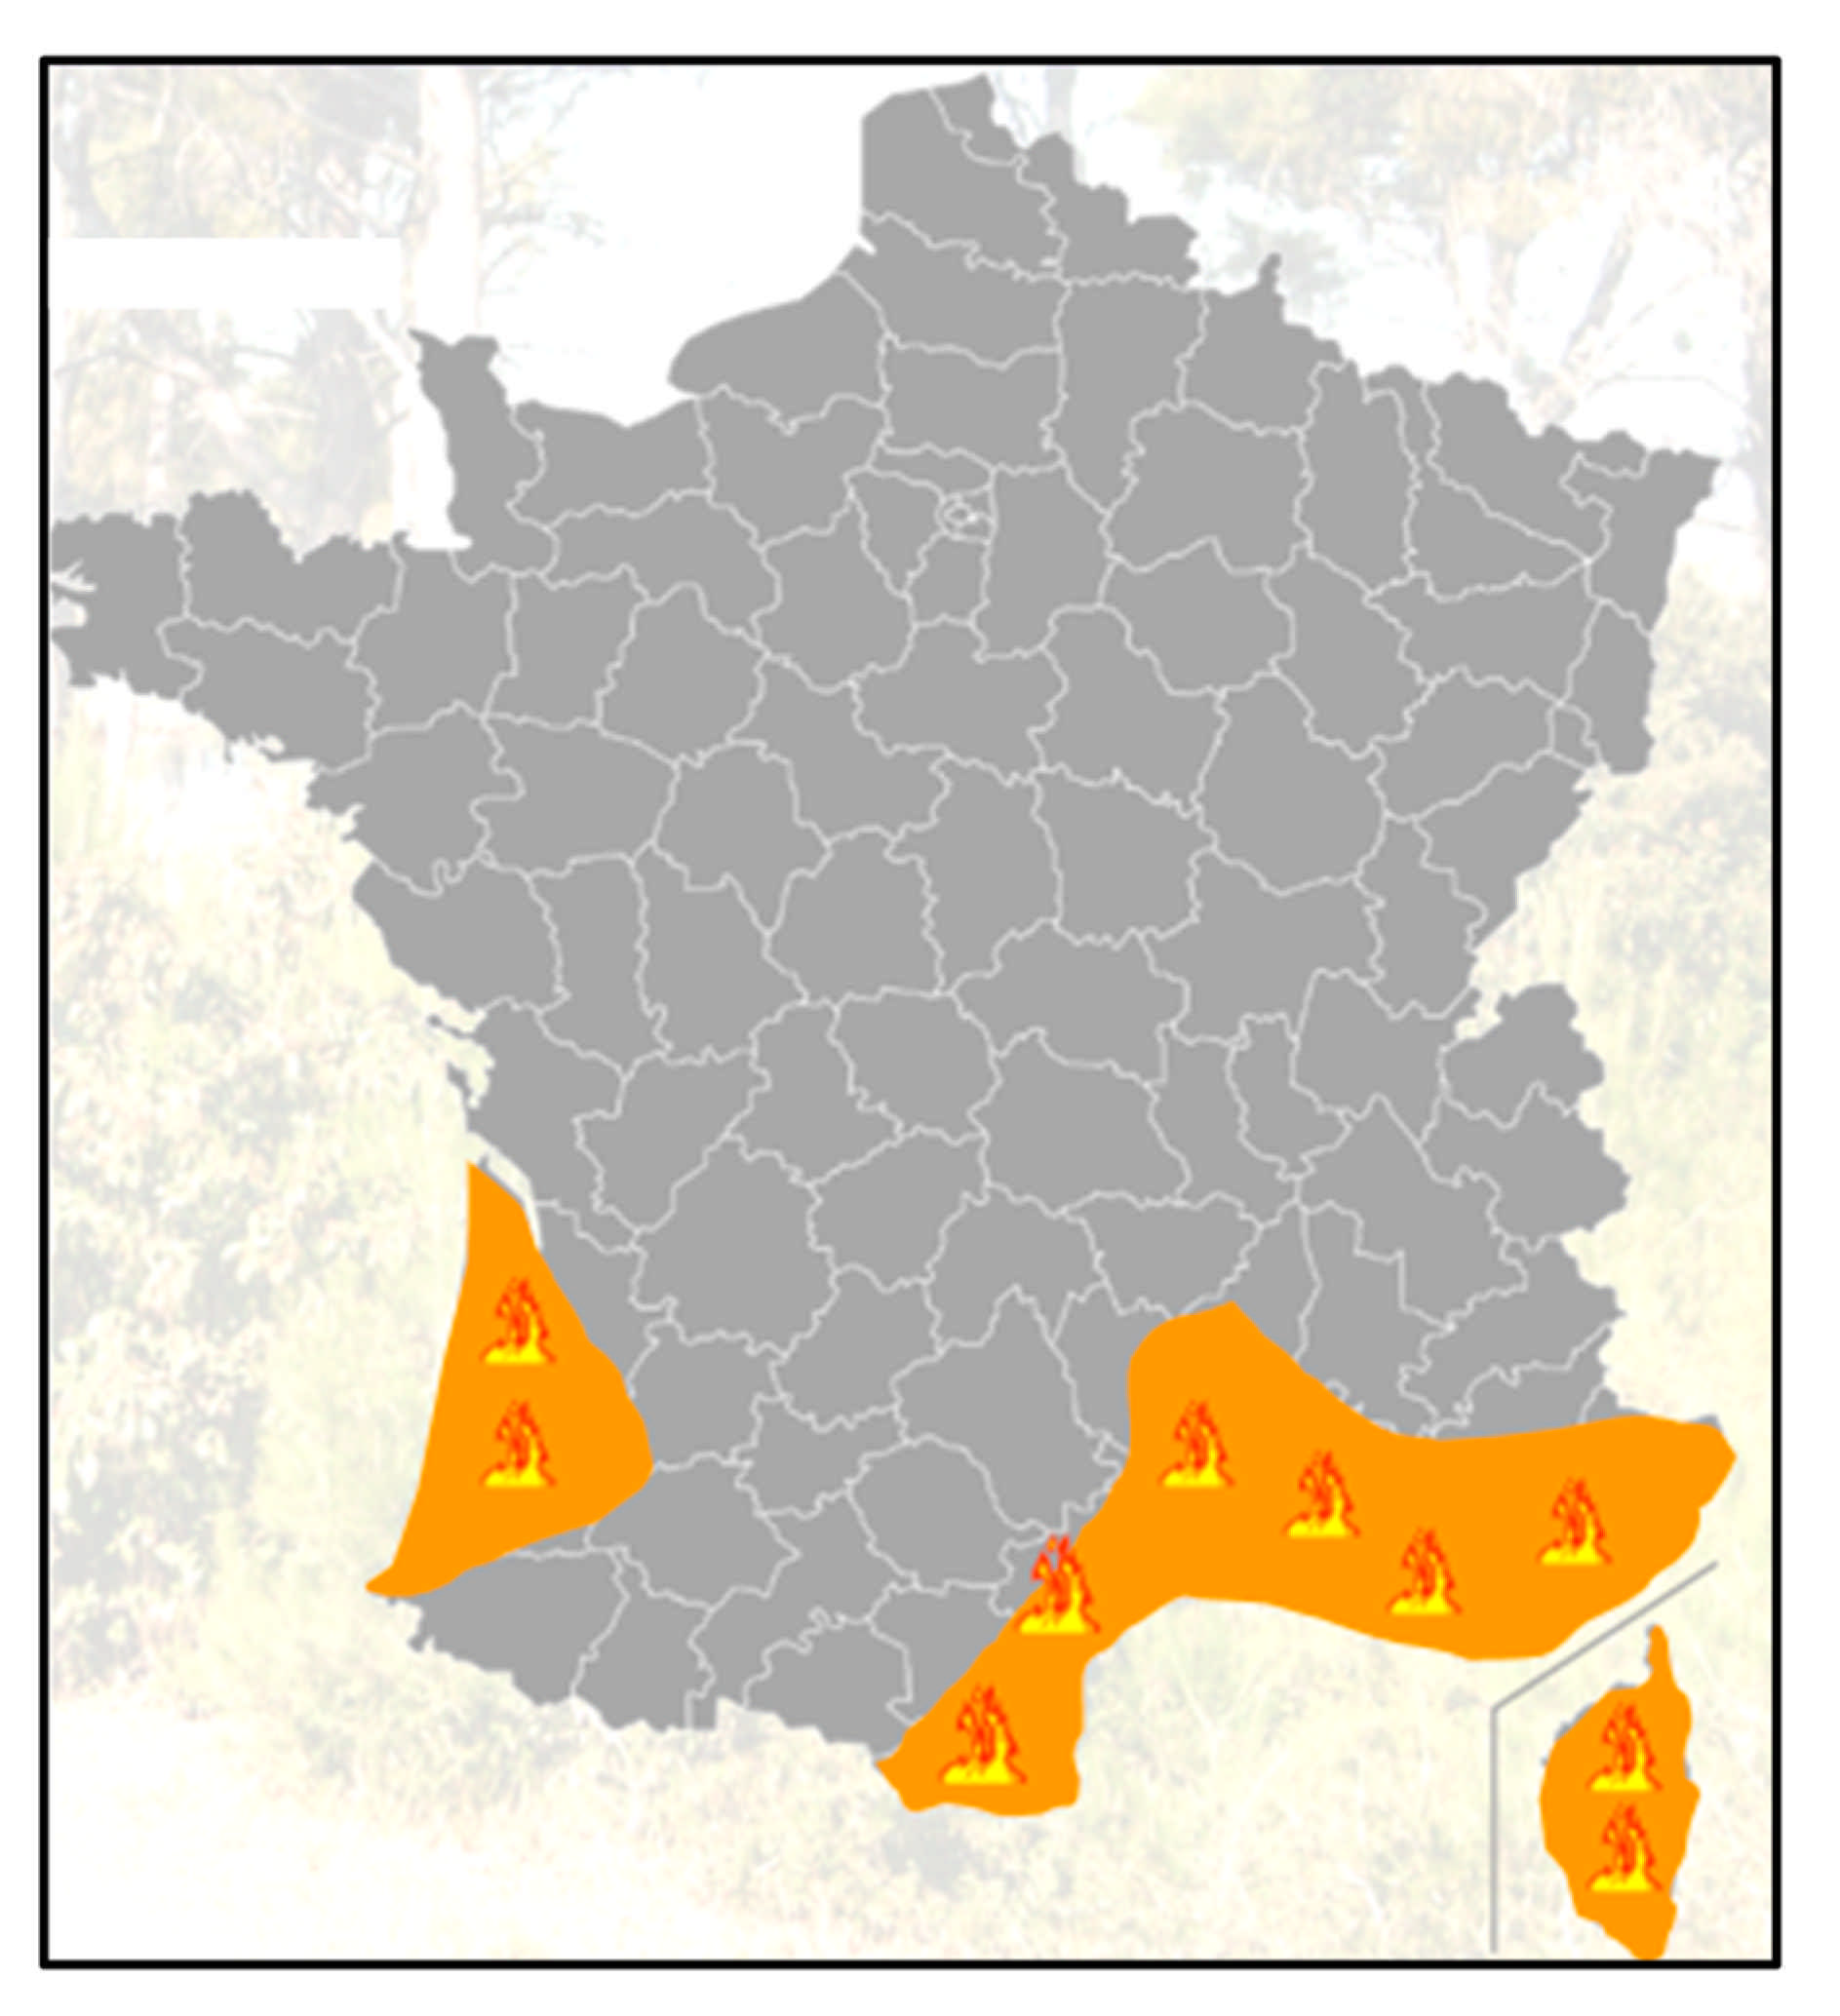
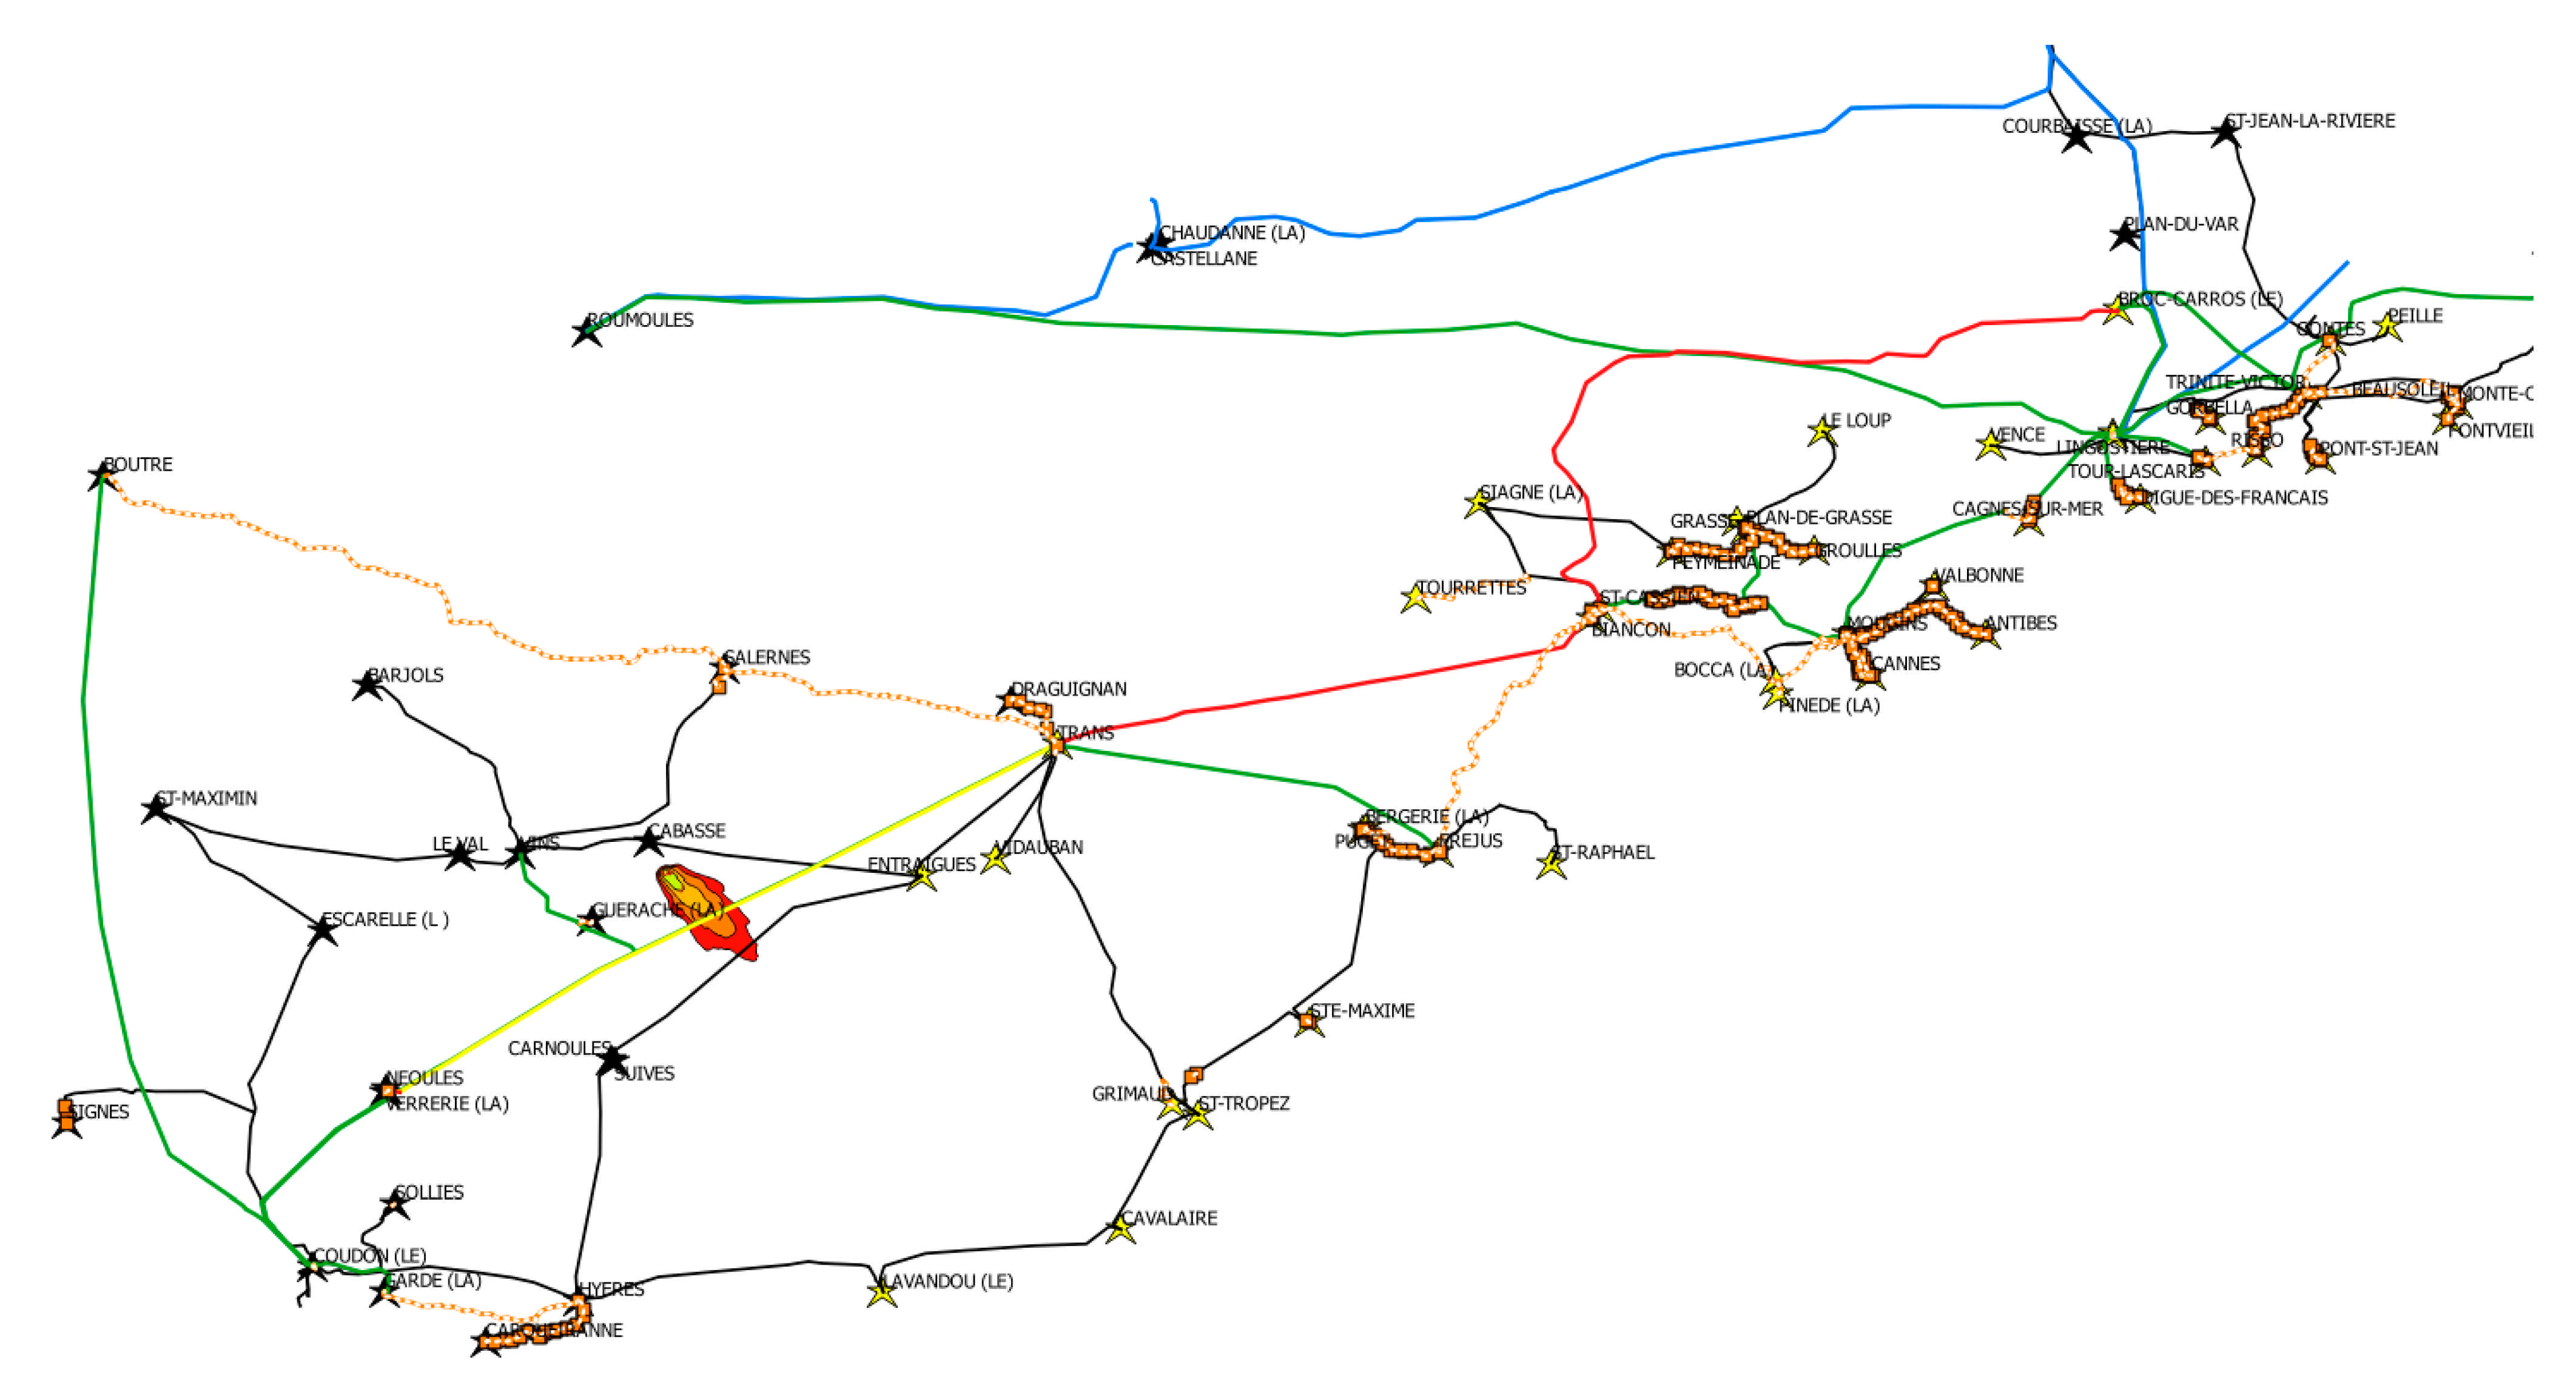
3.1. Geographic Area

The Provence-Alpes-Côte d’Azur (PACA) region under consideration is an area of 31,400 km² with a population of 5 million inhabitants. It is located in the south-east of France and delineated south by the Mediterranean shore, north by the Alps, east by the Italian Boarder and west by the Rhone valley (Figure 4). Located between the Alpine range and the Mediterranean Sea, Provence-Alpes-Côte d’Azur region is characterized by pronounced contrasts within three main geographical areas:
  • The Mediterranean coast is characterized by low shores and cliffs. It shows strong economic and demographic dynamics, in particular in the Bouches-du-Rhône department. The natural reserve of Camargue appears as an exception where human activities remain very limited.
  • The center and the western parts are composed of alluvial plains, lowlands, and hills. The Rhône and Durance Valleys represent major traffic routes driving a flourishing economy, notably and related to the production of electricity.
  • The Provence hinterland and the Alpine range (located north-east of the Region) is a sparsely populated area. The decline of agriculture enables forest to grow and the development of peri-urbanization.
The case study was conducted in the province of Var (with the city of Toulon: 160,000 inhabitants, 15th most populated city in France), as it is the forest fire prone area in France and frequently exposed to intense heatwaves and forest fires. The scenario also assumes that during the near future (2040s), an additional tourism flux could reach above 30 million per year [43].

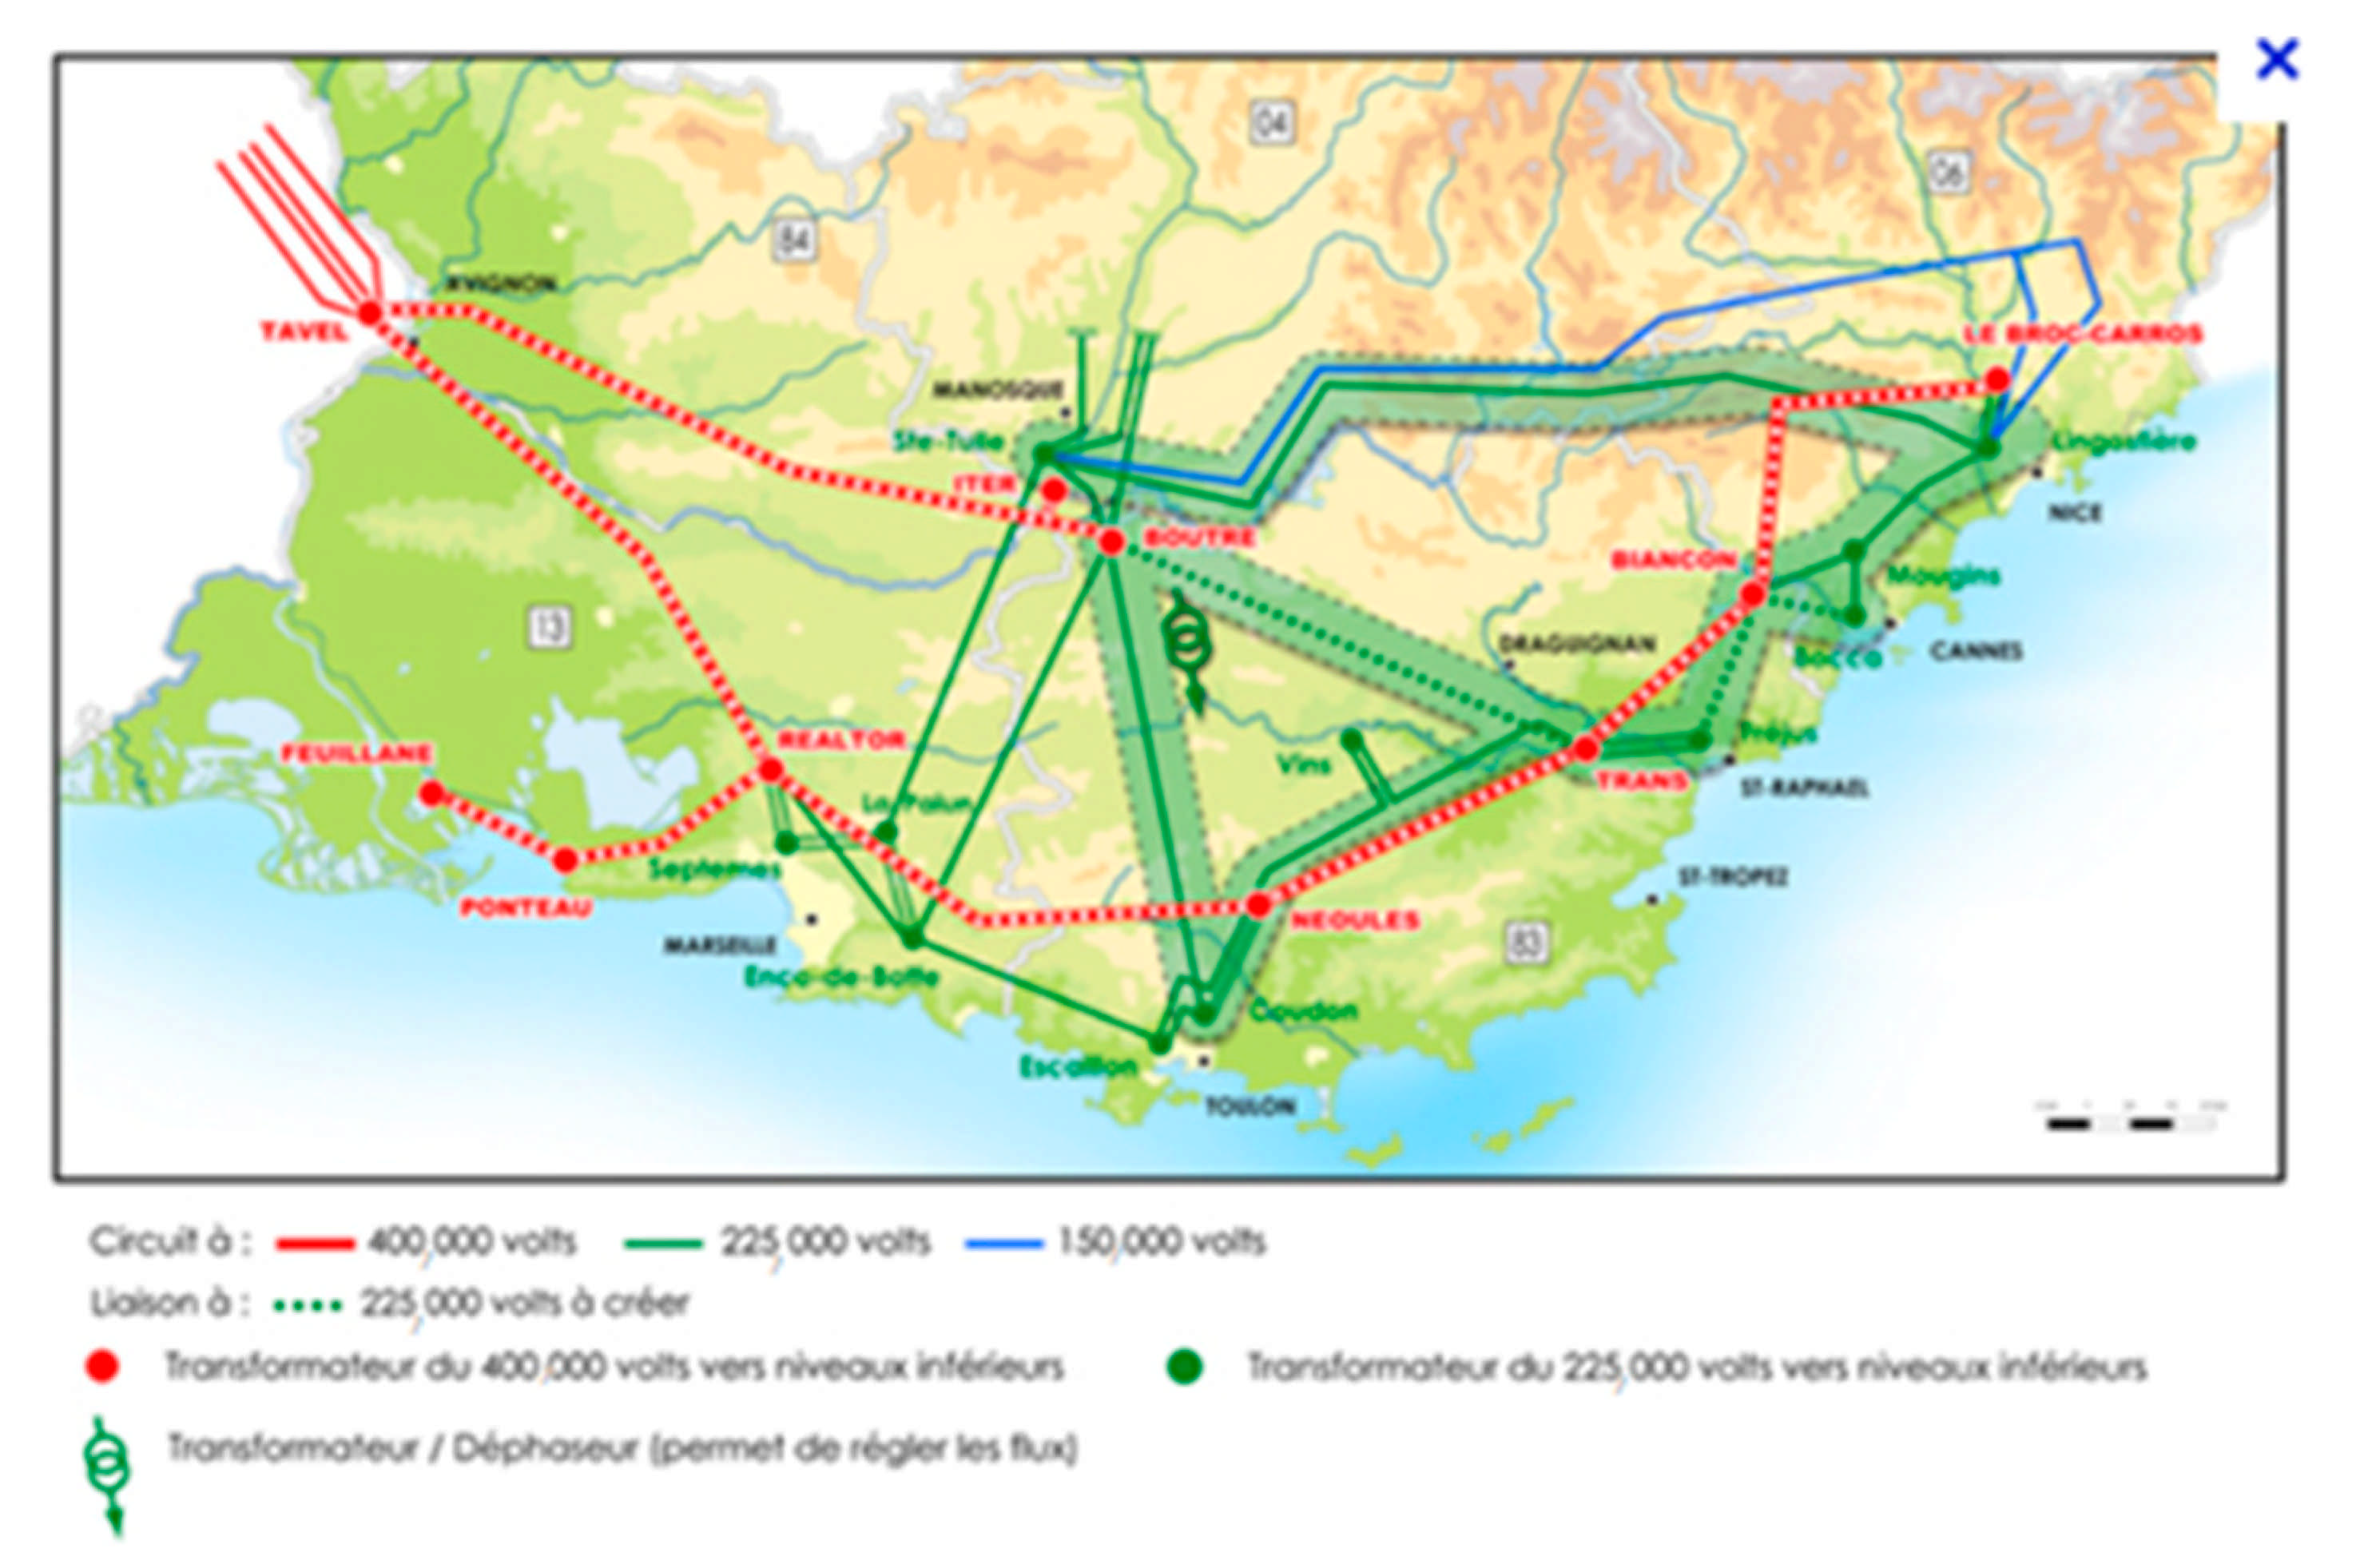
3.2. PACA Critical Infrastructures

The main CI of interest in this case study are electricity network and road highways. Three of them appear as key players for this case study: RTE (transmission) and ENEDIS (distribution to end-users) from the electricity side and ESCOTA as the highway operator. PACA region is constrained by the specific topographic relief. This has consequences on the organization of the networks under consideration for this case study. In terms of transportation, the main axis is east-west oriented. This is the only one besides secondary road networks serving the eastern part of the region.
The transmission network operated by RTE in PACA covers 5662 km of aerial transmission lines and 595 km of underground transmission lines. Two hundred substations are installed, providing a transformation capacity of 17,833 MVA (Figure 5). In terms of power transmitted through the network, PACA consumes around 37 GWh per year (figures of 2015) while it produces around 12 GWh. The power demand (higher and lower peaks in 2015) varies between 2836 MW and 8006 MW in the region. The main assets that will be investigated for this CI are: production units (power plants), transmission and distribution lines (both aerial and buried), substations, and control center.
Regarding the electricity network, the unbalance is even more evident. In 2015, PACA region produced 41% of the electricity that was consumed in the region. It therefore had to import almost 25 GWh this same year, mainly from the nuclear power plants located in the Rhone Valley. A total of 64% of the electricity production in the region comes from renewable sources, mainly hydropower (Durance and Verdon valleys mainly, Nice hinterland to a lesser extent). The generation of electricity in PACA is mainly located in the mountainous hinterland, and the importation comes from the Rhône Valley, while the consumption occurs on the seashore (RTE personal communication).
It creates a situation of electricity peninsula where the eastern part of the region is heavily relying on one main transmission line. In 2015, works were carried out to develop missing links and alternative paths in the network by installing a high tension buried line north of the Var department. However, it is already considered that this solution may not be sufficient to ensure a robust network after 2025. Indeed, RTE plans that the electricity consumption will increase in the region by around 15% by 2030. It is also considered that seasonal patterns with stronger peaks are to be expected, linked to warmer summers and more frequent heat waves. The injection of more and more electricity from intermittent renewable sources into the network (related to emissions reduction plans) may also weaken the network, since power storage solutions are not yet mature. The highway network also appears as one of the CI most affected by the forest fires risk. It is also relying on the electricity provision for delivering its services. In the PACA region, and in particular in the three departments under scrutiny, the main highway operator is ESCOTA. It operates a network of 471 km under the status of service concession until 2032 (Figure 6). The main assets that were investigated for this CI are roadways, safety related systems, traffic control center, rest, and service areas.

3.3. Outline Rationale and Description of the Specific Scenario Retained

The case study occurs during the summer, when the population highly increases due to the tourist presence, resulting in an overloaded flux of people on the highways networks and increasing the consumption of electricity. Moreover, with the presence of tourists during this high-risk period, the fire ignition probability increases too.
A heat wave has been striking the south-east of France for a couple of days, causing incidents on the electricity network (temperature alerts reached in some substations) and on the roadway (behaviour changes caused by stress). The forest fire risk index is extremely high, especially in the Var department.
A forest fire ignites north of the city of Brignoles and is pushed south-west by the wind. Soon, the fire reaches both the highway (A8) used by thousands of tourists in summer time. Due to the important smoke production, visibility is significantly reduced so that highway has to be closed, resulting in an important traffic increase on the secondary road networks. Tourists are confined on highway rest and service areas, while basic services delivery (drinking water, road signaling, radio emission, etc.) is threatened. Additional accidents are caused because of the panic of people.
Owing to the risk of electrical priming caused by smoke, as well as to facilitate aerial firefighting operations, electricity lines are cut off, and in particular extra high aerial lines serving the eastern part of the region (400 kV and 2325 kV). Load-shedding plans have to be applied for the transmission network, which will result in reduced power being available for the distribution network. Due to the high temperature of soil and ground, a junction box of the buried extra high tension line crossing the north of the Var department stops functioning, cutting this line as well.
The risk of a black out in the eastern part of the PACA region is extremely high, given that the two main power transmission lines are cut. The impact on the general public and on the other CIs (in particular the highway network) may be very severe, also impacting vulnerable societal groups and economic activity. Other emergency operations are disturbed because of the large delay of alert, which could lead to a decrease of available means and major dispersion of such means.

4. Extreme Event under Climate Change

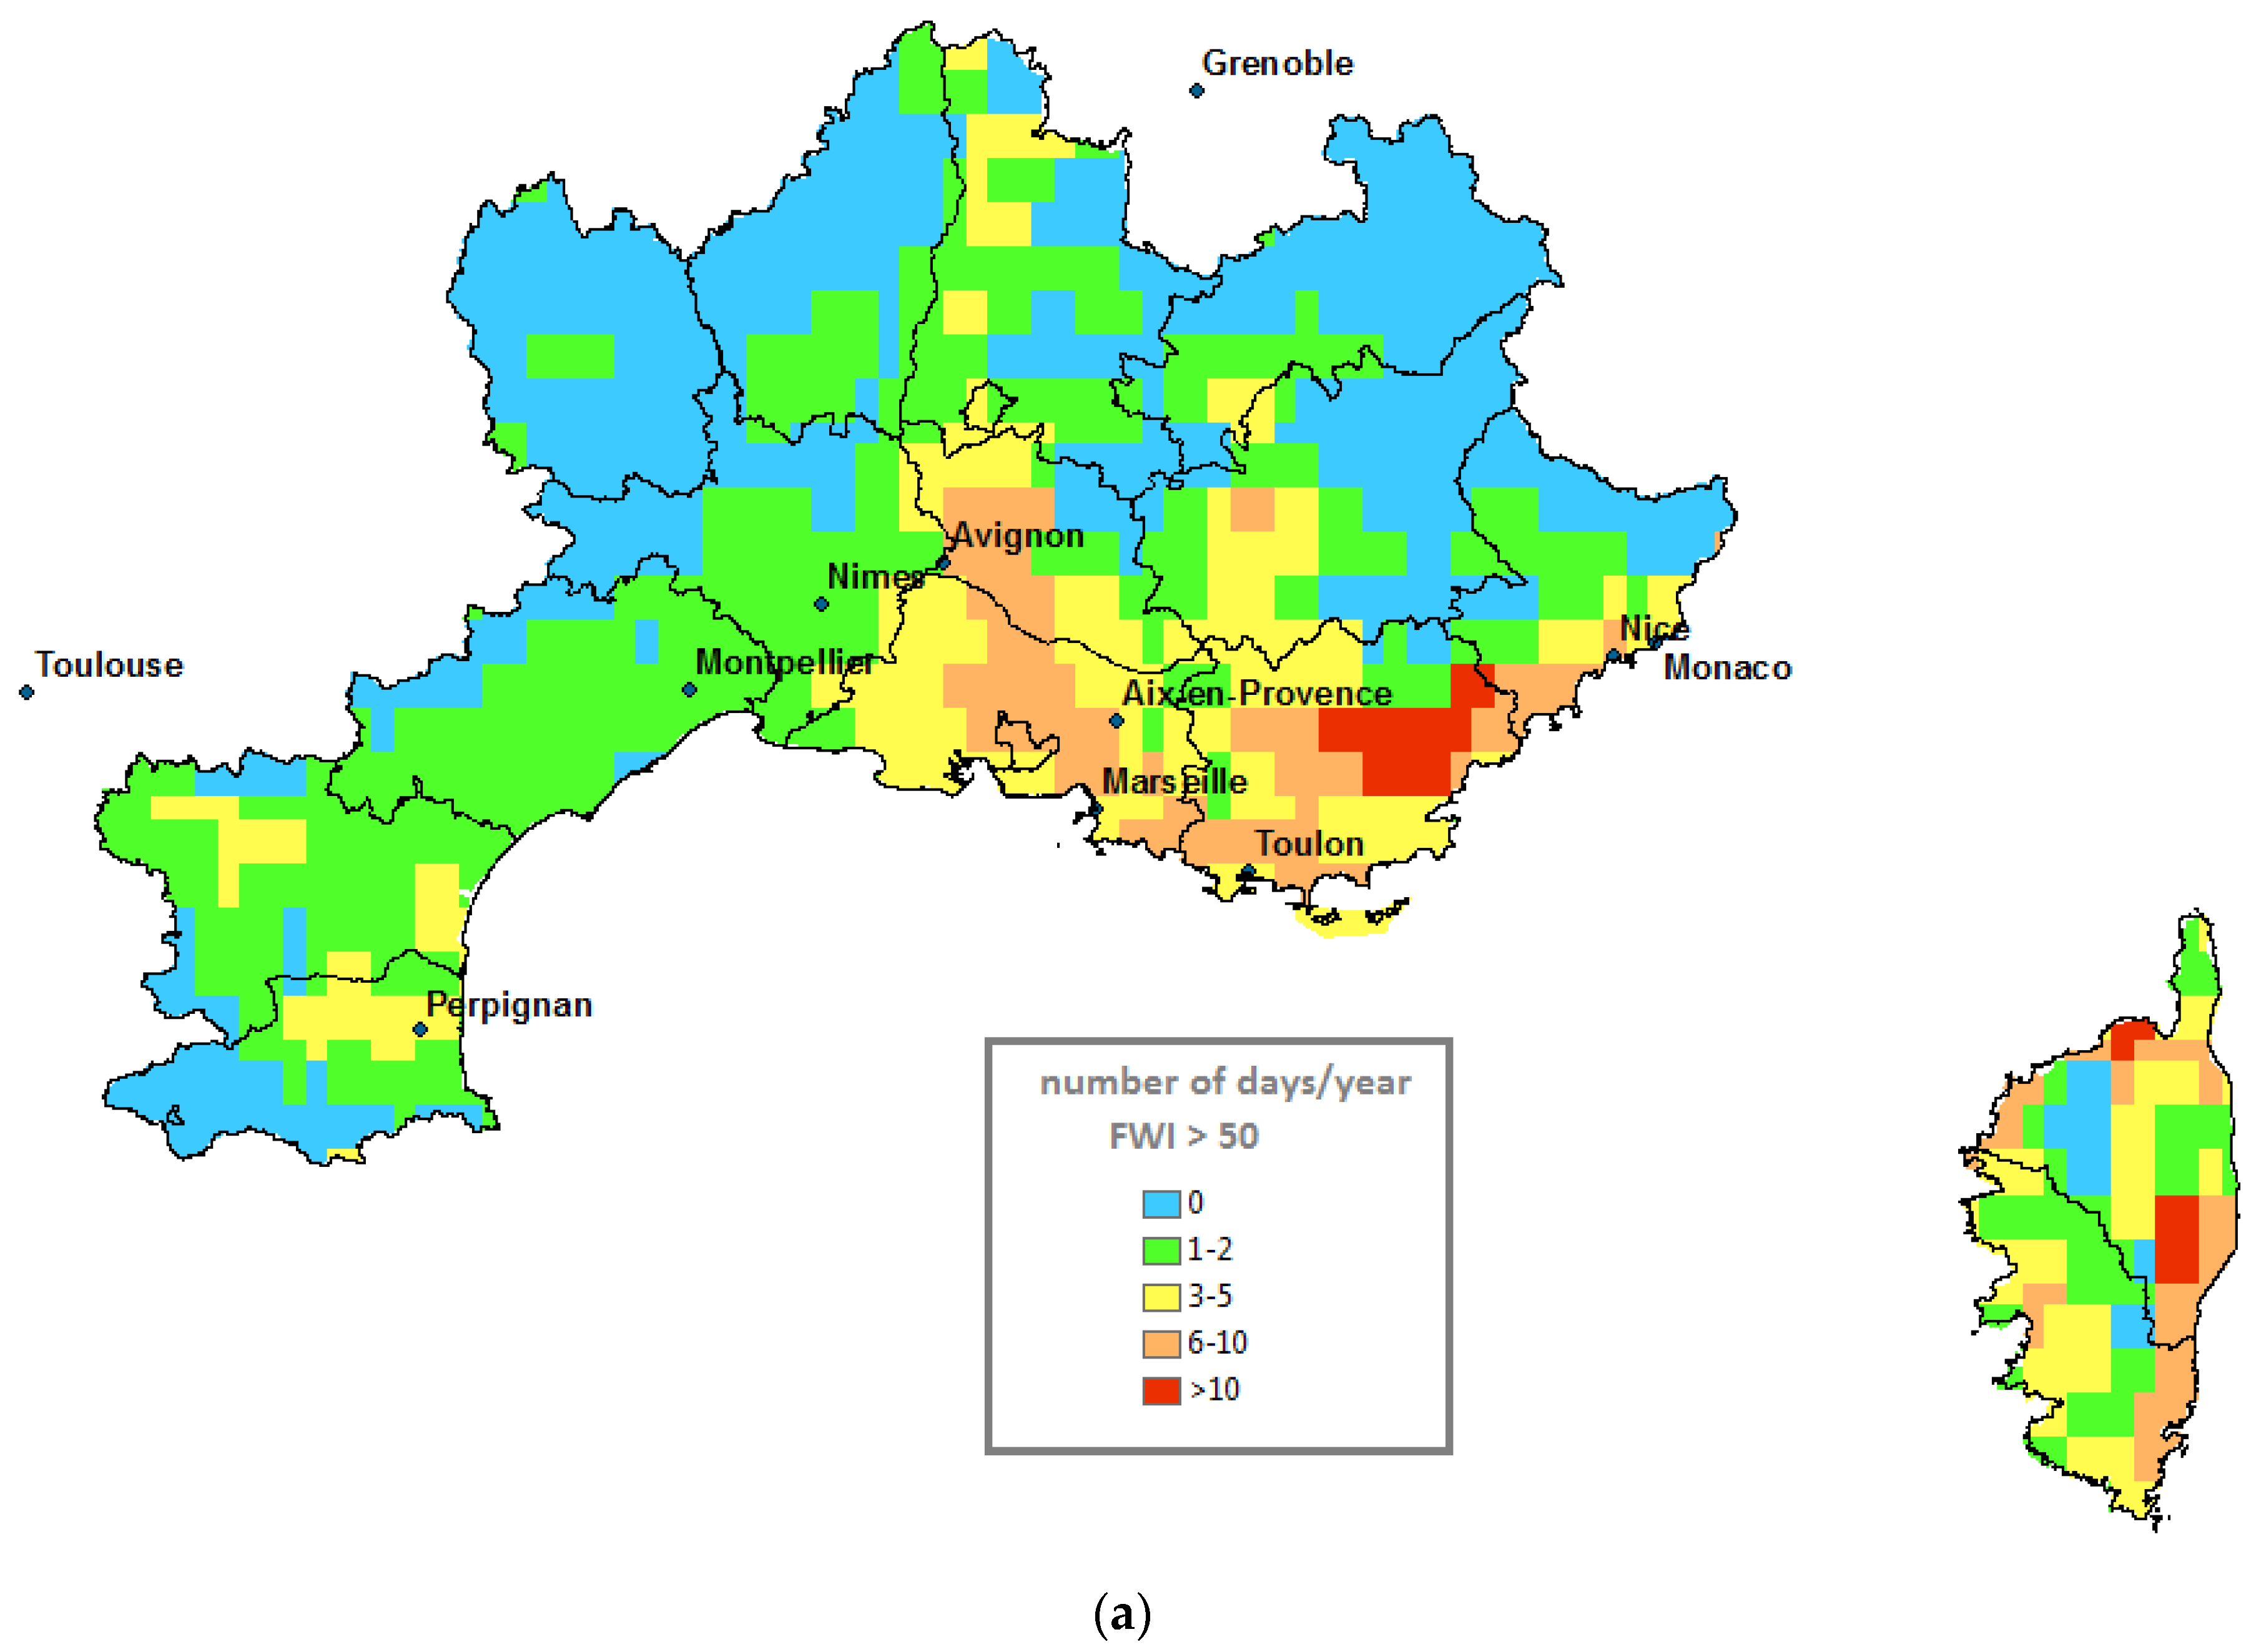
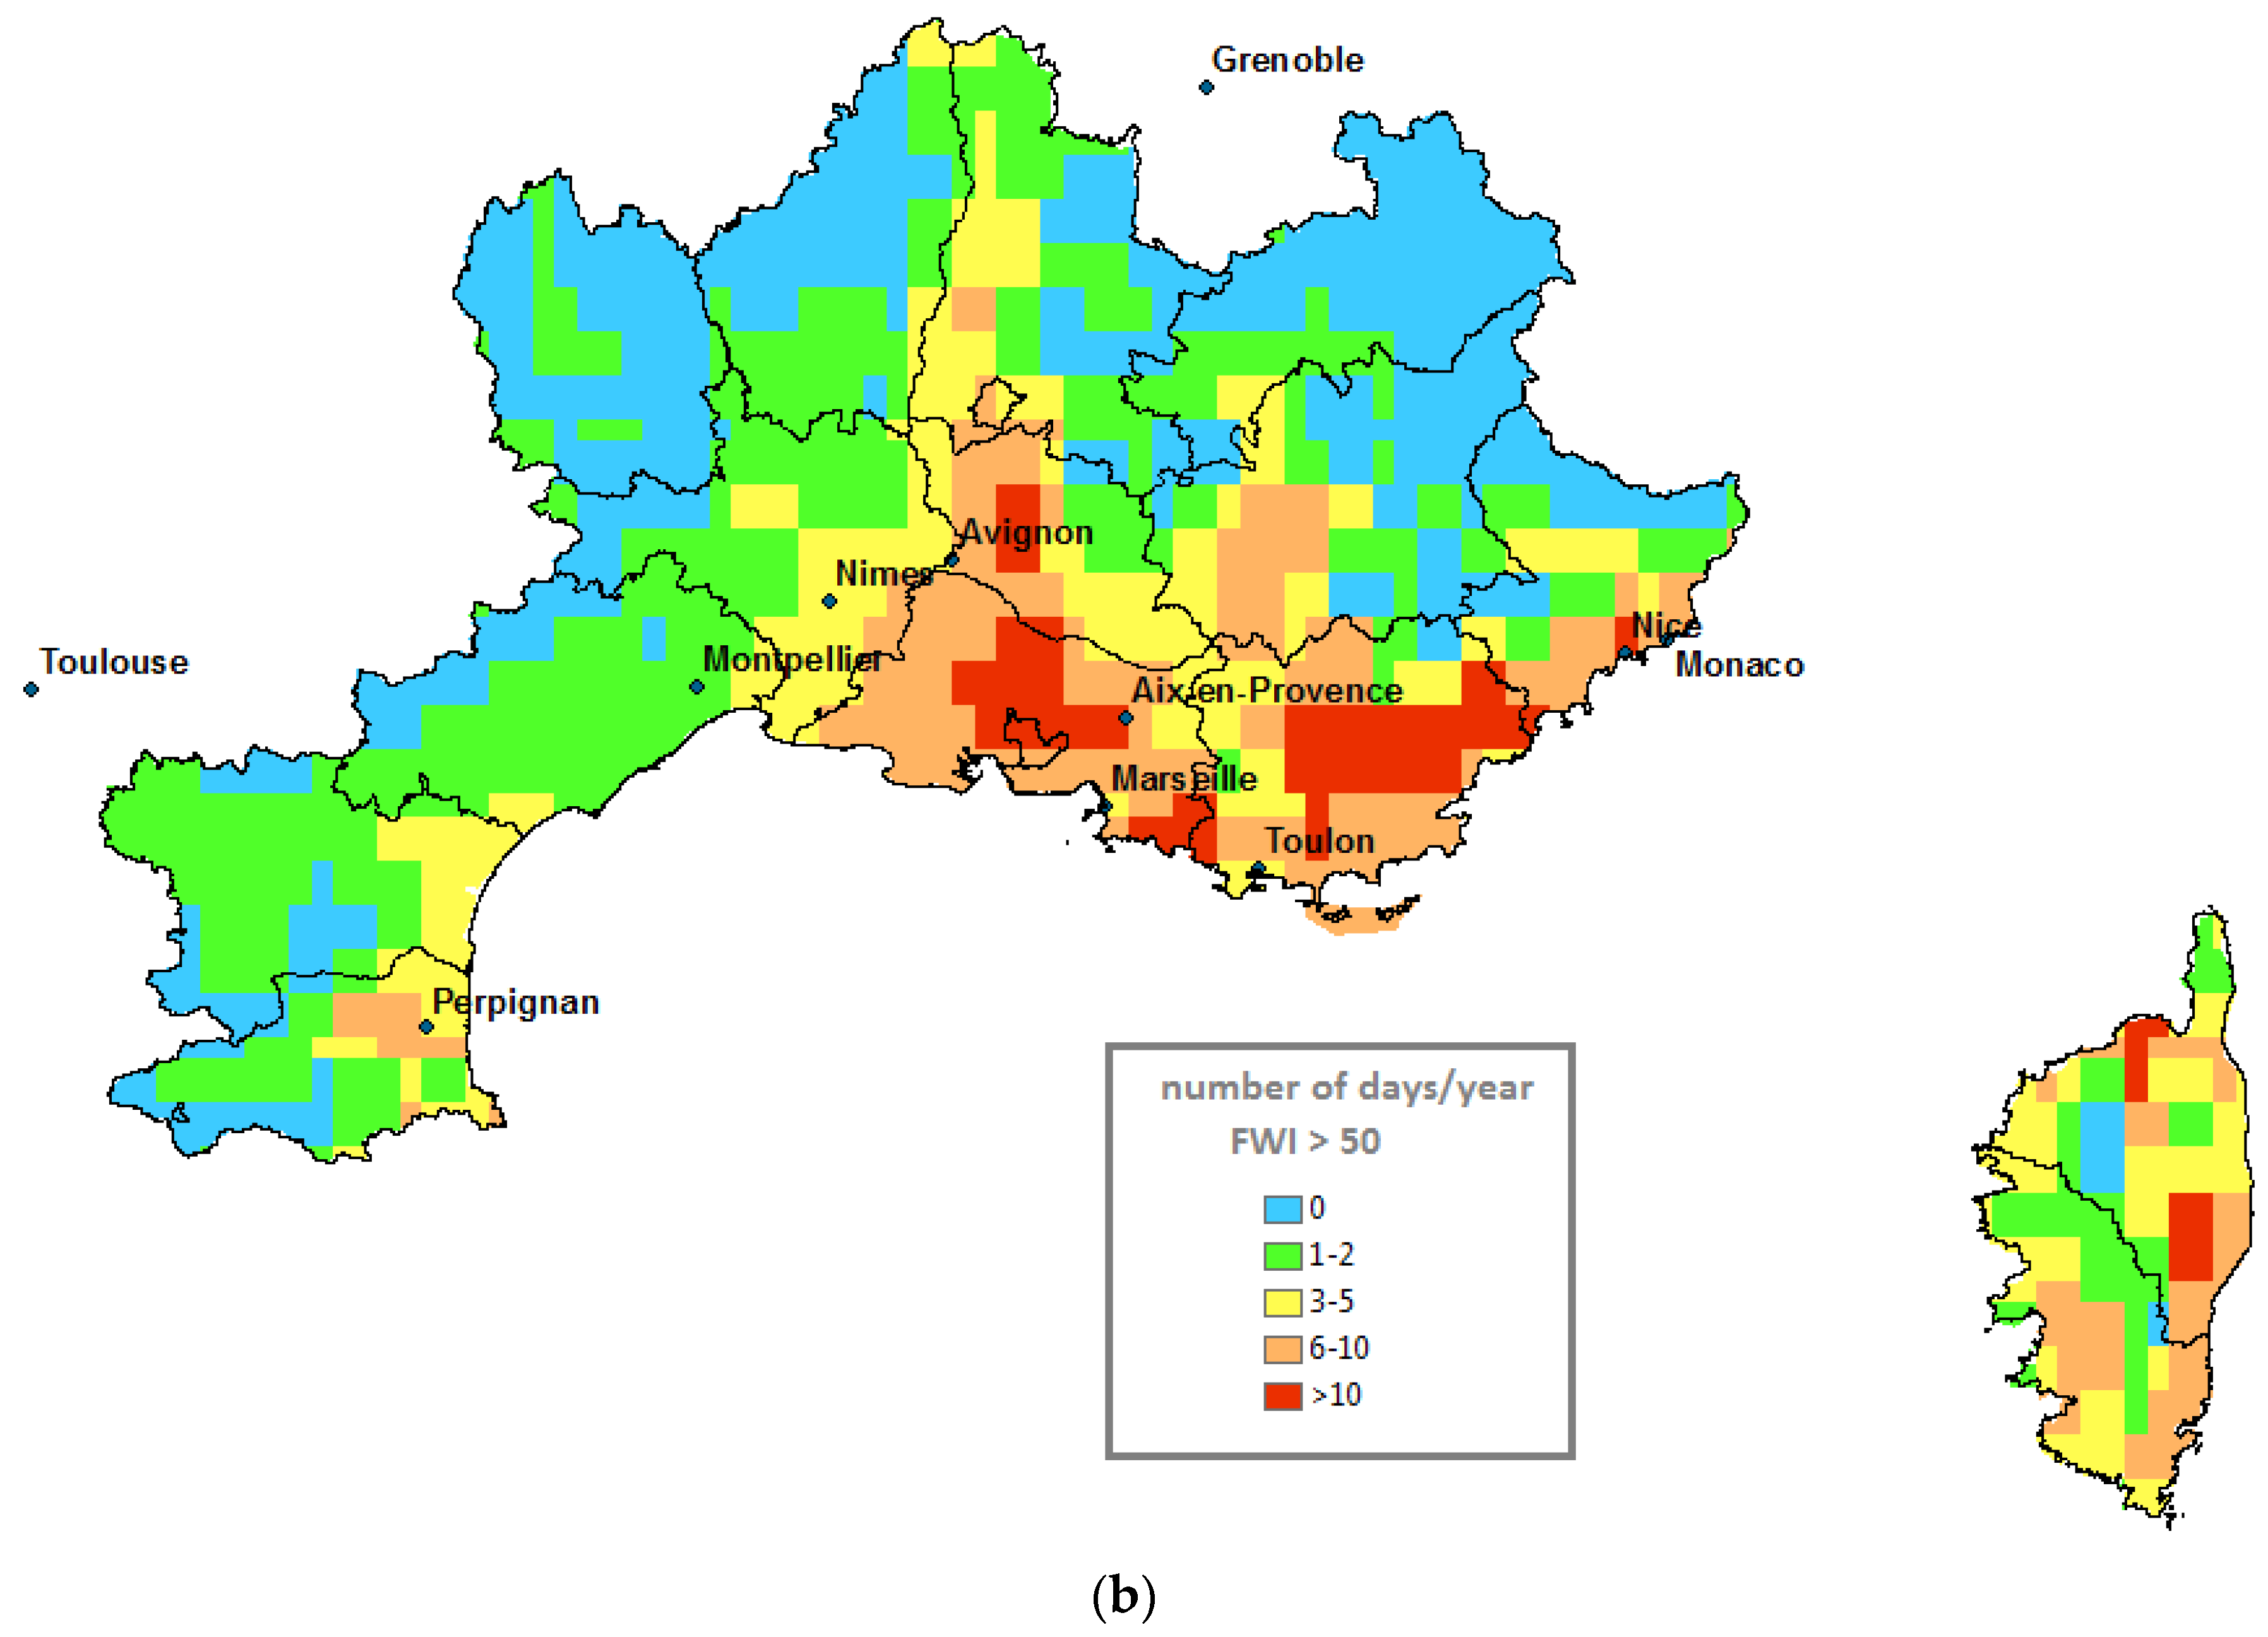
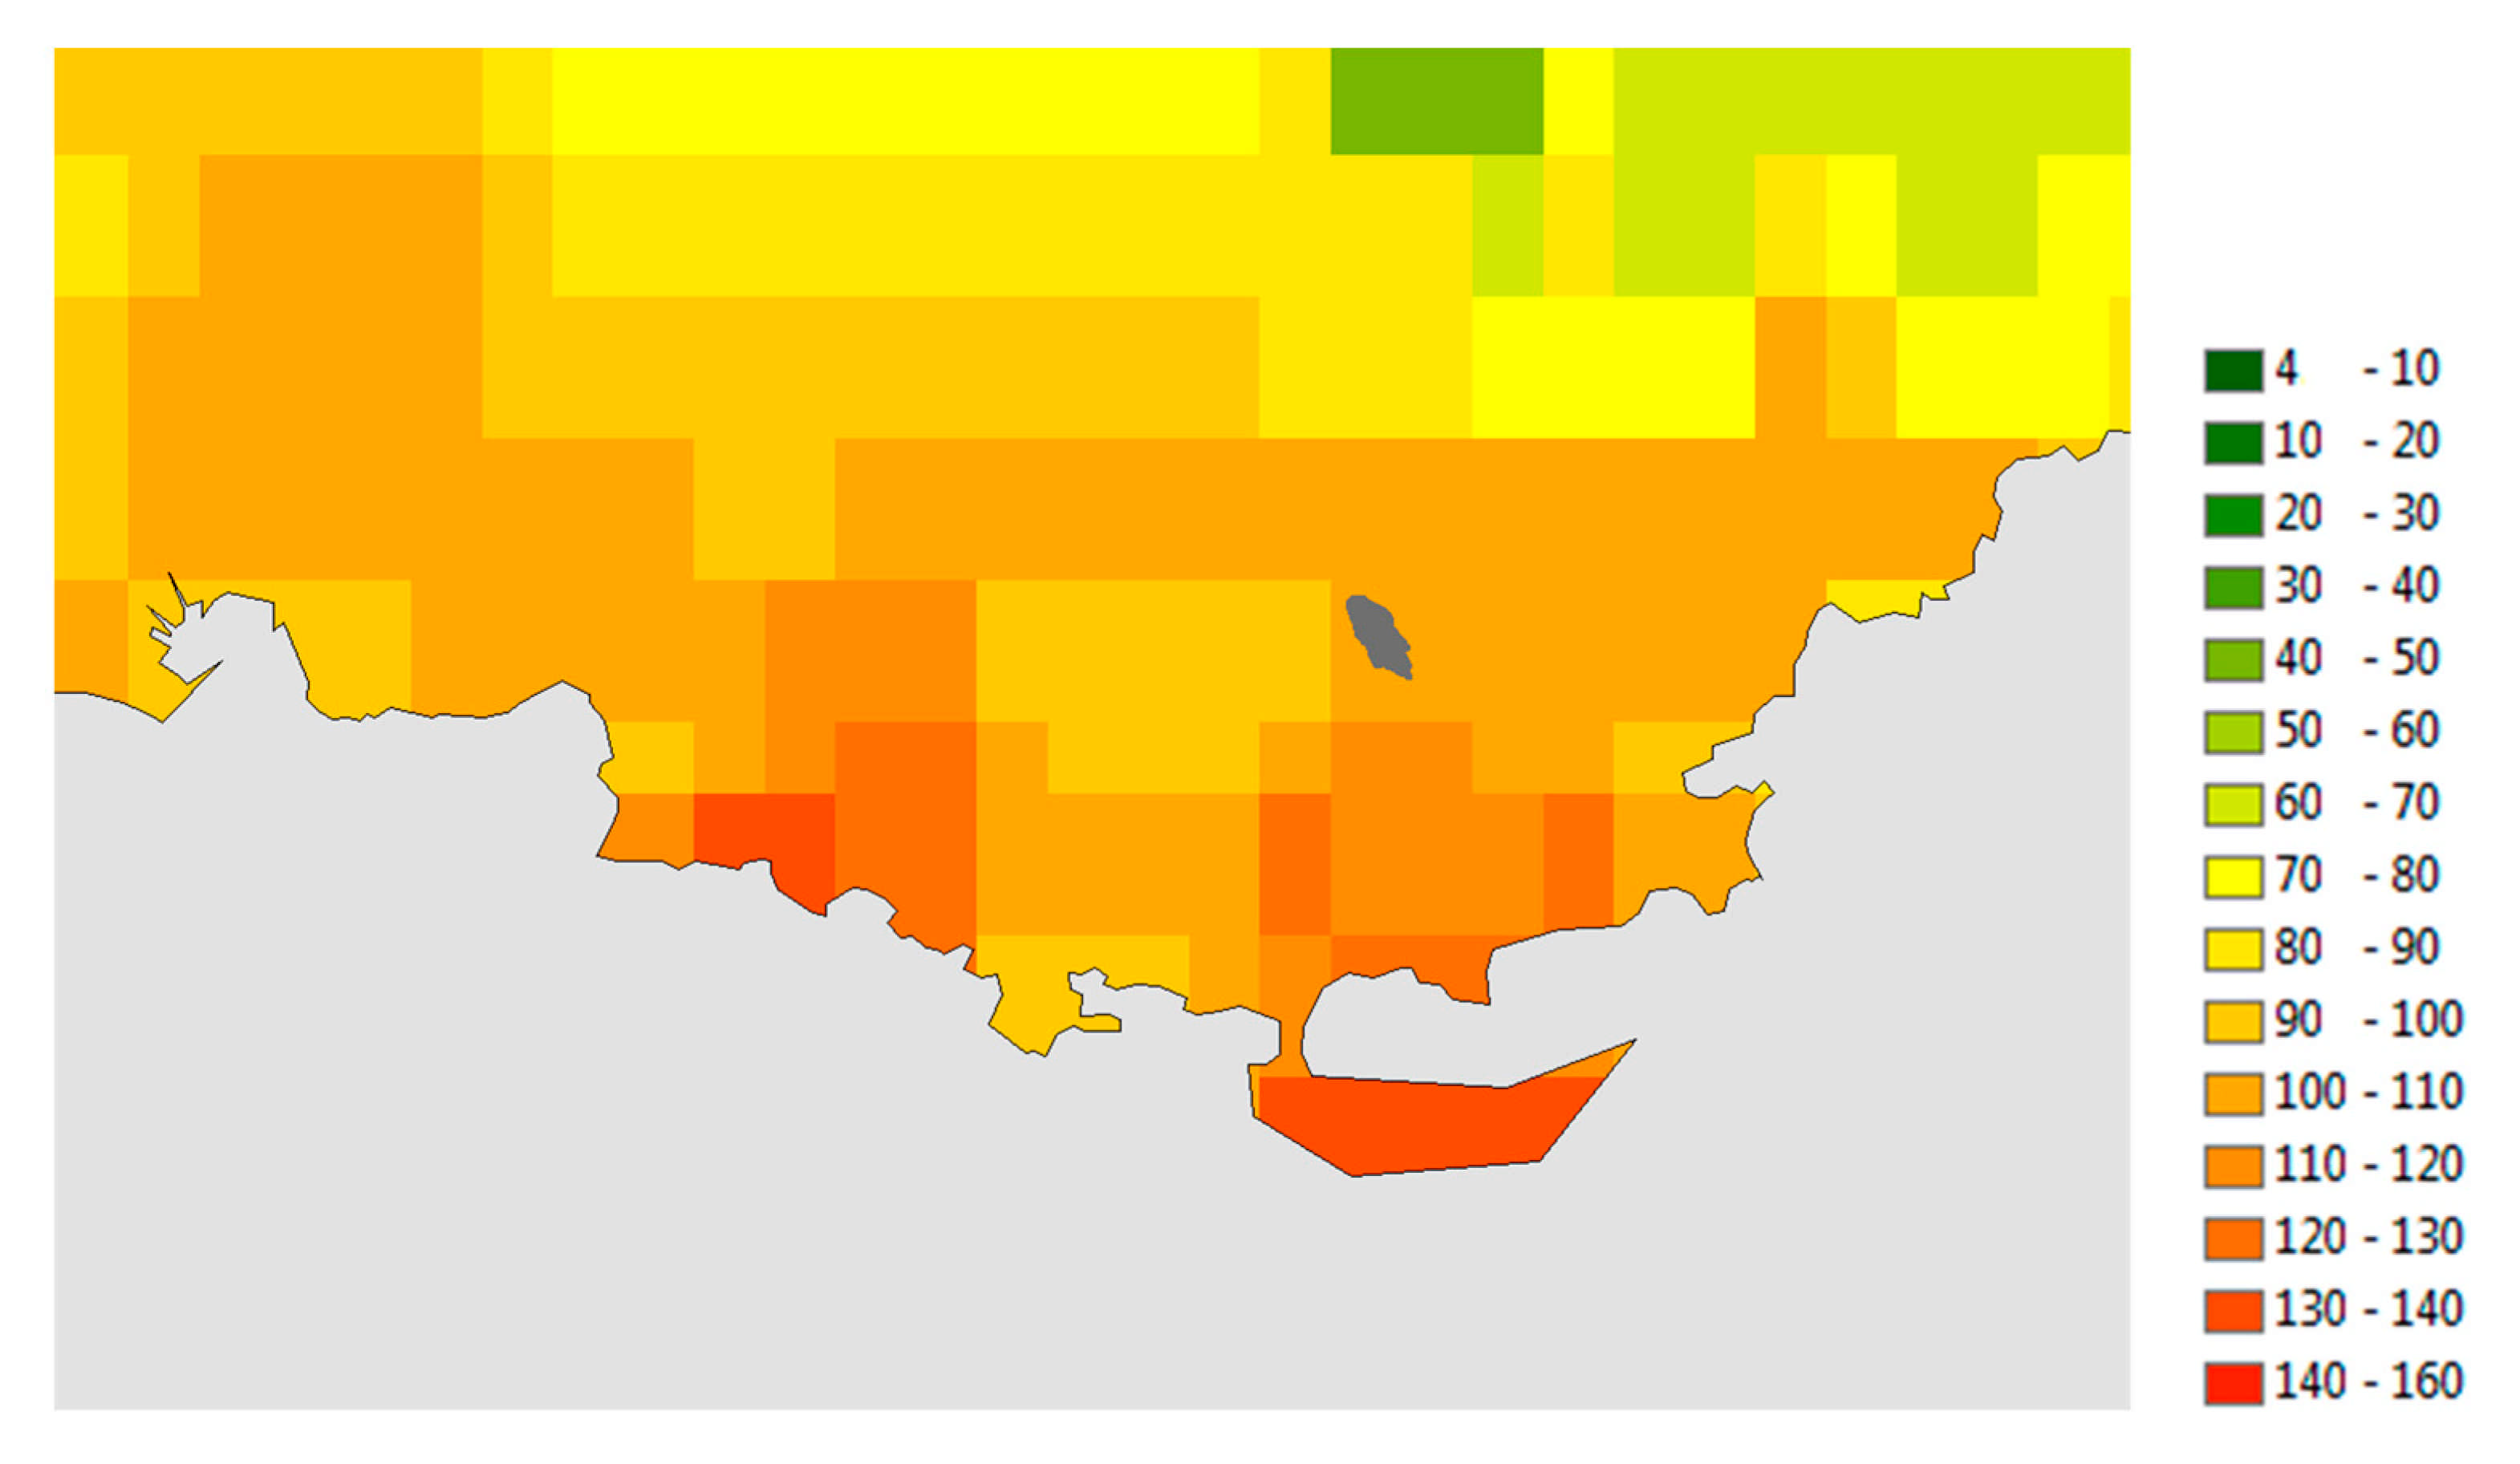
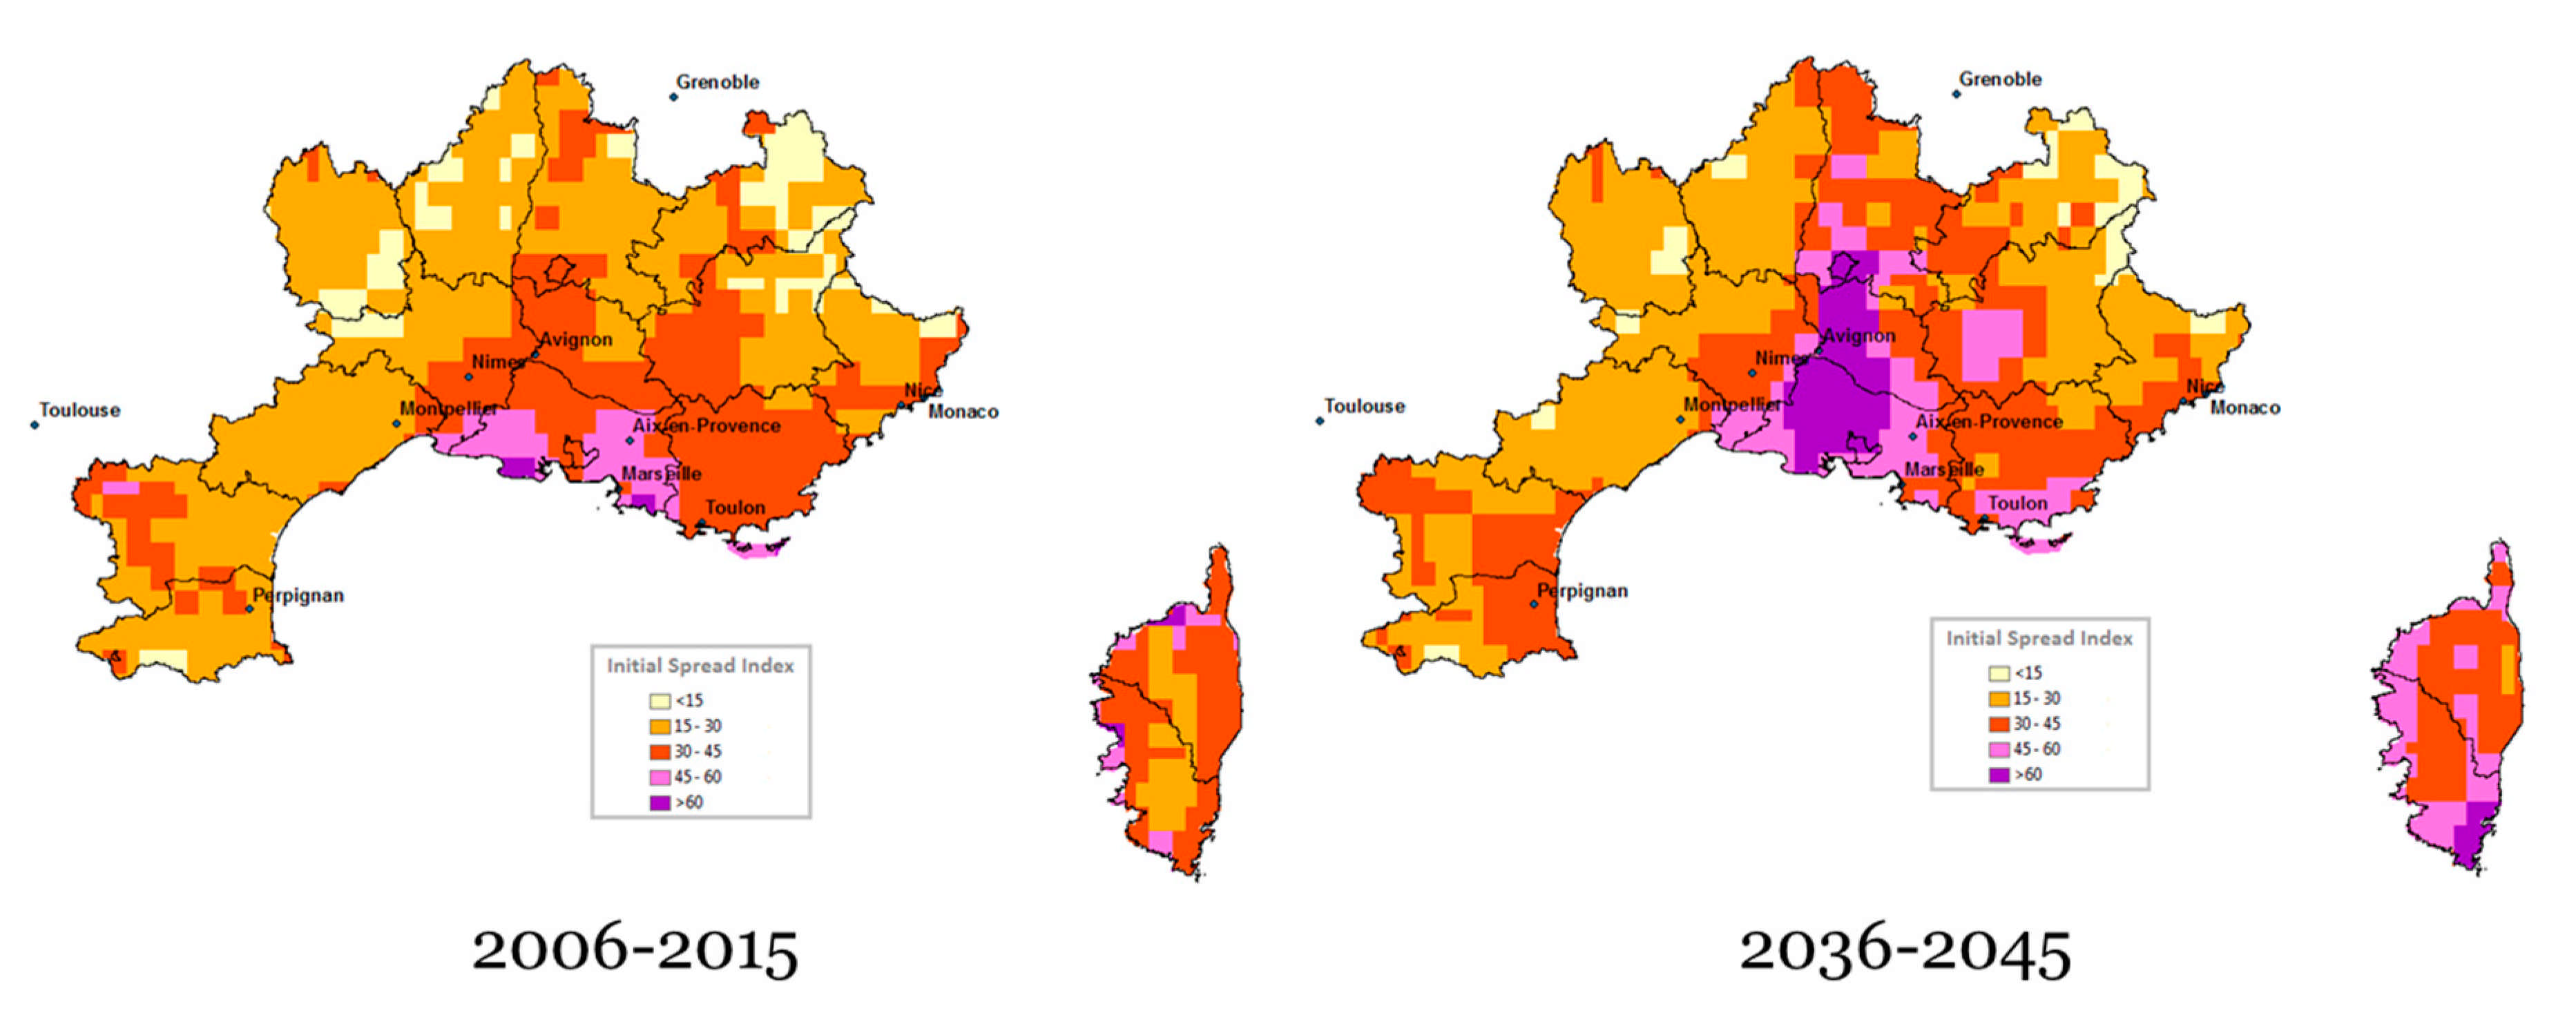
4.1. Climate Change Induced Forest Fire Risk

Damaging forest fires in the Mediterranean strongly depend on the air temperature and wind conditions, the amount of fuel load and the drought conditions that drastically increase flammability, particularly during the summer period. Within this work the meteorological Fire Weather Index (FWI) has been applied as a reliable indicator for the fire risk in the region. A number of FWI system components (Fire Weather Index, Drought Code, Initial Spread Index, and Fire Severity Rating) were estimated and analyzed in the current study for the Mediterranean area of France [44].
The evolution of critical meteorological parameters was calculated for 2006–2015 (present day climatology) and 2036–2045 periods with two climate scenarios: RCP4.5 and RCP8.5. Daily data-sets for the extended fire seasons (1 May–31 October) were created with an 8 × 8 km2 spatial analysis. Figure 7 presents the annual averaged number of days with a FWI greater than 50. This number was considered to represent very high risk for large fires, and was derived after personal communication with the related stakeholders.
A data set was provided on the concerned PACA area and was employed to perform an analysis of extreme values and return periods and probability of exceedance. The main objective of such a process is to analyze the evolution of fire season duration, to assess the heat wave period evolution and to study the probabilities of having extreme values during 2036–2045.

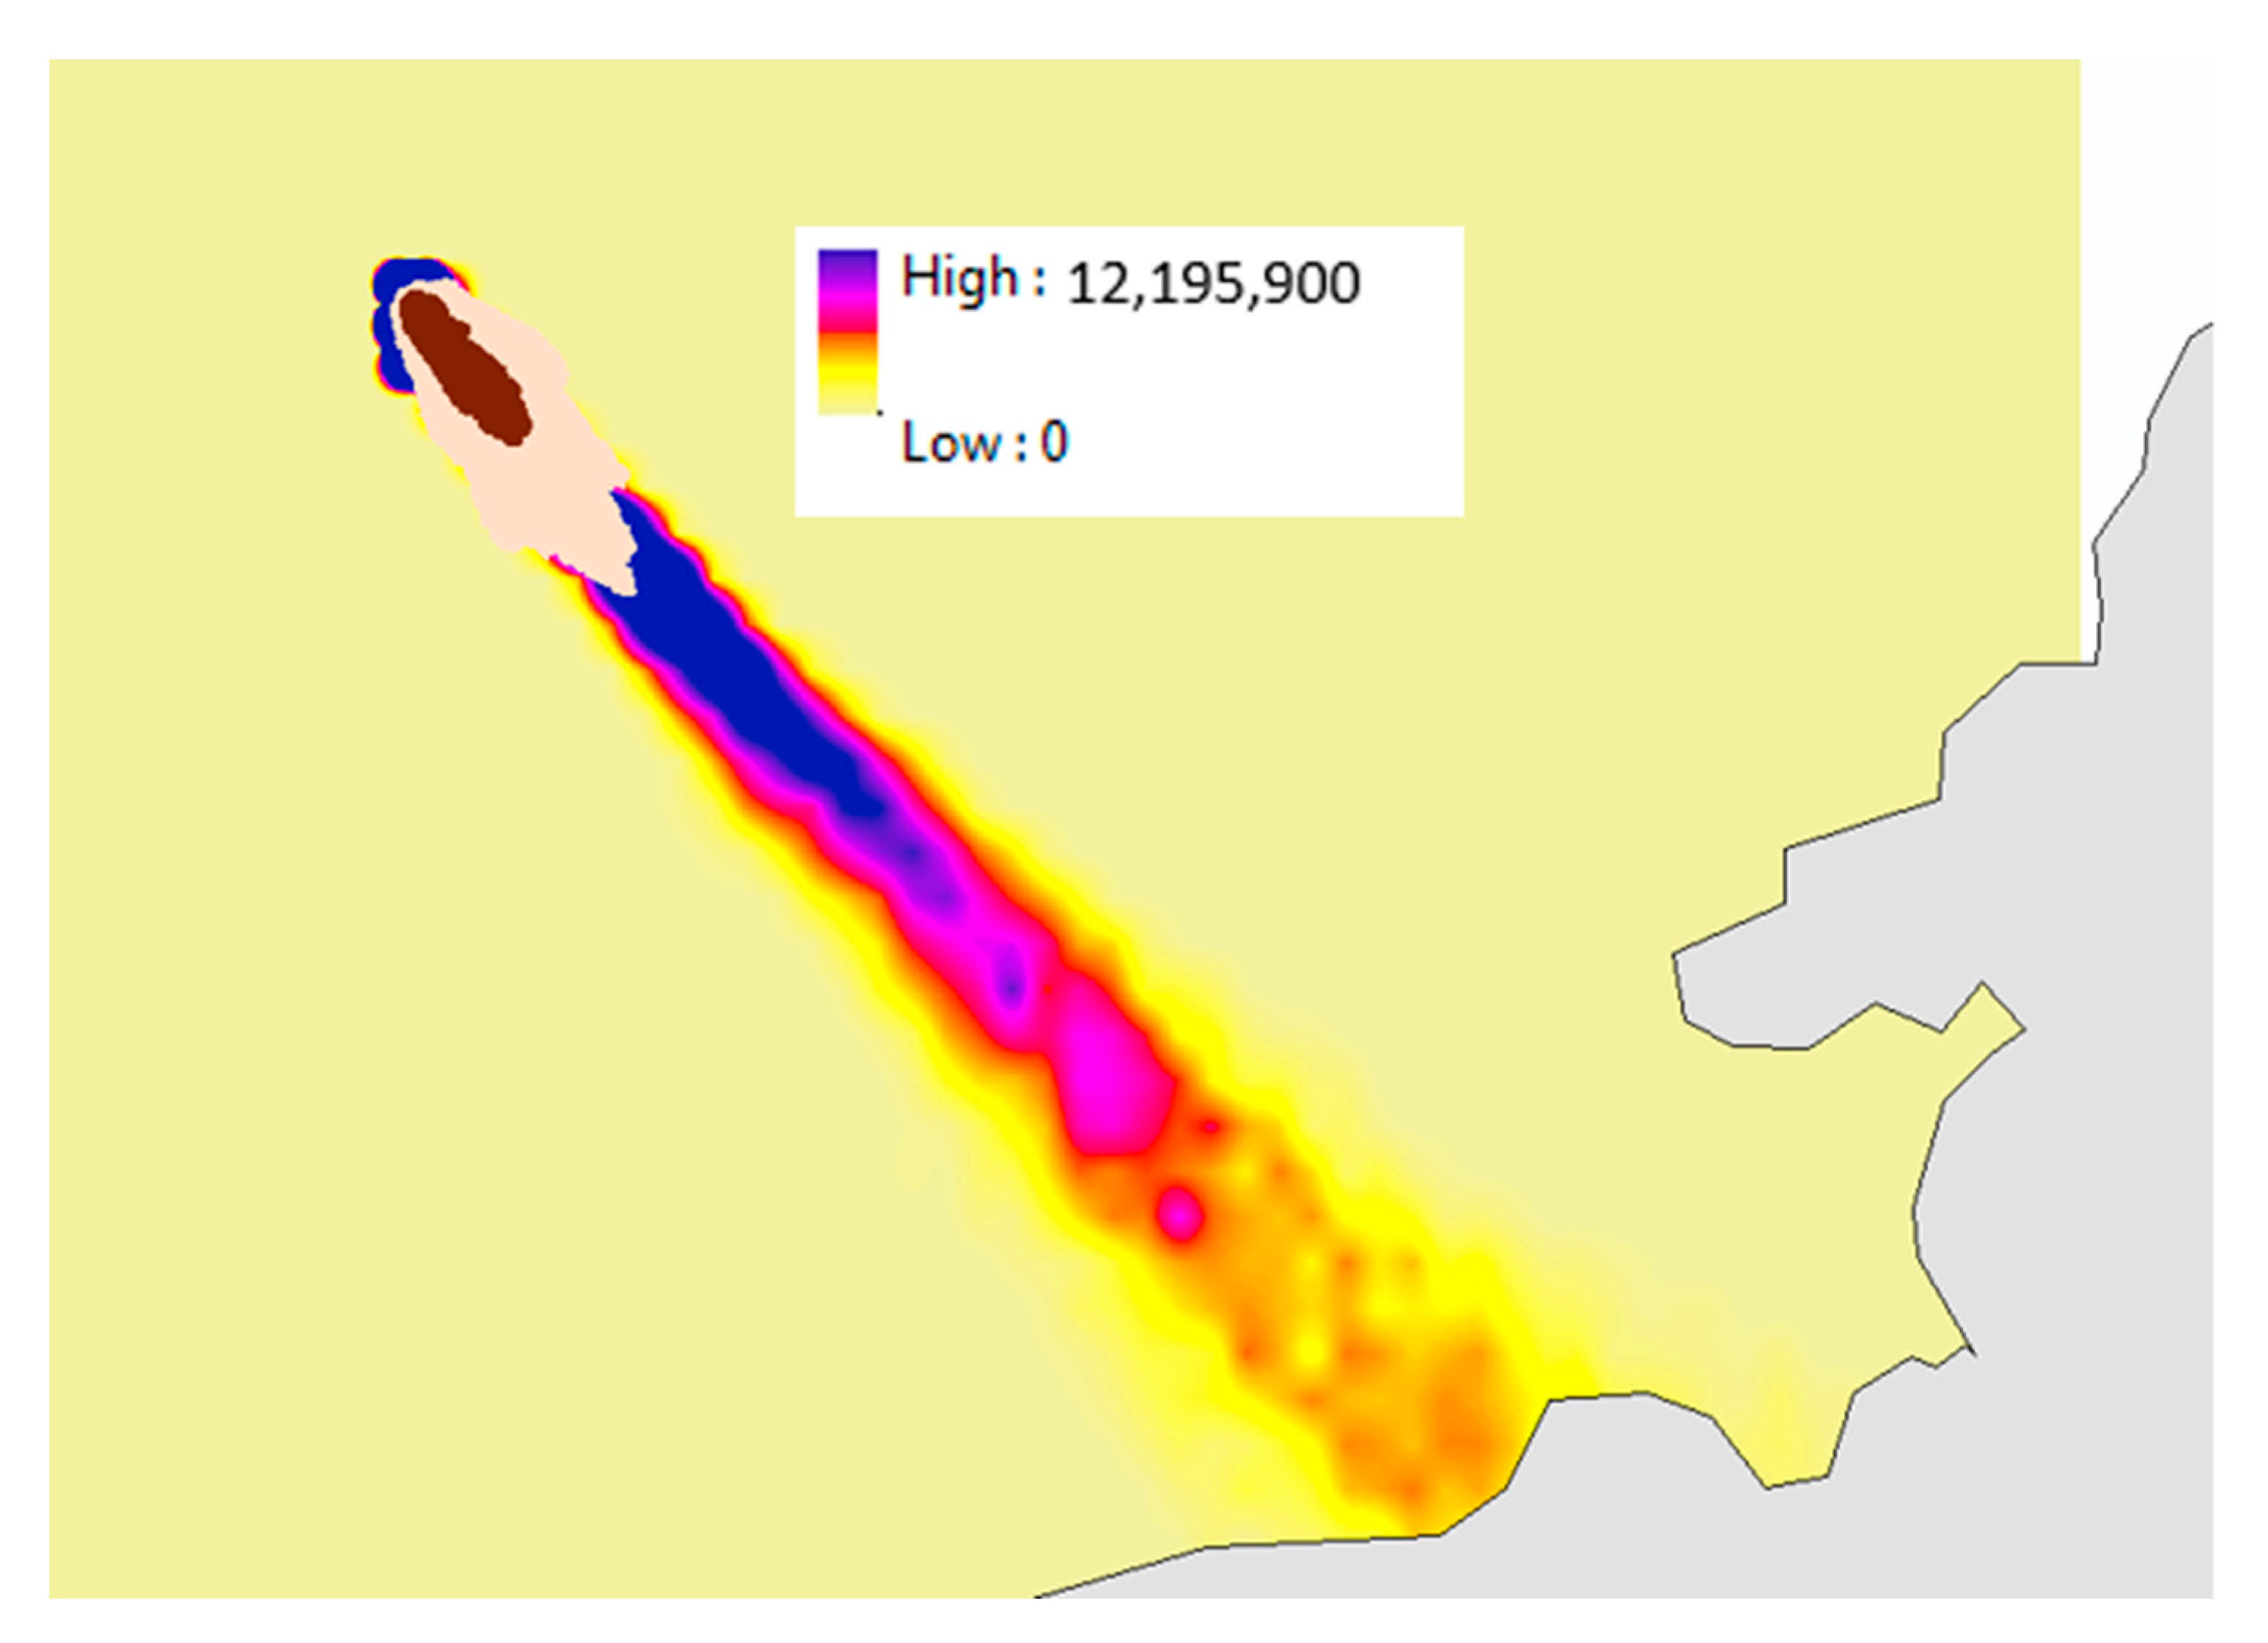
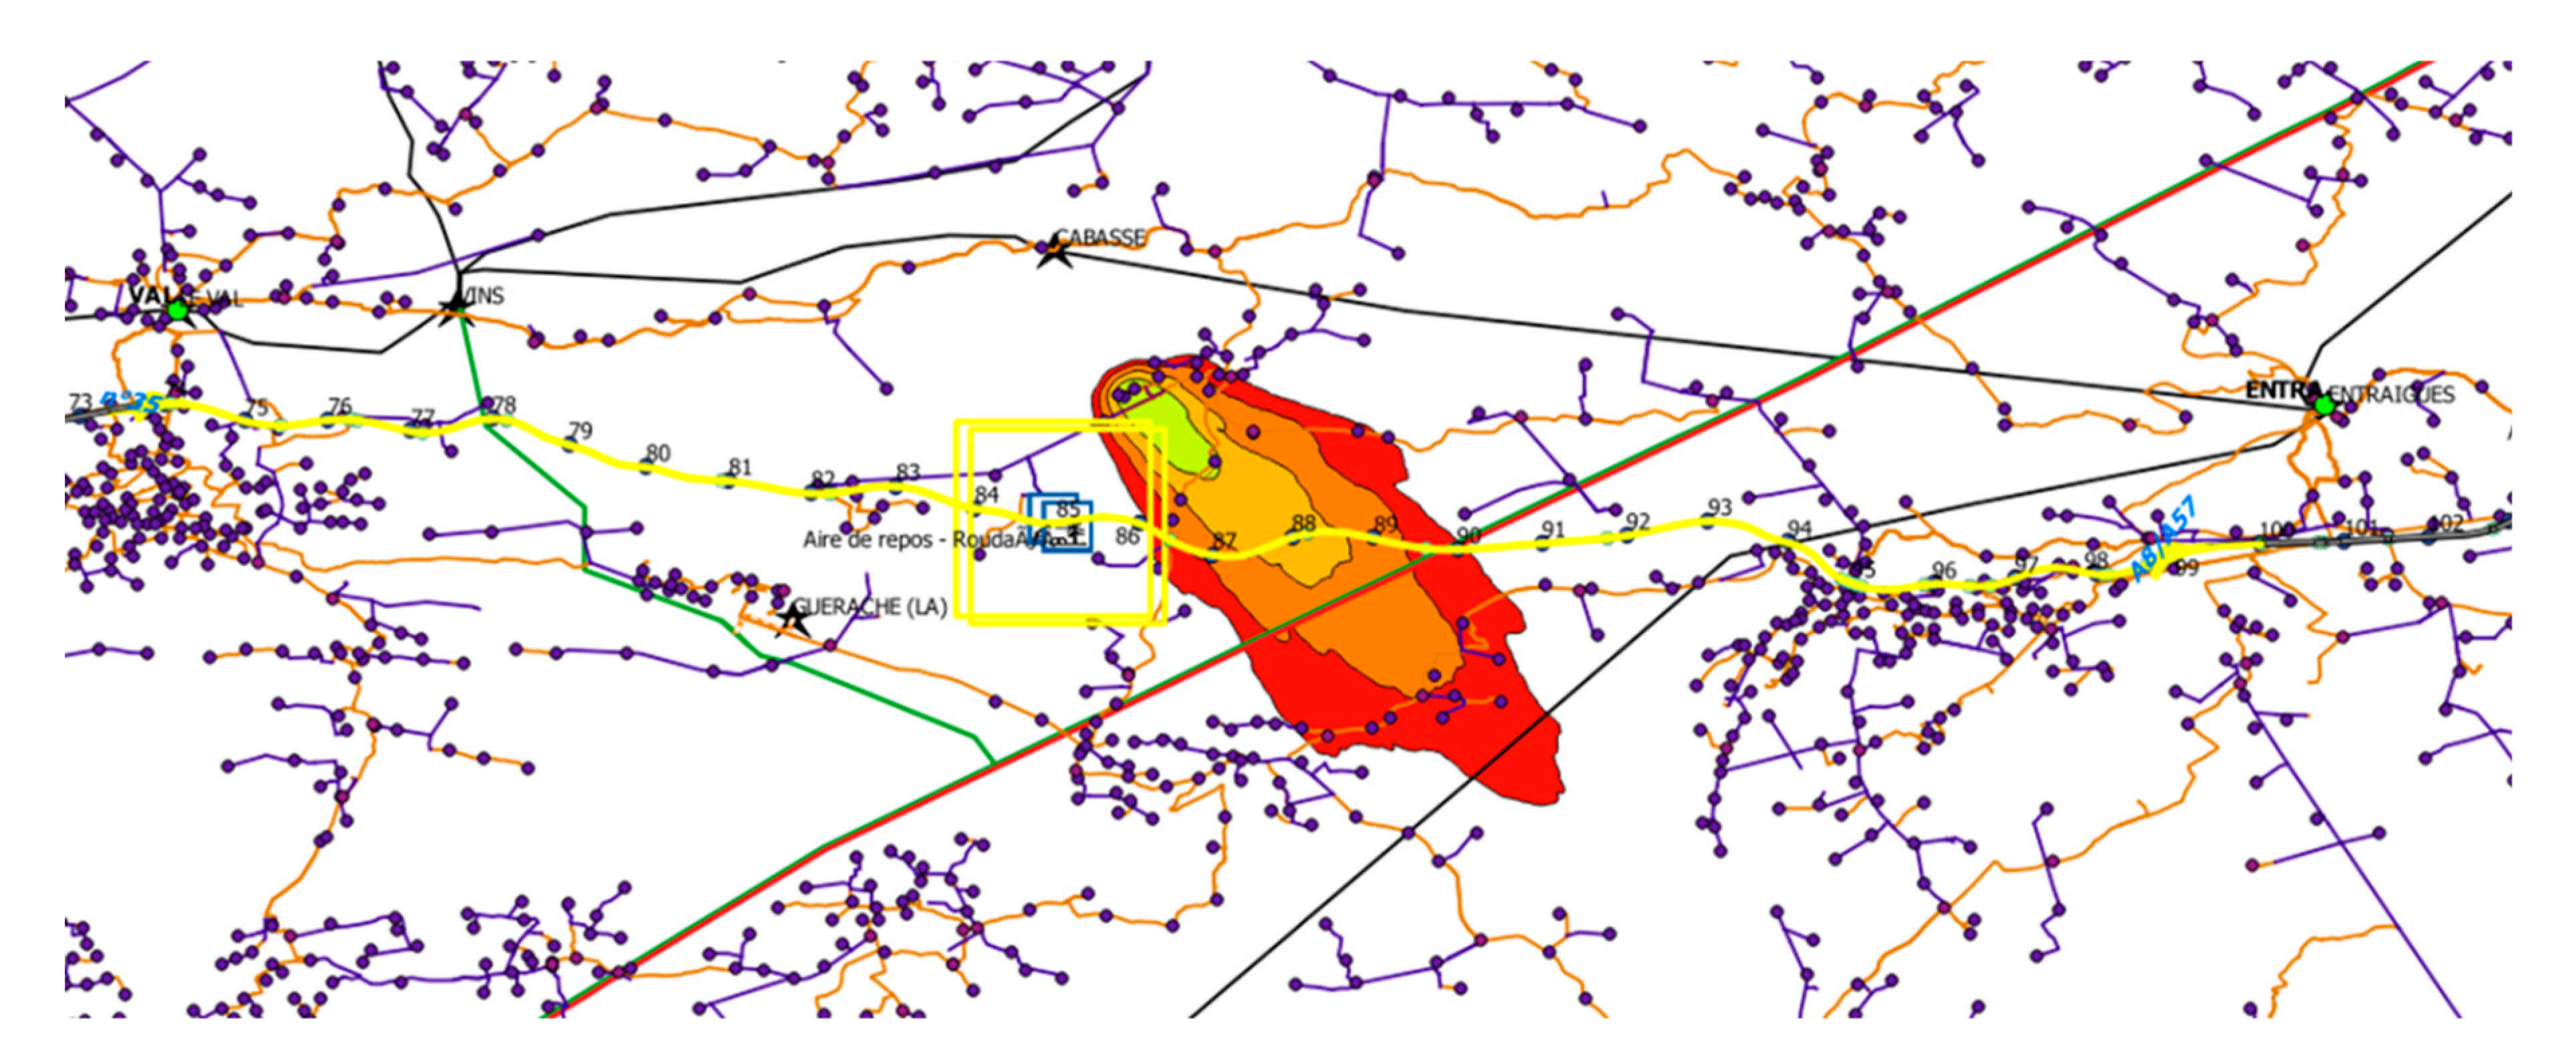
4.2. Modeling the Fire Spreading under Future Climate

In order to assess the specific scenario described in more details in Section 4.1, a sequential deployment of three different tools was applied: A fire simulation model (FIRETACTIC), followed by a biogenic fire emission processing tool (FEPS) and a dispersion model (HYSPLIT) to provide an estimate of the smoke plume.
FireTactic [45] is a forest fire simulation software developed by Intergraph Public Safety (France) to support Firefighters to optimize their battle tactics and actions against forest fires through a quick, simple, and effective modelling tool. The operator of the software has fast information on how the fire will spread over the following hours.
In this work, FireTactic, was used to simulate fire contour evolution on a given scenario. For the scenario, the fire duration was of 4 h. Figure 8 presents the final spreading of the fire overlayed on top the FWI values. The generated fire rate of spread (ROS) and the fireline intensity (FLIN) allowed the damages evaluation on the assets networks though the damage function process introduced in Section 5.
The FireTactic output then fed the Fire Emission Production Simulator (FEPS), a USDA Forest Service Pacific Wildland Fire Sciences Lab product [46], designed to manage data concerning consumption, emissions and heat release characteristics of prescribed burns and wildland fires. This produced hourly estimates of PM2.5 including burned areas, plume rise from the resulting fire radiative power. The hourly emissions were fed into the Hybrid Single Particle Lagrangian Integrated Trajectory Model (HYSPLIT) computer model [47,48] that is used to derive the concentration of smoke for the area of interest for a period of 12 hours from the fire-starting time. Figure 9 displays a snapshot of the produced smoke concentration (in μgr/m3), which was used to drive the impact models.

5. Impact Assessment

For the specific extreme event scenario, in addition to CI assets and networks being affected directly, CI assets and networks outside of the impacted hazard area can also be affected indirectly, e.g., as a result of: (a) electricity sub-station fails and causes properties served by the sub-station, both inside and outside of the impacted area to lose power; and (b) high voltage transmission lines are stopped so not enough power is available to serve the distribution network needs. Figure 10 presents an overview of the cascading impacts on the examined scenario.

5.1. Impacts on the Electricity Sector

Wildfires have important consequences for the power sector. They can directly damage transmission poles and other electricity infrastructure. However, the greatest risk comes from smoke and particulate matter. Smoke and ash from fires can ionize the air, creating an electrical path away from transmission lines [49]. Higher air temperatures have led to drier forests and earlier snowmelts, both of which contribute to wildfire risk [50]. Droughts and higher air temperatures also help make wildfires more intense and longer-lasting.
Moreover, wildfires pose a direct risk to infrastructure mainly because of the sudden need of a bulk volume of water for firefighting and when the assets are close to the fire or the firefighting activities [51]. Table 1 provides a summary of the main impacts on the electricity and road networks alongside some design thresholds.
Concerning the “wooden poles of the distribution network” the induced damages were linked to ROS and FLI according to the following rules:
  • If ROS > 800 m/h or FLI > 1700 kW/m and burned area > 50 ha, then wood electric poles start to burn and the ones in metal start to be damaged If ROS > 1800 m/h or FLI > 70,000 kW/m and burned area > 500 ha, then wood electric poles are all burned and the ones in metal are all damaged.
The “number of clients not served by electricity” was determined by the number of clients connected to each electricity station and the state of each electricity station. Electric substations cut from electricity supply analysis. This analysis takes power lines, electricity stations and fire contour datasets, and through topological information and matching, an assessment is made if there is damage or not. One of the main rules followed includes that an electricity station is connected to the electricity network by an upstream power line that is affected by a fire incident. If this is the case, the capacity of this power station is reduced by the amount of upstream not functional lines divided by the sum of all powerlines connecting this substation from upstream. In addition, the “Estimated Number and Replacement Cost of wooden pylons” is determined from the calculation of the replacement costs of wooden pylons that have been burned during a fire incident. The number of intersecting fire contours with wooden pylons and damage is presumed under the set of rules above, then is assumed that the pylons need complete replacement. All other pylons do not have associated replacement costs.
The “Transmission Tower Fire Physical Damage” is determined by the physical damaged due to fire based on the following steps: get fireline intensity per computational step, estimate temperature, find strength of structure, select exposure, determine fire duration, and finally find damage value from fragility curve.
Figure 11 presents on overview of the impact on the electricity network due to the determined fire. The High Voltage aerial line is cut because of fire and smoke and the impacts are propagated because of the load shedding strategy. The downstream substations only supply 80% of their capacity, leading to severe disruptions in consumers virtually hundreds of km away from the forest fire location.

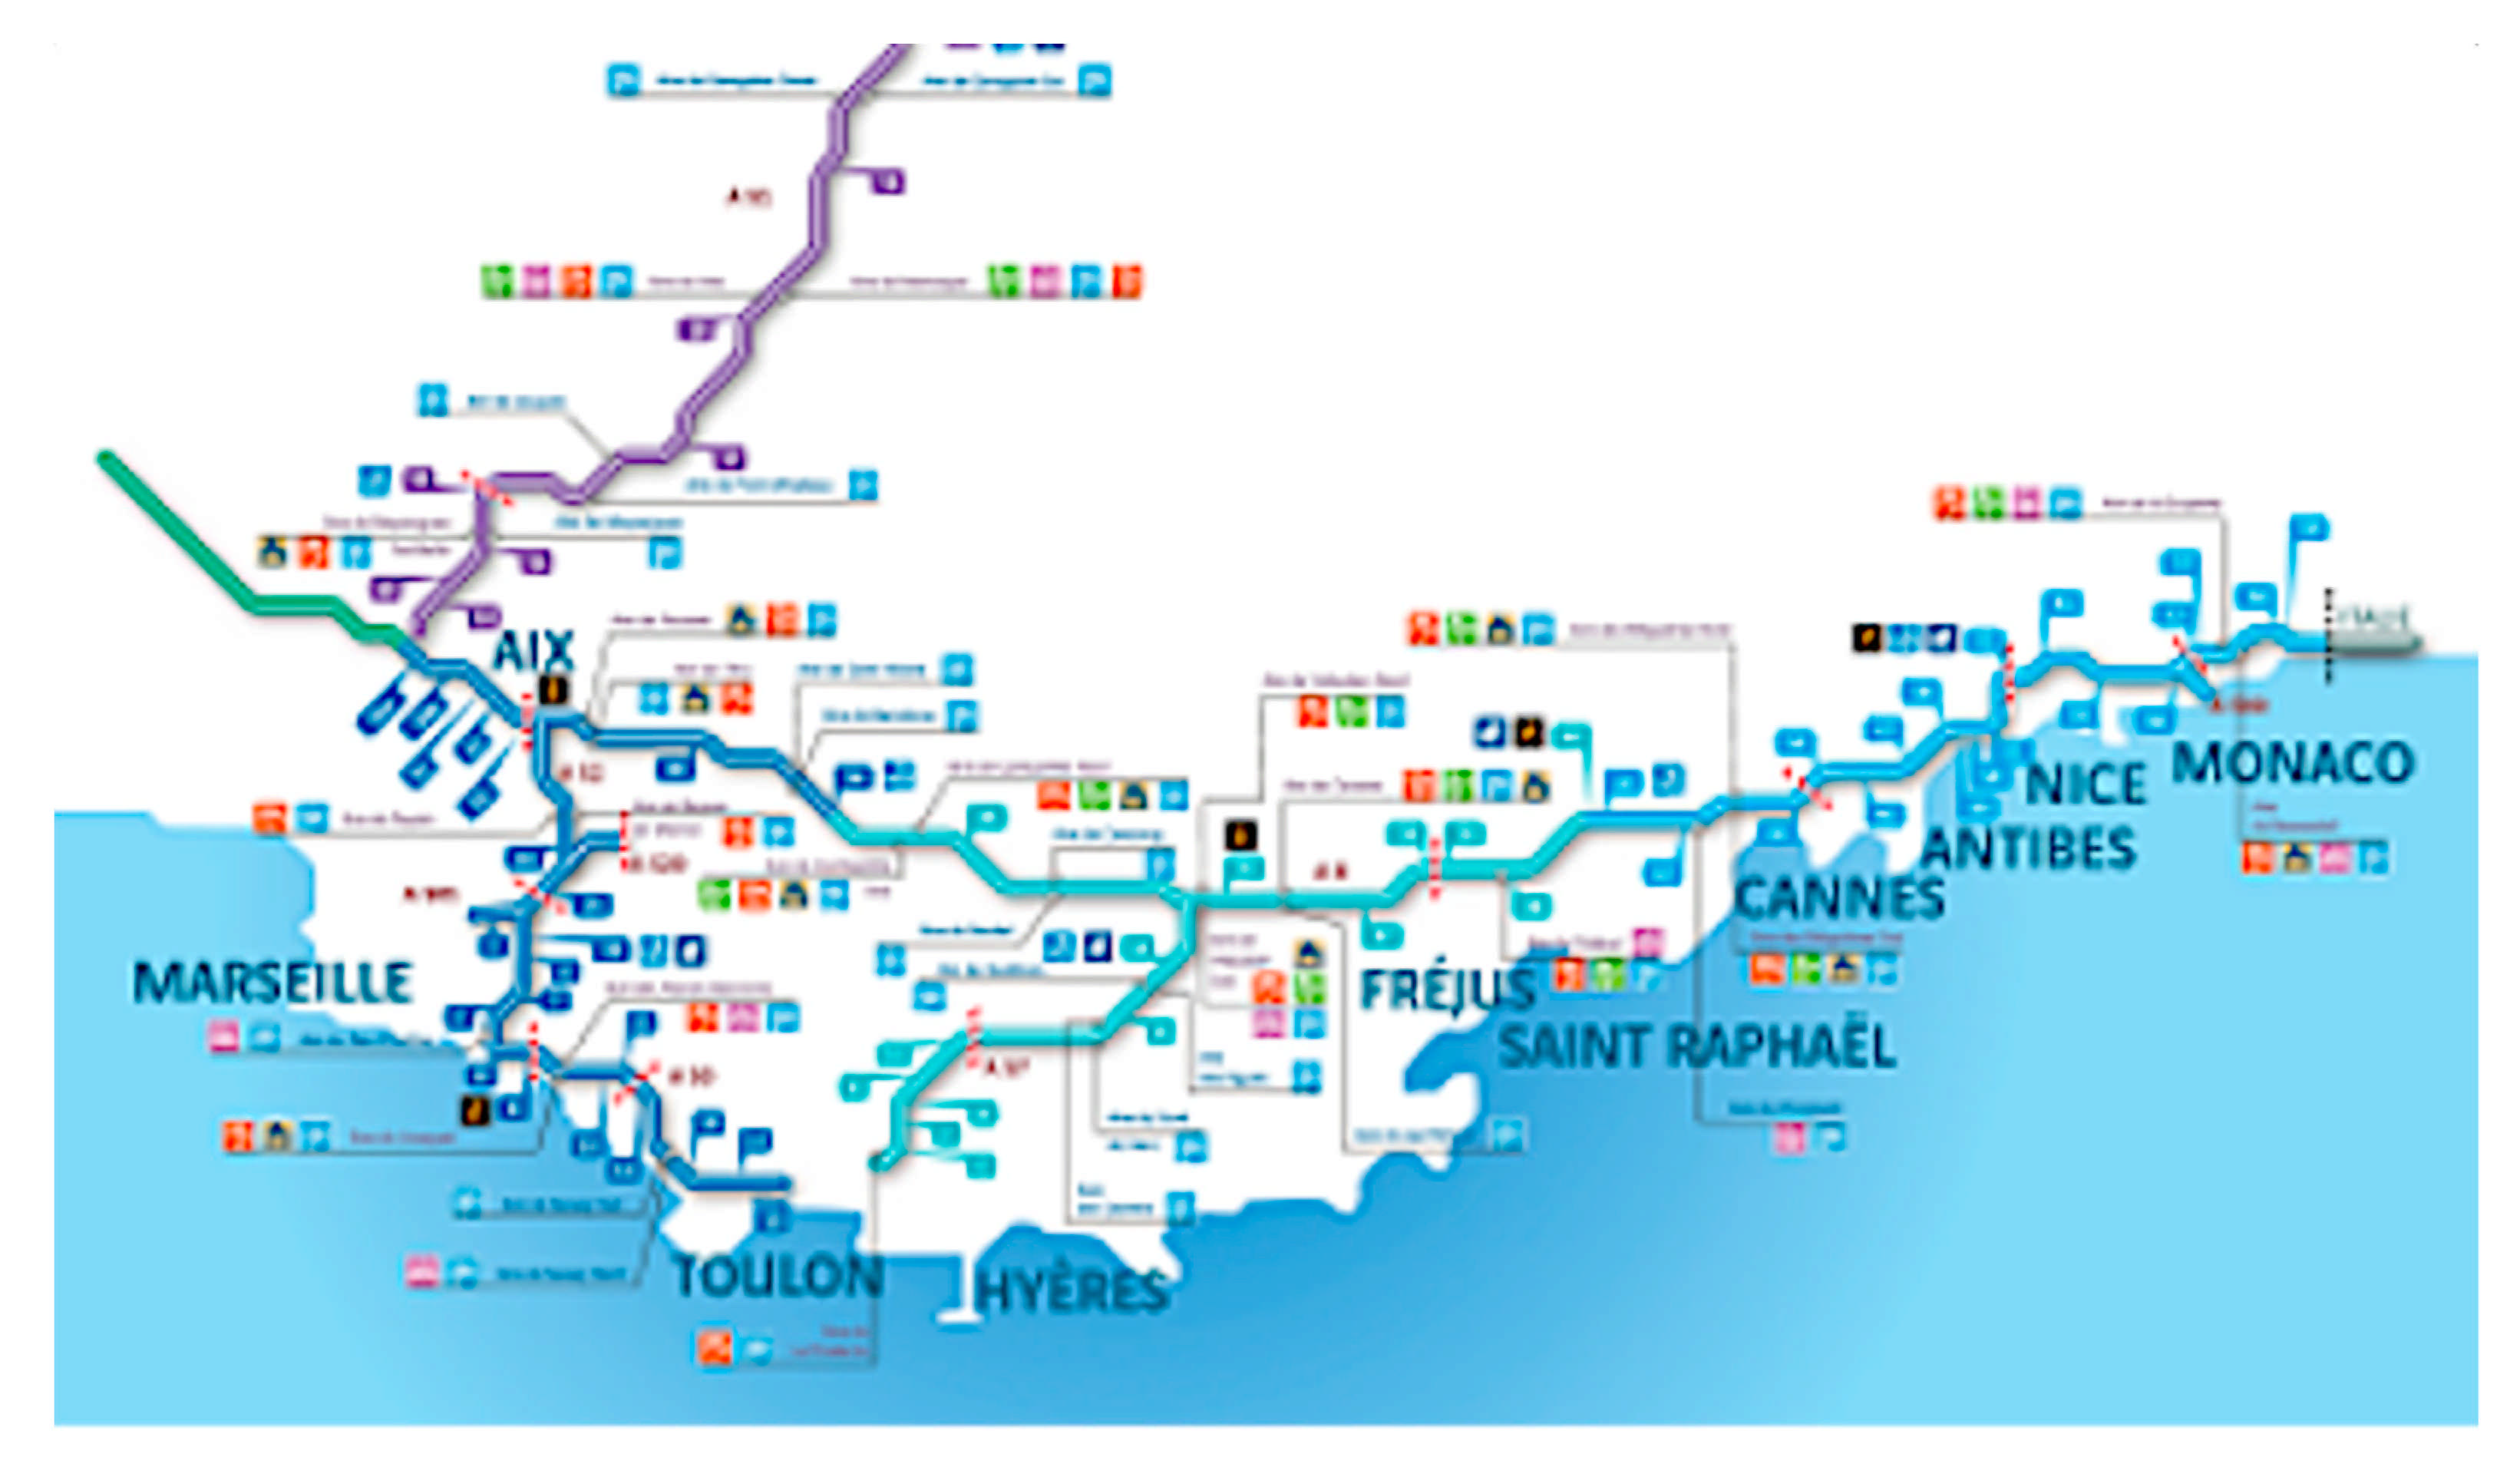
5.2. Impacts on the Road Network

If a transportation CI asset is affected by fire, its operation usually stops (e.g., road closure), whereas assets affected by smoke are occasionally not disturbed or their functionality can be maintained until a certain smoke density is reached (e.g., reduced speed on roads due to bad sight until transport stands still) [57]. The transport velocity is attenuated until the transport flow stops. This procedure can take different amounts of time. Rapid impassability, e.g., due to fire in close proximity can leave road users on the network without being able to exit the road or to divert to alternative routes. Before reaching the point of inaccessibility, roads can be closed in advance by the operators.
An additional potential damage function can be related to the road visibility as determined by the PM10 concentration levels from smoke, as shown in Table 2.
As a consequence, the operation is ceased, resulting in cascading effects on the rest of the network. Road assets are vulnerable to operational damages concerning economic losses. In many countries the network users are forced to pay toll fees for the use of highways. When a highway is disrupted by a natural disaster and the tollbooths cannot continue their operations, the revenues from tolls decrease. If a road is disrupted it will most likely be closed due to impassability. The occurring losses are defined as additional costs. The additional costs are computed by:
Number of delayed vehicles × additional costs per vehicle-km × disruption duration (1).
Following the ascertainment of closed roads and the closure durations, information on the transport volumes on each road in the network is required. On that account, if available, origin-destination transport matrices are used to model transport diversification on alternative routes. Otherwise, these matrices are derived based on the transport flows along single roads. Further, the alternative routes need to be identified. Conclusively, the travel costs for the unaffected network and the disrupted network are ascertained and compared. The travel costs could be linked to a function of travel speed. The “Highway Operator Loss of Revenue as cascading effect of electricity blackout” is based on the analysis of the loss of revenue (unpaid tolls) for highway operator due to highway shutdown as a result of electrical substation equipment damage. For this purpose, unpaid tolls due to damaged highway as a result of an electrical substation equipment damage are computed. The number of vehicles that use highway segment per day retrieved from related dataset. The duration of highway shutdown, loss of revenue per vehicle per hour was considered once there is clearance to use the road by related authorities and transportation operator. The analysis calculates the losses due to highway not working time by multiplying the number of vehicles by highway shutdown time and costs of revenue per vehicle. The “Highway Operator Loss of Revenue” is based on the assessment of losses of revenue (unpaid tolls) for highway operator due to highway shutdown as a result of fire incident. For this purpose, unpaid tolls due to damaged highway are computed. The number of vehicles that use highway segment per day are used considering the duration of the incident. The analysis calculates the losses due to highway not working time by multiplying the number of vehicles by highway shutdown time and losses of revenue due to fire incident.
Concerning the impacts to the transportation network, Figure 12 presents the propagation of the impacts on the highway, where a part of the network was stopped before. Furthermore, based on the projected toll/security/rest … facilities are down, impact to be calculated on the traffic flow and on the income generation by the operator.

6. Discussion and Conclusions

The work introduces a systematic effort conducted within the framework of the EU-CIRCLE project for the co-creation of a climate change risk assessment methodology for interconnected CI, with the active participation of the scientific community and CI operators. This mix is highly critical for the success of the process because there is unique knowledge about the assets design and its scope of operations which is often not public domain. Additionally, there are many intra-organizational issues that need to be resolved as climate impacts spread in many different interlocutors for each CI operator (different departments with different responsibilities). Furthermore, the community is just releasing that climate change aspects will not only be related to physical damages but will also cover the business continuity element and most critical, the crisis management and response process. Thus far, and as it was discovered during the extensive meetings with the stakeholders, there is almost non-existent integration intra- and cross- organization with respect to the climate change context and its multi-dimensional induced risk. However, all participants demonstrated very high interest in the topic, as documented with the request for the organization of a real crisis exercise with all the involved organizations and authorities based on the developed scenario.
Concerning the establishment of climate change risk assessment methodology, there is considerable difficulty to work with analytical damage functions, as CI operators are not accustomed to such approach. The same holds for climate analysis where numerous different possibilities were identified such as extreme value analysis, e.g., return period and scenario selection. The Fire Index analysis is relevant to evaluate how fire risk and heat wave will evolve in the next decades. Nevertheless, this part of the tool will not be used by the critical operators to evaluate climate change in their future prevention plans, as it is not their mission. CI operators and emergency responders need to be familiarized at least with some basic climate services products and our work was critical in raising awareness about climate change and possible impact of forest fires on the interconnected infrastructure networks. There was considerable discussion on the organizational element of crisis management for this scenario as it is a critical element for efficient and effective response.
One of the key findings of the different workshops and exercises is that the coordination between different agencies and CI operators is critical in reducing the impacts of present and future events. As at present there is no sharing of common tools, such as GIS based tools, to work on predefined crisis scenarios and climate risk analysis and risk-informed decisions on adaption measures.
The crisis exercise determined that time is a key factor in responding to present and also future crises. As it anticipated that forest fires under climate change will result in much faster fire spreading (Figure 13) throughout the region, suitable arrangements should be made for much faster deployment of forces, increased capacity of early warning systems and more efficient exchange of information between involved stakeholders.
An extensive assessment of the processes and tools deployed during the different exercises demonstrated that forest fires under climate change will be a major source for risk for infrastructures in South France. Especially exercises focusing on prevention planning could also be linked to decisions about future investments ensuring the risk reduction in interconnected infrastructure. In addition, climate analysis could be used by territorial managers or private companies involved in the elaboration of the prevention plans such as PPRIF (Forest Fire Risk Prevention Plan).
Overall, the proposed approach achieved its objectives as follows:
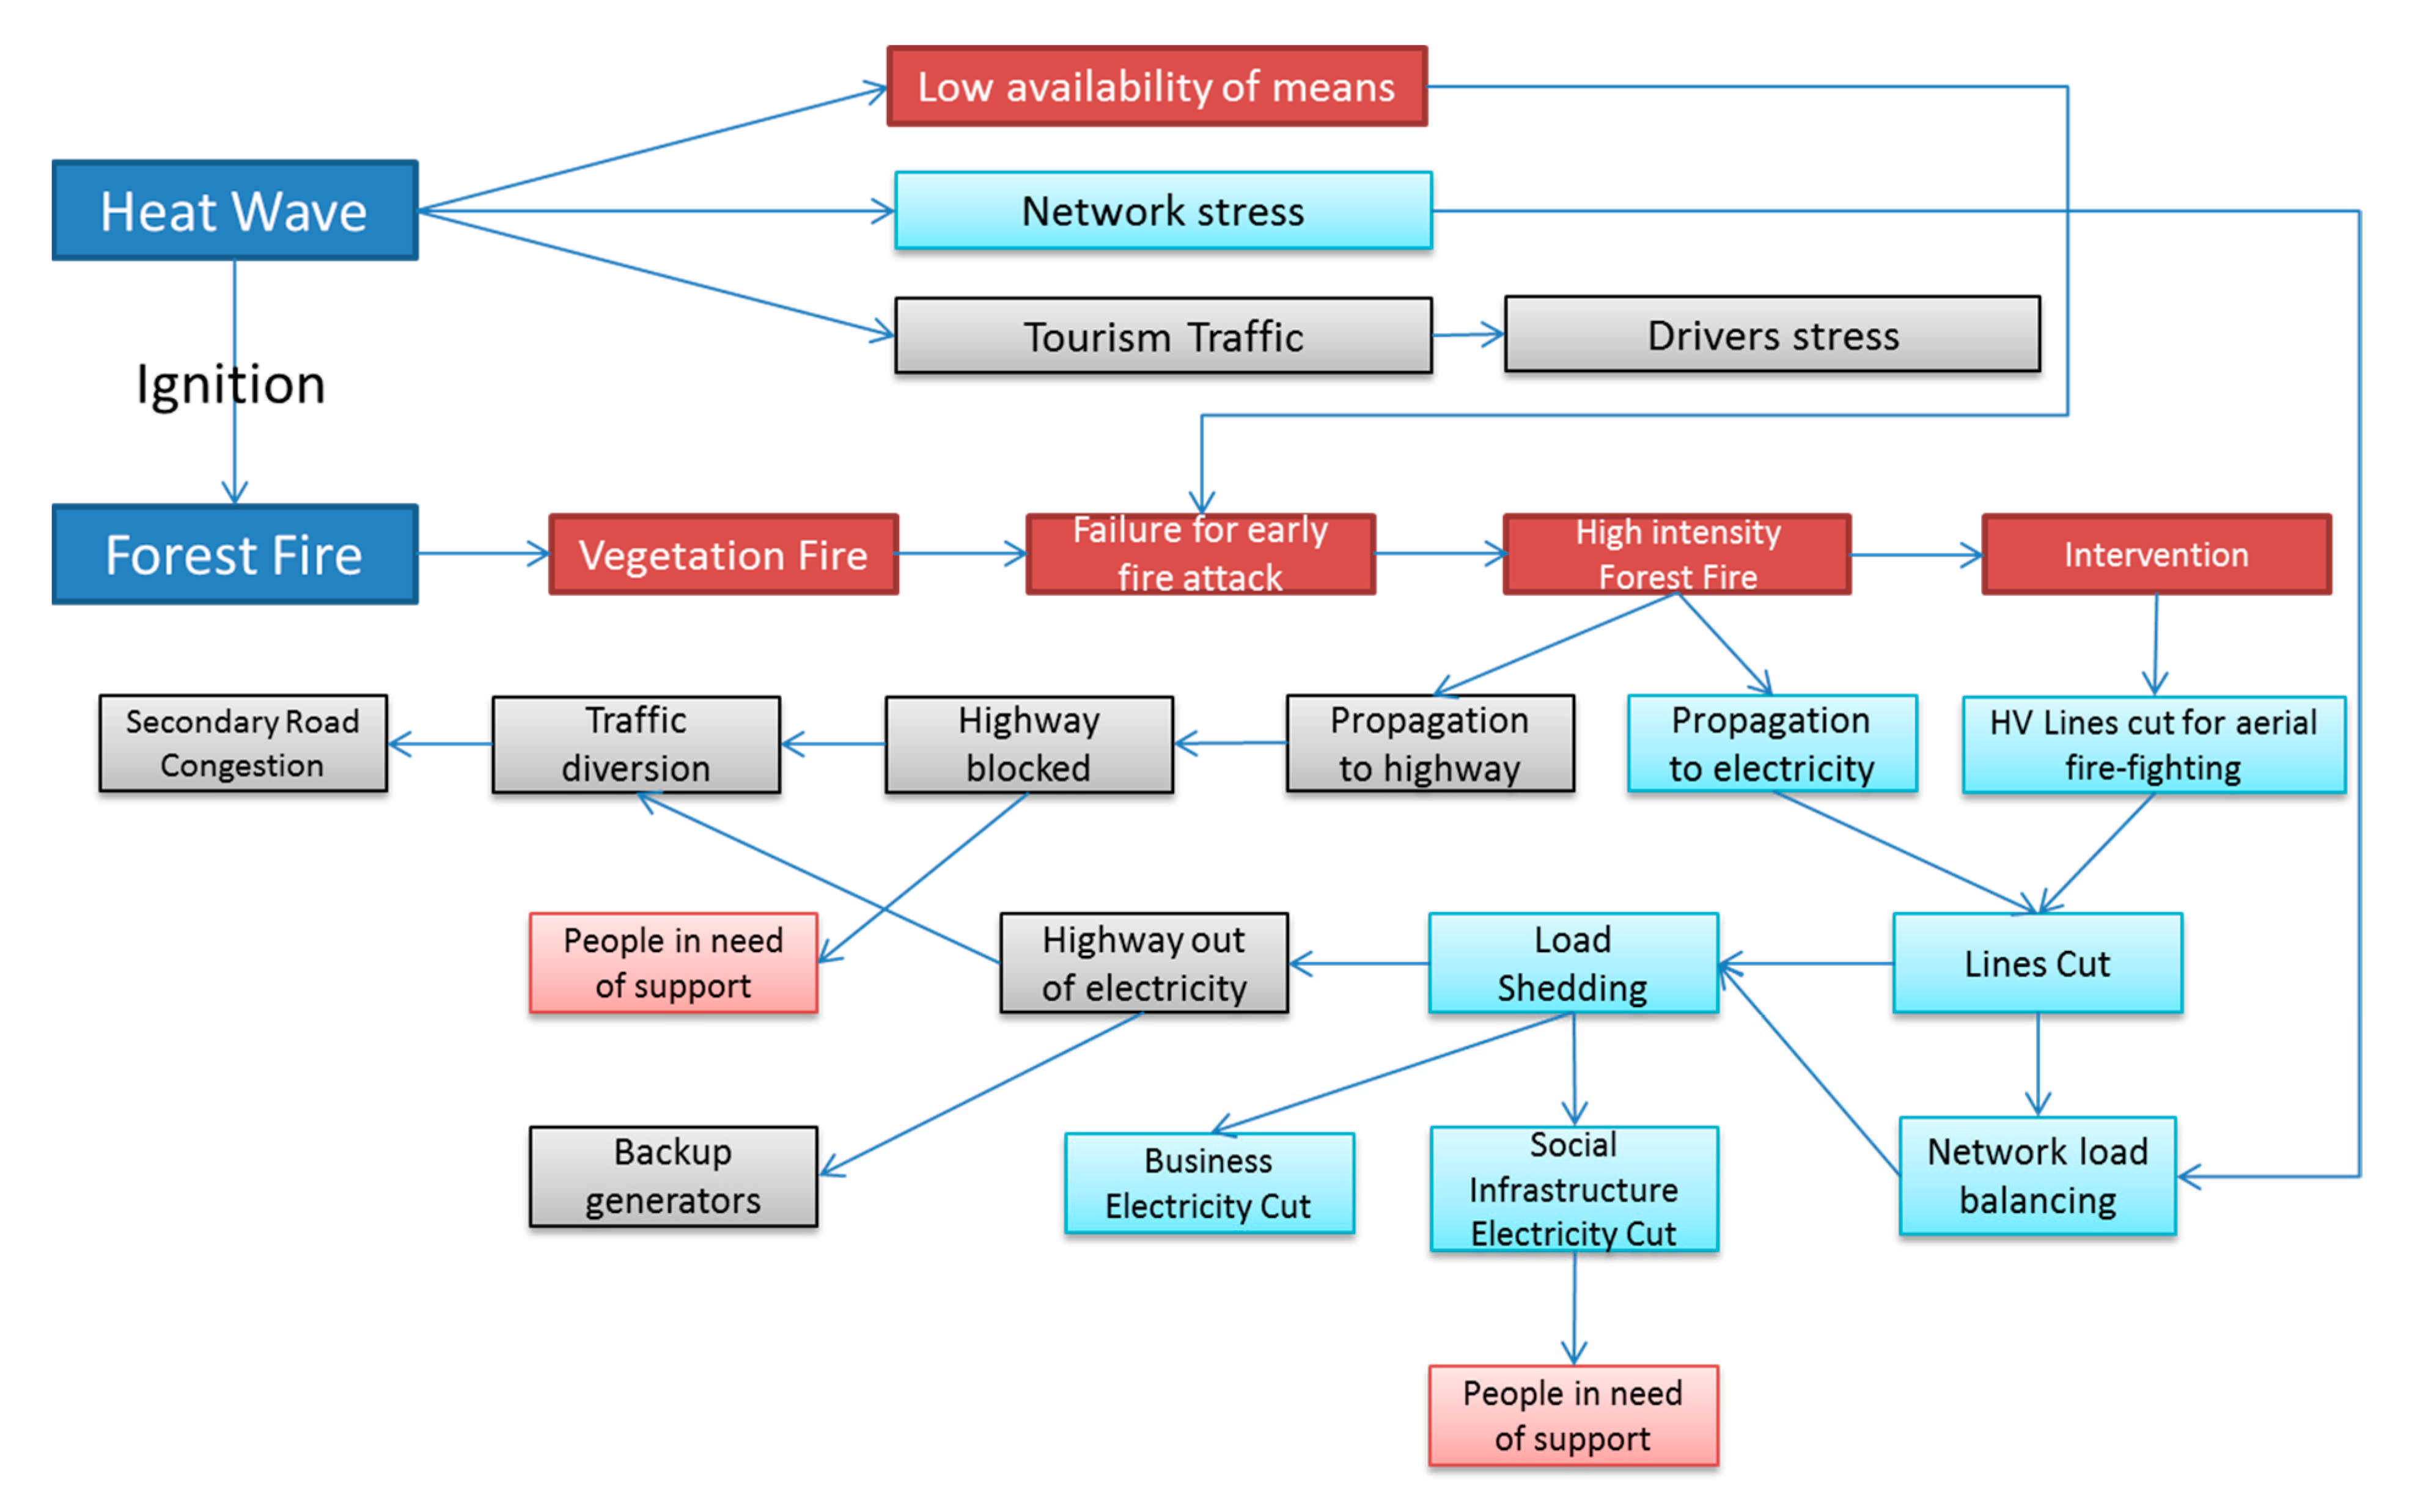
  • To raise awareness on vulnerabilities and interdependencies between networks from different types of CI operators, first responders and regional emergency management authorities. Although there is interaction between electricity infrastructure operators, this process helped identify bi-direction interconnections between electricity and transportation CI. This allowed all involved groups to identify impacts beyond their domain thus allowing for a holistic impact and cascade effects in a large region.
  • To analyze the impacts of network failures and develop the corresponding countermeasures, also considering the changing characteristics of forest fires extremes under climate change. This collective effort was highly important to raise awareness of climate change impacts, as the majority of the engaged infrastructures operators did not consider it as a high priority threat. Further, extreme scenarios, as those projected by climate change, are not considered in their operational planning, thus demonstrating a pressing need to start thinking with a broader perspective.
  • To shift towards an integrative approach for advancing resilience across inherently interdependent critical infrastructure systems. The EU-CIRCLE framework demonstrated the need for managing organizational and governance issues on a regional scale, that will inform future CI design and emergency response. Operational imperatives should be considered when planning actions towards risk mitigation and cascading failures considering fast recovery of CI operations in case of climate extreme events.
  • To allow the associated stakeholders to test common generated knowledge with their respective internal tools, and in particular stress situations. This process also contributed to the thorough examination of crisis management tools and flow of information between different involved CI and national authorities.

7. Conclusions

This work introduced a methodological framework for assessing climate risks on forest fires for interconnected infrastructures, with emphasis on electricity and transportation network. The work was demonstrated in a real case study in South France with the active participation of the scientific community, CI operators and emergency responders. Although climate change is not considered a high priority within different CI operators, there is increasing awareness on the perceived impacts due to extreme scenarios and that should lead to increased coordination between stakeholders.

Author Contributions

Conceptualization and writing—review and editing A.S.; conceptualization, methodology, data collection F.G., A.C., C.F. and J.L.; formal analysis—V.V.; data collection—D.V., N.P. and S.K.; methodology, validation I.G. and G.E.; methodology R.H. and S.H. All authors have read and agreed to the published version of the manuscript.

Funding

The current study has been performed within EU-CIRCLE project that has received funding from the European Union’s Horizon 2020 research and innovation programme under Grant agreement No 653824.

Institutional Review Board Statement

Not applicable.

Informed Consent Statement

Not applicable.

Data Availability Statement

Supporting Report can be found at www.eu-circle.eu.

Acknowledgments

The authors acknowledge support from local infrastructure operators for providing data and valuable discussions for fine tune of this case study.

Conflicts of Interest

The authors declare no conflict of interest.

References

  1. Seto, K.; Dhakal, S.; Bigio, A.; Blanco, H.; Delgado, G.C.; Dewar, D.; Huang, L.; Inaba, A.; Kansal, A.; Lwasa, S.; et al. Human Settlements, Infrastructure and Spatial Planning. In Climate Change 2014: Mitigation of Climate Change. Contribution of Working Group III to the Fifth Assessment Report of the Intergovernmental Panel on Climate Change; IPCC: Geneva, Switzerland, 2014. [Google Scholar]
  2. De Rose, A.; Anagnostopoulos, F.; Tricot, A.; Sandhu, N.; Laureysens, I.; Vertriest, L.; Lammerant, J.; Adraenssens, V. Climate Change Adaptation of Major Infrastructure Projects; European Commission: Brussels, Belgium, 2018. [Google Scholar]
  3. Forzieri, G.; Bianchi, A.; Silva, F.B.; Herrera, M.A.M.; Leblois, A.; Lavalle, C.; Aerts, J.C.J.H.; Feyen, L. Escalating impacts of climate extremes on critical infrastructures in Europe. Glob. Environ. Chang. 2018, 48, 97–107. [Google Scholar] [CrossRef] [PubMed]
  4. Tollefson, J. California wildfires and power outages cause disruptions for scientists. Nature 2019, 575, 16. [Google Scholar] [CrossRef] [Green Version]
  5. Hay, C.; Chhabra, M. The impact of wildfires and beneficial electrification on electricity rates in PG&E’s service territory. Electr. J. 2020, 33, 106710. [Google Scholar]
  6. Burillo, D.; Chester, M.V.; Pincetl, S.; Fournier, E. Electricity infrastructure vulnerabilities due to long-term growth and extreme heat from climate change in Los Angeles County. Energy Policy 2019, 128, 943–953. [Google Scholar] [CrossRef]
  7. Carlini, E.M.; Michi, L.; Minto, L.; Chiereghin, F.; Genovese, C.; Foppa, R.; Fedrizzi, A. Forest fire or other dangerous situations: Safety procedure for overhead lines. In Proceedings of the 2019 AEIT International Annual Conference (AEIT), Firenze, Italy, 18–20 September 2019; pp. 1–6. [Google Scholar] [CrossRef]
  8. Fraser, A.M.; Chester, M.V.; Underwood, B.S. Wildfire risk, post-fire debris flows, and transportation infrastructure vulnerability. Sustain. Resilient Infrastruct. 2020, 1–13. [Google Scholar] [CrossRef]
  9. Moftakhari, H.; AghaKouchak, A. Increasing exposure of energy infrastructure to compound hazards: Cascading wildfires and extreme rainfall. Environ. Res. Lett. 2019, 14, 104018. [Google Scholar] [CrossRef]
  10. Yoon, S.; Mukherjee, S.; Hastak, M. A Framework to Assess Natural Hazard-Induced Service Inoperability in the Electricity Sector; Canadian Society for Civil Engineering: Montreal, QC, Canada, 2019; Volume 2019. [Google Scholar]
  11. Pourghasemi, H.R.; Gayen, A.; Edalat, M.; Zarafshar, M.; Tiefenbacher, J.P. Is multi-hazard mapping effective in assessing natural hazards and integrated watershed management? Geosci. Front. 2019, 11, 1203–1217. [Google Scholar] [CrossRef]
  12. Hayes, S.; Desha, C.; Burke, M.; Gibbs, M.; Chester, M. Leveraging socio-ecological resilience theory to build climate resilience in transport infrastructure. Transp. Rev. 2019, 39, 677–699. [Google Scholar] [CrossRef]
  13. Novo, A.; González-Jorge, H.; Martínez-Sánchez, J.; Santos, L.M.G.; Lorenzo, H. Automatic detection of forest-road distances to improve clearing operations in road management. Int. Arch. Photogramm. Remote Sens. Spat. Inf. Sci. ISPRS Arch. 2019, 42, 1083–1088. [Google Scholar] [CrossRef] [Green Version]
  14. Church, R.L.; Murray, A. Disruption, Protection, and Resilience. In Advances in Spatial Science; Springer: Berlin/Heidelberg, Germany, 2018; pp. 203–227. [Google Scholar]
  15. Ronchi, E.; Gwynne, S.M.V.; Rein, G.; Intini, P.; Wadhwani, R. An open multi-physics framework for modelling wildland-urban interface fire evacuations. Saf. Sci. 2019, 118, 868–880. [Google Scholar] [CrossRef]
  16. Pastor, E.; Muñoz, J.A.; Caballero, D.; Àgueda, A.; Dalmau, F.; Planas, E. Wildland–Urban Interface Fires in Spain: Summary of the Policy Framework and Recommendations for Improvement. Fire Technol. 2019, 56, 1831–1851. [Google Scholar] [CrossRef]
  17. Oyang, M. Review on modeling and simulation of interdependent critical infrastructure systems. Reliab. Eng. Syst. Saf. 2014, 121, 43–60. [Google Scholar] [CrossRef]
  18. Rinaldi, S.M.; Peerenboom, J.P.; Kelly, T.K. Identifying, understanding, and analyzing critical infrastructure interdependencies. IEEE Control Syst. Mag. 2001, 21, 11–25. [Google Scholar]
  19. Perimann, R. Genetic algorithms for agent-based infrastructure interdependency modelling and analysis. In Proceedings of the 2007 Spring Simulation Multiconference, Norfolk, VA, USA, 25–29 March 2007; pp. 169–177. [Google Scholar]
  20. Haimes, Y.Y. Systems-based approach to preparedness for, response to, and recovery from natural and human-made disasters. Leadersh. Manag. Eng. 2012, 12, 288–298. [Google Scholar] [CrossRef]
  21. Crowther, K.G.; Dicdican, R.Y.; Leung, M.F.; Lian, C.; Williams, G.M. Assessing and Managing Risk of Terrorism to Virginia’s Interdependent Transportation Systems; Center for Risk Management of Engineering Systems: Charlottesville, VA, USA, 2004. [Google Scholar]
  22. Krishnamurthy, V.; Kwasinski, A. Characterization of power system outages caused by hurricanes through localized intensity indices. In Proceedings of the 2013 IEEE Power and Energy Society General Meeting, Vancouver, BC, Canada, 21–25 July 2013; pp. 1–5. [Google Scholar]
  23. Wang, Y.; Baldick, R. Research on resilience of power systems under natural disasters—A review. IEEE Trans. Power Syst. 2016, 31, 1604–1613. [Google Scholar] [CrossRef]
  24. Panteli, M.; Mancarella, P. Modeling and evaluating the resilience of critical electrical power infrastructure to extreme weather events. IEEE Syst. J. 2017, 11, 1733–1742. [Google Scholar] [CrossRef]
  25. Dueñas-Osorio, L.; Kwasinski, A. Quantification of lifeline system interdependencies after the 27 February 2010 Mw 8.8 offshore maule, Chile earthquake. Earthq. Spectra 2012, 28, S581–S603. [Google Scholar]
  26. Krishnamurthy, V.; Kwasinski, A.; Dueñas-Osorio, L. Comparison of power and telecommunications interdependencies between the 2011 Tohoku and 2010 Maule earthquakes. ASCE J. Infrastruct. Syst. 2016, 22, 04016013. [Google Scholar] [CrossRef]
  27. Nguyen, T.D.; Cai, X.; Ouyang, Y. Modelling infrastructure interdependencies, resiliency and sustainability. Int. J. Crit. Infrastruct. 2016, 12, 4–36. [Google Scholar] [CrossRef]
  28. Wu, B.; Tang, A.; Wu, J. Modeling cascading failures in interdependent infrastructures under terrorist attacks. Reliab. Eng. Syst. Saf. 2016, 147, 1–8. [Google Scholar] [CrossRef]
  29. Cimellaro, G.P.; Reinhorn, A.M.; Bruneau, M. Framework for analytical quantification of disaster resilience. Eng. Struct. 2010, 32, 3639–3649. [Google Scholar] [CrossRef]
  30. Hernandez-Fajardo, I.; Dueñas-Osorio, L. Probabilistic study of cascading failures in complex interdependent lifeline systems. Reliab. Eng. Syst. Saf. 2013, 111, 260–272. [Google Scholar] [CrossRef]
  31. Kwasinski, A. Local energy storage as a decoupling mechanism for interdependent infrastructures. In Proceedings of the 2011 IEEE International Systems Conference, Montreal, QC, Canada, 4–7 April 2011; pp. 435–441. [Google Scholar]
  32. Goldbeck, N.; Angeloudis, P.; Ochieng, W.Y. Resilience assessment for interdependent urban infrastructure systems using dynamic network flow models. Reliab. Eng. Syst. Saf. 2019, 188, 62–79. [Google Scholar] [CrossRef]
  33. Lomba-Fernández, C.; Hernantes, J.; Labaka, L. Guide for climate-resilient cities: An urban critical infrastructures approach. Sustainability 2019, 11, 4727. [Google Scholar] [CrossRef] [Green Version]
  34. Monstadt, J.; Schmidt, M. Urban resilience in the making? The governance of critical infrastructures in German cities. Urban Stud. 2019, 56, 2353–2371. [Google Scholar] [CrossRef] [Green Version]
  35. Romero-Lankao, P.; Bruns, A.; Wiegleb, V. From Risk to WEF Security in the City: The Influence of Interdependent Infrastructural Systems. Environ. Sci. Policy 2018, 90, 213–222. [Google Scholar] [CrossRef]
  36. Hummel, M.A.; Siwe, A.T.; Chow, A.; Stacey, M.T.; Madanat, S.M. Interacting infrastructure disruptions due to environmental events and long-term climate change. Earth Future 2020, 8, e2020EF001652. [Google Scholar] [CrossRef]
  37. Spearing, L.A.; Faust, K.M. Cascading System Impacts of the 2018 Camp Fire in California: The Interdependent Provision of Infrastructure Services to Displaced Populations. Int. J. Disaster Risk 2020, 50, 101822. [Google Scholar] [CrossRef]
  38. Ganteaume, A.; Barbero, R. Contrasting large fire activity in the French Mediterranean. Nat. Hazards Earth Syst. Sci. 2019, 19, 1055–1066. [Google Scholar] [CrossRef] [Green Version]
  39. Fargeon, H.; Pimont, F.; Martin-StPaul, N.; de Caceres, M.; Ruffault, J.; Barbero, R.; Dupuy, J.L. Projections of fire danger under climate change over France: Where do the greatest uncertainties lie? Clim. Chang. 2020, 160, 479–493. [Google Scholar] [CrossRef]
  40. Sutanto, S.J.; Vitolo, C.; di Napoli, C.; D’Andrea, M.; van Lanen, H.A.J. Heatwaves, droughts, and fires: Exploring compound and cascading dry hazards at the pan-European scale. Environ. Int. 2020, 134, 105276. [Google Scholar] [CrossRef] [PubMed]
  41. Barbero, R.; Abatzoglou, J.T.; Pimont, F.; Ruffault, J.; Curt, T. Attributing Increases in Fire Weather to Anthropogenic Climate Change Over France. Front. Earth Sci. 2020, 8, 104. [Google Scholar] [CrossRef]
  42. Van Oldenborgh, G.J.; Krikken, F.; Lewis, S.; Leach, N.; Lehner, F.; Saunders, K.; van Weele, M.; Haustein, K.; Li, S.; Wallom, D.; et al. Attribution of the Australian bushfire risk to anthropogenic climate change. Nat. Hazards Earth Syst. Sci. Discuss. 2020, 1–46. [Google Scholar] [CrossRef] [Green Version]
  43. OECD. Tourism Trends and Policies 2020; OECD: Paris, France, 2020. [Google Scholar]
  44. Varela, V.; Vlachogiannis, D.; Sfetsos, A.; Karozis, S.; Politi, N.; Giroud, F. Projection of forest fire danger due to climate change in the French Mediterranean region. Sustainability 2019, 11, 4284. [Google Scholar] [CrossRef] [Green Version]
  45. Dumond, Y. An applied step in forest fire spread modelling. In Proceedings of the 23rd European Conference on Modelling and Simulation, (ECMS2009), Madrid, Spain, 9–12 June 2009; pp. 32–38. [Google Scholar]
  46. Sandberg, D.V.; Anderson, G.K.; Norheim, R.A. Fire Emission Production Simulator (Software); United States Department of Agriculture: Washington, DC, USA, 2004; p. 95.
  47. RR Draxler and GD Hess. An overview of the HYSPLIT_4 modelling system for trajectories dispersion and deposition. Aust. Meteorol. Mag. 1998, 47, 295–308. [Google Scholar]
  48. Rolph, G.D.; Draxler, R.R.; Stein, A.F.; Taylor, A.; Ruminski, M.G.; Kondragunta, S.; Zeng, J.; Huang, H.C.; Manikin, G.; McQueen, J.T.; et al. Description and verification of the NOAA smoke forecasting system: The 2007 fire season. Weather Forecast. 2009, 24, 361–378. [Google Scholar] [CrossRef]
  49. Davis, M.; Clemmer, S. How Climate Change Puts Our Electricity at Risk; Union of Concerned Scientists: Cambridge, MA, USA, 2014. [Google Scholar]
  50. Zamuda, C.; Mignone, B.; Bilello, D.; Hallett, K.; Lee, C.; Macknick, J.; Newmark, R.; Steinberg, D.; US Department of Energy. U.S. Energy Sector Vulnerabilities to Climate Change and Extreme Weather; US Department of Energy: Washington, DC, USA, 2013.
  51. Sham, C.H.; Tuccillo, M.E.; Rooke, J. Effects of Wildfire on Drinking Water Utilities and Best Practices for Wildfire Risk Reduction and Mitigation; Water Research Foundation: Denver, CO, USA, 2013. [Google Scholar]
  52. Sakumoto, Y.; Nishigaki, T.; Ikeda, K.; Kohno, M. Fire Resistance of Steel Frames. In Technical Memorandum of Public Works Research Institute; Public Works Research Institute: Tsukuba, Japan, 2003; Volume 3906, pp. 347–354. [Google Scholar]
  53. Brandt, T. Effects of Fire Damage on the Structural Properties of Steel Bridge Elements; Purdue University, ProQuest Dissertations Publishing: West Lafayette, IN, USA, 2011; p. 1502121. [Google Scholar]
  54. You, F.; Zhang, Y.; Chen, H.X.; Zhang, L.H.; Zhu, J.P.; Zhou, J.J. Preliminary studies on flashovers of high-voltage transmission lines induced by wildfires by field survey and experimental tests. Procedia Eng. 2013, 52, 557–565. [Google Scholar] [CrossRef] [Green Version]
  55. Project Sunrise Powerlink: Effect of Wildfires on Transmission Line Reliability Collocation of Transmission Alternatives with the Southwest Powerlink. Available online: http://www.cpuc.ca.gov/environment/info/aspen/sunrise/deir/apps/a01/App%201%20ASR%20z_Attm%201A-Fire%20Report.pdf (accessed on 15 March 2020).
  56. Smith, S.T. The Performance of Distribution Utility Poles in Wildland Fire Hazard Areas; Technical Bulletin; North American Wood Pole Council: Birmingham, AL, USA, 2014. [Google Scholar]
  57. Habermann, N.; Hedel, R. Damage functions for transport infrastructure. Int. J. Disaster Resil. Built Environ. 2018, 9, 420–434. [Google Scholar] [CrossRef] [Green Version]
Figure 1. EU-CIRCLE resilience.
Infrastructures 06 00016 g001
Figure 2. EU-CIRCLE case study implementation framework.
Infrastructures 06 00016 g002
Figure 3. User engagement process.
Infrastructures 06 00016 g003
Figure 4. Provence Alpes Cote d’Azur (PACA) region and fire prone areas.
Infrastructures 06 00016 g004
Figure 5. Electricity transmission network (high voltage).
Infrastructures 06 00016 g005
Figure 6. PACA highways.
Infrastructures 06 00016 g006
Figure 7. (a) Climatic model MPI/RCP8.5/number of days/year Fire Weather Index (FWI) > 50: period: 2006–2015; (b) Climatic model MPI/RCP8.5/number of days/year FWI > 50: period: 2036–2045.
Infrastructures 06 00016 g007aInfrastructures 06 00016 g007b
Figure 8. Fire spreading overlaid by extreme 95% value of FWI under RCP85 period: 2036–2045.
Infrastructures 06 00016 g008
Figure 9. Fire total simulation—2 hours (out of total 4) and smoke total simulation (μgr/m3)—8 hours.
Infrastructures 06 00016 g009
Figure 10. Scenario identified impacts and cascading effects.
Infrastructures 06 00016 g010
Figure 11. Estimation of electricity network service disruption and cascading effects.
Infrastructures 06 00016 g011
Figure 12. Highway projected impacts due to fire incident.
Infrastructures 06 00016 g012
Figure 13. Average annual Initial Spreading Index for present and future RCP8.5.
Infrastructures 06 00016 g013
Table 1. Forest fires impact on electricity infrastructures and associated threshold.
CI SectorAssetImpacts on AssetImpact Threshold
Energy (Electricity)Distribution lines
Extra-High Voltage (ΕΗV) transmission lines
Fires in and around distribution lines can burn down the lines and damage distribution poles. According to [52] the strength of steel is reduced to 0.5 at a temperature range from 500 to 600 °C and this is the point where steel transmission towers are not able to bear the design load. At this 420 °C the galvanising increases with consequences for the corrosion prevention after the fire [53]. This temperature is supposed to be reached after 10 min of fire exposure.Structural threshold:
  • Temperature = 500–600 °C

Functional threshold:
  • Temperature = 420 °C (melting point of zinc)
Distribution substations
Transformer
Electrical grid operation
Fires can create a “flashover” from electricity infrastructure as the greatest risk comes from smoke and particulate matter [which] can ionize the air, creating an electrical path away from the lines. This can shut down the lines and produce power outages [54].Functional threshold:
  • PM2.5 concentration is > 350 μg/m3
Step up_down substationsIn most cases substations are normally located around defoliated areas; however, there is always possibility of a physical damage occurrence to substation facilities [55].Same threshold values as described in ΕΗV transmission lines.
Wooden pylonWooden pylons are submitted to fire front leading to their destruction [56]Flame temperature (>650 °C)
Table 2. Visibility and Road Accessibility.
No Visibility (Road Should be Closed)Medium Visibility (Road Should be Closed)Good Visibility (No Closure of Road)
PMmean > 30 mg/m310 < PMmean < 30 mg/m310 < PMmean mg/m3
Publisher’s Note: MDPI stays neutral with regard to jurisdictional claims in published maps and institutional affiliations.

