1. Introduction
A neutral section is a discrete piece of equipment included within the overhead contact line (OCL) of an alternating current (AC) electrified railway. It provides the function of electrical separation between two power supply systems. Neutral sections can be defined as ‘long’ or ‘short’, where the long variety may be 400 m in length, and the short is made up of discrete insulators spliced into the contact wire, and is less than 8 m long. The insulators included in the short neutral section can provide a disturbance to the smooth passage of the train mounted pantograph. For this reason, in the UK railway electrification on the 25 kV overhead line system (and elsewhere in Europe and internationally), short neutral sections are a recognised cause of reliability and performance problems.
Notwithstanding the preference for the long type of neutral section for (much) higher speeds, and the potential of inverter fed systems, which might avoid the need for electrical separation, there is still a pressing requirement for a short neutral section, which can be accommodated in the congested UK rail infrastructure. However, to date, neutral section performance is still poor and reliability uncertain.
The purpose of the work described here was to investigate whether an adaptation of the simulation techniques currently in use for the analysis of pantograph/OCL dynamic interaction could be used to provide a mechanism for analysing the behaviour of the current types of UK short neutral sections, an approach which had not been reported elsewhere, and furthermore to test this by carrying out a limited parametric analysis. This work was undertaken as part of the author’s PhD thesis [
1] at Newcastle University, UK.
2. The Neutral Section in the Electrification Infrastructure
In mainland Europe at present, AC electrification, of one form or another, accounts for around 60% of the electrified networks, whilst the extension of electrification and new projects (particularly those for high speed) are virtually all 25 or 15 kV AC [
2,
3]. However the 15 kV 16.7 Hz (previously 16 2/3 Hz) system in the Germanic countries and Scandinavia does not make great use of neutral sections as with this form of AC power supply the feeding sections can be interconnected synchronously, and often are [
4].
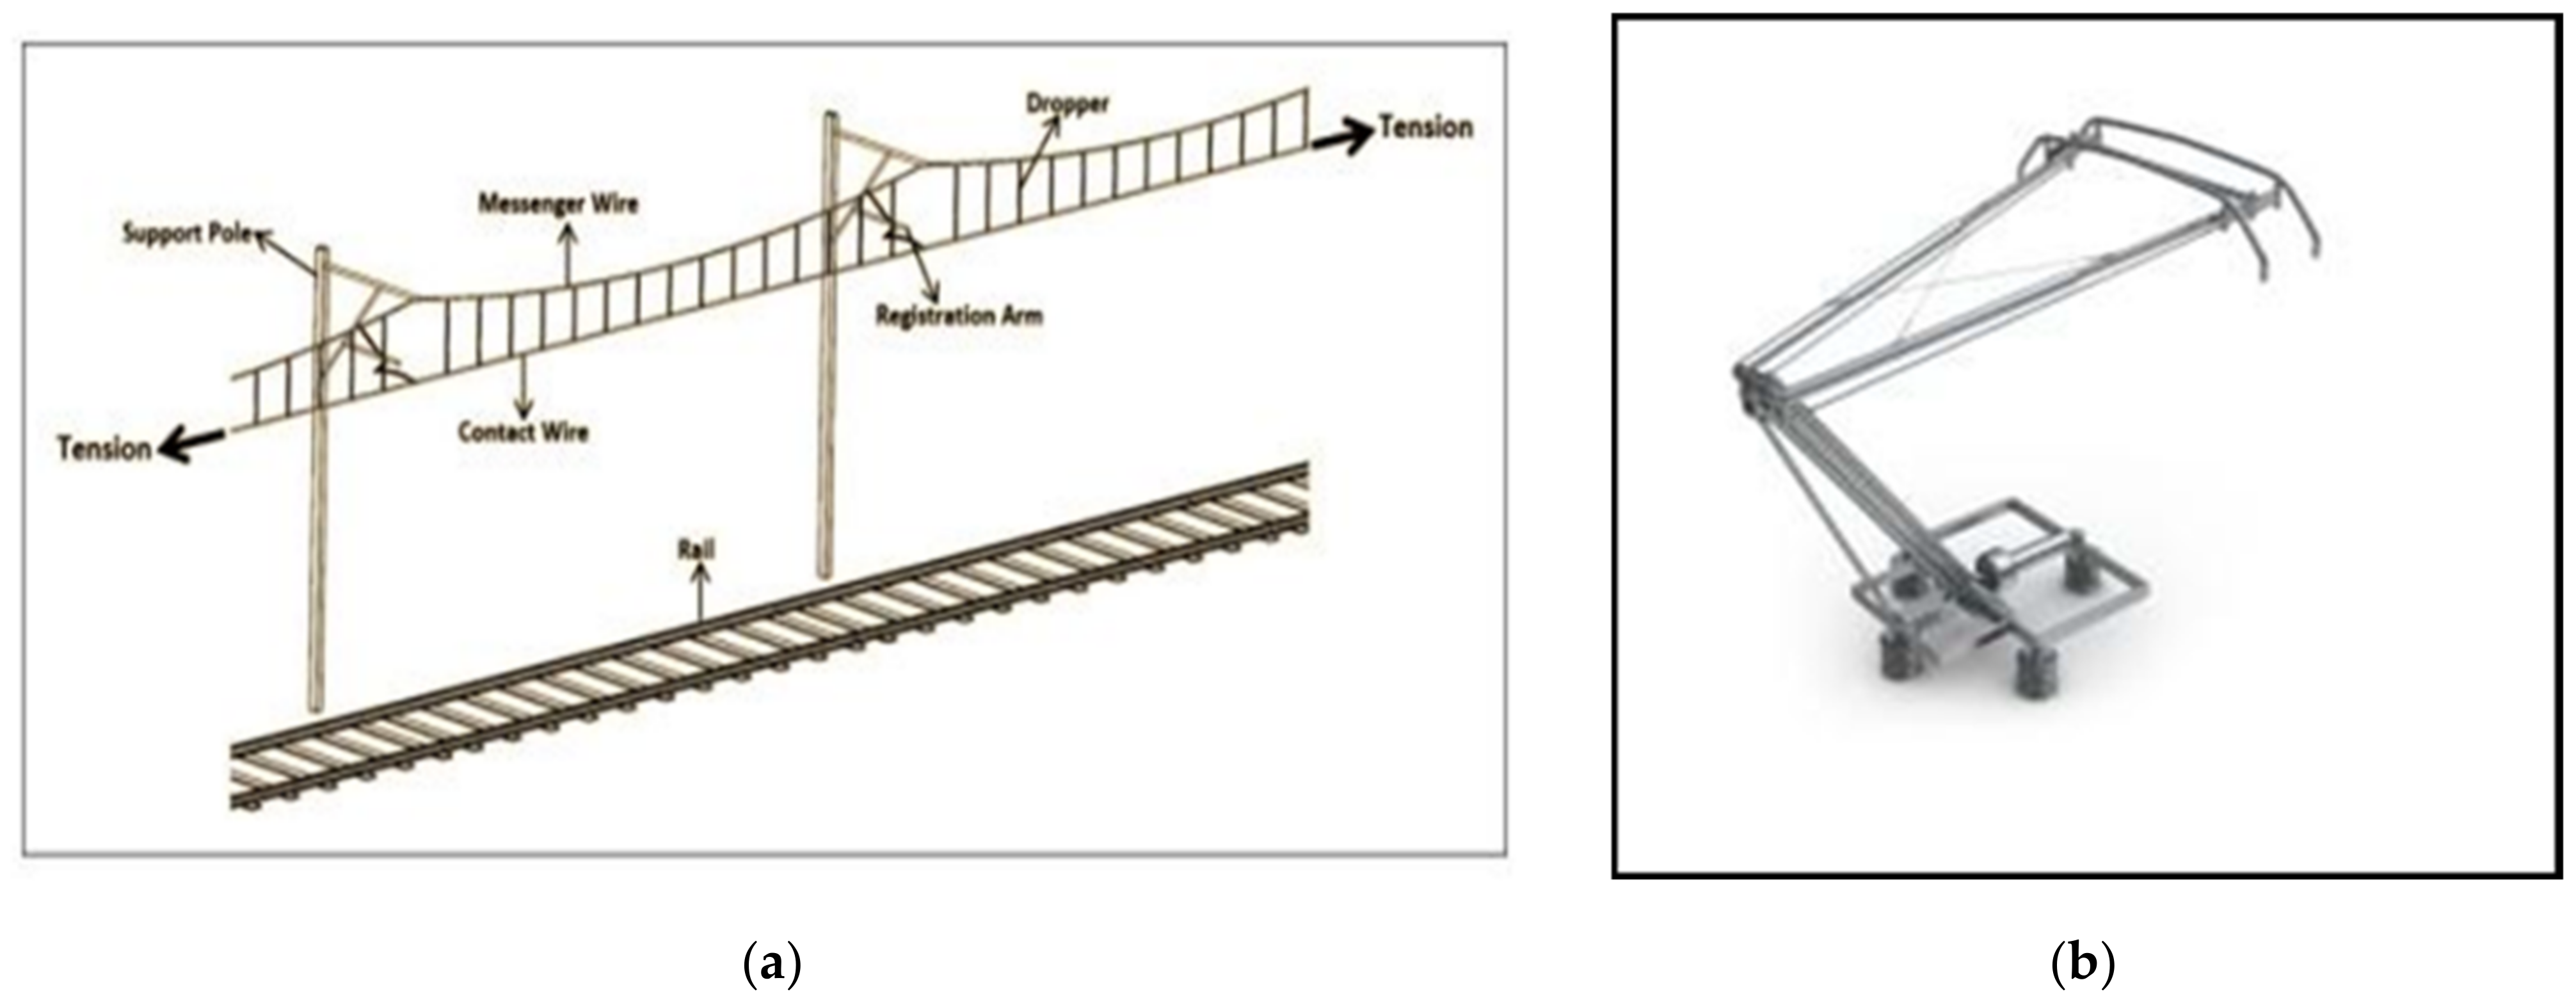
AC electrification predominantly uses an overhead contact line (OCL). Typically, the construction of the OCL consists of a tensioned contact wire (CW) supported at regular intervals by ‘droppers’ from a tensioned messenger wire above it. The two wires are often referred to as the ‘conductors’. Tensions and conductor particulars are dependent on the particular system, but typically the messenger is a stranded bronze conductor of around 65–80 mm
2 and the CW is a solid copper or copper alloy wire of around 100–150 mm
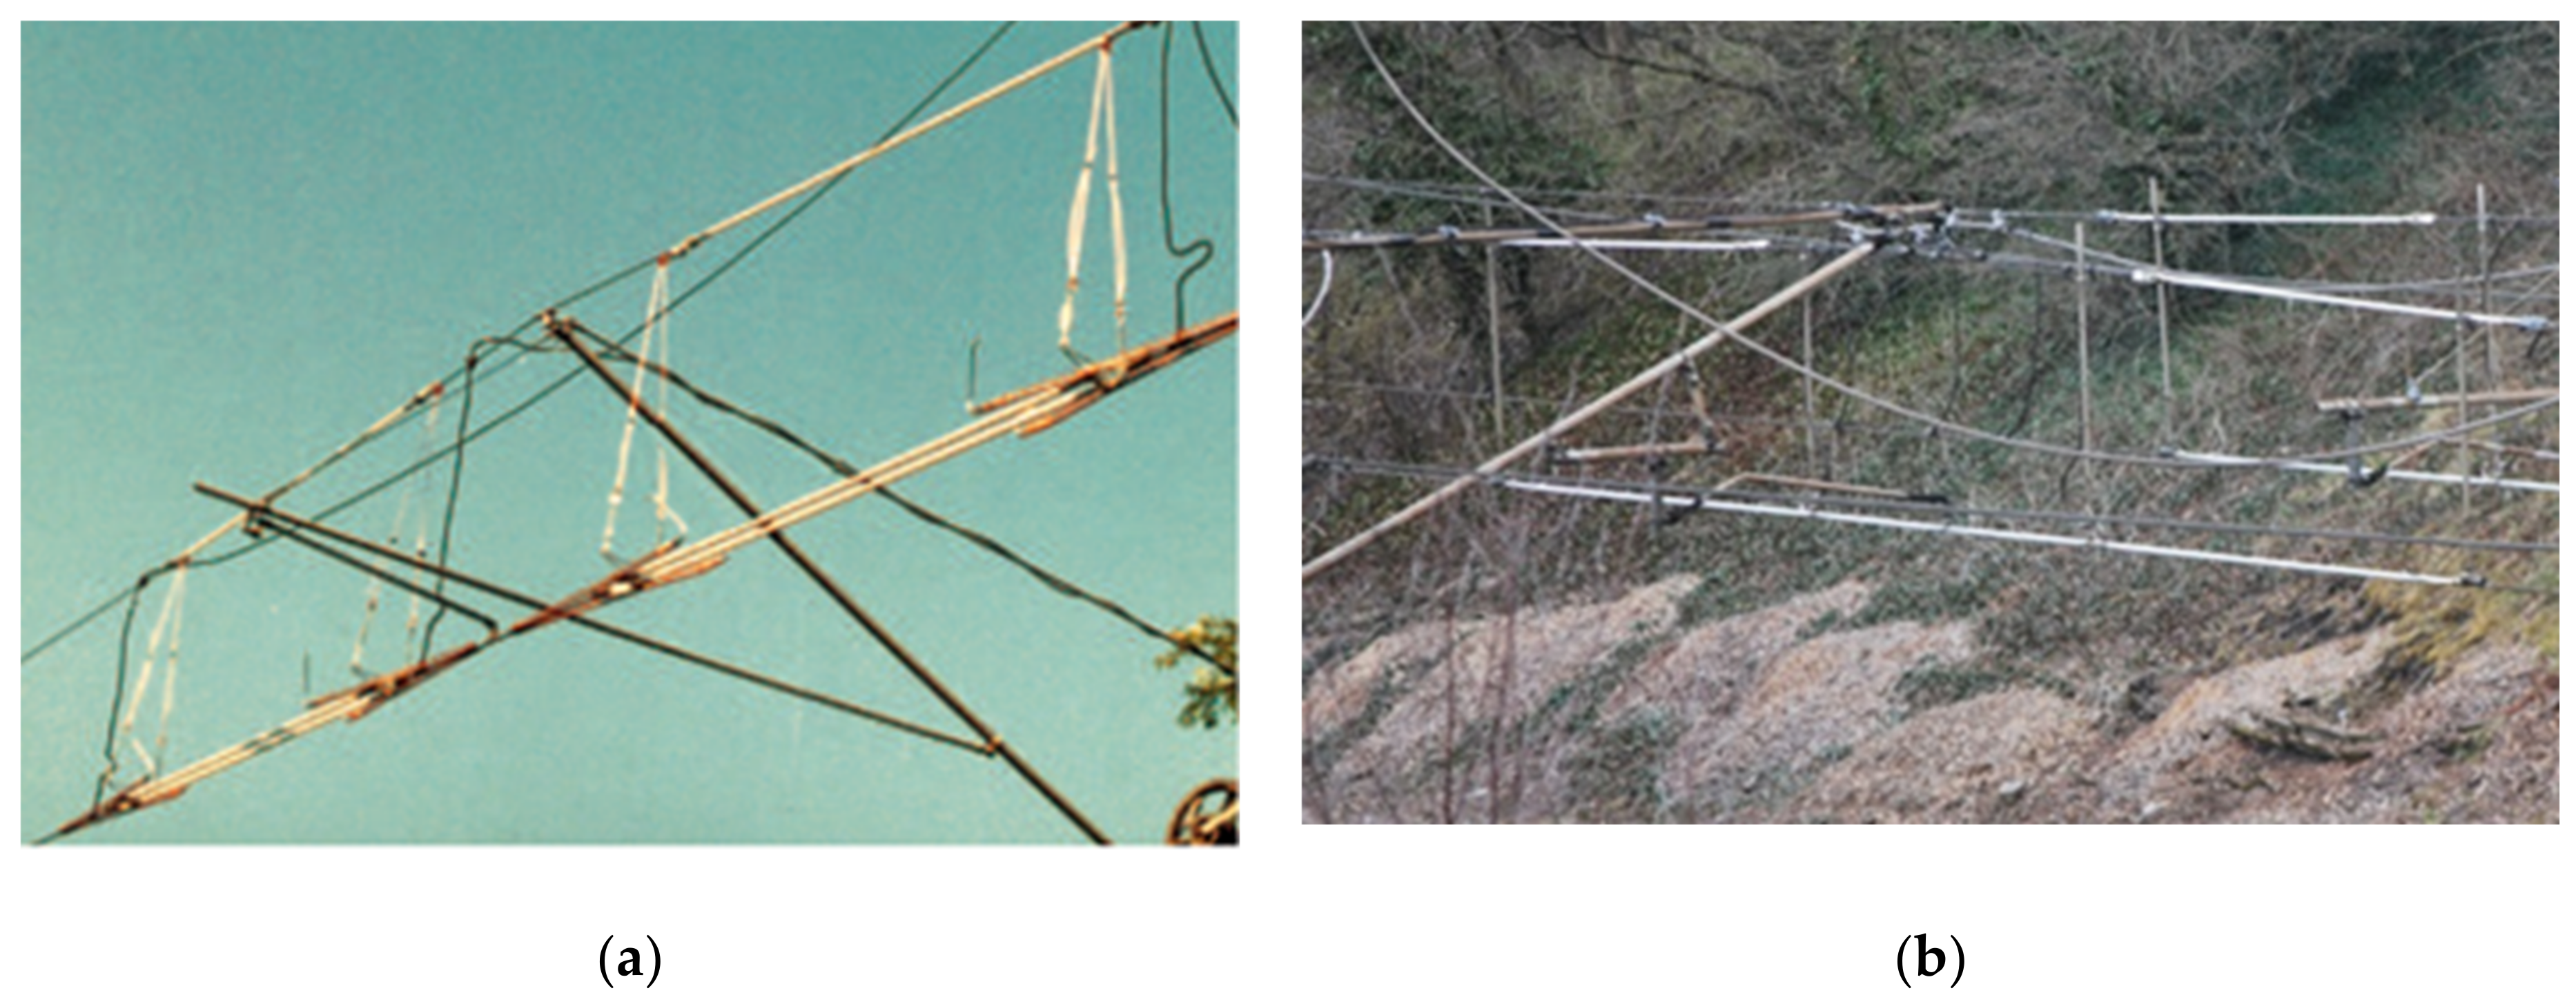
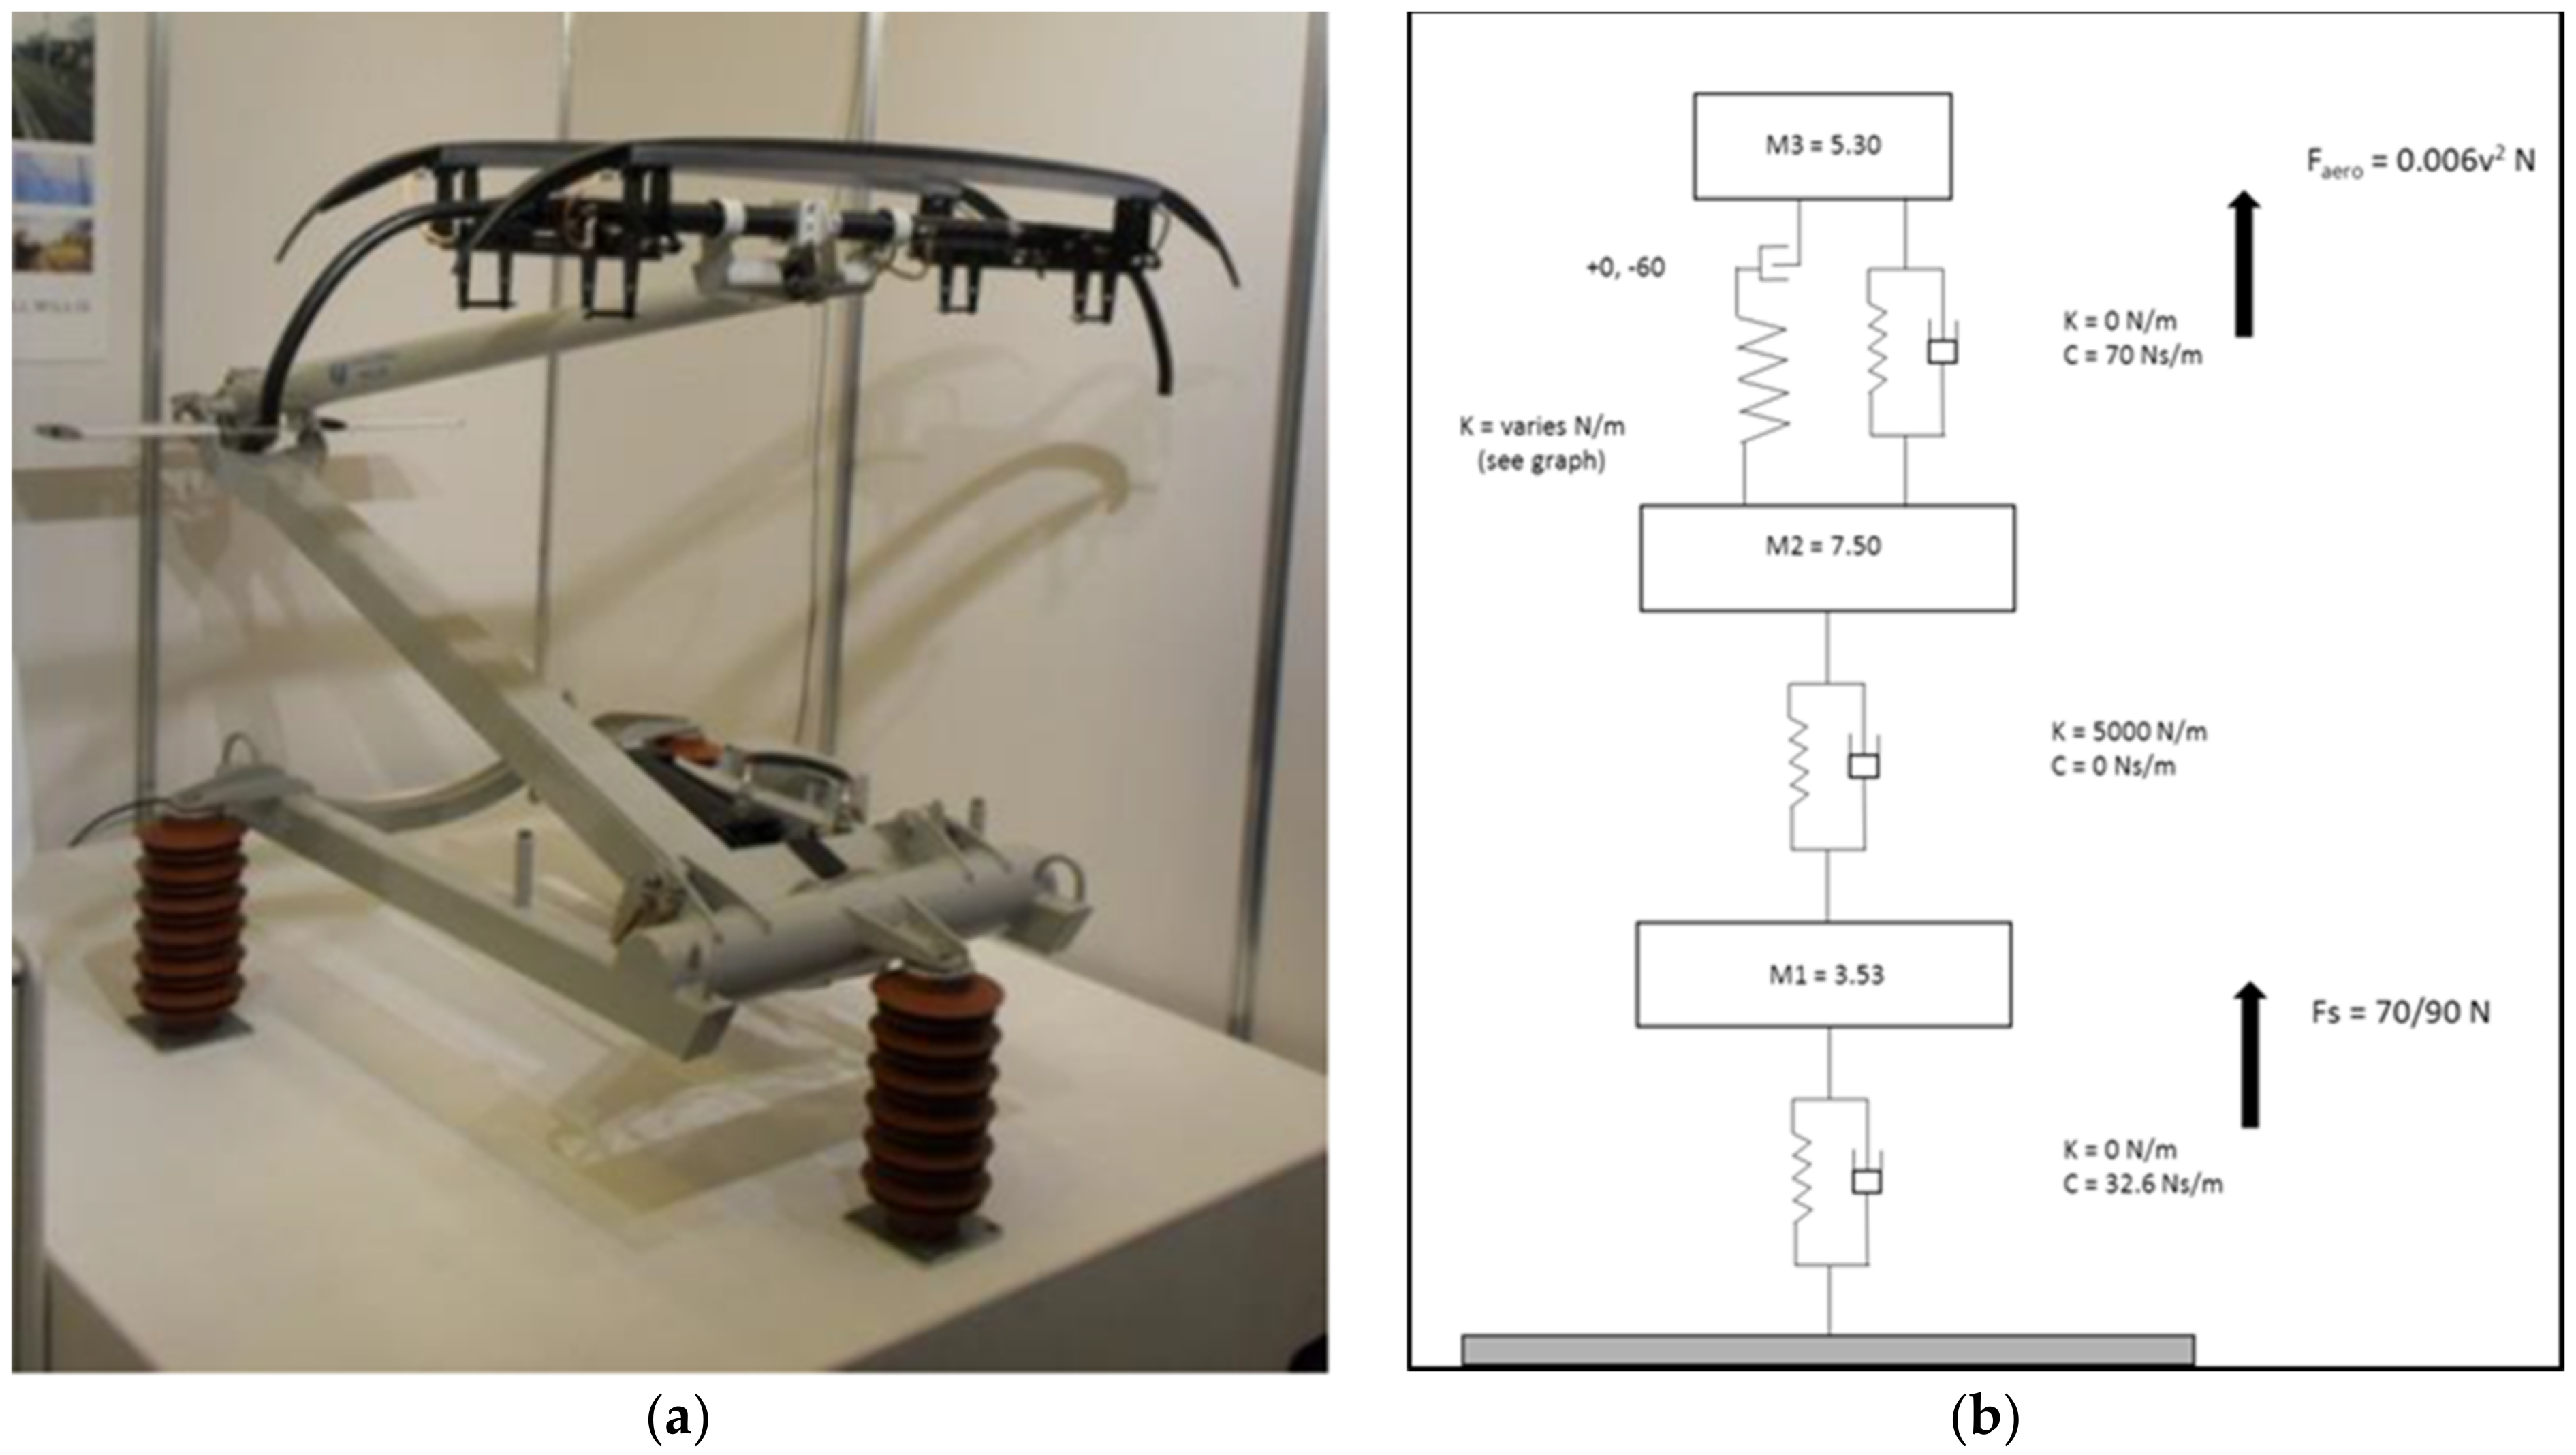
2. Tensions might be of the order of 12–20 kN. The function of the messenger and droppers is to maintain the geometrical profile of the CW in a desirable position. The messenger is supported at regular intervals (typically 50–65 m) from track side structures, at which points the CW is held in a position either side of the track centre line by registration arms, known as ‘staggering’. A typical arrangement is illustrated in
Figure 1a.
Current is collected from the CW by roof mounted devices on the trains, known as pantographs. A pantograph consists of a head carrying a number of carbon collector strips, supported on an articulated frame, which will accommodate variations in height of the pantograph head, whilst maintaining a constant attitude (
Figure 1b). An uplift force is applied by the pantograph to the head by air pressure or springs, typically of around 70–120 N.
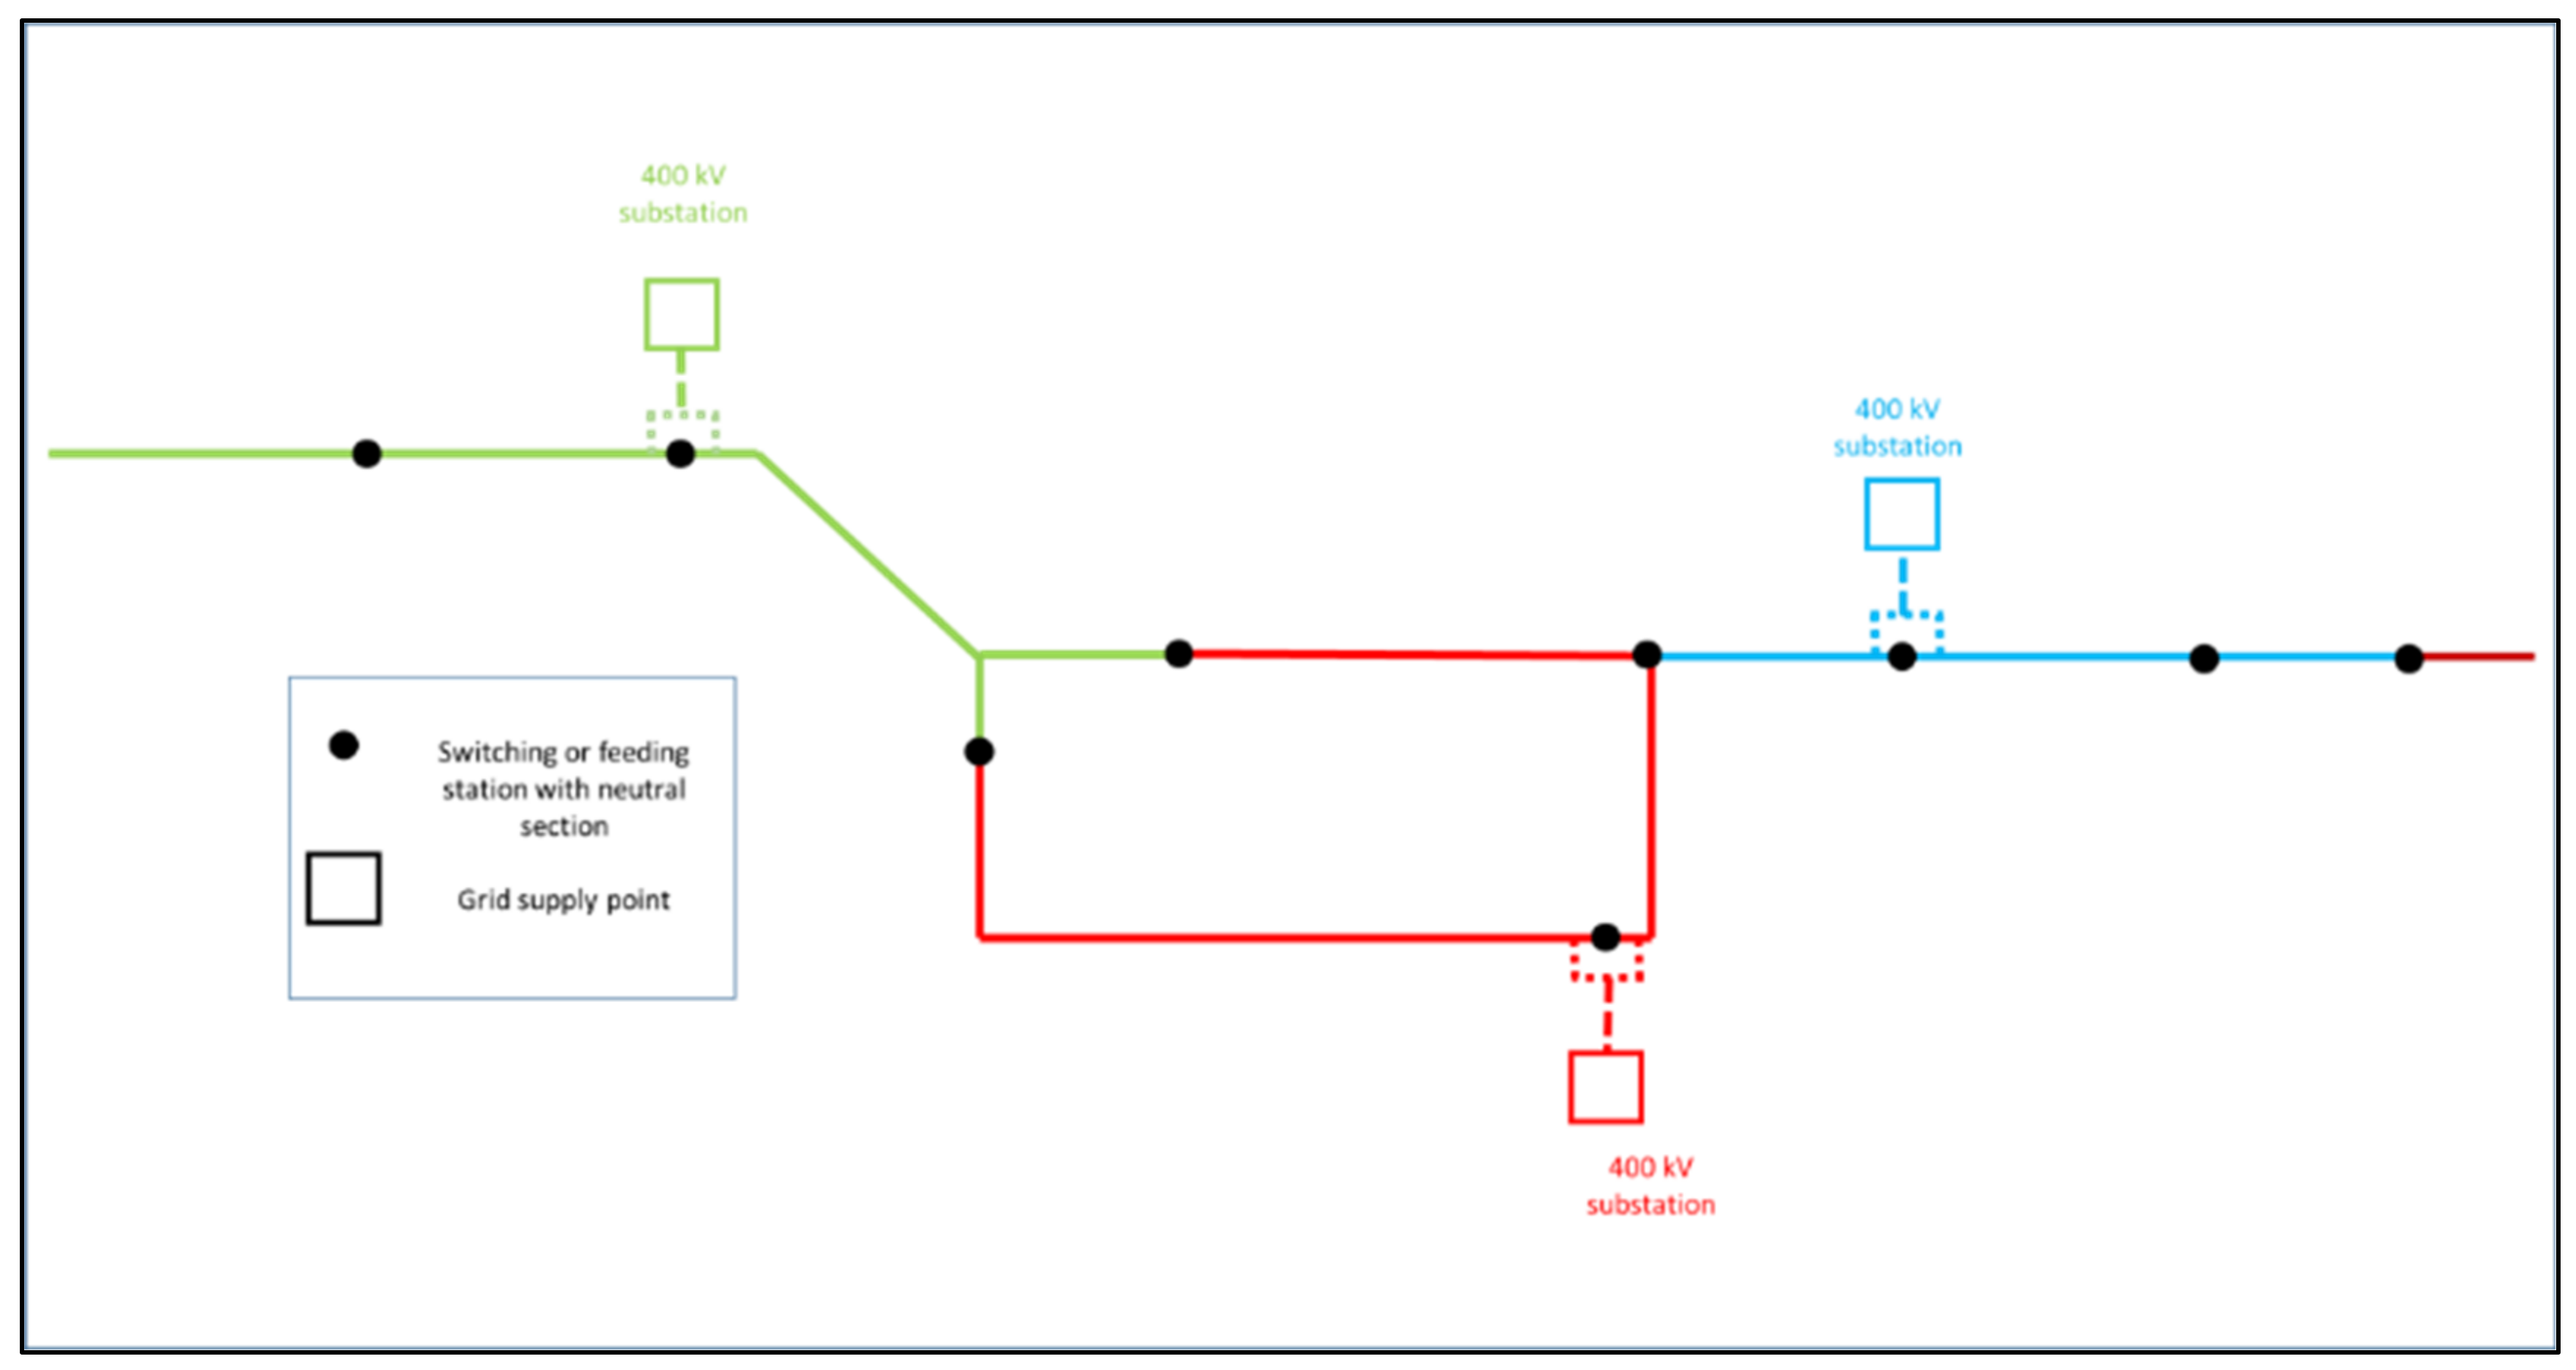
Although in the early days of railway electrification power generating facilities were often owned and operated by the railway company, since the widespread adoption of 25 kV 50 Hz on British railways, supplies have been taken directly from the electricity supply industry. A transmission network delivers at high-voltage three phase; however an AC electrified railway (conventionally) requires a single phase supply, and consequently a single phase supply is taken across two phases of the supply. In order to provide relatively high redundancy, very often two separate circuits supplying two separate 25 kV transformers are provided at each location, allowing for one to be taken out of service for maintenance without interruption to the railway [
5].
The supplies from each source are kept separate to avoid paralleling of the supply network, and to comply with the conditions of supply, whether from the same phase pairs or not. Consequently, adjacent feeder stations can only feed the overhead contact line either side of themselves up to a point nominally mid way between them, where an electrical break must be provided.
A typical example of a major feeding scheme indicating the routes electrified (not individual tracks), the feeder points and the mid-points where neutral sections are located (based on a simplification of the UK’s Great Western mainline electrification) is shown in
Figure 2.
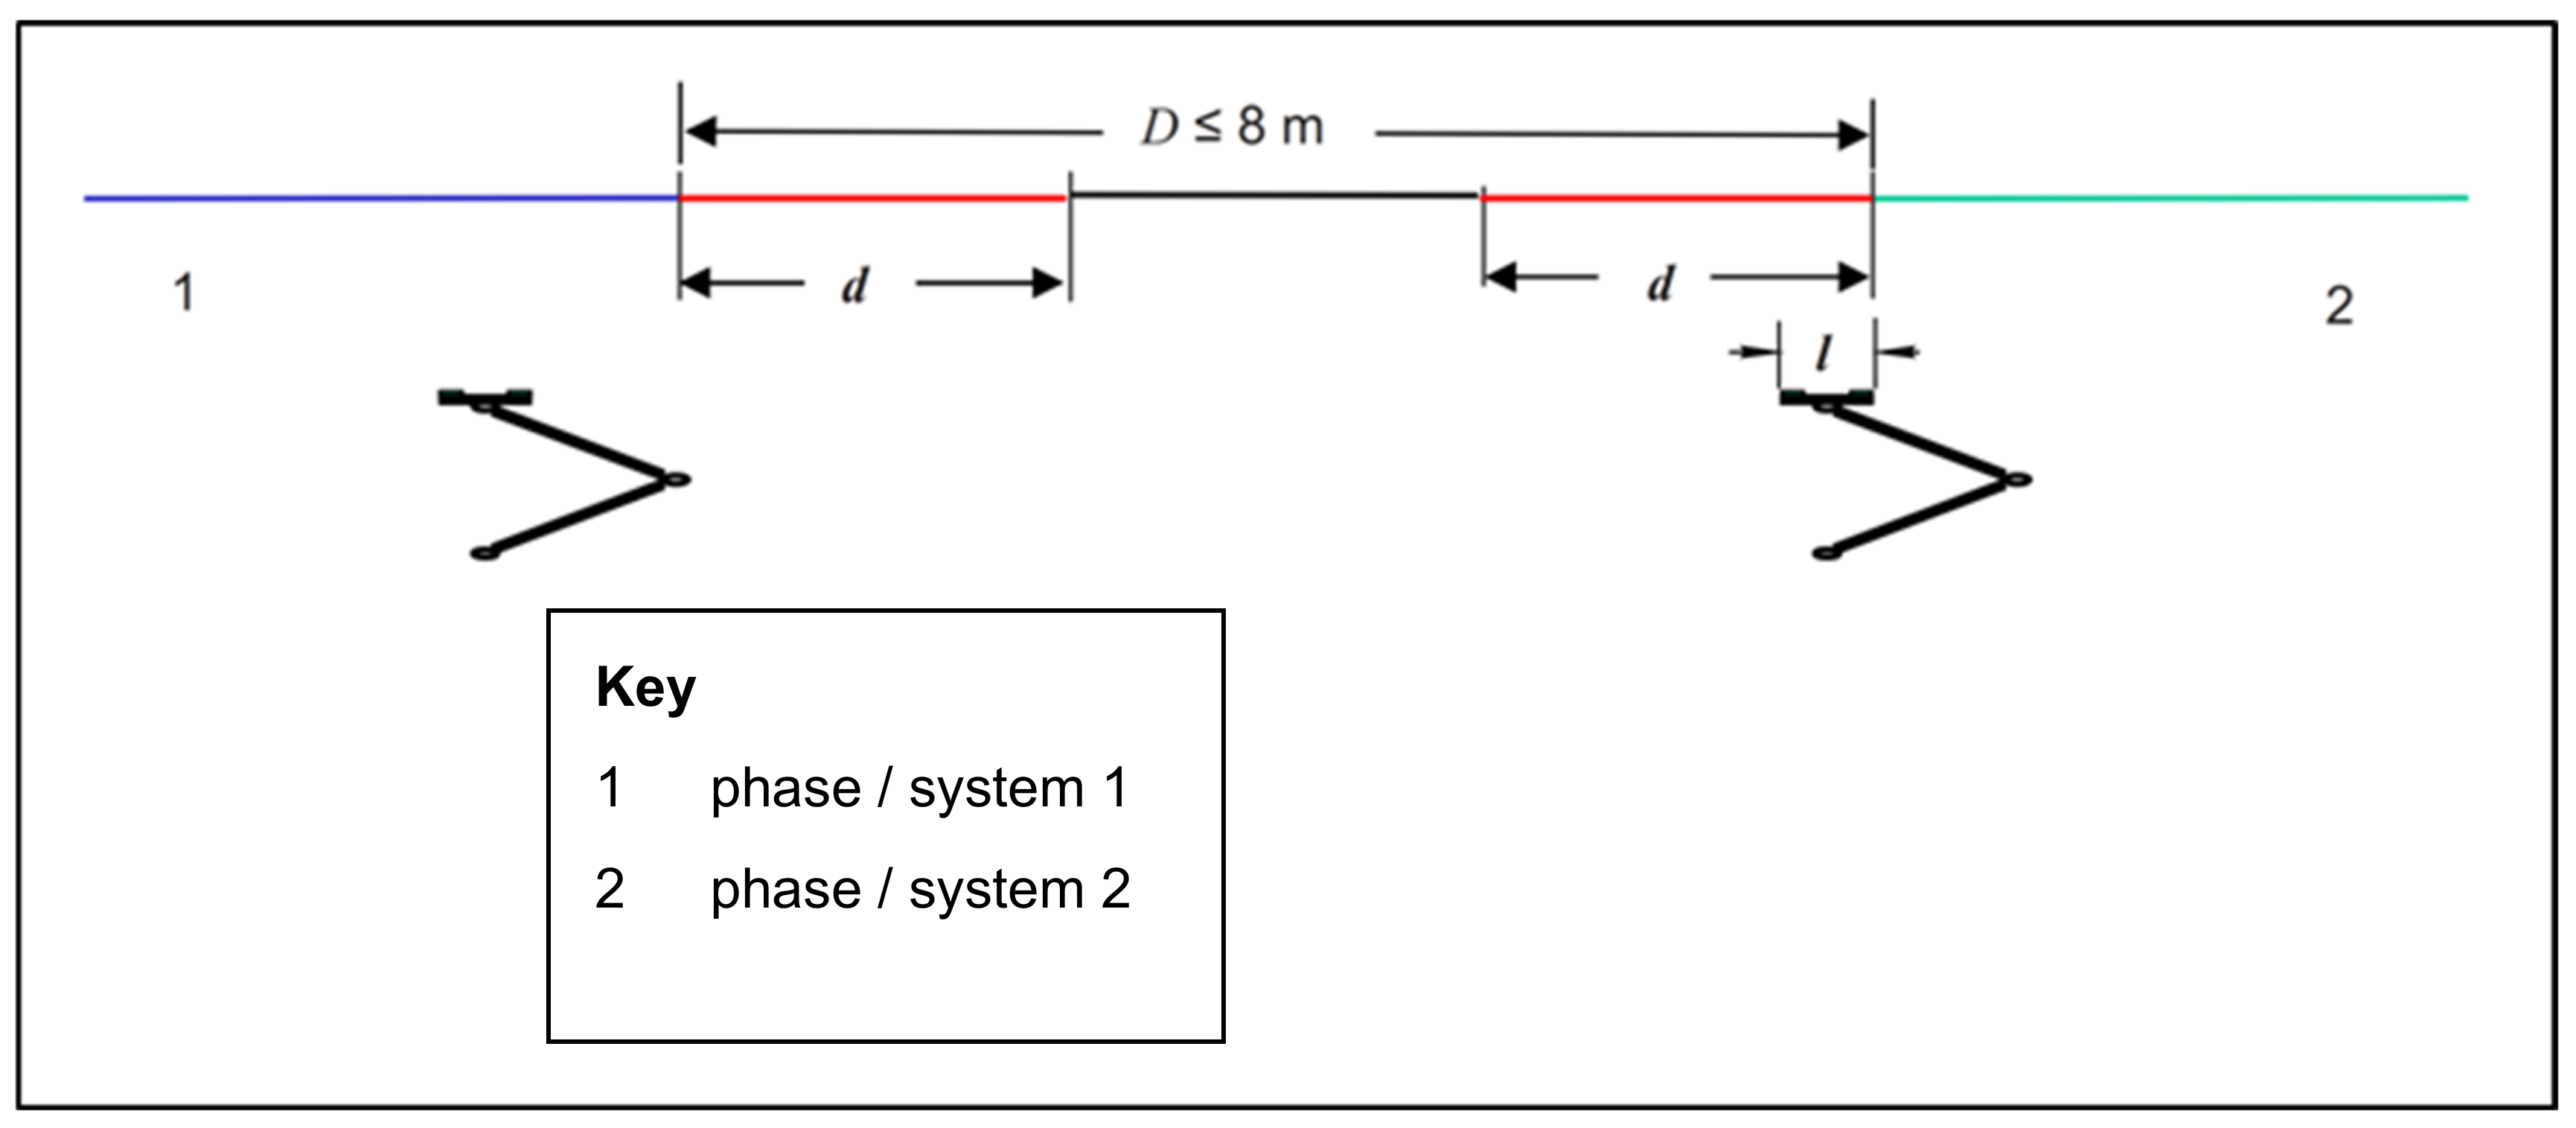
This complete electrical break is provided in the OCL at both the feeder station and mid points, and it is for this functionality that a neutral section is provided. A neutral section allows the passage of the pantograph but interrupts, completely, the continuity of collection of current. Additionally, an earthed centre section is often provided to prevent any electrical faults being drawn across the two supplies. A schematic of the short neutral section is shown in
Figure 3, which is taken from the European standard EN 50367 [
8] and which shows the neutral section by the red and grey lines, with an overall length of
D, the individual insulators of length
d, and a pantograph with an along track length of
l. These dimensions are used in the standard to define the limits to the geometry of the neutral section.
A neutral section is also used for ‘system separation sections’, which are located where two different electrical systems exist either side, either different voltages/frequencies (e.g., 25 kV 50 Hz and 15 kV 16.7 Hz) or for administrative or billing purposes (e.g., at a national border or rail network ownership boundary).
Neutral sections are described in terms of in terms of geometry and mechanical performance in EN 50367:2020 [
8] and in terms of electrical functionality in EN 50388:2012 [
9]. ‘Long’ and ‘short’ neutral sections are defined, where the long variety is usually (but not exclusively) made up of consecutive overlaps, and may be 400 m in length, and the short is made up of discrete insulators spliced into the contact wire, and is less than 8 m long. Only the long form is suitable for higher speeds.
3. UK Short Neutral Section Development
On British Rail ‘short’ neutral sections have been in use since around 1963. They originally incorporated in line insulators made up of ceramic beads (CB) threaded onto a glass fibre core, and inserted into the OCL, separated by a short earthed section (of contact wire). The connections between the contact wire and the CB insulators were effected by means of aluminium bronze end fittings, which, due to their construction, required the use of additional ‘skids’ to carry the pantograph head carbon collector strips across the discontinuity presented. Sprung anti-torsion tubes supported the contact wire end fittings to maintain the skids and fittings in a vertical attitude. The overall length, from live to live section, was around 4.2 m.
As line speeds above 160 km/h (100 m/hr) were anticipated with potential Advanced Passenger Train (APT) introduction, issues of poor performance were encountered during trials at 200 km/h (125 m/hr) including chipping of pantograph carbons (by misaligned skids) and cracked ceramic beads [
10]. This prompted parallel workstreams; one of development of the existing design and one of fundamental re-design.
A more fundamental development by BR Research in the early 1980s resulted in a design known as the ‘skidless’ neutral section, and introduced widely on BR from the early 1980s [
11]. It used CB insulator developments, but incorporating a novel form of end fitting to the CB insulator which was cylindrical, and allowed the connection to the contact wire to be made by a conventional contact wire splice, which avoided the need for skids. This transferred the load along a line of action much closer to the neutral axis of the contact wire than the previous form of splices, and thus inserted a much smaller couple, and hence deformation, into the connection. As well as eliminating the pantograph carbon damaging skids, it effectively increased the useful length of the insulator, which allowed a shorter, and hence stiffer, insulator rod to be used, benefiting dynamic performance.
Production versions of the skidless neutral section were introduced from 1983 as shown in
Figure 4.
The skidless CB neutral section remained in use until the late 1990s when, with the West Coast upgrade programme requiring a neutral section for use with 120 mm
2 cross section contact wire, its performance, in the context of the greater emphasis on reliability post-privatisation, led to search for another type [
12]. Another aspect of post privatisation policy was the desire to seek a standard item warranted by the manufacturer, rather than in house design, however the chosen design from Arthur Flury (AF) of Switzerland still required some modification to suit both the UK conditions and the demands of the infrastructure manager (Railtrack at the time).
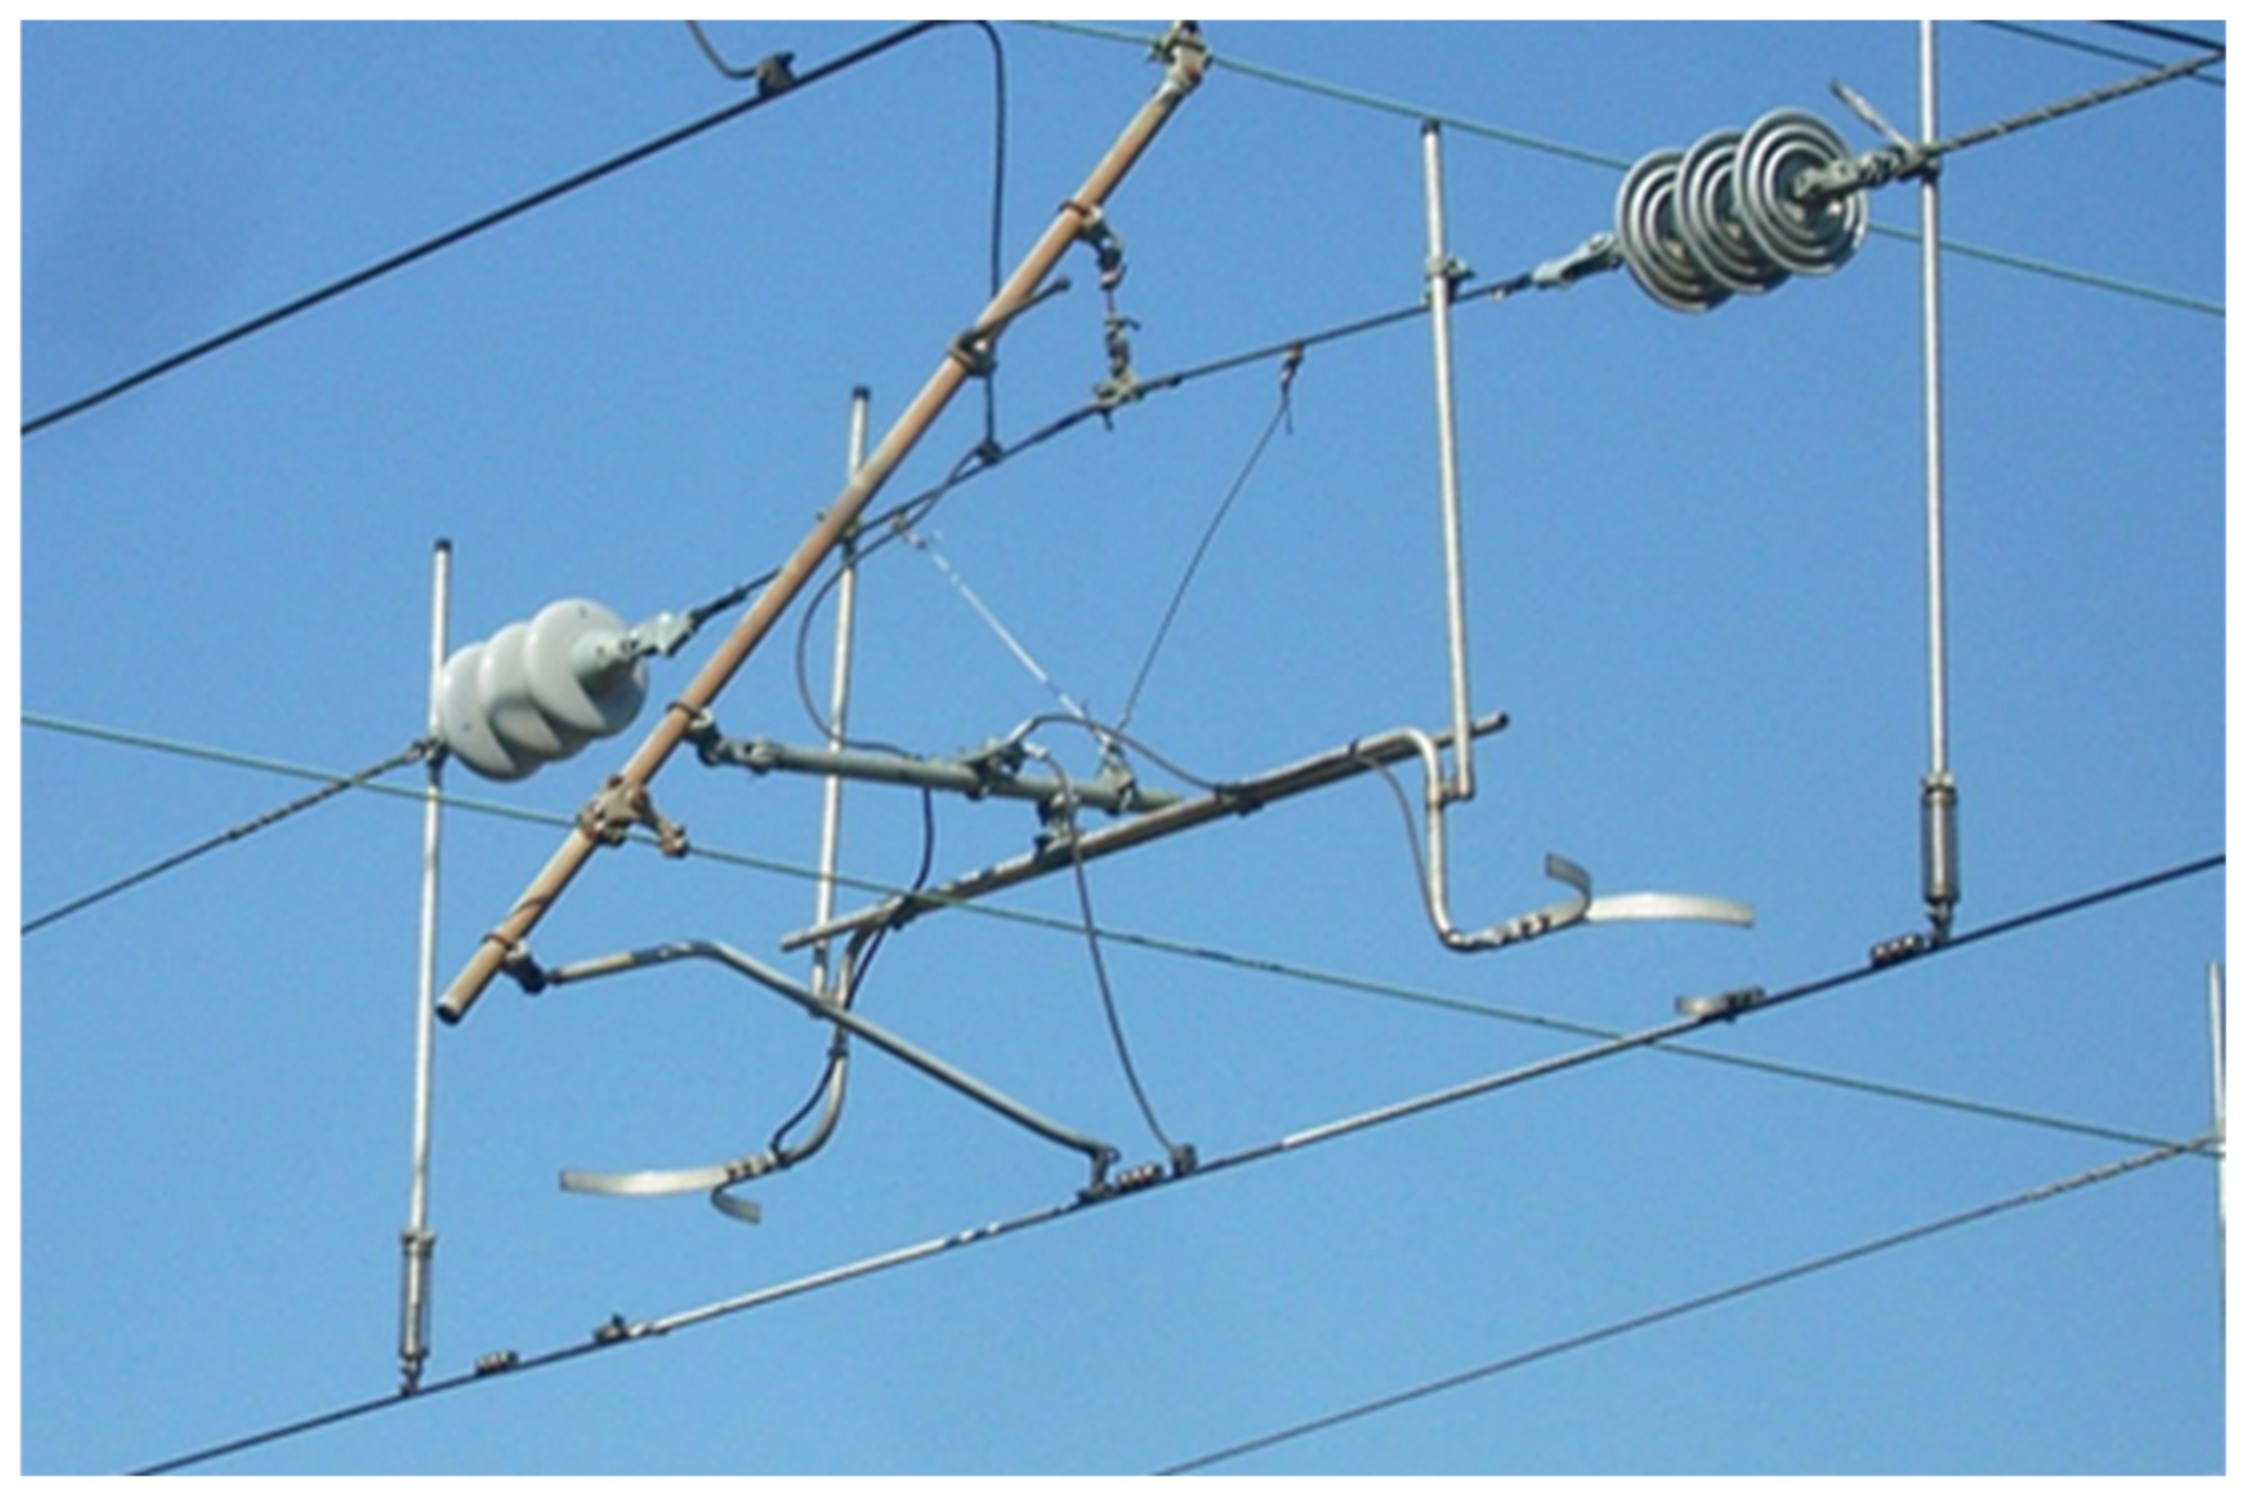
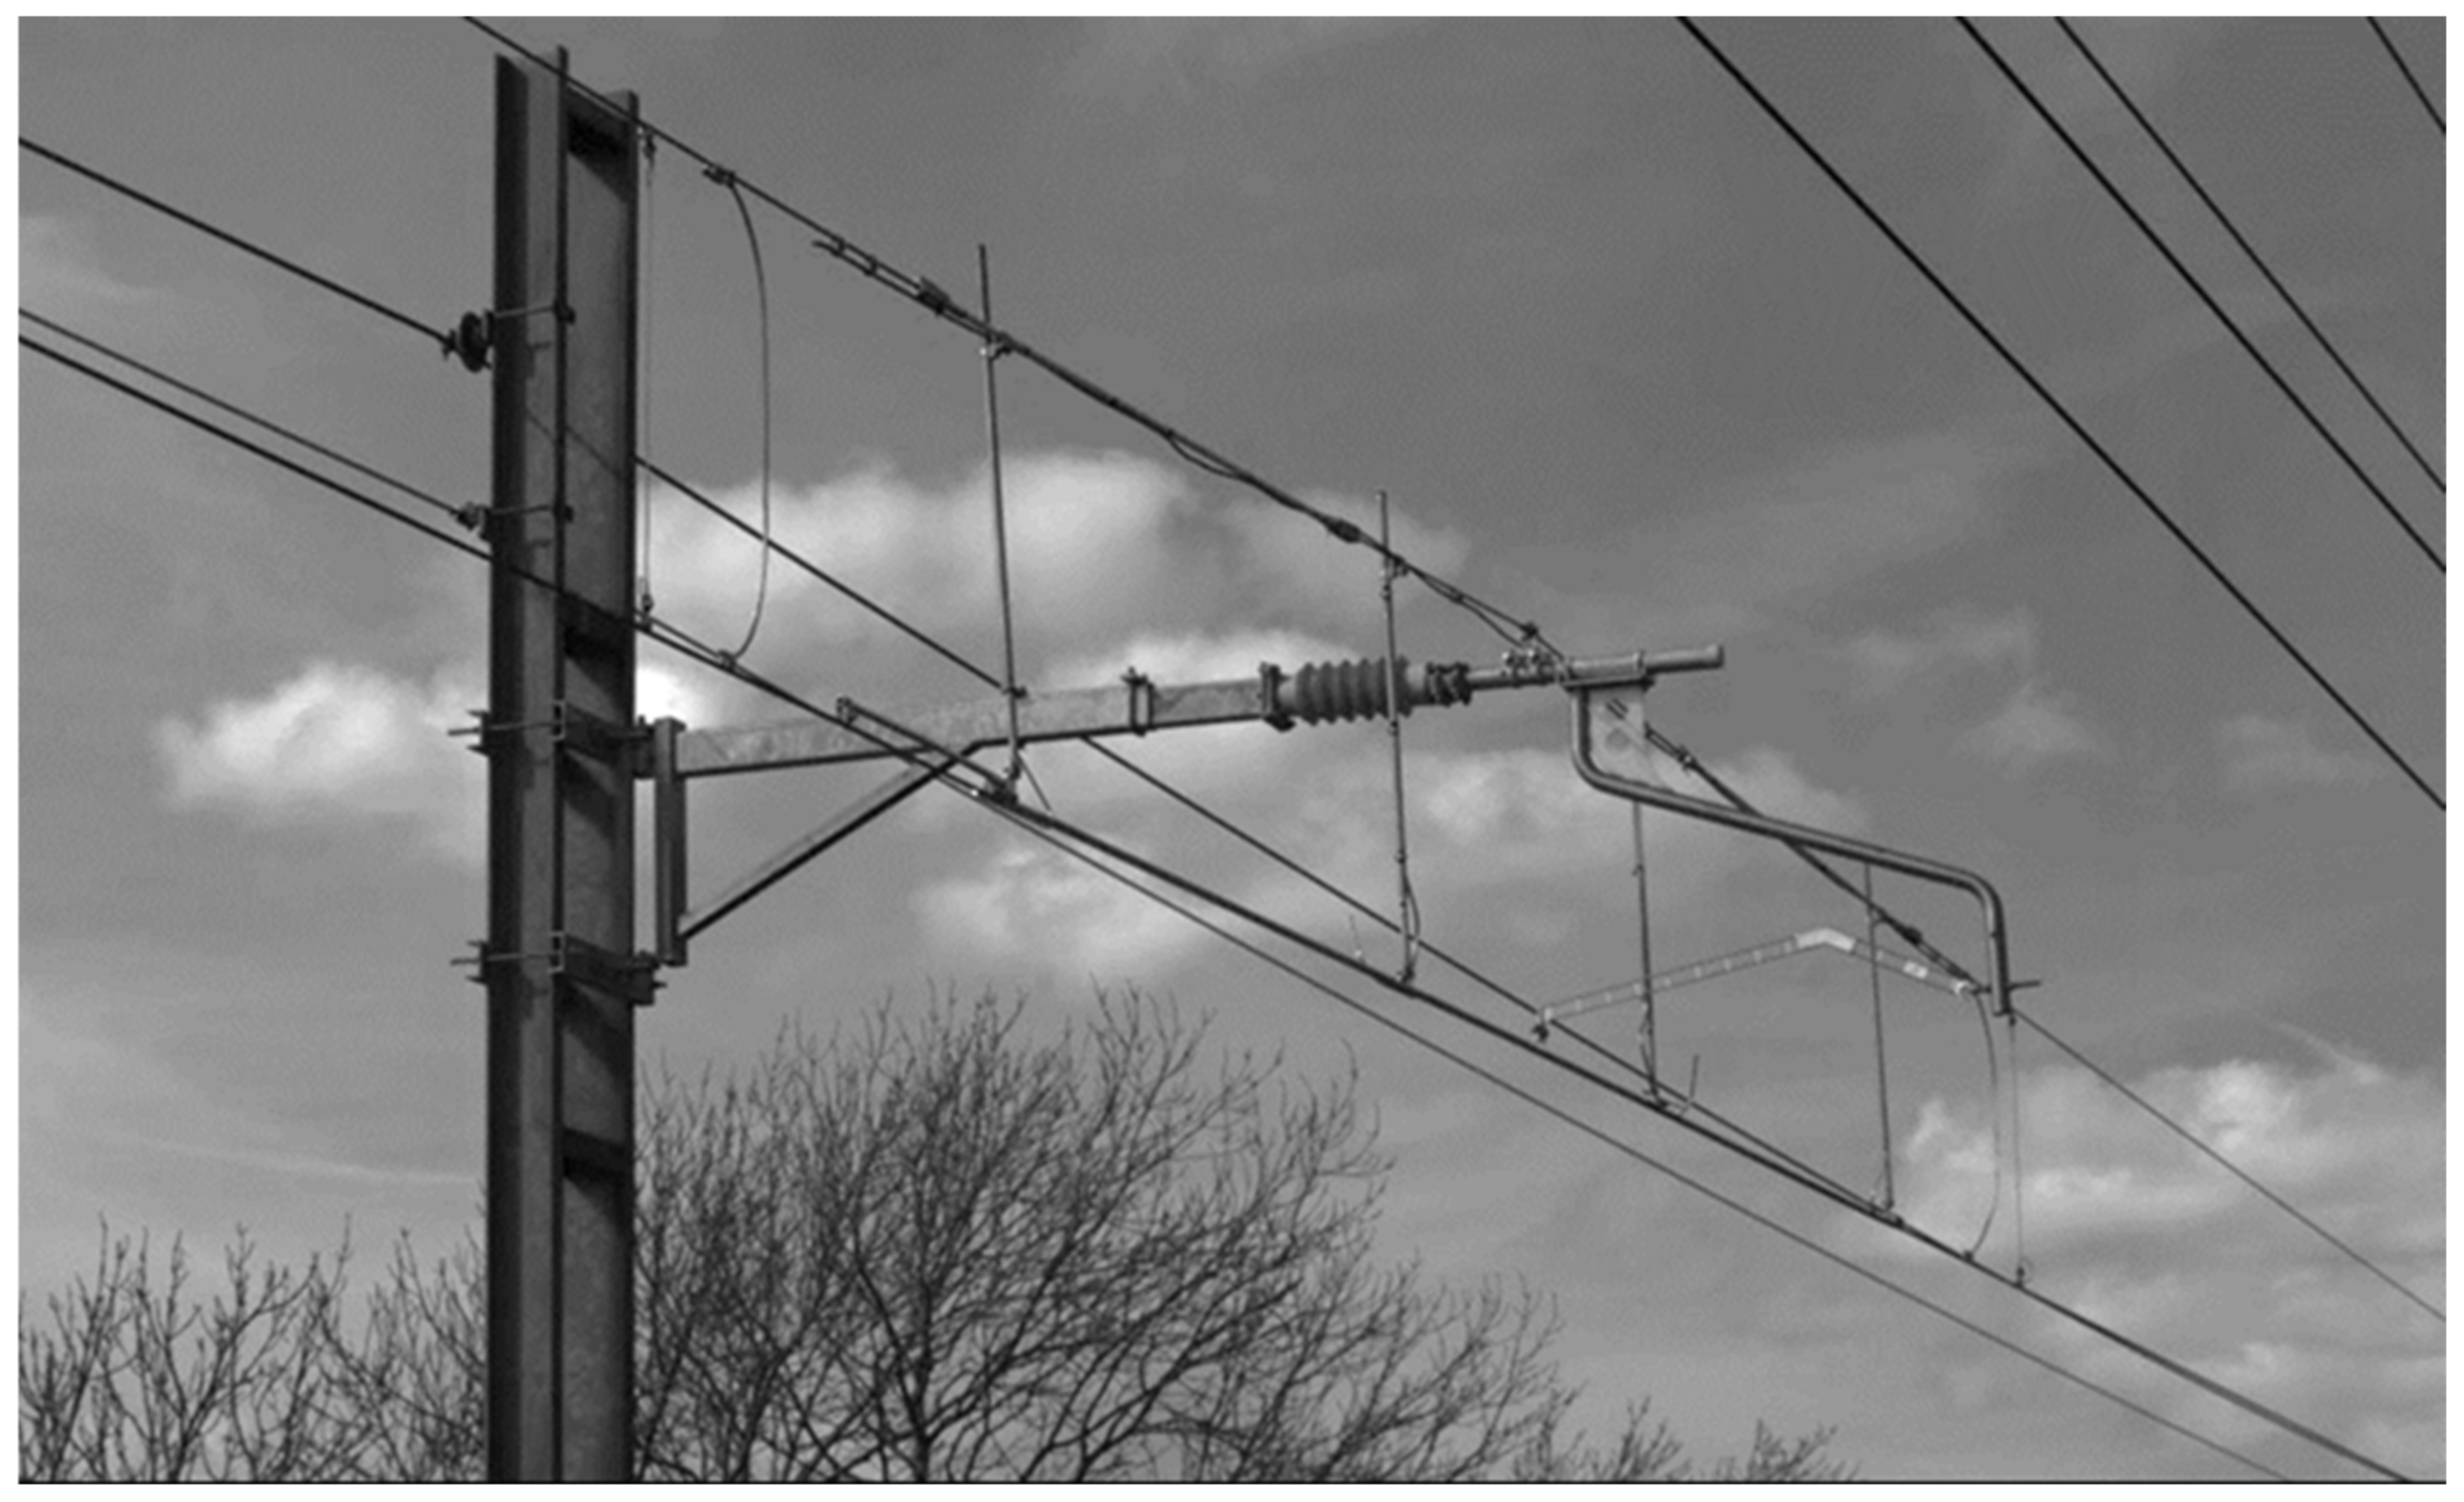
The design was a conventional AF 25 kV type, NS25-UK-10 [
13] in use elsewhere in Europe and around the world. It consisted of two parallel PTFE covered rods, terminated in non-ferrous end fittings, skids and integrated arcing horns. Two sets of these were mounted symmetrically around the support point, supported at the contact wire/rod end fittings by adjustable droppers. This arrangement is shown in the photograph in
Figure 5a.
The use of twin parallel rods to transmit the tension allowed each glass fibre rod to be of a smaller diameter which kept the neutral axis of the insulator close to that of the contact wire, reducing the bending due to the contact wire tension across an offset axis. The use of two rods however necessitated an end fitting that could not be negotiated by the pantograph head without the use of skids. Thus this design reverted to a pre-1980s concept of using skids, a concept that had been abandoned when the skidless ceramic bead insulator was introduced.
Operational experience with this type of neutral section was mixed, and some improvements were initiated and implemented by Railtrack (later Network Rail) over time. The initial focus was on the twin rod aspect, and AF were encouraged to develop a single rod version, without skids, around 2002 [
12]. Subsequently, a ratchet mechanism to allow the insulator rod to be rotated (allowing wear to be spread around the circumference before replacement was necessary) was also introduced. This model of neutral section is shown in the photograph in
Figure 5b.
Most of these developments created their own problems, including the introduction of a lever arm to address issues at the contact wire entry splice, and it would be true to say that for most of the last 10 years Network Rail has been involved in an ongoing design development and performance improvement exercise for its neutral sections, based around the Arthur Flury single rod type.
The current situation is that attention continues on the short neutral section. The practical difficulties in finding space in the line for carrier wire type neutral sections (such as on recent schemes such as Great Western Electrification) contribute to the urgency of this.
4. Recent UK Neutral Section Experience
The neutral section itself is a discontinuity in the otherwise (generally) smooth passage of the pantograph along the OCL, and experience indicates [
14,
15] that they are notoriously unreliable, requiring more intensive maintenance than any other OCL feature, and perform poorly, leading to poor quality current collection and pantograph damage.
Network Rail formally reports infrastructure incidents (to the UK regulator, the ORR) that cause train delays in excess of 500 min, broken down by asset type [
16]. Analysis for the years 2006–2014, and data for OCL incidents and those attributed to neutral section failure, is shown in
Table 1 [
17]. (For comparison, OCL failures contribute to about 3% of all Network Rail reported train delay minutes.)
Data of the required granularity is not available for other years. Naturally, other neutral section incidents and failures below the reporting threshold of 500 min will have occurred, especially where faults have been found on routine patrols and addressed before a major incident occurred.
The cost for these incidents can only be estimated, due to differing Schedule 8 rates (compensation from Network Rail to train operating companies for infrastructure caused delays) across the network, but the average delay for each neutral section related incident is above 4000 min over the last nine years [
18,
19,
20]. Notwithstanding the different rates, costs of hundreds of thousands of pounds per incident can be assumed, and it is this that drives the need for an improvement in neutral section performance.
The data in
Table 1 is related to an approximate population of 515 neutral sections. And despite the variability in the level of detail and granularity in the data over the time period, some observations can be drawn. Predominantly only two types of neutral section exist in the infrastructure in this period: the skidless ceramic bead type, and the Arthur Flury single rod type. The Arthur Flury single rod type accounts for twice the volume of train delay minutes from approximately the same number of incidents [
18,
19,
20]. 68% of all neutral section incidents occurred in line speed lines 160–200 km/h, and although data is not readily available, it is a fair working assumption that most if not all of neutral sections on these lines are the Arthur Flury single rod type, as this was Network Rail policy, although it is not clear when all were completed.
The summary in
Table 2 shows how the total train delay minutes is allocated between the two main neutral section types, and which types produce incidents of greatest train delay minutes [
18,
19,
20].
Table 3 shows the number of neutral sections installed by line speeds, and the total minutes delay in each speed band [
18,
19,
20].
Although superficially indicating a poorer performance, it should be borne in mind that Arthur Flury single rod type would be installed on the faster (160–200 km/h) lines and in the areas considered ‘vulnerable’, and so a greater incidence of failures might reasonably be expected. However the general conclusion can still be drawn that the replacement of the skidless ceramic bead neutral section type by the Arthur Flury single rod type has not eliminated the neutral section as a source of unreliability and train delays in the higher line speed (160–200 km/h) areas.
5. Pantograph and OCL Interaction Studies—Analysis Methodology
The dynamics of the interaction of the pantograph and the OCL have been a subject of interest since the introduction of lightweight AC OCL systems, and has developed significantly with the increased availability of greater computing power, and the demands of high speed rail development in Europe (and beyond). The purpose has been to optimise both OCL and pantograph parameters to economically achieve a satisfactory ‘quality’ of current collection. More recently this has been also necessary as one of the elements in demonstrating compliance with the Technical Specification for Interoperability (TSI) for Energy subsystem as required under the EU Interoperability Directive [
21].
The requirements for this quality of current collection are mostly defined in the Energy TSI [
22] and elaborated further in European standards EN 50119 [
23] and EN 50367 [
9]. As would be expected, these requirements are related to average performance over a large distance, and so the criteria mainly used are the statistical mean contact force, F
m and its standard deviation, σ (although forces do not form a normal distribution), together with the vertical movement of the CW as the pantograph passes (the ‘contact point’). Both simulated and measured values are low pass filtered at a specified frequency, in most cases 20 Hz. Compliance is demonstrated by both computer simulation and line test measurements. Additionally (and importantly for the work described in this paper) the TSI requires any simulation methods used in demonstrating the quality of current collection to be validated in accordance with another European standard EN 50318 [
24]. Much of the work in the field is mainly concentrated on dealing with this requirement. As far as neutral sections are concerned, there is a requirement in EN 50119 [
23] that the peak force for a short neutral section does not exceed 350 N.
A significant amount of work has been published on the numerical methods of simulation of pantograph/OCL interaction. A good recent summary of a number of researchers work in this field, and comparison of their approaches, is to be found in a special issue of the Journal of Vehicle System Dynamics [
25], ‘The pantograph-catenary interaction benchmark’ where ten papers describe their different approaches. Some of this built upon earlier work under the EU funded PantoTrain project [
26].
As well as indicating a good degree of agreement against a ‘benchmark’ set of OCL-pantograph data, these papers give a good overview of the state of the art for these forms of simulations, and from which it can be seen that, by and large:
The techniques combine elastic models of the OCL with rigid multi body models for the pantograph;
the OCL is modelled by finite element; lumped mass models of the pantograph are common;
The most sophisticated approaches use 3D models of the OCL and a 3D true multi body representation of the pantograph;
The simplest model used is 1D lumped parameter model of the pantograph and 2D finite element model of the OCL.
The general numeric approach taken is to create mass, stiffness and damping matrices to form the elastic OCL model, and to solve the equations of motion between that and the moving lumped parameter model of the pantograph at discrete time (or distance) steps, using either finite element method (or occasionally finite difference) to solve the integrations, and using iterations if a non-linear approach is used. All the simulation methods described appear to be undertaken by custom computer code, usually Fortran and/or MATLAB (or similar), some involving co-simulation between the two, and are bespoke to the problem being solved.
6. Modelling the Neutral Section Behaviour
Very little published material is specifically directly related to the simulation of neutral sections subject to the pantograph passage. The approach taken for this study then was to first achieve a satisfactory simulation of OCL/pantograph interaction (‘plain’ OCL without any specific features), and then to include the elements modelling the neutral section into the OCL model. An incremental approach was taken, validating the simulation output at each step before proceeding, see
Section 7 below.
The decision was made to use a proprietary finite element analysis tool, rather than create custom code in MATLAB or equivalent environment. The reasoning for this was based on a number of factors. Significant amongst them was the ability to experiment with a variety of approaches by simple adjustment of parameters and switches in the execution of the script, rather than having to rewrite code. Such parameters and options included: linear or non-linear analysis, integration type, iteration convergence criteria, numerical damping, non-linear and bi-linear stiffness (and other physical parameters), contact modelling scheme, etc. A number of commercially available Finite Element Analysis (FEA) tools are available on the market, and of these Ansys was chosen, due to the large installed product base and wide availability of support. There is not a large volume of material from researchers using Ansys for this type of analysis, but one of the most applicable is that from Sheffield University [
27].
The choice made was to use Ansys Mechanical apdl, run from a script. The only significant downside was in the computational cost (i.e., run time). The best performance available was achieved by reducing the model size, the volume of computation, and the quantum of results and output to only the minimum required for the study in hand.
The behaviour of a neutral section will be governed by a number of factors, being:
The characteristics of the OCL tension length in which it is situated, in particular those on the approach to the neutral section;
The characteristics of the insulator components inserted into the OCL at the neutral section;
The characteristics of the joints between the insulator components and the contact wire of the OCL.
The characteristics of any connections to the neutral section insulators (e.g., anti-torsion elements).
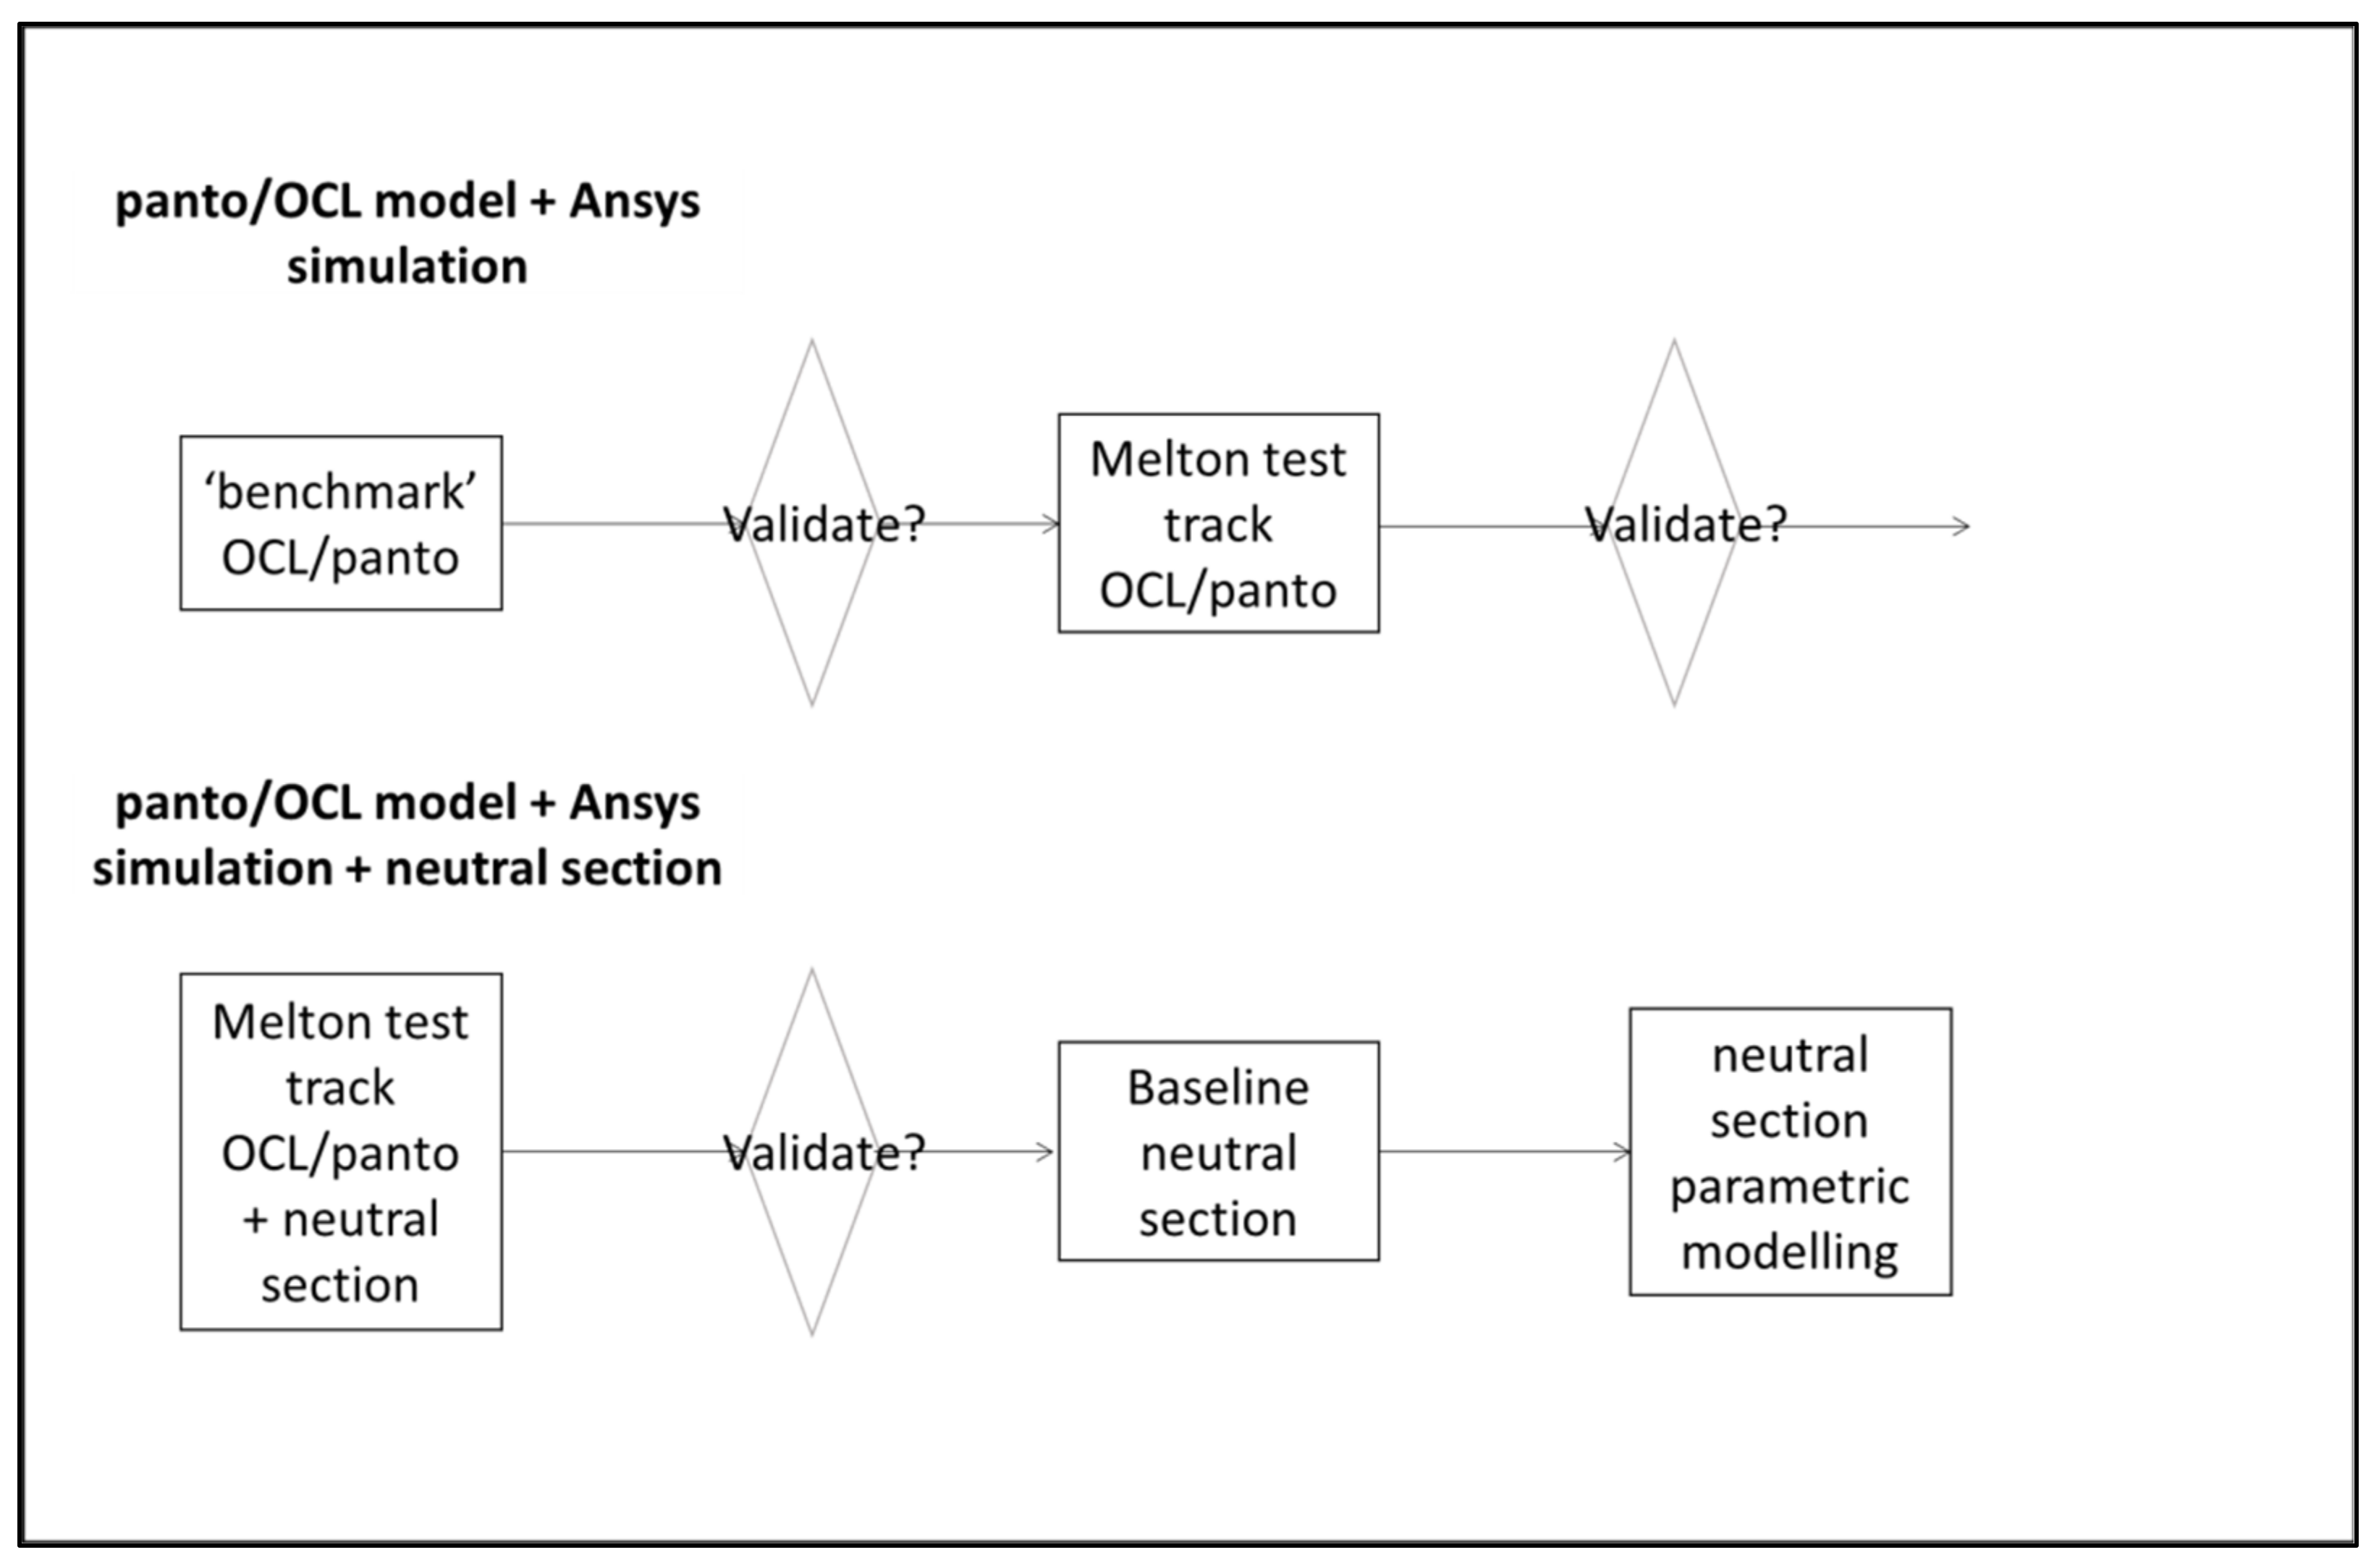
Consequently prior to modelling the interaction of the neutral section with the pantograph, first the ‘plain’ OCL must be satisfactorily modelled. As has been described in
Section 6 there is an amount of current thinking in modelling the OCL-pantograph interface to draw from, and then build upon. Without wanting to reinvent the work done there, and allowing predominantly to concentrate upon the neutral section problem, as far as possible the dynamic simulation method sought to use previously validated approaches and adapt these into the Ansys model. The flow of the analysis and validation work undertaken is shown in
Figure 6.
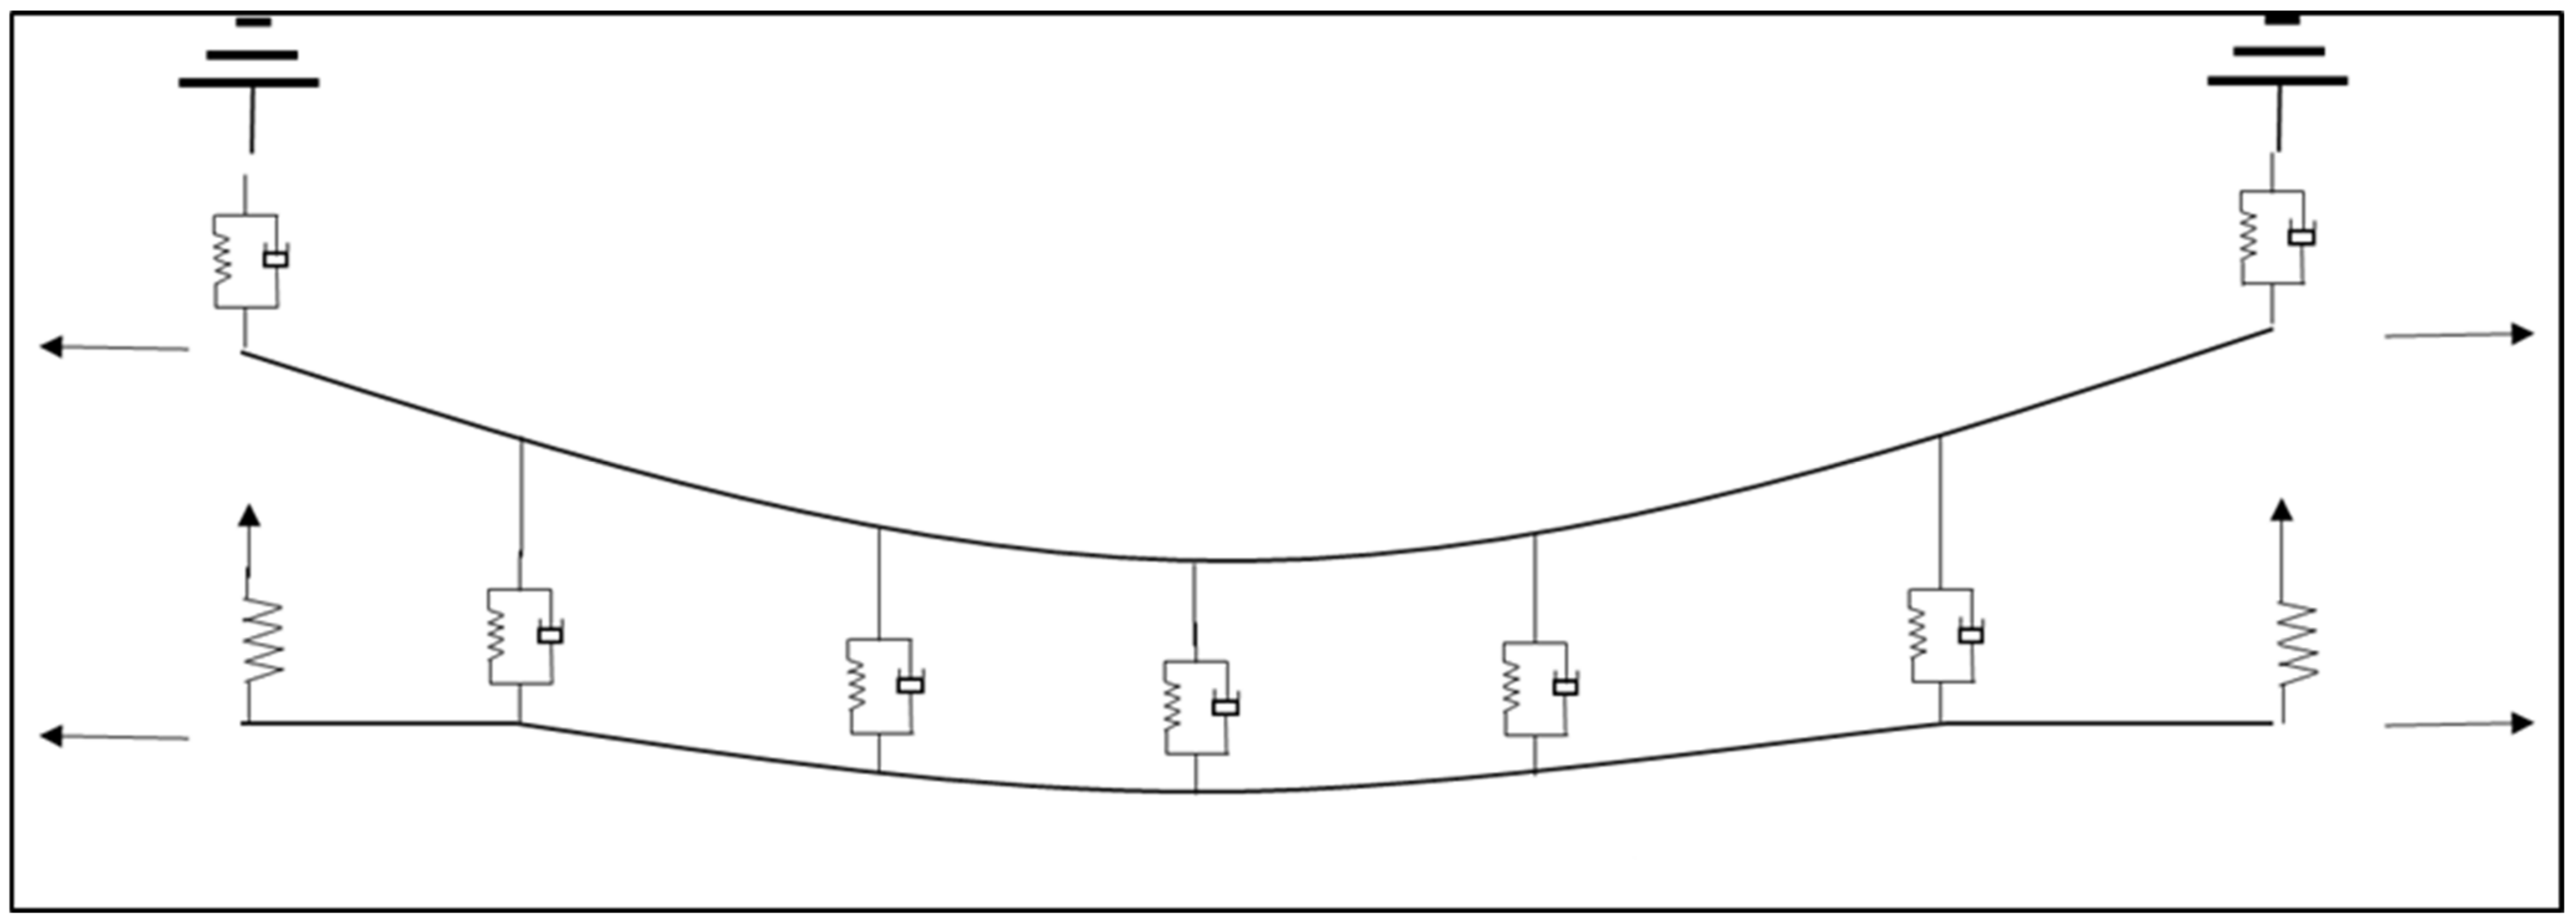
The OCL-pantograph simulation requires the modelling of the rigid multi-bodies (the pantograph) and elastic elements of the OCL (the contact and messenger wires). The basic representation of OCL is shown in
Figure 7. In undertaking the simulation, the following features of note were developed experimentally and adopted.
The CW and messenger wires are modelled as beams with a circular cross section, equivalent to the section properties of the real CW and messenger.
They are modelled as non-linear Timoshenko beams, which formulation has the additional shear deformation term over the Euler–Bernoulli beam. The non-linear analysis requires an iterative solution, and convergence criteria are chosen to achieve convergence in typically three steps.
Droppers are modelled as non-linear spring damper elements, with zero stiffness in compression. The stiffness in tension of the dropper wire is calculated from the effective elastic modulus of the braided wire which, being a ‘mechanism’ rather than a homogenous material, is based on a proportion of the parent material modulus, as the dropper is not heavily loaded in relation to its tensile strength (unlike the messenger wire stranded conductor).
Other material properties, e.g., elastic modulus, density, Poisson’s ratio are taken from the values for the relevant material specification.
The initial static geometry of the OCL is calculated using the known tensions and masses of the CW, messenger and droppers, using the two-model principle, where the CW profile is used to determine the loads in the droppers, and the dropper loads are then applied to the messenger to derive the messenger profile, and hence the dropper lengths. The mass of the dropper is a function of length, and so the solution is iterated for this. There are some assumptions made in this method, but accuracy is sufficient for good results and minimal nodal adjustment during initial equilibrium finding.
The longitudinal tension in both CW and messenger was set by ‘initial stress’. Creating tension by element longitudinal force was found to distort the geometry of the OCL model due to minor adjustments in nodal position arising in initial equilibrium finding, and which caused a component of tension along the dropper, and hence tension was lost from the CW successively at each dropper in the model. Using initial stress corrected this.
The initial geometry of the OCL was used to generate the nodes for direct generation of a multi-span 2D model. Element lengths were experimented as regular, fine and super-fine (250, 500 and 1000 mm) and a three element beam with an inter-nodal length of around 500 mm was chosen, where this element length had a natural frequency well above the frequency range of interest of 0–20 Hz.
Damping of real world OCL is low. Experiments were conducted in applying damping to various elements of the OCL model using Rayleigh proportional damping, and alpha and beta values of 0.1025 and 0.0001 respectively in both the CW and messenger were found suitable.
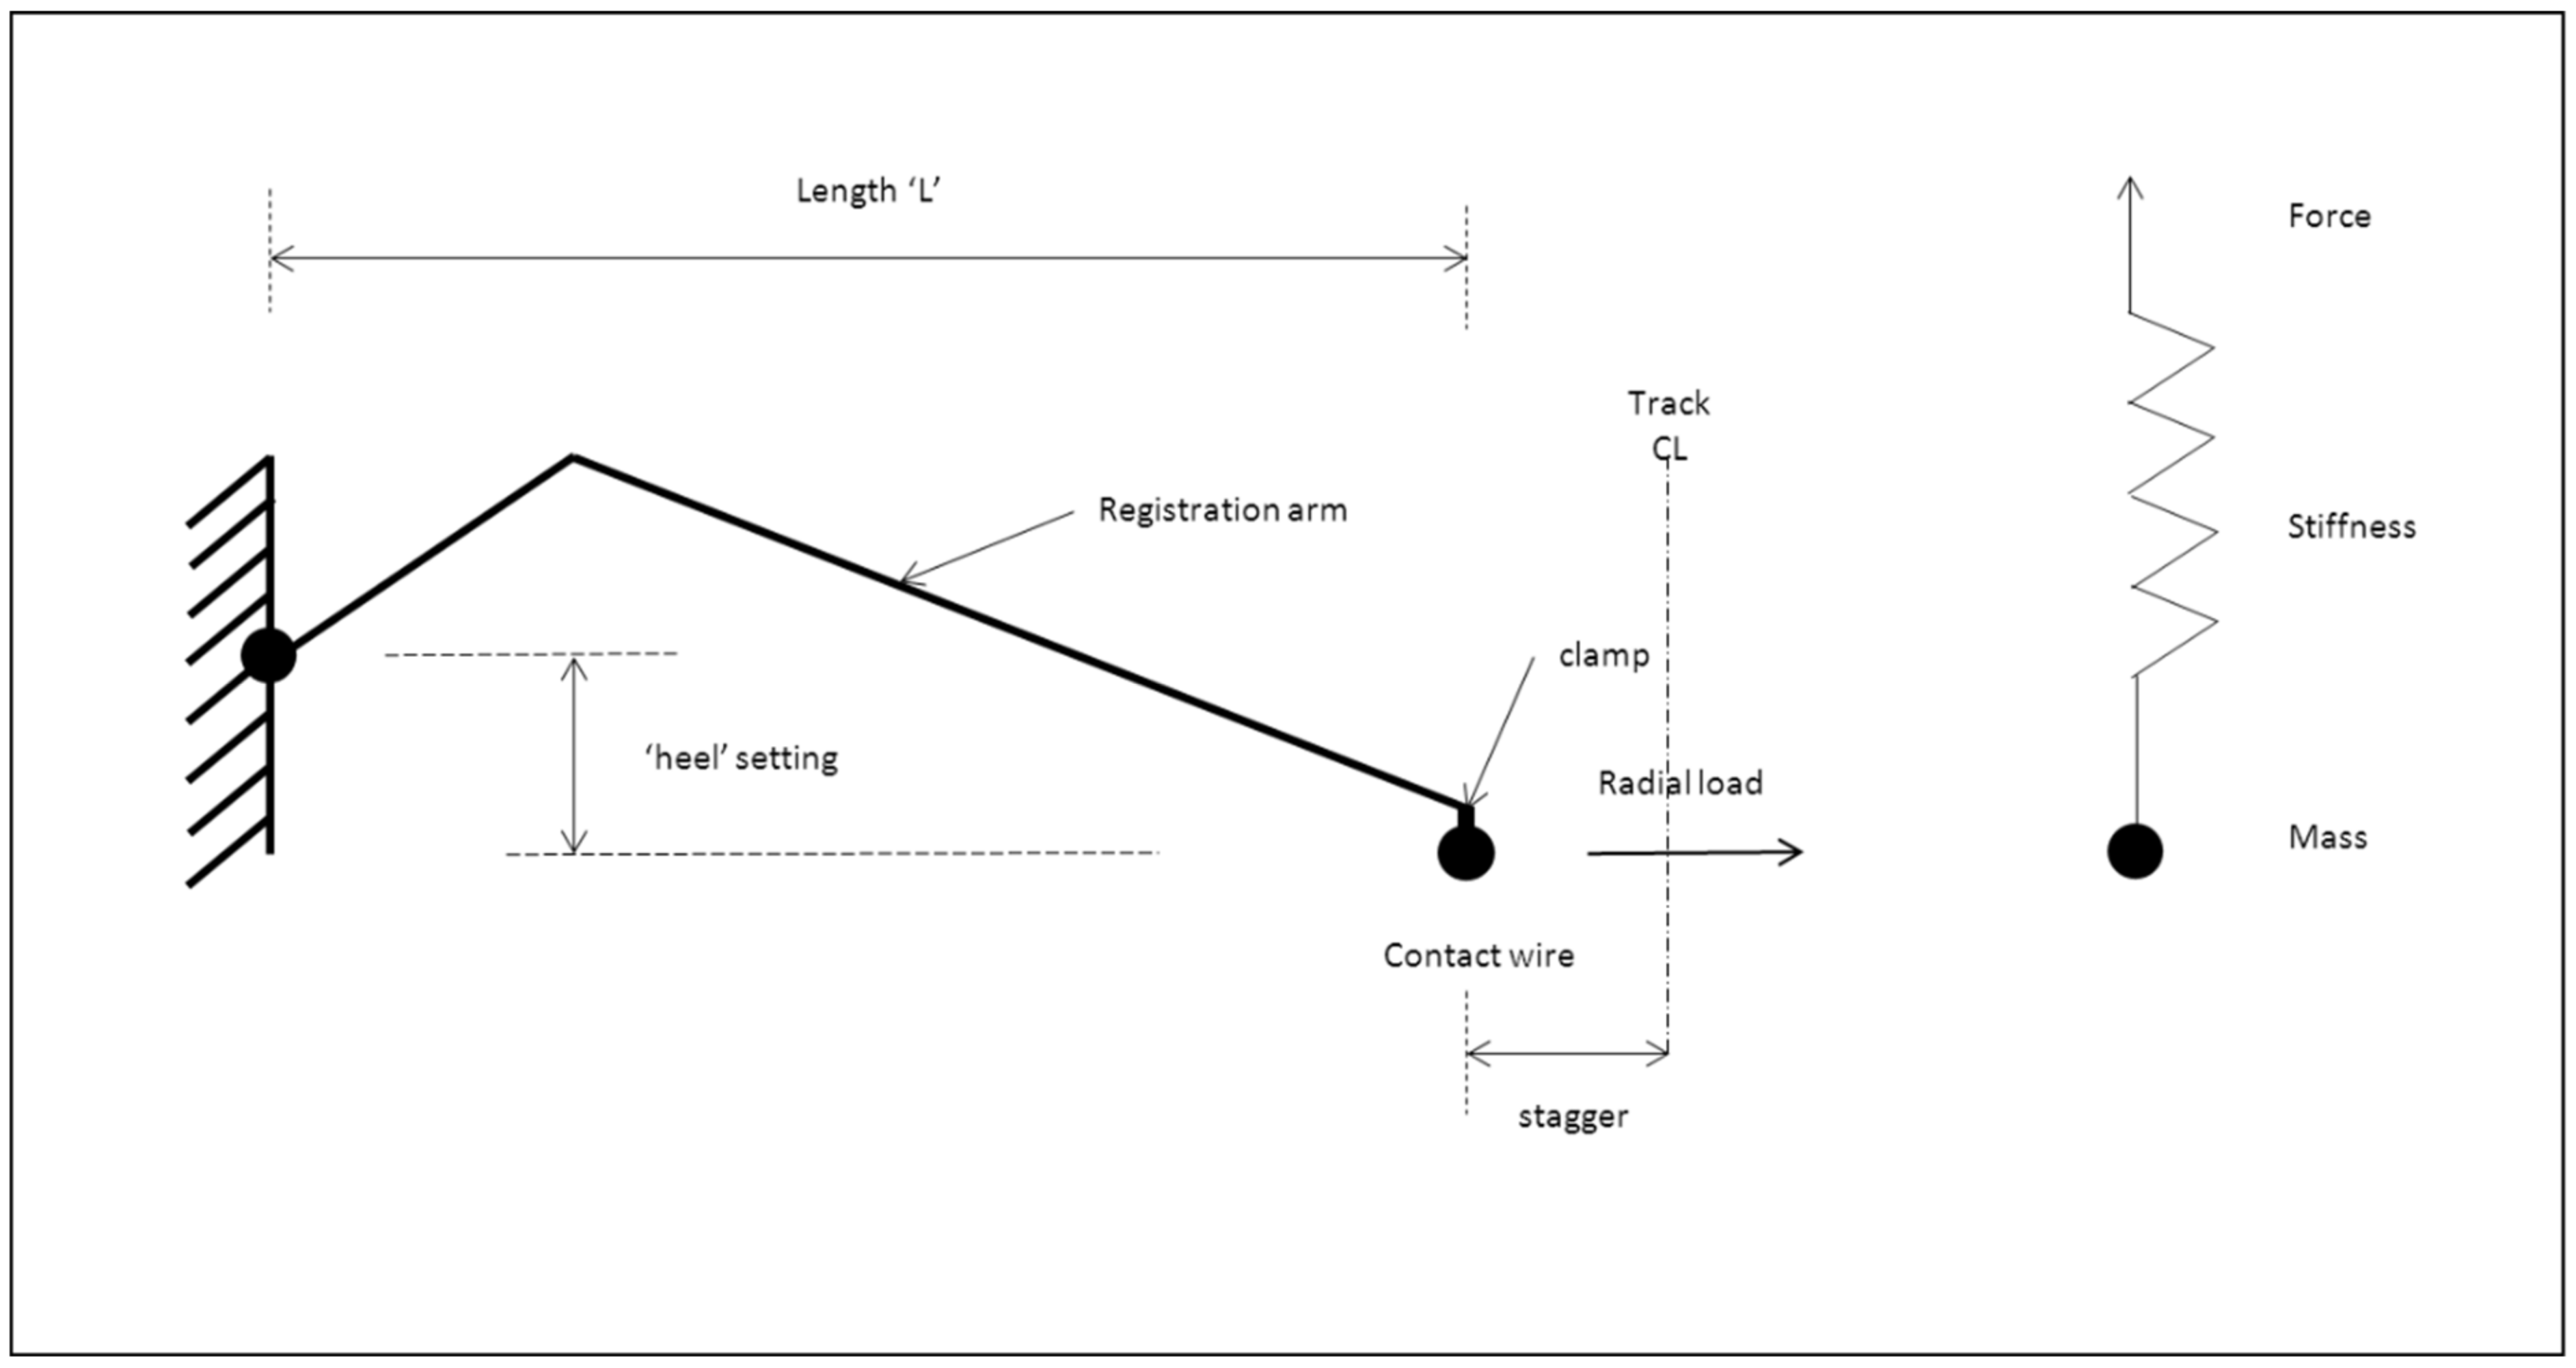
The effects of registration arms on OCL dynamic behaviour are quite significant, and in a 2D model need to be explicitly input as the equivalent registration arm effects to achieve a satisfactory simulation (the registration arm can only be truly represented in the third dimension). The vertical force (from radial load and ‘heel’ setting), the arm pendulum stiffness, and arm mass constitute these effects (see
Figure 8).
Contact between the CW and the pantograph head is modelled using the ‘Penalty’ method. The penalty stiffness is determined experimentally, and needs to be set such that the resulting pantograph head natural frequency is separated from the frequency range of interest of 0–20 Hz.
The 1D pantograph model was created using point mass and spring-damper elements, and vertical forces representing the pantograph static uplift force and aerodynamic augment, and was constrained in all degrees of freedom other than vertical. Parameters were given (for the EN 50318 models) or taken from manufacturers data for real pantographs, and in particular the RSSB report T1105 [
28] which gave mass-spring-damper (lumped parameter) models for majority of UK pantographs (see
Figure 9). The Brecknell Willis BW HSX250 pantograph used for one of the models has a non-linear pantograph head stiffness and bump stops. An expression for the stiffness was derived, and the bump stops represented as very high values at the extremities of the non-linear stiffness, in tabular format (which can be used by Ansys), see
Figure 10. However it was found that in practice the pantograph head movement was constrained within an approximately linear section of the curve, and a constant value of stiffness produced satisfactory results. However the ability to represent non-linear pantograph head stiffness within the simulation method had been demonstrated.
A Newmark integration scheme was used and to facilitate convergence, numerical damping using integration parameters of Beta = 0.3025 and Gamma = 0.600 were applied, although higher values were used during an initial settling down dynamic load step (i.e., before pantograph linear movement applied).
To accommodate the frequency range of interest of 0–20 Hz, and allow for possible extension to higher frequencies in future, a sampling frequency of 200 Hz was chosen (integration time step of 0.005 s). This produced an acceptable compromise of accuracy and computational cost.
Before the dynamic simulation commences, initial contact between the underside of CW and pantograph head is made, using the effect of the pantograph static uplift force and the natural sag of the CW between nodes during equilibrium finding.
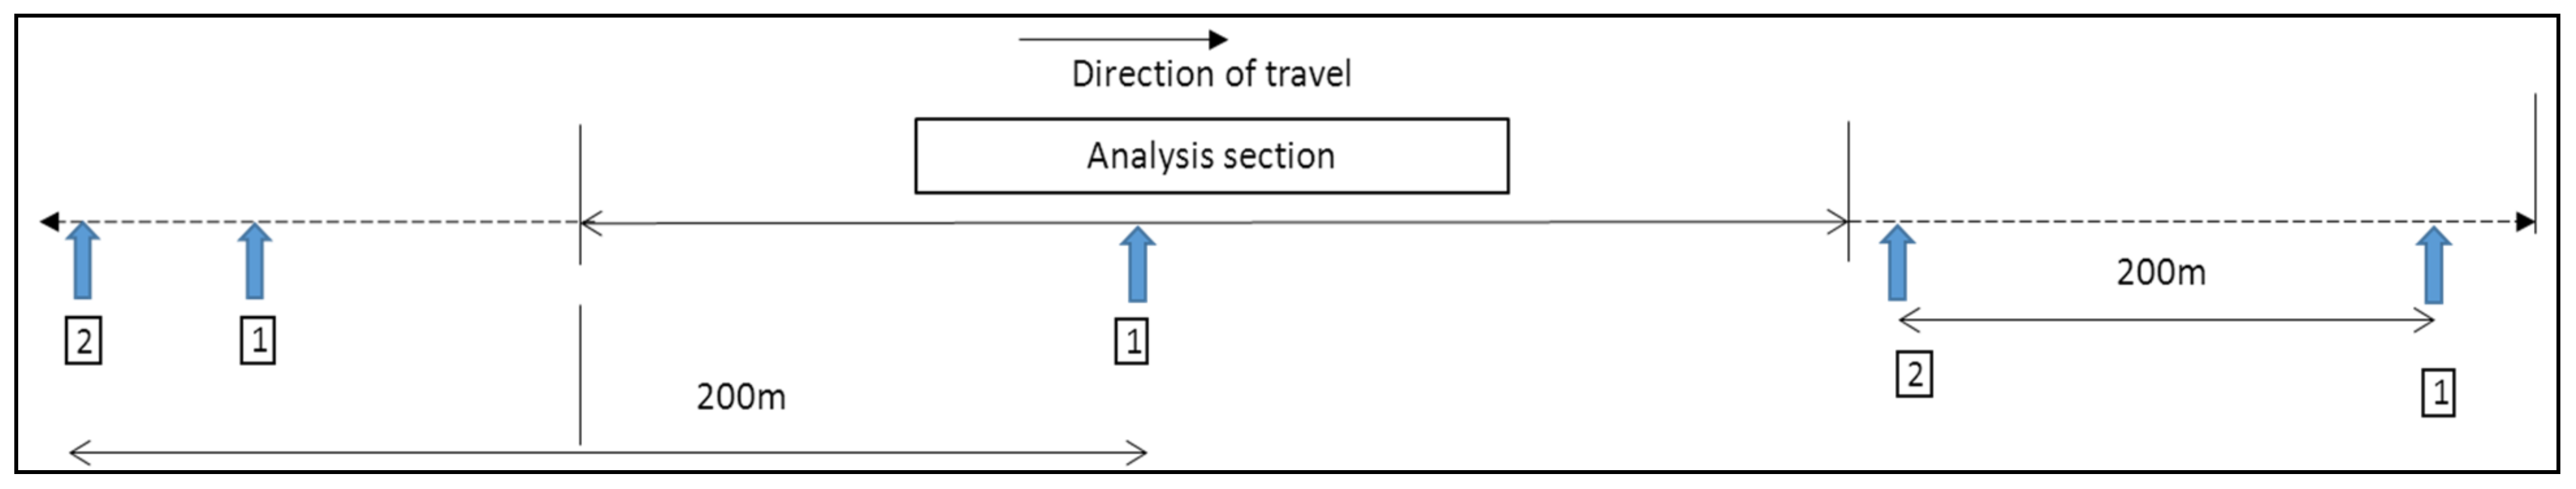
To represent two pantograph operation, an ‘hybrid’ scheme using both time and distance separation was developed, to give the best compromise of accuracy and computational cost (model length). In this scheme the two pantographs are initially very close together, and the trailing pantograph is kept stationary until a time interval during which the leading pantograph has travelled a fixed distance equivalent to the operational pantograph spacing, after which both pantographs move in unison at this fixed separation, until the trailing pantograph has exited the analysis section of the OCL model. See
Figure 11.
It is considered that the neutral section is made up of elastic and rigid or solid elements (depending on the approach chosen). In particular it was proposed to model the various splices, connecting the insulating elements to each other and to the contact wire at each end, as joints with their characteristics developed from actual test in the laboratory, rather than extracted theoretically from their design drawings. The neutral section model consists of seven flexible elements and thirteen joint/force elements.
The parameters to be investigated are mean and peak force and vertical uplift (displacement) as the pantograph passes.
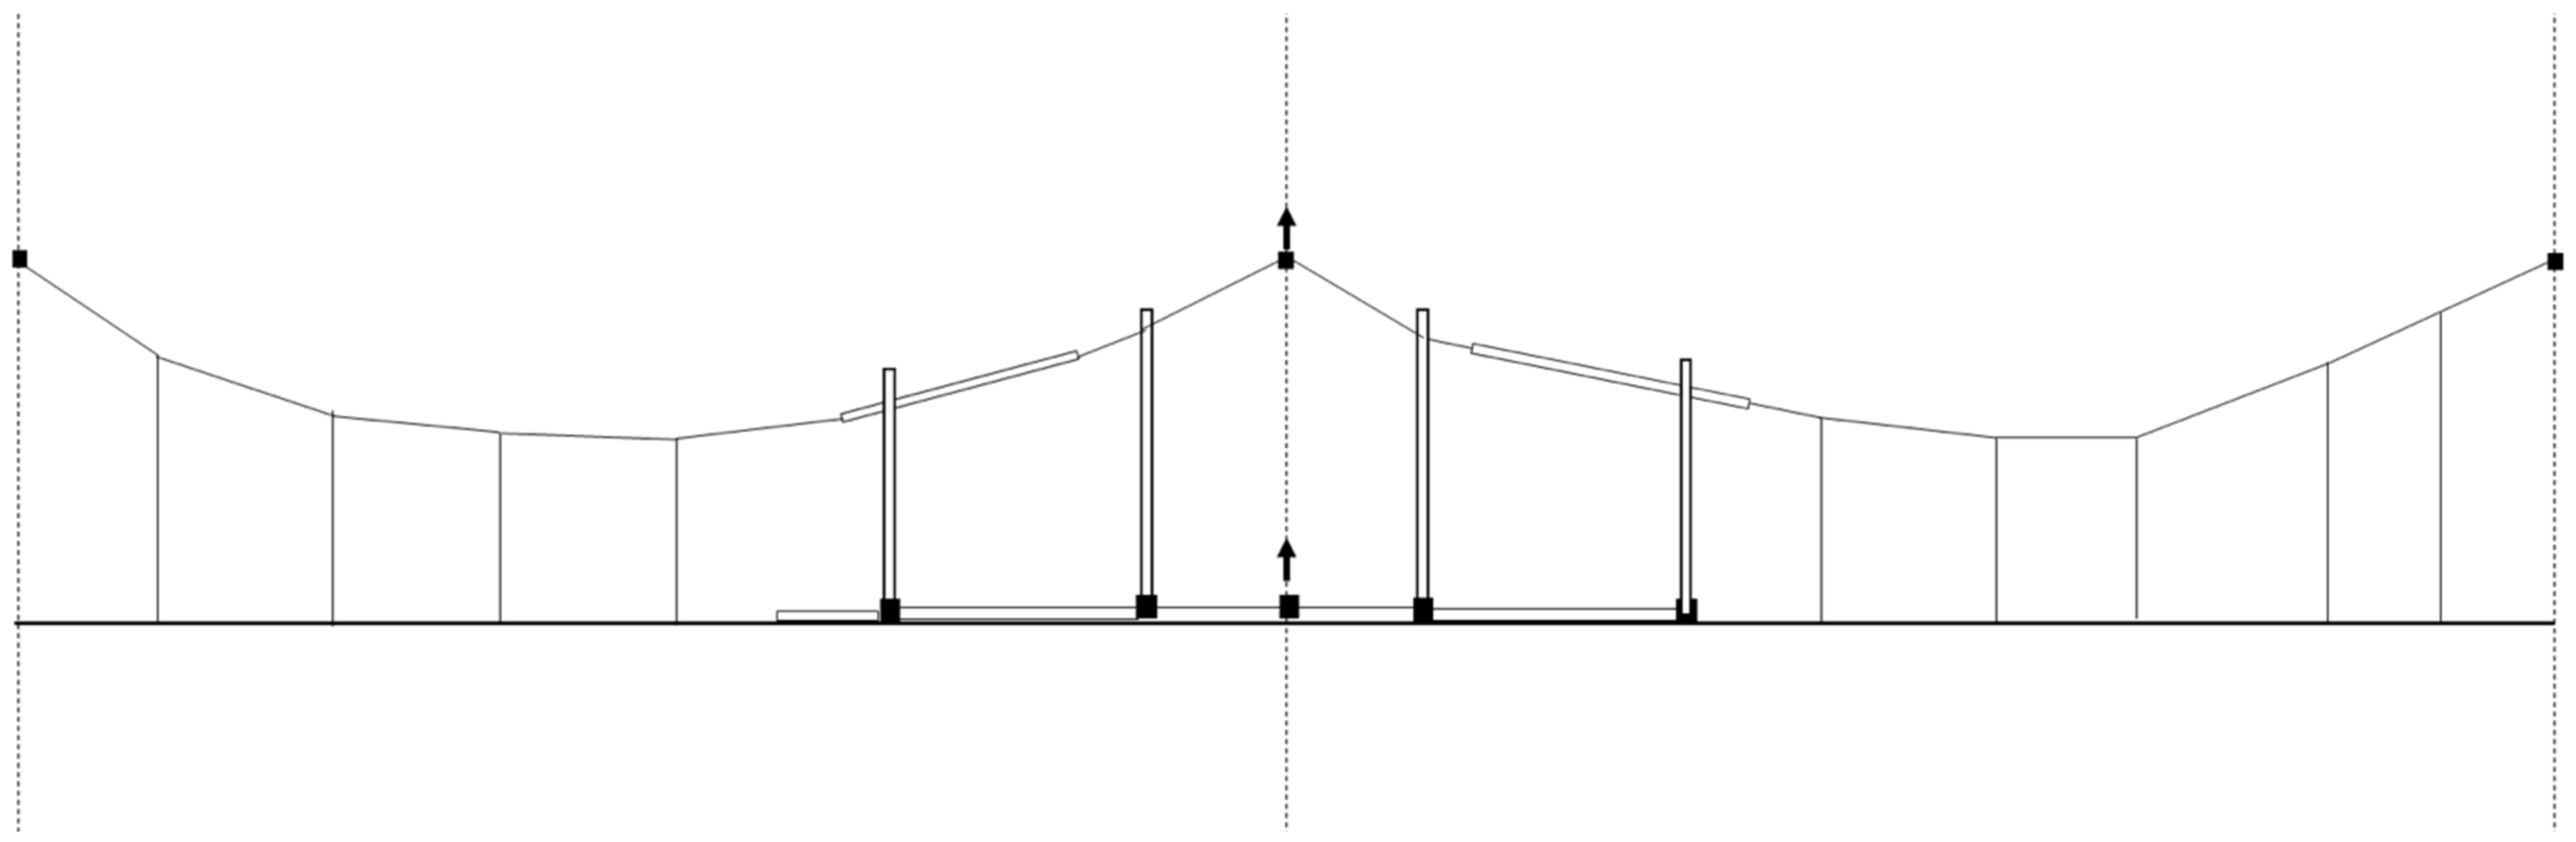
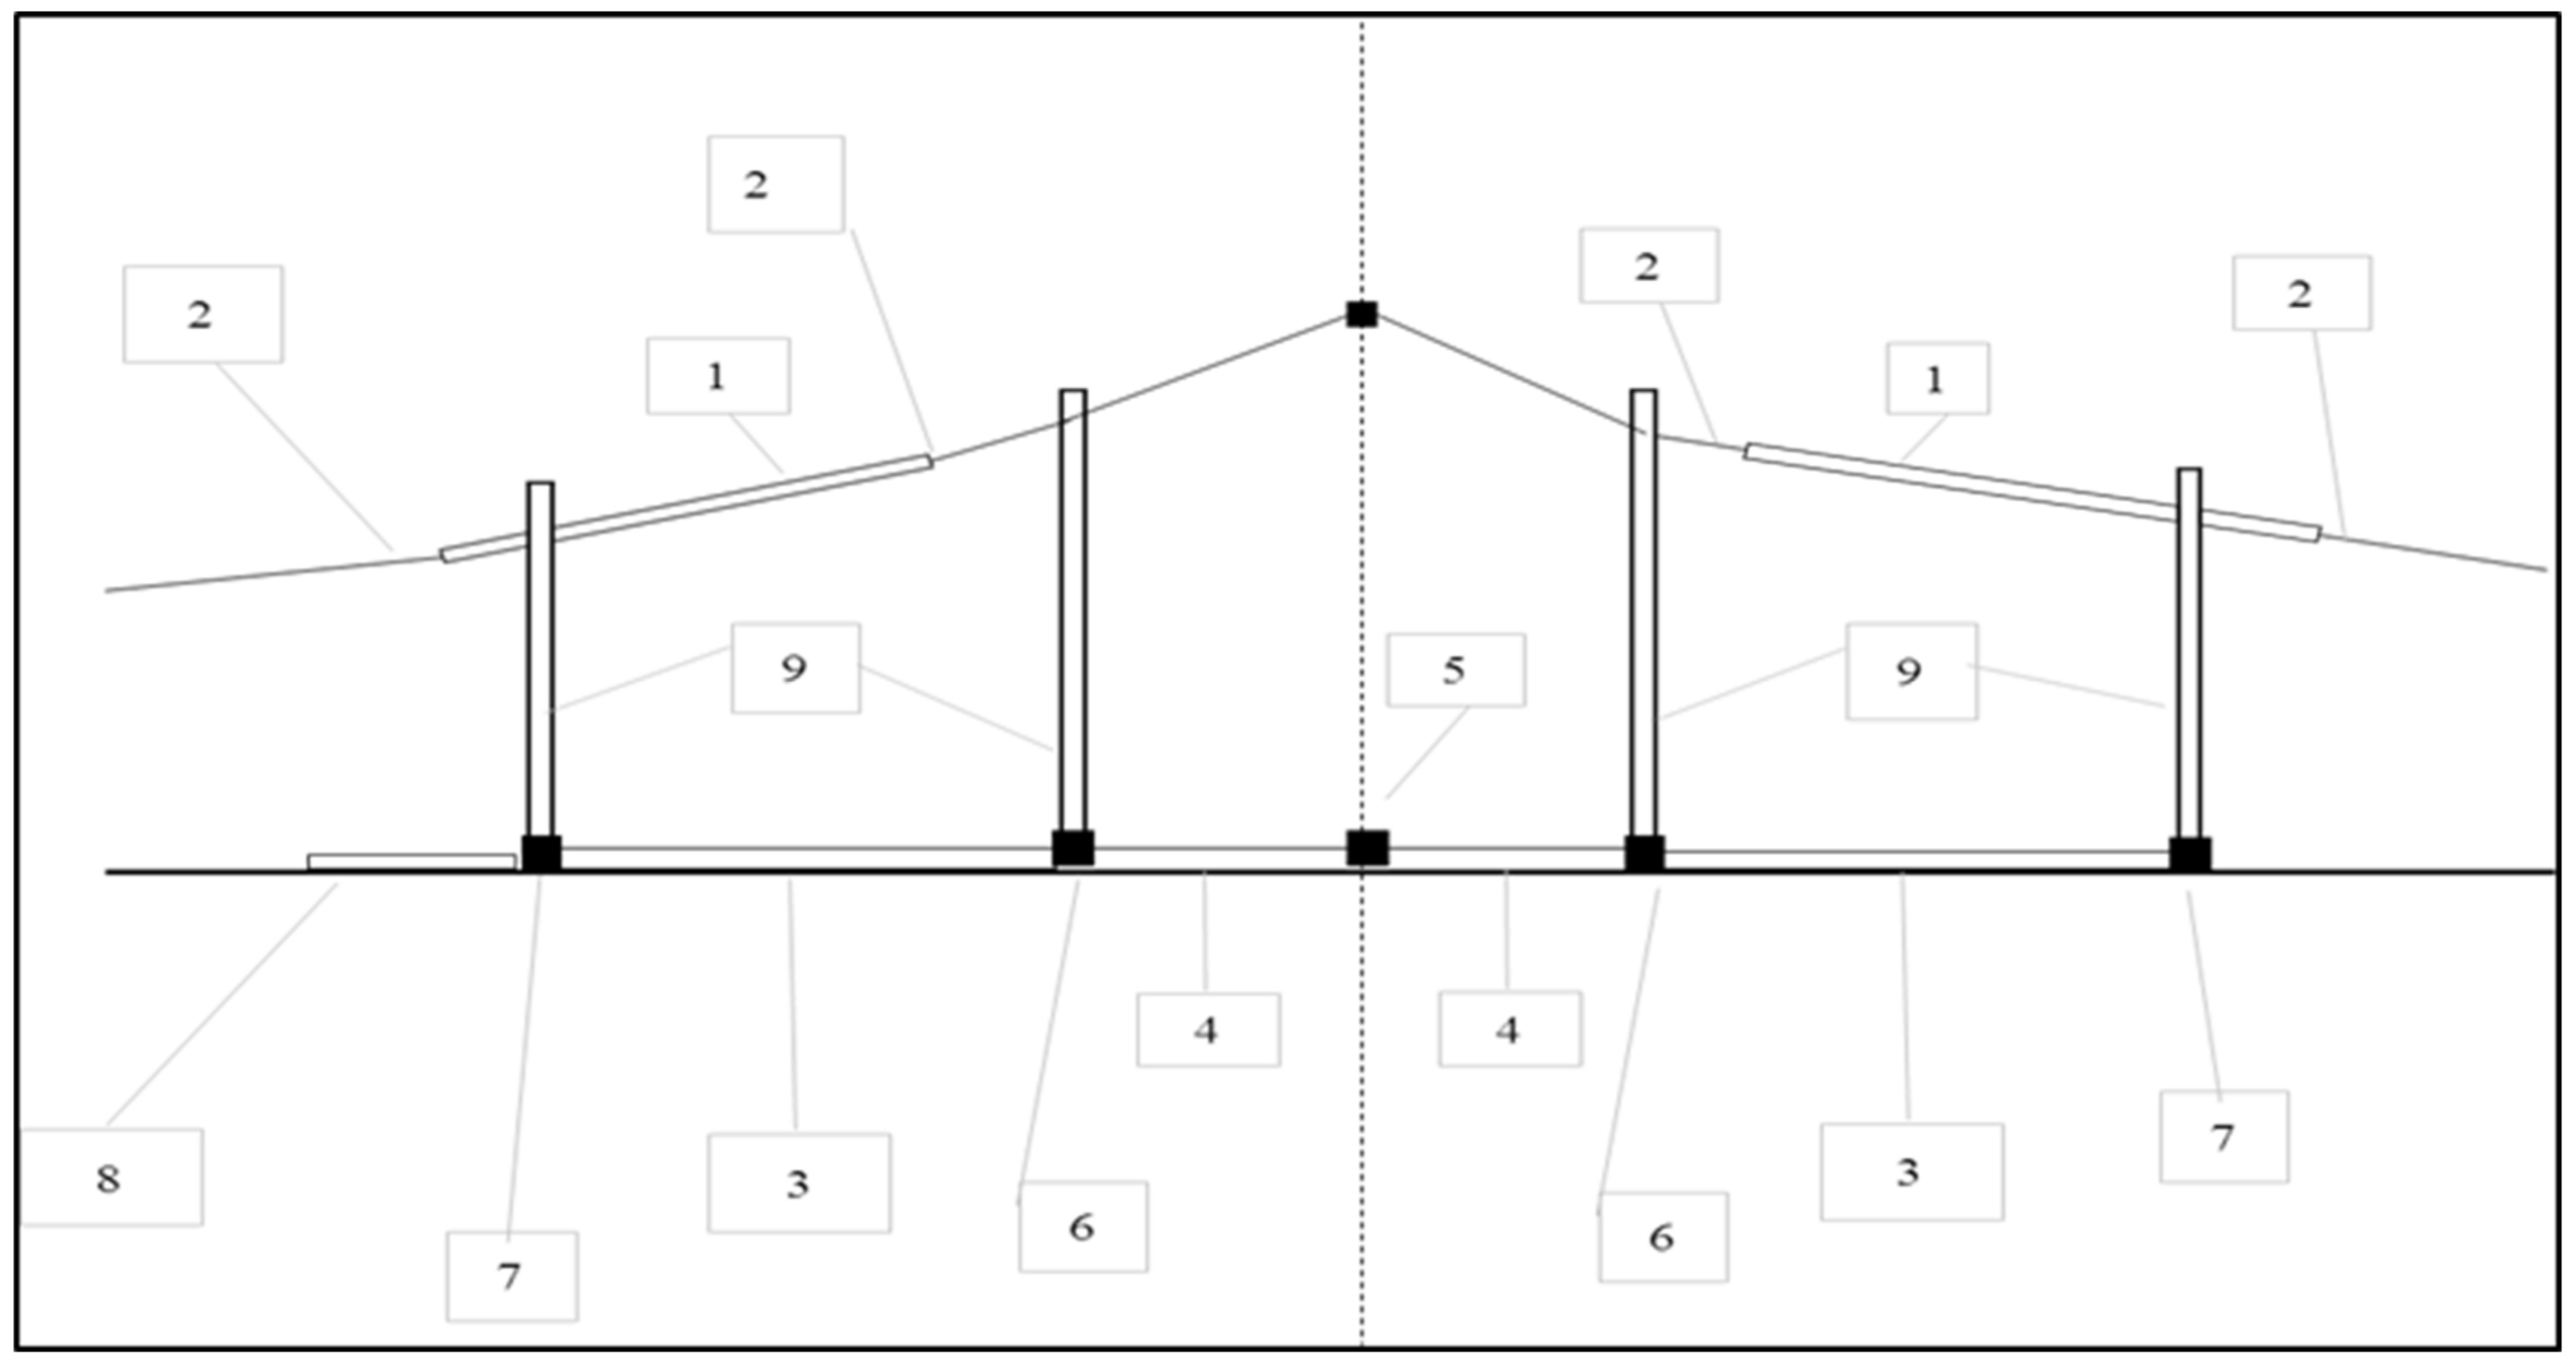
The neutral section is an assembly of components installed into otherwise regular OCL. Diagrammatically the neutral section installed in a two span section of OCL is shown in
Figure 12, the actual neutral section installed on the Melton test track is shown in
Figure 13, and the significant features of the neutral section are identified in
Figure 14.
The following description refers to
Figure 14 and the numbered items therein. The messenger insulator (1) is a PTFE coated GRP rod of outer diameter 21 mm with a 14 mm GRP core. It is 2750 mm long and weighs 3.2 kg. It is attached to the messenger wire by a ‘forked collar’ end fitting (2) at each end. The CW insulator (3), (4) is similar to the messenger insulator, but with an external diameter of 24 mm, but the same core of 14 mm. Each insulator PTFE/GRP rod is terminated in a stainless steel end fitting. There are two CW insulator forms, the long and the short. They differ only in the length of the composite rod sections. The long insulators provide the primary insulation at each end of the neutral section, the shorter rods act as continuity pieces in the centre section, and are, at least at the stainless steel end fittings, earthed. Item (5) is the centre connector, and carries a fitting that mimics the CW profile, to allow a registration arm to be attached. Item (6) is the inner connector, which carries a small arcing horn and allows the lower end of the spring dropper tube to be attached. At both ends the connection to the regular CW is made by a composite cylindrical ferrule which is formed into a vertical plate at the outer end (7), with holes aligned to take one half of a contact wire splice. At the entry end, in addition, there is a ‘lever arm’ device (8) which consist of a 25 mm diameter stainless steel tube, approximately 910 mm long, fitted from the CW splice outwards, and mounted above the CW. The spring dropper tubes (9) are stainless steel tubes, with an internal spring connected to a forked end rod at the bottom. They are connected at the top to the messenger insulators directly. At the lower end, the forked end fitting of the sprung rod connects to the inner connector pieces.
Experiments were conducted with different approaches to modelling these neutral section components in the Ansys OCL model. These included:
Modelling all components as elastic elements with continuous connections via shared end nodes
Using the Ansys multibody analysis multi-point constraint elements and rigid bodies, with genuine Ansys ‘joints’ at the connections
Using simplified representations of the components connected using Ansys torsional spring-damper elements to represent the joint stiffnesses
Using simplified representations of the components connected using small elements of high elasticity to represent the joint stiffnesses.
Ultimately, it was the last of these which proved the most satisfactory.
The components in the line of the CW were all modelled as either solid or hollow cylinders, with the material and section properties manipulated so that they were equivalent to those of the actual component represented, and all section centre lines were offset from the CW axis so that their undersides were aligned with that of the CW, to allow for continuity of the contact surface with the pantograph head.
7. Validation
The development of the dynamic simulation method, and application of these techniques to the neutral section problem requires a means of validation before any meaningful and robust conclusions can be made. In particular, it is helpful if the dynamic simulation output can be compared to results from a real life test and measurement, of an installation equivalent to that being simulated. A parallel exists within the field of EU Interoperability. It is a feature of the requirements for OCL assessment mandated within the Energy TSI [
22] that both simulation and line test results are considered. For a simulation method to be used in this way, its output must be first validated against line test data, in accordance with relevant European Standards [
8,
24]. Those European standards have also been used here.
The current version of EN 50318 [
24] includes sufficient data for to allow for a two stage validation process: firstly with some simple ‘imaginary’ data of typical OCL and pantograph, as a reference model (referred to as a ‘benchmark’), and secondly against real line test data for a representative section of OCL (3 types in fact allowing to choose the one most close to the intended usage) for which pantograph and OCL technical data is provided. Acceptable ranges of simulated output are provided. In our case however, there is access to real line test data.
Consequently for this work, a three stage validation process was adopted. The first stage was a comparison with the results for a simple sample of OCL given in the earlier 2002 (now superseded) version of 50318 [
31]. The publication of the revised version of 2018 [
24] occurred during the course of this work, and this gave the opportunity to validate the simulation against the slightly more sophisticated OCL models in that standard. Finally, as actual line test data was available to the research, from the test of Series 1 OCL [
32,
33] and Brecknell Willis HSX250 pantographs undertaken at Melton test track in UK, during 2016, a comparison against that data was able to be made. The data was collected by DBST on behalf of Furrer + Frey and made available by them for this work [
30].
The relevant parameters of the OCL and of the simulation conditions were adjusted accordingly for each set of validation tests. In all three cases, the simulation method employed produced output that was within the specified limits of acceptability specified in the standards, and are shown in
Table 4 and
Figure 15 for the EN 50318 benchmark test, and
Table 5 and
Figure 16 for the comparison against Melton line test data.
Only once the technique of modelling the OCL in Ansys and undertaking the simulation was completed and validated, was the actual OCL/neutral section/pantograph situation addressed.
Helpfully, the above mentioned Melton test track line test data also included data of the Arthur Flury single rod neutral section, which was incorporated within the test section, and this then also provided data for a validation of the neutral section model and simulation.
8. Analysis and Results
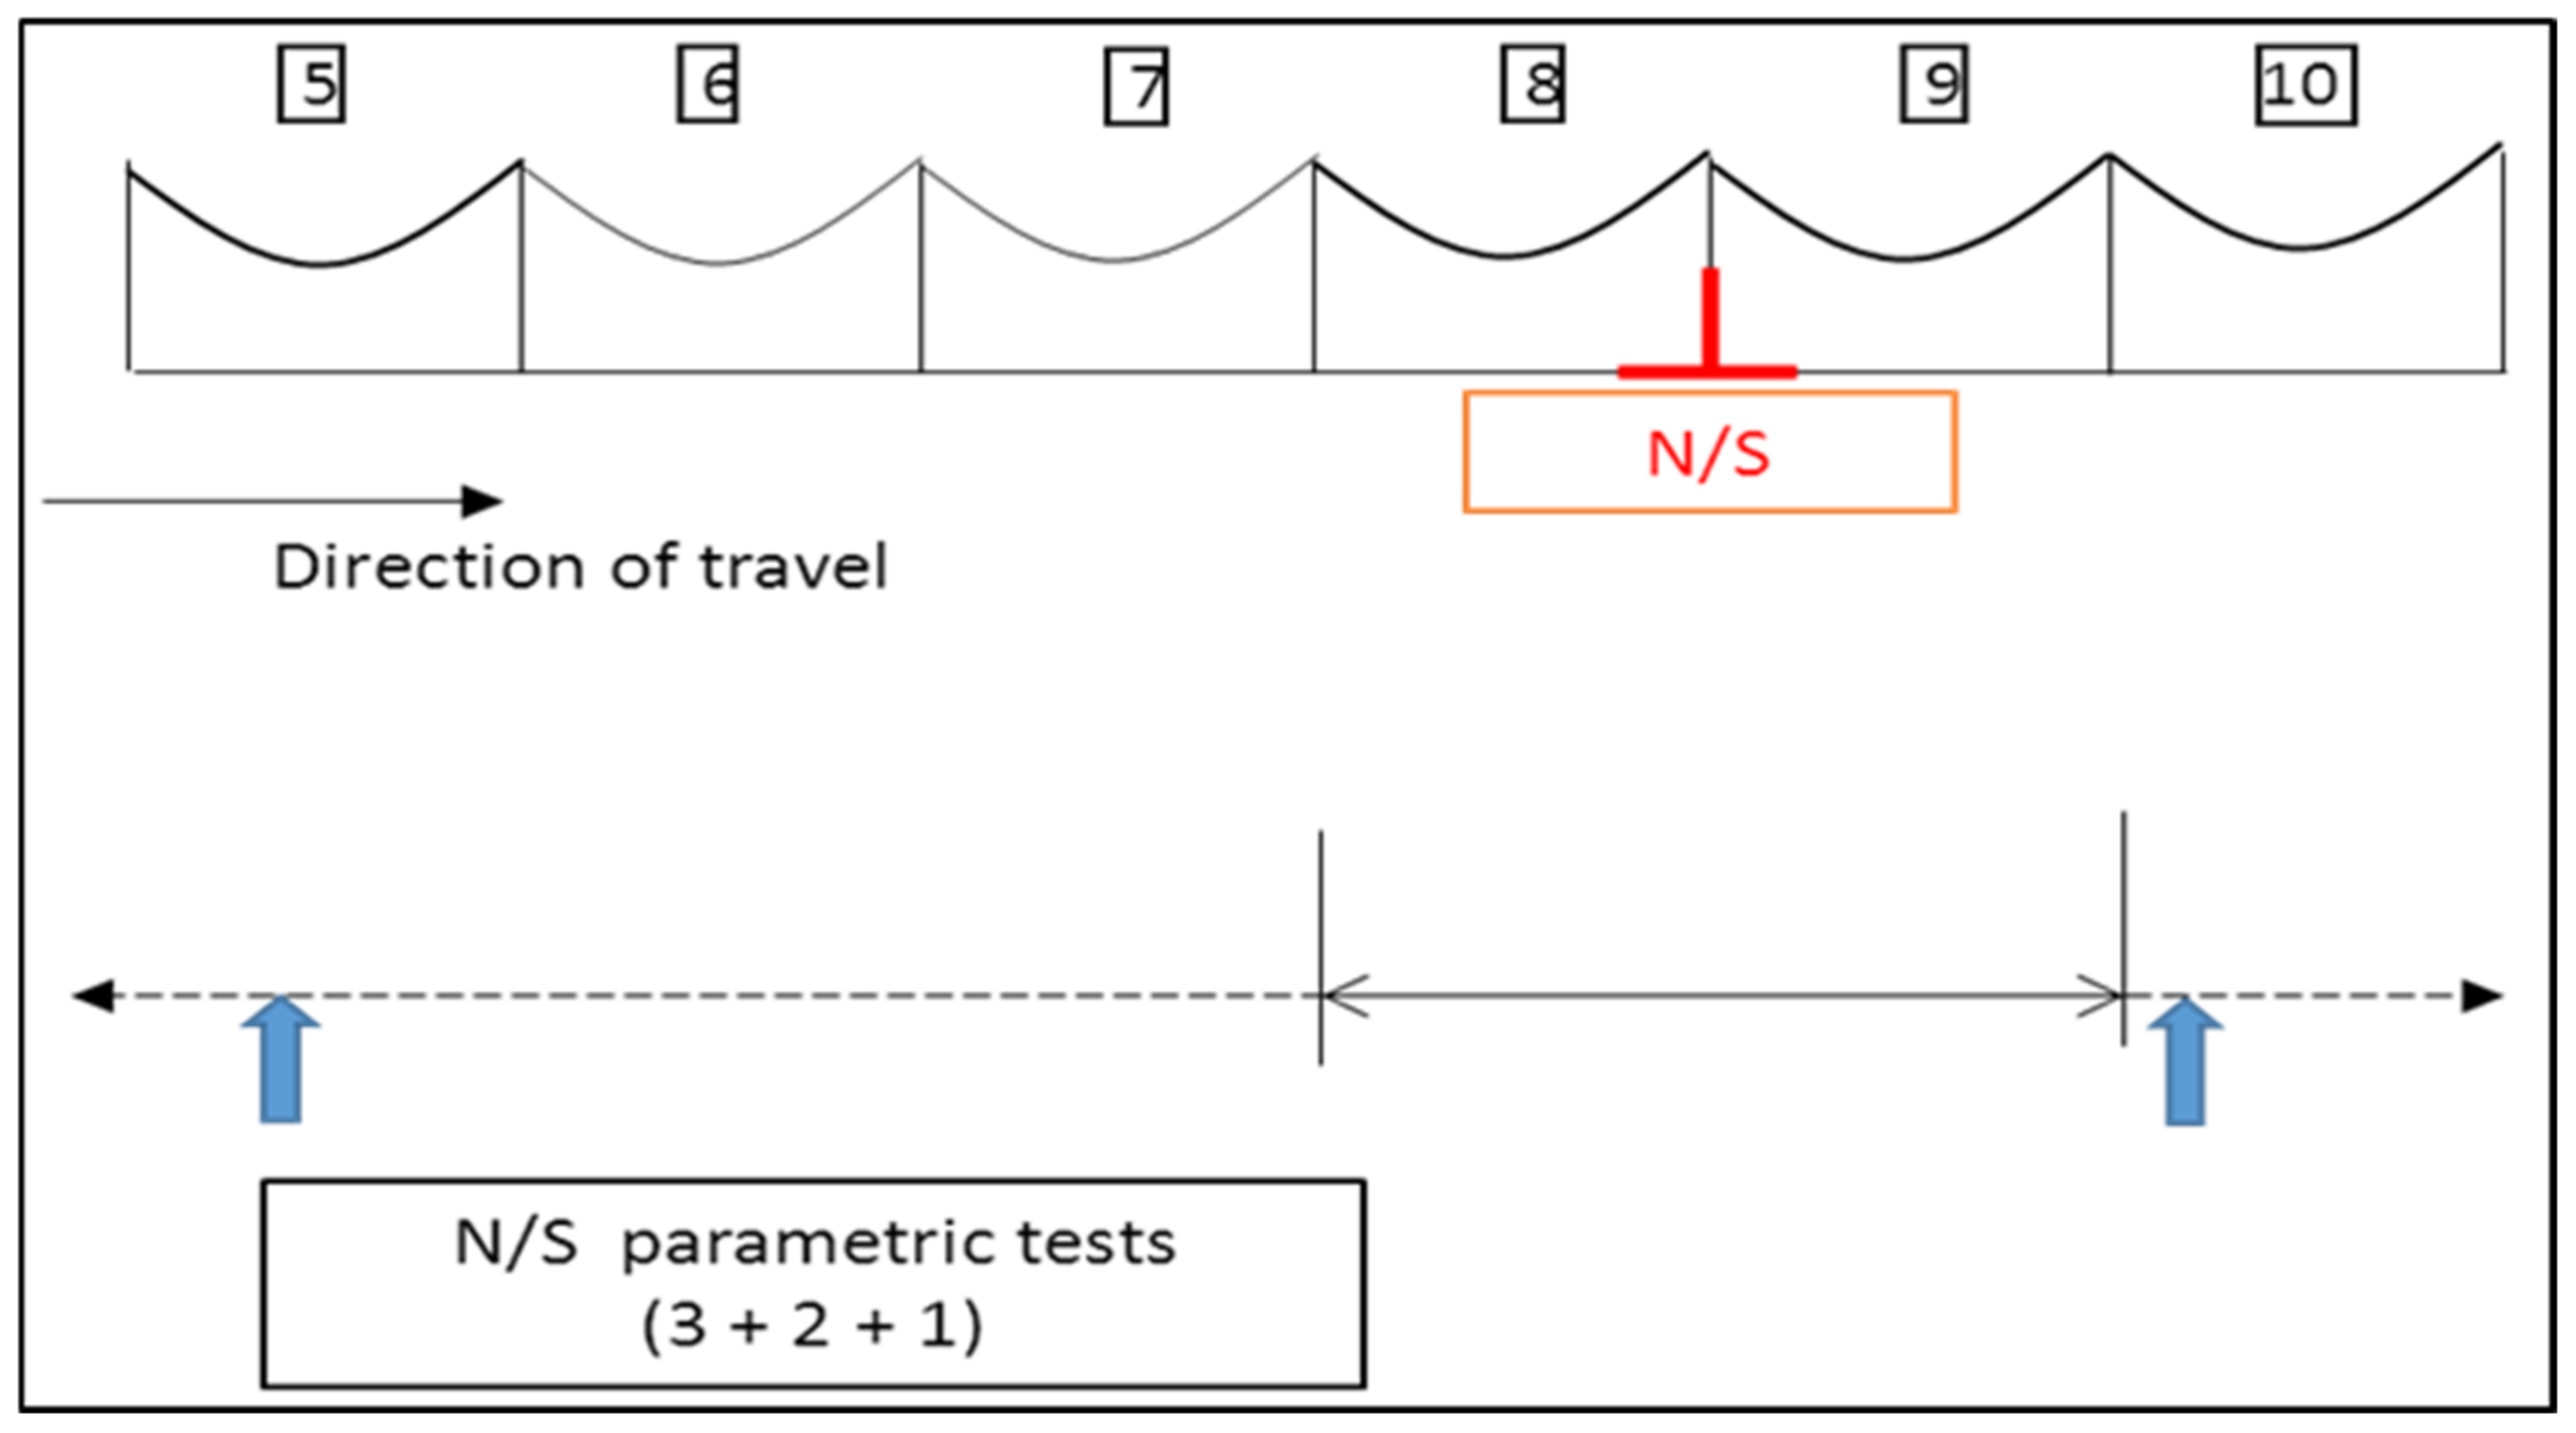
Having established a working model of the neutral section which delivered acceptable simulation outputs compared to the line test data from Melton, this model was used to test a variety of parametric adjustments, as ‘options’. The purpose of this was to not so much improve the neutral section as such , but to demonstrate that the method could be used to identify and test such potential improvements.
A limited number of such options were identified and tested. The criteria to be assessed in the comparison to the baseline were mean and peak contact forces, and vertical displacement of the contact point. These criteria were assessed within three analysis zones: (i) the two OCL spans either side of the neutral section; (ii) the two half spans either side of the neutral section; and (iii) the neutral section alone, between the first regular droppers either side. The analysis zone was situated in a 6 span OCL model, see
Figure 17.
For the baseline, a single pantograph at 200 km/h was used, similar to the HSX250, but with a reduced pantograph head mass to facilitate the higher frequency range of interest of 30 Hz (as well as 20 Hz) and the penalty stiffness chosen. Sampling frequency was 300 Hz.
For the sake of completeness, the options tested included both ‘realistic’ (readily achievable in real world) and ‘theoretical’ (e.g., changes to material properties) modifications.
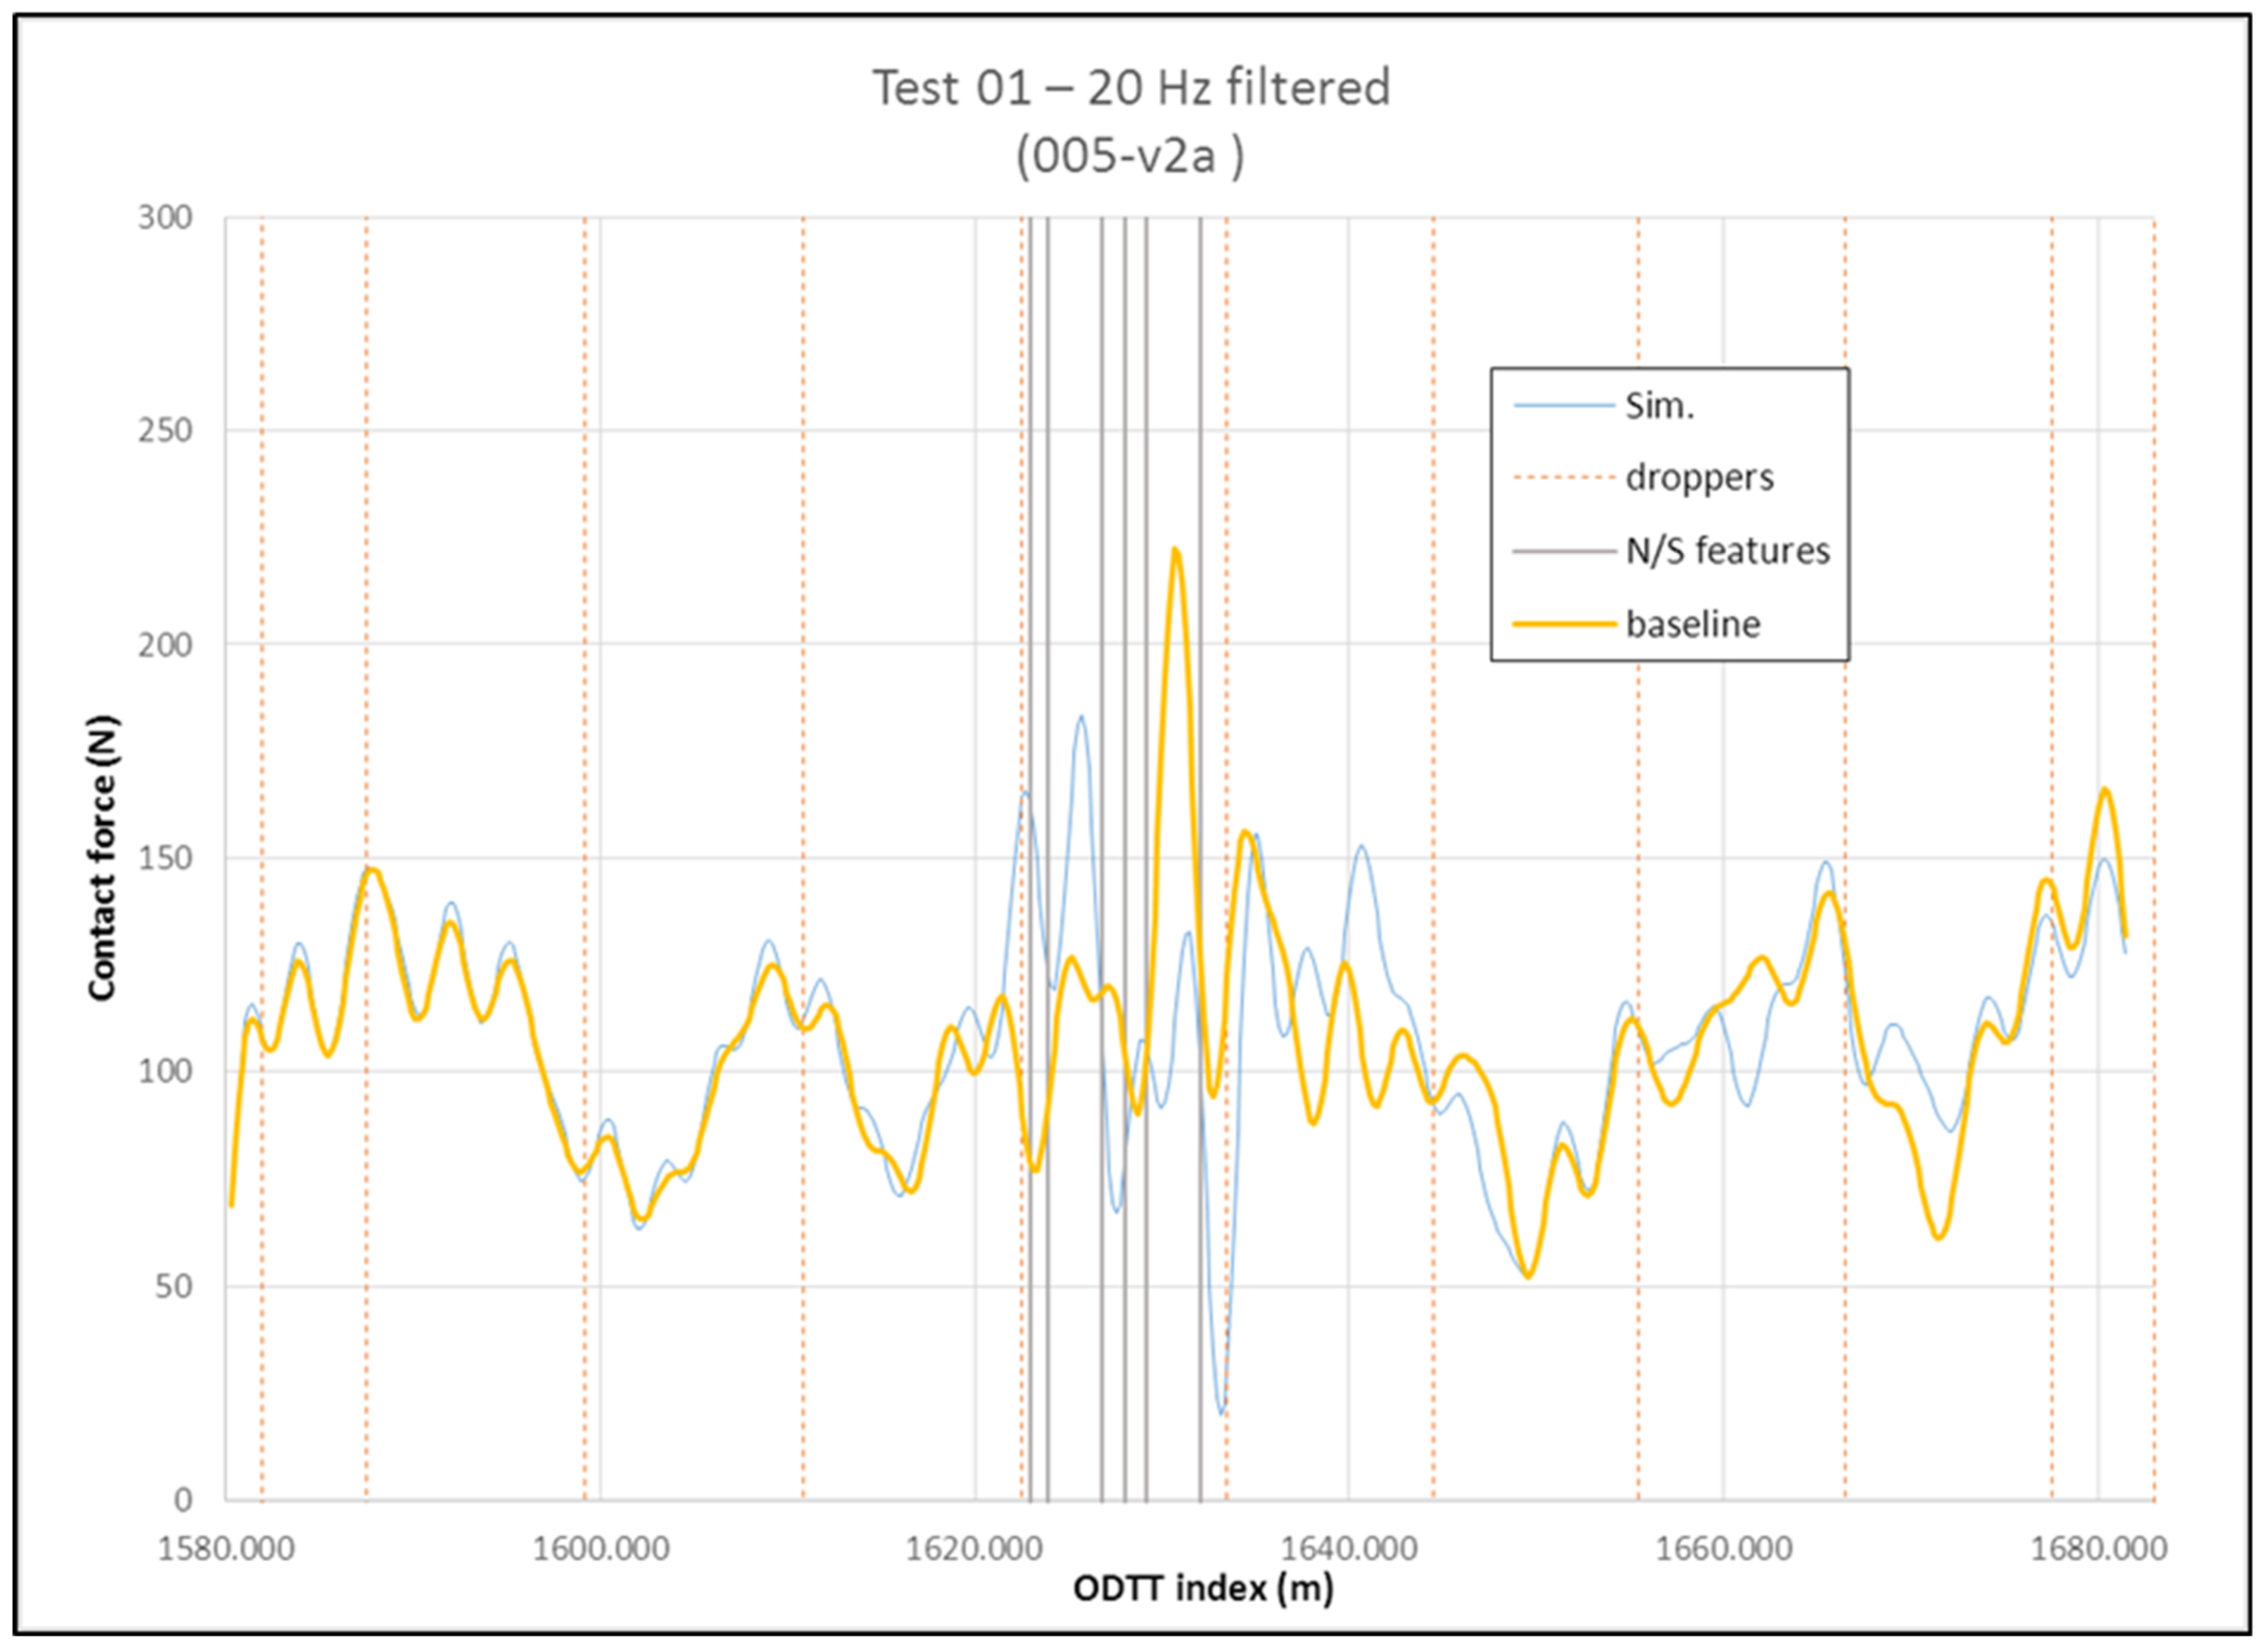
Figure 18 shows the comparison of one of the realistic options, of shortening the messenger insulator such that the outside spring droppers are not attached to it but to the messenger itself, in comparison to the baseline. The orange and blue lines are the baseline and option simulated contact force outputs respectively. It can be seen that the traces diverge after the first outside dropper, the location of the point of difference.
In terms of the assessment criteria, a number of proposals were found to be marginally better or neutral, some others were discounted for worsening performance, and one in particular, was found to significantly improve the performance.
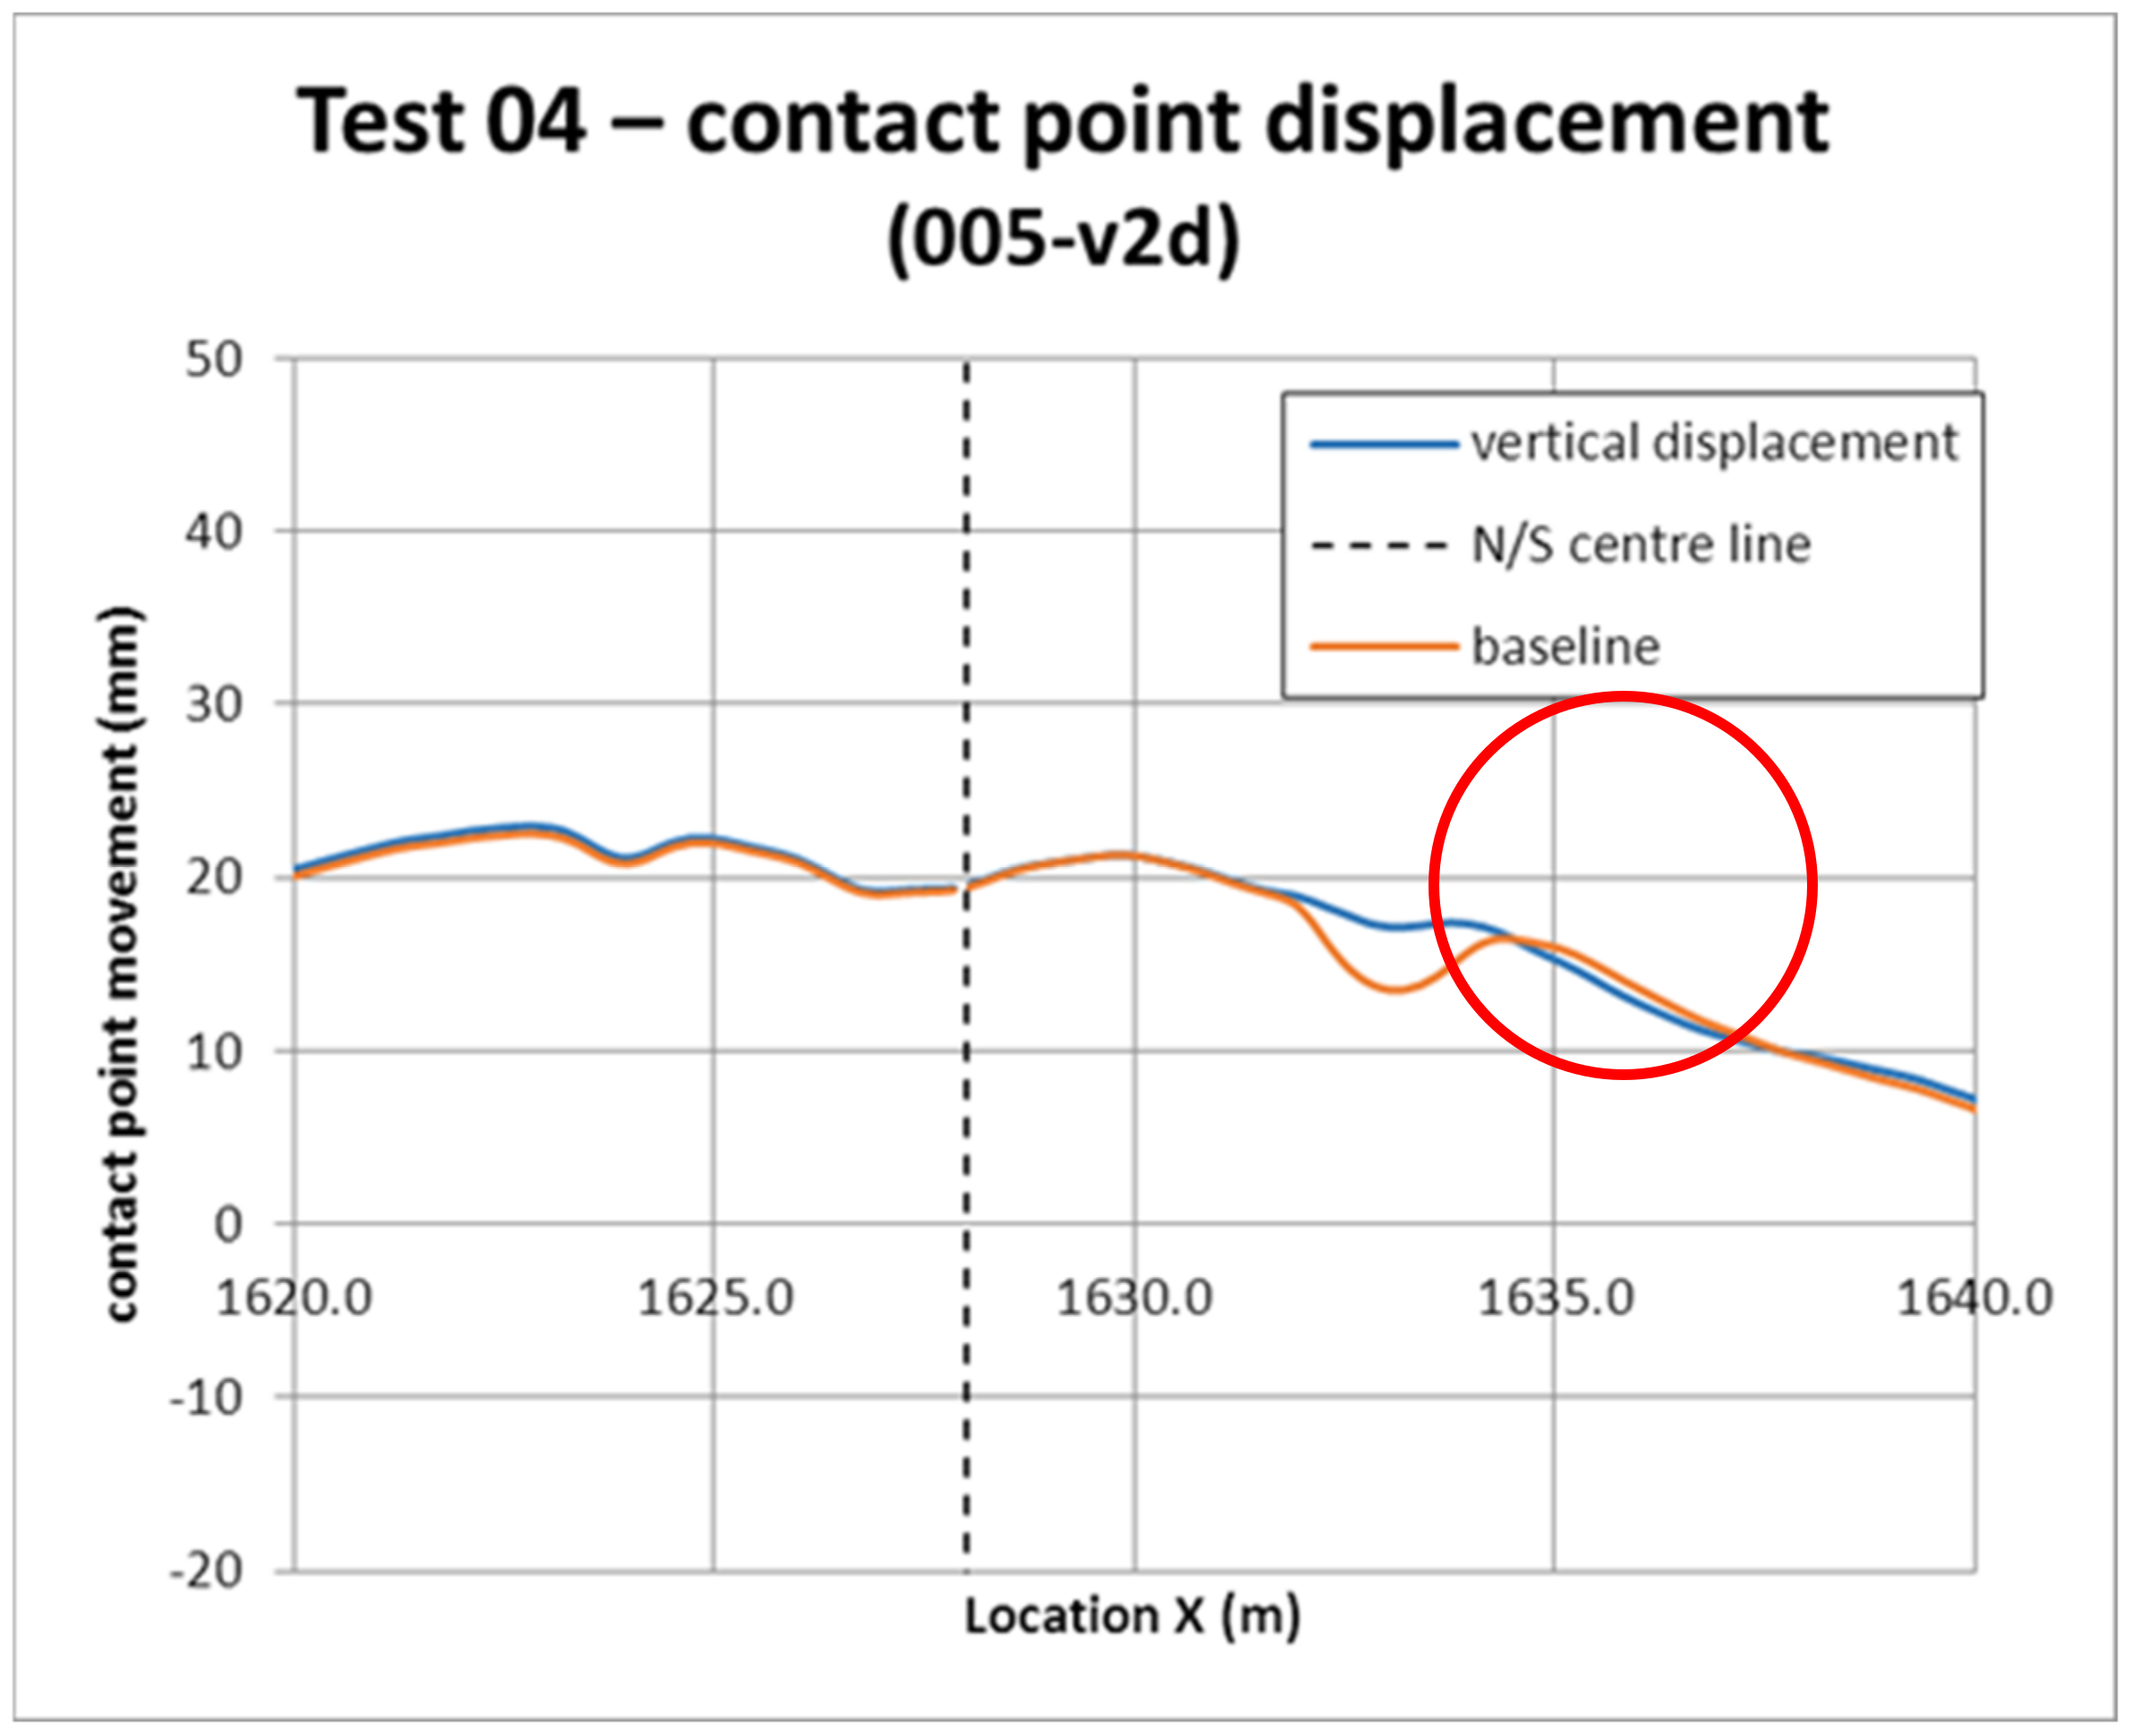
This last improvement option was that of introducing a lever arm at the exit end of the neutral section, similar to the one at the entry, and could be considered highly achievable in the real world. In this option, filtered at 20 Hz, the contact force standard deviation is lower by almost 6 N, and the maximum force is lower by 5 N, but the minimum force is much greater than the baseline, by about 45 N, showing a much more compact range of forces throughout the neutral section. The lower range of forces is corroborated by the vertical displacement of the contact point, where this option is the only one to satisfactorily addressed the ‘dip’ that occurs at the exit point in the baseline. The improvement in this profile is shown in the enlarged comparison in
Figure 19, particularly at the exit end, as would be expected, as this is the location of the modified parameter.
9. Discussion
This work has used a number of approaches, some of which have been novel, some of which are less frequently reported, and some of which are adaptations of existing practice (state of art). This ‘package’ of techniques has been used to develop a dynamic analysis method for the neutral section as a discrete component within the overhead contact line.
The use of Ansys (or any equivalent FEA software, e.g., Abaqus) is not common for this type of analysis, as most use a custom code, but its adoption here allowed quicker development of a method, and one whose output could be validated against independent results. The flexibility of Ansys allowed experiments to be made with modelling parameters far more easily than having to rewrite code. The computational inefficiency was the major disadvantage.
Using the experiences of other researchers in the modelling parameters deployed within Ansys was another useful expedient, but in every case, the parameters eventually chosen were tested within Ansys and the output validated. In many cases, independently derived parameters and approaches were used, e.g., non-linear Timoshenko vice linear Euler-Bernoulli beams, the hybrid two pantograph scheme, the custom damping package, etc.
The model of the neutral section as a composite of masses, springs and joints with flexible elements modelled as cylinders or tubes, with material properties flexed appropriately, appears to have served well to represent the actual neutral section. Prior to analysis, it had been thought the critical feature would be the joints, however this appeared to be not so significant.
For validation of the outputs against actual line test data, although in accordance the current European standards, and requirements of the energy TSI for EU interoperability, it is clear that this practice requires not just good data, but good data from an adequately good quality OCL installation. In the real world, this is less readily encountered. There is a danger that the simulation method thus validated merely reproduces a replica of a flawed OCL installation.
As criteria for the assessment of neutral section ‘behaviour’, the use of the three TSI parameters (mean force, deviation, uplift) is limited and is more aligned to the TSI objective of demonstrating aggregate quality of the interface, whereas the true neutral section behaviour extends to more than just the interface with the pantograph, to the forces, strains and displacements within the neutral section construction itself. However, it is expected that the analysis method demonstrated can be extended to such parameters in future work.
Only a limited number of parametric options were attempted. A full analytic approach needs the ability to flex the neutral section model for the different combinations, which ideally needs a multi-function model where all the nodes for all possible variants are included in the initial model, and individual sets of nodes switched in and out as they are needed for the particular geometrical and component arrangement being studied. This is clearly an elaborate process, and was not included in this limited study, but would need to be for a fuller range of analytic options.
However a future path forward for the undertaking of this analysis has been indicated. Although further work remains to be done, important first steps have been taken.
10. Next Steps
The research described in this paper has demonstrated that an analysis technique of this type is capable of simulating behaviour and assessing design improvements in short neutral sections. Logical next steps would be the application of this methodology to a variety of potential design modifications and developments of the short neutral section, to establish if significant improvements in performance can be derived. An extension of the assessment criteria beyond mean force, deviation and uplift would be desirable.
11. Conclusions
This work has successfully applied an adaptation of current pantograph/OCL dynamic simulation techniques, via a proprietary finite element analysis software, to the neutral section behaviour. It has shown that a theoretical analysis that is based upon laboratory test data, and validated against line test data, can help to identify the contribution of the neutral section’s construction and element characteristics to performance in terms of peak and mean forces and displacements. From this opportunities for optimisation can be proposed and tested, as has been demonstrated by a limited number of parametric tests, at least one of which has identified a behaviour improving modification.
This research has not ‘solved’ the neutral section problem, but it has developed and tested a novel technique which can be applied to the problem and which has the capability to move the understanding forward. This has been demonstrated by successfully undertaking a limited number of tests of options to modify the parameters of neutral section components.
This work contributes to the continued availability of a reliable short neutral section for the speed range 160–200 km/h, which is a necessity in the cramped UK rail infrastructure, both currently and for the foreseeable future.


