1. Introduction
The typically long and enclosed geometry of tunnel spaces contributes to difficulties in the evacuation, rescue, and firefighting operations in tunnels, given that even the slightest of incidents produce possible significant losses, e.g., human casualties or economic slowdowns, as demonstrated by tunnel fire incidents in the past. In case of a massive fire, the ceiling lights are covered by dense smoke, thereby reducing the effective visibility for an evacuation. An evacuee’s mobility or walking speed in a less visible environment is not only influenced by insufficient lighting but also by stratified dense smoke covering the lighting that may induce forced evacuation in the dark. Togawa [
1] approximated that the walking speed in a dark architecture was 0.3 m/s, which was within the walking speed of 0.24–0.88 (average 0.49) m/s that Seike et al. [
2] have reported, whereas walking behavior in a dark tunnel has not been clarified. Evacuees during the Sekisho tunnel fire accident in Japan [
3] were reported to have used their mobile phones’ light, but the mobile light function effect was little due to the dense smoke. Without regarding the influence of dense smoke and toxic gas on the human body, the walking speed in a dark tunnel may be considered as the slowest evacuation speed. In addition, evacuees tend to become lost while searching for fire exits. If the evacuees’ behavior and the reason for such a tendency of becoming lost in a completely darkened tunnel could be clarified, then we would be able to develop a performance-based design for emergency facilities.
Seike et al. [
2] reported the literature review relating to our study, so we referenced their report as follows:
Togawa [
1] simulated blackouts by investigating the fundamental walking speeds of participants with and without blindfolds in various environments, including underground corridors, hotels, and department stores. Participants who were familiar and unfamiliar with their surroundings were considered. A tunnel environment was not considered.
Jin and Yamada [
4] investigated the influence of visibility by measuring the walking speeds of 10 participants in a smoke-filled 20 m long corridor. The participants were directed to walk along the side of the corridor until they saw an emergency board placed in front of the wall. The smoke was produced by burning wood (irritant) or crude oil (nonirritant). The tests were not conducted in a tunnel but were intended for disaster prevention in Japanese road tunnel fires because they used real smoke. The results have been widely referenced in the literature on building safety.
In the Frantzich and Nillson [
5,
6] study, the walking speed was measured in a 37 m long tunnel filled with artificial glycerol (irritant) smoke and acetic acid (nonirritant), with real vehicles placed as obstacles throughout. The experiments were performed in dense smoke (with an extinction coefficient of greater than 1.9 m
−1). Their target was to clarify the function of guide lights in tunnel fires, but the real tunnel-evacuation experiments, especially in the significantly a dense smoke (greater than 2 m
−1) situation, were few; hence, we chose their experiments for comparison.
Fridolf et al. [
7] experimented in a 200 m long road tunnel. They used glycerol-based artificial smoke with (irritant case) and without (nonirritant case) acetic acid. Participants watched a video of a situation in which a passenger train stopped, and the passengers were instructed to seek the emergency facilities for evacuation. Four crossing points were established from the starting point to the endpoint, and the participants were instructed to walk diagonally from one wall to another. Emergency lights were installed at intervals of 8 m. The mean illuminance of the emergency lights was only approximately 1 lux, meaning the experiments were conducted in an almost dark scenario. Their experimental situation differed from ours, especially in terms of the guide lights, but real tunnel-evacuation experiments in a dense smoke (greater than 1 m
−1) situation were not so many; hence, we chose their experiments for comparison.
Fridolf et al. [
8] and Ronchi et al. [
9] reported experiments in a 400 m long road tunnel. Participants watched a video of a situation in which a passenger train stopped, and the passengers were instructed to seek the emergency exits for evacuation. Emergency lights were installed at 8 m intervals. The illuminance of the ceiling lights ranged from approximately 70 to 110 lux. The experimental situation was identical to that of Frantzich and Nilsson [
5,
6] and Fridolf et al. [
7].
Seike et al. [
10,
11] experimentally investigated evacuation speed in a 700 m long full-scale smoke-filled tunnel of which 400 m was used and clarified the relationship between the extinction coefficient (up to 1.6 m
−1) and normal walking speed under lightened and darkened conditions, respectively. They conducted their evacuation experiment in a full-scale smoke-filled tunnel to clarify the relationship between smoke density up to the extinction coefficient = 1.6 m
−1 (which includes extinction coefficient = 0.4 m
−1 as the Japanese road tunnel fire-prevention standard) and evacuation speed.
Seike et al. [
2] reported that age and gender were confirmed to have an insignificant influence on walking speed. The results clarified that participants’ walking speeds were approximately lognormally distributed within a 95% interval (using the 2.5th and 97.5th percentiles of the distribution as endpoints, which were, respectively, 0.24 and 0.88 m/s with a mean value of 0.49 m/s). Some female participants became lost and gave up trying to evacuate, which generated a cancelation rate of 0.6% of the total number of evacuees.
Seike et al. [
12] experimentally investigated evacuation speed distribution. The results of the statistical analysis were used for determining the relationship between emergency evacuation speed and an extinction coefficient of up to extinction coefficient = 2.2 m
−1 through a set of formulations, which agree that the evacuation speed decreases with greater extinction coefficient values. Based on the comparison between our experimental results and that of the Swedish group, it was considered that the evacuation speed decreased rapidly around extinction coefficient = 4 m
−1, after which it approached Seike et al.’s [
2] values asymptotically.
These past experiments did not investigate the relationship between evacuation behavior and psychological stress in evacuation. In their experiments, they supposed that participants were always calm. However, Leach [
13] reported that during disasters, around 10–15% of those affected embrace themselves, 70–75% feel frozen, and 10–20% cry or scream. A rise in stress levels and anxiety increase an evacuee’s heart rate and result in respiratory distress, even after evacuation starting and the smooth evacuation action difficult. Panic follows and induces unexpected occurrences, thus requiring stress assessment among the evacuees.
Regarding the past psychological stress assessment, Jin [
14] only investigated the relationships between psychic unrest levels, walking speed, and smoke density in an architectural space, whereas Frantzich and Nilsson [
5,
6], Fridolf et al. [
7,
8], Ronchi et al. [
9], and our group [
2,
10,
11,
12] reported the walking speed in a smoke-filled tunnel without clarifying the relationships between the walking speed in a completely darkened tunnel and under stress. Therefore, in this study, our aim is to show a new evaluation method proposal of stress evaluation from saliva, heart rate, and blood pressure measurement and we attempted to investigate of the relationship with movement speed. The present study’s state-of-the-art is a challenge to evaluate the stress and connect to the human behavior in the tunnel evacuation. To the best of our knowledge, this study is the first to evaluate the stress and connect to the human behavior in evacuation. Our investigation could be useful for innovate the stress assessment. Additionally, our study assumption is significantly rare in the field of endocrinological data. We measured the walking locus, speed, and stress in a darkened full-scale tunnel to investigate the fundamental characteristics during tunnel fires. The study subjects wore an eye mask, assuming a middle-to-late evacuation environment. We did not use smoke.
Stress levels by heart rate, blood pressure, and oxytocin and cortisol concentrations from saliva are assessed before and after the experiments, followed by a questionnaire survey. Typically, oxytocin is released during feelings of stress and fear and has an anxiolytic effect [
15]. Recent works [
16,
17] have shown that the released oxytocin related to stress is detectable from human saliva.
2. Experimental Setup
2.1. Experimental Tunnel
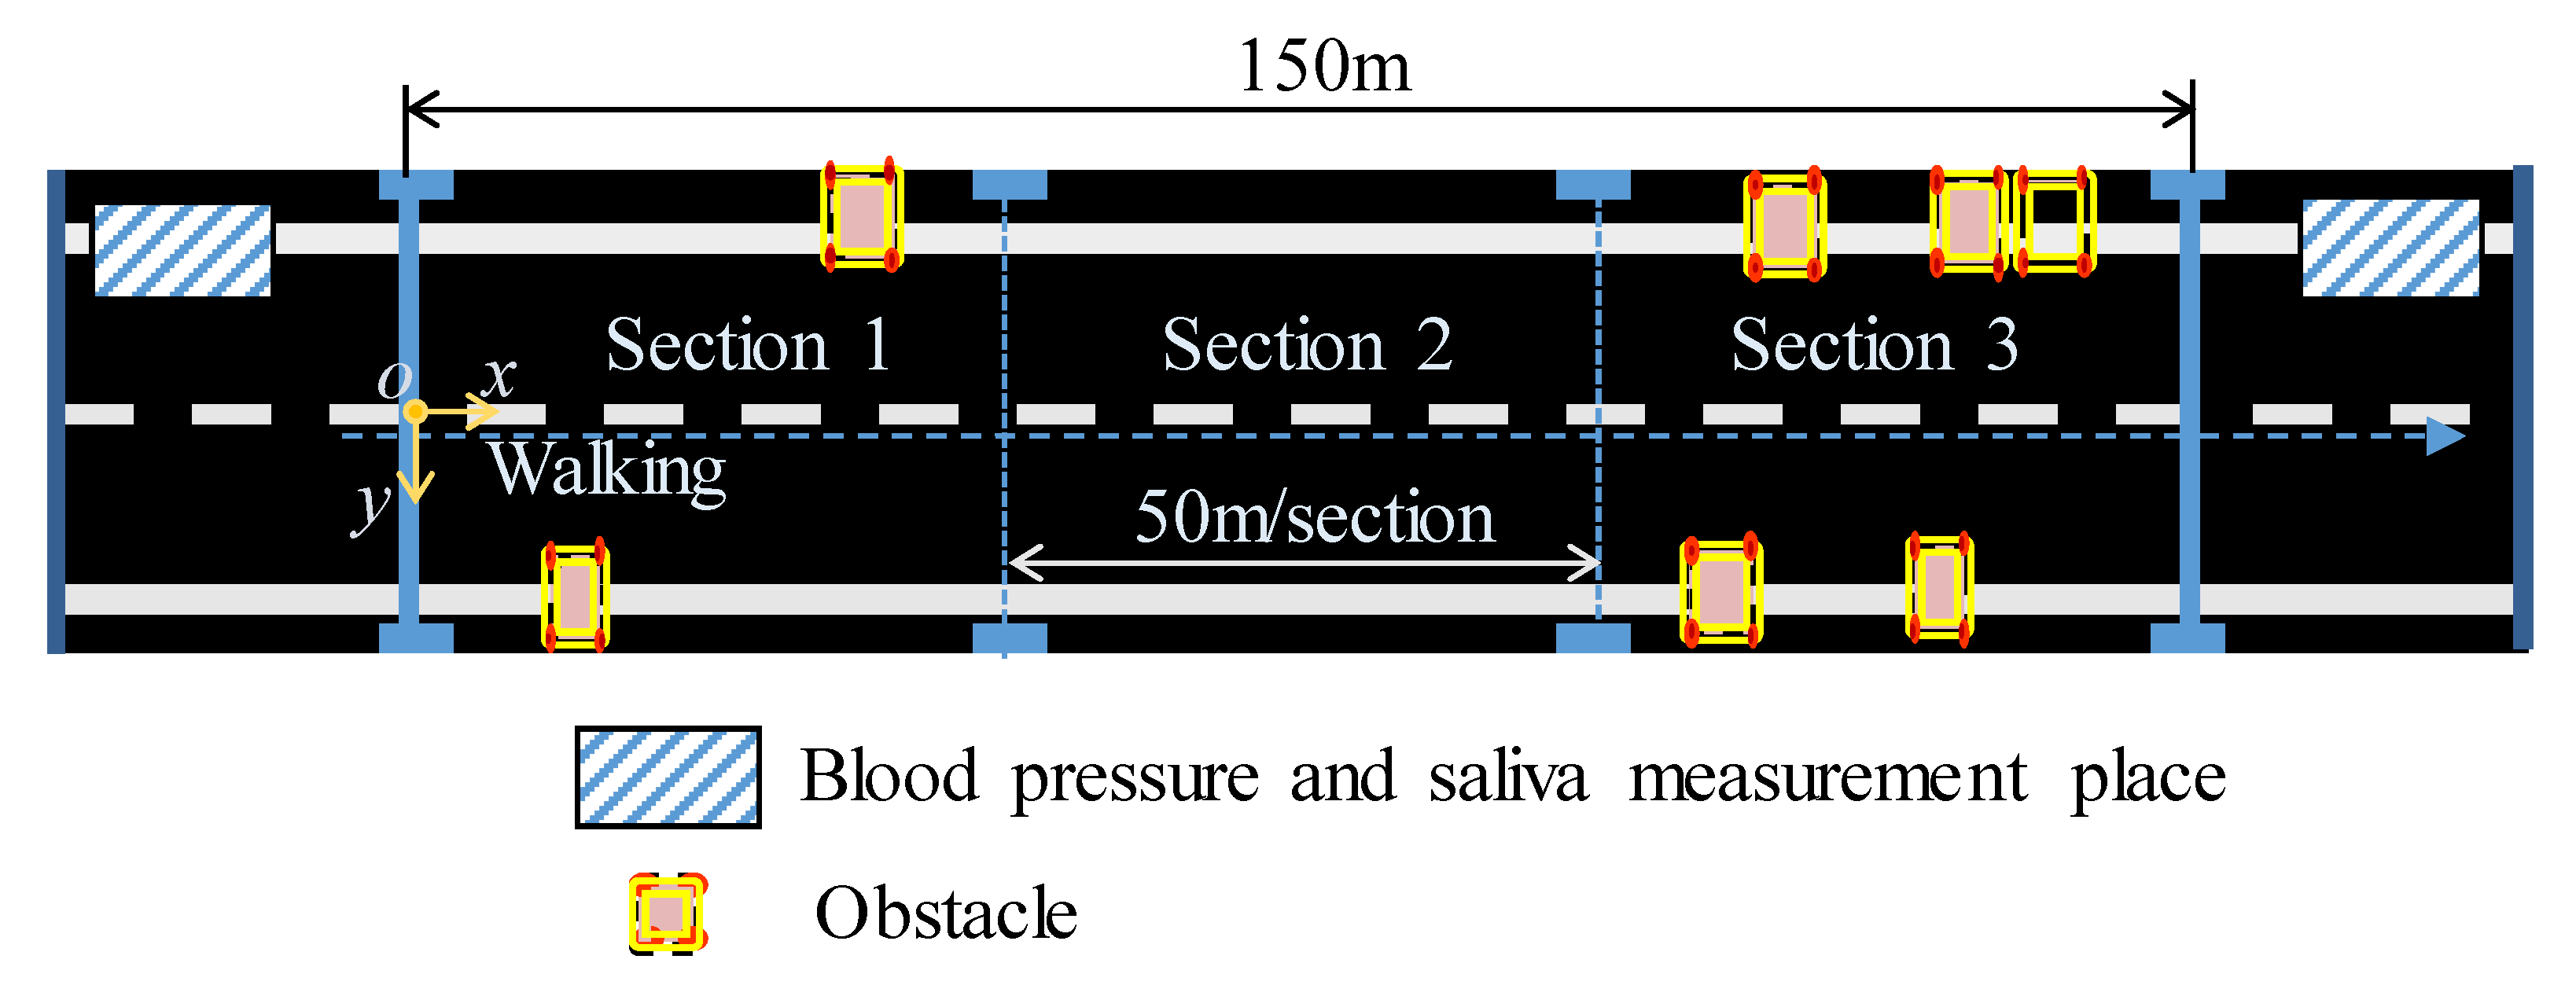
We conducted experiments in an obsolete full-scale tunnel, the ex-Tonokuchi tunnel in Fukui. The horseshoe-shaped tunnel was 488 m long, 6.6 m wide, and 5.4 m high. The region allocated to the experiment (longitudinal interval and transverse section) is shown in
Figure 1. The longitudinal and wide directions were indicated by
x and
y, respectively, and the origin was set at the width center point
o.
2.2. Subjects
Nine subjects participated in the experiments (six males, three females; 20.6 years old on average), because we would like to avoid the influence of age and prevent the injured. The subjects were instructed to wear a safety vest, a mask, and a helmet. The group effect is fundamental in tunnel fire scenarios; however, before the group evacuation investigation, it was necessary to consider the individual behavior characteristics investigation. Hence, we focused on the individual behavior and stress and would focus on the grouping effect in the future topic.
2.3. Explanation
We investigated the fundamental characteristics for risk analysis in tunnel fires by measuring the walking speed in a tunnel with no visibility. Subjects wore an eye mask and were given these instructions:
“Please walk in the tunnel as you would normally walk.”
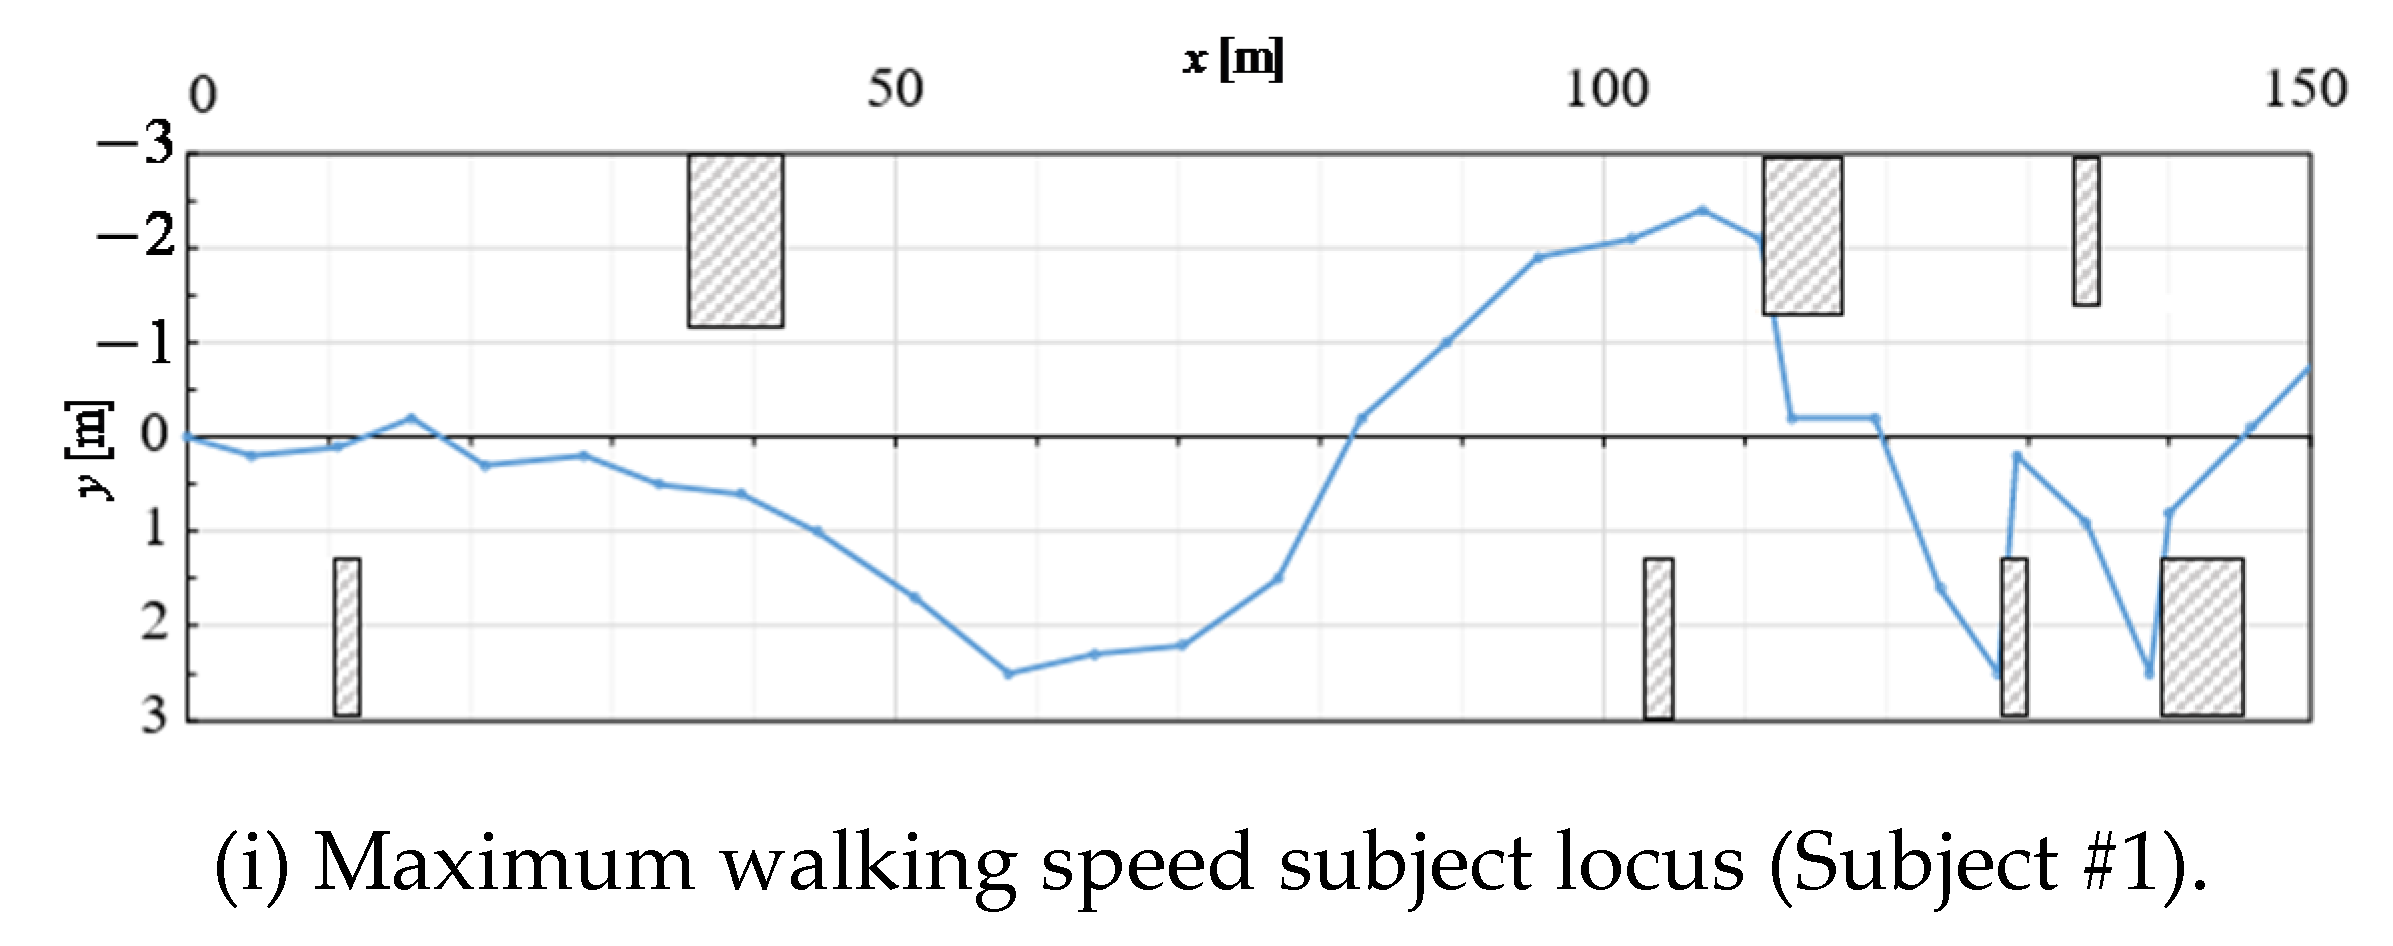
The subjects walked the 150 m long lanes consisting of several sections with or without obstacles. Three obstacles were installed on the measuring route (
Figure 1). Four obstacles (sorts of a tent) were set at a fixed location. Before the experiments, subjects were reminded to walk with caution relative to these obstacles.
2.4. Measurement of Walking Speed
The walking speed of the subjects was derived from their longitudinal and transverse locations where their experimental attendant left numbered cards every 5 s (see
Figure 2). Notably, the subjects were blindfolded.
A subject was blindfolded while the locus was measured by another subject.
Two walking speed types were addressed herein as follows:
The mean walking speed
vm = one section (50 m)/the passing time in one section (see
Figure 1).
Topical walking speed ,
where ∆x and ∆y are longitudinal and transverse displacement during ∆t (5 s).
2.5. Stress Assessment
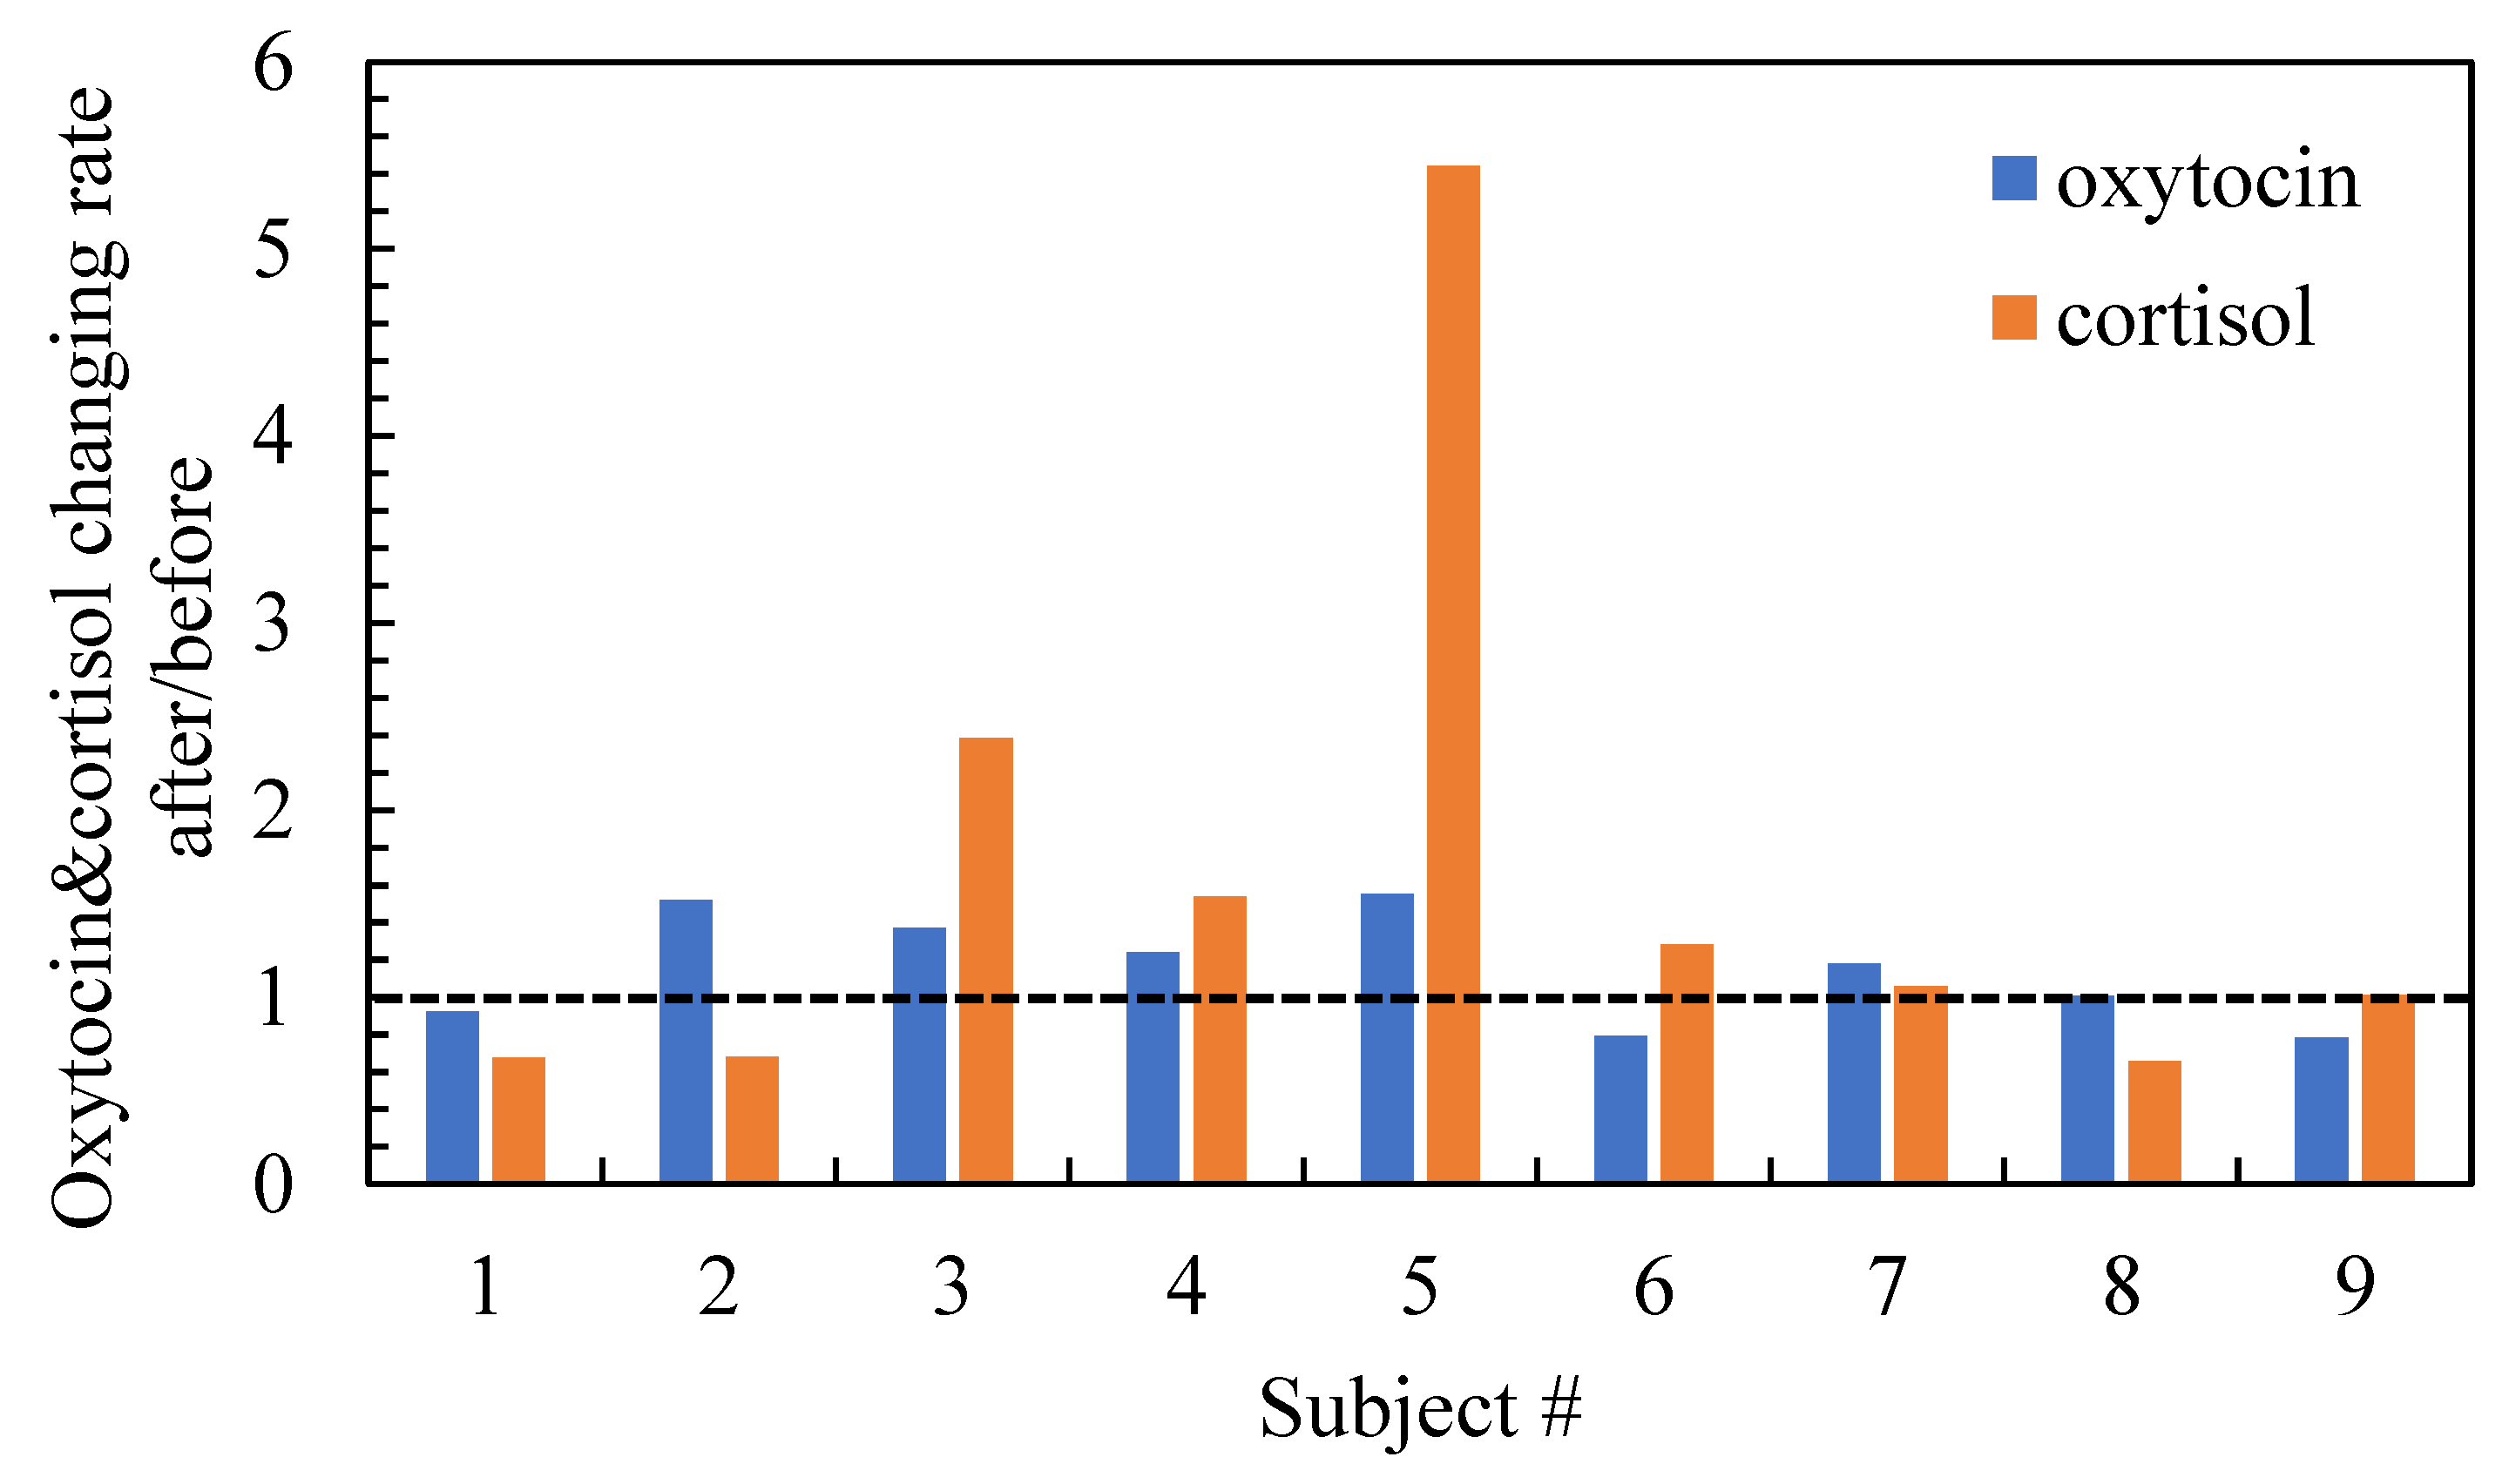
We assessed the stress of the subjects by measuring their heart rate before, during, and after the experiments, their blood pressure, and their oxytocin and cortisol concentrations from saliva before and after the experiments, as well as completing a questionnaire survey after the experiments. This research ethics were approved by Toyama Prefectural University (corresponding author’s (M. Seike) former affiliation) and Kanazawa University.
2.5.1. Oxytocin Concentration in Saliva
A study shows that oxytocin, a substance involved in an anxiolytic effect, is released upon feelings of stress or fear [
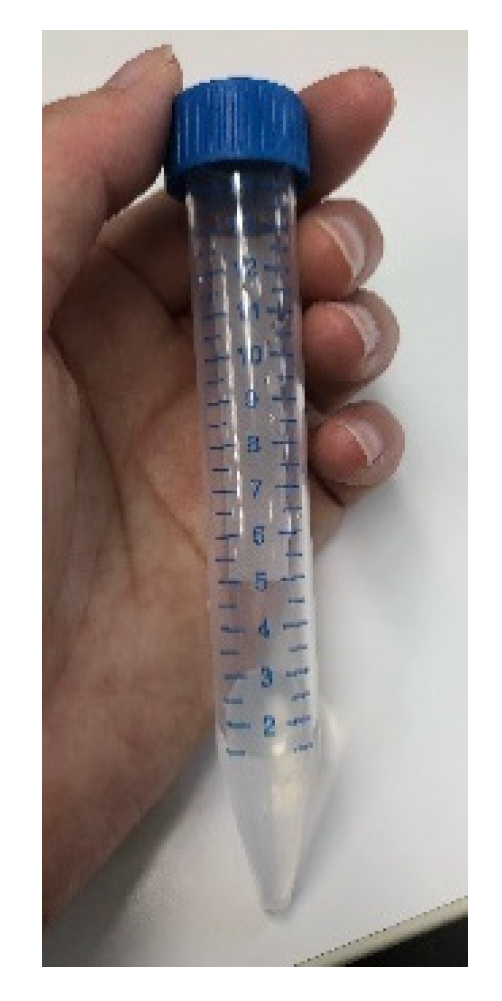
15]. As stress biomarkers, oxytocin and cortisol were measured before and after the experiments. After gargling, the subjects’ saliva was collected by exhaling into a polystyrene centrifuge tube (15 mL,
Figure 3) through which approximately 1 mL saliva was passed directly. After centrifugation at 3000 rpm for 12 min at 4 °C, the supernatant was collected and transferred to an Eppendorf tube. Oxytocin and cortisol concentrations were immediately measured from the saliva using EIA: Enzo kit.
A 50 μL oxytocin blue conjugate and 50 μL yellow antibody were added to 100 μL of the sample. The antigen–antibody reaction was then performed overnight at 4 °C. After washing with a wash buffer the next day, a pNpp substrate (200 μL) was added and kept at room temperature. Moreover, after a stop solution (50 μL) was added, the corresponding absorbance at 405 nm was read with a plate reader (made by BioRad). A calibration curve was prepared each time, and the oxytocin concentration was calculated.
2.5.2. Heart Rate and Blood Pressure
Selye [
18] reported that an increase in body stress results in hypotension, such as a shock layer, and then transitions to the antishock phase, accompanied by an increase in blood pressure. Accordingly, Jin [
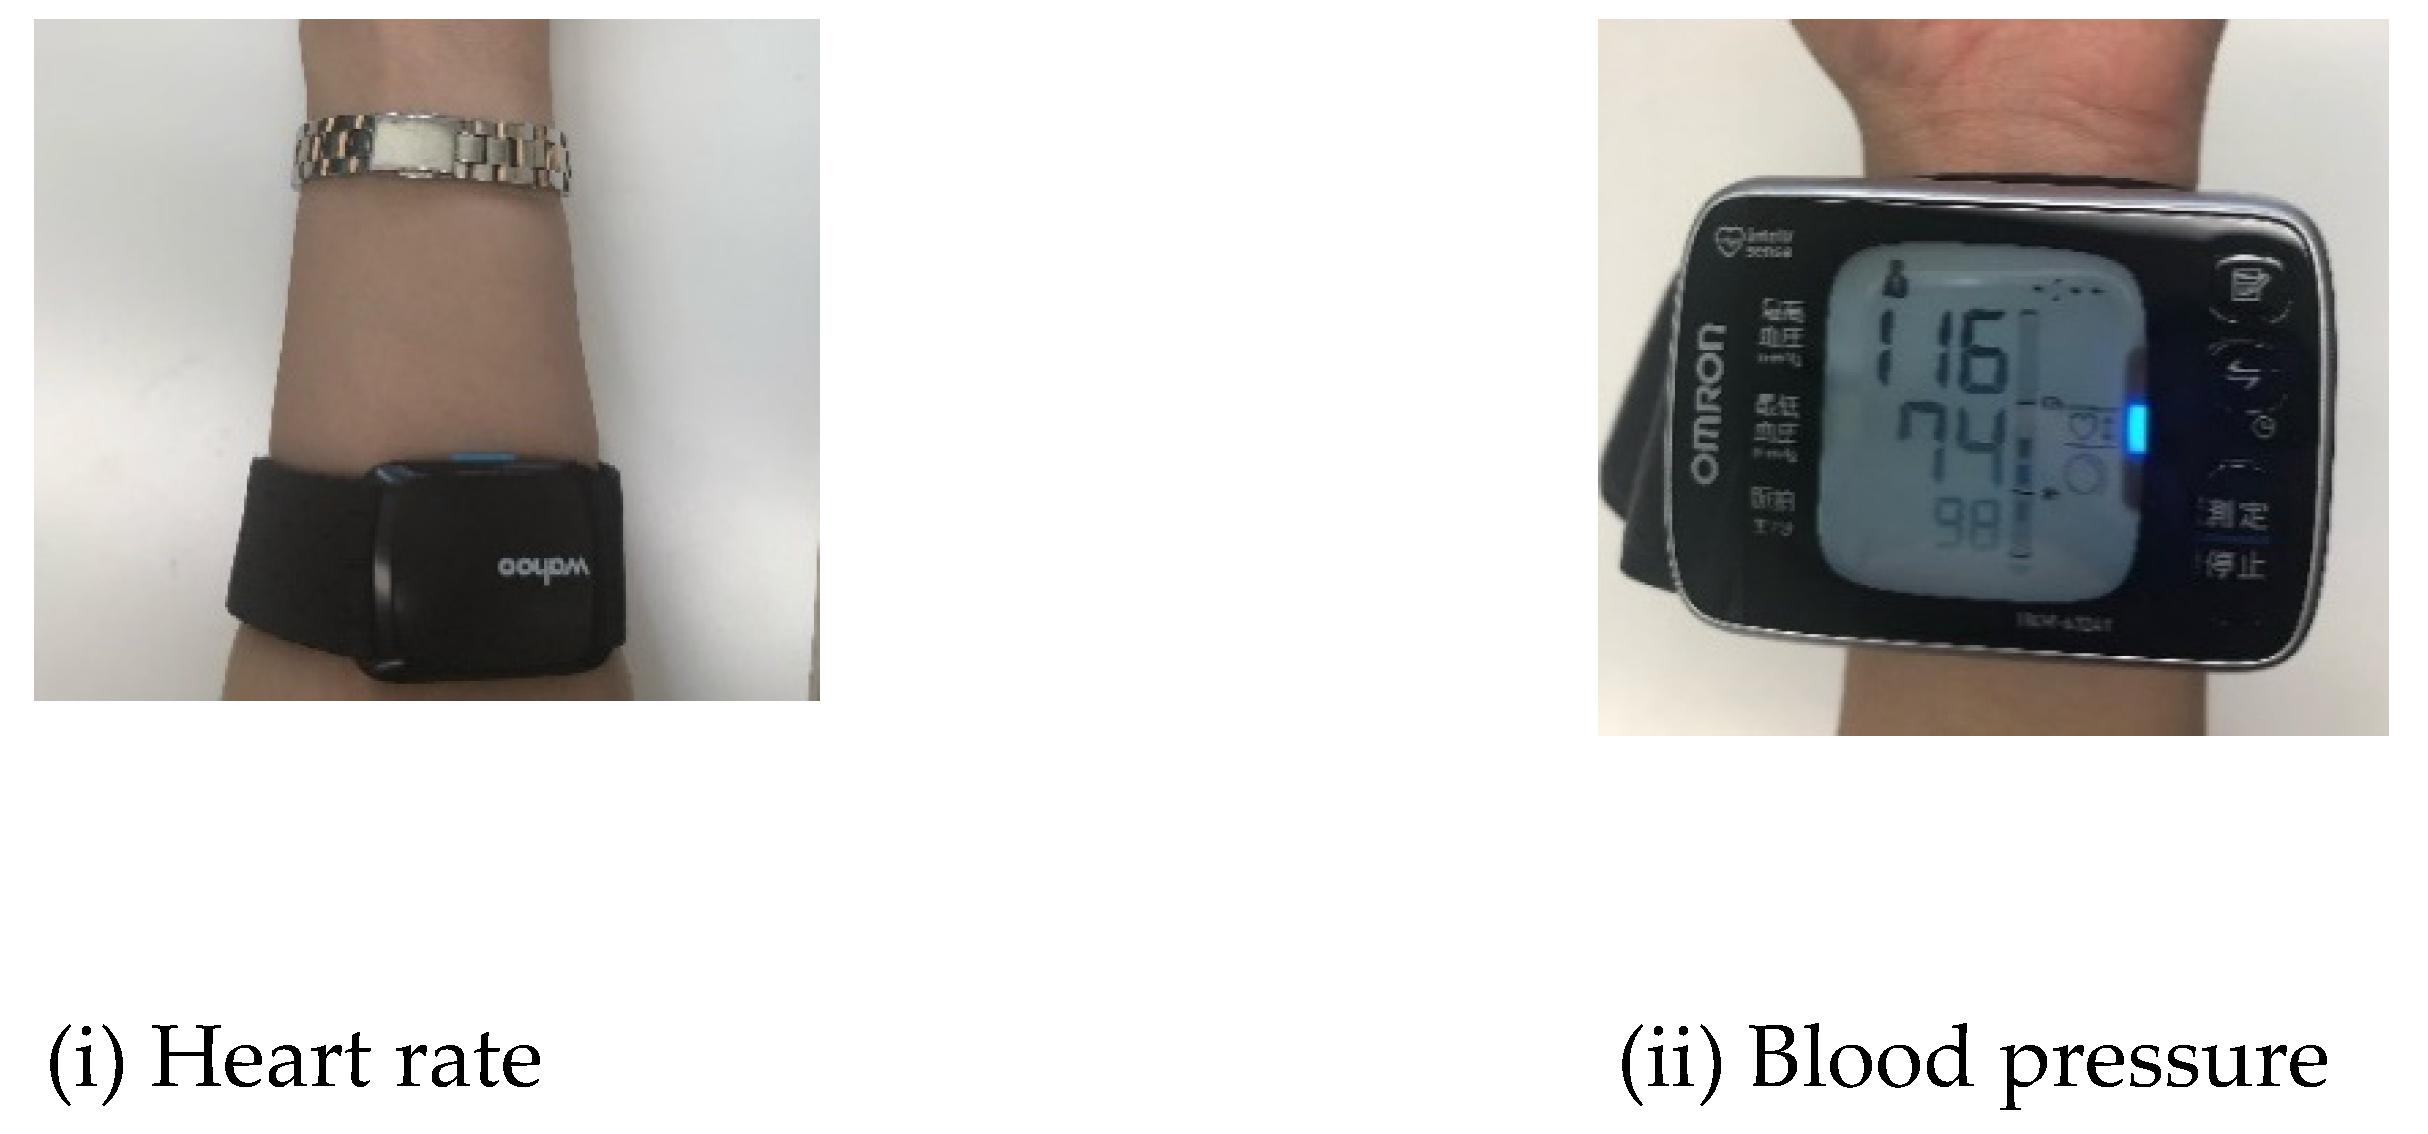
14] used heart rates to measure psychic unrest levels. In this study, we measured both blood pressures and heart rates using TrikerFIT WahooWF124 (see
Figure 4(i)). We measured the blood pressures and heart rates before and after the experiments using Omron HEM-6324T (see
Figure 4(ii)). The subjects’ blood pressures were measured along with measuring time. We applied this time to investigate the heart rates of the subjects in the experiments.
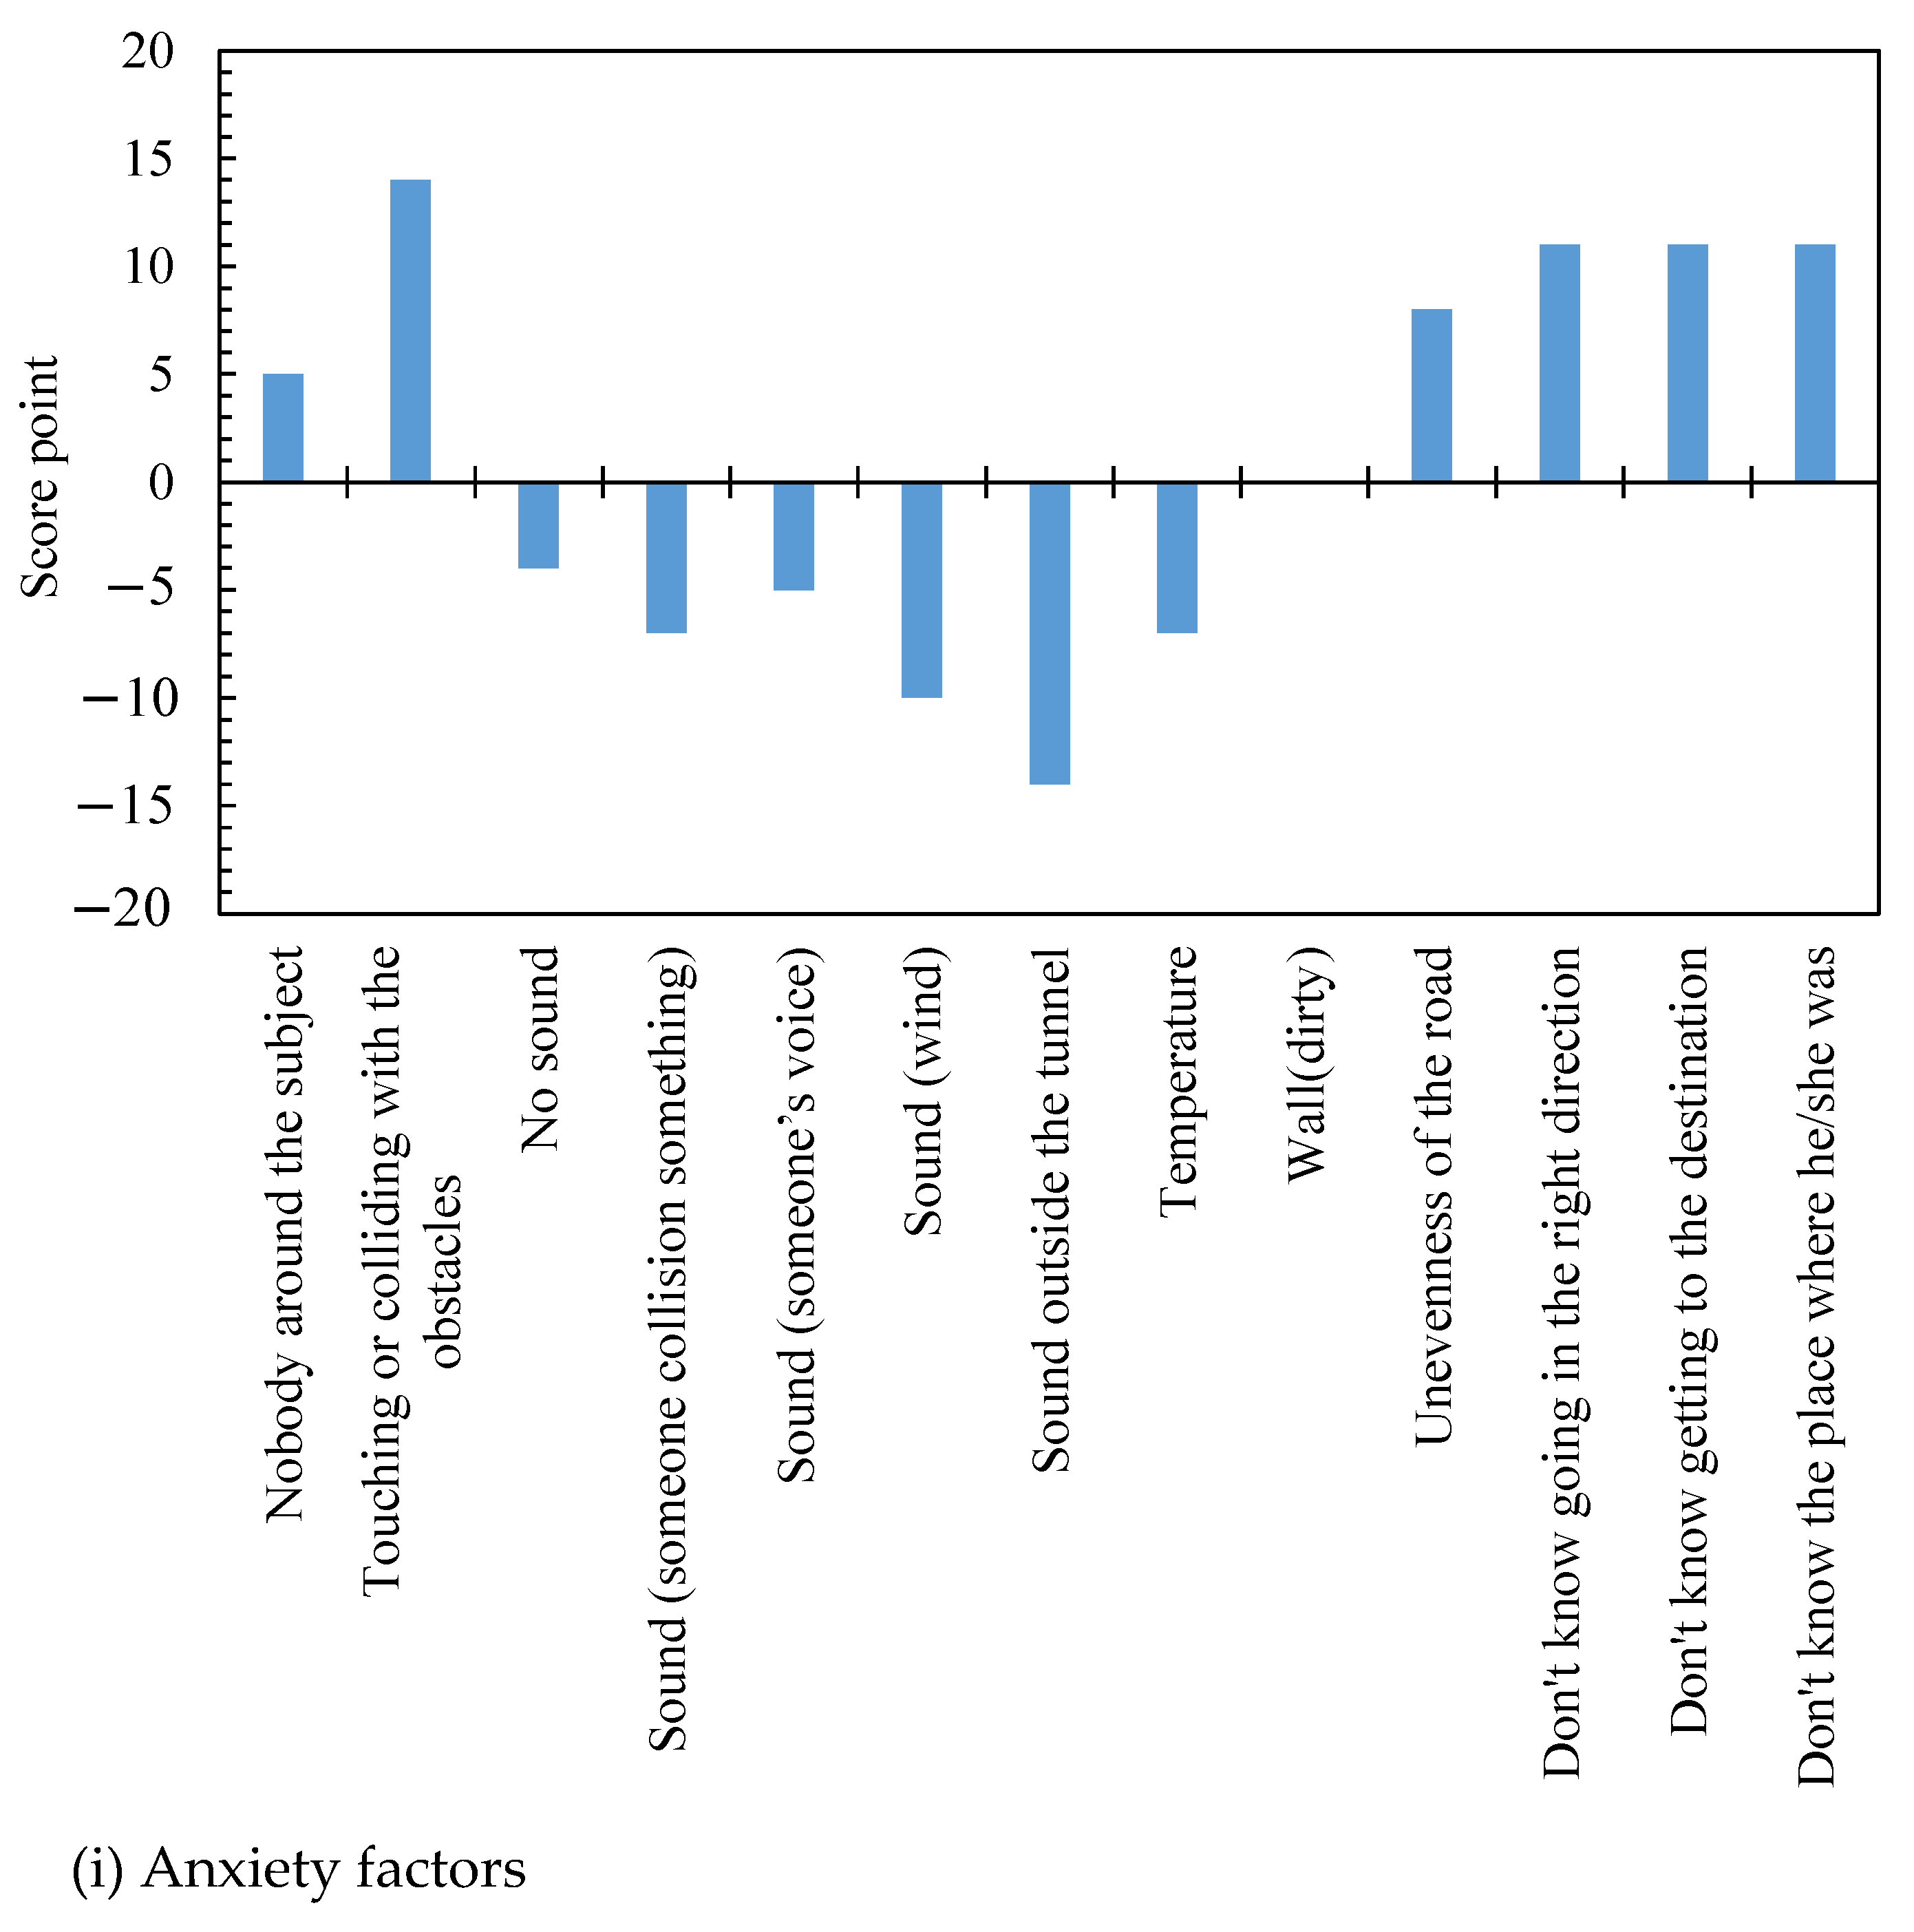
2.6. Questionnaire Survey
Upon completion of the experiments, we asked the subjects to answer a questionnaire. We picked up the anxiety factors at the time of evacuation as follows and investigated what the subjects were anxious about. The reason for adopting a 5-point evaluation was determined from the classification based on S.S. Stevens [
19], focusing on the interval scale by the question about the attitude in this study.
(A) Anxiety Factors
- (1)
Nobody around the subject;
- (2)
Touching or colliding with the obstacles;
- (3)
No sound;
- (4)
Sound (someone collision something);
- (5)
Sound (someone’s voice);
- (6)
Sound (wind);
- (7)
Sound outside the tunnel;
- (8)
Temperature;
- (9)
Wall (dirty);
- (10)
Unevenness of the road;
- (11)
Do not know if going in the right direction;
- (12)
Do not know how to reach the destination;
- (13)
Do not know the place where he/she was.
We picked up the elements that were useful at the time of evacuation as follows and investigated what the subjects depended on. The reason for adopting the 5-point evaluation was the same as the anxiety factors.
(B) Helpful item
- (1)
Wall;
- (2)
Obstacle;
- (3)
Unevenness of the white line *.
* There is unevenness (bumps) on the white lines to alert the drivers in the tunnel.
We prepared two sets of questionnaires: one assessing anxiety factors and the other asking the helpful item for walking by score (yes: 2 points, probably yes: 1 point, neither yes and no: 0 points, probably no: −1 point, and no: −2 point).
4. Conclusions
We experimentally attempted to investigate the evacuation loci and stress levels of subjects by measuring the oxytocin concentration in their saliva, their heart rate, blood pressure, and results of a survey questionnaire for a full-scale tunnel scenario. These are the generalized results:
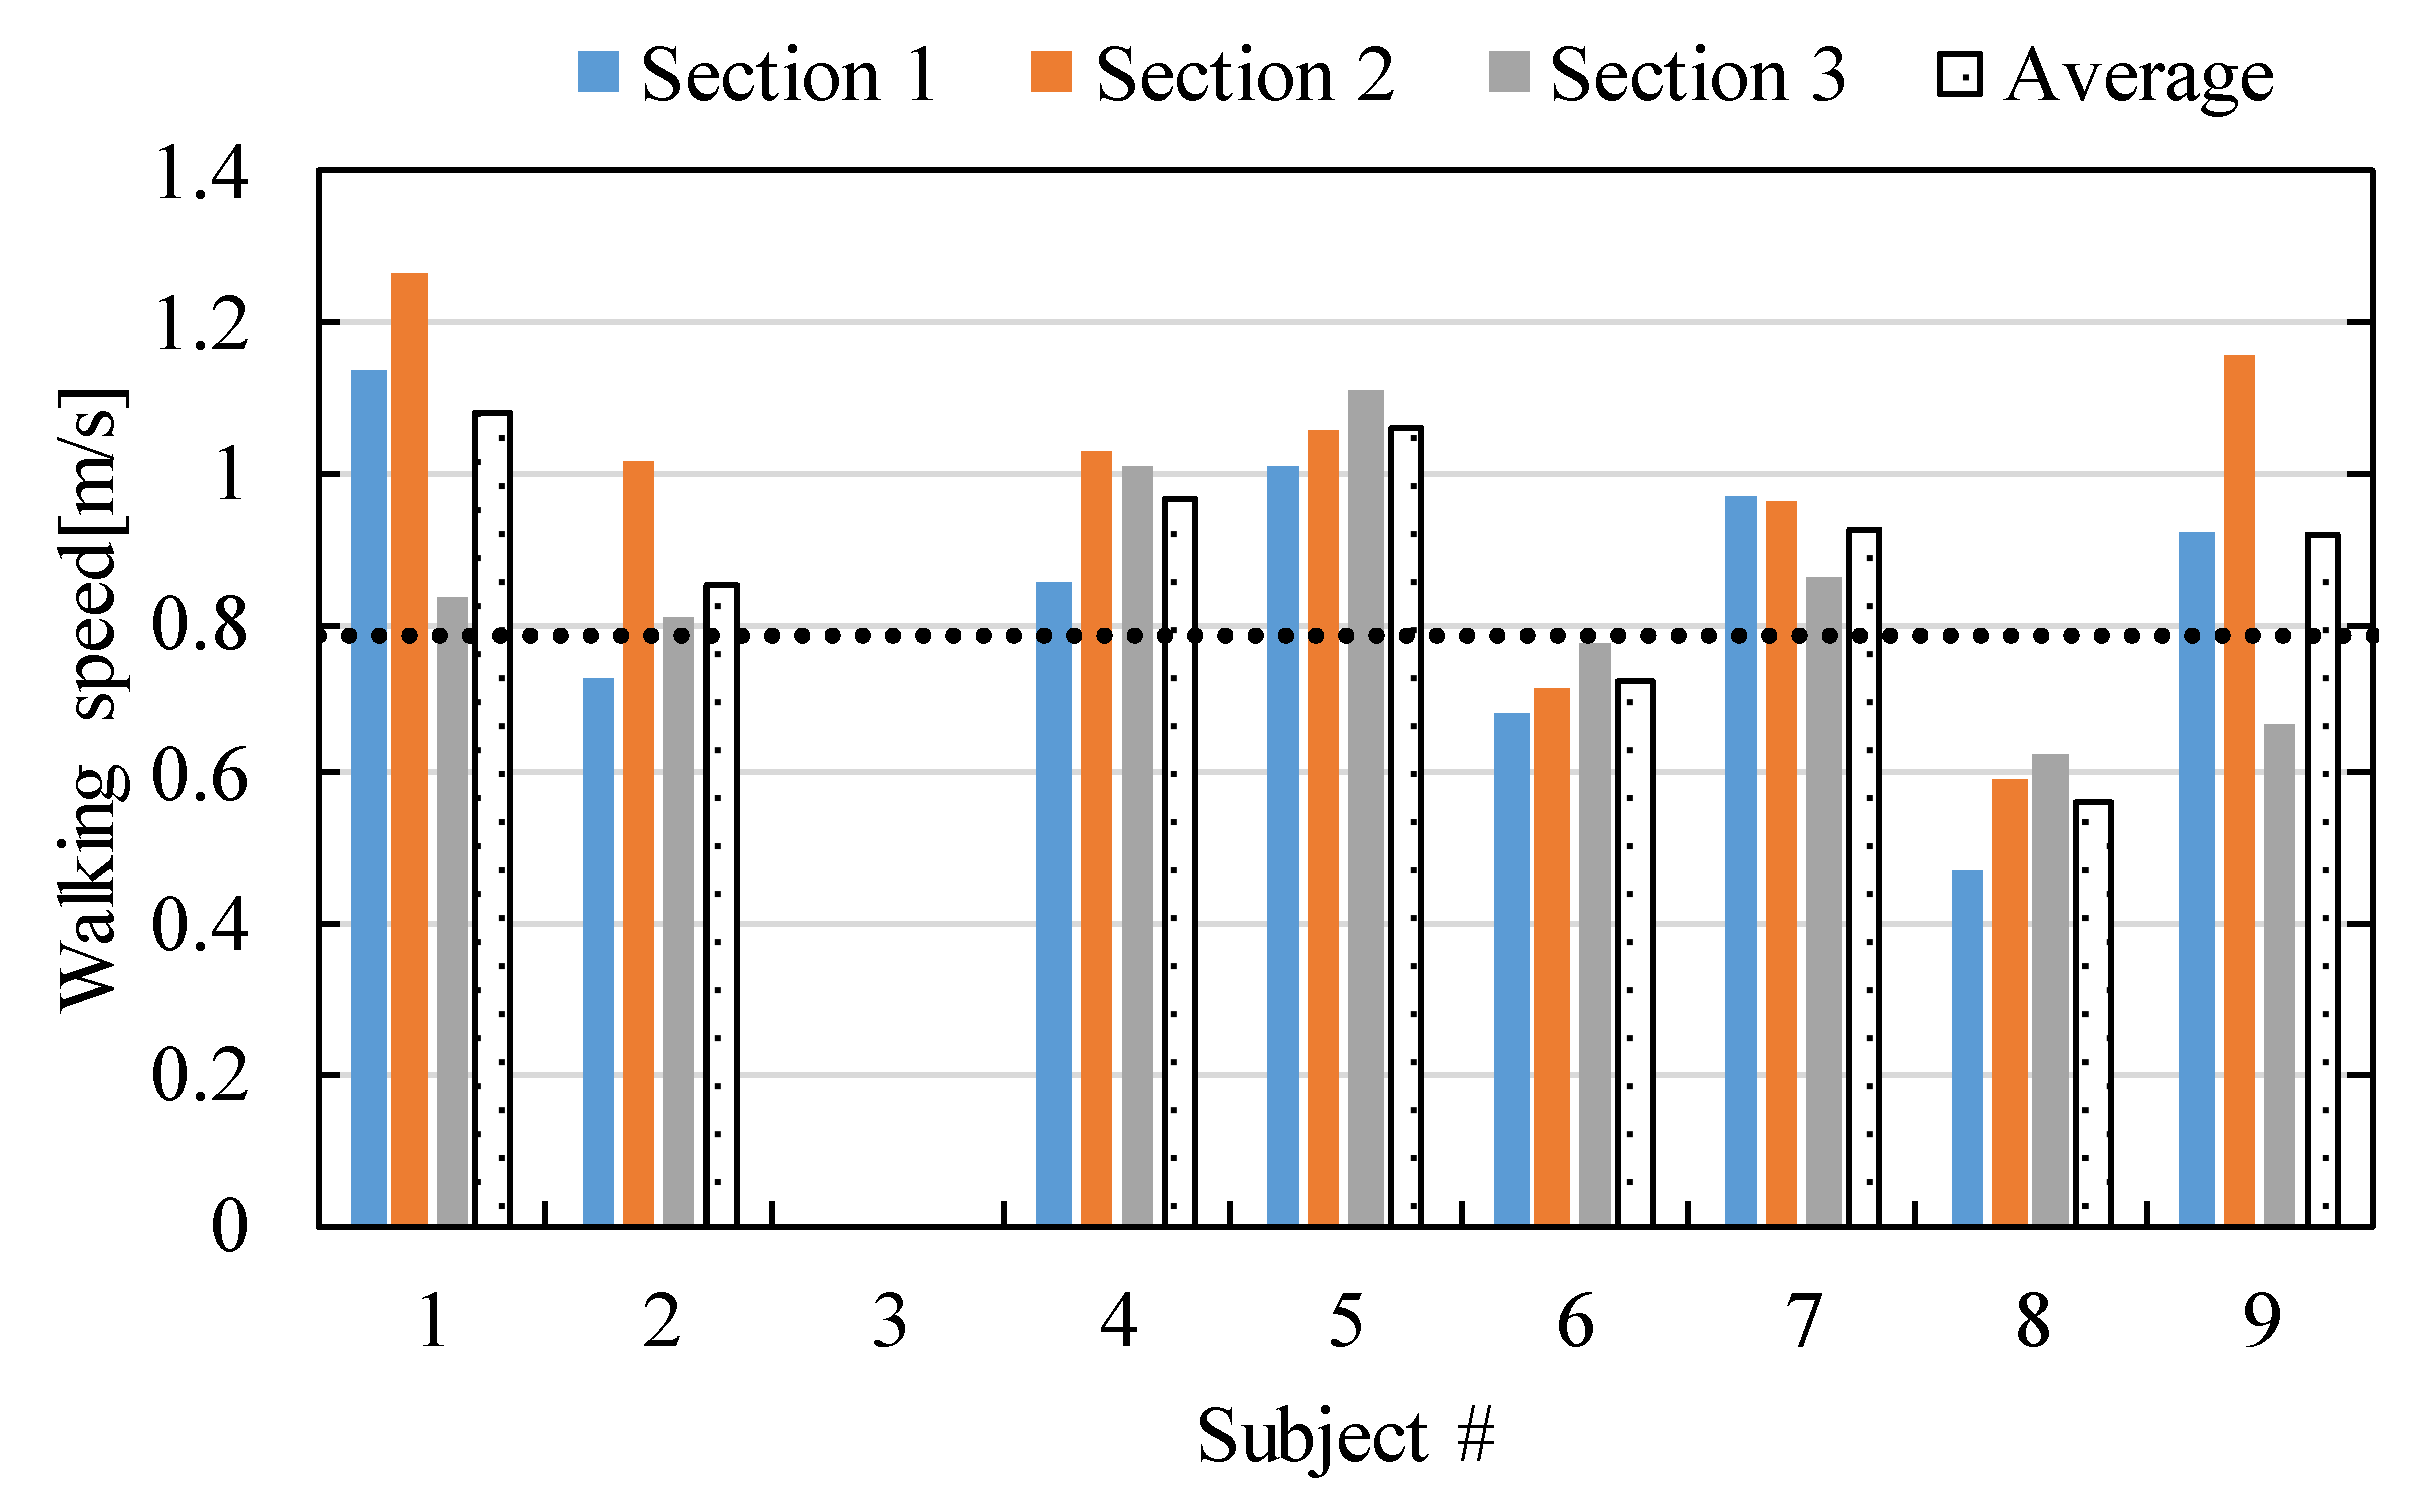
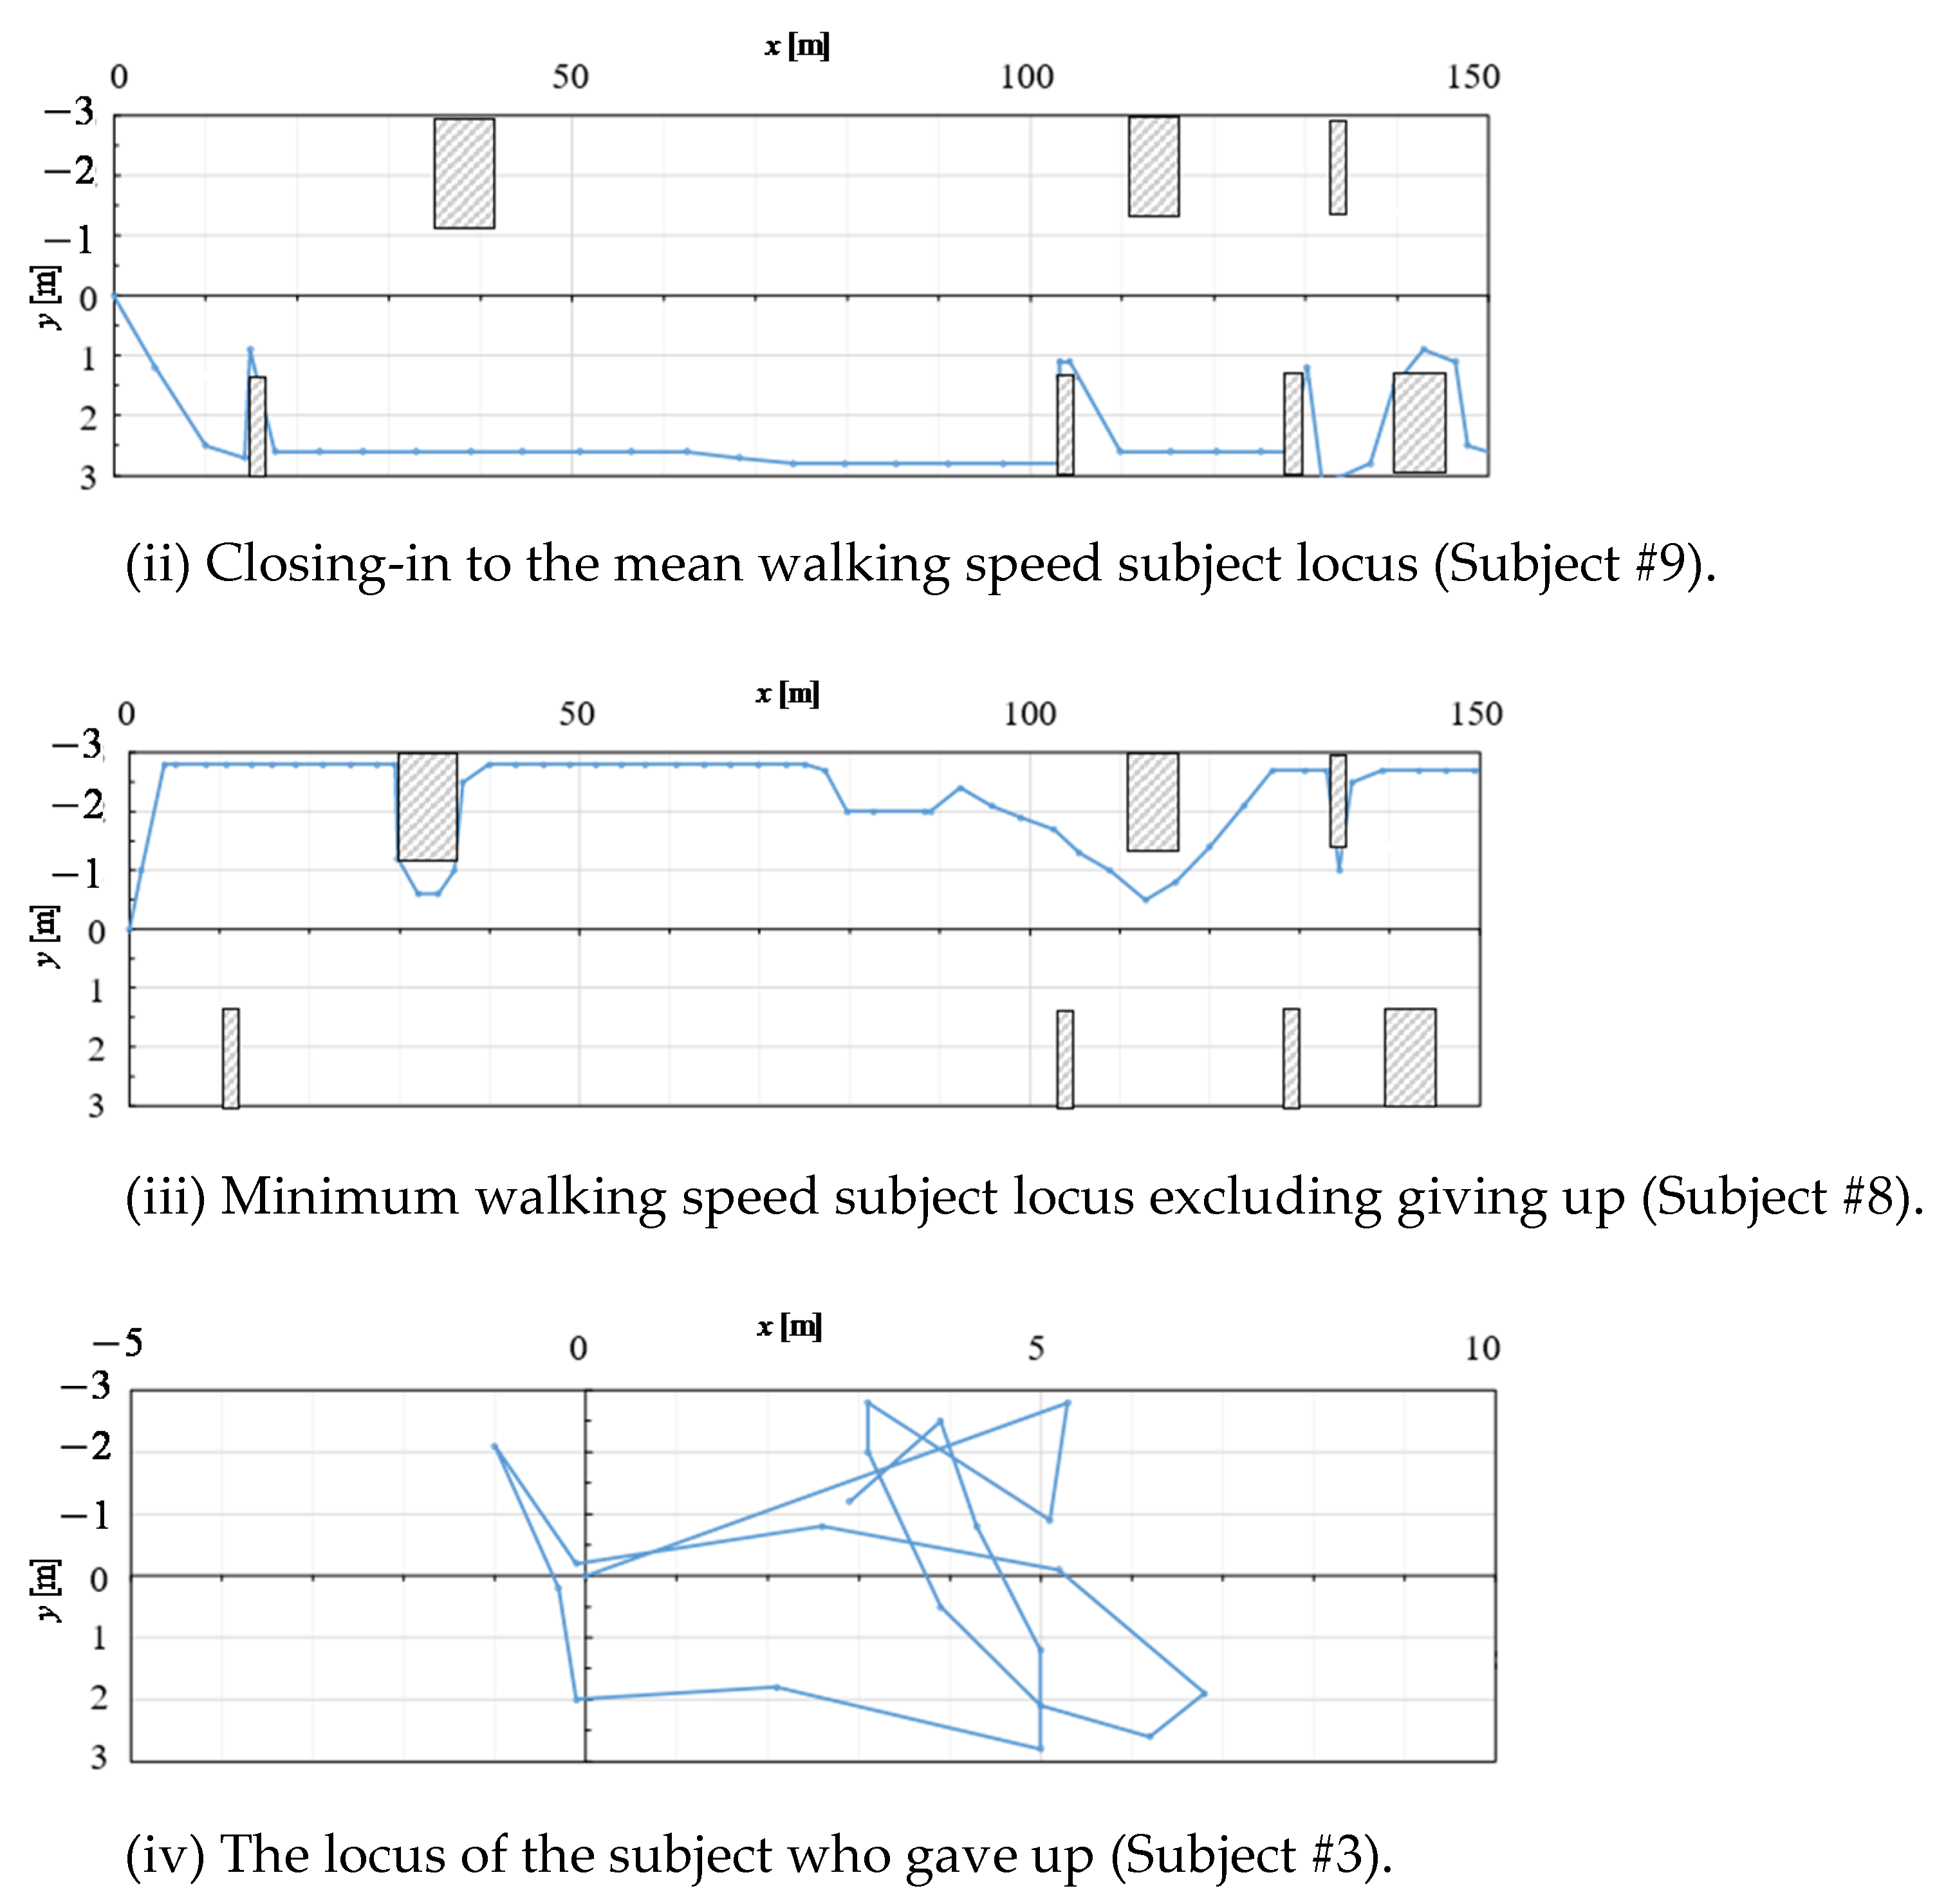
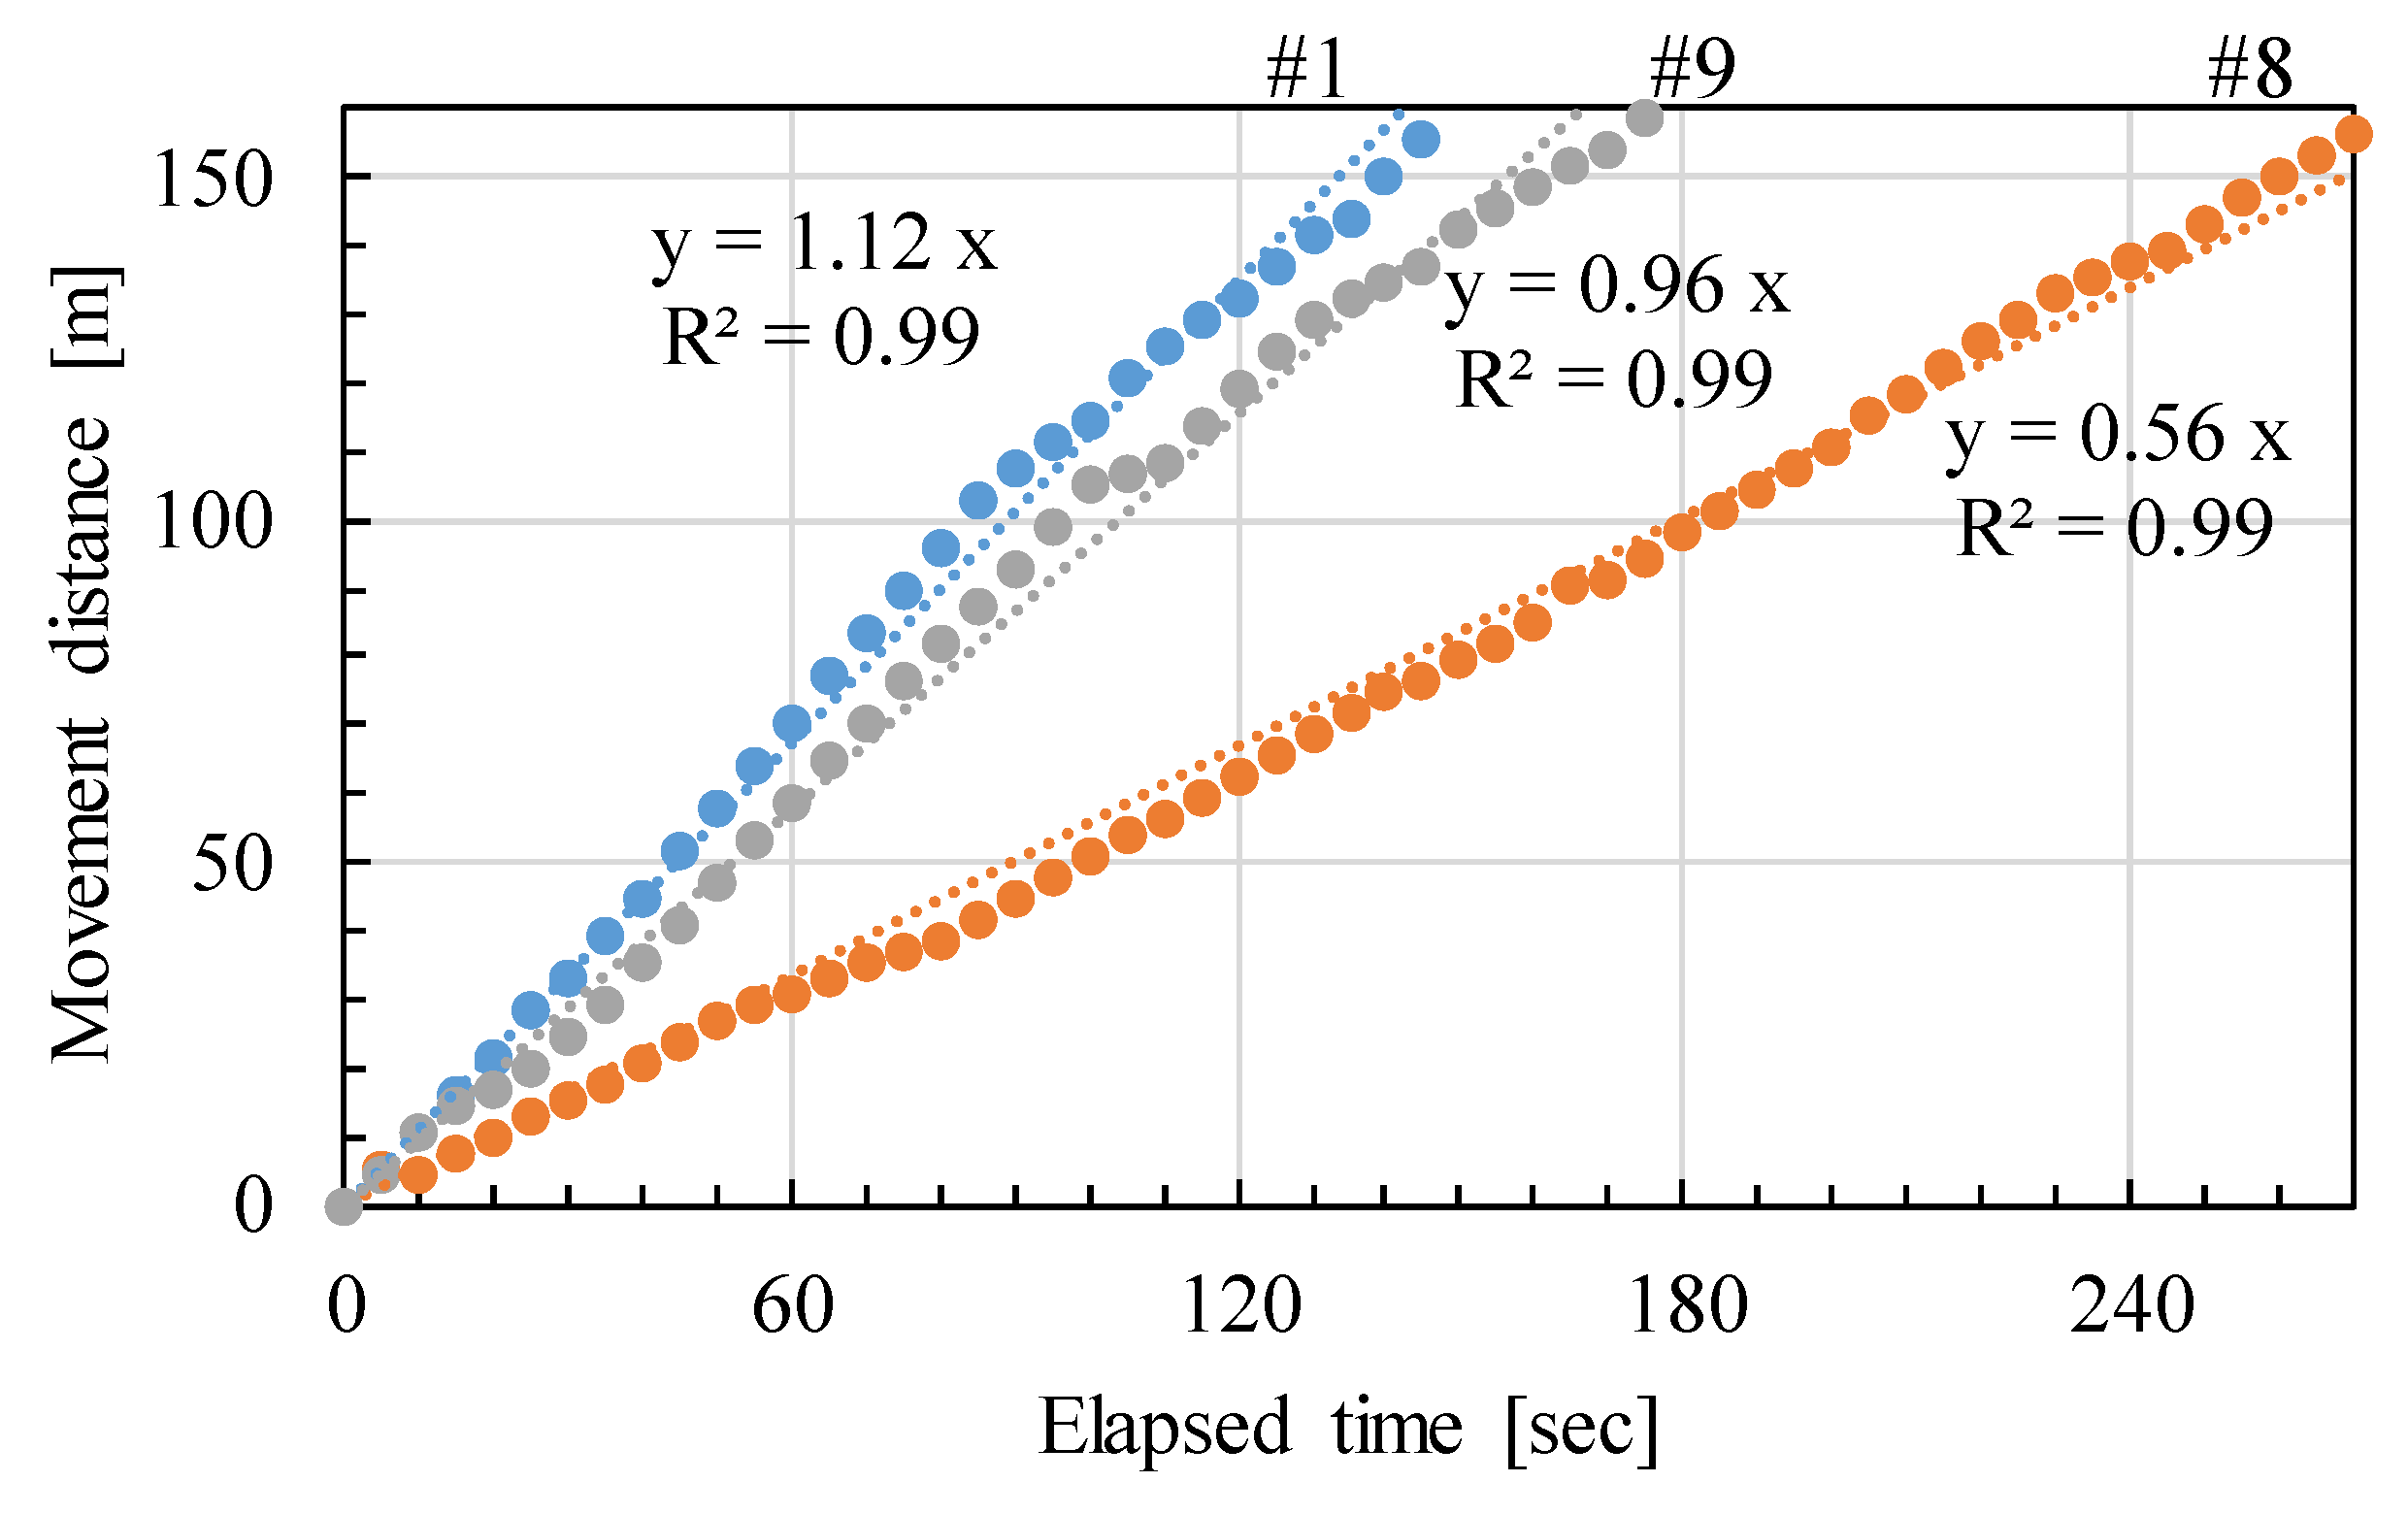
The mean walking speed
vm was 0.47 m/s (Subject #8) to 1.27 m/s (Subject #1), with a mean value of 0.78 m/s for all subjects. The mean walking speed in
Section 2 was the fastest (0.87 m/s), and those in
Section 1 and
Section 3 were 0.75 and 0.74 m/s, respectively, which was because there was no obstacle in
Section 2. The moving distance of the subjects to the width was approximately less than 11–14%.
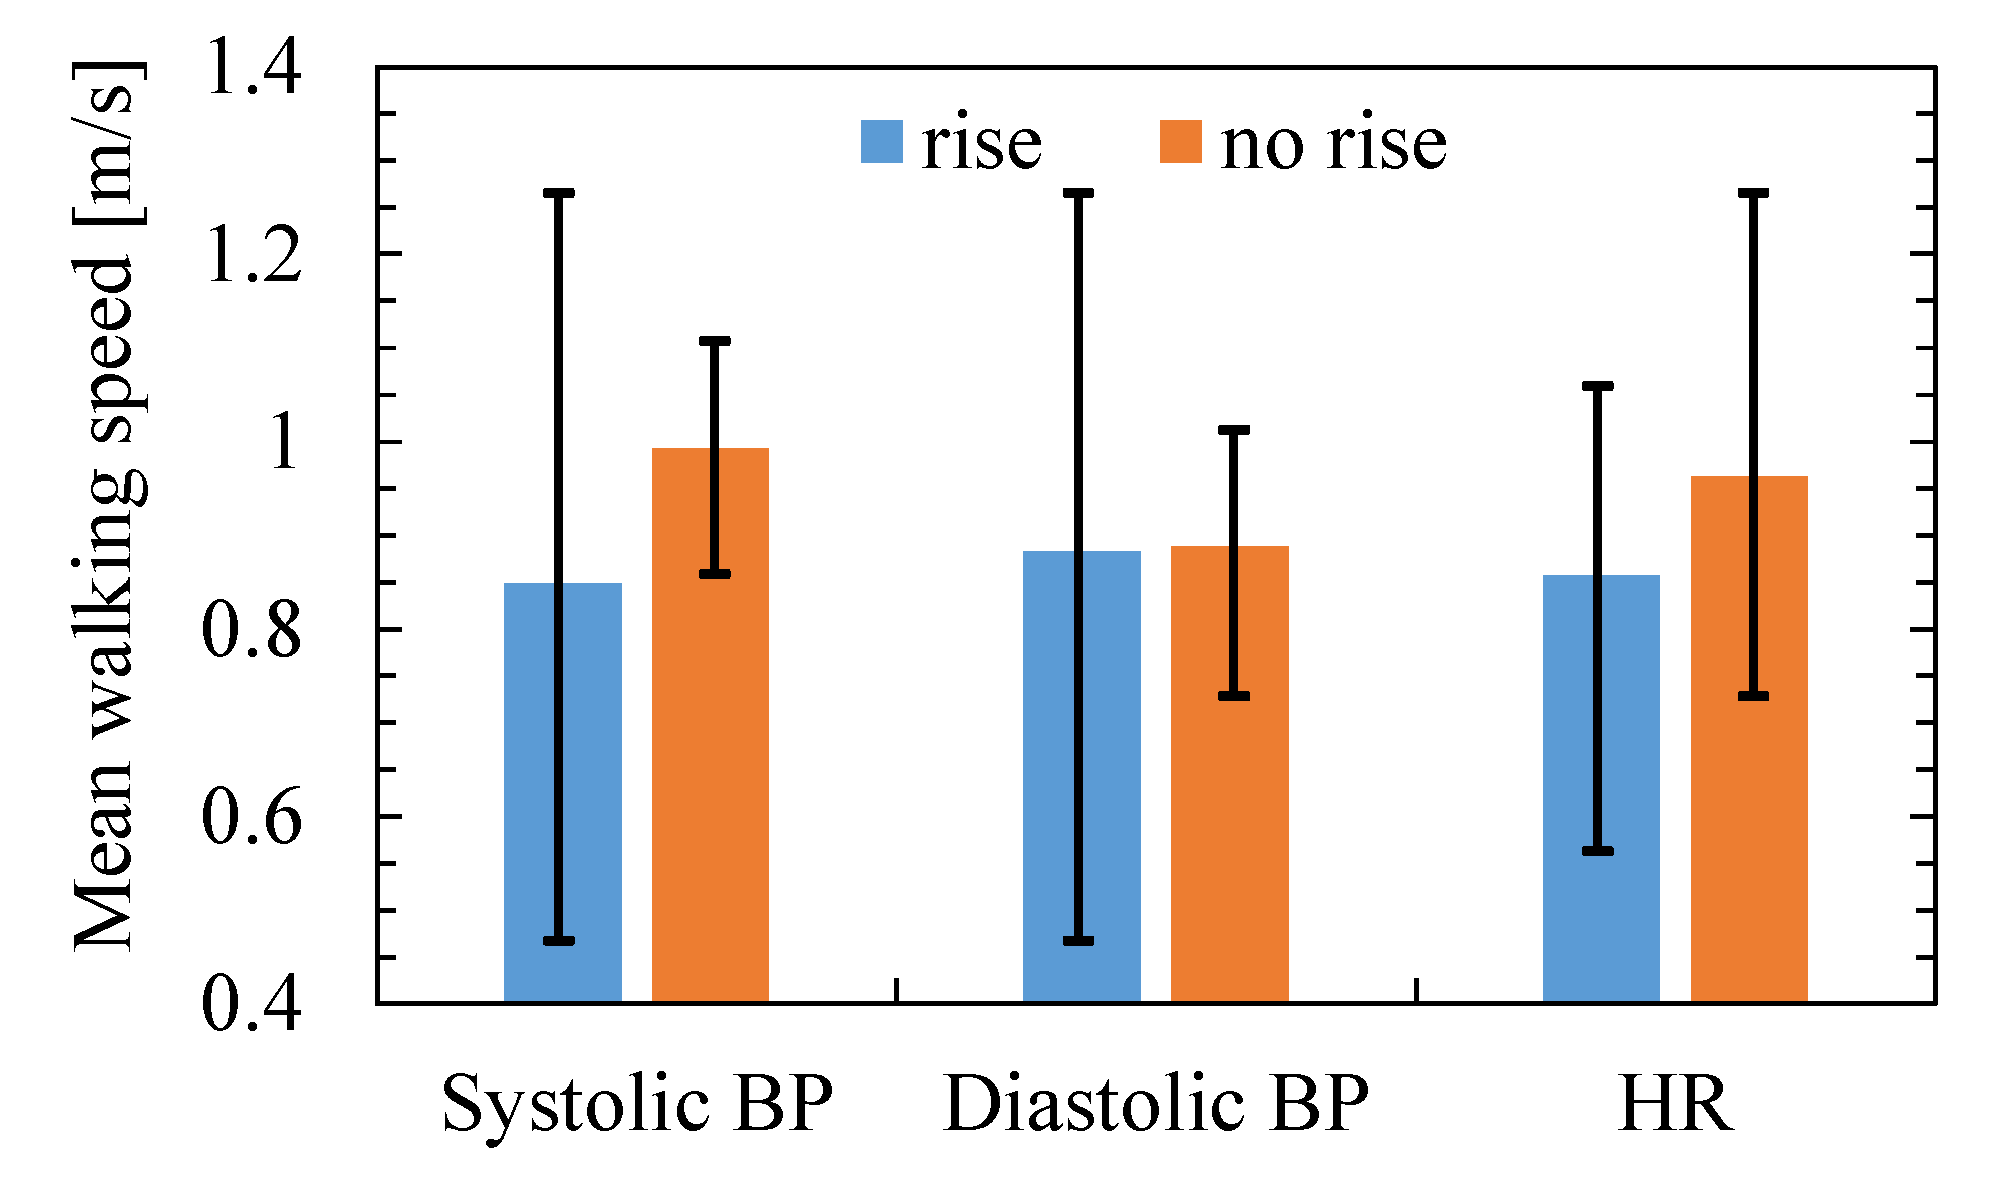
The heart rate of all subjects increased with oxytocin concentration. Two subjects (Subjects #4 and #8) had increased blood pressure, heart rate, and oxytocin. Thus, heart rate and oxytocin concentration may have some relationships. For stress assessment, the group who felt stress demonstrated a walking speed of 0.17 m/s, slower than that of the group that did not feel stress. Increases in heart rate and blood pressure due to stress also affected their motor function and inevitable slow down. Therefore, how to reduce stress and evacuate was paramount.
The subjects answered the tunnel wall as the most helpful item (chosen by eight subjects including those who gave up), followed by the unevenness (bumps) on the white lines on the road (chosen by the subjects other than those who gave up). One of the subjects became lost, saying that she could not find the unevenness (bumps) on the white lines on the road. However, the bumps can be acceptable guides in a dense smoke environment or completely dark tunnel scenario. It is significantly crucial to choose what to rely on for evacuation.
In this study, we could only collect nine samples; thus, the data were small. This study was limited by its small number of participants with fewer exclusion criteria. Hence the future tasks with large sample sizes and including both males and females should be required to provide meaningful data regarding our investigation’s potential usefulness. The ultimate goal of the program is to assess the stress and connect to the human behavior in evacuation. To the best of our knowledge, this study is the first to evaluate the stress and connect to the human behavior in evacuation. Our investigation could be useful for innovate the stress assessment. Additionally, our study assumption is significantly rare in the field of endocrinological data. To elucidate the walking speed behavior and stress, we would investigate the age of an individual, initial psychophysical conditions of an individual, respiratory volume (exposure to toxic gas concentrations), awareness of the subject who is taking a test, and detection and reaction time (the premovement time) as future tasks after overcoming COVID-19.


 ,
, 


