Article

Digital Image Correlation for Evaluation of Cracks in Reinforced Concrete Bridge Slabs

by
Christian Overgaard Christensen
1,*,
Jacob Wittrup Schmidt
2,
Philip Skov Halding
1,
Medha Kapoor
1 and
Per Goltermann
1
1
Department of Civil Engineering, Technical University of Denmark, 2800 Kgs. Lyngby, Denmark
2
Department of Built Environment, University of Aalborg, 9220 Aalborg Ø, Denmark
*
Author to whom correspondence should be addressed.
Submission received: 10 June 2021 / Revised: 1 July 2021 / Accepted: 5 July 2021 / Published: 7 July 2021
(This article belongs to the Special Issue Resilient Bridge Infrastructures)

Abstract

:
In proof-loading of concrete slab bridges, advanced monitoring methods are required for identification of stop criteria. In this study, Two-Dimensional Digital Image Correlation (2D DIC) is investigated as one of the governing measurement methods for crack detection and evaluation. The investigations are deemed to provide valuable information about DIC capabilities under different environmental conditions and to evaluate the capabilities in relation to stop criterion verifications. Three Overturned T-beam (OT) Reinforced Concrete (RC) slabs are used for the assessment. Of these, two are in situ strips (0.55 × 3.6 × 9.0 m) cut from a full-scale OT-slab bridge with a span of 9 m and one is a downscaled slab tested under laboratory conditions (0.37 × 1.7 × 8.4 m). The 2D DIC results includes full-field plots, investigation of the time of crack detection and monitoring of crack widths. Grey-level transformation was used for the in situ tests to ensure sufficient readability and results comparable to the laboratory test. Crack initiation for the laboratory test (with speckle pattern) and in situ tests (plain concrete surface) were detected at intervals of approximately 0.1 mm to 0.3 mm and 0.2 mm to 0.3 mm, respectively. Consequently, the paper evaluates a more qualitative approach to DIC test results, where crack indications and crack detection can be used as a stop criterion. It was furthermore identified that crack initiation was reached at high load levels, implying the importance of a target load.

1. Introduction

A challenge related to advanced theoretical evaluations is often the lack of available input parameters which reflects the true structural parameters such as boundary conditions, material parameters, arch effects, structural geometry and composition as well as the real load redistribution. The combined effect of these parameters is deemed to significantly influence the structural response and thus the theoretical predictions. Another challenge related to such evaluations is that the desired outcome might not be reached within the available time and economy.
Over the past decade, in situ full-scale test methods (proof-loading, diagnostic-loading, failure-loading) have gained interest as a competing method for structural capacity evaluation [1,2,3,4]. When applying in situ full-scale test methods, it can be difficult to identify the unique contribution from specific parameters to the structural response. However, the methods provide important information about the real full-scale behavior. Accordingly, the gained information can be used as a decision basis related to potential capacity upgrading, repair action, strengthening etc. and consequently life extension of existing structures. However, even with direct test results from proof- and diagnostic-loading, the real ultimate capacity of the tested structure is often up to discussion, since the margin between the predicted capacity and real ultimate capacity may be unknown and can differ depending on the bridge type.
Past studies involving high magnitude loading of bridges have shown that some capacity reserve may be available in a significant number of bridge structures [5,6,7,8,9,10,11].
Throughout the literature, loading methods vary significantly. The evolution goes from several applications where force controlled loading was used (dead load of applied heavy elements) [5,12] to the use of further developed systems with different loading beams/spreaders, involving ground anchor systems [13,14,15,16,17]. Later research shows more advanced loading systems involving hydraulic jacks [6,9,10,18,19,20,21] and more exact simulation of real wheel pressures [3,7]. It is seen that in situ test methods differ significantly, which is reflected in the related monitoring approaches and schemes as well [2].

1.1. Danish Capacity Evaluation Program

Since 2016, several one-span bridges with a span up to 12 m have been tested as part of a Danish capacity evaluation program. Two of the tested bridges were constructed as OT-slab bridges (OT-beams with in situ concrete cast on top). The test results showed significantly higher capacities than estimated theoretically and no signs of significant structural distress, even at load levels higher than predicted capacity. The test results include output from separately controlled hydraulic jacks and several different monitoring sources (multistation, Linear Variable Displacement Transducers (LVDTs), distance lasers, 2D DIC) [3,22]. The gained information provided important knowledge about the structural behavior and as a result, the OT-slab was evaluated to behave as a plate rather than separately activated beams. Models for orthotopically reinforced slabs with construction joints and partial construction joints were developed to verify this interaction [4,23,24]. In addition to these evaluations, laboratory tests of downscaled OT-slabs were initiated; one is included in this paper.

1.2. The Danish Classification System

In Denmark, administration and control of heavy vehicles are handled through a unique classification system [25,26]. In this system, both vehicles and bridges are categorized in classes. The vehicle class is based on the total weight of the vehicle combined with a unique axle load configuration (i.e., Class 80, 100, 120 tonne vehicle). The bridge class is based on the highest vehicle class (and related unique axle configuration) that can pass the bridge without compromising the ultimate bridge capacity. Consequently, a heavy transport route can be approved, if all bridges on the route have a class higher than (or identical to) the desired vehicle class.
A strategic Danish road map based on the classification system has been developed during the past decades [27]. This map has information concerning dedicated routes for Class 100 vehicles, where such vehicles do not require a special permit. However, the number of heavy vehicles has increased significantly during the past decade, which has resulted in a significant demand for capacity upgrading and thus expanding of the heavy vehicle road map.
The classification system provides an excellent basis for a systematic handling of the heavy vehicles but also defines desired loading threshold values. Axle load configuration, load magnitude and position of the vehicle are described in detail in the Danish road directorate guidelines [26].
In a full-scale load test, the loading positions and magnitude related to a desired vehicle class can therefore be applied in accordance with the guidelines [3]. This gives a reduced uncertainty concerning load placing and magnitude, and also provides a threshold related to target load. The target load serves as the primary threshold used as a stop criterion when performing proof-loading. It is, however, a somewhat dynamic value, since the proof-loading is performed to verify or falsify a certain bridge class. A possibility is also that the bridge class is lower than estimated, which can result in a class reduction and potentially structural damage during proof-loading. The target load should therefore be supported by several other stop criteria often generated through different monitoring schemes.

1.3. Monitoring and Stop Criteria

Advanced monitoring and associated stop criteria are essential when performing proof- and diagnostic-load tests on existing concrete structures to make sure that the test does not cause irreversible damage. Several countries have national guidelines for diagnostic and proof-loading of structures, e.g., [28,29], but few present stop criteria and the knowledge related to bridge testing stop criteria provisions are limited.
Research has recently been carried out in regards to gathering stop criteria from different national guidelines as well as combining these in a proposal for flexural stop criteria for concrete bridges [30]. Earlier work has also involved stop criteria related to shear failure mechanisms, but this is still under further development [31,32,33,34,35,36] due to the potentially brittle nature of such failure mechanisms.
A stop criterion can be divided into qualitative and quantitative thresholds. The quantitative stop criteria can be based on strain, crack width, stiffness reduction, etc., whereas the qualitative stop criteria can be based on deformation profiles, load/deflection diagram, crack detection and overall structural behavior, all combined with engineering judgement.
In this study, a special focus is dedicated to 2D DIC, which seems to provide an excellent mean to meet a number of the described criteria such as deformation evaluation, strain, crack identification, structural behavior evaluations, etc. However, other promising methods for assessment of crack distributions do exist and one worth mentioning is the use of fiber optic sensors, as recent studies show how it is possible to detect, locate, trace, quantify and visualize cracks during the processes of their initiation and propagation [37].
Evaluating a concrete surface by the use of 2D DIC generates pseudo deformation from out-of-plane movement and rotation of the surface. Theoretically, it is possible to correct for such geometrical errors, but an exact correcting for precision measurements on full field data has proven challenging [38,39,40]. Preliminary work on this was performed by [39]. This research concerned evaluations regarding initial crack detection, crack width monitoring and crack width correction for out-of-plane movement and rotation. The significance of these has yet to be quantified towards stop criteria reliability in proof-load testing.
Of the mentioned guidelines, the German guidelines offer stop criteria for crack widths in buildings, wmax ≤ 0.5 mm for new cracks and wmax ≤ 0.3 mm for existing cracks. A more recent theoretically based criteria is proposed by [30]. In the presented research, the calculated values for crack widths vary from wmax ≤ 0.11 mm to wmax ≤ 0.19 mm. In addition, it is proposed that crack widths w ≤ 0.05 mm should not be considered cracks.
For most exposure classes, the maximum allowable crack width for service limit loads for concrete members by EN 1992-1-1 (EC2) is wmax ≤ 0.2 mm for pre-stressed members with bonded tendons and wmax ≤ 0.3 mm for non-prestressed structures [41]. It remains an open discussion what threshold should be used in proof-loadings, but it can be argued that similar or higher values should be acceptable in a proof-loading.
Further work is required on quantifying these thresholds and validating them with in situ bridge testing, where environmental conditions may significantly influence the monitoring results and reliability. Consequently, a link between monitoring in laboratory conditions and full-scale condition should be provided, considering the very different environments.
When evaluating stop criteria for in situ tests, it is important to assess the precision of the monitoring equipment under the given environmental circumstances. DIC monitoring precision may be affected by numerous environmental circumstances such as change in light exposure, humidity, temperature and wind, but also variation of lighting over the covered surface, contrast pattern detection, reflections and increased possibility of human error in placing of the system.
A stop criterion should show sufficient margin of safety, but should also not be overly conservative [30]. It therefore seems important to investigate what level of precision is needed for a stop criterion to work as intended, but also what level of reliability it is possible to obtain in an in situ environment. For example, out-of-plane movement towards the DIC camera will cause pseudo deformation, which will make strain and crack widths appear larger than reality. Thereby, the measured values are hypothesized to provide the basis for a timely termination of the test with a sufficient margin of safety, all though the in situ test may be prone to premature termination.
The scope of this paper is to investigate the capabilities of 2D DIC as a method to monitor stop criteria in in situ proof-loadings for a systematic reclassification of concrete bridges. A special attention is paid to crack detection and crack width measurement and related structural behavior. In this regard, a link between testing in laboratory conditions and in situ proof-loading is provided, where reliability load/deflection curve and target load and sources of error and its effect on the primary aspects of the results are evaluated. In this evaluation, OT-slabs are used as basis for the evaluations.

2. Structural Composition and Test Series

An OT-slab bridge consists of multiple overturned prefabricated pretensioned T-beams, which are joined to a slab by casting concrete on top, as seen in Figure 1. Transverse reinforcement is used to bond the beam elements together. The amount of transverse reinforcement is of significant importance to the structural behavior and thus the capacity of the bridges.

2.1. Full-Scale Bridge Tests

The two previously tested OT-slab bridges were tested in Jutland, Denmark, in summer of 2016 and winter of 2017 [3] (example photograph in Figure 2). The bridges were similar in composition and appearance with a difference in span only. Bridge 1 (422-0-005, Underpass of Foldagervej (road)) had a span of 11 m and Bridge 2 (422-0-009, Underpass of Rosmosevej (road)) had a span of 9 m. Both had a width of 12.2 m (37 beams). The in situ cast concrete was covered with a layer of protecting concrete, a thin bitumen membrane and finally a relatively thick asphalt layer.
The first bridge reached a maximum load of 4482 kN (axle load above 100 tonnes) with a corresponding deflection of 21 mm at mid-span, while the second bridge reached a maximum load of 4650 kN (axle load above 100 tonnes) with a corresponding deflection of only 9 mm. The monitoring setup included measurements from a land surveying multistation, LVDTs, distance lasers and strain gauges, as well as output from the hydraulic jacks which were controlled in pairs (analog to each wheel of a heavy vehicle) and deformation measurements between the test rig parts [3]. Two-Dimensional Digital Image Correlation was used to investigate crack initiations as well as the structural behavior. In addition, an important aspect was also the applicability of the system when used in situ.
No visible cracks were observed on the bottom surface at these load levels, when an axle load of approximately 9 times higher than the theoretically estimated capacity was reached [3].
One of the main project scopes was to evaluate if a higher capacity than originally evaluated could be reached. In addition, the high magnitude loading was aimed at reaching a response beyond the elastic domain. Due to the magnitude of the capacity, this was not reached, but the tests provided a good result for the project team and the bridge owner.
Results for monitoring in a proof-loading situation was limited since it was still an open question how the structure and the equipment would behave under large deflections. It was therefore decided to cut two strips from Bridge 2 to enable this evaluation.

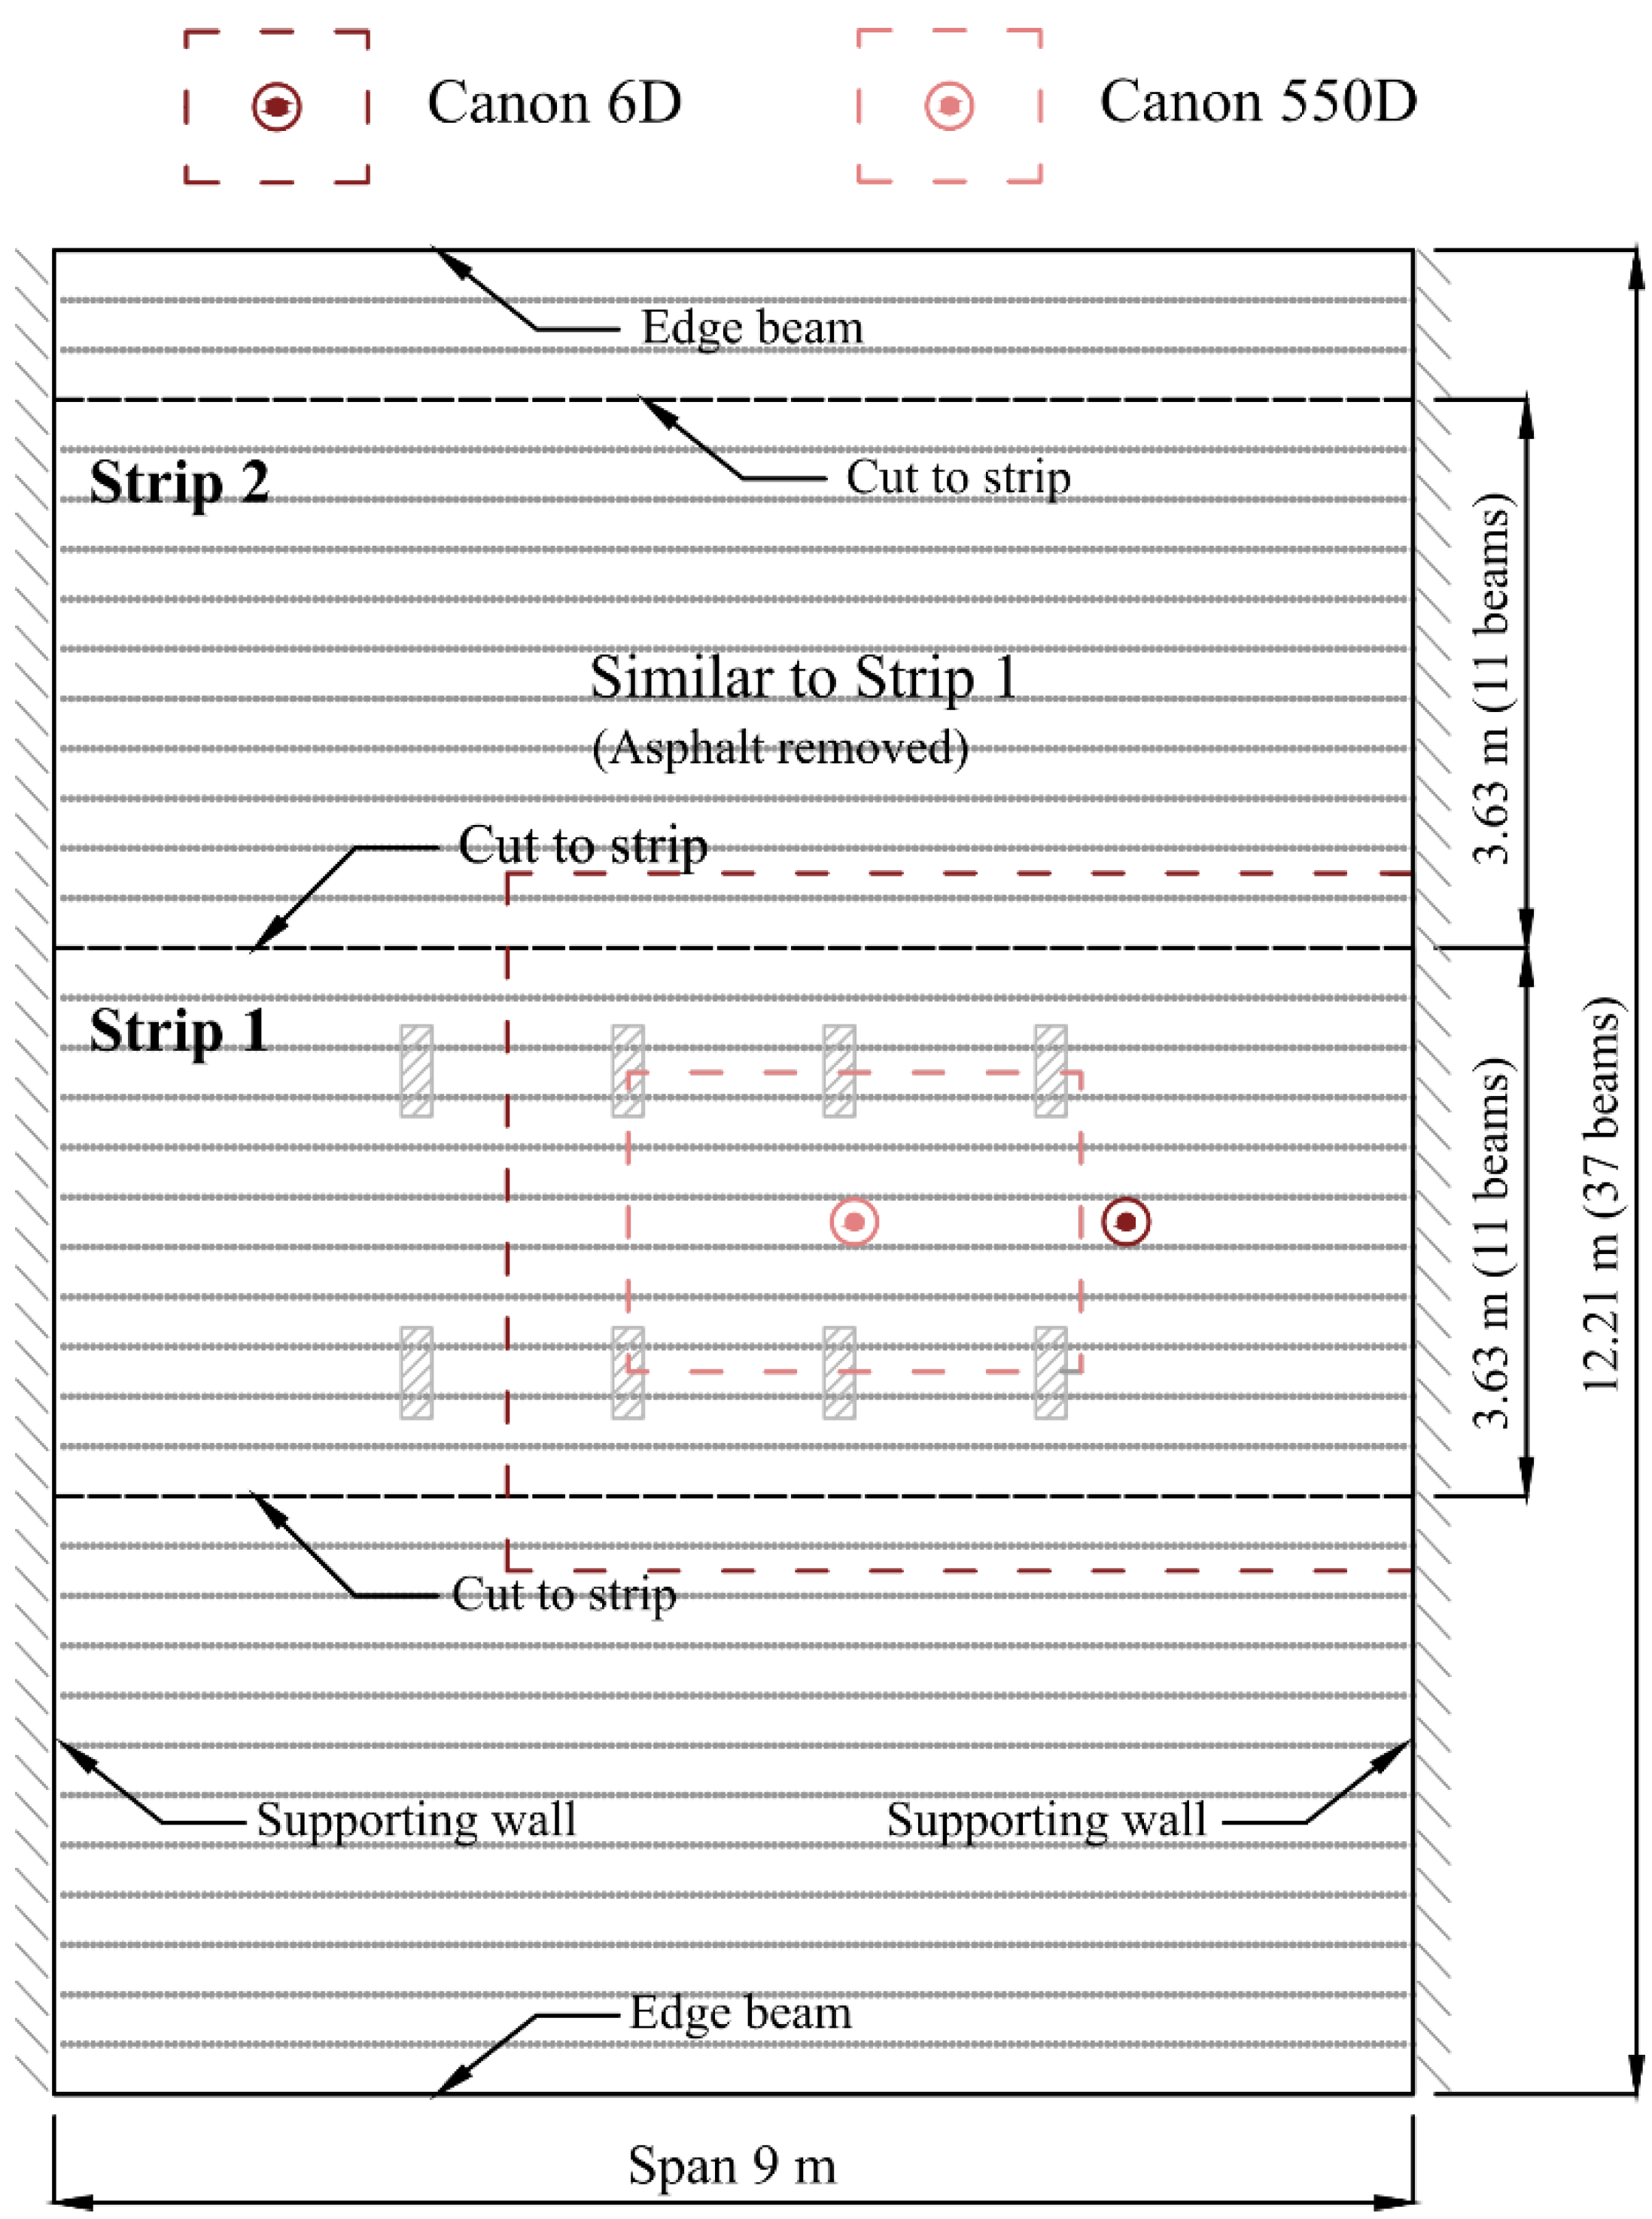
2.2. Strip Tests 1 and 2

Figure 3 depicts the two 3.63 m (11 beams) wide strips cut from Bridge 2, as well as the load configuration, wheel pressure zones and DIC setup. The load setup was designed for the bridge tests to match a vehicle load configuration according to the Danish classification system similar to the setup used on the intact bridge before the strips were cut [3]. Normally, a lighter vehicle B is placed approximately 200 mm from vehicle A in the side lane. However, only vehicle A could be situated on the strips, and vehicle B was therefore neglected. Strip 1 was tested with the full road build-up consisting of a bitumen layer, a protective concrete layer and an asphalt layer. Strip 2 was tested with the asphalt layer removed.
The DIC setup consisted of two cameras with coverage as shown in Figure 3. The primary DIC camera was a Canon 6D with 20 Megapixel (Mpx) resolution camera with a wide-angle lens (Canon EF 16-35 mm f/2.8L II USM). It was placed to cover across mid-span, all the way to one of the supports. The camera distance was 3.8 m from lens to bridge surface in both tests. In both tests, a secondary camera was placed closer to mid-span and closer to the surface (camera distance 2.6 m). The camera was a Canon 550D with 18.7 Mpx with a regular lens (Canon EF-S 18–55 mm f/3.5–5.6 IS). Images were captured every 3 min. No surface pattern and no light sources were applied due to time limitations and since the natural pattern of the concrete surface was sufficient for analysis. For other in situ tests, it may be necessary to apply both surface pattern and light sources (soft/ambient lighting is to be preferred to avoid reflections). In addition, the captured images can be improved by adjusting the balance between camera parameters such as ISO, shutter speed and aperture.

2.3. Scaled Laboratory Tests

The laboratory test was carried out in the Structural Lab at the Technical University of Denmark in spring 2020. Testing in the laboratory offer a more controlled environment, where adjustments are easier to perform and the full detailed slab behavior can be followed more closely. Consequently, a large monitoring package can be applied due to increased accessibility to the slab. Three of the primary reasons for doing the test were:
  • To investigate the transverse shear transfer of load between OT-beam elements.
  • To evaluate crack initiation threshold in situ and compare these to results gained in laboratory conditions.
  • Provide experience with testing and monitoring for future application in in situ tests.

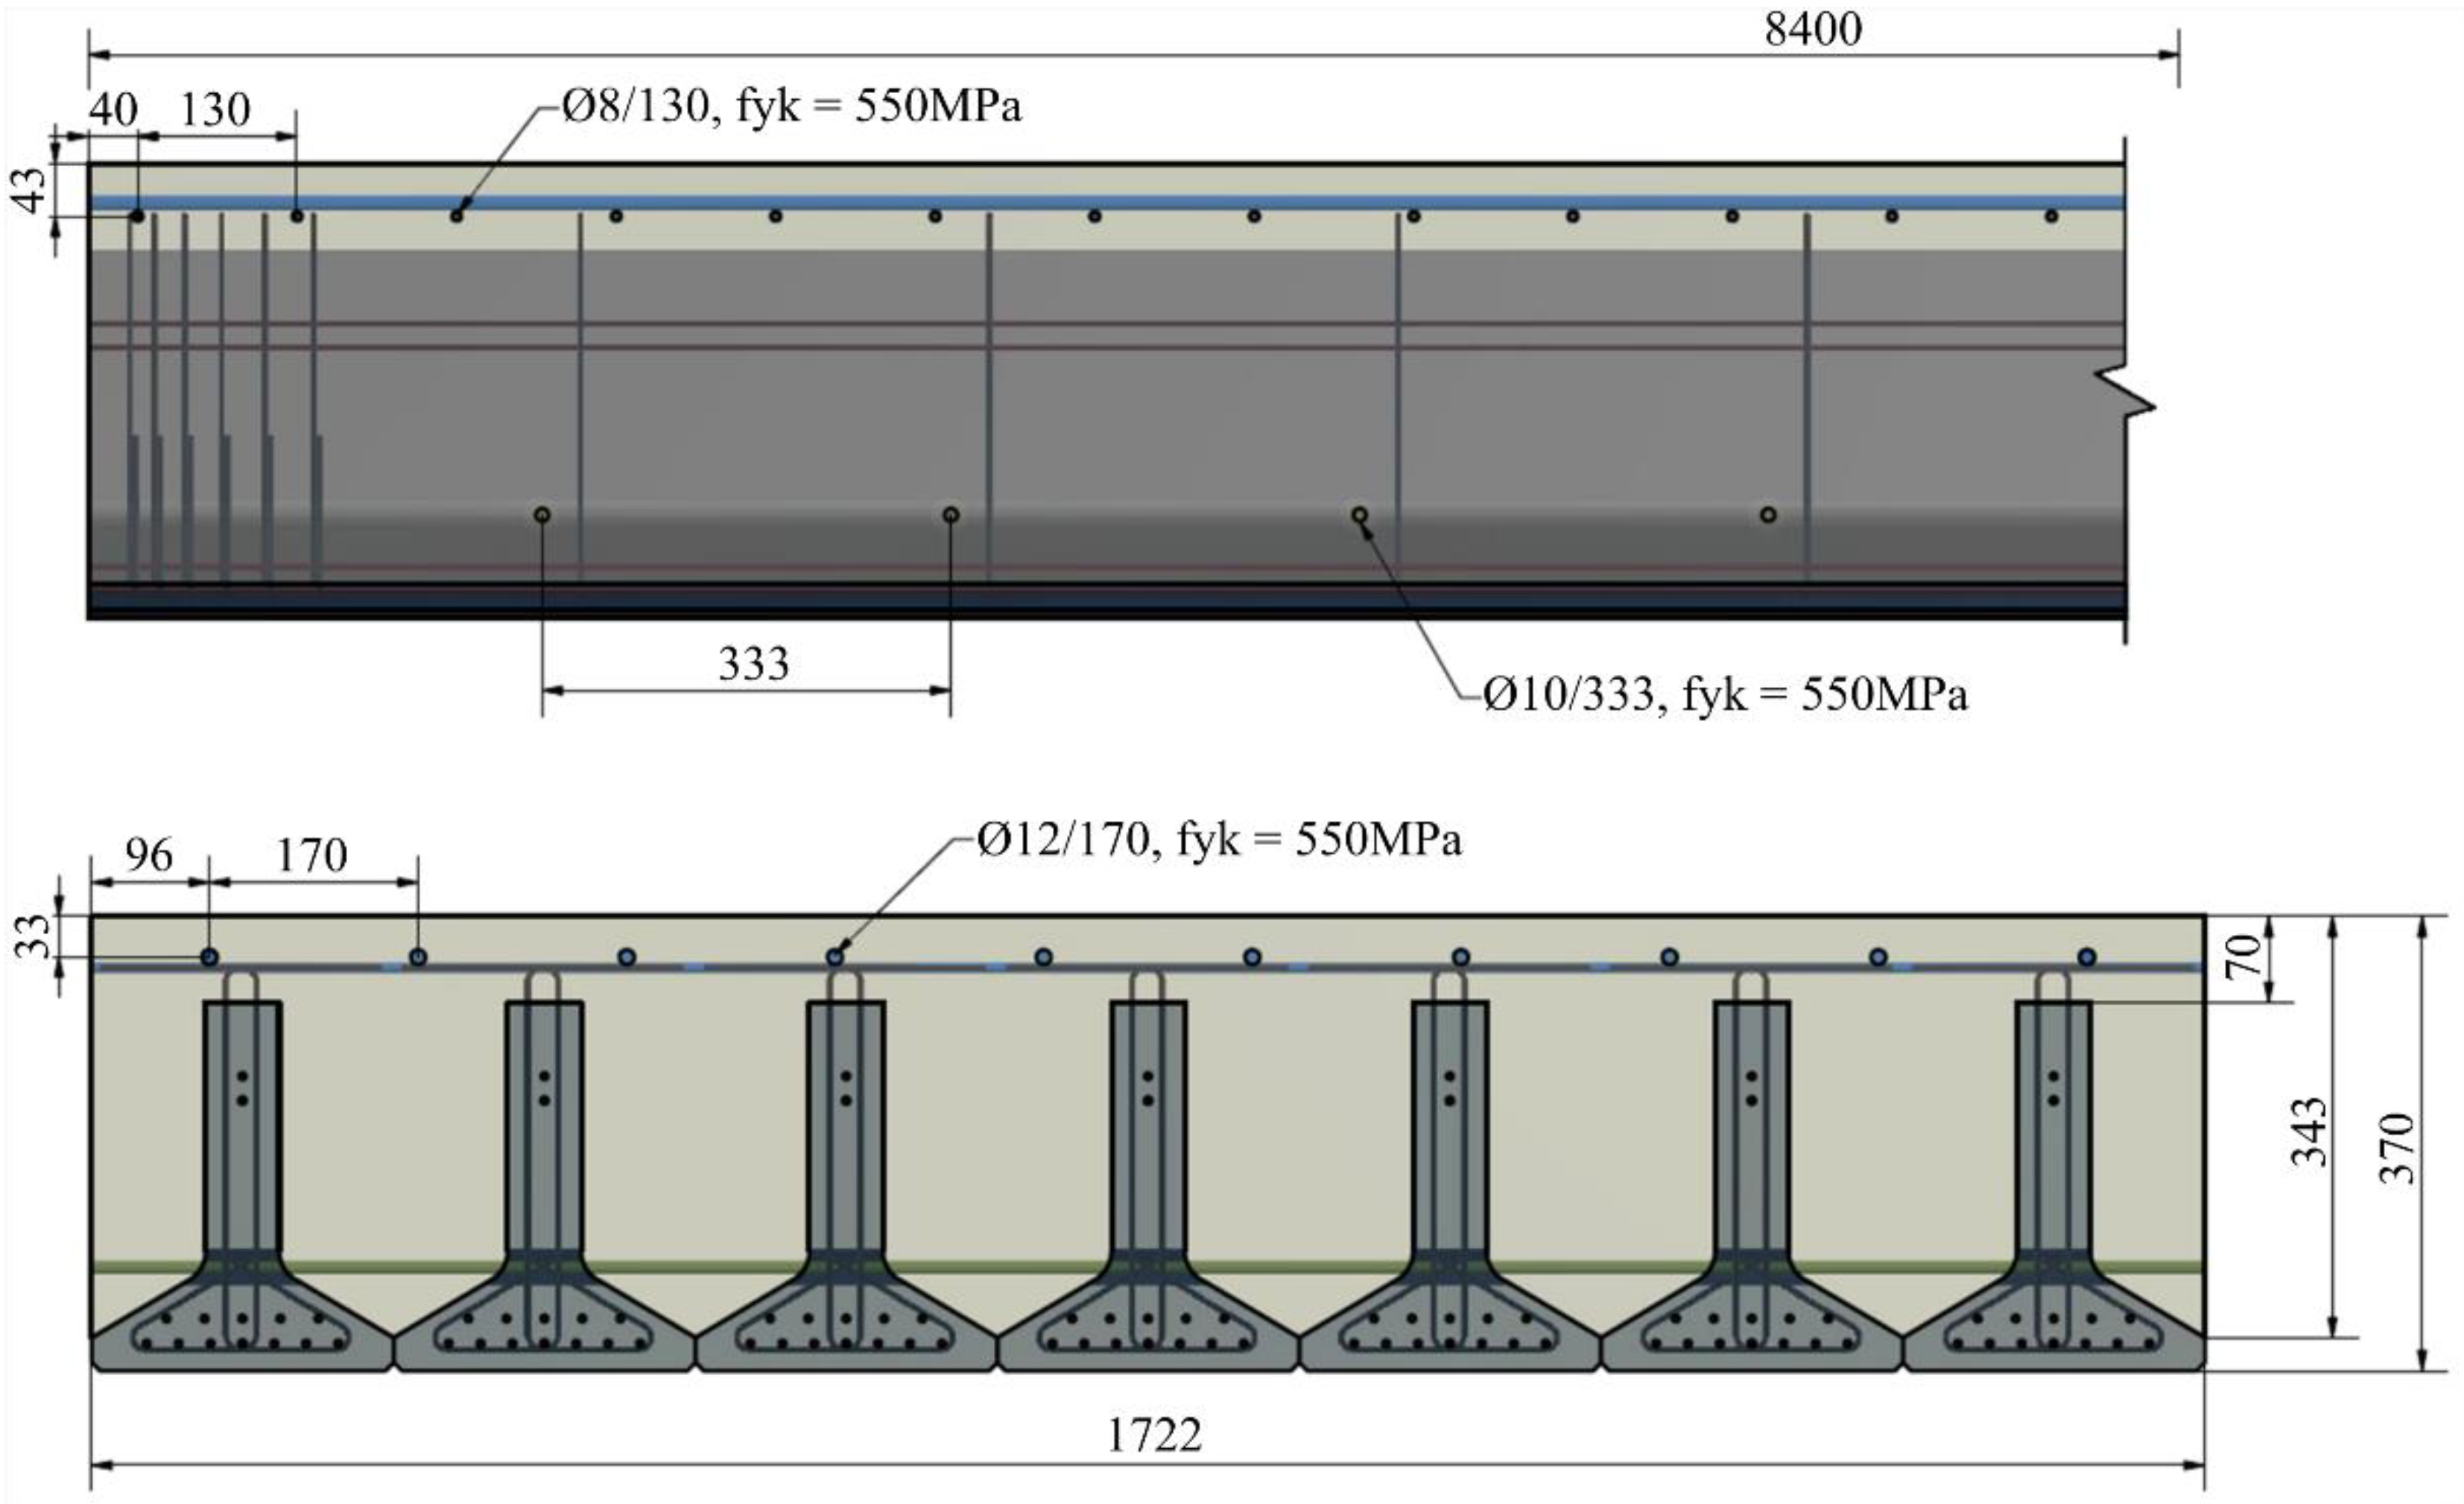
2.3.1. Laboratory Test Specimen

The test specimen (and setup) was designed to provide a high load transfer in the interface between the individual beam elements. The OT-beams used for the slab specimen were slightly downscaled versions of the OT-beams of Bridge 2. The beams in Bridge 2 had a width and height of 330 mm and 450 mm, respectively, whereas the down-scaled beams have a width and height of 246 mm and 300 mm, respectively.
The downscaled slab had a length of 8400 mm and consisted of seven OT-beams for a total width of 1722 mm. The beams had concrete with fck = 45 MPa and longitudinal prestressed rebars with fu = 1800 MPa. The total slab had a thickness of 370 mm and a total weight of 13.5 tons, including the top concrete (fck = 30 MPa). Figure 4 shows a drawing of the downscaled OT-slab. Transverse reinforcement (Y10/333) was placed in the web of the OT-beams and net reinforcement was placed in the top of the slab (Y8/130 in transverse direction and Y12/170 in longitudinal direction). Added reinforcement had fyk = 550 MPa.

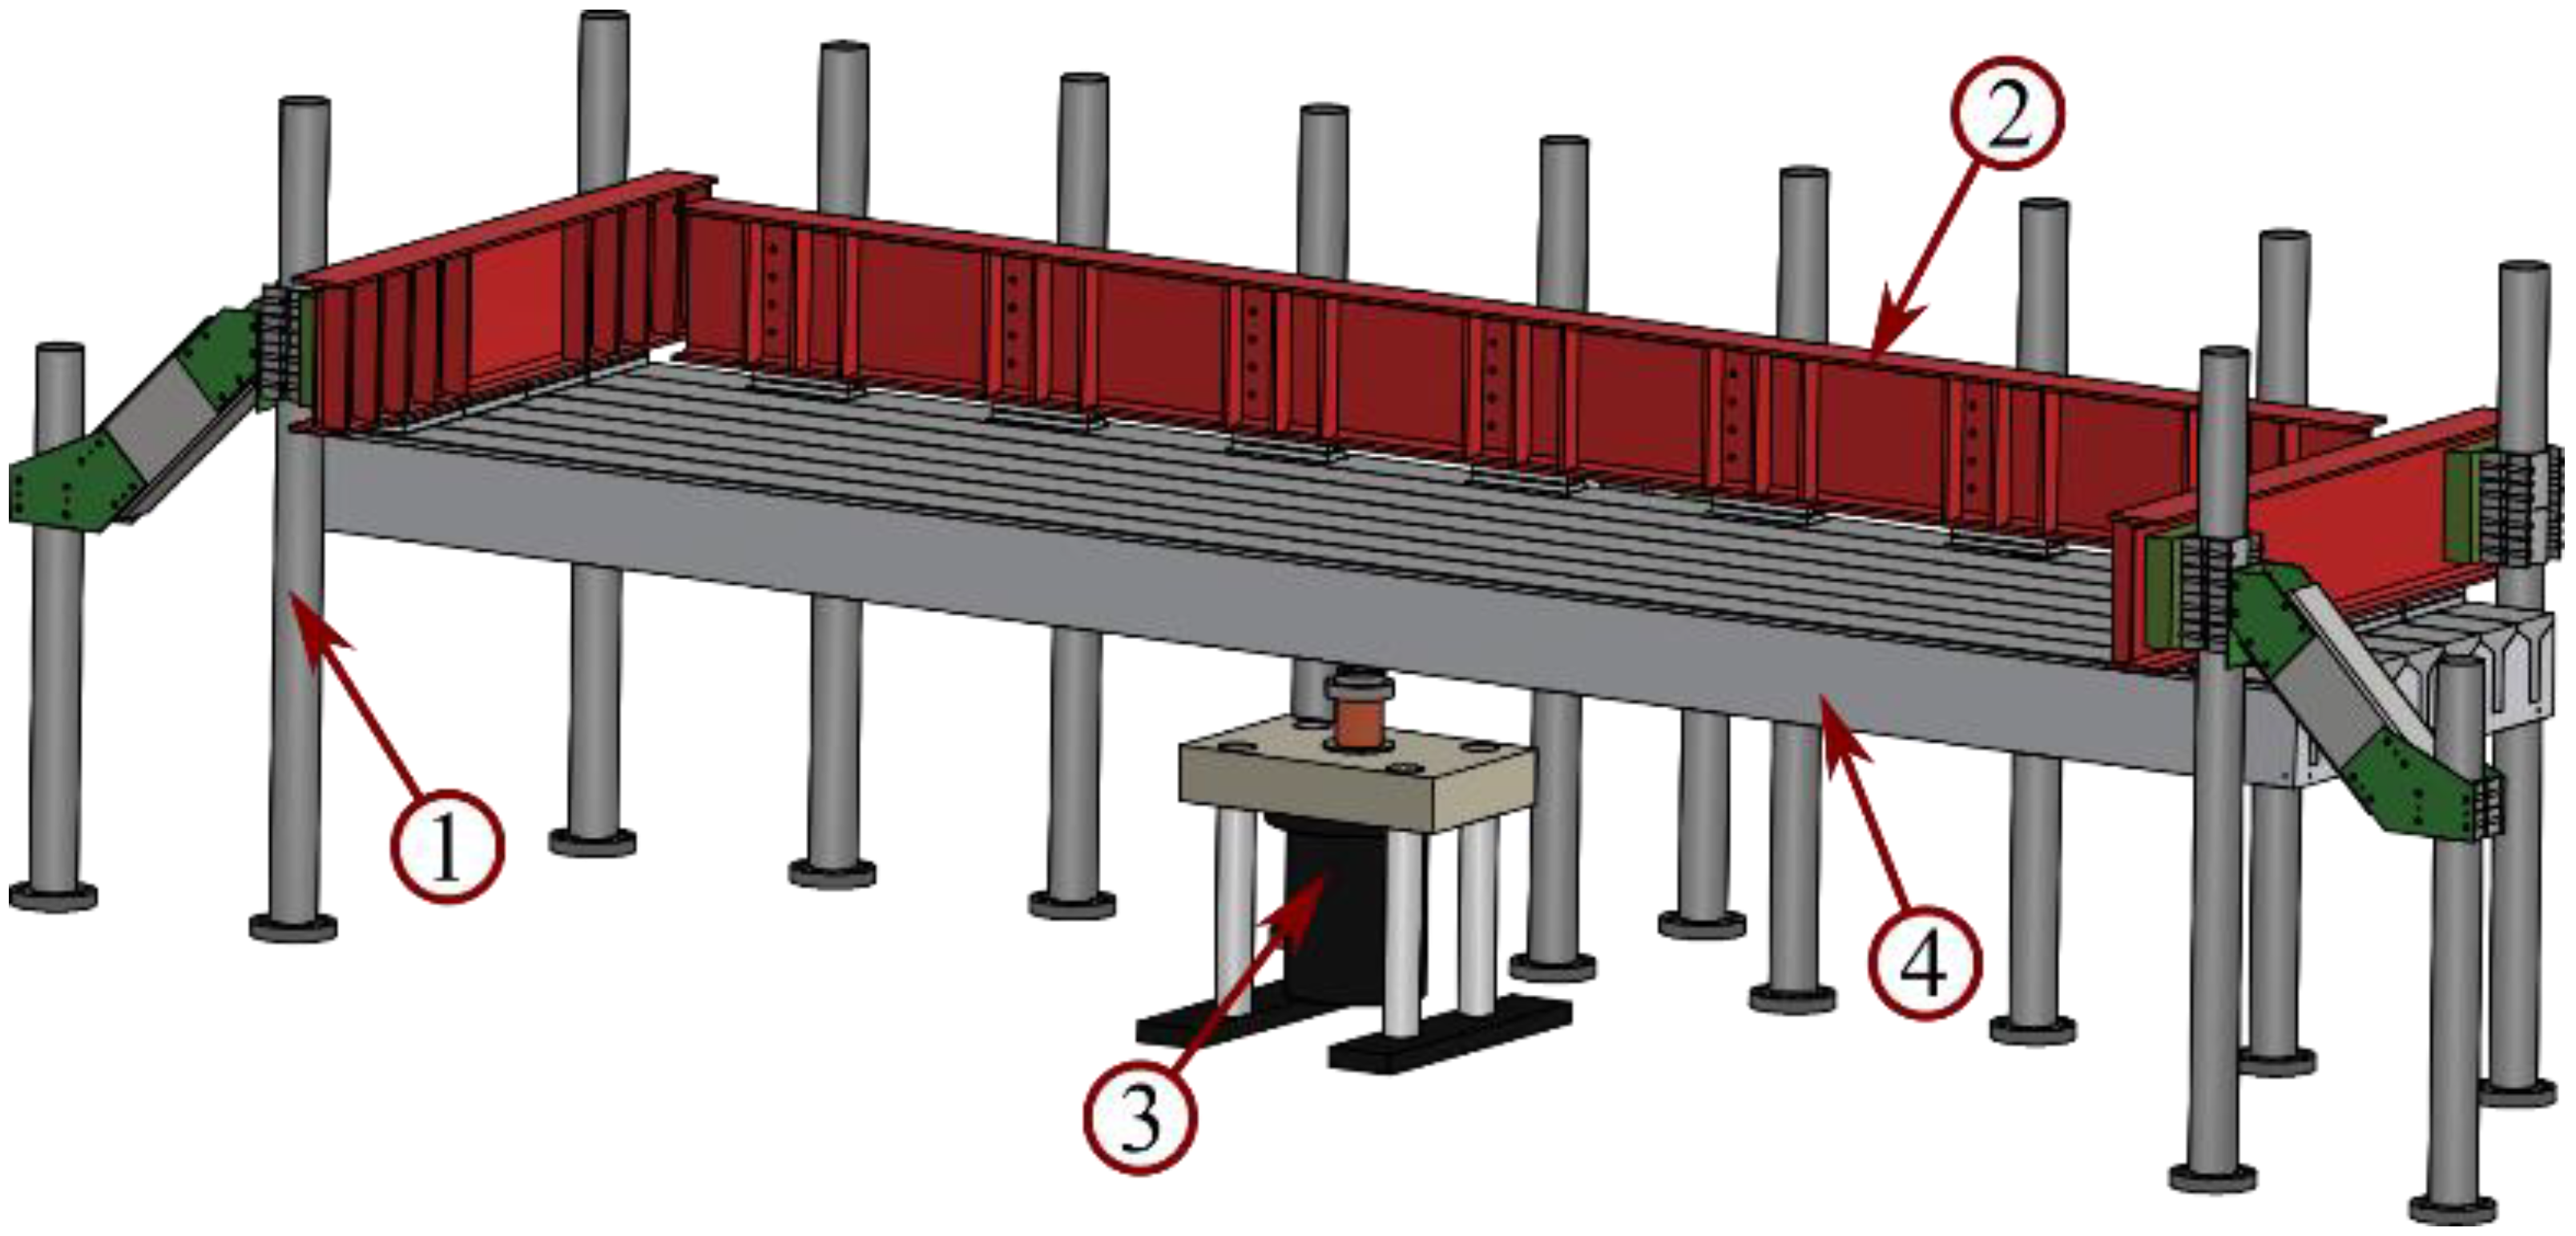
2.3.2. Laboratory Test Setup

The primary components of the test setup are depicted in Figure 5. These include (1) multiple load-carrying columns with three stiffeners, (2) horizontal I-profiles along three edges for support along with pinned bearings between the profiles and the slab surface, (3) the primary actuator used for load application and (4) the OT-slab. The described setup provides a transverse span of 1599 mm and a longitudinal span of 7569 mm as also depicted in Figure 6.
It is seen that the slab was tested upside-down. One of the significant benefits of this is that it makes it possible to achieve a camera distance similar to the in situ bridge tests. This provides a more solid basis for comparison.
Loading was performed using a deformation controlled hydraulic actuator with a capacity of 2 MN. The loading point was placed in the plate centerline, approximately 492 mm from the free edge (between beam number two and three), see Figure 6. This ensured a high shear transfer between the OT-beams. The load was applied as a point load with a deformation-controlled load rate of 1 mm/min and a load distribution plate of approximately 35 × 45 cm.

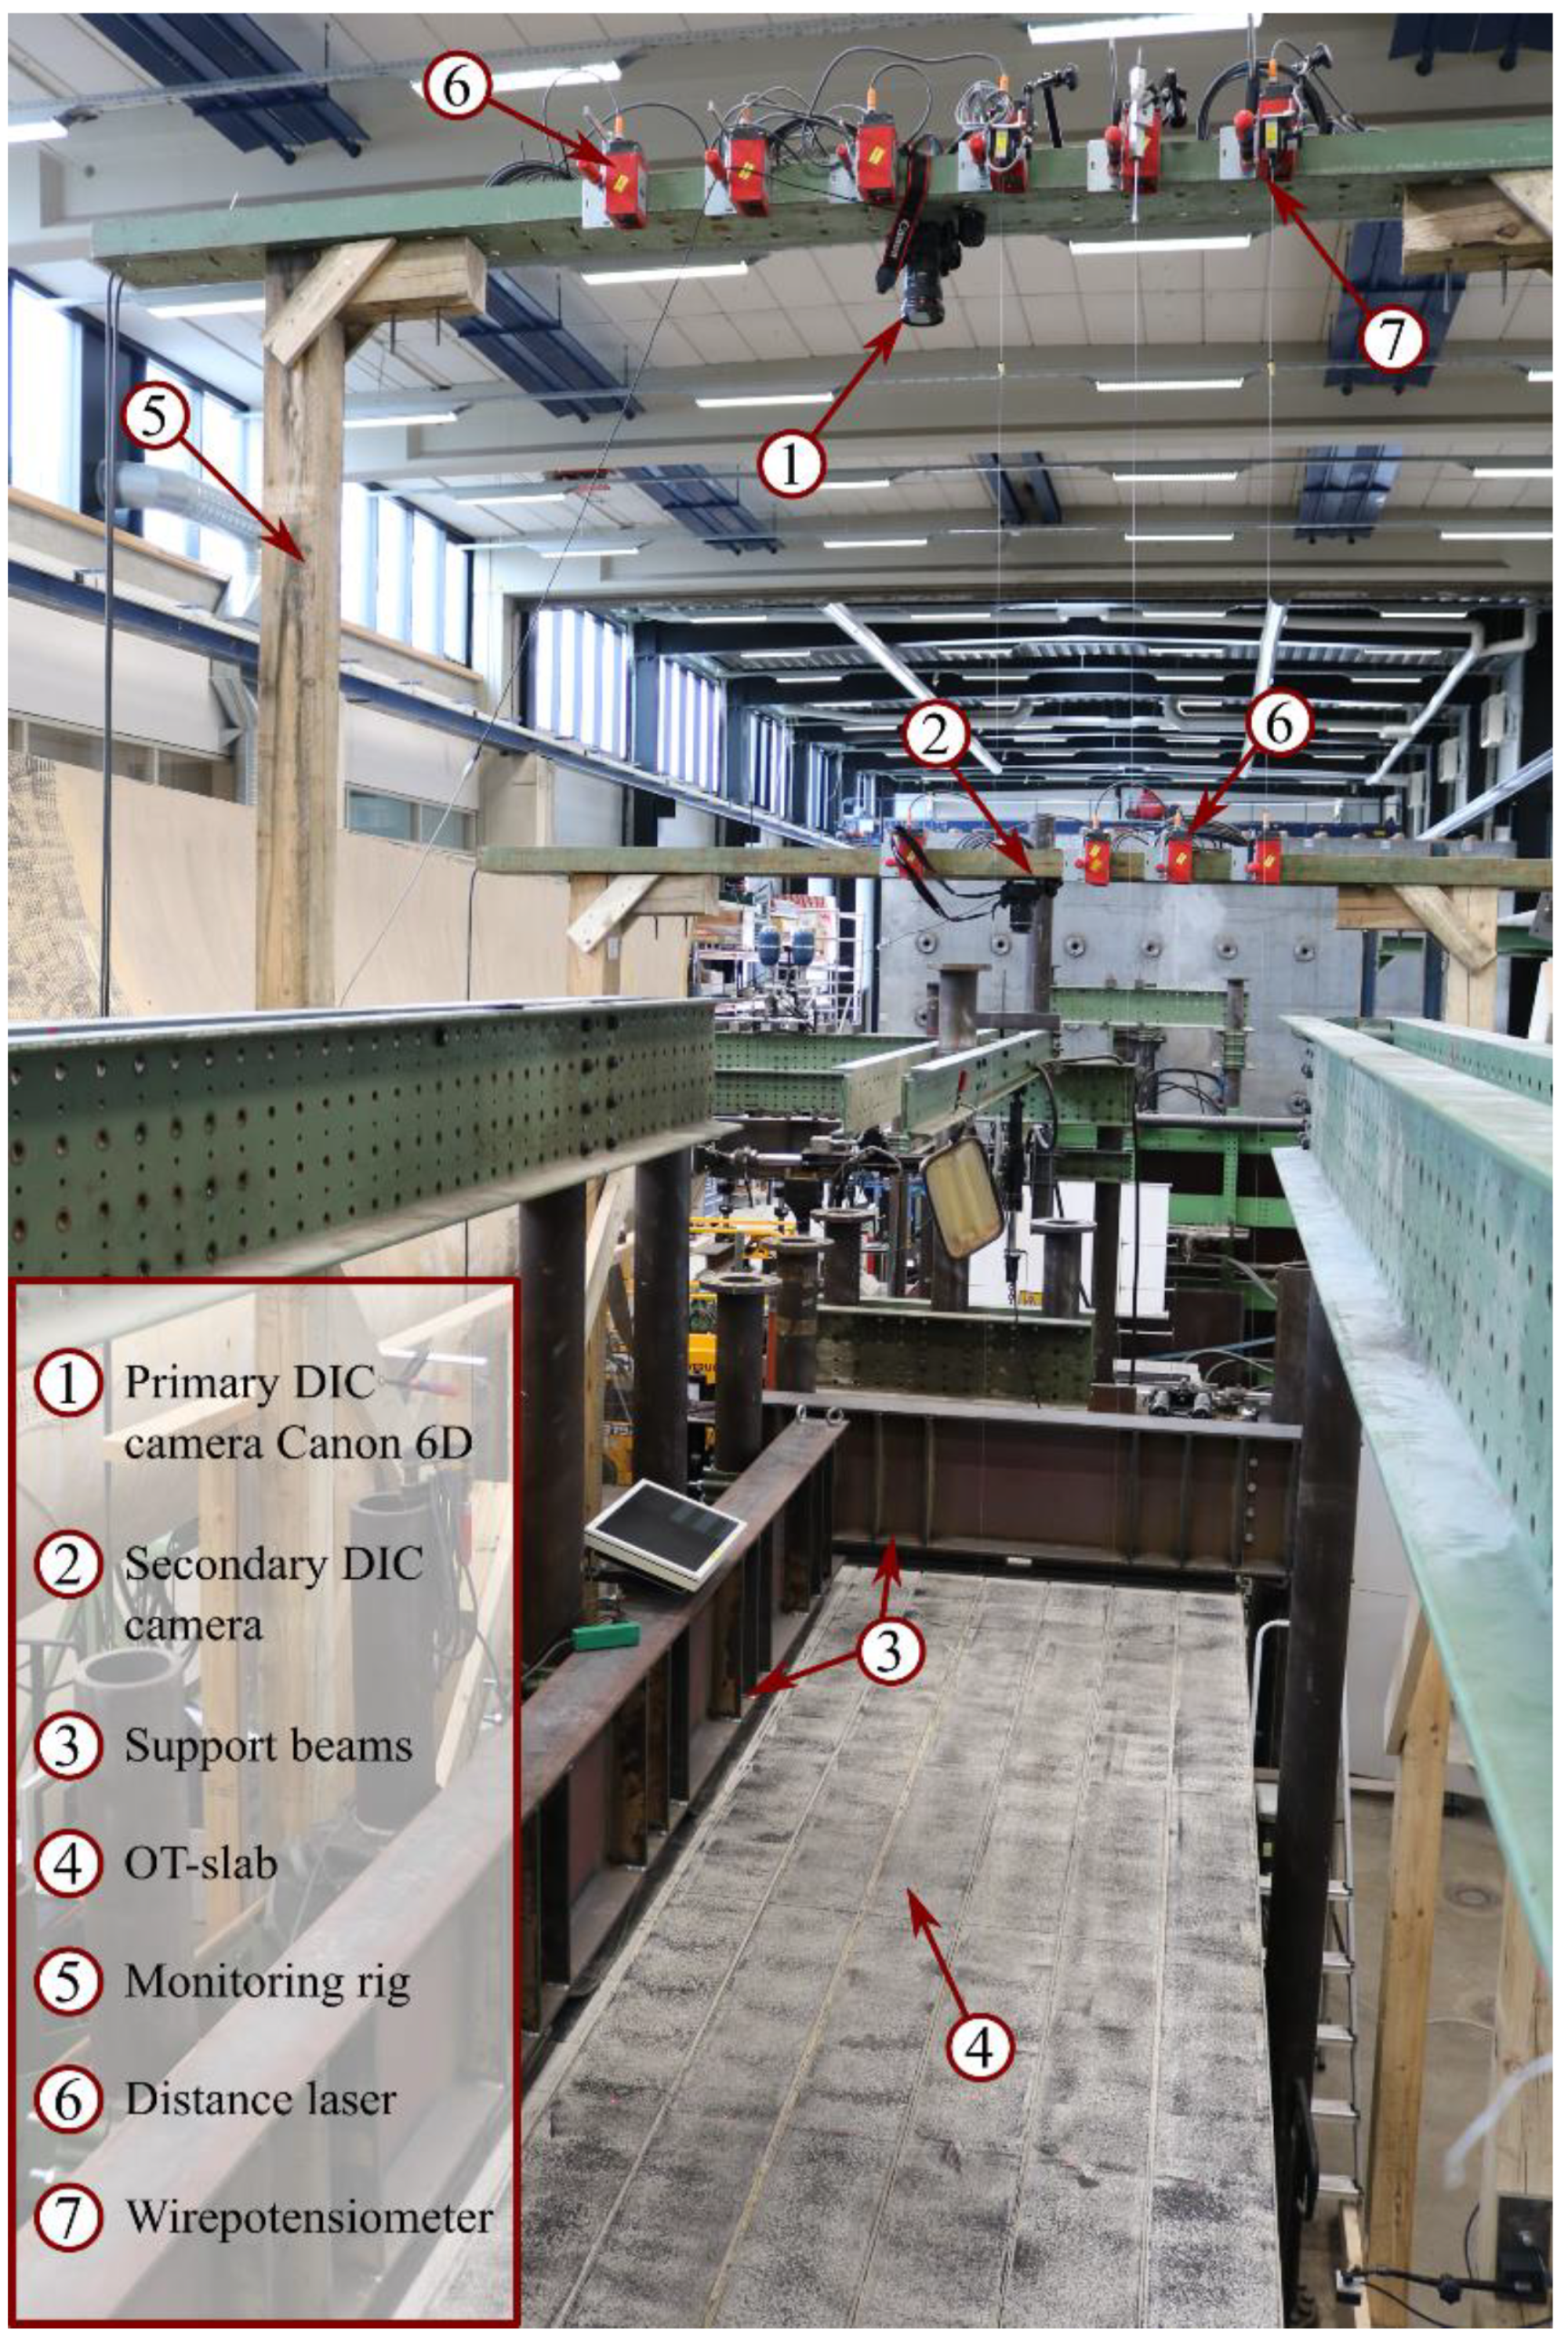
2.3.3. Laboratory Test Monitoring

The monitoring setup consisted of LVDTs, wire potentiometers and distance lasers for deflection measurements, strain gauges for strain monitoring in the transverse reinforcement and 2D DIC for full field surface evaluation of deformations and cracks. An independent monitoring rig was constructed around the test setup with no physical contact between the two, as seen in Figure 7. Consequently, all measurement devices could be mounted independently of the test setup and errors from setup movement could be avoided.
The primary DIC camera was a Canon 6D with 20 Mpx resolution camera and a wide-angle lens (Canon EF 16–35 mm f/2.8L II USM) used to capture the full surface of the slab, see Figure 6 for camera coverage. The camera distance was 3.8 m to provide a correlation with the previous in situ tests. Other secondary cameras were applied in locations of interest closer to the surface. Based on experience from the strip tests, the image capture rate was reduced to 10 s. The surface was covered in a contrast pattern (see Figure 8) and no lighting except for the laboratory overhead lighting was applied. The surface pattern was applied using a structure paint roller, which from experience works well for such an application. Multiple preliminary tests were performed to verify this.

2.4. DIC Monitoring Setup Comparison

The test setup of the laboratory test was aimed to provide a good basis for comparison with the DIC results generated from the in situ tests. Table 1 shows a comparison between the in situ setup and the laboratory test. The depicted observations regard camera position, orientation and distance, as well as speckle pattern and lighting information along with image capture interval.

3. Experimental Results and Analysis

3.1. Laboratory Test

The lab test was loaded to a maximum load of 819 kN, which resulted in a deflection of 125 mm (at the loading point). At this point, the testing was stopped since concrete crushing had already occurred in the two outer OT-beams, even though it is not visible in the load/deflection curve. In addition, large deformations were obtained, which could potentially lead to damage of the test rig.
All plots in this section show strain in x-direction for the best possible comparison with the strip tests, this even though the y-direction could also be relevant for the lab test.

3.1.1. Laboratory Test Pattern Recognition

All DIC analyses were performed using the commercial DIC software GOM Correlate [42]. When working with GOM, the creation of a surface component offers the possibility to evaluate the pattern quality, where the reference image is matched to the deformed image. This function shows the readability of the Region Of Interest (ROI) in terms of color ranging from green (good) to red (bad) and no color (not recognizable). The readability can be affected by multiple factors:
  • Whether a speckle pattern is applied;
  • Whether the pattern (applied or not) has the right speckle size—too small or too large speckles, in conjunction with choice of subset size, can have a negative effect on the readability and results [40,43,44];
  • Whether the grey level distribution within the pattern is sufficient [43];
  • Undesirable lighting and reflections on the surface affect the above points;
  • Changes in lighting or reflections during testing affects the algorithm’s ability to match the image patterns.
The captured surface for the lab test can be seen in Figure 9a, where the applied pattern is evenly distributed, has a good contrast and the lighting is uniform (for a large-scale test). The choice of subset size and point distance relies much on the composition of the surface pattern. In the laboratory test, the pattern size is well defined and the preferred subset size and point distance (by experience) are between 30/10 and 45/15 (size/distance), but can go down to as small as 15/5, which is useful for crack detection. Using the pattern quality function in GOM, this gives an excellent recognition of the surface; see Figure 9b for 45/15.

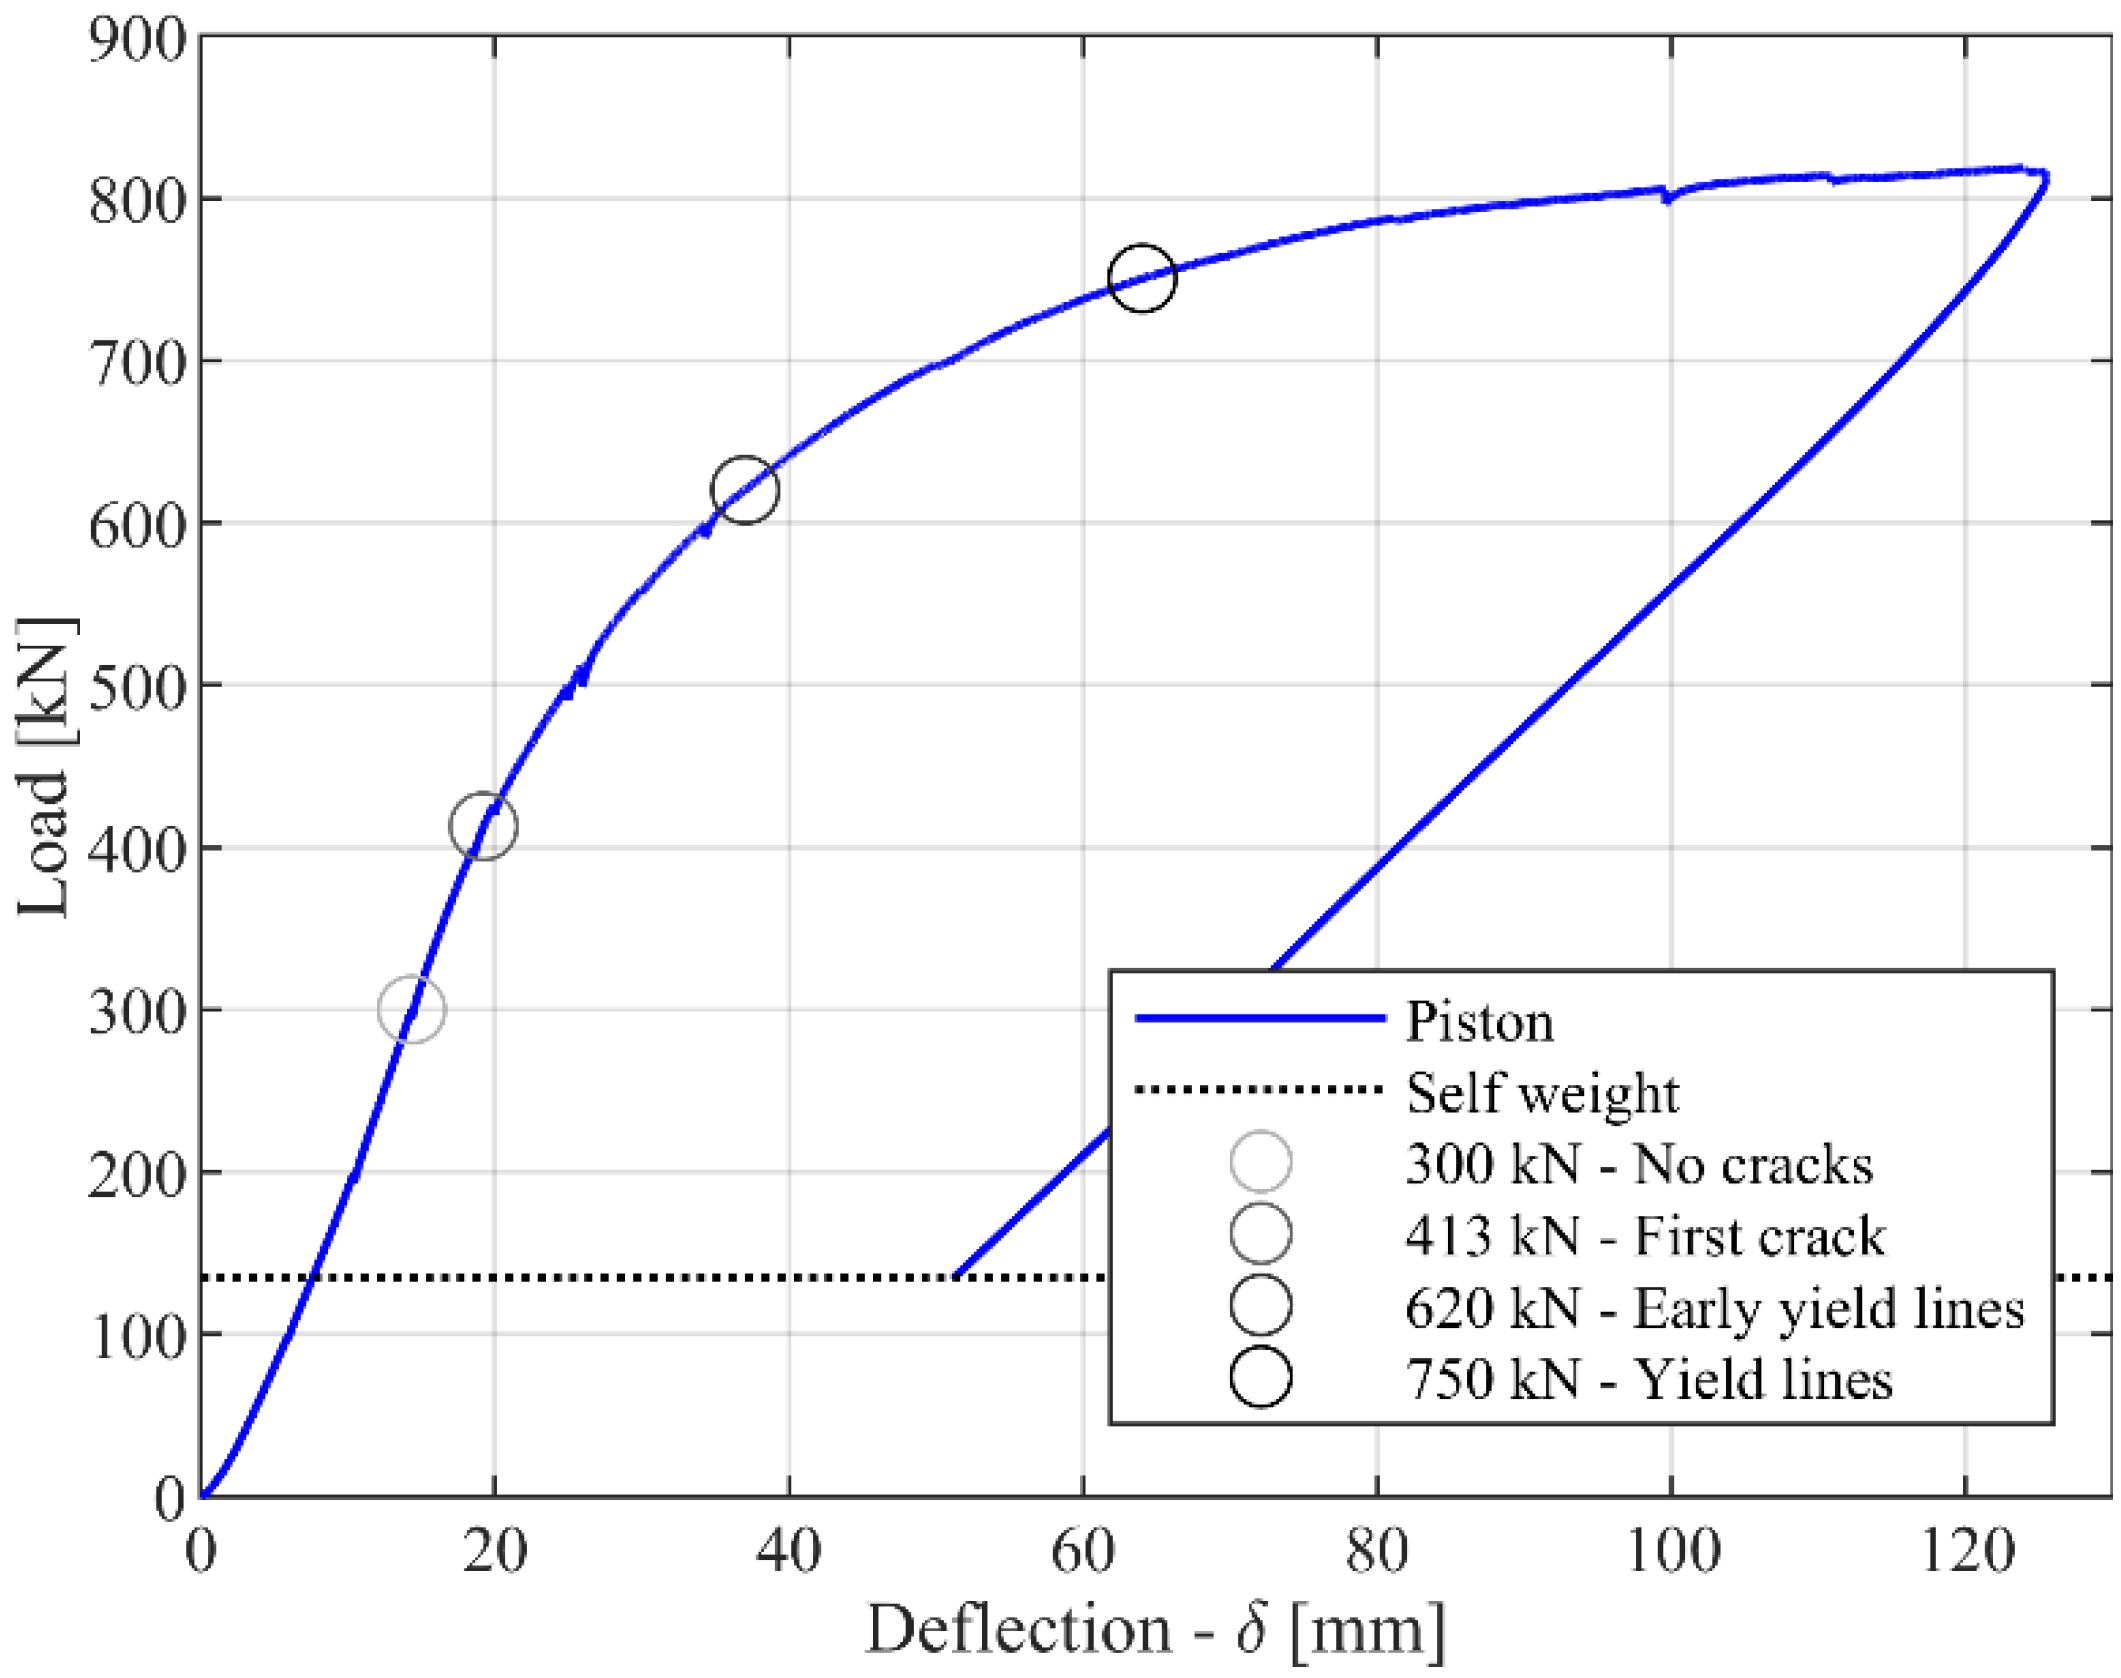
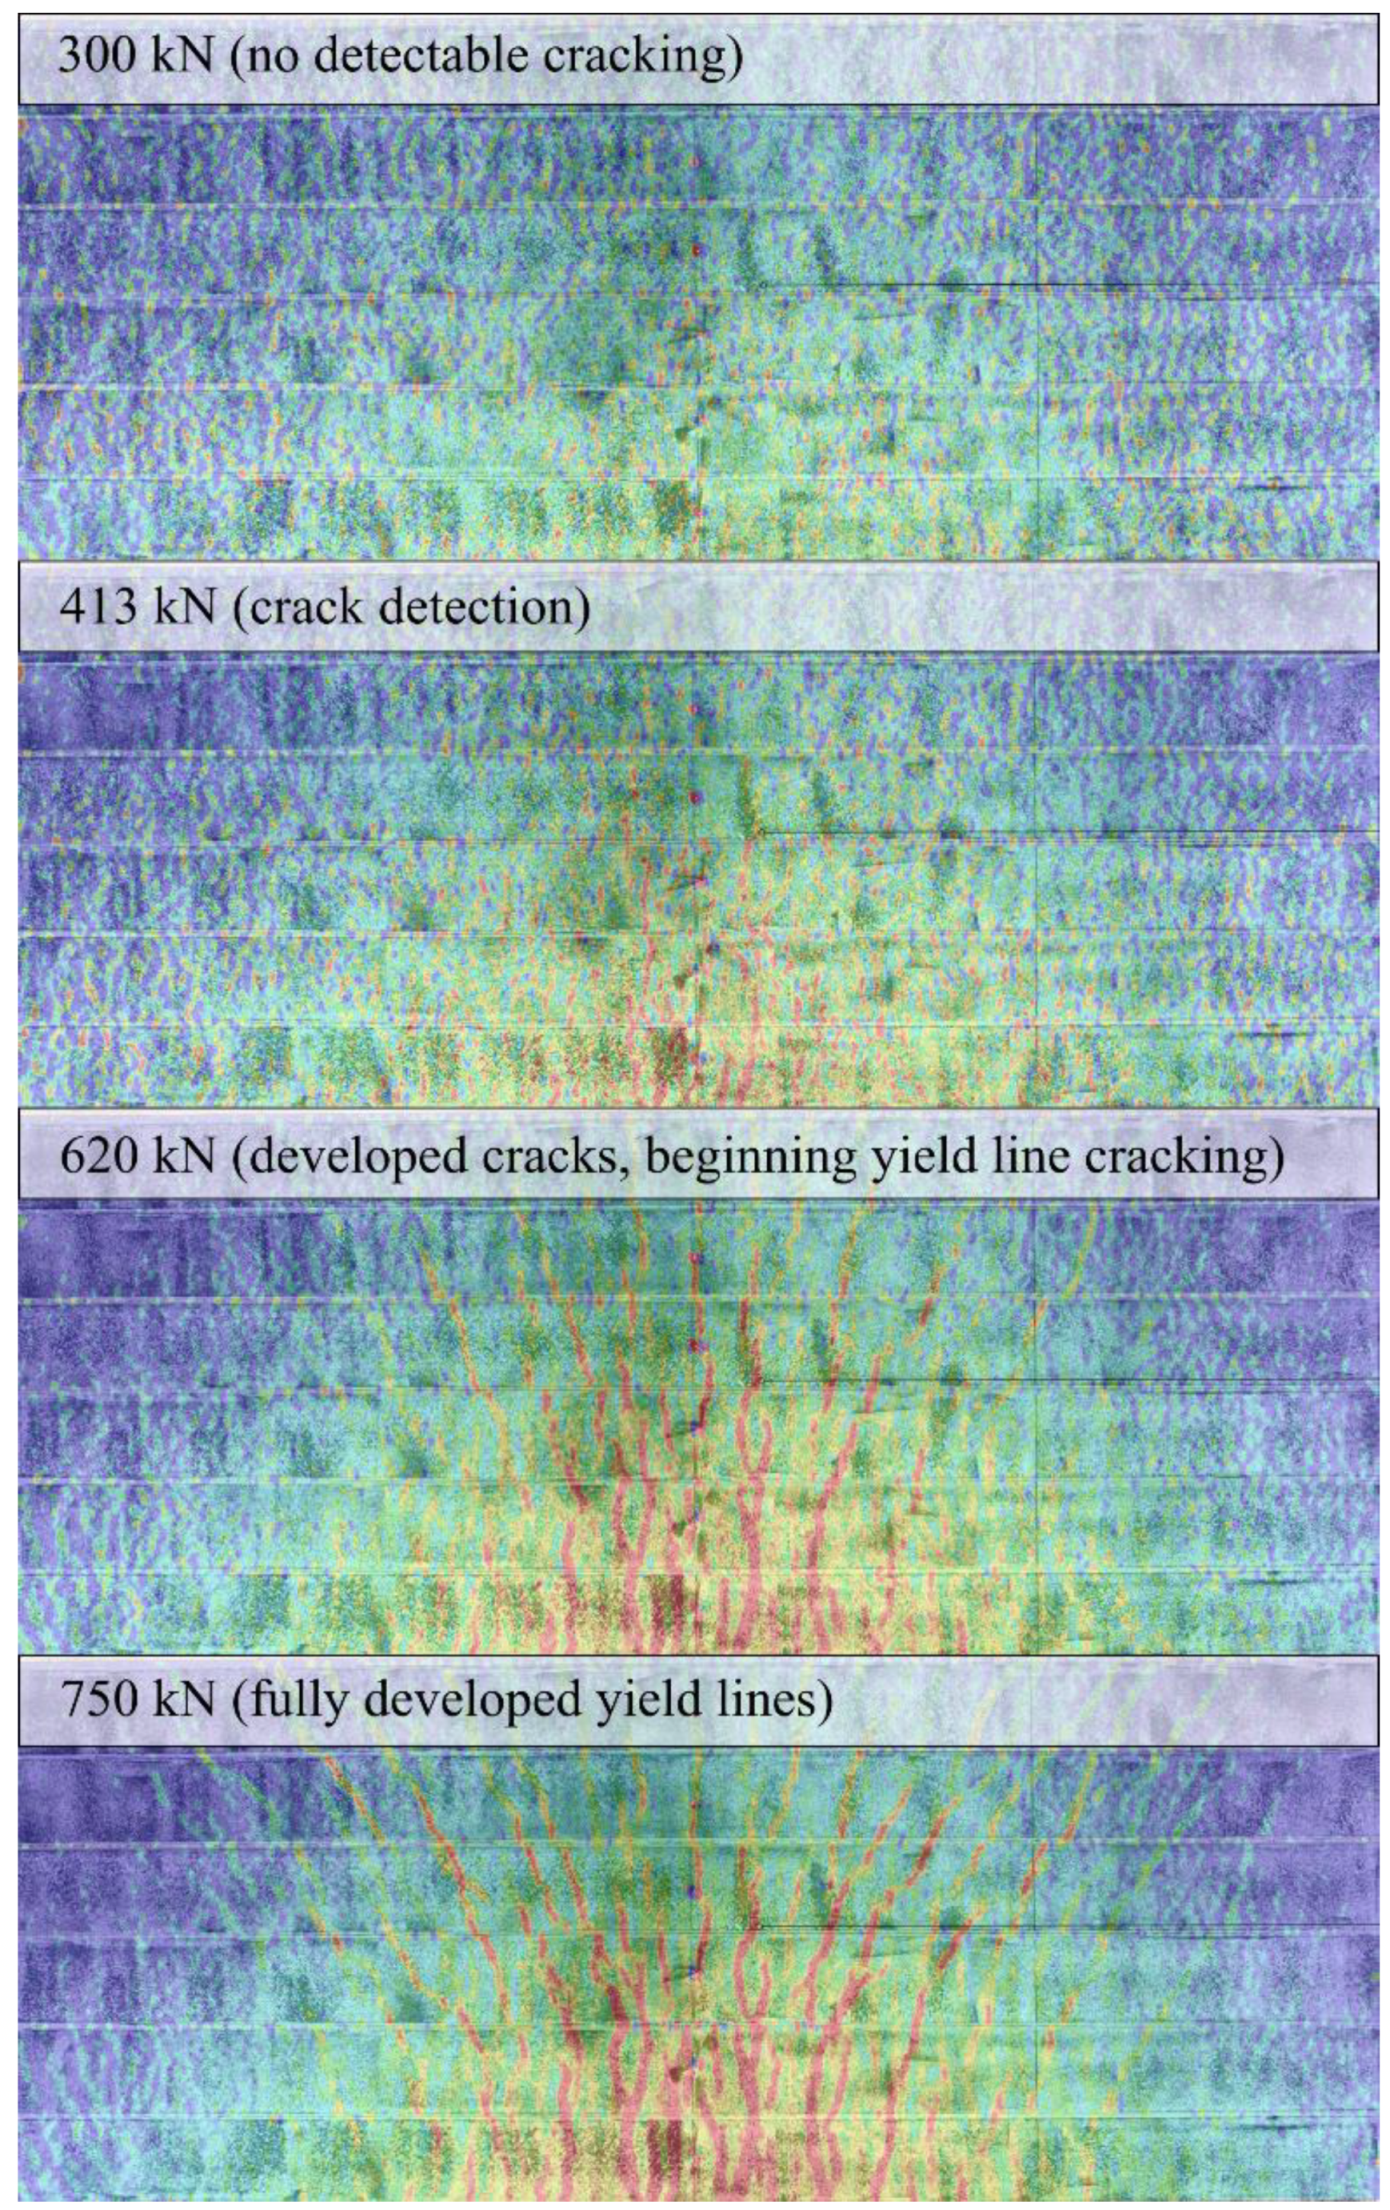
3.1.2. Laboratory Test Crack Detection

The subset size and point distance have a significant influence on the ability to perform crack detection. Figure 10 shows three plots with different subset sizes and point distances, at a load level of 413 kN (first detectable crack). A significant amount of noise is visible for 15/5, but also two distinct cracks can be seen. For 30/10 and 45/15, the noise level is lower, but distinct cracking is not yet visible. It is visible that something is occurring, but to have more certain crack detection, higher load levels are required (425 kN and 435 kN, respectively). Consequently, small subsets may detect the cracks earlier (as observed), but noise could also be too significant for detection. Large subsets will smoothen the results causing a delayed crack detection.
Figure 11 shows the load/deflection curve for the lab test with markers for four distinct crack development stages: (1) no detectable cracking, (2) crack detection, (3) developed cracks and beginning yield lines, (4) fully developed yield lines. It is clear that crack detection occurs in the linear elastic regime before any stiffness change. Crack patterns for the different stages are shown in Figure 12.
The more developed cracking stages might appear dramatic, but these should always be coupled to the magnitude of the applied load. For instance, at 620 kN, which on the load/deflection curve would indicate minor or no plastic deformation, the load level is already at a significant magnitude. Consequently, a lower load level may already have fulfilled a desired target load.
In the Danish classification system, the largest vehicle is a Class 500 vehicle, which involves axle loads of maximum 23.7 tonnes (232 kN), hence wheel pressures of 11.85 tonnes (116 kN). It should be noted that the lab test is slightly downscaled, and therefore has a lower capacity compared to the reference in situ OT-structure.
Nevertheless, the test specimen should be considered a subcomponent of a real bridge structure with only seven OT-beams embedded. With this in mind, the load carrying capacity has sufficient magnitude for a target load stop criterion to become the governing stop criterion, a criterion that would be reached before crack detection.

3.1.3. Laboratory Crack Width Measurements

At the time of crack detection, it becomes possible to monitor crack widths. Figure 13 shows six measured locations (three on each crack at the crack detection level).
The measured values are given in Table 2, without and with the correction for out-of-plane error [38,39,40]. Only the out-of-plane component is included in the correction, since no x-direction rotation occurs at mid-span. The values are compared with examples of threshold values, (1) the EC2 threshold for SLS (wmax ≤ 0.2 mm for prestressed concrete elements) and (2) the threshold from the German guideline (wmax ≤ 0.5 mm for new cracks).
It is seen how the directly measured values (without correction for out-of-plane movement) at crack detection are between 0.2 mm and 0.3 mm, which is above the EC2 threshold for SLS but below the threshold from the German guideline. After correction, however, all crack widths are below the EC2 threshold, as well. This means that the cracks were detected in time and can be monitored towards the stop criteria. However, had the chosen criteria been in the range described in [30] (wmax ≤ 0.11–0.19 mm), there would not have been a timely warning. These results were achieved at a camera distance of 3.8 m with one single camera covering the entire slab surface.

3.2. Strip Tests

The strip tests cut from Bridge 2 were loaded beyond the elastic regime, where Strip 1 (with asphalt) and Strip 2 (without asphalt) reached maximum loads of 3818 kN and 2922 kN (axle load of 97.4 tonnes and 74.5 tonnes), respectively. The maximum deflection of the two strips was 48 mm and 38 mm, respectively.
The results from Strip 1 includes continuous data logging throughout the test supplemented by manual results from a land surveyor. For Strip 2, an error occurred in the logger system and therefore only land surveyor data exist. In addition, Strip 2 was tested at a higher load rate than Strip 1 due to time limitations. The load/deflection curves can be seen in Figure 14. It is seen how the full data from LVDT show a more detailed loading acquisition, whereas the land surveyor data provide a smoother curve due to fewer data points. The figure also shows the frequency of DIC images (crosses) and first detection of cracking with two different cameras. In addition, loading equivalent to Class 100, 150 and 500 vehicles are depicted for comparison. The Class 500 vehicle is the heaviest standard vehicle, whereas the Class 150 vehicle is usually applied for new bridges and Class 100 for existing bridges.
In a proof-loading, the target load would include safety factors, but since the strip tests each include only 11 of 37 beams of the full bridge, a direct comparison to standard vehicles seems more than reasonable. It is seen how the test would have been terminated early in the linear elastic regime with a large margin to the crack occurrence.
The strip tests were monitored with a wide-angle lens Canon 6D camera and a regular lens Canon 550D camera, with camera distances of 3.8 m and 2.6 m, respectively. Both cameras support a 14-bit raw format, but for Strip 1, the images from the Canon 550D were only captured as 8-bit JPEG.

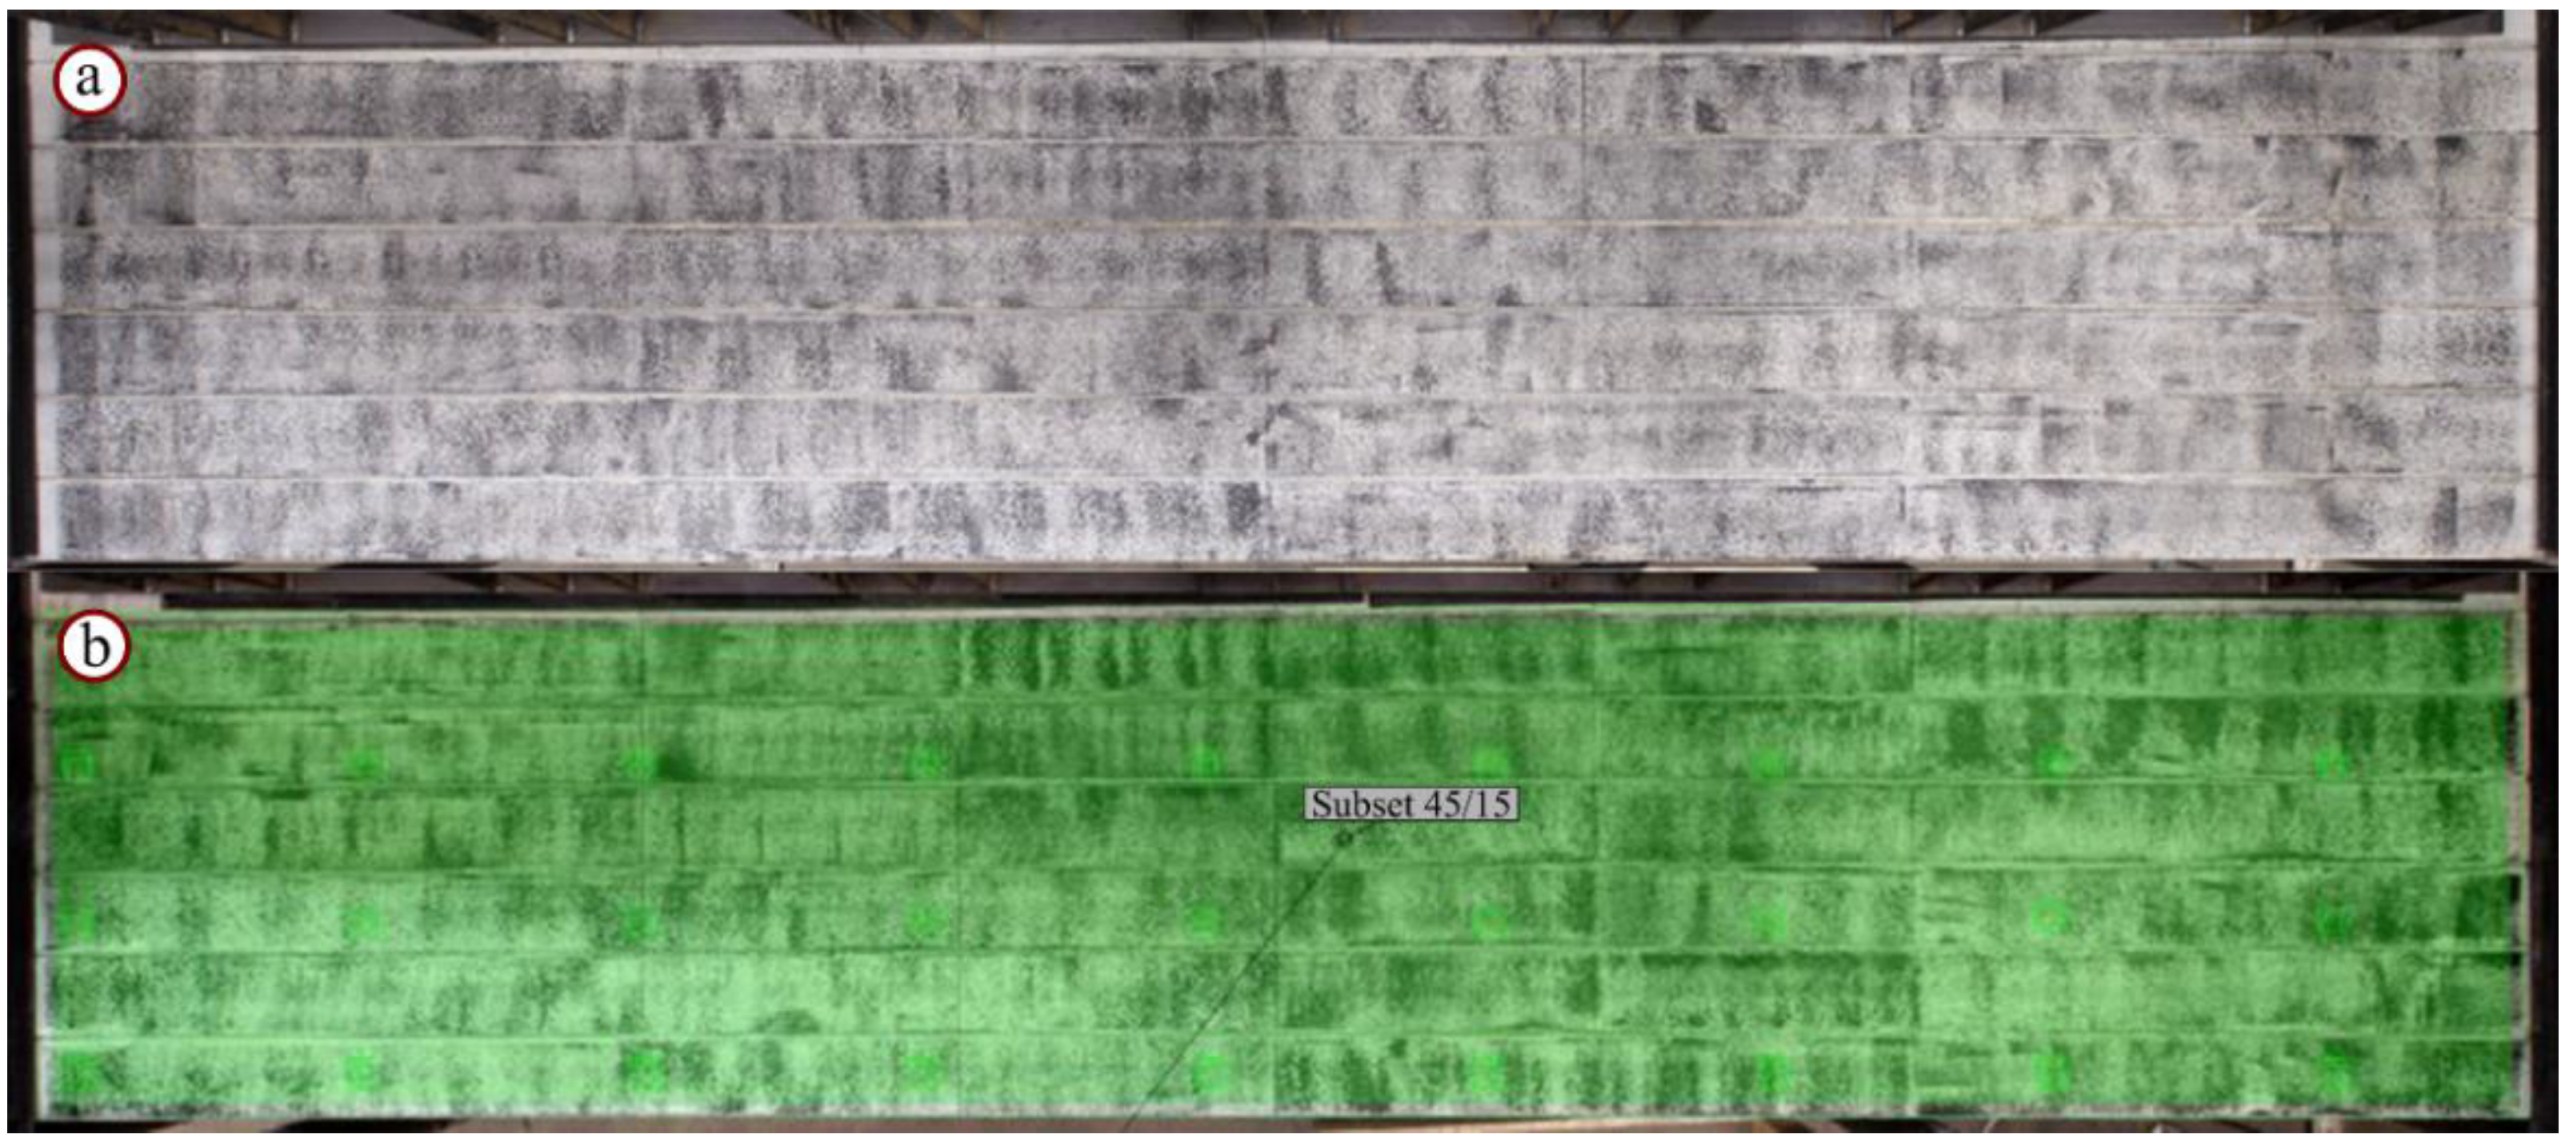
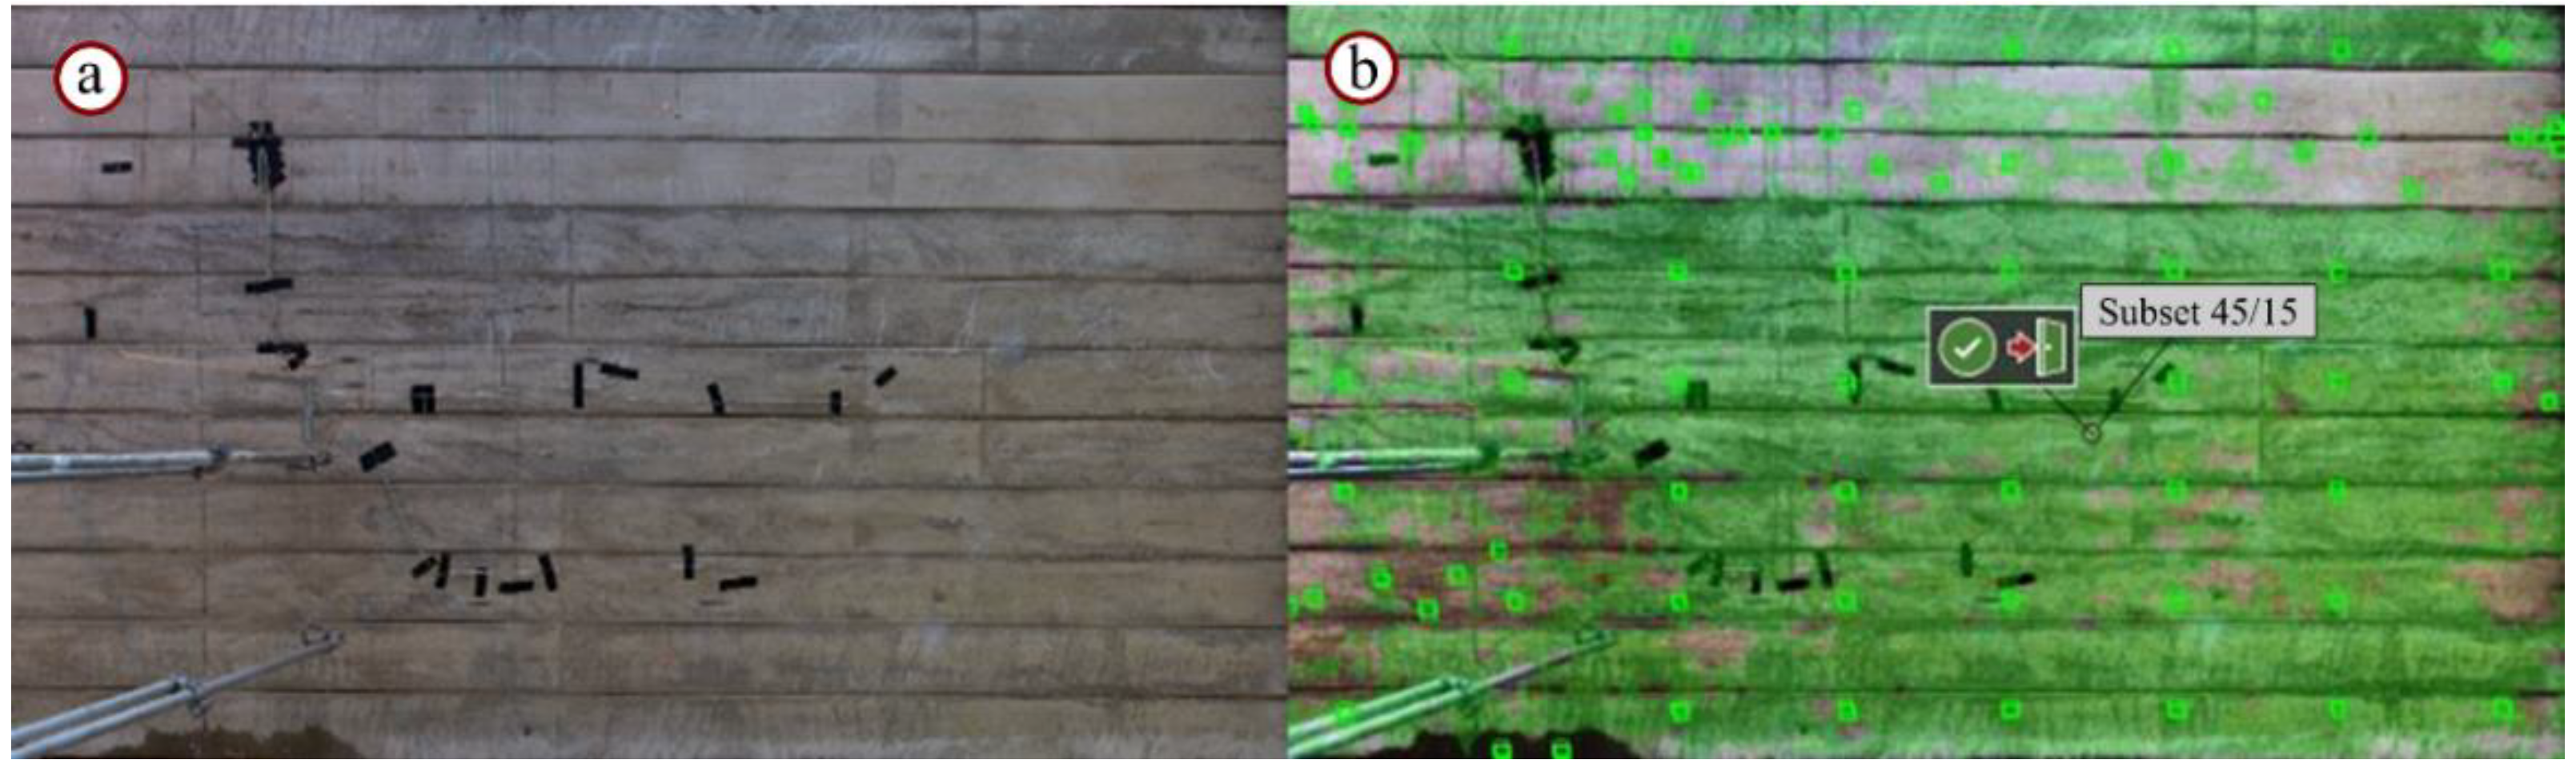
3.2.1. Strip Test Pattern Recognition and Optimization

The captured surfaces have almost uniform lighting, but suffer from distortions related to instrumentation and cables, as seen in Figure 15a. Even without an applied surface pattern, the surface is recognized well, as seen in Figure 15b for Strip 1 with Canon 6D. However, some blank areas are shown, especially on two beams on Strip 1, where the natural pattern is significantly less pronounced. The chosen subset size for the plot is 45/15 even though a larger subset can capture the surface better. A larger subset does, however, smoothen out strain intensities and therefore causes challenges in crack detection. A smaller subset size is relevant to consider, but like the lab test, noise can become a challenge.
It is possible to enhance the images before the analysis and thereby gain a more optimized pattern recognition. The enhancing parameters vary from test to test and the process must therefore be performed manually, which is often rather time consuming; thus, its use is often limited to post-analysis.
Furthermore, corrections could potentially affect the actual result in an unpredictable and inconsistent way. In the following analysis, it was chosen to perform a single optimization using linear grey level transformation, a commonly used tool in image analysis. The optimization method performs stretching of the grey levels. It is a procedure that should be performed with care, since it can easily affect the test results. The following were considered in the process:
  • The parameters of the grey level stretch may be varied, but the exact same parameters were applied to all images in the image series;
  • Images with larger bit-depth are preferred because of the additional information stored in the image;
  • Camera noise is also stretched, which may increase the overall noise in the results. It is therefore a balance between the additional information gained and the noise level;
  • Contour is not changed.
An optimized image is shown in Figure 16a and the corresponding pattern recognition in Figure 16b. It is seen how the surface is recognized much better than in Figure 15b and further analysis shows that the benefits of this outweigh the cons. This is therefore carried out for all images from the strip tests with a similar effect.

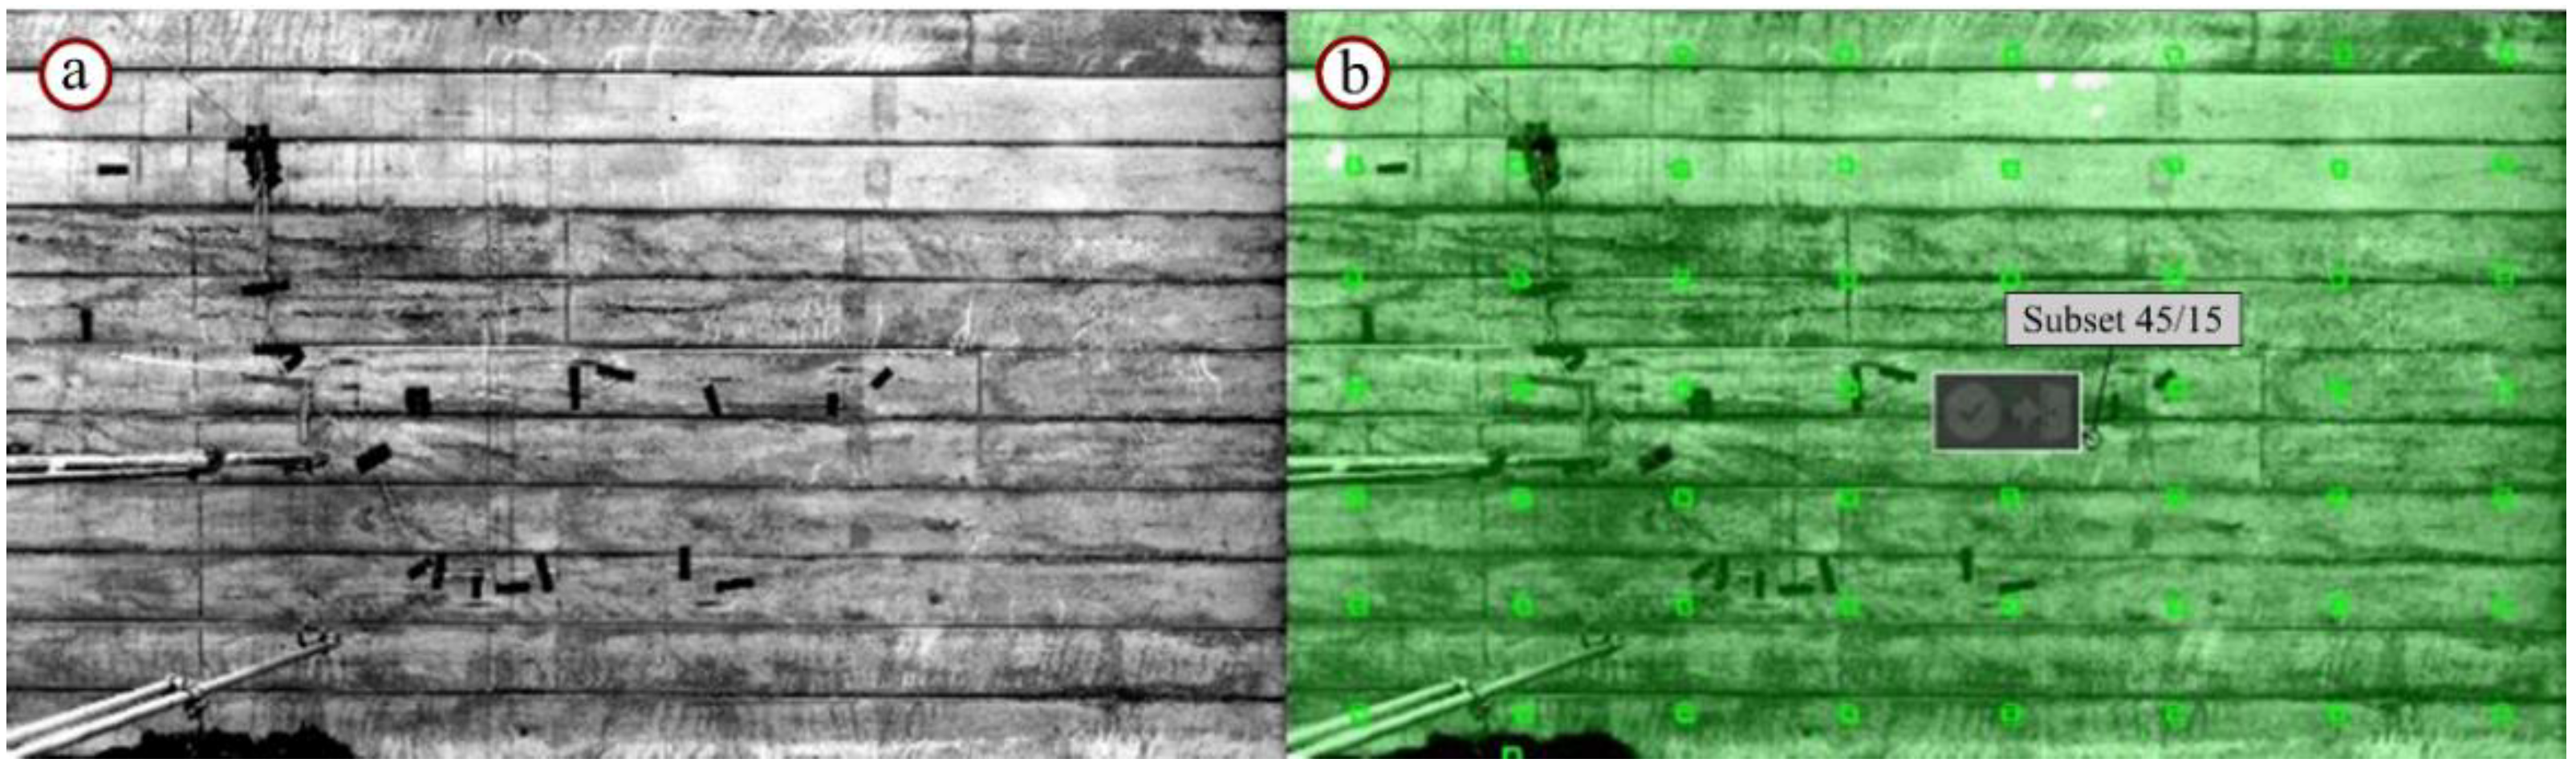
3.2.2. Strip Test Crack Detection

The use of the optimized images makes it possible to successfully use smaller subset sizes, which is beneficial for crack detection. Three different subset sizes are shown in Figure 17 for Strip 2 with the Canon 550D camera. The formed cracks are clearly visible for subset sizes 30/10 and 45/15, although the plot has more noise for subset 30/10. With the smaller subset 15/5, the cracks can still be seen, but the noise becomes dominating in the plot. Therefore, subset 30/10 is primarily used throughout the following analysis.
Images before and after crack detection are shown for both cameras for Strip 2 in Figure 18. It is seen how the images at a larger distance using the Canon 6D camera have noise to an extent that makes it difficult to see cracking. With the Canon 550D camera, the cracks are very well defined in comparison. The effect from camera distance on resolution is also clear when comparing that the images from the Canon 550D camera have 1.72 px/mm and the images from the Canon 6D camera have 0.69 px/mm. However, the use of two cameras ensures that both the full-field results are captured as well as more detailed data from the closer camera. The Strip 1 data show similar results, although with slightly lower quality for the Canon 550D camera due to the 8-bit JPEG images.
The times of crack detection are marked in Figure 14 for both strip tests. It is seen how the cracks are detected a bit later on the load/deflection curve than for the lab test in Figure 11. The crack formation is observed as more sudden from one image to the next and it is involving all 11 beams in the slab along with a significant stiffness change.
Given this sudden crack formation and viewing Figure 18, it seems that cracks are formed between two images (“No cracks” and “Cracks”) and that no indications of cracks are present prior to this. Additionally, the simultaneous cracking of the beams indicates a well distributed load on the prestressed OT-beams.
An image capture interval of 3 min was used for the data sampling. If the interval had been lower, the cracks may have been detected earlier. For Strip 1, it is seen from Figure 14 that the cracks are not detected simultaneously with the two cameras. This is because only slight indications of cracking are visible with the Canon 6D camera on earlier images.

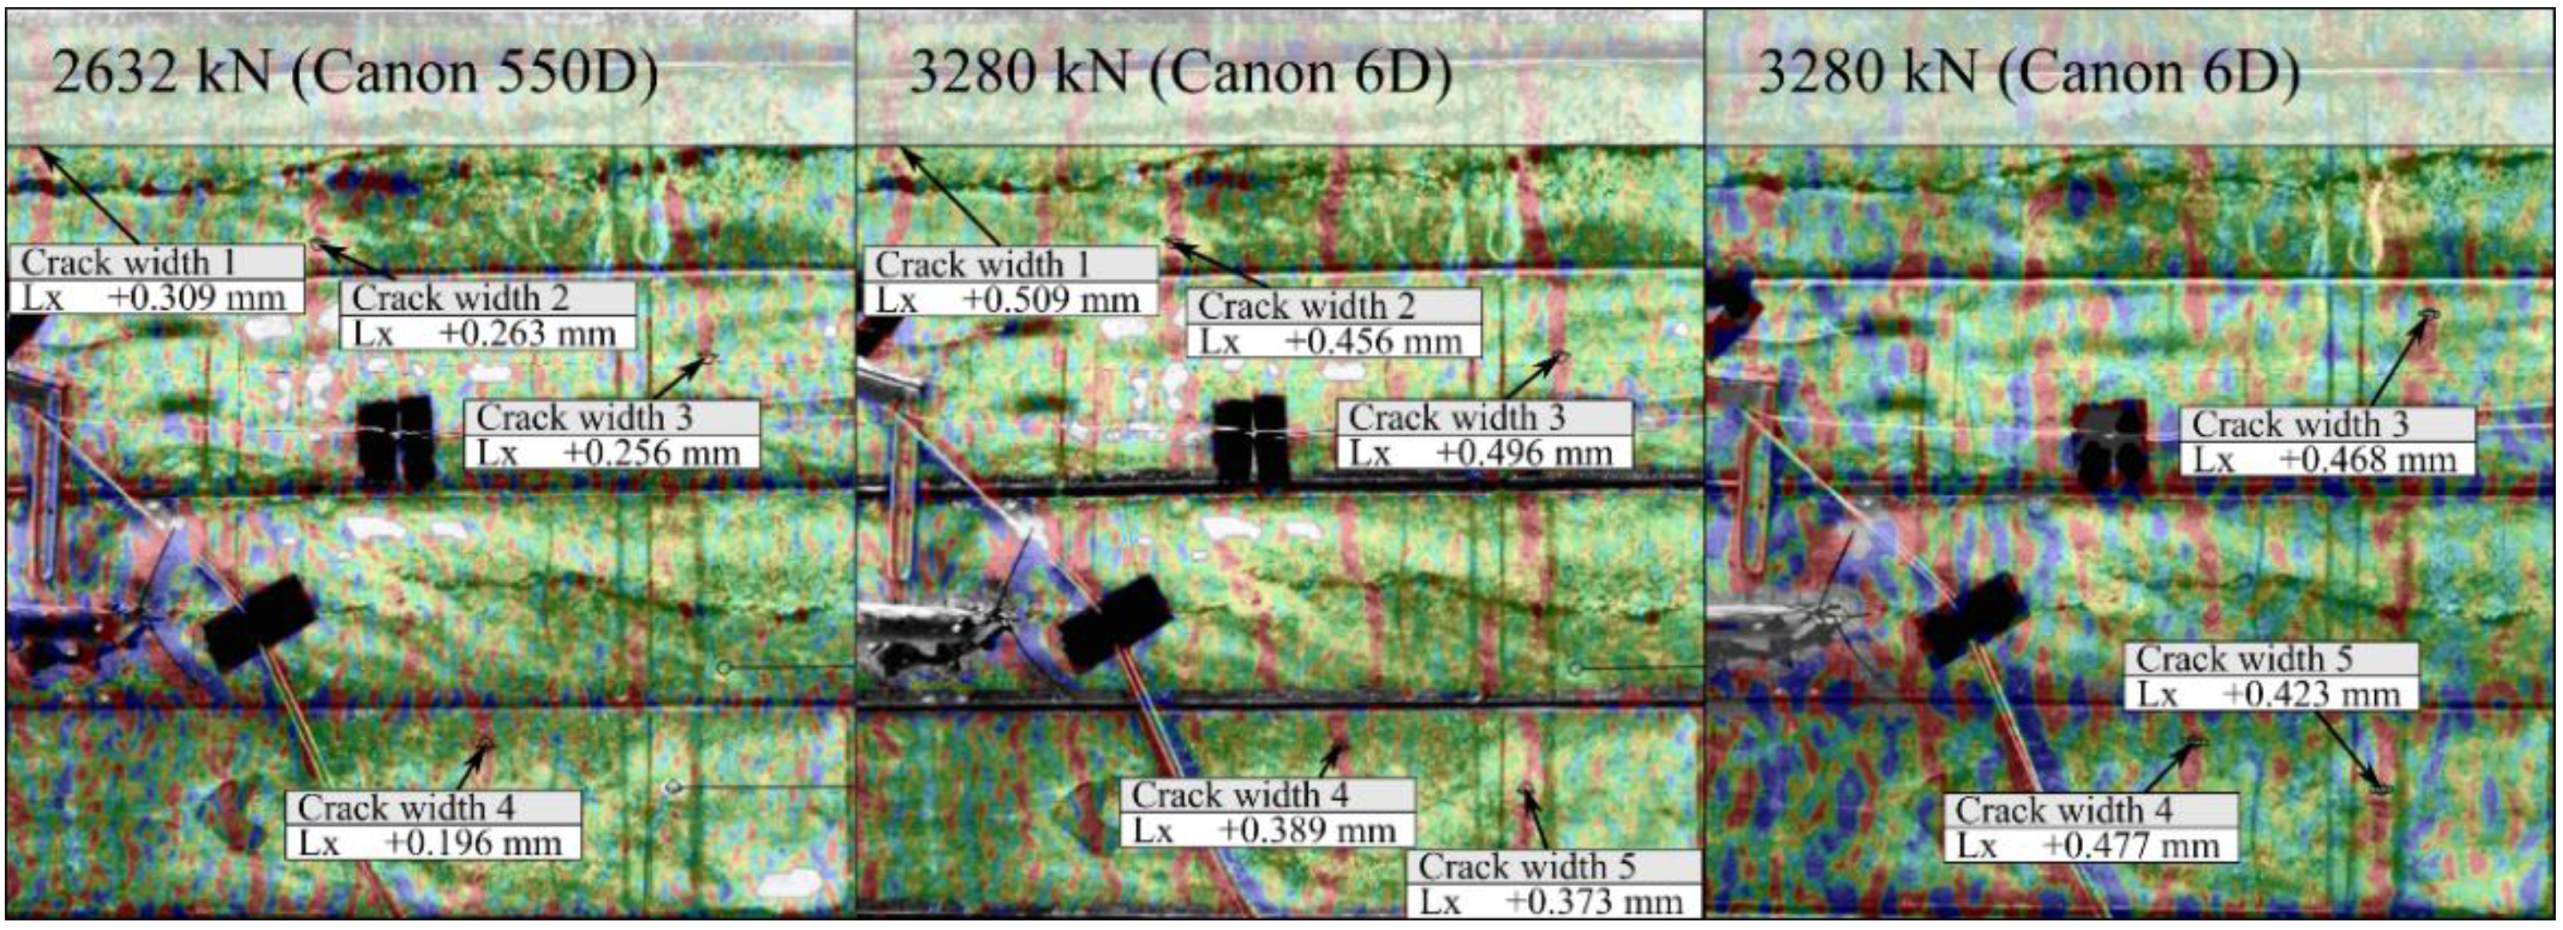
3.2.3. Strip Test Crack Widths

Similar to the lab test, the crack widths can be monitored from the time of crack detection. Because the cracks are not detected simultaneously for Strip 1, multiple comparisons are made. Figure 19 shows crack width numbers 1–5 for the Canon 550D images at load level of Canon 550D crack detection (2632 kN) and at the load level of Canon 6D crack detection (3280 kN). At 2632 kN, crack width 5 has not yet developed enough to be monitored. The Canon 6D images involve a significant amount of noise and therefore only three cracks can be monitored at the time of crack detection. These three cracks are chosen to match crack widths 3–5 from.
The measured crack widths and corresponding corrections are shown in Table 3 for Strip 1. At 2632 kN, crack widths 1–4 (Canon 550D) measure between 0.196 mm and 0.309 mm before correction and 0.104 mm and 0.191 mm after correction, which is slightly higher than for the lab test at crack detection. At 3280 kN, the same cracks measure between 0.219 mm and 0.305 mm after correction, which is an increase of approximately 0.1 mm. Using the Canon 6D images, crack widths 3–5 measure between 0.281 mm and 0.332 mm, which is slightly higher than the Canon 550D results.
For Strip 2, the crack detection occurs simultaneously. Five cracks are monitored, as seen in Figure 20. Clear crack indications are visible for Canon 550D, while the plot for Canon 6D is dominated by noise.
The measured crack widths, corrections and corrected values are given in Table 4. Before correction, the crack widths measure between 0.335 mm and 0.457 mm for Canon 550D and between 0.431 mm and 0.535 mm for Canon 6D. After correction, they measure between 0.175 mm and 0.240 mm for Canon 550D and between 0.236 mm and 0.328 mm for Canon 6D. It is seen how the Canon 6D results generally measure larger crack widths, similarly to the Strip 1 results. Applying the stop criteria from the German guideline, all measured cracks are detected in time. However, only some of the measured crack widths for Strips 1 and 2 are below the EC2 threshold at the time of crack detection and none are from the Canon 6D results.

4. Evaluation of Results towards Proof-Loading

In the evaluation of results towards proof-loading of bridge structures, it seems important to distinguish between qualitative and quantitative data. The target load, for example, is a well-defined and an easily measurable threshold, while some of the considerations related to the DIC results in this paper must be considered more qualitative and require a higher level of real-time result understanding and thus engineering judgement.
An exact target load was not set for either the lab test or the strip tests. However, through comparison with the Danish classification system, it is seen that there is a significant capacity reserve in the tested OT-slab structures. The comparison is made with the largest wheel pressure in the classification system (116 kN) for the lab test and Class 100, 150 and 500 vehicles (677 kN, 1048 kN and 1395 kN) for the strip tests. The target load seems to be the governing stop criterion, and similar proof-load tests would have been terminated before crack detection. It should be noted that this may not be the case for other types of bridge structures.
Disregarding the target load, the DIC results seem very relevant. The first task to consider for a proof-loading situation is the DIC pattern recognition on site. The large size of the tested structures could have posed a challenge compared to small-scale laboratory experiments with DIC applied. Sufficient light conditions are difficult to achieve without experiencing areas with a higher light exposure and perhaps even reflections. This is the reason why no artificial lighting was applied in the strip tests. Similarly, it was not possible to apply a speckle pattern in the strip tests, although some natural concrete surface pattern was present on the concrete surface. In the laboratory test, it was possible to apply a speckle pattern and the overhead lighting in the DTU Structural Lab gave little variation in light exposure. Therefore, the pattern recognition was at a satisfactory level (Figure 9) and due to the pattern quality, it was possible to successfully apply multiple subset size configurations. In the in situ strip tests, most of the surface could be recognized, but to obtain more full-field data, the images were enhanced by linear grey level transformation (Figure 16). The stretch was performed using the same parameters for all images in the image series and it does not change the contour. However, this method also stretches camera noise. In the given case, the benefits from more full-field data are assessed to outweigh the additional noise. The amount of noise in the analyzed results does not mean that the results cannot be used, only that the results become more qualitative, which affects the way to view results for crack widths. The stretch was performed on the lab test results as well, but had no significant effect, since the surface was already read well.
In the laboratory test, cracks were identified in the linear elastic regime before any significant stiffness change (Figure 11). The surface pattern (Figure 9) provided a noise level which was sufficiently low for smaller subset configurations (e.g., 15/5) to work well. Larger subset configurations smoothen the strain intensities and make definite crack detection more challenging (Figure 10). In the strip tests, cracking was detected at a later stage in the load/deflection curve; however, multiple factors influence this observation. The general setup of the lab test and strip tests have different supporting conditions. From the strip test results, it is seen that the first cracks form through all 11 beams in the slab and that the cracks form from one DIC image to the next (Figure 18) with no prior indications of cracking. In the load/deflection curve, this results in a sudden stiffness change. The load and boundary conditions in the lab test differ from the in situ strip tests. Consequently, the slab tested in the laboratory is constrained by the longitudinal support and cracking occurs more gradually. In the early crack stages, only the outer OT-beams are cracked and the stiffness change is not as sudden. In addition, the image capture interval in the strip tests (3 min/image) is larger than for the lab test (10 s/image). This means that cracks might have been identified earlier if more images had been captured. Nonetheless, clear cracking seems to happen from one DIC image to the next with no prior indications. Consequently, it appears that cracking occurs between the two images and not earlier.
Compared to the lab test, a larger amount of noise is present in the strip test DIC results, especially for the Canon 6D camera at a distance of 3.8 m (Figure 18). This camera does, however, provide a good method to evaluate and verify the overall structural behavior during loading (load placing, symmetry, boundary condition, etc.). Accordingly, the use of two cameras shows how multiple independent monitoring systems can work in synergy in a desirable way. The enhancing of the images by linear grey level transformation enables the Canon 6D camera to provide full-field data, whereas the Canon 550D provides better crack monitoring in an area of interest. Intelligent positioning of the cameras is therefore one of the key elements to successful monitoring and ultimately identification of stop criteria.
The measured crack widths from the lab test (Table 2) all exceeded the EC2 threshold for SLS (wmax ≤ 0.2 mm), but were within the criteria from the German guideline [28] (wmax ≤ 0.5 mm). After correction, they all complied with the EC2 threshold. In the strip tests, only few of the measured crack widths (Table 3 and Table 4) complied with the EC2 threshold after correction. The strip test results may be associated with noise and other errors, but the results are fairly consistent. The noise is more pronounced for the Canon 6D results from 3.8 m, which generally show values that are slightly larger than the Canon 550D from 2.6 m. The crack identification is seen in the transition stage between the linear elastic and plastic regime, from which it could be deemed that the cracks were not detected in time. However, with confidence in the time of crack detection, it might not be possible to measure the cracks at an earlier stage for such a strip setup. In addition, time-dependent effects could also have affected the results, and it is an open discussion how the crack width magnitudes would be if the test had been unloaded at the crack identification load level. With this in mind, it may be relevant to address the described thresholds. The EC2 SLS threshold is not an actual stop criterion but has been chosen by the authors due to lack of relevant guidelines and documents. In proof-loadings, a load safety factor will be applied and it can therefore be argued that a larger crack width may be acceptable. Hence, it can also be argued that the values described by [30] (wmax ≤ 0.11–0.19 mm) might be overly conservative. This open discussion seems to present an opportunity for “crack detection” to be a more governing criterion and perhaps that is the way to proceed. Monitoring for a specific crack width criterion is a quantitative method, but the results could be viewed more qualitatively. In a proof-loading situation, indeterminate crack indications from a full-field plot could thereby act as a stop criterion and thus cause a stop and hold of the load while the results can be checked further. Definite crack detection could terminate the test or allow for continued testing until a crack width criterion is reached. This criterion should be larger than the EC2 SLS criterion. In addition, the structure can also be unloaded in order to inspect the area of crack detection.
The described qualitative approach has significant benefits since it involves more manageable demands for the monitoring setup and precision. As generally seen when using DIC, varying conditions may affect the image acquisition, thus affecting the test results. A qualitative approach reduces the significance of this. However, for optimal stop criterion evaluation, it seems important that DIC results are verified and quantified further with more tests and secondary monitoring sources. Two promising systems, which could be used in future work for such a purpose, could be fiber optic sensors and acoustic emission.

Future Probabilistic Application of Test Results

For application in future proof-load tests, an evaluation of probabilistic characteristics of the monitoring information is required. This is to assess the efficiency of tailored proof-loading and monitoring strategies. In a probabilistic decision analysis for identifying an optimal proof-loading strategy, including choice of optimal proof-load level and monitoring equipment or methods, information from a monitoring system is modelled accounting for both its cost and precision. The component of measurement uncertainty influences the Value of Information from the monitoring and optimal decisions [45].
The target load for a proof-loading is derived with a structural reliability basis, which depends on the underlying models of capacity and system behavior. The utilization of elastic limit information from monitoring during a proof-load test can provide a high value in the decision making for bridge capacity reclassification [46]. If the monitoring system has a low reliability in accurate determination of the elastic limit, then the test planner may choose to increase safety factors on the target load, thus lowering the resulting classification outcome. Development of reliable and accurate monitoring methods is therefore of great importance, especially when comparing proof-loading strategies with, e.g., advanced theoretical modelling and simulation for achieving efficient capacity reclassification [47].
Although the results in this paper suggest a more qualitative approach, a quantitative analysis of qualitative observations is still required for implementation in probabilistic decision analysis. A quantitative consideration of the monitoring requires statements about the reliability or precision of the method and equipment. The results primarily address two aspects of information about structural response during proof-load testing: crack detection or initiation and crack width measurement.
Crack detection can be regarded as an initial stop criterion in the proof-load testing, at which point other information, e.g., load/deflection curve, is also assessed to check for signs of permanent deformation. From a probabilistic standpoint, it is relevant to assess the Probability of Detection (PoD) of a crack, a well-known metric to evaluate the capability of a crack monitoring system. The PoD expresses the probability of detecting a crack of a particular size as a mathematical function [48].
Following crack detection, the test operator may choose to either terminate the test or continue towards a crack width-based stop criterion. Here, the uncertainty in the measured quantity provides an evaluation of the monitoring information. Due to noise and out-of-plane movement, 2D DIC-based monitoring for a crack width-based stop criterion in a traditional way may be difficult. The out-of-plane movement leads to high measurement uncertainties and makes the crack widths appear larger than in reality [39]. Therefore, the risks of damage to the bridge due to proof-loading is low, even with the measurement uncertainty of the DIC.
Apart from being influenced by the measurement precision of the equipment, human error also has a significant impact on the reliability of monitoring [49], e.g., in the set-up, sensitivity setting, initial calibration of the equipment, operator skill level, familiarity, interpretation of data and repetition. Here, the critical aspect for the monitoring system is to have a high enough PoD at the critical crack width in order to provide timely information to the test conductor. This, with simultaneous monitoring of crack widths and load/deflection response with multiple equipment (e.g., DIC, LVDT, acoustic emission), can increase the precision.

5. Conclusions

This paper considers the use of 2D DIC for crack identification and evaluation in proof-load testing. Tests were performed on a downscaled OT-slab under laboratory conditions and on two in situ full-scale OT-slab strips cut from a bridge. A special focus in the research was to evaluate 2D DIC as a mean to verify qualitative and quantitative stop criteria in combination with structural response identification. The DIC results included full-field plots, investigation of the time of crack detection and monitoring of crack widths. All tests showed a high capacity compared to the target loads described in the Danish classification system. In a proof-loading case, the target load would have been the governing stop criterion since it was reached prior to DIC crack detection.
  • The laboratory slab surface with speckle pattern was well identified by the DIC software.
  • The in situ specimen surfaces with no speckle patterns and only concrete surface texture showed larger areas with good readability, but in some areas, the surface was not read well by the DIC software.
  • Enhancing the in situ images using linear grey level transformation resulted in images that were identified well.
  • The successful enhancement resulted in a good surface identification, thus enabling the use of different subset configurations (15/5, 30/10, 45/15).
  • Subset 15/5 worked well in the laboratory test, where the cracks were detected in the elastic stage of the load/deflection curve.
  • Larger subset configurations smoothen the strain intensities and might only show indications of cracking.
  • In the strip tests, subset 15/5 did not work well for crack detection due to noise, but subset 30/10 detected the crack formation well and at an acceptable stage in the load/deflection curve.
  • The strip test results also showed that crack indications by the use of multiple cameras for confirmation of cracking can be beneficial.
  • Crack widths measured at the time of crack detection and corrected for out-of-plane movement showed values of 0.080 mm to 0.132 mm in the laboratory tests.
  • The same procedure resulted in crack width values from 0.104 mm to 0.332 mm in the strip tests.
It is seen that the crack detection with corresponding crack width measurements from both laboratory and in situ tests correspond well with the thresholds of known literature. Hence, the method seems to serve well for identification of stop criteria in proof-loading of in situ bridge structures. In addition, it is suggested to investigate a more qualitative approach to DIC stop criteria, where crack detection and even indeterminate crack indications can act as early stop criteria. In future investigations, such an approach could work in conjunction with the application of independent monitoring systems for verification, such as fiber optic sensors and acoustic emission.

Author Contributions

Conceptualization, C.O.C. and J.W.S.; methodology, C.O.C., J.W.S. and P.S.H.; software, C.O.C. and J.W.S.; validation, C.O.C., J.W.S. and P.S.H.; formal analysis, C.O.C.; investigation, C.O.C., J.W.S. and P.S.H.; resources, J.W.S.; data curation, C.O.C. and P.S.H.; writing—original draft preparation, C.O.C., J.W.S. and M.K.; writing—review and editing, C.O.C., J.W.S., P.S.H., M.K. and P.G.; visualization, C.O.C.; supervision, J.W.S. and P.G.; project administration, J.W.S. and P.G.; funding acquisition, J.W.S. All authors have read and agreed to the published version of the manuscript.

Funding

The funding source do not wish to be revealed as stated in this section.

Institutional Review Board Statement

Not applicable.

Informed Consent Statement

Not applicable.

Data Availability Statement

All data and information needed for the evaluations discussed are provided in the paper.

Acknowledgments

A sincere gratitude is addressed to the Danish Road Directorate and Perstrup Beton Industri A/S for their contributions to the ongoing research. A big thank you to COWI A/S who is greatly appreciated as a collaborator in the project. Additionally, gratitude is directed towards the technical staff in the Structural Lab at the Technical University of Denmark for their assistance, knowledge and interest in the research project.

Conflicts of Interest

The authors declare no conflict of interest.

References

  1. Lantsoght, E.; van der Veen, C.; de Boer, A.; Hordijk, D.A. Proof Load Testing of Reinforced Concrete Slab Bridges in the Netherlands. Struct. Concr. 2017, 18, 597–606. [Google Scholar] [CrossRef] [Green Version]
  2. Bagge, N.; Popescu, C.; Elfgren, L. Failure Tests on Concrete Bridges: Have We Learnt the Lessons? Struct. Infrastruct. Eng. 2018, 2479, 292–319. [Google Scholar] [CrossRef]
  3. Schmidt, J.W.; Halding, P.S.; Jensen, T.W.; Engelund, S. High Magnitude Loading of Concrete Bridges. ACI Struct. J. 2018, 323, 9.1–9.20. [Google Scholar]
  4. Jensen, T.W.; Poulsen, P.N.; Hoang, L.C. Limit Analysis of Reinforced Concrete Slabs with Construction Joints. Eng. Struct. 2020, 205, 110062. [Google Scholar] [CrossRef]
  5. Anonymous. Destruction of the Prestressed Concrete Footbridge at the South Bank. Civ. Eng. Rev. 1952, 6, 330–334. [Google Scholar]
  6. Gosbell, K.B.; Stevens, L.K. Test Loading of a Full Scale Bridge. In Proceedings of the Australian Road Research Board; 1968; Volume 4, pp. 2018–2041. Available online: https://trid.trb.org/view/103665 (accessed on 6 July 2021).
  7. Goodpasture, D.W.; Burdette, E.G. Full Scale Tests to Failure of Four Highway Bridges. Am. Railw. Eng. Assoc. 1973, 74, 454–473. [Google Scholar]
  8. Isaksen, H.R.; Kanstad, T.; Olsen, P.-E. Prøvebelastning Av Bru Nr 02-1234 Smedstua Bru; Statens Vegvesen: Vegdirektoratet, Norway, 1998. [Google Scholar]
  9. Zhang, J.; Peng, H.; Cai, C.S. Field Study of Overload Behavior of an Existing Reinforced Concrete Bridge under Simulated Vehicle Loads. J. Bridg. Eng. 2011, 16, 226–237. [Google Scholar] [CrossRef]
  10. Zhang, J.; Peng, H.; Cai, C.S. Destructive Testing of a Decommissioned Reinforced Concrete Bridge. J. Bridg. Eng. 2013, 18, 564–569. [Google Scholar] [CrossRef]
  11. Lantsoght, E.O.L. Shear in Reinforced Concrete Slabs under Concentrated Loads Close to Supports; Uitgeverij BOXPress: North Brabant, The Netherlands, 2013. [Google Scholar] [CrossRef]
  12. Elmont, V.J. Test-Loading until Breaking Point of a 100-Foot Arch Bridge. Can. Eng. 1913, 24, 739–744. [Google Scholar]
  13. Rösli, A. Die Versuche an Der Glattbrücke in Opfikon. Eidgenössische Mater. Und Versuchsanstalt Für Ind. Bauwes. Und Gew. 1963, 192, 7–24. [Google Scholar]
  14. Bergström, M.; Täljsten, B.; Carolin, A. Failure Load Test of a CFRP Strengthened Railway Bridge in Örnsköldsvik, Sweden. J. Bridg. Eng. 2009, 14, 300–308. [Google Scholar] [CrossRef]
  15. Köppel, S.; Vogel, T. Feldversuch Steilerbachbrücke. In Institut für Baustatik und Konstruktion, Eidgenössische Technische Hochschule Zürich; ETH Library: Zürich, Switzerland, 1997. [Google Scholar] [CrossRef]
  16. Plos, M. Application of Fracture Mechanics to Concrete Bridges, Chalmers Tekniska Högskola. Avdelningen för Betongbyggnad. 1995. Available online: https://research.chalmers.se/en/publication/1158 (accessed on 6 July 2021).
  17. Song, H.-W.; You, D.-W.; Byun, K.-J.; Maekawa, K. Finite Element Failure Analysis of Reinforced Concrete T-Girder Bridges. Eng. Struct. 2002, 24, 151–162. [Google Scholar] [CrossRef]
  18. Jorgenson, J.L.; Larson, W. Field Testing of a Reinforced Concrete HIghway Bridge to Collapse. Transp. Res. Rec. 1976, 66–71. [Google Scholar]
  19. Azizinamini, A. Old Concrete Slab Bridges.1. Experimental Investigations. J. Struct. Eng. 1994, 120, 3284–3304. [Google Scholar] [CrossRef]
  20. Nanni, A.; Alkhrdaji, T.; Chen, G.; Barker, M.; Yang, X.; Mayo, R. Overview of Testing to Failure of a Highway Bridge Strengthened with FRP Composites. In Proceedings of the 4th International Symposium on FRP for Reinforcement of Concrete Structures (FRPRCS4), Baltimore, MD, USA, 31 October–5 November 1999; pp. 69–80. [Google Scholar]
  21. Alkhrdaji, T.; Barker, M.; Chen, G.; Mu, H.; Nanni, A.; Yang, X. Destructive and Non-Destructive Testing of Bridge J857, Phelps County, Missouri. Volume 1—Strengthening and Testing to Failure of Bridge Decks; Springfield: Washington, DC, USA, 2001. [Google Scholar]
  22. Halding, P.S.; Schmidt, J.W.; Jensen, T.W.; Henriksen, A.H. Structural Response of Full-Scale Concrete Bridges Subjected to High Load Magnitudes. In Proceedings of the SMAR, Zürich, Switzerland, 13–15 September 2017. [Google Scholar]
  23. Jensen, T.W.; Poulsen, P.N.; Hoang, L.C. Finite Element Limit Analysis of Slabs Including Limitations on Shear Forces. Eng. Struct. 2018, 174, 896–905. [Google Scholar] [CrossRef]
  24. Jensen, T.W.; Poulsen, P.N.; Hoang, L.C. Layer Model for Finite Element Limit Analysis of Concrete Slabs with Shear Reinforcement. Eng. Struct. 2019, 195, 51–61. [Google Scholar] [CrossRef]
  25. Vejdirektoratet (The Danish Road Directorate). Vejledning Til Belastnings Og Beregningsgrundlag; Vejregelrådet: Denmark, 2010; Available online: http://vejregler.lovportaler.dk/ShowDoc.aspx?q=Vejledning+til+Belastnings+beregningsgrundlag+for+vej-+stibroer+Vejdirektoratet+-+Vejregelr%C3%A5det%2C+juli+2010&docId=vd-20101203132049684-full (accessed on 6 July 2021).
  26. Vejdirektoratet (The Danish Road Directorate). Annex A: Lastmodeller for Klassificering Og Bæreevnevurdering (Models of Special Vehicles for Road Bridges); Vejregelrådet: Denmark, 2017; Available online: http://vejregler.lovportaler.dk/searchresult.aspx?texttype=&t=%2fV1%2fNavigation%2fTillidsmandssystemer%2fVejregler%2fAnlaegsplanlaegning%2fBygvaerker%2f (accessed on 6 July 2021).
  27. Vejdirektoratet (The Danish Road Directorate). Strategic Road Map. Available online: https://www.vejdirektoratet.dk/api/drupal/sites/default/files/2020-03/00-Tungvognsvejnet_Danmark_wcag (accessed on 5 March 2020).
  28. DafStb. DAfStb-Guideline: Load Tests on Concrete Structures; Deutscher Ausschuss für Stahlbeton: Berlin, Germany, 2000. [Google Scholar]
  29. ACI Commitee 437. Code Requirements for Load Testing of Existing Concrete Structures (ACI 437.2M-13); American Concrete Institute: Farmington Hills, MI, USA, 2013. [Google Scholar]
  30. Lantsoght, E.O.L.; Yang, Y.; Van Der Veen, C.; Hordijk, D.A. Stop Criteria for Flexure for Proof Load Testing of Reinforced Concrete Structures. Front. Built Environ. 2019, 5, 47. [Google Scholar] [CrossRef] [Green Version]
  31. Lantsoght, E.O.L.; Yang, Y.; Tersteeg, R.H.D.; Van Der Veen, C.; De Boer, A. Development of Stop Criteria for Proof Loading. In Proceedings of the Life-Cycle of Engineering Systems: Emphasis on Sustainable Civil Infrastructure—5th International Symposium on Life-Cycle Engineering, IALCCE 2016, Delft, The Netherlands, 16–20 October 2016. [Google Scholar]
  32. Lantsoght, E.O.L.; Yang, Y.; Van Der Veen, C.; De Boer, A.; Hordijk, D.A. Beam Experiments on Acceptance Criteria for Bridge Load Tests. ACI Struct. J. 2017, 114, 1031–1041. [Google Scholar] [CrossRef]
  33. Lantsoght, E.O.L.; van der Veen, C.; Hordijk, D.A. Proposed Stop Criteria for Proof Load Testing of Concrete Bridges and Verification. In Proceedings of the Life-Cycle Analysis and Assessment in Civil Engineering: Towards an Integrated Vision—Proceedings of the 6th International Symposium on Life-Cycle Civil Engineering, IALCCE 2018, Ghent, Belgium, 28–31 October 2018. [Google Scholar]
  34. Lantsoght, E.; Yang, Y.; Tersteeg, R.H.D.; van der Veen, C.; de Boer, A. Stop Criteria for Proof Loading. Life Cycle Eng. Syst. Emphas. Sustain. Civ. Infrastruct. 2016. Available online: https://www.frontiersin.org/articles/10.3389/fbuil.2019.00047/full (accessed on 6 July 2021).
  35. Lantsoght, E.O.L.; Yang, Y.; Van Der Veen, C.; De Boer, A.; Hordijk, D.A. Determination of Loading Protocol and Stop Criteria for Proof Loading with Beam Tests. In Proceedings of the High Tech Concrete: Where Technology and Engineering Meet—Proceedings of the 2017 Fib Symposium, Maastricht, The Netherlands, 12–14 June 2017. [Google Scholar]
  36. Lantsoght, E.O.L.; Yang, Y.; Van Der Veen, C.; Hordijk, D.A. Stop Criteria for Proof Load Tests Verified with Field and Laboratory Testing of the Ruytenschildt Bridge Ruytenschildt Field Test. In Proceedings of the IABSE Conference, Copenhagen, Denmark, 25–27 June 2018; pp. 1–8. [Google Scholar]
  37. Tan, X.; Abu-Obeidah, A.; Bao, Y.; Nassif, H.; Nasreddine, W. Measurement and Visualization of Strains and Cracks in CFRP Post-Tensioned Fiber Reinforced Concrete Beams Using Distributed Fiber Optic Sensors. Autom. Constr. 2021, 124, 103604. [Google Scholar] [CrossRef]
  38. Halding, P.S.; Schmidt, J.W.; Christensen, C.O. DIC-Monitoring of Full-Scale Concrete Bridge Using High-Resolution Wideangle Lens Camera. In Proceedings of the Maintenance, Safety, Risk, Management and Life-Cycle Performance of Bridges—9th International Conference on Bridge Maintenance, Safety and Management, IABMAS 2018, Melbourne, Australia, 9–13 July 2018. [Google Scholar]
  39. Christensen, C.O.; Lantsoght, E.O.L.; Schmidt, J.W. Quantification of Digital Image Correlation Applicability Related to In-Situ Proof Load Testing of Bridges. In Proceedings of the SMAR 2019—Fifth Conference on Smart Monitoring, Assessment and Rehabilitation of Civil Structures, Potsdam, Germany, 27–29 August 2019; pp. 1–8. [Google Scholar]
  40. Halding, P.S.; Christensen, C.O.; Schmidt, J.W. Surface Rotation Correction and Strain Precision of Wide-Angle 2D DIC for Field Use. J. Bridg. Eng. 2019, 24, 04019008. [Google Scholar] [CrossRef] [Green Version]
  41. European Committee for Standardization EN 1992-1-1, Eurocode 2: Design of Concrete Structures—Part 1-1: General Rules and Rules for Buildings 2008. Available online: https://webshop.ds.dk/en-gb/subjects/standard/ds-en-1992-1-1-ac2008 (accessed on 6 July 2021).
  42. GOM. GOM Correlate Professional 2018. Available online: https://www.gom.com/ (accessed on 19 November 2020).
  43. Triconnet, K.; Derrien, K.; Hild, F.; Baptiste, D. Parameter Choice for Optimized Digital Image Correlation. Opt. Lasers Eng. 2009, 47, 728–737. [Google Scholar] [CrossRef] [Green Version]
  44. Sutton, M.A.; Matta, F.; Rizos, D.; Ghorbani, R.; Rajan, S.; Mollenhauer, D.H.; Schreier, H.W.; Lasprilla, A.O. Recent Progress in Digital Image Correlation: Background and Developments since the 2013 W M Murray Lecture. Exp. Mech. 2017, 57, 1–30. [Google Scholar] [CrossRef]
  45. Kapoor, M.; Schmidt, J.W.; Sørensen, J.D.; Thöns, S. A Decision Theoretic Approach towards Planning of Proof Load Tests. In Proceedings of the 13th International Conference on Applications of Statistics and Probability in Civil Engineering (ICASP13), Seoul, Korea, 26–30 May 2019. [Google Scholar]
  46. Kapoor, M.; Thöns, S.; Schmidt, J.W.; Sørensen, J.D.; Christensen, C.O. Decision Analytic Approach for Using Elastic Limit Information from Proof Loading in Bridge Reclassification. Struct. Infrastruct. Eng. Under Rev. Currenly Under Review.
  47. Schmidt, J.W.; Thöns, S.; Kapoor, M.; Christensen, C.O.; Engelund, S.; Sørensen, J.D. Challenges Related to Probabilistic Decision Analysis for Bridge Testing and Reclassification. Front. Built Environ. 2020, 6, 14. [Google Scholar] [CrossRef] [Green Version]
  48. Zhang, R.; Mahadevan, S. Fatigue Reliability Analysis Using Nondestructive Inspection. J. Struct. Eng. 2001, 127, 957–965. [Google Scholar] [CrossRef]
  49. Wall, M.; Burch, S.; Lilley, J. Human Factors in POD Modelling and Use of Trial Data. Insight Non Destr. Test. Cond. Monit. 2009, 51, 553–561. [Google Scholar] [CrossRef]
Figure 1. Section of an OT-slab.
Infrastructures 06 00099 g001
Figure 2. Applied classification loads used for the in situ tests. Standard vehicle A adjacent to standard vehicle B.
Infrastructures 06 00099 g002
Figure 3. Plan drawing of the two strips and the position of load and DIC cameras.
Infrastructures 06 00099 g003
Figure 4. Drawing of down-scaled OT-slab (in top part of the figure, only left side of span is shown).
Infrastructures 06 00099 g004
Figure 5. Laboratory test setup with (1) multiple load-carrying columns with three stiffeners, (2) horizontal I-profiles along three edges for support along with pinned bearings between the profiles and the slab surface, (3) the primary actuator used for load application and (4) the OT-slab.
Infrastructures 06 00099 g005
Figure 6. The laboratory test setup viewed from above with loading point and DIC coverage indicated.
Infrastructures 06 00099 g006
Figure 7. Test setup with monitoring rig separate from test setup.
Infrastructures 06 00099 g007
Figure 8. Contrast pattern on slab surface.
Infrastructures 06 00099 g008
Figure 9. (a) Image from the lab test with pattern. (b) Pattern recognition for lab test, subset 45/15.
Infrastructures 06 00099 g009
Figure 10. Crack detection for different subset sizes—lab test.
Infrastructures 06 00099 g010
Figure 11. Load/deflection curve—lab test.
Infrastructures 06 00099 g011
Figure 12. Lab test crack development stages.
Infrastructures 06 00099 g012
Figure 13. Crack widths at crack detection—lab test.
Infrastructures 06 00099 g013
Figure 14. Load/deflection curve—strip tests.
Infrastructures 06 00099 g014
Figure 15. Raw pattern recognition for Strip 1 (Canon 6D). (a) Image of the captured surface without surface pattern. (b) Recognized areas with subset 45/15.
Infrastructures 06 00099 g015
Figure 16. Improved pattern recognition for Strip 1 (Canon 6D). (a) Captured image with optimized grey distribution. (b) Recognized areas after optimization with subset 45/15.
Infrastructures 06 00099 g016
Figure 17. Time of crack detection for different subset sizes (15/5, 30/10, 45/15), Strip 2 (Canon 550D).
Infrastructures 06 00099 g017
Figure 18. Crack Detection for Strip 2. All with Subset 30/10.
Infrastructures 06 00099 g018
Figure 19. Crack widths at crack detection for Strip 1.
Infrastructures 06 00099 g019
Figure 20. Crack widths at crack detection for Strip 2.
Infrastructures 06 00099 g020
Table 1. Comparison of DIC test setup, along with observations from tests.
Comparison ParameterStrip 1Strip 2Lab Test
Camera positionCentered transversely covering along mid-span towards one supportCentered transversely covering along mid-span towards one supportCentered
Camera distance3.8 m, 2.6 m3.8 m, 2.6 m3.8 m
Speckle patternNoNoYes
Variation in lighting over the covered surfaceSlightSlightNo
Variation in lighting during testingSlightSlightNo
Image capture interval3 min3 min10 s
Table 2. Measured and corrected crack widths at crack detection—lab test.
Crack Width No.Measured Value (mm)Correction (mm)Corrected Value (mm)
10.2210.1000.121
20.2490.1320.117
30.2320.1520.080
40.250.1180.132
50.2070.1250.082
60.2870.1790.108
Table 3. Measured and corrected crack widths at crack detection—Strip 1.
Crack No. Strip No. Camera Model Load Level (kN) Measured Value (mm) Correction (mm) Corrected Value (mm)
11550D26320.3090.1180.191
11550D32800.5090.2180.291
21550D26320.2630.0990.164
21550D32800.4560.1820.274
31550D26320.2560.1030.153
31550D32800.4960.1910.305
316D32800.4680.1360.332
41550D26320.1960.0920.104
41550D32800.3890.1700.219
416D32800.4770.1790.298
51550D32800.3730.1550.218
516D32800.4230.1420.281
Table 4. Measured and corrected crack widths at crack detection—Strip 2.
Crack No.Strip No.Camera ModelMeasured Value (mm)Correction (mm)Corrected Value (mm)
62550D0.3350.1600.175
626D0.5350.2070.328
72550D0.3610.1730.188
726D0.5080.2410.267
82550D0.4130.1900.223
826D0.530.2520.278
92550D0.4570.2170.240
926D0.4310.1950.236
102550D0.4130.1770.236
1026D0.4930.2290.264
Publisher’s Note: MDPI stays neutral with regard to jurisdictional claims in published maps and institutional affiliations.

