
Energy Balance in Wastewater Systems with Energy Recovery: A Portuguese Case Study


1
Urban Water Unit, National Laboratory for Civil Engineering, LNEC, Av. Brasil 101, 1700-066 Lisbon, Portugal
2
CERIS, Instituto Superior Técnico, Universidade de Lisboa, Av. Rovisco Pais, 1049-001 Lisbon, Portugal
*
Author to whom correspondence should be addressed.
Infrastructures 2021, 6(10), 141; https://0-doi-org.brum.beds.ac.uk/10.3390/infrastructures6100141
Submission received: 2 September 2021
/
Revised: 27 September 2021
/
Accepted: 30 September 2021
/
Published: 7 October 2021
Abstract
:This paper presents and discusses the application of a novel energy balance scheme for assessing energy efficiency in wastewater systems. The energy balance is demonstrated with a Portuguese real-life case study, using mathematical modelling to estimate the different energy components and to compute two energy efficiency indices. The total inflow intrinsic energy can represent a significant amount (>95%) of the total energy used in systems mainly composed of gravity sewers. The total input energy is significantly (four-times) higher in the wet season than in the dry season, mostly due to undue inflows (e.g., direct rainfall and infiltration). The potential for energy recovery strongly depends on the available head and flow rate at the delivery point, being 0.01 kWh/m3 in the current case, with a project payback period of 4 years. The energy balance components and the respective energy efficiency indices strongly depend on the considered reference elevation. Thus, a unique regional reference elevation is recommended in the calculations.
1. Introduction
Energy efficiency in the water industry is often regarded as an operational issue focused mostly on pumping and treatment equipment or processes improvement, simply regarded as a management efficiency target to be achieved [1]. However, due to the worldwide energy crisis and to the need of reducing greenhouse gas (GHG) emissions, there is an increasing motivation to minimize the energy requirements in sustainable water use [2]. Climate change is challenging the water sector to optimize energy use and limit GHG emissions in the current daily operations. The number of examples of energy efficiency improvement measures in water production and treatment is rapidly growing [3,4].
Aware of the need to reduce energy consumption and the associated costs, water utilities are currently looking for innovative ways to improve energy efficiency in their services by improving equipment efficiency, optimizing pump scheduling and changing the system layout [5], as well as recovering the excessive energy whenever feasible [6,7]. However, a significant potential for water-energy saving can be found when analysing the system as a whole, since energy is dissipated not only in pumping stations but also in the system layout, pipes and water losses, among others. There remains a need to adapt and explore alternative approaches, mainly to wastewater and stormwater systems, to assess the inefficiencies associated with the sewer inflow and network layout.
The energy balance should account for all inputs and/or generation of energy supply versus energy outputs based on energy consumption by energy use [8]. The energy balance compares the total energy that enters the system boundaries with the total energy that leaves the boundaries. Many authors have suggested the development of energy balances in the urban water cycle [5,9,10,11], but for wastewater systems, this concept has hardly been developed and explored.
Carrying out energy balances in the entire water system allows the understanding of which components are energy-intensive and, therefore, allows the identification of measures to increase the energy efficiency. Energy balances assessment also supports the tactical and operational levels of management. At the tactical level, these provide a diagnosis of the system, enable the comparison between systems and help to prioritize interventions in subsystems. At the operational level, critical subsystems can have their service improved by specific actions, such as changes in pumping operation according to demand profiles (e.g., daily pumping schedules, adoption of speed controllers). Therefore, mapping energy consumption through an energy-balance scheme for the water systems is useful to identify critical components requiring action and to plan interventions to improve the energy efficiency [12].
Water supply systems, which are mostly pressurized pipes, have a significant potential for energy recovery [13] through the installation of turbines and pumps operating as turbines in locations with excessive pressures (e.g., near pressure or flow control valves, at the inlet of storage tanks) [14,15]. Given the nature of wastewater systems, the inlet or the outlet of wastewater treatment plants (WWTP) are preferentially used as potential sites to install an energy recovery solution to generate electricity in the wastewater system fields and thermal energy applications [16].
The assessment of the energy recovery potential for water supply systems requires the identification of the locations where energy is dissipated, the estimation of available hydraulic power and the development of technical and economic feasibility studies [17,18,19,20]. However, in wastewater systems, the use of energy recovery devices (herein, referred to as turbines) is more difficult not only due to the nature of the fluid, which contains solid materials and has corrosive properties, but also due to the existence of typical low heads with high flow rates. Whenever the installation of a turbine is already planned during the infrastructure construction, this will significantly reduce the capital costs and optimize the hydraulic design of the system [21].
The development of energy recovery feasibility studies involves key steps: the identification of potential locations; the identification of the most suitable turbine and the prediction of its performance, given specific head and flow values; the simulation of the energy recovery during a period of time; and a cost-benefit analysis [20]. The Archimedes screw was originally developed to pump water from a low to a high-level section. This equipment is composed of a helical array of simple blades wound on a central cylinder. Recently, this equipment has been used in the reverse mode (inverted Archimedes screw) serving as a turbine—the Archimedes screw turbine—to generate energy for low heads and high flow rates [20,22].
A novel energy balance tailored for wastewater systems was proposed by the authors of [23]. This balance has a different structure and several new components compared to water supply systems [5] and irrigation systems [24], and allows the identification of the main system inefficiencies and the potential for energy recovery. This energy balance aims to understand the energy transformation processes occurring in the integrated wastewater system, highlighting the most energy-consuming subsystems. This approach can be applied in three assessment levels (macro, meso and micro-level) depending on available information of the wastewater system in terms of the physical characteristics and flow rates.
The current paper aims to apply and discuss the energy balance developed for wastewater systems at the micro-level, using mathematical simulations to describe the flow throughout the system. A real Portuguese case study, composed of several systems, is used. The main innovative features are the detailed application of the micro-level energy balance to a wastewater system, supported by a hydraulic model to calculate the different energy balance components, the discussion of the main energy consumption components and the specific energy indices, and the analysis of the potential for energy recovery at the downstream manhole of the system.
2. Methodology
2.1. Energy Balance for Wastewater Systems
The energy balance scheme specific for wastewater systems proposed by the authors of [23] was applied herein. Mathematical modelling was used to calculate the different components of the balance, allowing a micro-level energy efficiency assessment. This energy balance allows the identification of the main energy inefficiencies of the wastewater system and the analysis of different measures to reduce water-energy consumption and to recover energy. The proposed balance only focuses on the transport component of wastewater systems, including raising and gravity sewers. WWTP were not included herein, although the methodology can be extended to incorporate other components, such as treatment and heat recovery processes.
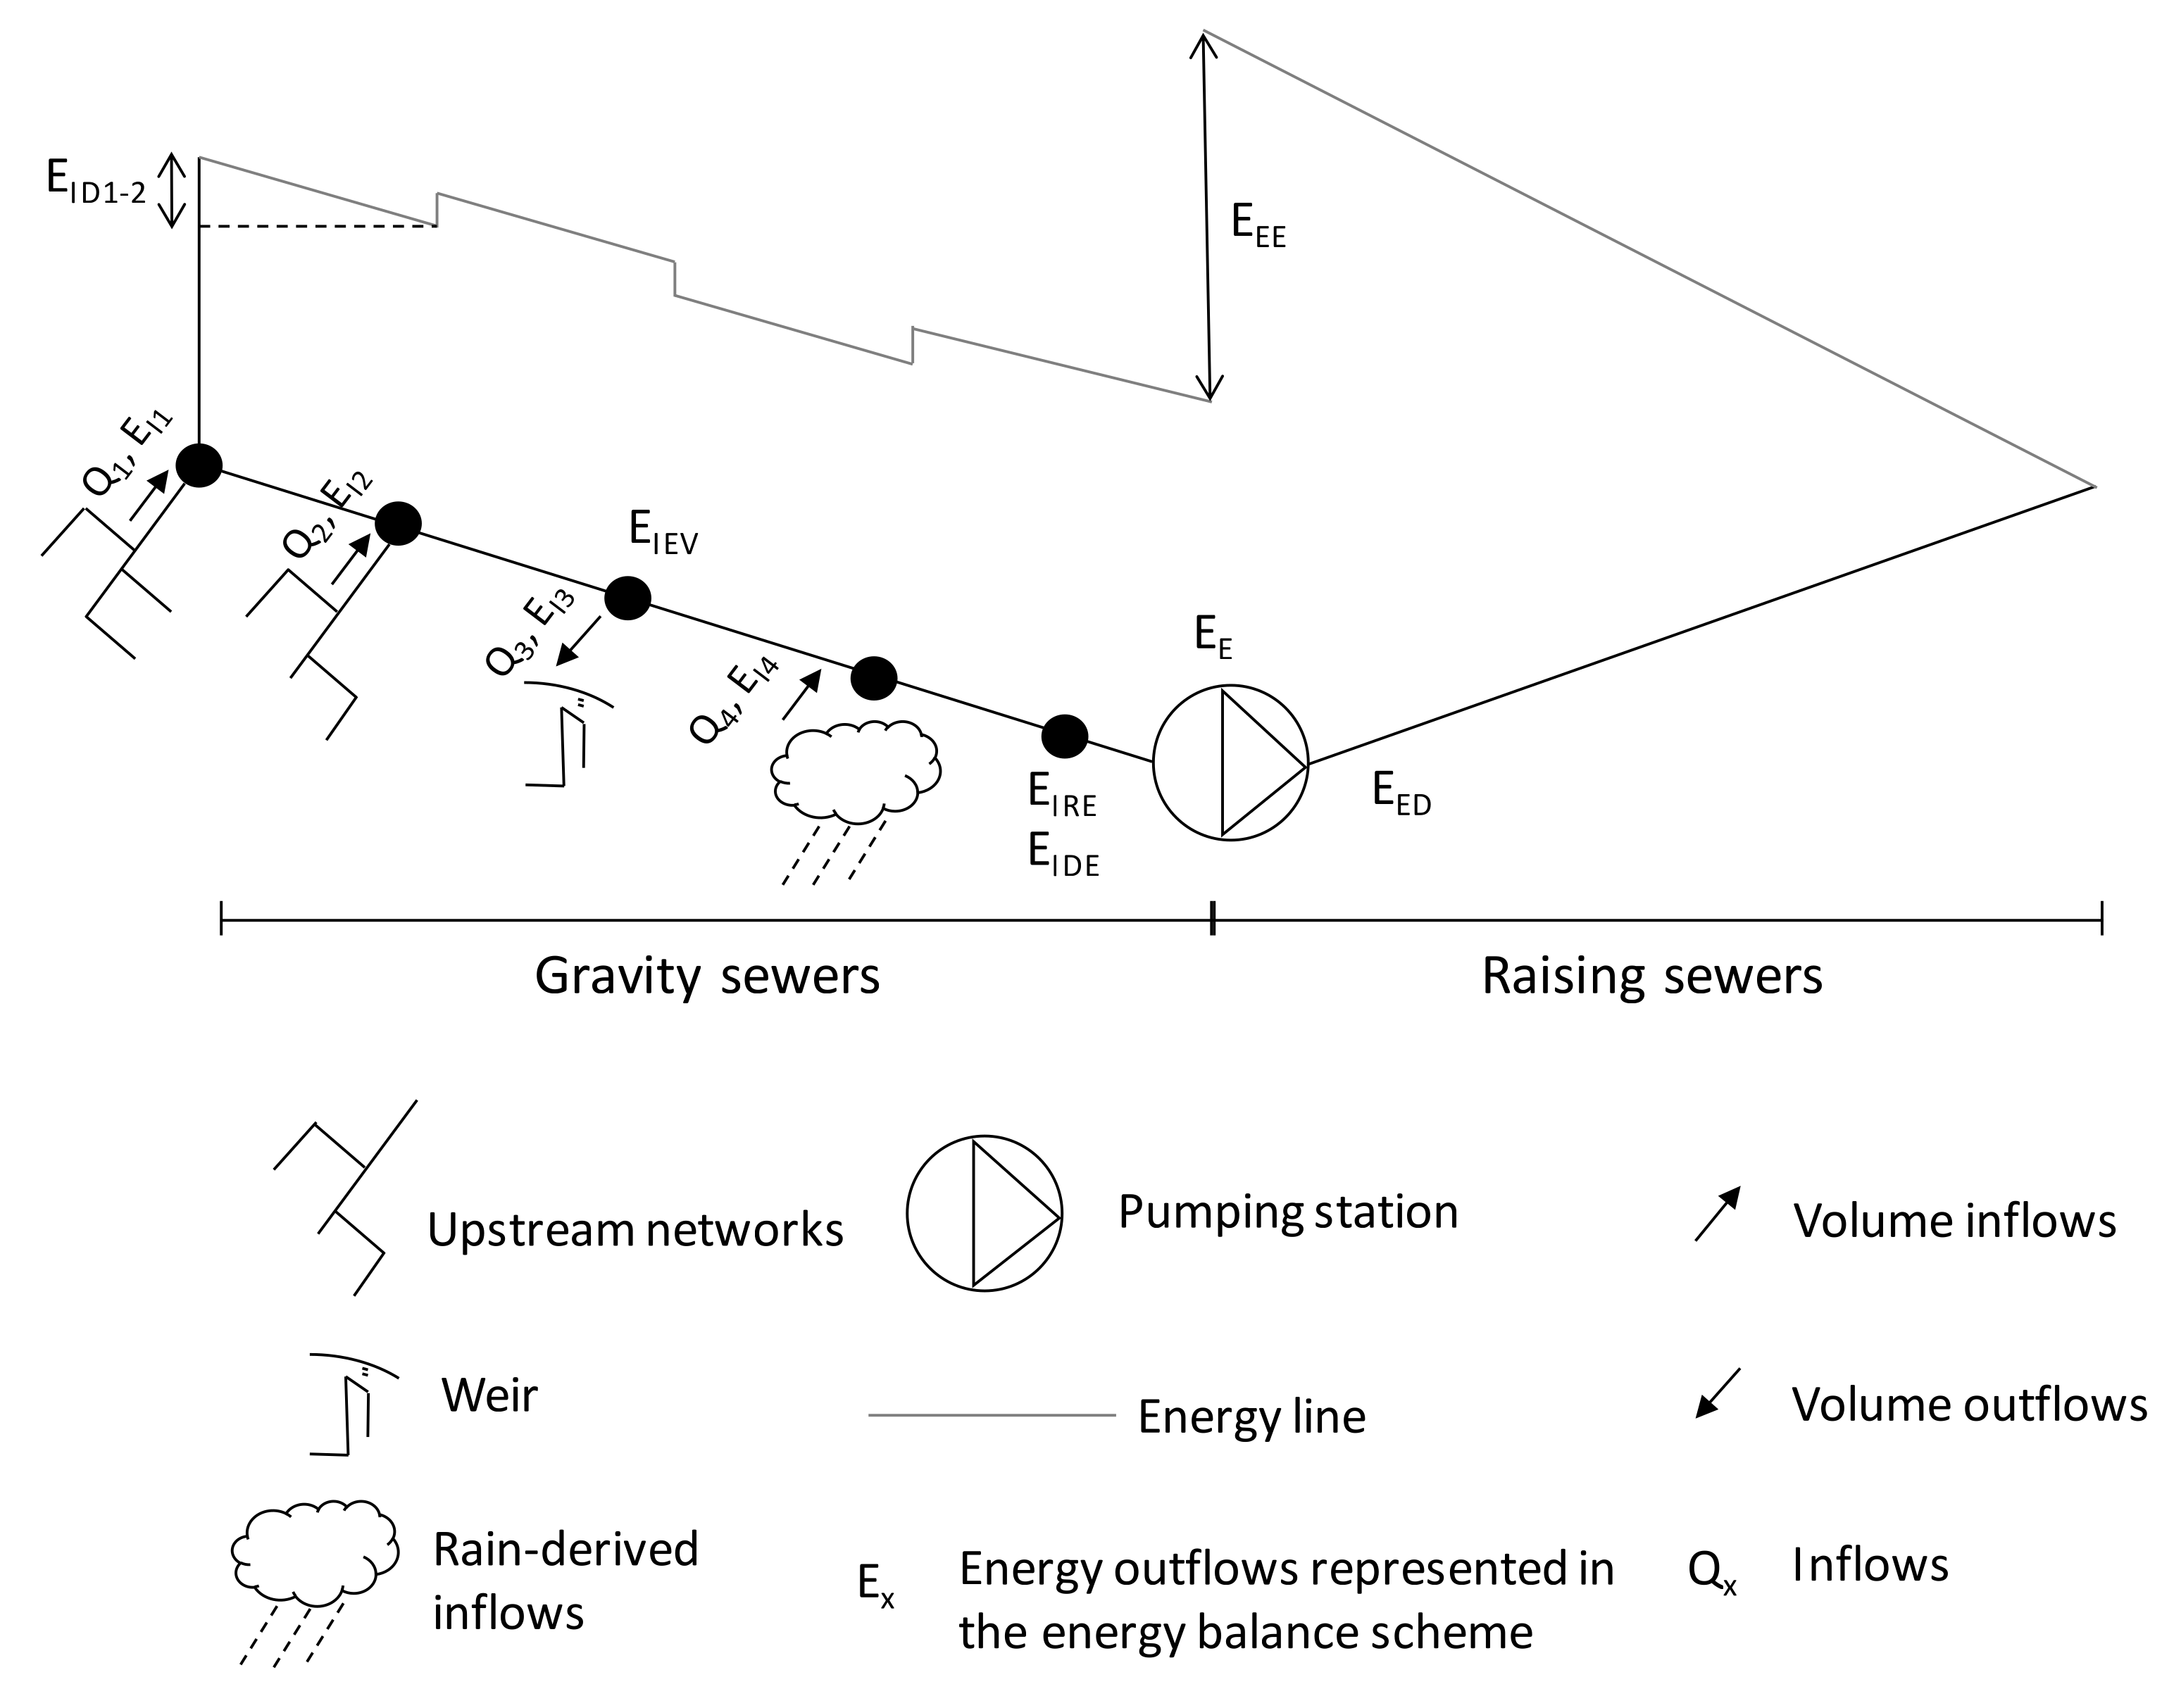
Figure 1 shows the schematic representation of the different inputs and outputs of energy components associated with the energy balance calculation. The referred energy balance is depicted in Table 1 for typical wastewater systems.
The energy balance can be applied at three assessment levels (macro, meso, and micro-level) depending on the available data (network inventory data, flow measurements or energy measurements) and the time horizon (day, month, year). Thus, the energy balance can be calculated by utilities with different maturity levels, systems, layouts and operation modes.
First, a macro-level assessment provides a global overview of the major components of energy consumption in the system. The external energy and the energy associated with undue inflows and authorized inflows can be estimated annually. This assessment is significant, as it allows for a preliminary evaluation of energy consumption in the system. The macro assessment can also be used when wastewater utilities do not have hydraulic models or have limited data.
Second, a meso-level assessment is an intermediate level that requires additional data and can also be applied by utilities that do not have hydraulic models. The calculations consist of the elevation-associated energy and the dissipated energy components in a disaggregated way, including the pump inefficiencies, friction losses and local head losses. If results from energy audits are available, then the computation of the dissipated energy associated with the pumping equipment will be more accurate. When these results are not available, the estimation of the pumping station efficiency can be carried out in a simplified way.
Finally, the third proposed assessment is the micro-level assessment, which requires a calibrated hydraulic model of the network and provides a detailed assessment of the energy consumption in every component of the energy balance, typically applied at the subsystem level. The adopted level of simplification in the mathematical model depends on several factors, mainly the modelling purpose and scope, the required and available data, and the loading conditions of the system. The simplifications of the data, network and structures of the drainage system must guarantee a reasonable description of the real operational conditions. Data requirements of a mathematical model are significant and should be complemented with fieldwork to define and characterize the magnitude and relevant characteristics of the system [25]. There is a wide variety of software suitable for the mathematical modelling of stormwater drainage systems, such as SWMM, Mike Urban, Mike Flood, Info Sewer and Sewer Cad, among others. Any of these can be used for computing the energy balance components. This approach can only be applied by wastewater utilities with a high maturity level, since they need to have hydraulic models already implemented and calibrated. Otherwise, simplified approaches should be preferentially used [23].
The results obtained by the micro-level assessment allow the identification of the main inefficiencies of the system and the establishment of improvement measures at the tactical level of planning. The current paper focuses on the micro-level. A detailed description of this assessment is provided in Section 2.2. Macro- and meso-level assessments, as well as their application results, have been further described by the authors of [23].
2.2. Micro-Level Assessment Description and Formulation
The total energy used in the system for transport and treatment is the sum of the total inflow intrinsic energy and external energy. Total inflow intrinsic energy refers to the energy associated with the free surface flow, which is composed of kinetic and potential energy. External energy refers to the energy supplied by the pumping stations. Both energy components are divided into two parts: the energy associated with authorized or due inflows and the energy associated with undue inflows.
From the perspective of the energy outflows, the total inflow intrinsic energy includes the system downstream energy, the recovered energy, the dissipated energy due to inefficiencies in the energy recovery equipment or pipe friction and local head losses and, finally, the energy associated with exceedance volumes (not connected to energy-consuming component or potentially inflowing to energy-consuming components). The external energy can also be divided into the elevation-associated energy (necessary energy to pump the wastewater volume between the water level in the pumping well and the elevation in the downstream delivery point) and the dissipated energy due to the inefficiencies in electromechanical equipment or due to pipe friction and local head losses. A more detailed description of the energy balance has been provided by [23]. The required data and the formulas for calculating each component of the energy balance are presented in Table 2.
Regarding the remaining components of the energy balance presented in Table 1, the energy at the final section of the system, (typically the connection to a WWTP or an interceptor sewer), was calculated by applying Equation (3) at the final node of the system (kWh), and , the energy dissipated by friction losses and local head losses, was calculated by applying Equation (6) to each pumping station. In the micro-level application, the percentage of the energy associated with authorized or due flows, and , can be estimated by the hydraulic model considering the dry weather inflow. Similarly, the energy associated with undue inflows, and , can be estimated using a proportion of the runoff volume entering the system (wet weather inflow). Concerning the components of the energy associated with exceedance volumes ( and ), these can be estimated by considering the discharged and flooded volumes obtained by the model. Detailed procedures to calculate the latter components without the use of a hydraulic model have been described by [23].
As mentioned, the full application of the micro-level assessment requires a calibrated hydraulic model of the drainage system to allow the reliable simulation of the system behaviour and the calculation of the energy balance components.
2.3. Energy Recovery and Economic Viability
The application of the micro-level assessment allows the estimation of the potential of energy recovery. For this purpose, the available hydraulic power can be estimated by Equation (12), and the potential energy recovery by Equation (13):
in which is the available hydraulic power (W), E is the potential energy recovery (kWh) and Δt is the operating time (h) in the period of analysis.
The energy recovery can be carried out by installing turbines adequate for low heads and high flow rates (e.g., water wheels, Archimedes screws). Despite the highly corrosive properties of wastewater and transported solid material, there have been several successful applications in wastewater systems [21,22].
The economic analysis of these projects should be based on the calculation of the annual recovered energy for a defined design flow rate, and the respective costs and benefits during the project lifetime. The capital costs (CC), operation and maintenance (O&M), costs and gross and net revenues are calculated. Several economic indicators can be used to evaluate the feasibility of these projects, such as the net present value (NPV), the payback period (PBP) and the internal rate of return (IRR) [20].
The additional input data to calculate these indicators are the discount rate, ; the project lifetime, n (years); the energy cost unit, (€/kWh); and the annual O&M costs, defined as a percentage of the CC. The CC includes the equipment control, management, civil works and turbine generator setup. The CC includes the revenues throughout the analysis, and the referred economic indicators are calculated for each design flow rate and each technological solution [20]. An acceptable and feasible solution should fit the highest NPV, with an acceptable IRR (>10%) and an adequate payback period ideally lower than 10 years [26].
3. Case Study
The application of the micro assessment requires that wastewater utilities have a hydraulic model of the network that is implemented and adequately calibrated. For the current study, a Portuguese wastewater utility provided a calibrated and reliable hydraulic model of a separate drainage subsystem. This subsystem, located in the Lisbon area, is part of a larger system that intercepts urban wastewater collected by the municipal drainage networks. Currently, the entire system serves a population of 800,000 equivalent inhabitants.
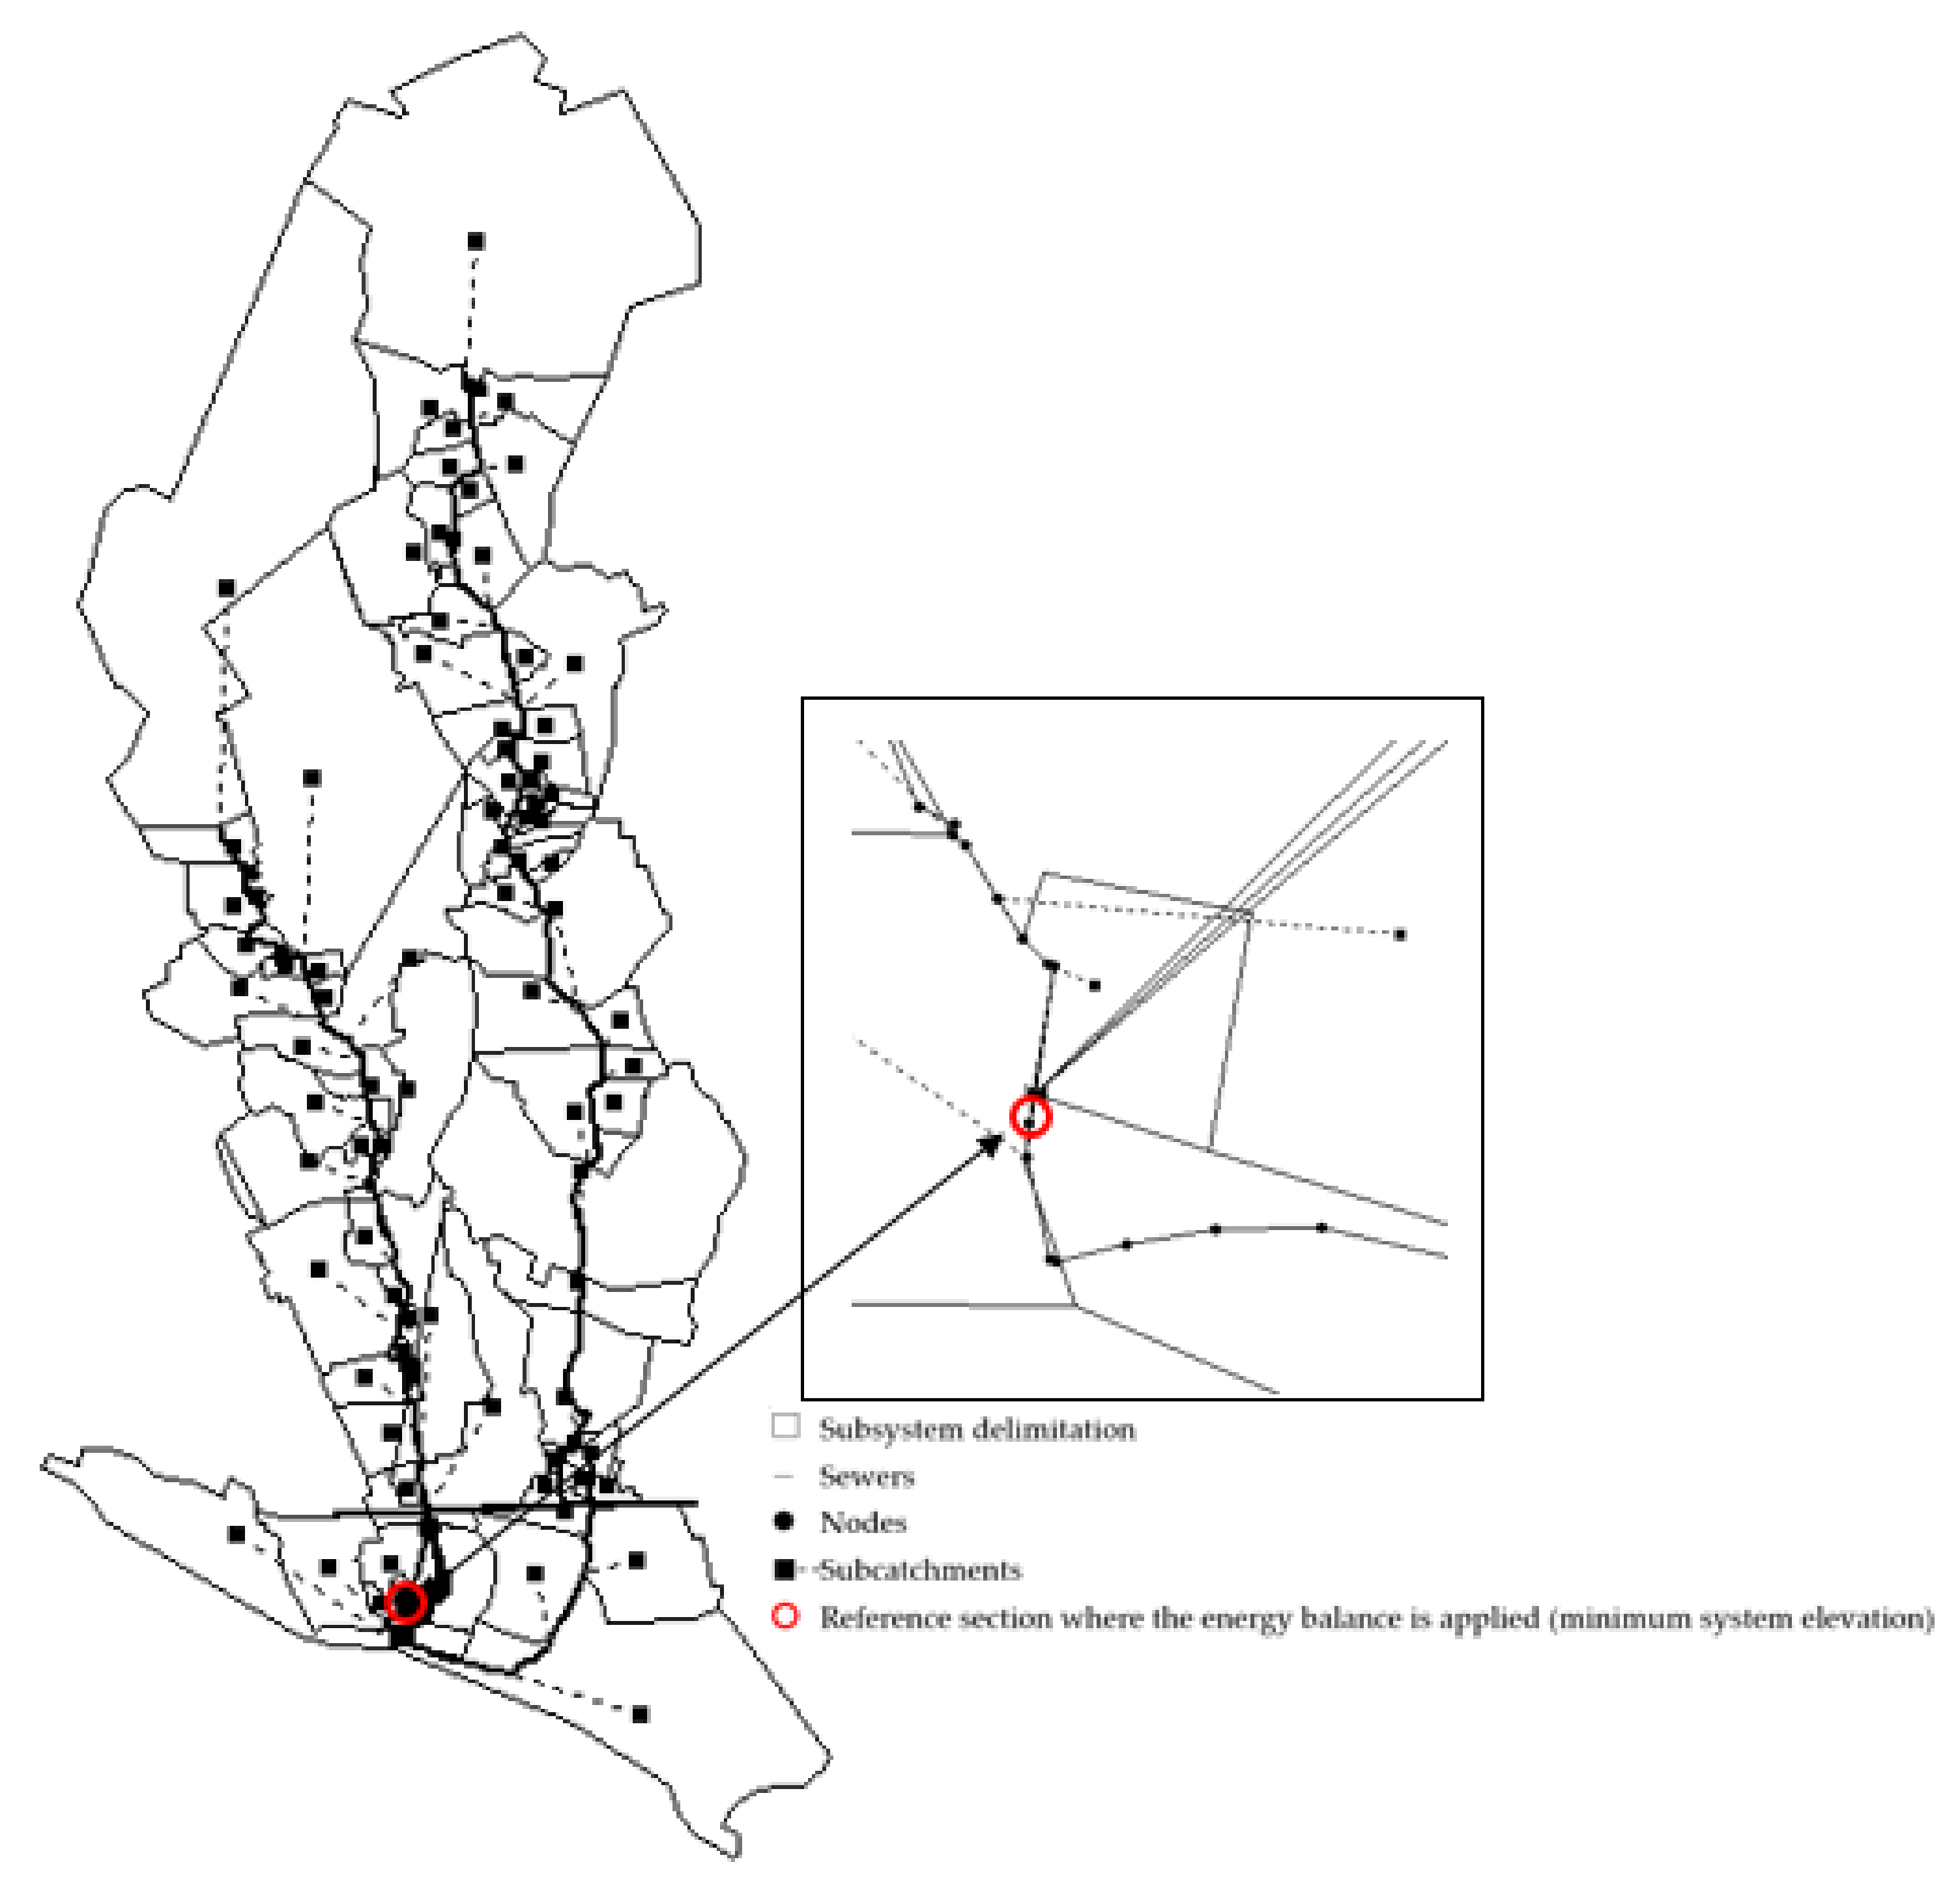
The network scheme of the selected subsystem is presented in Figure 2. It includes part of the general gravity flow interceptor and two emissaries. The first emissary is gravitationally connected to the general interceptor, and the second emissary has a gravitational part and an elevated part, since it does not have the possibility of a total gravitational connection to the general interceptor. The subsystem has a total network length of 15 km and is composed of 432 conduits, with diameters varying between 200 mm and 2200 mm, elevations between 2 m and 133 m, with one pumping station with a manometric head of 13 m, 92 sub-catchments and two weirs. The hydraulic model of the analysed subsystem is calibrated with the flow rate data for dry and wet weather collected in five udometers.
The hydraulic model was developed using the commercial software SWMM developed by the U.S. Environmental Protection Agency. Simulations were carried out for two days in the reference period of 2015: one day of June, representing the dry season (reference situation), and one day of January, representing the wet season. The selection of these days was proceeded by an analysis of records for the season, and it was found that these two days are representative of the corresponding average situations. Therefore, the results for the January day were considered representing represent a maximum energy consumption profile, and the results for the June day were considered to represent a minimum energy consumption profile. Whenever data are available, a complete year should be simulated. Otherwise, simplifications must be assumed. In the current case, the simplification considers the results of the simulations for each day (June or January) as representative of the two seasons of the year (i.e., dry and wet seasons).
4. Results and Discussion
4.1. Micro-Level Assessment Application
The micro-level assessment allows the identification of the main energy inefficiencies in wastewater systems. The most important assumptions for this assessment are: (i) the percentage of the energy associated with authorized or due inflows can be estimated by the hydraulic model considering the dry weather inflow; (ii) the percentage of undue inflows can be estimated using a proportion of the runoff volume entering the system (a percentage of 75% was considered for the present case, based on results of a previous sensitive analysis procedure) [27]; and (iii) the pump efficiency was assumed to be 30% in both cases, since no auditing data were available, and old wastewater pumps usually have very low efficiencies.
The total inflow intrinsic energy is given by Equation (3). The reference elevation, , corresponds to the lowest elevation point (2.03 m). At the inflowing nodes of the system, the hydraulic head is given by the summation of the potential head and the kinetic head.
The dissipated energy in free surface systems without energy recovery equipment is equal to the difference between the total inflow intrinsic energy and the system downstream energy. The latter was calculated by Equation (3), considering that the hydraulic head is given only by the kinetic head, since the potential head at the delivery point is 0 m (no drop at the manhole). In the current case, the recovered energy (Equation (5)) and the respective dissipated energy (Equation (7)) are null. Concerning the components of the energy associated with exceedance volumes ( and ), it can be estimated considering the discharged and flooded volumes obtained by the hydraulic model.
The results obtained for the energy balance application at a micro-level to the selected case study considering the reference situation (June, dry season) are presented in Appendix A (Table A1). The results for this typical summer day correspond to a minimum energy consumption profile for the current case study. This case is associated with purely dry weather conditions, so it is assumed that the percentage associated with undue inflows is 0%. The total wastewater collected volume at dry weather is 3,614,230 m3/year. The total elevated volume is 816,505 m3/year, and the total external energy consumption is 98,688 kWh/year. Concerning the exceedance volumes, at dry weather conditions, no overflows occur in the system.
The results obtained for the micro-level of the energy balance for a typical day in January (wet season) are presented in the Appendix A (Table A2). Similar to the previous results, the values for this season correspond to a maximum energy consumption profile for the present case study. For this case, given the contribution of the wet and dry weather inflows, the percentage of undue inflows is 42.6%. The total wastewater collected volume at dry weather is 6,090,268 m3/year, and the total volume at wet weather is 27,020,098 m3/year. The total elevated volume is 2,701,973 m3/year, and the total external energy consumption is 326,578 kWh/year. The exceedance volumes were estimated from the discharged and flooded volumes obtained from the hydraulic model, with a total of 19,931,068 m3/year.
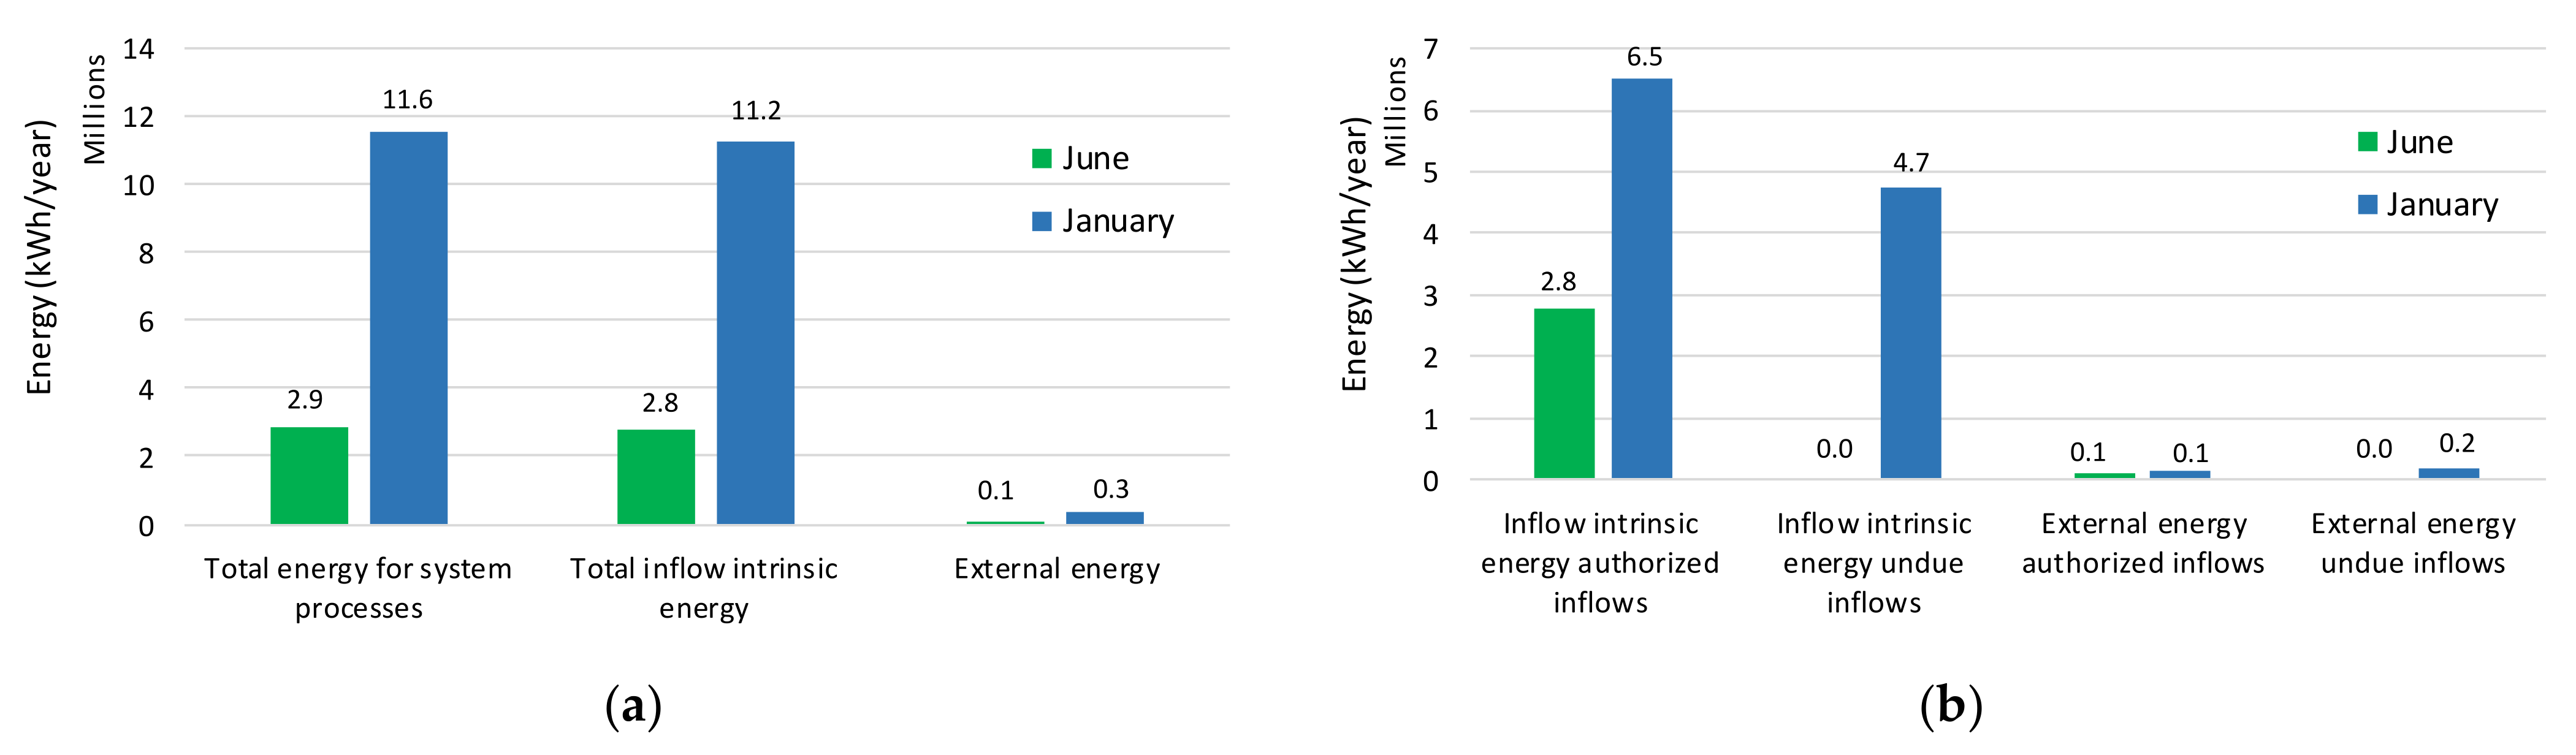
Figure 3 shows the comparison of the energy balance components for both seasons. Components that are zero in both cases (recovered energy and dissipated energy associated with energy recovery equipment) are not depicted.
A substantial increase (four-times higher) in the total energy for system processes was observed in the wet season, which is mostly associated with the undue inflows, mainly direct rainfall and infiltration (Figure 3a). The external energy is also higher in the wet season, though with a lower increase (three-times higher), because of the higher occurrence of discharges and floods in this season (Figure 3a,d).
The component related to the energy associated with exceedance volumes not connected to energy-consuming components only exists in wet season and is derived from undue inflows (Figure 3c). This component represents the theoretical energy that would be additionally consumed if the total volume that left the system (because of discharges or floods) was also pumped. Calculating this component is important to show to wastewater utilities the importance of acting in the control of undue inflows to reduce energy consumption. This action, in most cases, will only achieve the expected results when the discharged or flooded volumes are eliminated, and only later will the impact be reflected in the reduction of energy consumption. It also highlights the importance of measuring discharges because of their environmental effect and their impact on energy consumption.
In both cases, the total inflow intrinsic energy has high values (>95% of the total energy), since the system is mainly composed of gravity sewers with only one pumping station (Figure 3b). The energy associated with undue inflows considering both seasons is, on average, 21.3%, which is within the estimated range (20–44%) of the macro-level analysis in previous studies [23]. These components strongly depend on the length of the gravity sewer and the number of pumping systems. The current case has only one pumping station and 15 km of sewers, with the total inflow intrinsic energy per unit length being 183,946 kWh/km for the first case and 749,282 kWh/km for the second case. This network only represents a small subsystem inside the utility, highlighting that the results could differ depending on the system layout, characteristics and condition.
The available energy at the downstream end is significantly low (<7%), as the manhole at the reference section has no drop (0 m), and this energy is only associated with the residual velocity component. Therefore, most of the energy associated with the gravity flow is dissipated. Finally, since there is no installed energy recovery equipment, no recovered energy was calculated.
4.2. Reference Elevation Analysis
Several energy balance studies in the urban water cycle have considered the minimum elevation of the system as the reference elevation, z0 [10,11,12,28,29,30,31]. This reference elevation ensures that the energy balance components are always positive, making them easy to understand and compute. However, the reference elevation significantly affects the energy efficiency indices results based on the energy balance, which is important for the diagnosis of the system.
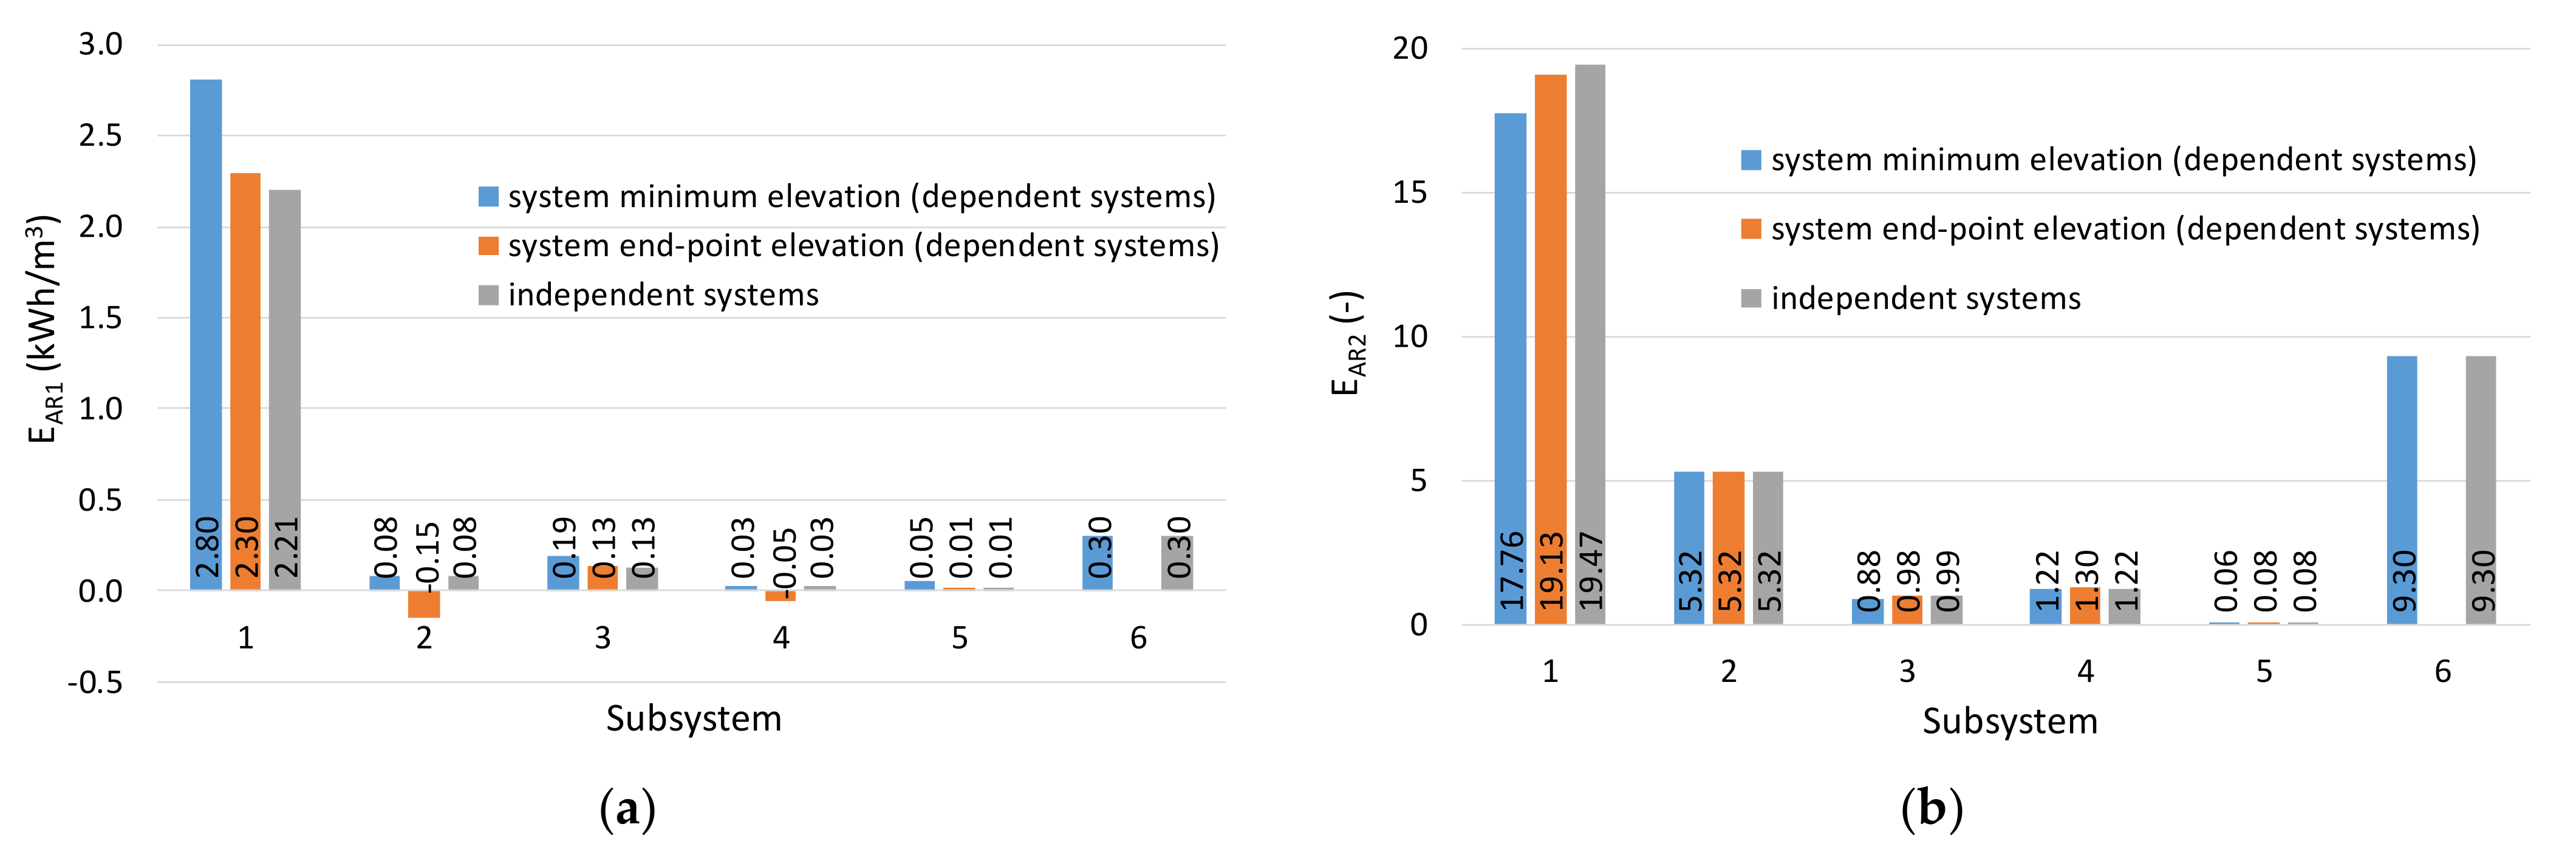
To assess the effect of the reference level on the results, the case study was divided into six smaller subsystems: four gravity sewers, one general interceptor and one elevation conduit. Three different situations were analysed: (i) the subsystems are connected and interdependent, and the reference elevation is the global system minimum elevation (2.03 m); (ii) the subsystems are dependent, but the reference elevation is the system downstream end section (15.00 m); and (iii) the subsystems are independent, and each one has as different reference elevation corresponding to its minimum elevation point. This sensitivity analysis was carried out for the wet season. Two energy efficiency indices, and, , were calculated. The first energy efficiency index is the energy supplied per unit volume of authorized or due inflows, defined by:
in which is the energy supplied per unit of authorised or due inflows (kWh/m3), is the energy supplied (either inflow intrinsic energy, , or external energy, ) to the system (kWh) and is the volume of authorised or due inflows (m3).
The second energy efficiency index represents the energy supplied over the minimum energy required by the system, defined as follows:
in which is the energy in excess in the system, typically associated with undue inflows (kWh), and is the minimum energy required by the system, associated with the operation at dry weather (kWh).
Figure 4 shows the results of the energy indices and for the six subsystems calculated for the three different reference elevations. The selection of different reference elevation values leads to different results even though the differences do not change the ranking of the subsystems in terms of energy efficiency. System 1 is always the most energy-intensive, and subsystems 3, 4 and 5 are assessed as the less intensive for both indices. When subsystems are considered as a whole and the reference elevation is the downstream end (case ii), the values of for subsystems 2 and 4 assume negative values, since these systems are at elevations below the endpoint, while the other subsystems are above the reference elevation. The index is always positive because it is the ratio of two negative energy components for subsystems 2 and 4.
Based on these results, the recommendation is to use a unique regional reference for elevation in the calculation of the energy balance. This reference elevation should be further analysed with different case studies. However, it should ensure that all values of energy components and the respective energy efficiency indices, and , are positive and easy to understand, facilitating the analysis of the results.
4.3. Energy Recovery Curves Application and Economic Viability
Preferable locations for installing energy recovery devices are sites with significant elevation drops combined with high flow rates and available physical space. The locations with a higher potential for energy recovery should be identified and analysed. The average head, flow rate and available hydraulic power allow the selection of adequate types of energy recovery equipment (turbines). For instance, the inverted Archimedes screw represents a very cost-effective technological solution for energy recovery in water systems with low available heads and for a wide range of flow rates [32]. The solution is adequate for liquids transporting solid material [33]. In the current case study, the selected energy recovery solution is the inverted Archimedes screw turbine.
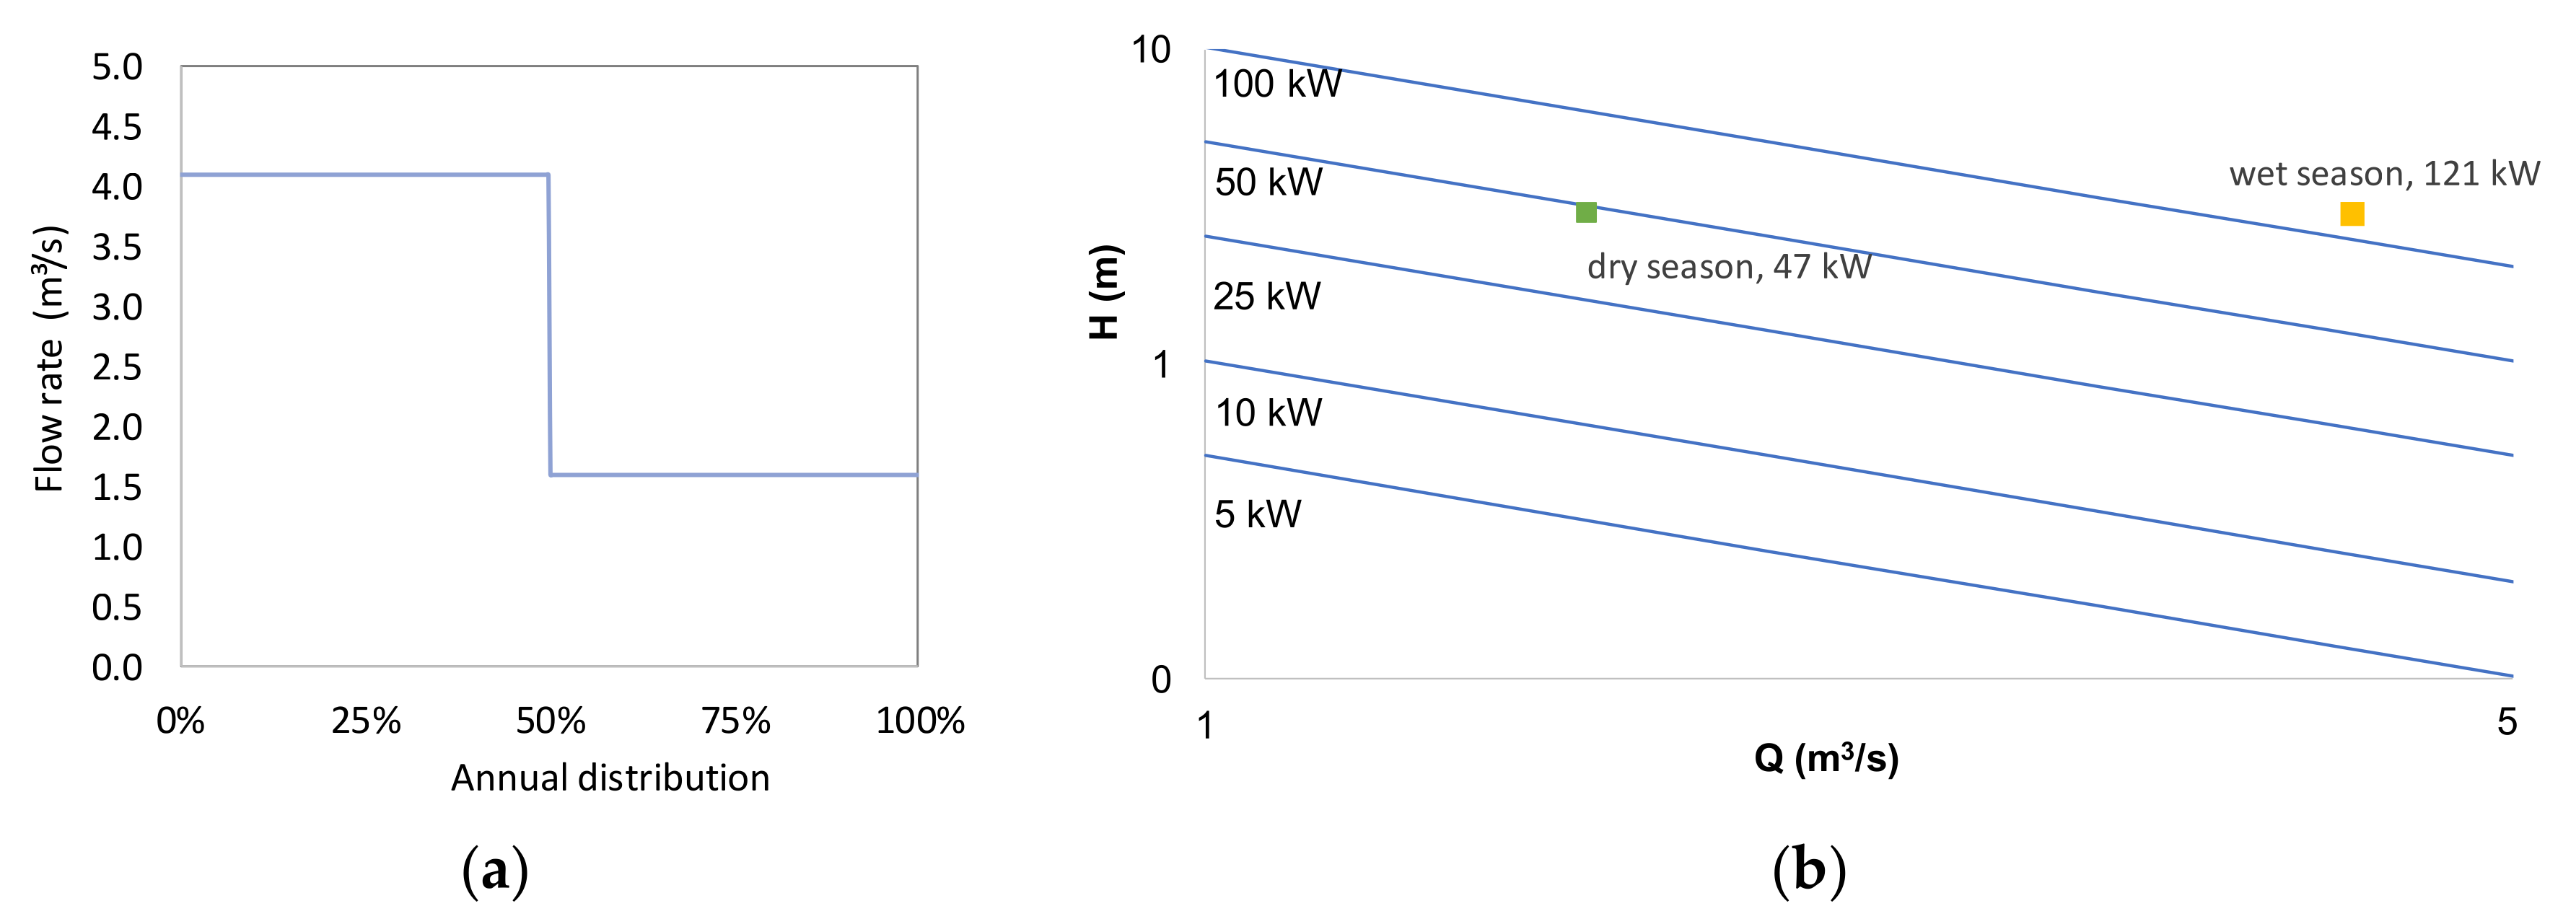
A preliminary assessment of the energy recovery potential was carried out for the two seasons (wet and dry). This assessment aims to illustrate different scenarios for energy recovery at the last point of the final interceptor, considering that the available head is 3 m at the manhole and that the flow rate is constant in each season (Figure 5a). Available average flow rates, available heads and the corresponding hydraulic powers calculated by Equation (12) are depicted in Figure 5b and Table 3. Calculated powers correspond to available mechanical powers in the flow, not accounting for the turbine efficiency. The points are marked as “dry season” and “wet season,” referring to each season. Curves are presented on a logarithmic scale.
These results show that the highest potential for energy recovery is in the wet season, with an average available hydraulic power value of 121 kW. In dry season, the average hydraulic power is significantly lower (47 kW). The values show good recovery potential associated with low heads (3 m).
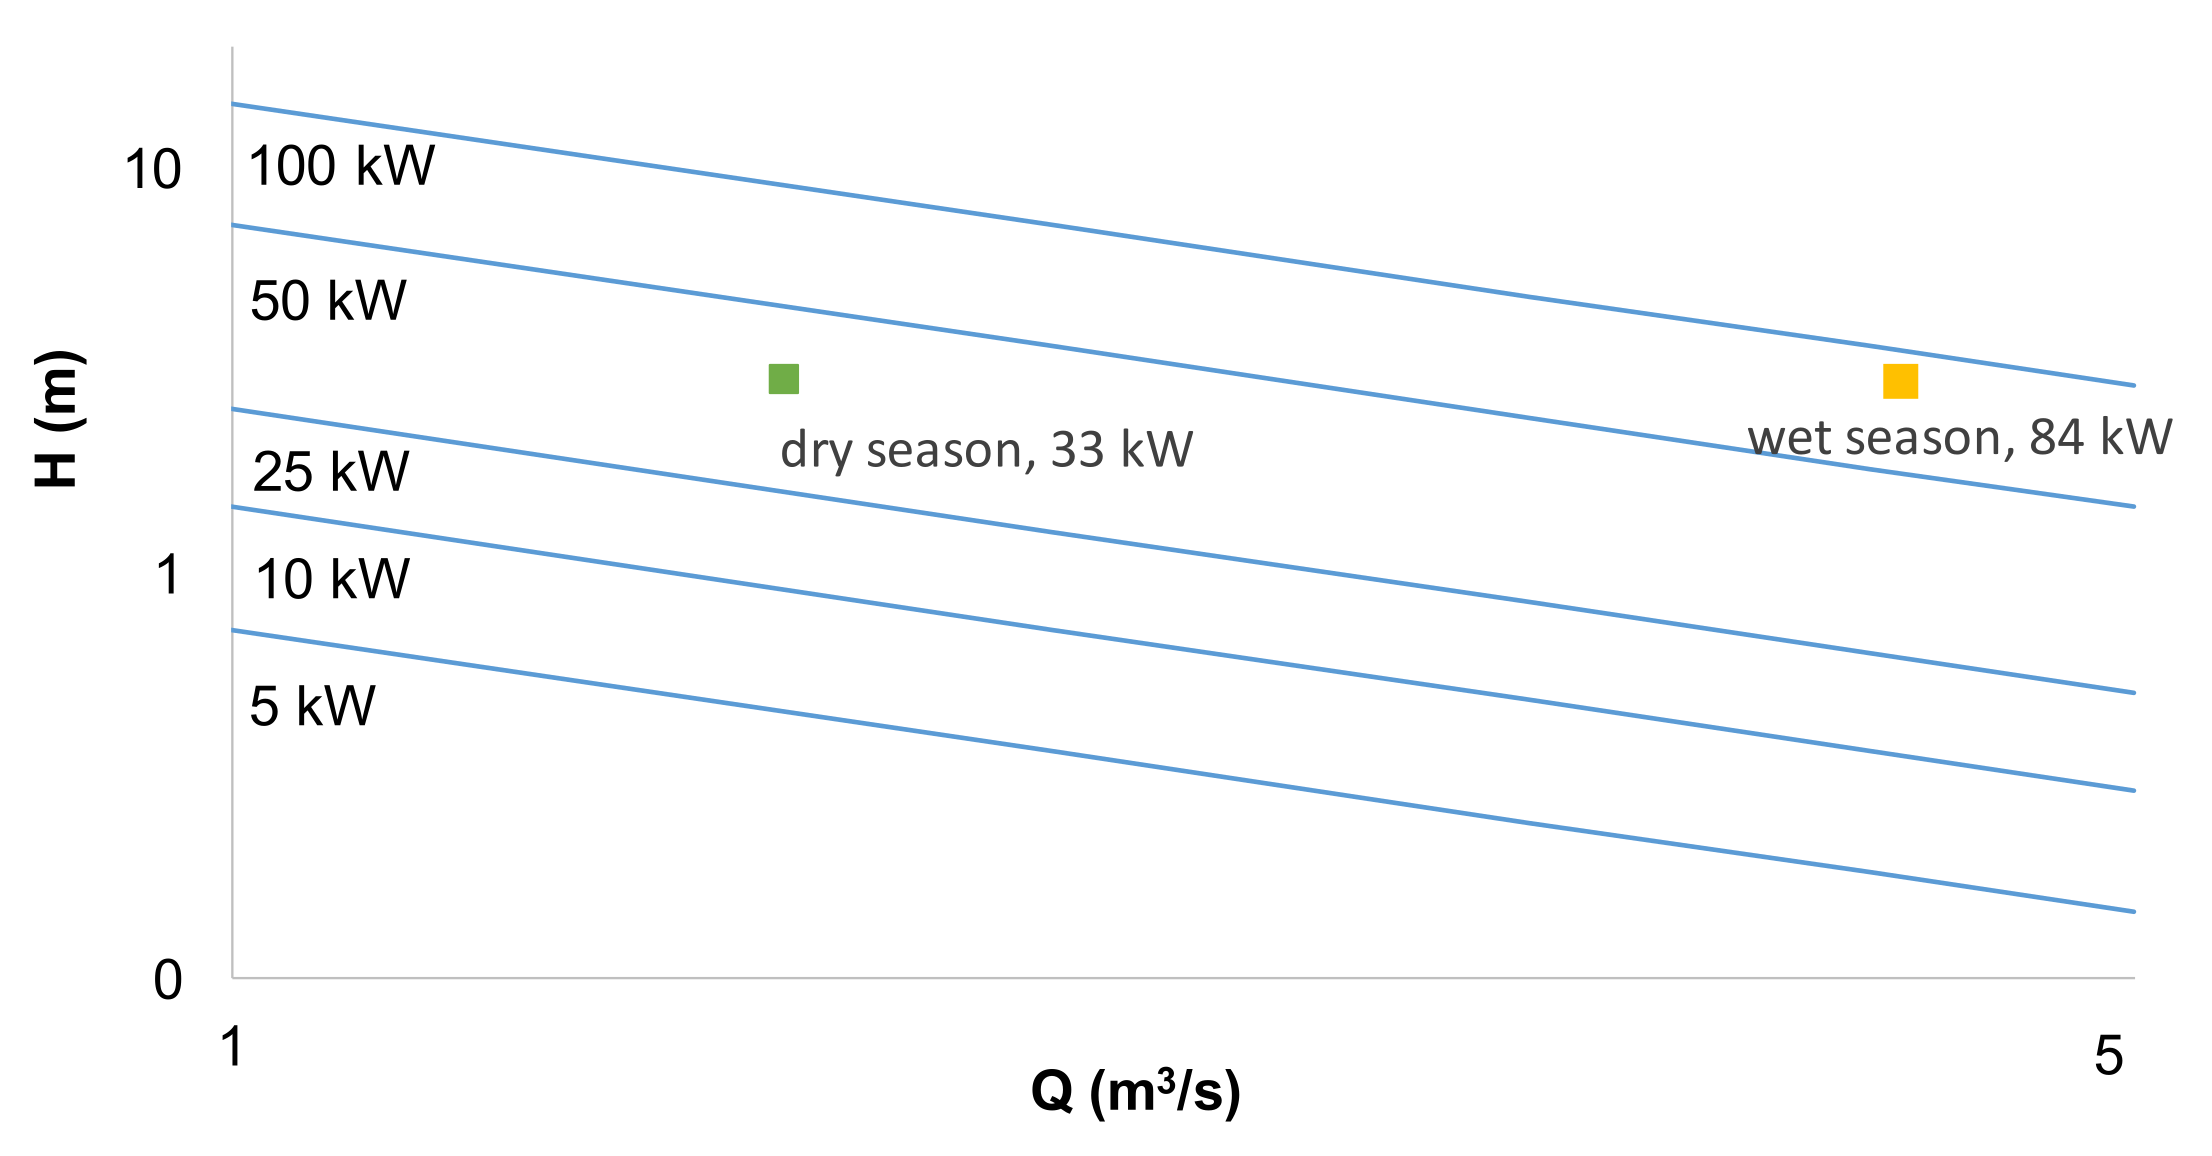
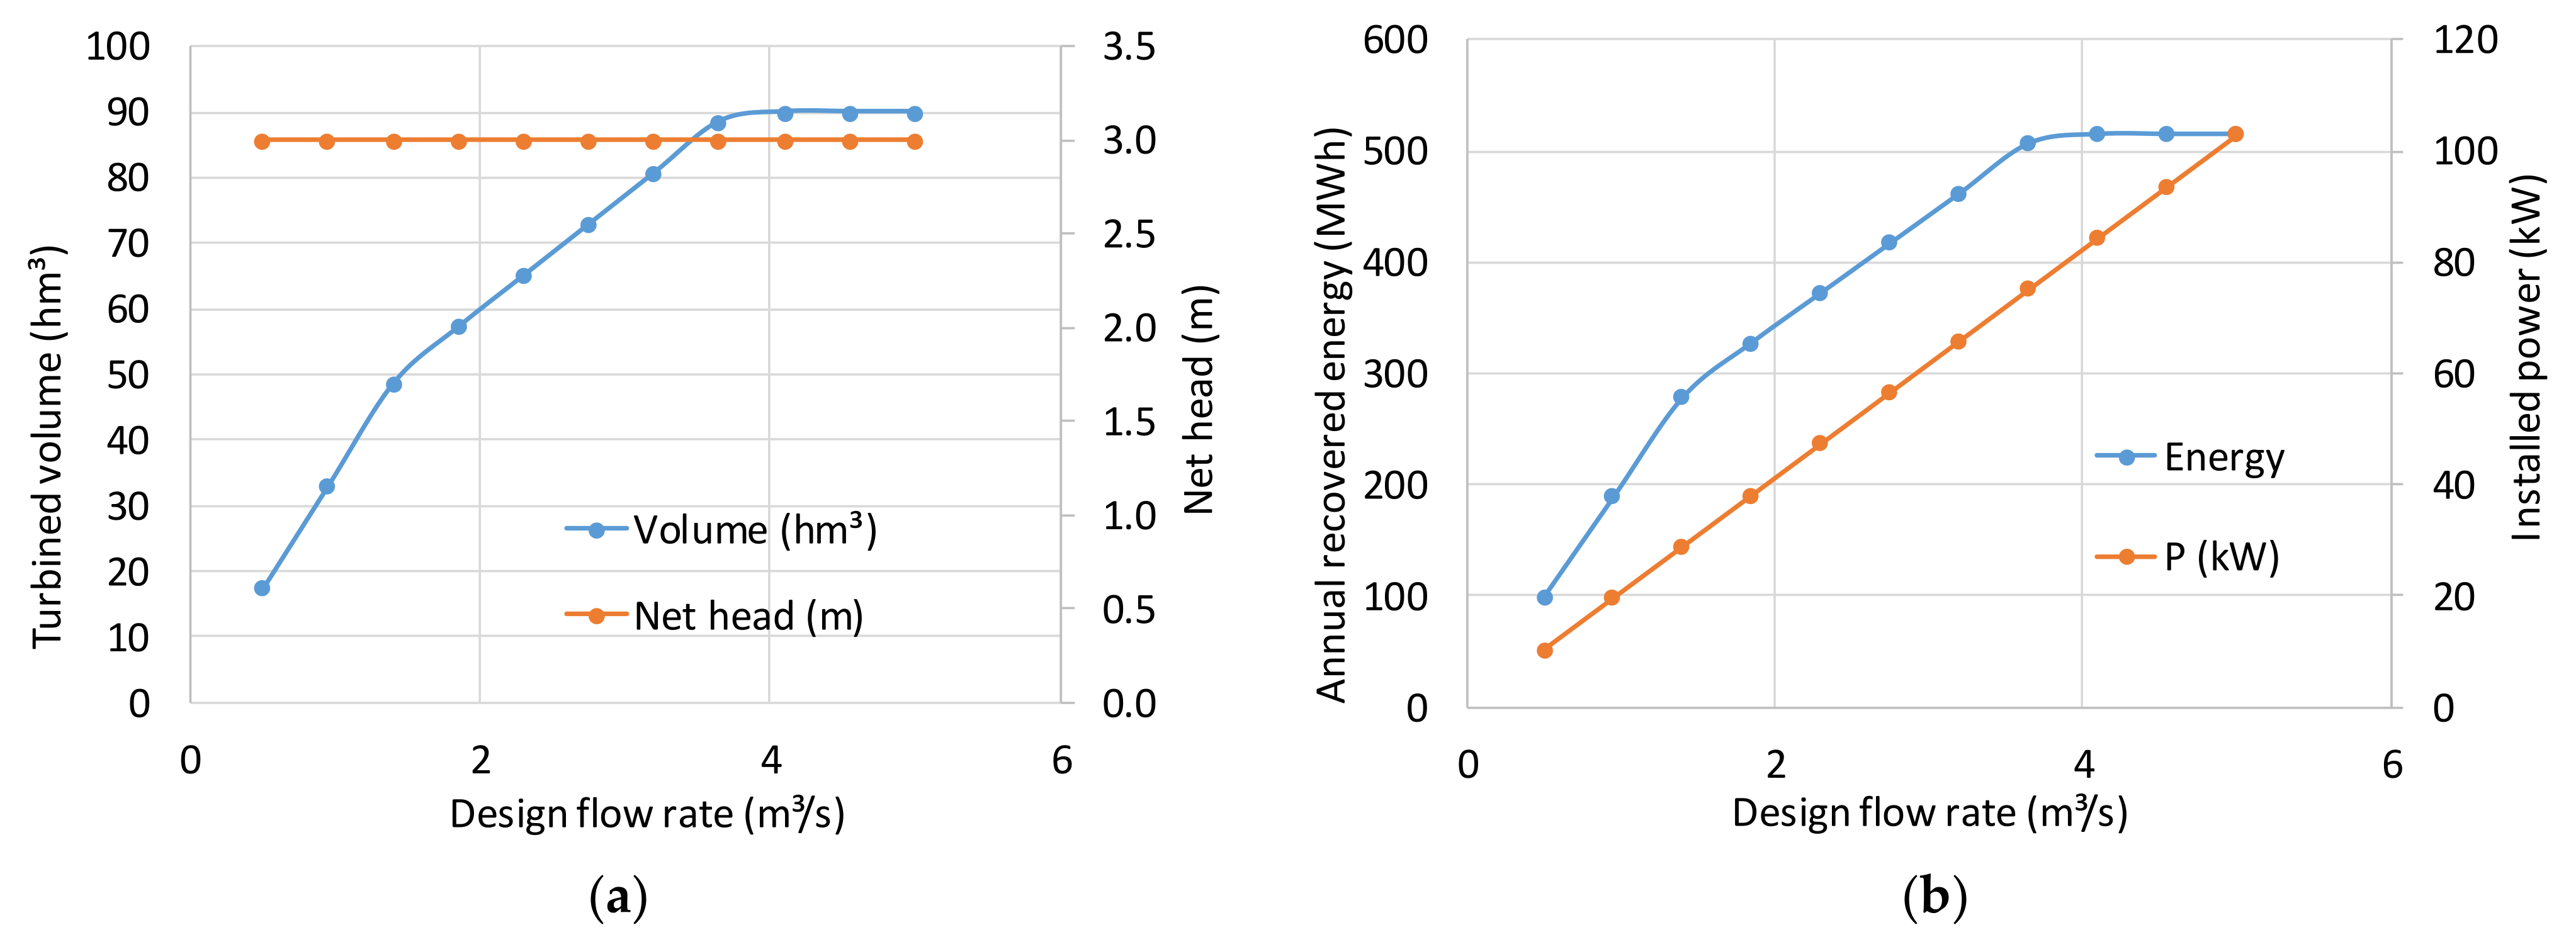
Figure 6 shows the estimated hydraulic power, considering the efficiency of 70% for this equipment [34]. Considering that the inverted Archimedes screw turbine operates with this efficiency for a wide range of flow rates (between 20–110% of rated conditions), the annual recovered energy and the corresponding installed power were simulated for different design flow rates. The maximum recovered energy (515 MWh/year) was observed for design flow rate of 4.1 m3/s, with a corresponding installed power of 84 kW (Figure 7). Considering the corrosive characteristic of the fluid with solids, the use of these turbines or equivalent equipment in wastewater systems is difficult, and efficiencies can be lower than 70%.
Economic analysis requires the calculation of the capital cost, O&M costs, gross and net revenues, as well as several economic indicators, such as the NPV, PBP and IRR. The assumptions adopted herein are: (i) discount rate = 5%; (ii) project lifetime = 20 years; (iii) energy unit cost = EUR 0.10 /kWh; (iv) annual O&M = defined as a percentage of the capital cost (5%). The discount rate, project lifetime and unit energy cost are the typical values used by water utilities in Portugal [20]. The unit capital cost for the Archimedes screw turbine is EUR 2 k/kW.
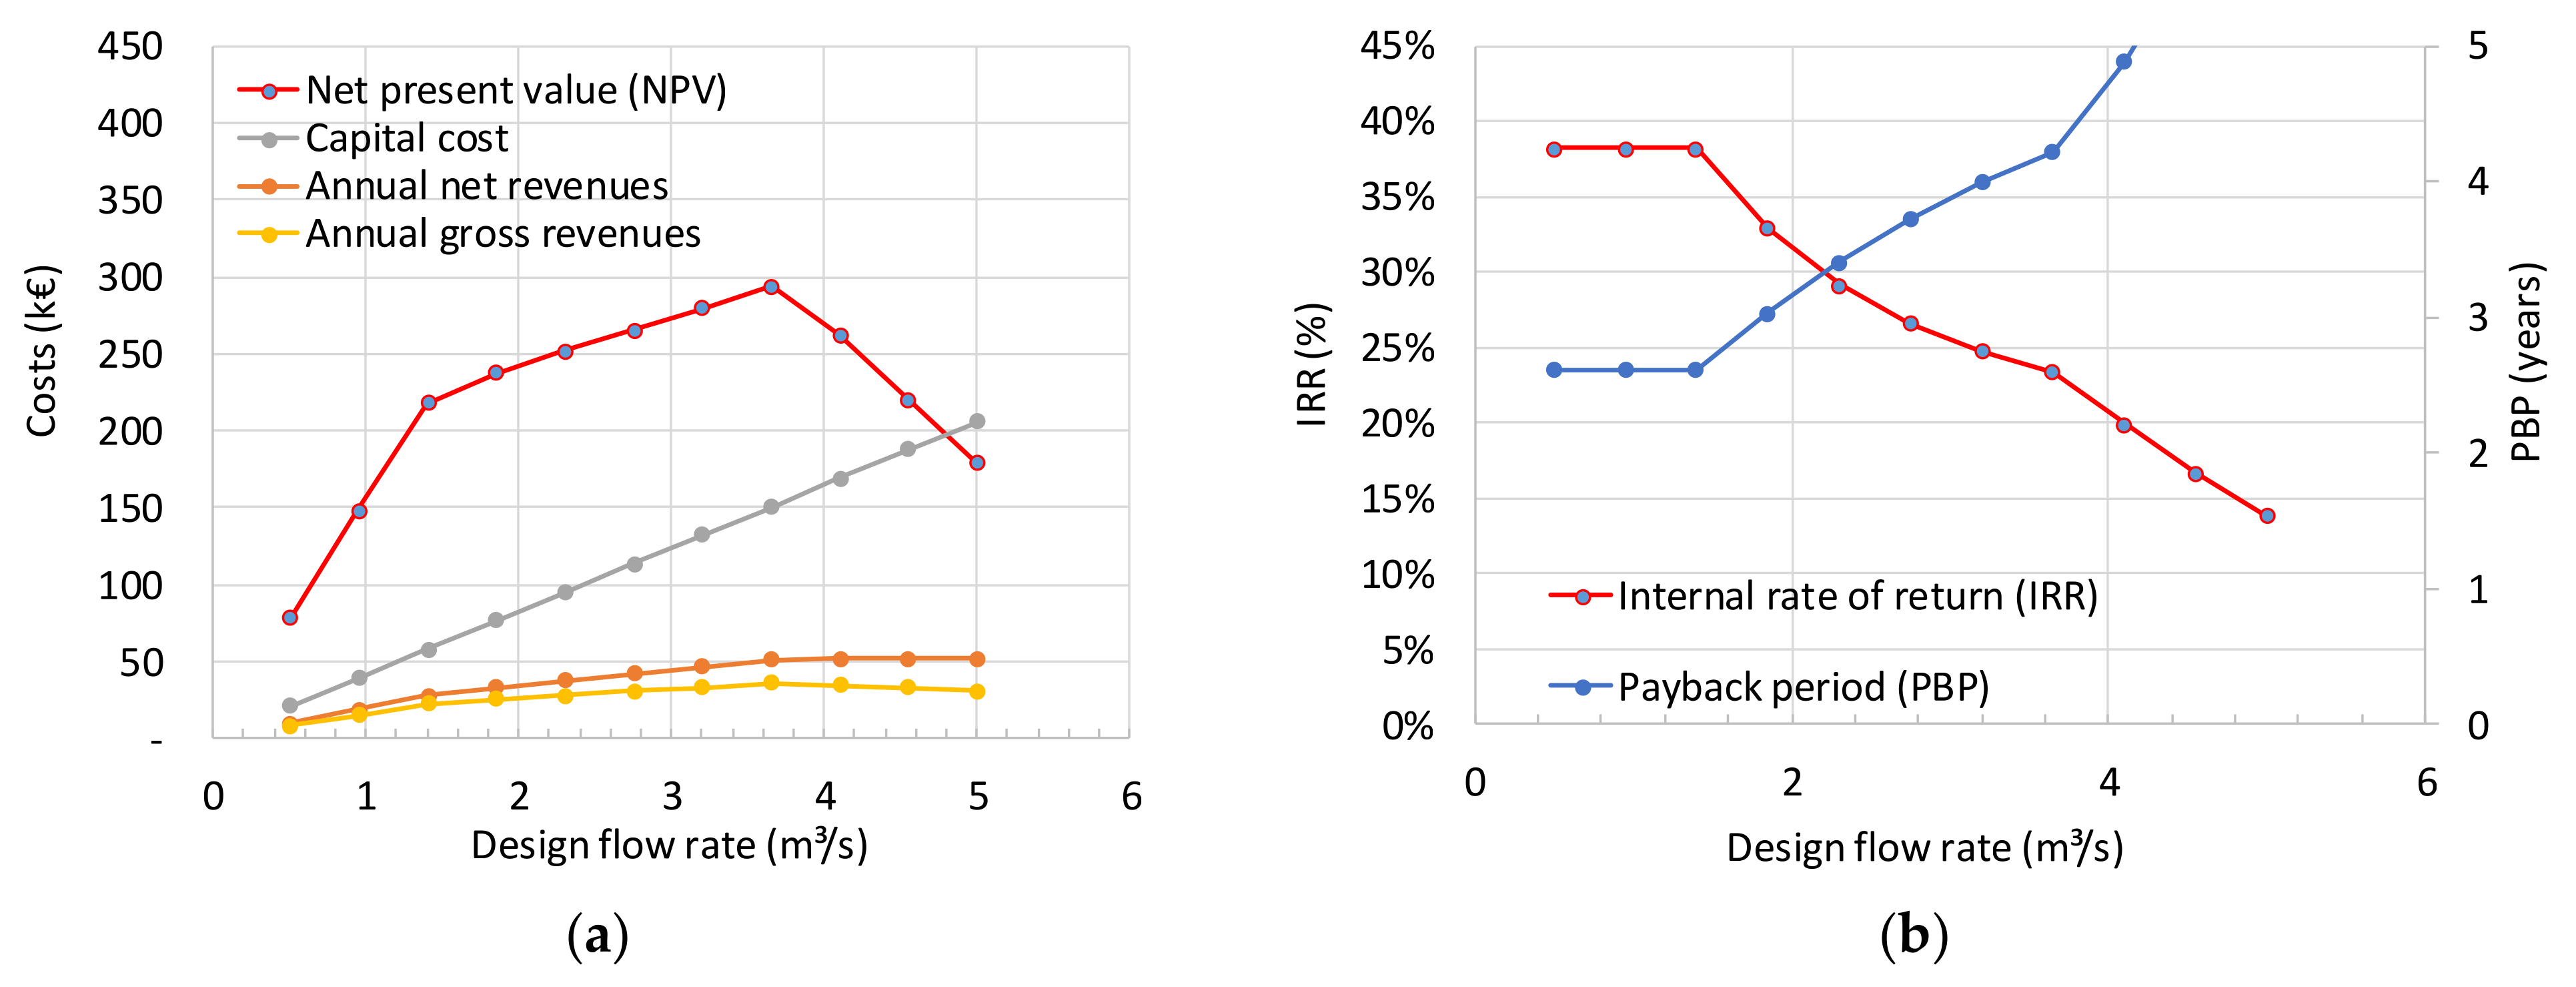
The results for NPV, capital costs, O&M costs and revenues for the Archimedes screw solution are presented in Figure 8a as a function of the design flow rate, and the respective PBP and IRR are presented in Figure 8b.
The maximum recovered energy for the flow rate of 4.1 m3/s (Figure 7b), while the maximum economic benefit leading to the maximum NPV (EUR 293.7 k) is for the design flow rate of 3.65 m3/s (Figure 8a). The corresponding installed power is 75 kW, and the annual recovered energy is 507 MWh/year, which corresponds to a specific energy recovery indicator of 0.01 kWh/m3. For this flow rate, the Archimedes screw turbine has a capital cost of EUR 150.4 k, O&M costs are EUR 15 k/year, the gross revenue is EUR 50.7 k and the net revenue is EUR 35.7 k. The PBP is 4 years, and the IRR is 23%.
The potential for energy recovery can also be evaluated in the other sites of the system, such as after discharges with significant flows or in sewer sections with significant head drops. In each case, the potential for energy recovery and the respective economic viability analysis should be carried out.
5. Conclusions
This paper presents a detailed application of a novel energy balance scheme for assessing energy efficiency in wastewater systems through hydraulic modelling. In the wet season, a substantial increase (four-times higher) in the total energy was observed, mainly derived from undue inflows. In addition, a major part of the energy consumption was associated with the total inflow intrinsic energy (>95% of the total energy used for system processes), since the system was mainly composed of gravity sewers and only one pumping station. The energy associated with undue inflows considering both seasons was significant, being, on average, 21.3%. The component related to the energy associated with overflows potentially inflowing to the energy-consuming component represents additional energy that would be consumed if the total volume that left the system was also elevated. Therefore, this component should not be mistreated, since it highlights to wastewater utilities that, while they do not reduce these exceedance volumes, the impact of actions in the control of undue inflows to reduce energy consumption is compromised.
Regarding the reference elevation analysis, there is evidence that this parameter significantly affects the energy efficiency indices, and the recommendation is to use a unique regional reference in the calculation of the energy balance.
The potential for energy recovery is also of utmost importance, since it enhances the need to consider the energy recovery practice from wastewater systems, which can be sometimes neglected due to recognised limitations. The results in the present paper show a good potential for energy recovery (500 MWh/year) and workable economic viability considering the several indicators presented, namely the PBP of 4 years and IRR of 23%.
In addition, this work reinforces the need for wastewater utilities to focus on the several energy balance components to highlight the main inefficiencies, even if it is not possible to calculate all of them, and different solutions with different results can be considered. It is of the utmost importance to align the proposed energy balance with the performance indicator metrics that support the diagnosis of energy efficiency in wastewater utilities. The potential for energy recovery should also be analysed in locations with high flow rates and with available heads higher than 2–3 m.
Author Contributions
The conceptual idea of this paper was by C.J., D.C. and M.d.C.A. Data analysis and investigation were carried out by C.J. Original draft preparation was developed by C.J. The writing, review and editing were carried out by C.J., M.d.C.A. and D.C. All authors have read and agreed to the published version of the manuscript.
Funding
This research was funded by the Portuguese Foundation for Science and Technology (FCT) through the PhD fellowship PD/BD/135587/2018.
Institutional Review Board Statement
Not applicable.
Informed Consent Statement
Not applicable.
Data Availability Statement
The data presented in this study are contained within the article.
Acknowledgments
The authors gratefully acknowledge the support of FCT, PhD fellowship PD/BD/135587/2018. The authors thank the Portuguese water utility Águas do Tejo Atlântico for providing the hydraulic model.
Conflicts of Interest
The authors declare no conflict of interest.
Appendix A

Table A1.
Results of the energy balance application in June: dry season (MWh, % of the total energy used for system processes).
Table A1.
Results of the energy balance application in June: dry season (MWh, % of the total energy used for system processes).
| ENERGY INFLOWS | ENERGY OUTFLOWS | |||||||
|---|---|---|---|---|---|---|---|---|
| Total energy used for system processes (transport and treatment), ET = 2857 MWh (100%) | Total inflow intrinsic energy (associated with the gravity flow), EI = 2759 MWh (96.5%) | Inflow intrinsic energy associated with authorized or due inflows, EIAI = 2759 MWh (96.5%) | Total inflow intrinsic energy, EI = 2,759,184 MWh (96.5%) | System downstream energy, EIDE = 184 MWh (6.4%) | ||||
| Recovered energy (micro hydropower), EIRE = 0 (0%) | ||||||||
| Dissipated energy, EID = 2574 MWh (90.1%) | …due to inefficiencies in energy recovery equipment (e.g., turbines), EIDT = 0 (0%) | |||||||
| …due to pipe friction and local head losses (e.g., junctions, bends, valves, screens), EIDL = 2575 MWh (90.1%) | ||||||||
| Inflow intrinsic energy associated with undue inflows, EIUI = 0 (0%) | ||||||||
| Energy associated with exceedance volumes, EIEV = 0 (0%) | …not connected to an energy consuming component, E′IEV = 0 (0%) | |||||||
| …potentially inflowing to an energy consuming component, E″IEV = 0 (0%) | ||||||||
| External energy (electrical), EE = 99 MWh (3.5%) | External energy associated with authorized or due inflows, EEAI = 99 MWh (3.5%) | External energy, EE = 99 MWh (3.5%) | Elevation associated energy, EEE = 29 MWh (1.0%) | |||||
| Dissipated energy, EED = 70 MWh (2.5%) | …due to inefficiencies (in electromechanical equipment, e.g., pumps), EEDE = 69.5 MWh (2.47%) | |||||||
| External energy associated with undue inflows, EEUI = 0 (0%) | ||||||||
| …due to pipe friction and local head losses (e.g., junctions, bends, valves, screens), EEDL = 0.5 MWh (0.03%) | ||||||||
Table A2.
Results of the energy balance application in January: wet season (MWh, % of the total energy used for system processes).
Table A2.
Results of the energy balance application in January: wet season (MWh, % of the total energy used for system processes).
| ENERGY INFLOWS | ENERGY OUTFLOWS | |||||||
|---|---|---|---|---|---|---|---|---|
| Total energy used for system processes (transport and treatment), ET = 11,566 MWh (100%) | Total inflow intrinsic energy (associated with the gravity flow), EI = 11,239 MWh (97.2%) | Inflow intrinsic energy associated with authorized or due inflows, EIAI = 6504 MWh (56.2%) | Total inflow intrinsic energy, EI = 11,239,224 MWh (97.2%) | System downstream energy, EIDE = 645 MWh (5.6%) | ||||
| Recovered energy (micro hydropower), EIRE = 0 (0%) | ||||||||
| Dissipated energy, EID = 3828 MWh (33.1%) | …due to inefficiencies in energy recovery equipment (e.g., turbines), EIDT = 0 (0%) | |||||||
| …due to pipe friction and local head losses (e.g., junctions, bends, valves, screens), EIDT = 3828 MWh (33.1%) | ||||||||
| Inflow intrinsic energy associated with undue inflows, EIUI = 4735 MWh (40.9%) | ||||||||
| Energy associated with exceedance volumes, EIEV = 6766 MWh (58.5%) | …not connected to an energy consuming component, E′IEV = 5736 MWh (49.6%) | |||||||
| …potentially inflowing to an energy consuming component, E″IEV = 1030 MWh (8.9%) | ||||||||
| External energy (electrical), EE = 327 MWh (2.8%) | External energy associated with authorized or due inflows, EEAI = 133 MWh (1.1%) | External energy, EE = 327 MWh (2.8%) | Elevation associated energy, EEE = 96 MWh (0.8%) | |||||
| Dissipated energy, EED = 231 MWh (2.0%) | …due to inefficiencies (in electromechanical equipment, e.g., pumps), EEDE = 229 MWh (1.98%) | |||||||
| External energy associated with undue inflows, EEUI = 194 MWh (1.7%) | ||||||||
| …due to pipe friction and local head losses (e.g., junctions, bends, valves, screens), EEDL = 2 MWh (0.02%) | ||||||||
References
- Lingireddy, S.; Wood, J. Improved operation of water distribution systems using variable-speed pumps. J. Energy Eng. 1998, 124, 90–103. [Google Scholar] [CrossRef]
- U.S. Department of Energy—USDE. Energy Demands on Water Resources. Rep. to Congress on the Interdependency of Energy and Water. U.S. Department of Energy: Washington, DC, USA, 2006. [Google Scholar]
- Frijns, J.; Hofman, J.; Nederlof, M. The potential for (waste)water as energy carrier. Energy Convers. Manag. 2013, 65, 357–363. [Google Scholar] [CrossRef]
- Wilson, L.; Lichinga, K.N.; Kilindu, A.B.; Masse, A.A. Water utilities’ improvement: The need for water and energy management techniques and skills. Water Cycle 2021, 2, 32–37. [Google Scholar] [CrossRef]
- Mamade, A.; Loureiro, D.; Alegre, H.; Covas, D. A comprehensive and well tested energy balance for water supply systems. Urban Water J. 2017, 14, 853–861. [Google Scholar] [CrossRef]
- Williams, A.A.; Smith, N.P.A.; Bird, C.; Howard, M. Pumps as Turbines and Induction Motors as Generators for Energy Recovery in Water Supply Systems. Water Environ. J. 1998, 12, 175–178. [Google Scholar] [CrossRef]
- Fecarotta, O.; McNabola, A. Optimal Location of Pump as Turbines (PATs) in Water Distribution Networks to Recover Energy and Reduce Leakage. Water Resour. Manag. 2017, 31, 5043–5059. [Google Scholar] [CrossRef]
- ISO. Energy Audits—Requirements with Guidance for Use; ISO 50002:2014(E); International Organizational for Standardization: Geneve, Switzerland, 2014. [Google Scholar]
- Duarte, P.; Alegre, H.; Covas, D. Avaliação do Desempenho Energético em Sistemas de Abastecimento de Água. VIII Seminário Ibero-americano; SEREA: Lisbon, Portugal, 2008. (In Portuguese) [Google Scholar]
- Cabrera, E.; Pardo, M.A.; Cobacho, R.; Cabrera, E., Jr. Energy audit of water networks. J. Water Resour. Plan. Manag. 2010, 136, 669–677. [Google Scholar] [CrossRef]
- Mamade, A.; Loureiro, D.; Alegre, H.; Covas, D. Top-Down and Bottom-Up Approaches for Water-Energy Balance in Portuguese Supply Systems. Water 2018, 10, 577. [Google Scholar] [CrossRef] [Green Version]
- Mamade, A. Enhancement of Water and Energy Efficiency in Water Supply Systems. PhD. Thesis, Instituto Superior Técnico, Lisbon, Portugal, 2019. [Google Scholar]
- Monteiro, L.; Delgado, J.; Covas, D. Improved Assessment of Energy Recovery Potential in Water Supply Systems with High Demand Variation. Water 2018, 10, 773. [Google Scholar] [CrossRef] [Green Version]
- Delgado, J.; Ferreira, J.P.; Covas, D.I.C.; Avellan, F. Variable speed operation of centrifugal pumps running as turbines. Experimental investigation. Renew. Energy 2019, 142, 437–450. [Google Scholar] [CrossRef]
- Jain, S.V.; Patel, R.N. Investigations on pump running in turbine mode: A review of the state-of-the-art. Renew. Sustain. Energy Rev. 2014, 30, 841–868. [Google Scholar] [CrossRef]
- Nowak, O.; Enderle, P.; Varbanov, P. Ways to optimize the energy balance of municipal wastewater systems: Lessons learned from Austrian applications. J. Clean. Prod. 2015, 88, 125–131. [Google Scholar] [CrossRef]
- McNabola, A.; Coughlan, P.; Williams, A.P. Energy recovery in the water industry: An assessment of the potential for micro-hydropower. Water Environ. J. 2014, 28, 294–304. [Google Scholar] [CrossRef]
- Gallagher, J.; Harris, I.M.; Packwood, A.J.; McNabola, A.; Williams, A.P. A strategic assessment of micro-hydropower in the UK and Irish water industry: Identifying technical and economic constraints. Renew. Energy 2015, 81, 808–815. [Google Scholar] [CrossRef]
- Su, P.-A.; Karney, B. Micro hydroelectric energy recovery in municipal water systems: A case study for Vancouver. Urban Water J. 2015, 12, 678–690. [Google Scholar] [CrossRef]
- Oliveira, P.F.; Martins, N.; Fontes, P.; Covas, D. Hydroenergy Harvesting Assessment: The Case Study of Alviela River. Water 2021, 13, 1764. [Google Scholar] [CrossRef]
- Berger, V.; Niemann, A.; Frehmann, T.; Brockmann, H. Advanced energy recovery strategies for wastewater treatment plants and sewer systems using small hydropower. Water Util. J. 2013, 5, 15–24. [Google Scholar]
- Pereira, H. Hydroenergy Recovery in Urban Water Systems: The Case Study of Alcântara wastewater Treatment Plant. Master’s Thesis, Instituto Superior Técnico, Lisbon, Portugal, 2018. [Google Scholar]
- Jorge, C.; Almeida, M.C.; Covas, D. A novel energy balance tailored for wastewater systems. Urban Water 2021. (Under Review). [Google Scholar]
- Fernandes, E. Avaliação da Eficiência Hídrica e Energética em Aproveitamentos Hidroagrícolas: Contributo Para o Diagnóstico Setorial e Estudo de Soluções de Intervenção. Master’s Thesis, Instituto Superior Técnico, Lisbon, Portugal, 2020. (In Portuguese). [Google Scholar]
- Almeida, M.C.; Cardoso, M.A. Infrastructure Asset Management of Wastewater and Rainwater Services; Technical Guide n.17; ERSAR: Lisbon, Portugal; LNEC: Lisbon, Portugal; IST: Lisbon, Portugal, 2010; ISBN 978-989-8360-05-2. (In Portuguese) [Google Scholar]
- Castro, R. Uma Introdução às Energias Renováveis: Eólica, Fotovoltaica e Minihídrica, 3rd ed.; IST Press: Palo Alto, CA, USA, 2018. (In Portuguese) [Google Scholar]
- Jorge, C.; Almeida, M.C.; Covas, D. Impacto de afluências indevidas no consumo energético em instalações elevatórias em sistemas de drenagem urbana. Revi. Águas Resíduos 2021, IV, 29–40. (In Portuguese) [Google Scholar] [CrossRef]
- Souza, E.V.; Covas, D.I.C.; Soares, A.K. Novel standardized energy auditing scheme in water supply systems. In Proceedings of the 11th International Conference on Computing and Control in the Water Industry, Exeter, UK, 5–7 September 2011. [Google Scholar]
- Feliciano, J.; Almeida, R.; Santos, A.; Ganhão, A.; Covas, D.; Alegre, H. Energy efficiency in water distribution systems—A path to an ideal network—AGS experience. Water Sci. Technol. Water Supply 2014, 14, 708–716. [Google Scholar] [CrossRef]
- Lenzi, C.; Bragalli, C.; Bolognesi, A.; Artina, S. From energy balance to energy efficiency indicators including water losses. Water Sci. Technol. Water Supply 2013, 13, 889–895. [Google Scholar] [CrossRef]
- Carriço, N.; Covas, D.I.C.; Alegre, H.; Almeida, M.C. How to assess the effectiveness of energy management processes in water supply systems. J. Water Supply Res. Technol.—AQUA 2014, 63, 342. [Google Scholar] [CrossRef]
- Simmons, S.; Dellinger, G.; Lyons, M.; Terfous, A.; Ghenaim, A.; Lubitz, W.D. Effects of Inclination Angle on Archimedes Screw Generator Power Production with Constant Head. J. Hydraul. Eng. 2021, 147, 04021001. [Google Scholar] [CrossRef]
- YoosefDoost, A.; Lubitz, W.D. Archimedes Screw Turbines: A Sustainable Development Solution for Green and Renewable Energy Generation—A Review of Potential and Design Procedures. Sustainability 2020, 12, 7352. [Google Scholar] [CrossRef]
- Lashofer, A.; Hawle, W.; Kaltenberger, F.; Pelikan, B. Die Wasserkraftschnecke—Praxis, Prüfstand und Potenzial. Osterr. Wasser- Abfallwirtsch. 2013, 65, 339–347. [Google Scholar] [CrossRef]
Figure 1.
Schematic representation of the energy components in wastewater systems.

Figure 2.
Network scheme of the selected subsystem.

Figure 3.
Comparison between the energy balance components for both seasons (June and January): (a) Energy inflows: total energy for system processes, total inflow intrinsic energy and external energy; (b) energy inflows: inflow intrinsic energy and external energy associated with authorized inflows and to undue inflows; (c) energy outflows: system downstream energy, dissipated energy due to pipe friction, and local head losses and exceedance volumes not connected to an energy consuming component and potentially inflowing to an energy-consuming component; (d) energy outflows: elevation associated energy and dissipated energy.


Figure 4.
Performance indices to analyse the system reference elevation: (a) , (b) .

Figure 5.
(a) Annual distribution of the flow rate; (b) curves for potential hydraulic power recovering (η = 100%).
Figure 5.
(a) Annual distribution of the flow rate; (b) curves for potential hydraulic power recovering (η = 100%).

Figure 6.
Curves for potential hydraulic power recovering (η = 70%).

Figure 7.
(a) Annual turbined volume and net head; (b) annual recovered energy and installed power for the Archimedes screw.
Figure 7.
(a) Annual turbined volume and net head; (b) annual recovered energy and installed power for the Archimedes screw.

Figure 8.
Economic analysis of the Archimedes screw installation as a function of the design flow rate: (a) CC, O&M costs, revenues and NPV; (b) PBP and IRR.
Figure 8.
Economic analysis of the Archimedes screw installation as a function of the design flow rate: (a) CC, O&M costs, revenues and NPV; (b) PBP and IRR.

Table 1.
Energy balance scheme for wastewater systems [23].
Table 1.
Energy balance scheme for wastewater systems [23].
| ENERGY INFLOWS | ENERGY OUTFLOWS | |||||||
|---|---|---|---|---|---|---|---|---|
| Total energy used for system processes (transport and treatment), ET | Total inflow intrinsic energy (associated with gravity flow), EI | Inflow intrinsic energy associated with authorized or due inflows, EIAI | Total inflow intrinsic energy, EI | System downstream energy, EIDE | ||||
| Recovered energy (e.g., micro-hydropower), EIRE | ||||||||
| Dissipated energy, EID | …due to inefficiencies in energy recovery equipment (e.g., turbines), EIDT | |||||||
| …due to pipe friction and local head losses (e.g., junctions, bends, valves, screens), EIDL | ||||||||
| Inflow intrinsic energy associated with undue inflows, EIUI | Energy associated with exceedance volumes, EIEV | …not connected to an energy-consuming component, E′IEV | ||||||
| …potentially inflowing to an energy-consuming component, E″IEV | ||||||||
| External energy (electrical), EE | External energy associated with authorized or due inflows, EEAI | External energy, EE | Elevation associated energy, EEE | |||||
| Dissipated energy, EED | …due to inefficiencies in electromechanical equipment (e.g., pumps), EEDE | |||||||
| External energy associated with undue inflows, EEUI | ||||||||
| …due to pipe friction and local head losses (e.g., junctions, bends, valves, screens), EEDL | ||||||||
The light grey boxes refers to the macro-level components, the dark grey boxes refers to the meso-level additional components to those in macro-level and the micro-level corresponds to all energy balance components (white and grey boxes).
Table 2.
Equations for calculating the energy balance components.
| Hydraulic head | (1) | |
| Total energy used for system processes | (2) | |
| Total inflow intrinsic energy | (3) | |
| External energy | (4) | |
| Recovered energy | (5) | |
| Dissipated energy due to pipe friction and local head losses | (6) | |
| Dissipated energy due to inefficiencies in energy recovery equipment | (7) | |
| Total dissipated energy associated with inflow intrinsic energy | (8) | |
| Elevation associated energy | (9) | |
| Dissipated energy due to inefficiencies in electromechanical equipment | (10) | |
| Total dissipated energy associated with external energy | (11) |
The parameters presented in the formulas are H = hydraulic head (m); p = the pressure (Pa); γ = the water specific weight (9800 N/m3); v = mean flow velocity (m/s); g = gravity acceleration (m/s2); z = the node elevation(m) (z corresponds to the elevation of the level of water with respect to the zero elevation, . The zero elevation, , can typically be assumed as the minimum elevation of the system or the elevation of the delivery point [11,12]. However, a discussion regarding the selection of this reference is presented in Section 4.2); = total energy used for systems processes; = total inflow intrinsic energy (kWh); = external energy (kWh); = flow inflowing to node i and time j (m3/s); = hydraulic head of the inflow to the node i and time j (m); = time interval j (s); α = unit conversion factor from W.s to kWh, α = 1/(1000 × 3600) = 2.78 × 10⁻⁷; N = number of nodes with inflow; T = number of time intervals; = pumped flow of the pumping station i at time j (m3/s); = manometric head of the pumping station i at time j (m), assuming equal pumps installed in parallel; = global efficiency of the pumping station i at time j (); = number of pumping stations. = recovered energy (kWh); = global efficiency of turbine i at time j (-); = flow of the turbine i at time j (m3/s); = net head of the turbine i and time j (m); = number of energy recovery devices; = energy dissipated in pipe friction and local head losses (kWh); = total head loss in pipe i at time j (m); = number of pipes; = dissipated energy in turbines (kWh); = total dissipated energy (kWh); = elevation associated energy (kWh); = geometric-head difference, between the pumping well and the delivery point (m); = dissipated energy associated with pumps inefficiency (kWh); = total dissipated energy (kWh).
Table 3.
Head, flow rate and hydraulic power for both seasons of the case study at the reference section.
Table 3.
Head, flow rate and hydraulic power for both seasons of the case study at the reference section.
| Head, H (m) | Season | Average Flow Rate, Q (m3/s) | Hydraulic Power (kW) |
|---|---|---|---|
| 3 | Dry | 1.6 | 47 |
| Wet | 4.1 | 121 |
Publisher’s Note: MDPI stays neutral with regard to jurisdictional claims in published maps and institutional affiliations. |
© 2021 by the authors. Licensee MDPI, Basel, Switzerland. This article is an open access article distributed under the terms and conditions of the Creative Commons Attribution (CC BY) license (https://creativecommons.org/licenses/by/4.0/).
Share and Cite
MDPI and ACS Style
Jorge, C.; Almeida, M.d.C.; Covas, D. Energy Balance in Wastewater Systems with Energy Recovery: A Portuguese Case Study. Infrastructures 2021, 6, 141. https://0-doi-org.brum.beds.ac.uk/10.3390/infrastructures6100141
AMA Style
Jorge C, Almeida MdC, Covas D. Energy Balance in Wastewater Systems with Energy Recovery: A Portuguese Case Study. Infrastructures. 2021; 6(10):141. https://0-doi-org.brum.beds.ac.uk/10.3390/infrastructures6100141
Chicago/Turabian StyleJorge, Catarina, Maria do Céu Almeida, and Dídia Covas. 2021. "Energy Balance in Wastewater Systems with Energy Recovery: A Portuguese Case Study" Infrastructures 6, no. 10: 141. https://0-doi-org.brum.beds.ac.uk/10.3390/infrastructures6100141