Article

Reduction of Hf via Hf/Zr Substitution in Mechanically Alloyed (Hf,Ti)CoSb Half-Heusler Solid Solutions

1
Department of Mechanical and Manufacturing Engineering, University of Cyprus, Nicosia 1678, Cyprus
2
Department of Mechanical and Structural Engineering and Materials Science, University of Stavanger, 4036 Stavanger, Norway
3
Department of Materials Engineering, Ben-Gurion University of the Negev, Beer Sheva 841051, Israel
*
Author to whom correspondence should be addressed.
Submission received: 22 February 2022 / Revised: 3 April 2022 / Accepted: 8 April 2022 / Published: 13 April 2022
(This article belongs to the Special Issue Advances of Thermoelectric Materials)

Abstract

:
(Hf,Zr,Ti)Co(Sb,Sn) Solid solutions were prepared by mechanical-alloying followed by hot-press method as an attempt to reduce Hf concentration and therefore the material’s cost without negatively affecting the thermoelectric performance. To this end, two different methods were applied: (a) Hf substitution with its lighter and cheaper homologue Zr; and (b) fine tuning of carrier concentration by the substitution of Sb with Sn. The isoelectronic substitution of Hf with Zr was investigated in Hf0.6-xZrxTi0.4CoSb0.8Sn0.2 solid solutions and resulted in lower power factors and ZTs. However, the low thermal conductivity of Hf0.4Zr0.2Ti0.4CoSb0.8Sn0.2 contributed in achieving a relatively good ZT~0.67 at 970 K. The effect of charge carrier concentration was investigated by preparing Hf0.4Zr0.2Ti0.4CoSb1-ySny (y = 0.15–0.25) compounds. Hf0.4Zr0.2Ti0.4CoSb0.83Sn0.17 composition prepared by six hours milling reached the highest ZT of 0.77 at 960 K.

1. Introduction

Over the last century, the global demand for energy has increased dramatically, as well as the energy-related emissions. The negative consequences of climate change and the exhaustion of fossil fuels have brought to the forefront one major challenge: the energy crisis. Thermoelectric (TE) materials can significantly contribute to the solution of this problem due to their capability to convert heat into electricity and vice versa. A material’s TE performance is estimated by a dimensionless figure of merit z T = σ S 2 Τ / κ , where σ,S,κ,T are the electrical conductivity, the Seebeck coefficient, the total thermal conductivity including both the lattice and electronic thermal conductivity and the operation absolute temperature, respectively [1,2,3].
Half-Heusler (HH) compounds, and especially MCoSb, MNiSn (M = Ti Zr,Hf) and FeRSb (R = V,Nb), have recently attracted great interest for medium-high temperature range applications because of their promising thermoelectric performance [4,5]. HHs crystallize in a cubic MgAgAs-type structure (Space group F 4 ¯ 3m) and provide the opportunity of substitutability at each of their three crystallographic sites, which has been found to be extremely useful for tuning TE transport properties [6]. Despite the excellent mechanical and electronic properties of MCoSb and MNiSn (M = Ti, Zr, Hf) alloys, their relatively high thermal conductivity is still considered a disadvantage. Several approaches have been employed for the reduction of thermal conductivity on this family of compounds. Alloy effect, micrometer-phase separation and nanostructuring are some of the most common ways to increase phonon scattering and therefore decrease lattice thermal conductivity [7,8,9,10]. Most recent investigations have shown that doping optimization can be additionally applied to improve the power factor and consequently the overall TE performance [11,12,13,14].
High zT values of up to ~1, were reached for both n- and p-type compositions, which were mainly prepared by an arc-melting method followed by several days of annealing [15,16,17,18,19]. E. Rausch et al. achieved one of the highest zTs ever reported in p-type half-Heusler compositions. A maximum zT of 1.2 at 710 °C was recorded for a phase-separated Ti0.25Hf0.75CoSb0.85Sn0.15 composition prepared by an arc-melting method followed by seven days of annealing at 900 °C [16]. Additionally, Yan et al. mentioned that large differences in the size and mass of the atoms that form the compound can significantly contribute to the reduction of lattice thermal conductivity [20]. Alloyed (Hf,Ti)CoSb0.8Sn0.2 ingots were formed by arc-melting followed by ball milling and hot-press method. As a result, a figure of merit ~1 at 800 °C was reached in a p-type Hf0.8Ti0.2CoSb0.8Sn0.2 material [20]. A peak zT ≥ 1.0 at 800 °C has been also achieved in nanostructured Hf0.44Zr0.44Ti 0.12CoSb0.8Sn0.2 prepared by arc-melting and ball milling [21]. This high zT is also attributed to the reduction of thermal conductivity due to the increased phonon scattering by both alloy and nanostructure effect.
Even though the results are encouraging, the disadvantages of arc-melting method, the time-consuming annealing process and the high cost of Hf remain barriers for the applicability of HH alloys in thermoelectric devices. According to a report on metal prices in the United States through 2010, one kilogram of Hf costs approximately 53 times more than one kilogram of Ti, while Zr is only 9 times more expensive than Ti [22]. Cost effectiveness is a major aspect for commercial use and has been often ignored by thermoelectric researchers. Therefore, reducing the Hf usage in HH solid solutions could be a critical step for practical applications [23].
On the other hand, mechanical alloying (MA) can be used as an alternative and beneficial method for the synthesis of half-Heusler materials. MA has several advantages, such as possibility of scaling up, fewer processing steps and a straight-forward preparation of nanostructured samples with decreased lattice thermal conductivity values. Recently, this scalable synthesis method was applied in p-type (Hf,Ti)Co(Sb,Sn) compounds and a high thermoelectric figure of merit (zT~1.1) was reached for the hot-pressed Hf0.6Ti0.4CoSb0.83Sn0.17 composition, prepared by 4 h MA [13]. This excellent result originates from the significant reduction of the lattice thermal conductivity in the Hf/Ti member in combination with nanostructuring and the charge carrier optimization in the Sb/Sn member [13]. However, the Hf percentage in this composition is still considered high in order to be used in cost-effective thermoelectric devices.
The aim of this work was to achieve a high thermoelectric performance in (Hf,Zr, Ti)Co(Sb,Sn) solid solutions with reduced Hf concentration, prepared by MA. Based on the previously discussed encouraging results of MA in HH compounds, Hf0.6-xZrxTi0.4CoSb0.8Sn0.2 (x = 0, 0.1, 0.2, 0.3, 0.4, 0.5) samples were prepared as an attempt to replace Hf with Zr and to investigate the effect of isoelectronic substitution on the thermoelectric properties. Then, the charge carrier concentration was optimized by preparing Hf0.4Zr0.2Ti0.4CoSb1-ySny samples and the effect of Sn/Sb doping was evaluated. The temperature-dependent thermoelectric properties (electrical conductivity, thermal conductivity and Seebeck coefficient) were measured on hot pressed pellets and the thermoelectric power factor and dimensionless figure of merit (zT) values were estimated.

2. Results and Discussion

2.1. (Hf, Zr,Ti)CoSb0.8Sn0.2 Solid Solution Series

In this section, the MA synthesis of Hf0.6-xZrxTi0.4CoSb0.8Sn0.2 (x = 0, 0.1, 0.2, 0.3, 0.4, 0.5) materials and the effect of Hf substitution with its lighter and cheaper homologue Zr on their microstructure and thermoelectric properties are discussed. The desired half-Heusler phases were completely formed after four hours of milling and there were no further changes for longer milling (up to 8 h). Moreover, 6 h of milling led to the best results in terms of thermoelectric properties [13]. Therefore, the preparation of samples was based on 6 h alloying followed by hot press sintering.

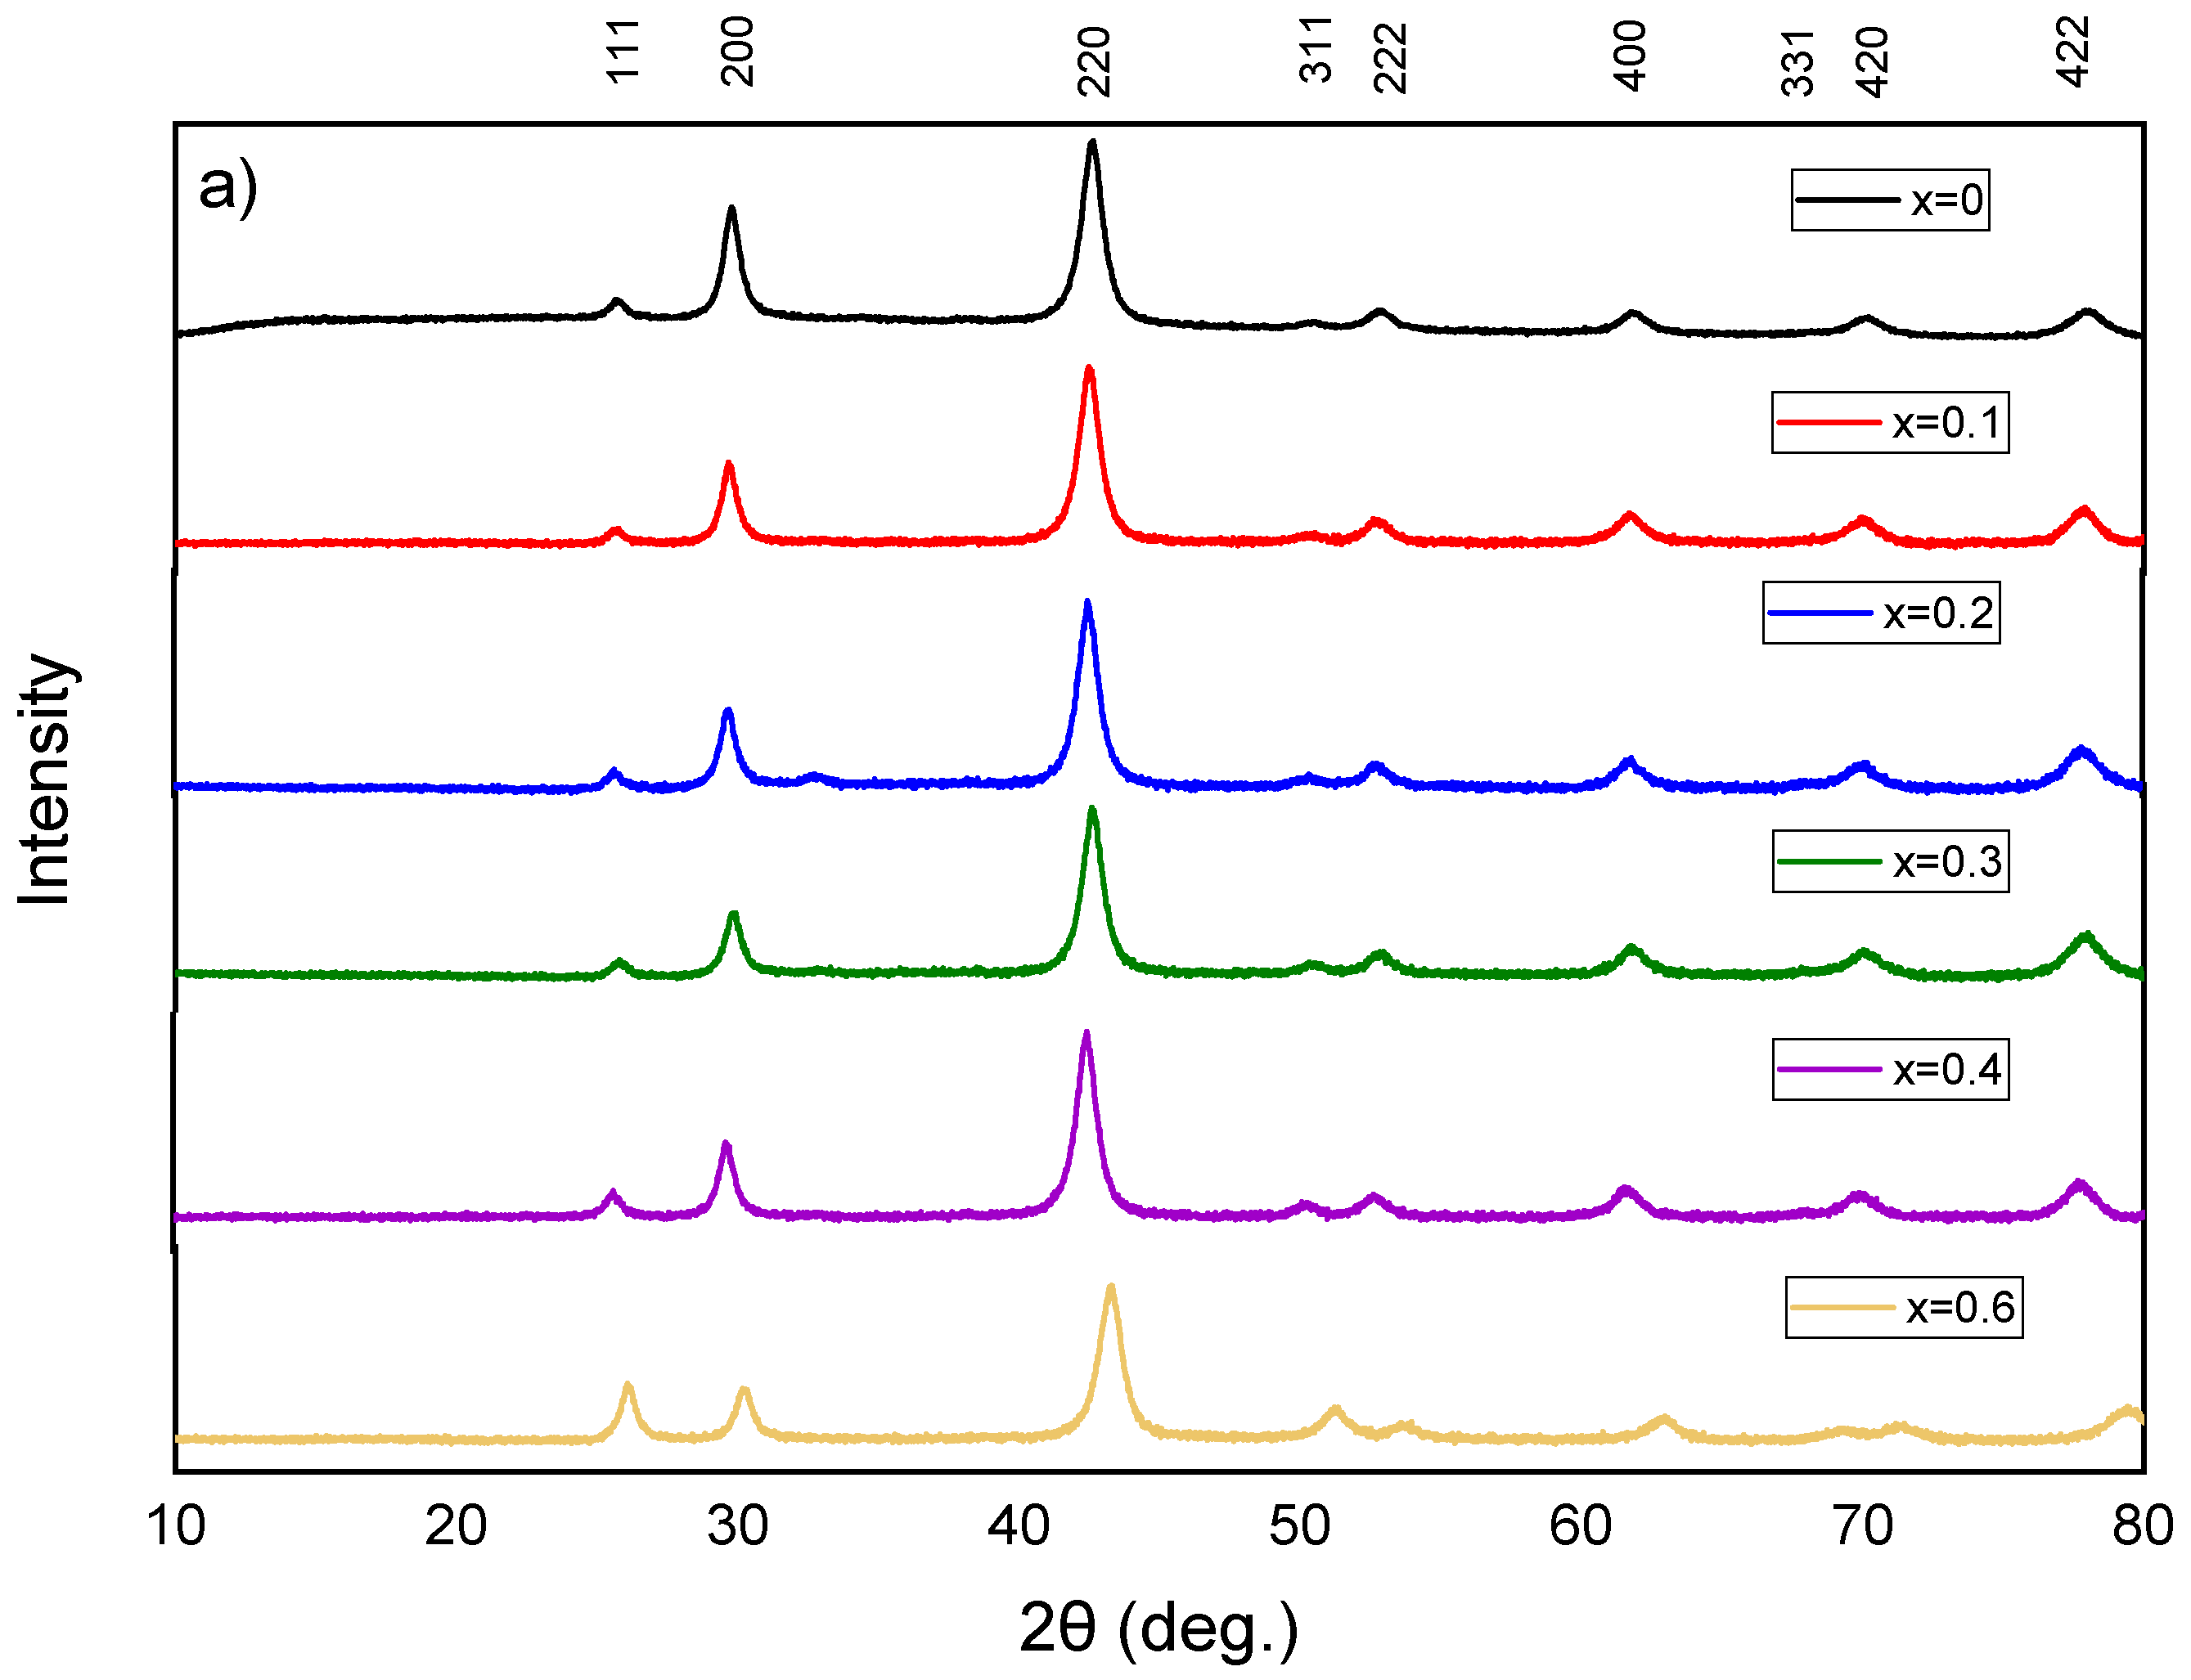
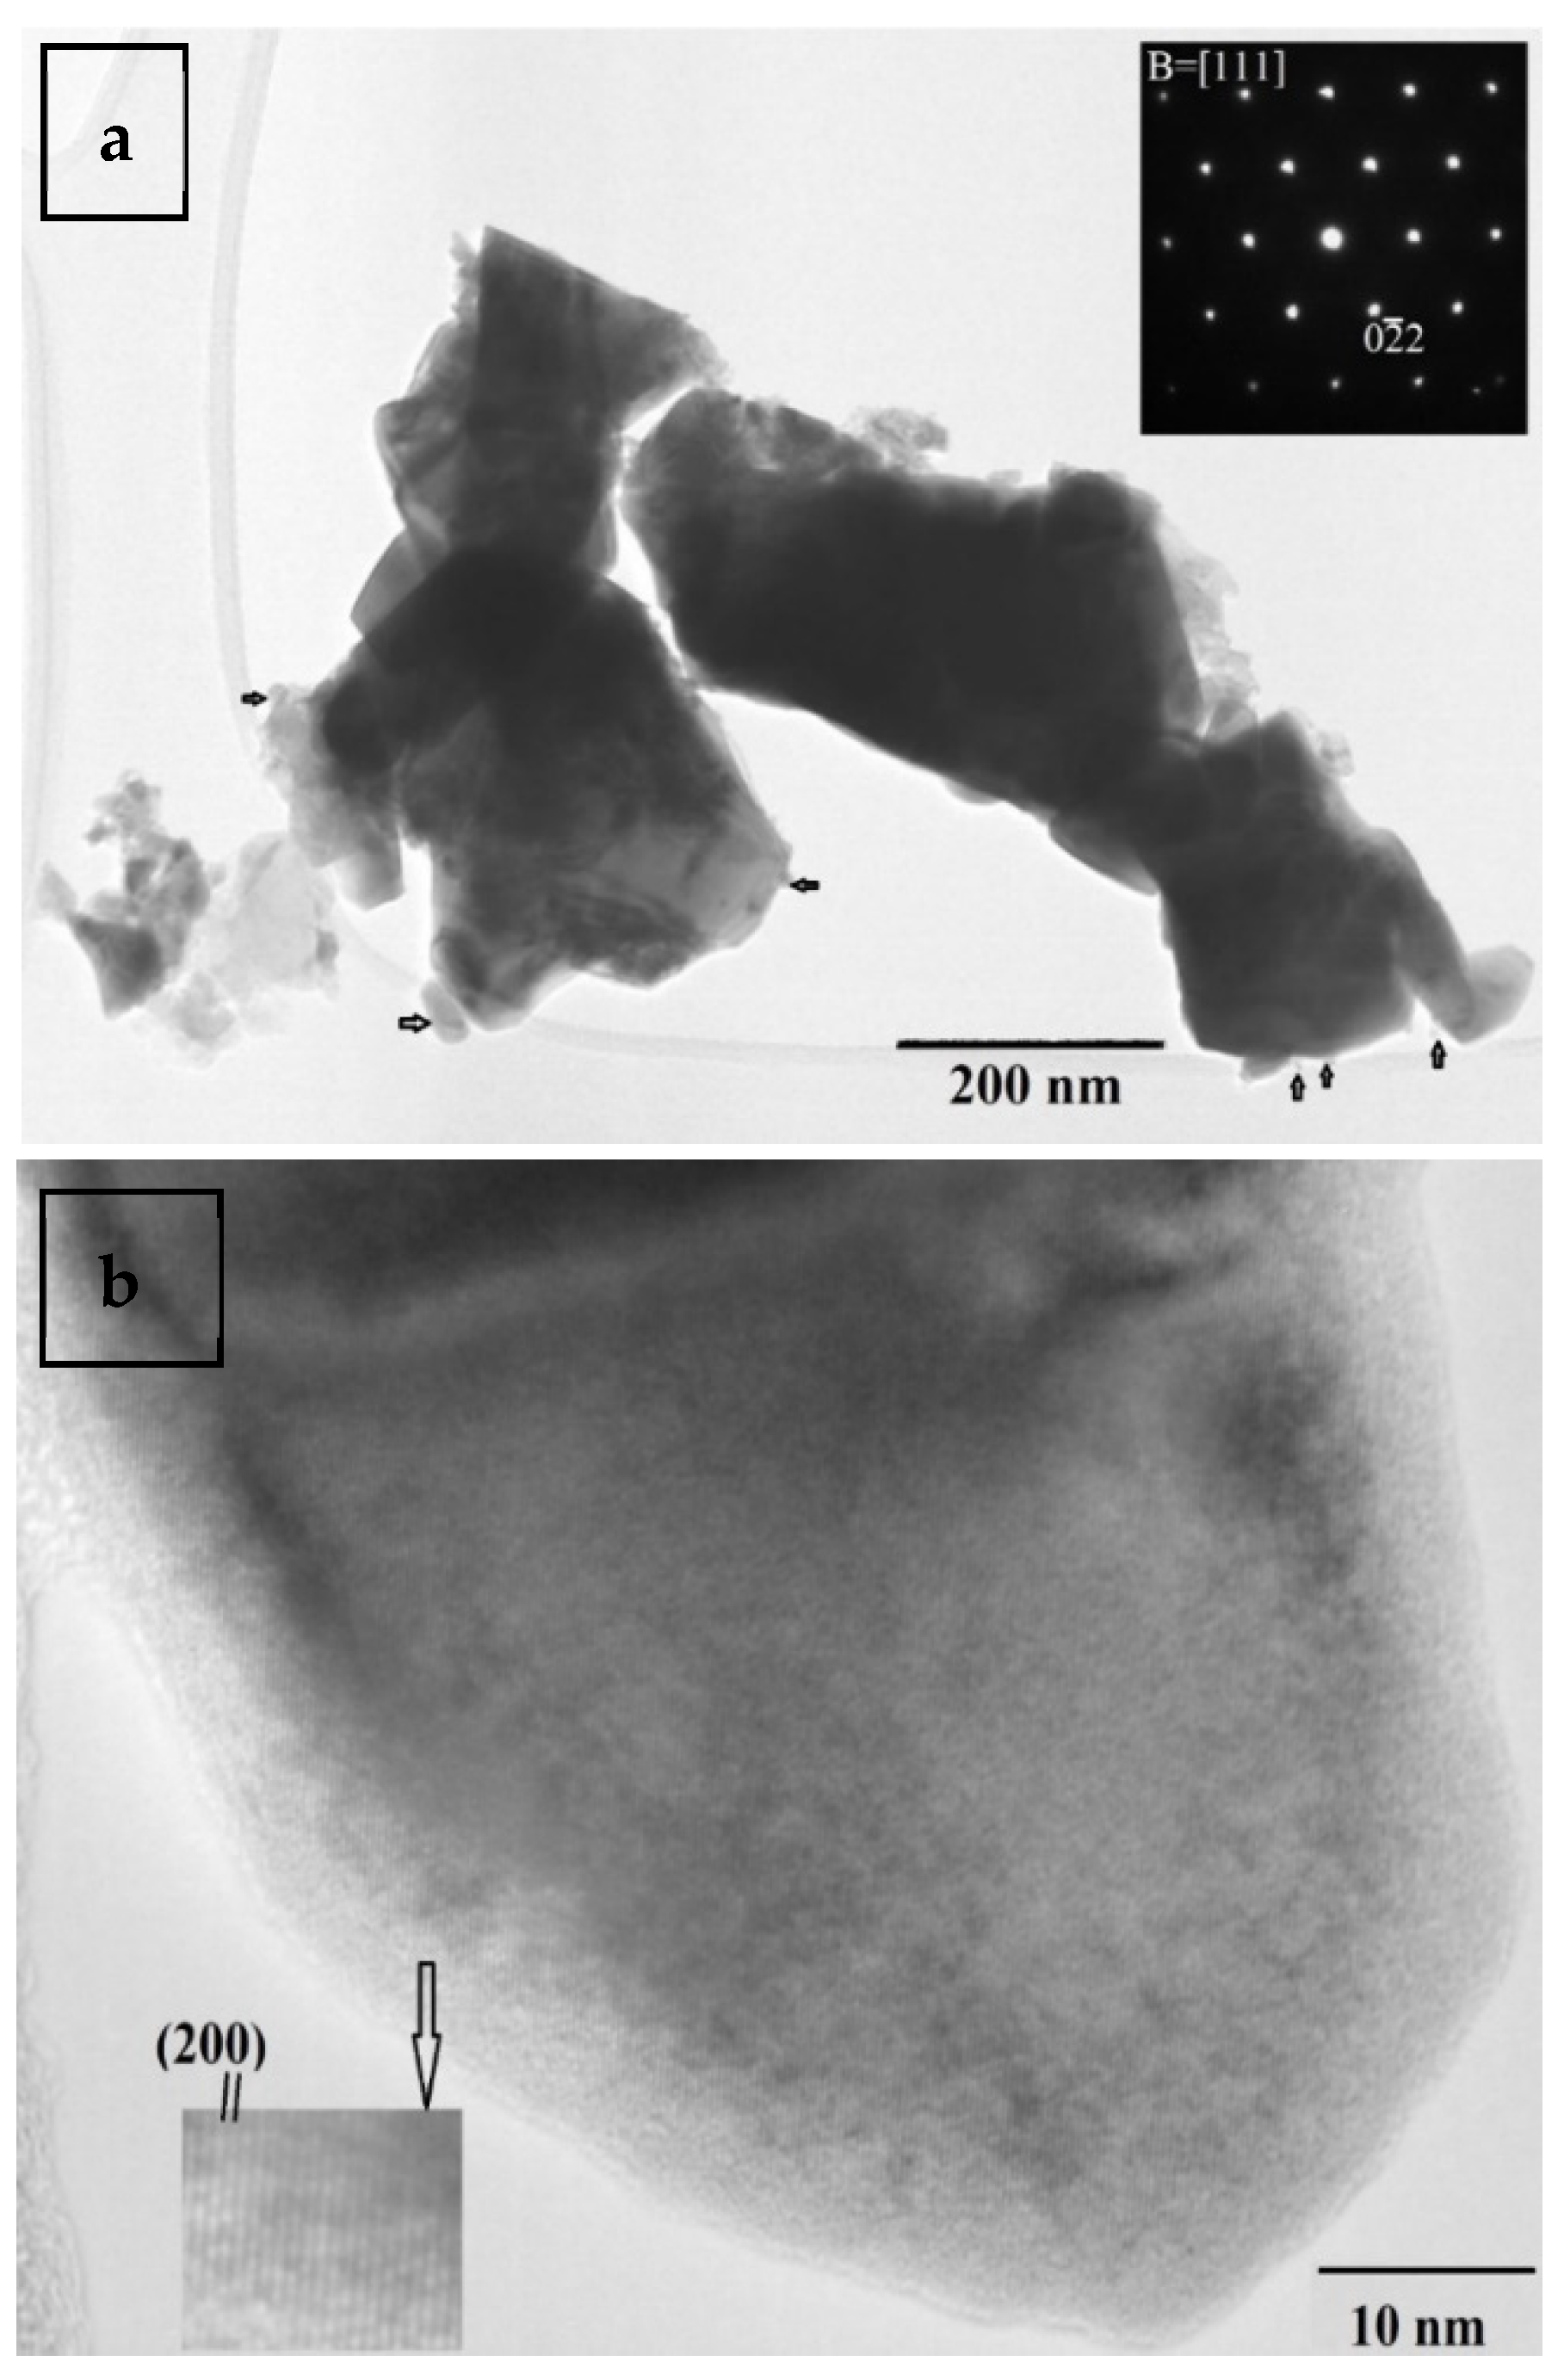
2.1.1. Structural Characterization

Figure 1a presents the powder X-ray diffraction patterns of the Hf0.6-xZrxTi0.4CoSb0.8Sn0.2 series after 6 h of milling. All diffraction peaks are matched with the cubic MgAgAs-type crystal structure (space group F 4 ¯ 3m), indicating the formation of the desired half-Heusler phases without any residual starting elements or other secondary phases presented. The XRD results after hot-pressing show that HH remains as the only phase in all prepared samples (Figure 1b). The position of peaks in XRD patterns does not severely change with increasing the level of Hf/Zr substitution. Despite the notable difference between the atomic number and mass of Hf and Zr, their atomic radii are almost identical due to the lanthanide contraction effect [24]. The lattice parameter as determined by XRD patterns, the geometrical densities (from mass and volume measurements) of the hot-pressed samples and relative densities based on the crystallographic densities are presented in Table 1. The substitution of Hf with Zr linearly decreases the geometrical density, as expected. As shown in Table 1, all hot-pressed samples exhibit a relative density higher than 94% of the crystallographic density.
SEM and EDS analysis were performed (Figure 2 and Table 2) to investigate the microscopic features in Hf0.6-xZrxTi0.4CoSb0.8Sn0.2 (x = 0, 0.1, 0.2, 0.3, 0.4, 0.5) materials. The slight loss of Hf and Sn can be explained by the behavior of these powders that stick on the vial’s and balls’ surface during milling, resulting in a small deviation from the desired alloy composition. As shown in Figure 2, several areas of each sample were selected for the EDS analysis. Some minor black and bright spots that are presented in back-scattered images revealed the same chemical composition as the grey matrix. Overall, back-scattered images and EDS results revealed homogeneous, stoichiometric and single-phase materials. Contrary to our results, structural investigations in analogous (Hf,Zr,Ti)CoSb0.8Sn0.2 solid solutions prepared by arc-melting proved that the samples underwent a dendritic intrinsic phase separation and up to three different HH phases can be identified [25]. Similarly, in a previous study of arc-melted (Ti,Zr)CoSb0.8Sn0.2 materials, a prominent phase-separation effect was noticed. According to N. S. Chauhan et al., Ti-rich phases were heterogeneously distributed within the Ti-deficient matrix in an arc-melted Ti0.5Zr0.5CoSb0.8Sn0.2 alloy [26]. A calculated thermodynamic phase-diagram of the (Hf1-x-yZrxTiy)NiSn system suggests that Ti-rich and Ti-poor grains in arc-melted materials are non-equilibrium states created during solidification and are then kinetically trapped at lower temperatures [27]. The mechanisms by which supersaturated solid solutions form by MA and rapid solidification processing (RSP) techniques like arc-melting, are different. Therefore, the level of solid solubility of various systems strongly depends on the synthesis technique. For instance, solid solutions can be easily obtained in the full composition range in the Cu-Fe, AlSb-InSb, and Cu-Co systems by MA but not by RSP [28].
Figure 3a shows a representative image of the morphology of the Hf0.4Zr0.2Ti0.4CoSb0.8Sn0.2 sample particles after hot-pressing. They are typically medium sized, about 150–200 nm on average, reaching up to 450 nm. Each one is single crystalline, as confirmed by the Selected Area Diffraction (SAD) pattern inset in Figure 3a, the latter viewed along the [111] zone axis. Measurements of the d spacings of the 220 reflections resulted in a mean lattice constant of aSAD = 0.604 nm, which is in very good agreement with the ‘theoretical’ lattice parameter of Hf0.4Zr0.2Ti0.4CoSb0.8Sn0.2. The latter has been calculated using Vegard’s law, taking into consideration the values of the three members, i.e., TiCoSb1-xSnx (a = 0.589 nm) HfCoSb1-xSnx (a = 0.604 nm) and ZrCoSb1-xSnx (a = 0.607 nm), resulting in atheor. = 0.596 nm, approximately [15]. This is also in agreement with the XRD results, where the lattice parameter of Hf0.4Zr0.2Ti0.4CoSb0.8Sn0.2 was calculated as αXRD = 0.601 nm.
A secondary morphology of the sample is in the form of smaller nanoparticles, some of which are illustrated in Figure 3b by arrows. These nanoparticles are crystalline and have sizes of 5–15 nm, although some may reach up to 60–70 nm. Figure 3b shows an HRTEM image of a crystalline nanoparticle, with a size of 61.7 nm. A thin band of a nearly amorphous structure is observed at its surface, probably due to ball milling. On the crystalline region, mainly (200) lattice fringes are dominant; experimental measurements of their separation provided d200 = 0.295 nm, resulting in a lattice constant of aHRTEM = 0.590 nm, close to the ‘theoretical’ one, as well as the XRD- and SAD-deduced experimental ones. The slightly lower value calculated in Figure 3b and in similar HRTEM images could be attributed to small fluctuations of the elemental content in such particles, especially when it comes to Sb percentage. Any effects of potential phase separation (higher Zr content) might be as well considered. This was confirmed by the EDS analysis results too, where the average stoichiometry of this particle deviated from the nominal Hf0.4Zr0.2Ti0.4CoSb0.8Sn0.2 one, having in particular about 5–8 at% deficiency in Zr and Co (see Table 3).

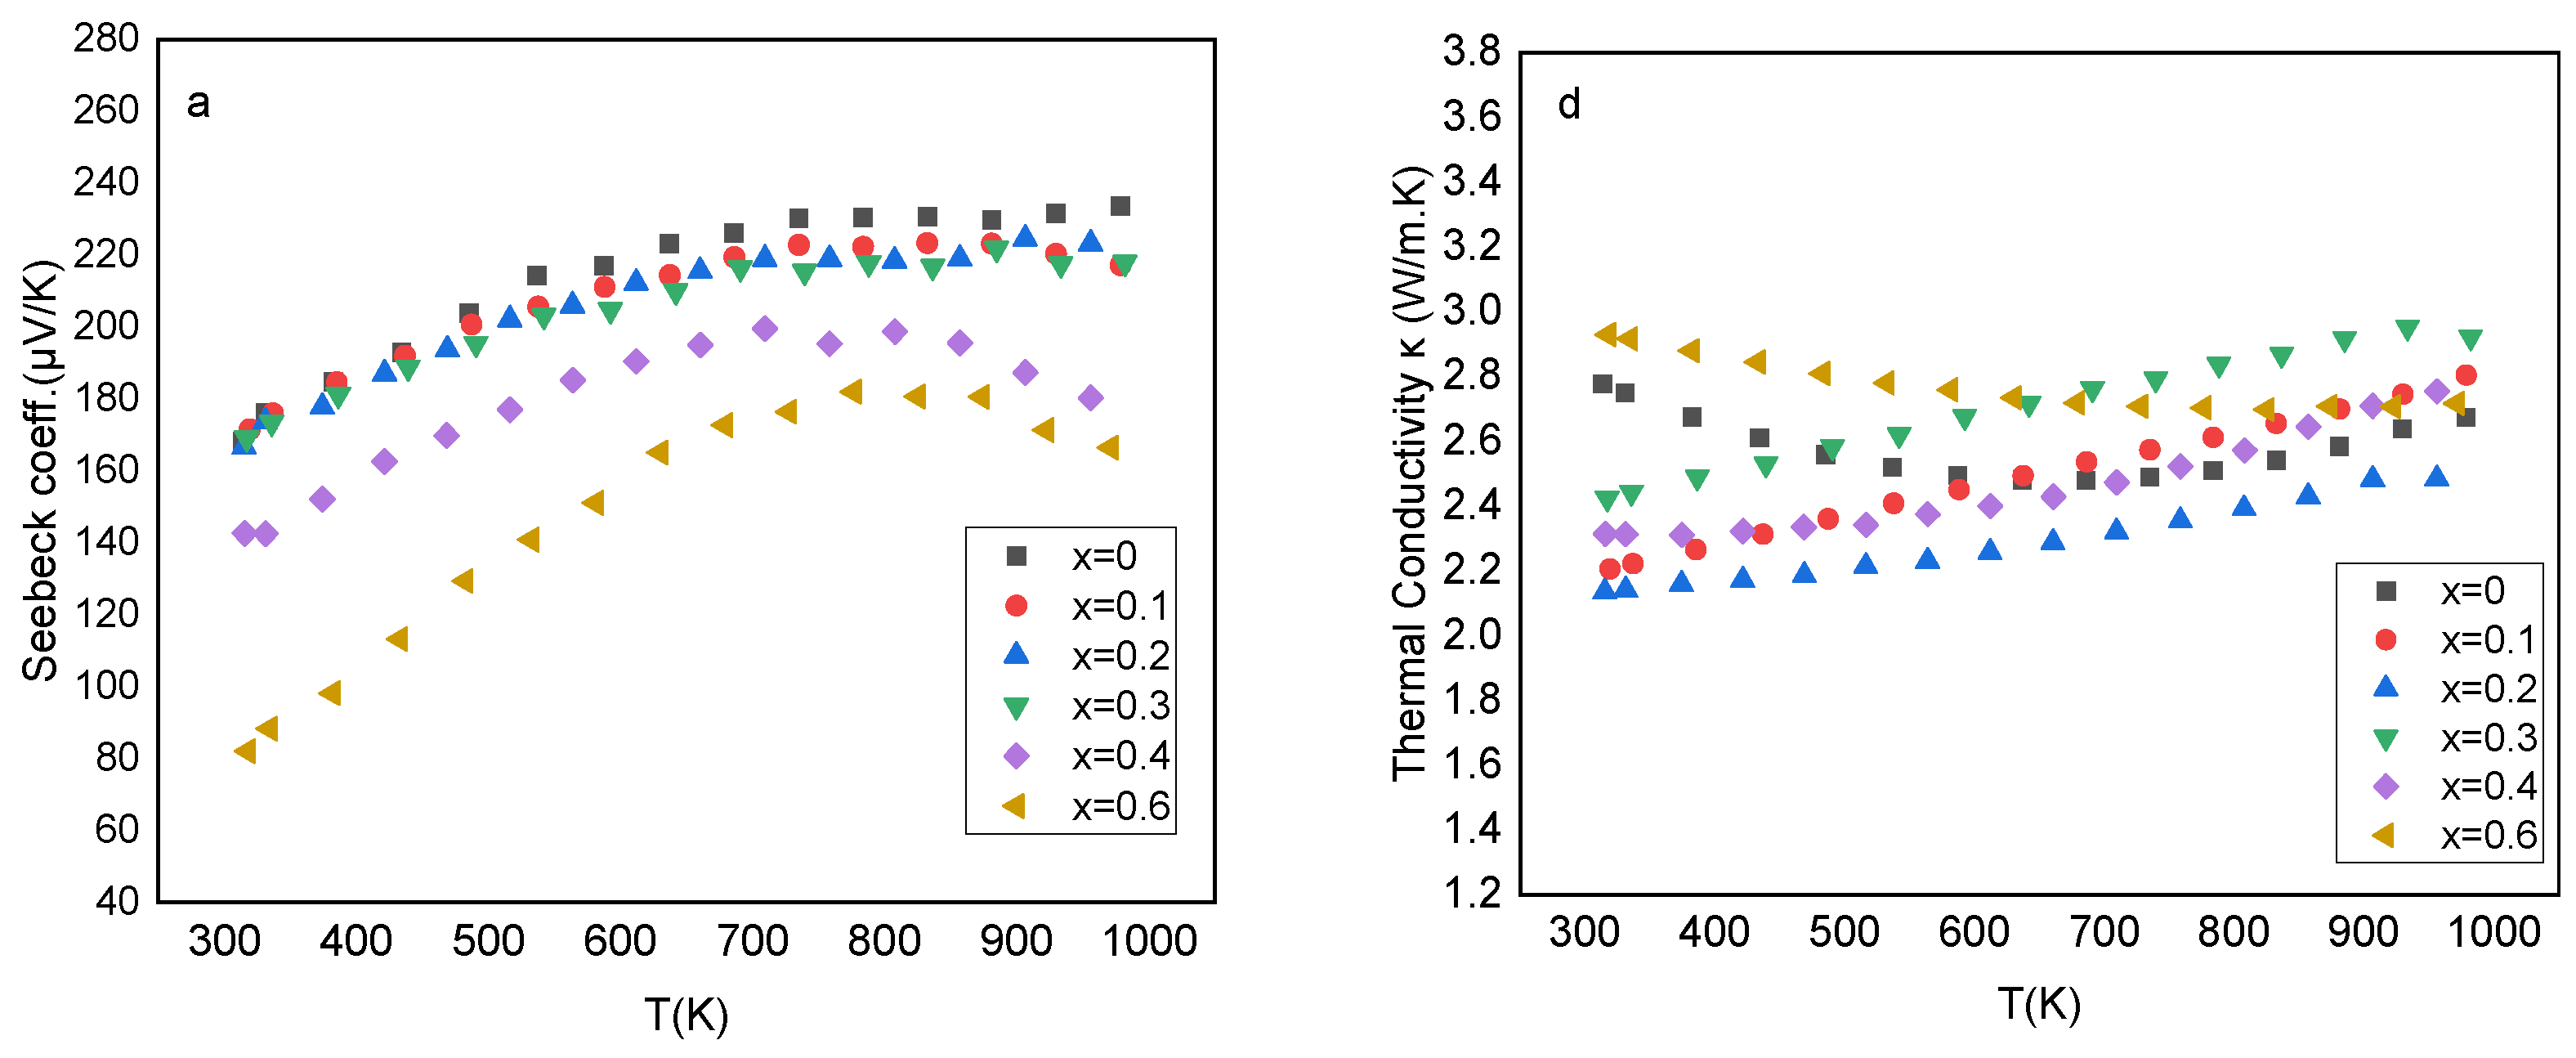
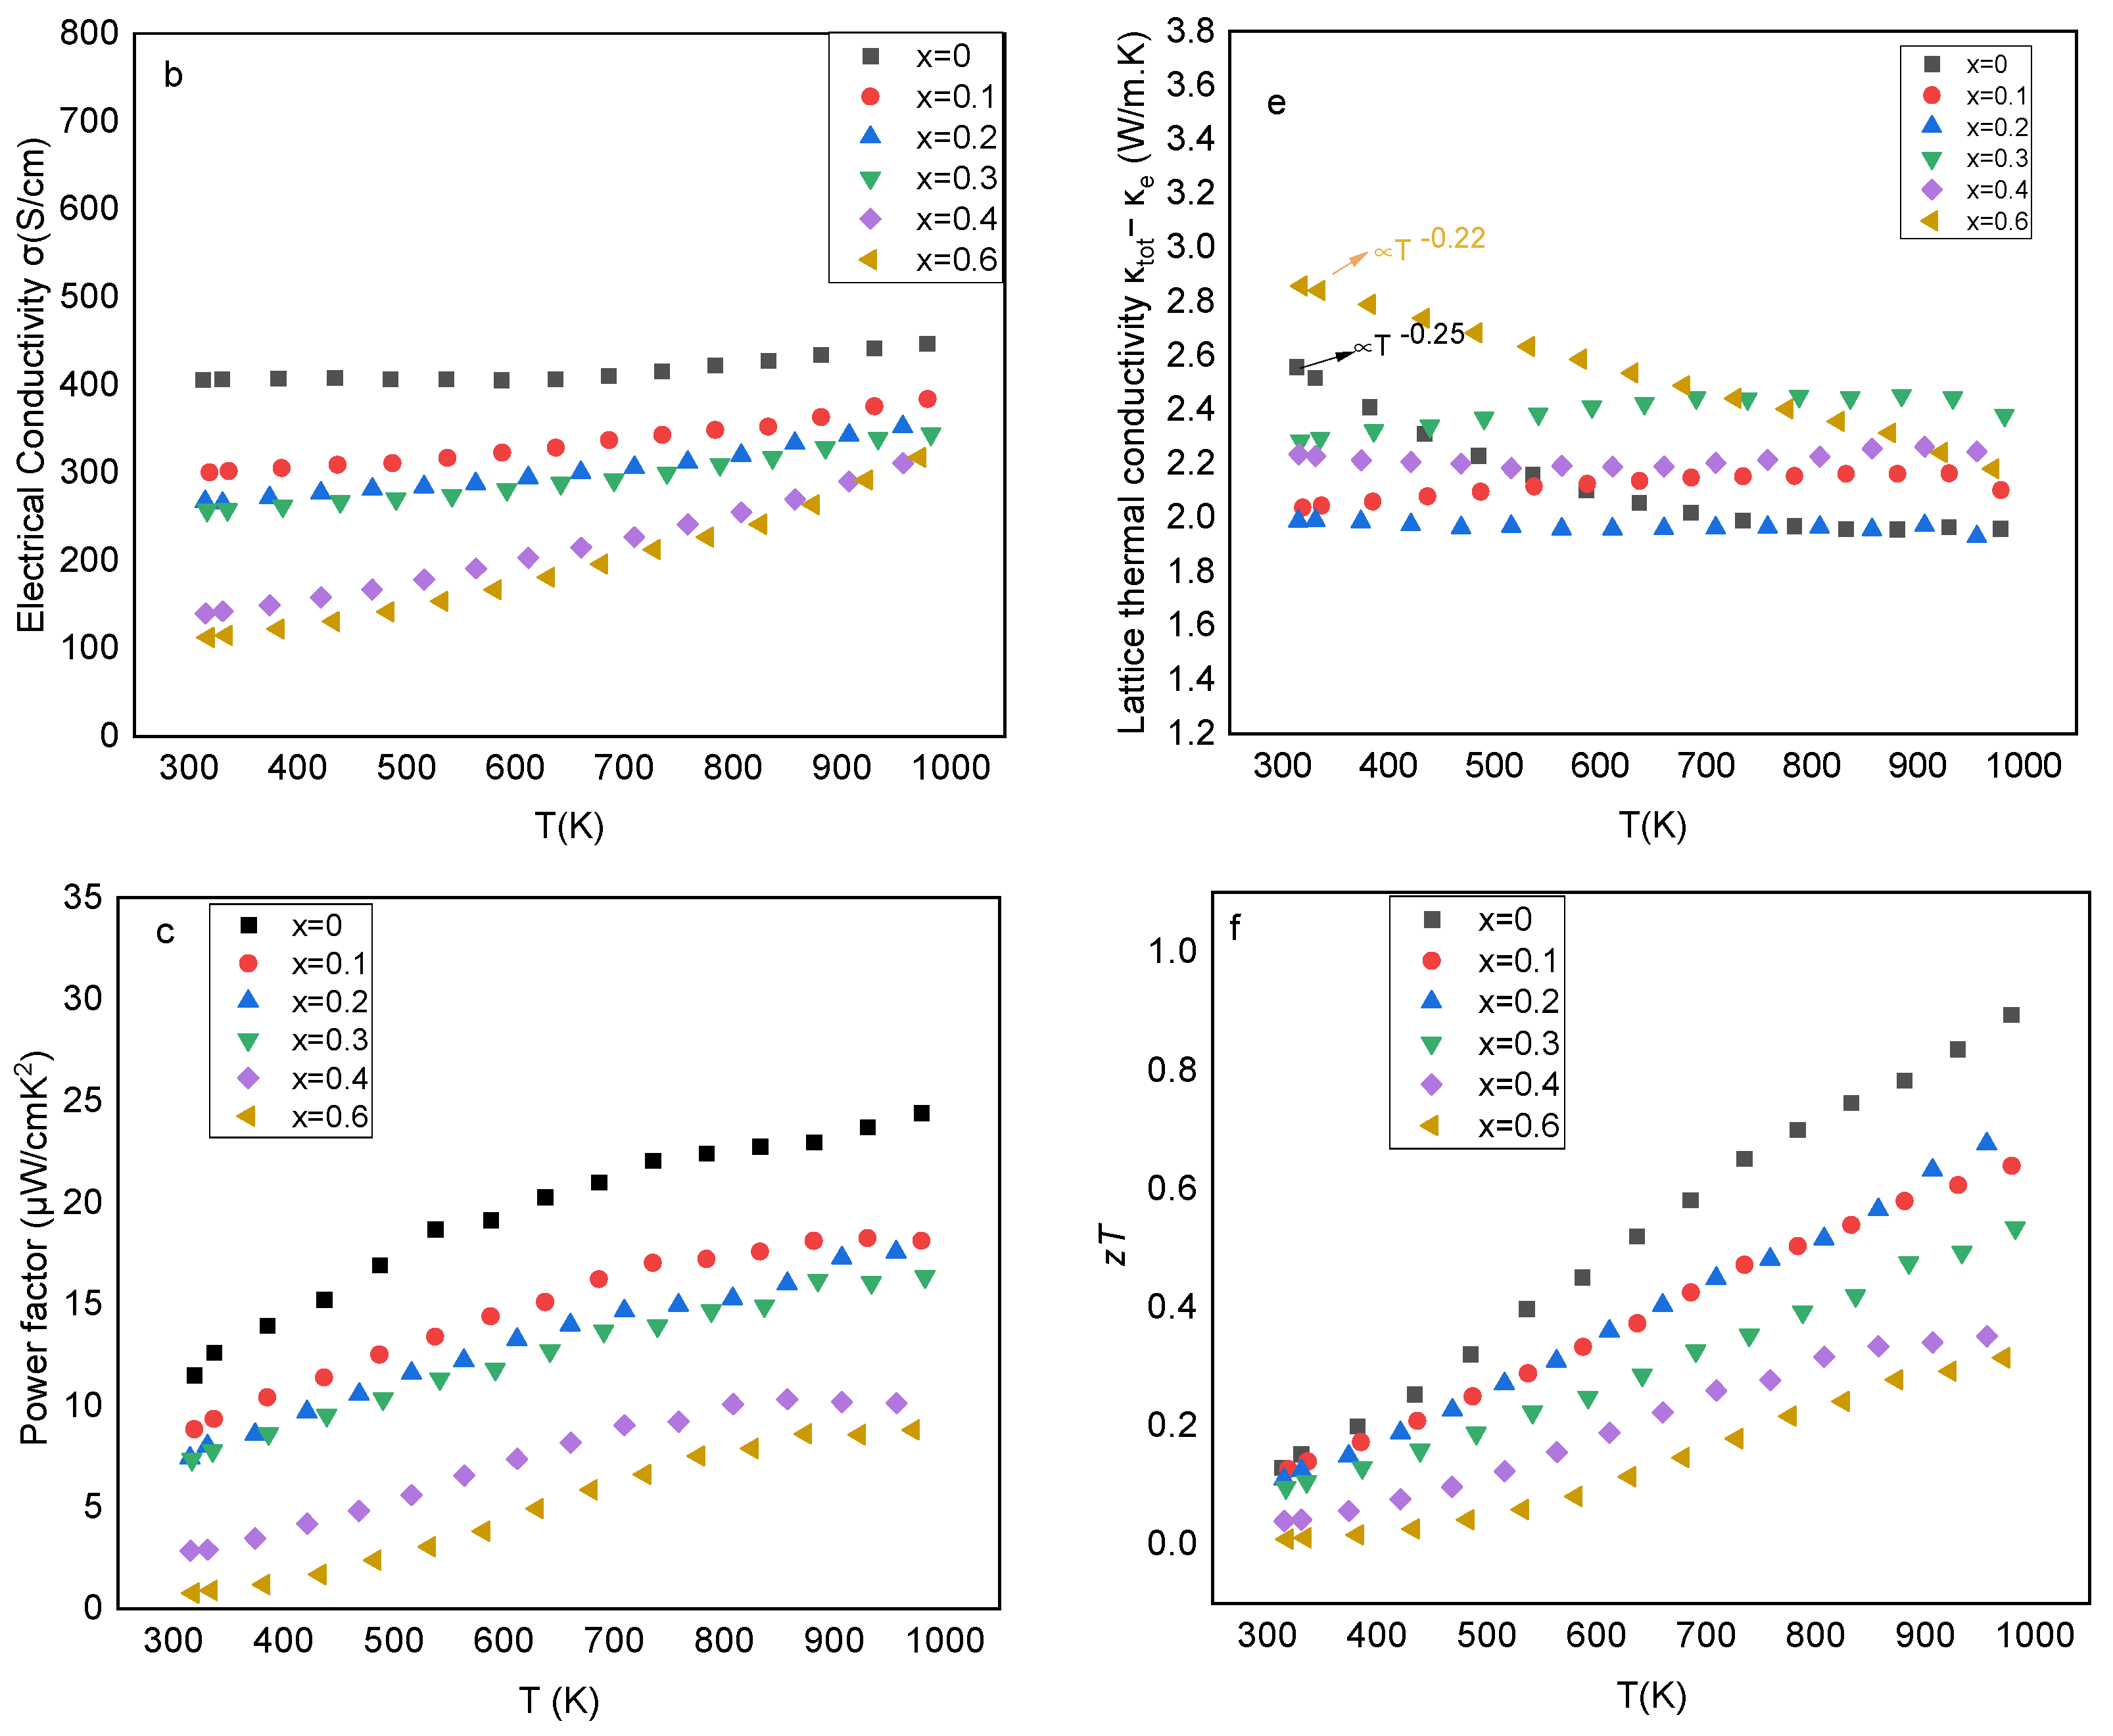
2.1.2. Thermoelectric Properties

The temperature-dependent Seebeck coefficient, electrical conductivity and power factor (S2σ) of the hot-pressed Hf0.6-xZrxTi0.4CoSb0.8Sn0.2 samples are presented in Figure 4a–c. All samples exhibit positive S values, confirming p-type materials. The highest value of 233 μV/K was observed for Hf0.6Ti0.4CoSb0.8Sn0.2 at 973 K and decreased with increasing Zr, indicating the increase of carrier concentration. Even though the substitution of Hf with Zr is isoelectronic, the carrier concentration and, therefore the S values, change. This effect can be explained by the alteration of the electronic structure, which thereafter alters the carriers’ concentration and their effective mass [16]. The change of carrier concentration and S upon isoelectronic replacement has been reported by several previous investigations [16,20,29]. For instance, hall measurements by Chauhan et al. in (Ti/Zr)Co(Sb,Sn) solid solutions support that isoelectronic substitution in HH solid solutions influence the carrier concentration and carrier mobility [29]. Moreover, the S values of sample with x = 0.6 present a stronger temperature dependence than samples with x < 0.6. Gandi et al. calculated that the energy bandgap of TiCoSb, HfCoSb and ZrCoSb is 1.05eV, 1.13 eV and 1.06 eV respectively [30]. The smaller bandgap of TiCoSb and ZrCoSb explains the slight drop of Seebeck coefficient in samples with a low Hf concentration (Hf ≤ 0.2) at T ≥ 750 K due to bipolar excitation. Electrical conductivity decreases when Zr(x) percentage rises, leading us to the conclusion that the substitution of Hf with Zr affects the carrier mobility. Moreover, samples with x ≤ 0.3 present relatively stable σ values, with increasing temperature while the σ values of samples with x ≥ 0.4 significantly increase with temperature. The aforementioned Seebeck coefficient does not intensively decrease with intrinsic excitation, suggesting the presence of an additional mechanism that influences the electrical conductivity [31]. This mechanism can be due to the enhanced grain boundary scattering that usually appears in materials with high nanocrystallinity, resulting in a thermally activated mobility. Ιn nanostructured materials, energy barriers that are known to form at the grain boundaries result in strong carrier scattering and restrict electronic conduction at low temperatures. When the temperature rises, charge carriers are thermally excited across the energy barriers and consequently the electrical conductivity increases [31]. This effect has been recently discussed in HfxTi1-xCoSb0.8Sn0.2 materials prepared by mechanical alloying, as well as in other thermoelectric systems, such as Mg3Sb2–Mg3Bi2 solid solution and NaPbmSbQm+2 (Q = S, Se, Te) [13,31,32,33]. Specifically, the substantial percentage of nanocrystallinity in HfxTi1-xCoSb0.8Sn0.2 was assessed by transmission electron microscopy experiments that proved the presence of primary particles in the size range of 350 nm and nanograins in the size range of ~12 nm [13]. The average particle size for this work’s sample with x = 0.2 was found to be a little bit lower, around 150–200 nm. The calculated power factors are shown in Figure 4c Hf0.6Ti0.4CoSb0.8Sn0.2 reached the highest PF ~24.5 μW/cmK2 at 973 K. Samples with x = 0.1–0.3 follow with PF values around 17 μW/cmK2.
The temperature dependence of total thermal conductivity (κ) and lattice thermal conductivity (κlattice) of Hf0.6-xZrxTi0.4CoSb0.8Sn0.2 samples are presented in Figure 4d,e, while the lattice thermal conductivity at room temperature as a function of Zr concentration (x) is presented in Figure 5a. At room temperature, samples with x = 0 and x = 0.6 present the highest thermal conductivity values (κ = 2.8 W/m·K and κ = 3.0 W/m·K respectively). On the other hand, samples with x = 0.1–0.4 present lower thermal conductivity at room temperature (in the range of 2.4–2.15 W/m·K) but then slightly increases with the rising temperature due to the increase in the electronic thermal conductivity (κe). The lowest thermal conductivity at high temperatures with a value of 2.48 W/m·K was recorded by Hf0.4Zr0.2Ti0.4CoSb0.8Sn0.2 at 960K.
To gain a better insight into how the replacement of Hf with Zr affects the heat transport in Hf0.6-xZrxTi0.4CoSb0.8Sn0.2 materials, the lattice thermal conductivity was estimated by subtracting the electronic contribution from total thermal conductivity (κ). The electronic thermal conductivity (κe) was calculated by the electrical conductivity σ and by using Wiedemann–Franz’s law κe = LσT. The Lorenz factor was calculated from Seebeck coefficient values: L = 1 . 5 + exp S 116 × 10 8 Κ 2 , as proposed by Kim et al. [34]. In addition, a simple exponential function, κlattice A · T N , was used to determine the exponent N in all temperature-dependent κlattice plots (Figure 4e). It is worth mentioning that the conventional Wiedemann–Franz’s law often leads to an overestimation of the lattice contribution, especially when it is applied for materials with a high nanocrystallinity and resistive grain-boundaries. The fundamental cause of this overestimation is mainly attributed to the conventional assumption of sample homogeneity, which treats electrons and phonons as independent channels of heat transport [35].
The lattice thermal conductivity of samples with 0.1 ≤ x ≤ 0.4 show a relatively stable/independent temperature behavior, while the κlattice of samples with x = 0 and 0.6 drops with temperature (N~−0.25). The lowest κlattice values (~1.95 W/m·K) were recorded for Hf0.6Ti0.4CoSb0.8Sn0.2 as expected, and Hf0.4Zr0.2Ti0.4CoSb0.8Sn0.2 at 970 K. In Figure 5a the κlattice at room temperature as a function of Zr (x) is compared with (Hf,Ti,Zr)CoSb0.8Sn0.2 compositions by E.Rausch et al. and Yan et al. [11,21]. The lattice thermal conductivity of the arc-melted Hf0.35Zr0.35Ti0.3CoSb0.8Sn0.2 by E. Rausch et al. is significantly higher than the κlattice of this work’s samples [11]. This can be attributed to the higher grain boundary density in this work’s nanostructured samples, as well as to the bigger atomic mass variation which results in stronger phonon scattering. The κlattice of the nanostructured Hf0.72Zr0.1Ti0.18CoSb0.8Sn0.2 and Hf0.45Zr0.45Ti0.1CoSb0.8Sn0.2 by Yan et al. is lower than that of Hf0.35Zr0.35Ti0.3CoSb0.8Sn0.2 by E. Rausch et al. due to the increased phonon-scattering at the grain boundaries in nanostructured materials [21]. However, our nanostructured samples recorded even lower κlatttice values, indicating enhanced mass and strain field variations in Hf0.6-xZrxTi0.4CoSb0.8Sn0.2 compositions. Published studies usually highlight that the Hf-Ti combination in half-Heusler compounds is expected to cause increased phonon scattering and lower κlattice than other combinations because of bigger difference in the size and mass of Ti and Hf atoms [36,37]. In this study, we show that similar lattice thermal conductivity values can be also achieved by Ti-Zr-Hf combination and this excellent result indicates that Hf0.4Zr0.2Ti0.4CoSb0.8Sn0.2 solid solution would be a good selection for further investigation regarding thermoelectric figure-of-merit.
In a theoretical analysis by Joshi et al., it was mentioned that in TiCoSb, ZrCoSb and HfCoSb materials, the maximum contribution to heat transfer comes from the acoustic branch of phonons and that the mixing of acoustic and optical mode phonons causes phonon–phonon scattering, which as a result reduces the lattice thermal conductivity of a compound [38]. Different atoms contribute in a different way in phonon DOS. Heavier atoms contribute to the low modes of frequencies while light atoms contribute to the higher ones [38]. It is also known that κlattice arises from several phonon scattering processes like grain boundary scattering, point defect scattering, scattering on dislocations, and Umklapp scattering processes [39]. In solid solutions, the point defect scattering originates from the mass and strain field fluctuations. Based on Slack’s [40] and Abeles’ [41] models, the disorder scattering parameter Γ describes the point defect scattering of phonons and it has two components: the scattering parameter due to mass fluctuations ΓM and the scattering parameter due to strain field fluctuations ΓS (Γ = ΓΜ + ΓS) [41]. In this case, the ΓS parameter was considered constant with changing the Hf/Zr ratio because of a high similarity between the atomic size of Hf and Zr [42]. The ΓM parameter (Figure 5b) was calculated based on the following equations [43]:
Γ Μ = i = 1 n c i M i ¯ M = 2 Γ Μ ι   i = 1 n c i
where the mass fluctuation parameter for the ith sublattice is:
Γ Μ i = k f k 1 M i k M i ¯ 2
The kth atom of the ith sublattice has mass M i k and fractional occupation f i k . The average mass of atoms on the ith sublattice is given by:
M i ¯ = k f i k M i k
The average atomic mass of the compound is:
M = = i = 1 n c i   M i ¯ i = 1 n c i
where, ci are the relative degeneracies of the respective sites. For instance, in TiCoSb c1 = c2 = c3 = 1.
In Figure 5b, the results from the ΓΜ parameter calculations are presented as a function of Zr concentration. ΓΜ significantly decreases as the Zr percentage rises. Specifically, the Hf-Ti combination, as well as the Hf-Ti-Zr combination with a low Zr percentage (x ≤ 0.2) present a ΓΜ around 0.13, which is expected to cause increased phonon scattering due to high atomic mass fluctuations. On the other hand, the Ti-Zr combination presents a decrease of approximately 85% in the ΓM parameter, suggesting lower scattering for phonons and therefore higher lattice thermal conductivity. Based on the calculated ΓM, the κlattice value at room temperature for Ti0.4Hf0.6CoSb0.8Sn0.2 (Figure 5a) is larger than expected. Interestingly, κlattice decreases when Zr is incorporated in the lattice and then remains almost unchanged for low Zr (x ≤ 0.2) concentration. This partially agrees with the calculated ΓM parameter that remains almost the same at low Zr percentages since it is more affected by the presence of the Hf-Ti combination and their higher mass difference. The higher κlattice of x = 0 indicates that this theoretical model cannot fully explain the κlattice results and that other factors may influence the κlattice behavior. For instance, the higher relatively density of x = 0 sample or a possible alteration of grain boundaries with Hf/Zr substitution could further explain the experimental values. At higher Zr concentration, ΓM parameter strongly decreases resulting in an increasing lattice thermal conductivity.
In Figure 4f the dimensionless thermoelectric figure-of-merit (zT) is presented as a function of temperature. The highest zT value equal to 0.9 was recorded for Hf0.6Ti0.4CoSb0.8Sn0.2 and the second highest zT equal to 0.68 was achieved for Hf0.4Zr0.2Ti0.4CoSb0.8Sn0.2 at 970 K and it is mainly attributed to its low lattice thermal conductivity.

2.2. Hf0.4Zr0.2Ti0.4CoSb1- ySny Solid Solution Series

The optimization of carrier concentration is a typical method for further improvement in a material’s thermoelectric performance. In this part, we investigate the adjustment of doping level by the partial substitution of Sb with Sn in Hf0.4Zr0.2Ti0.4CoSb1-ySny (y = 0.15, 0.17, 0.20, 0.23, 0.25) solid solution series.

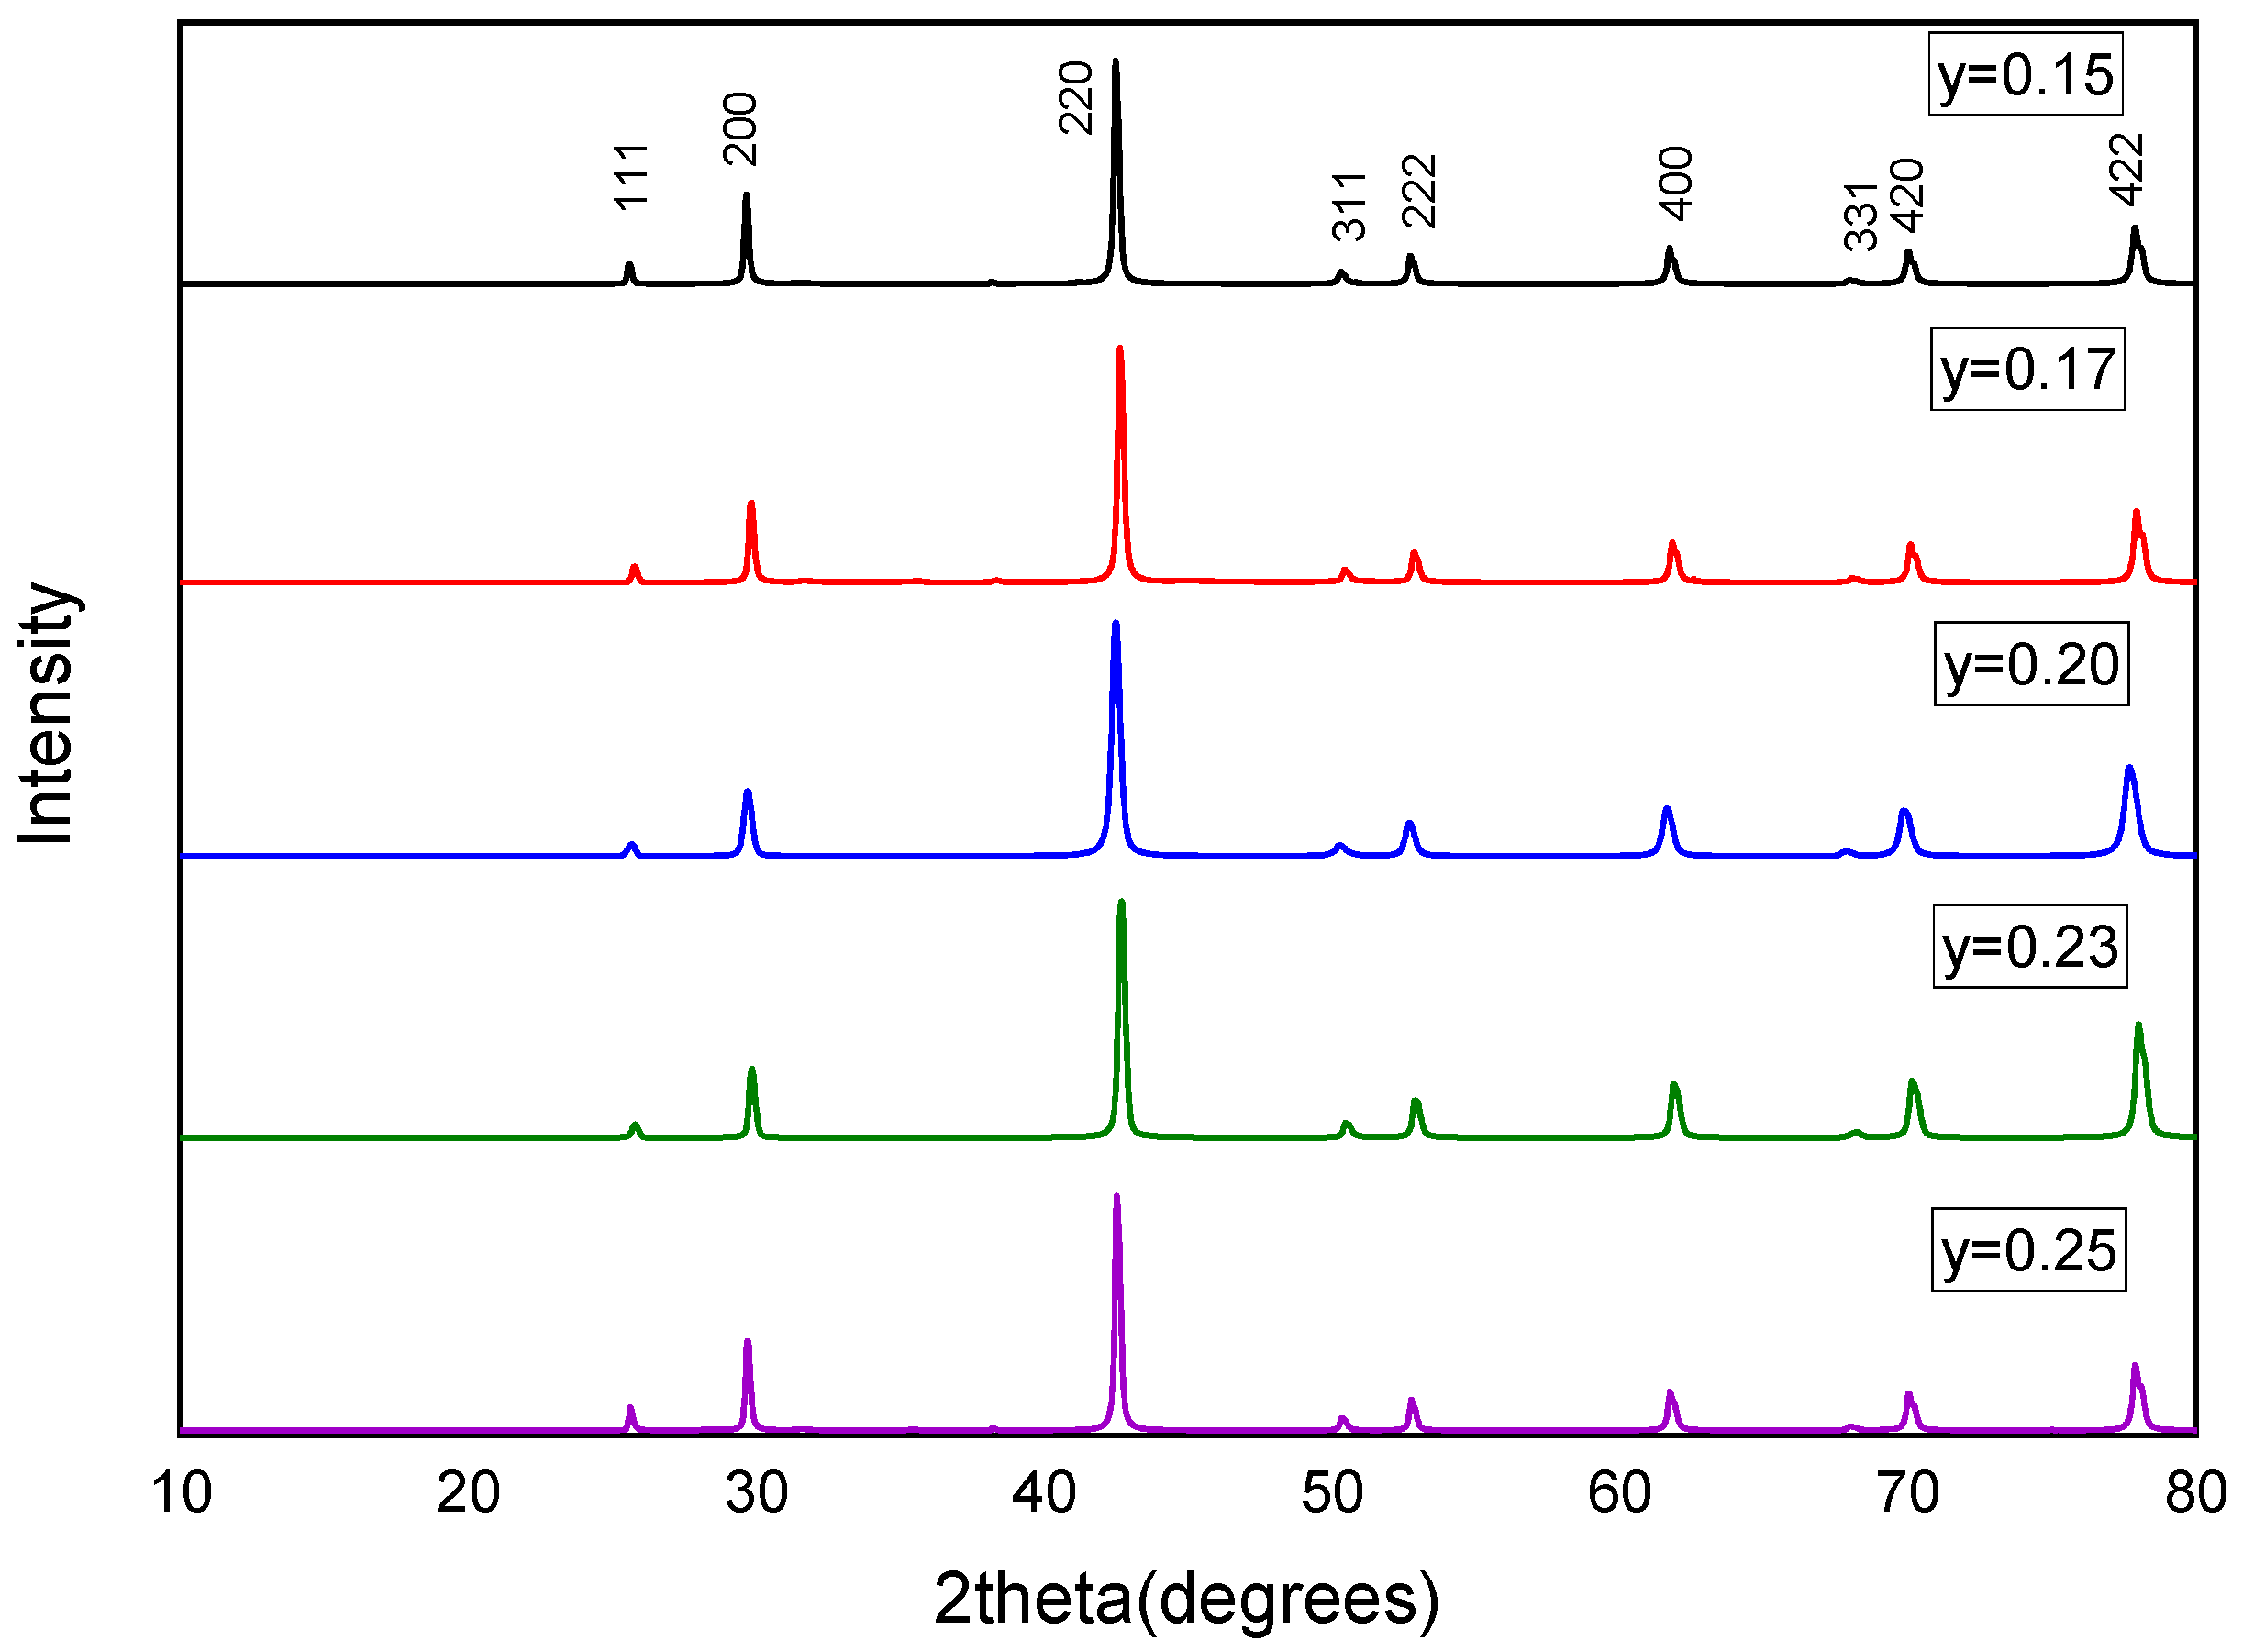
2.2.1. Structural Characterization

The XRD diffraction patterns of all prepared samples after hot-pressing revealed the desired HH phase (Figure 6). In Table 4, we present the lattice parameter, the geometrical densities of the hot-pressed samples and the relative densities based on the crystallographic densities. The change of Sb/Sn ratio does not significantly affect the geometrical density because of high similarity in the size and mass of the two elements. Back-scattered images and EDS results (Table 5) of samples with different Sb/Sn ratios showed homogeneous single-phase materials. Considering that there is an overlap between Sb and Sn in the EDS spectra and that the relative error of EDS results is approximately 5%, the samples can be considered as nearly stoichiometric and single phase. In contrast to the MA method, E. Rauch et al. reported that in an investigation of an analogous arc-melted system (Ti0.3Zr0.35Hf0.35CoSb1-xSnx), all samples underwent an intrinsic phase separation and inclusions of additional binary phases on a micrometer scale appeared in all samples with an Sn-substitution level greater than 20% [11].

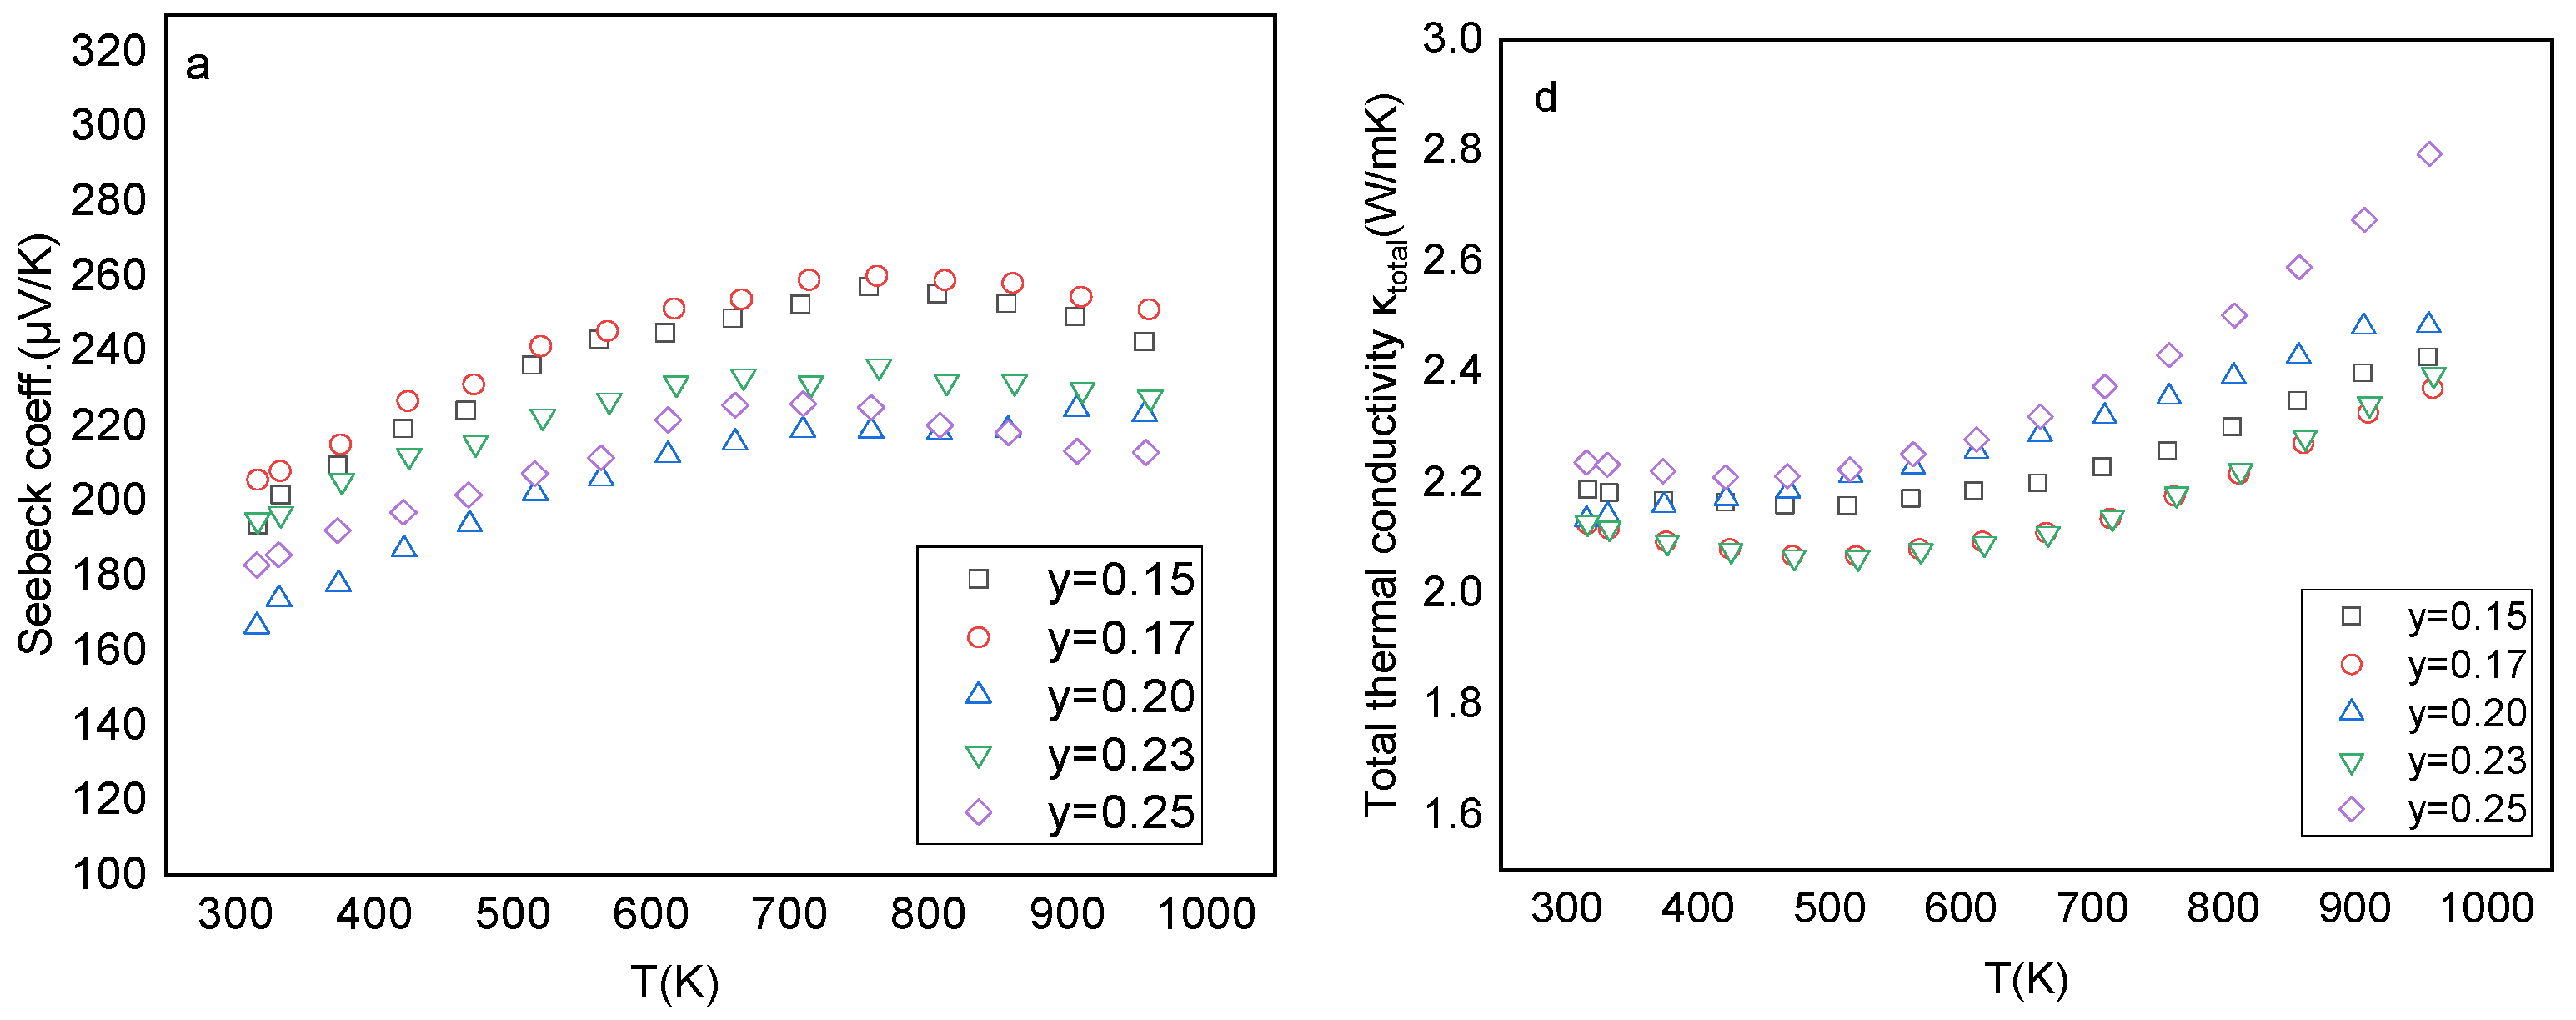
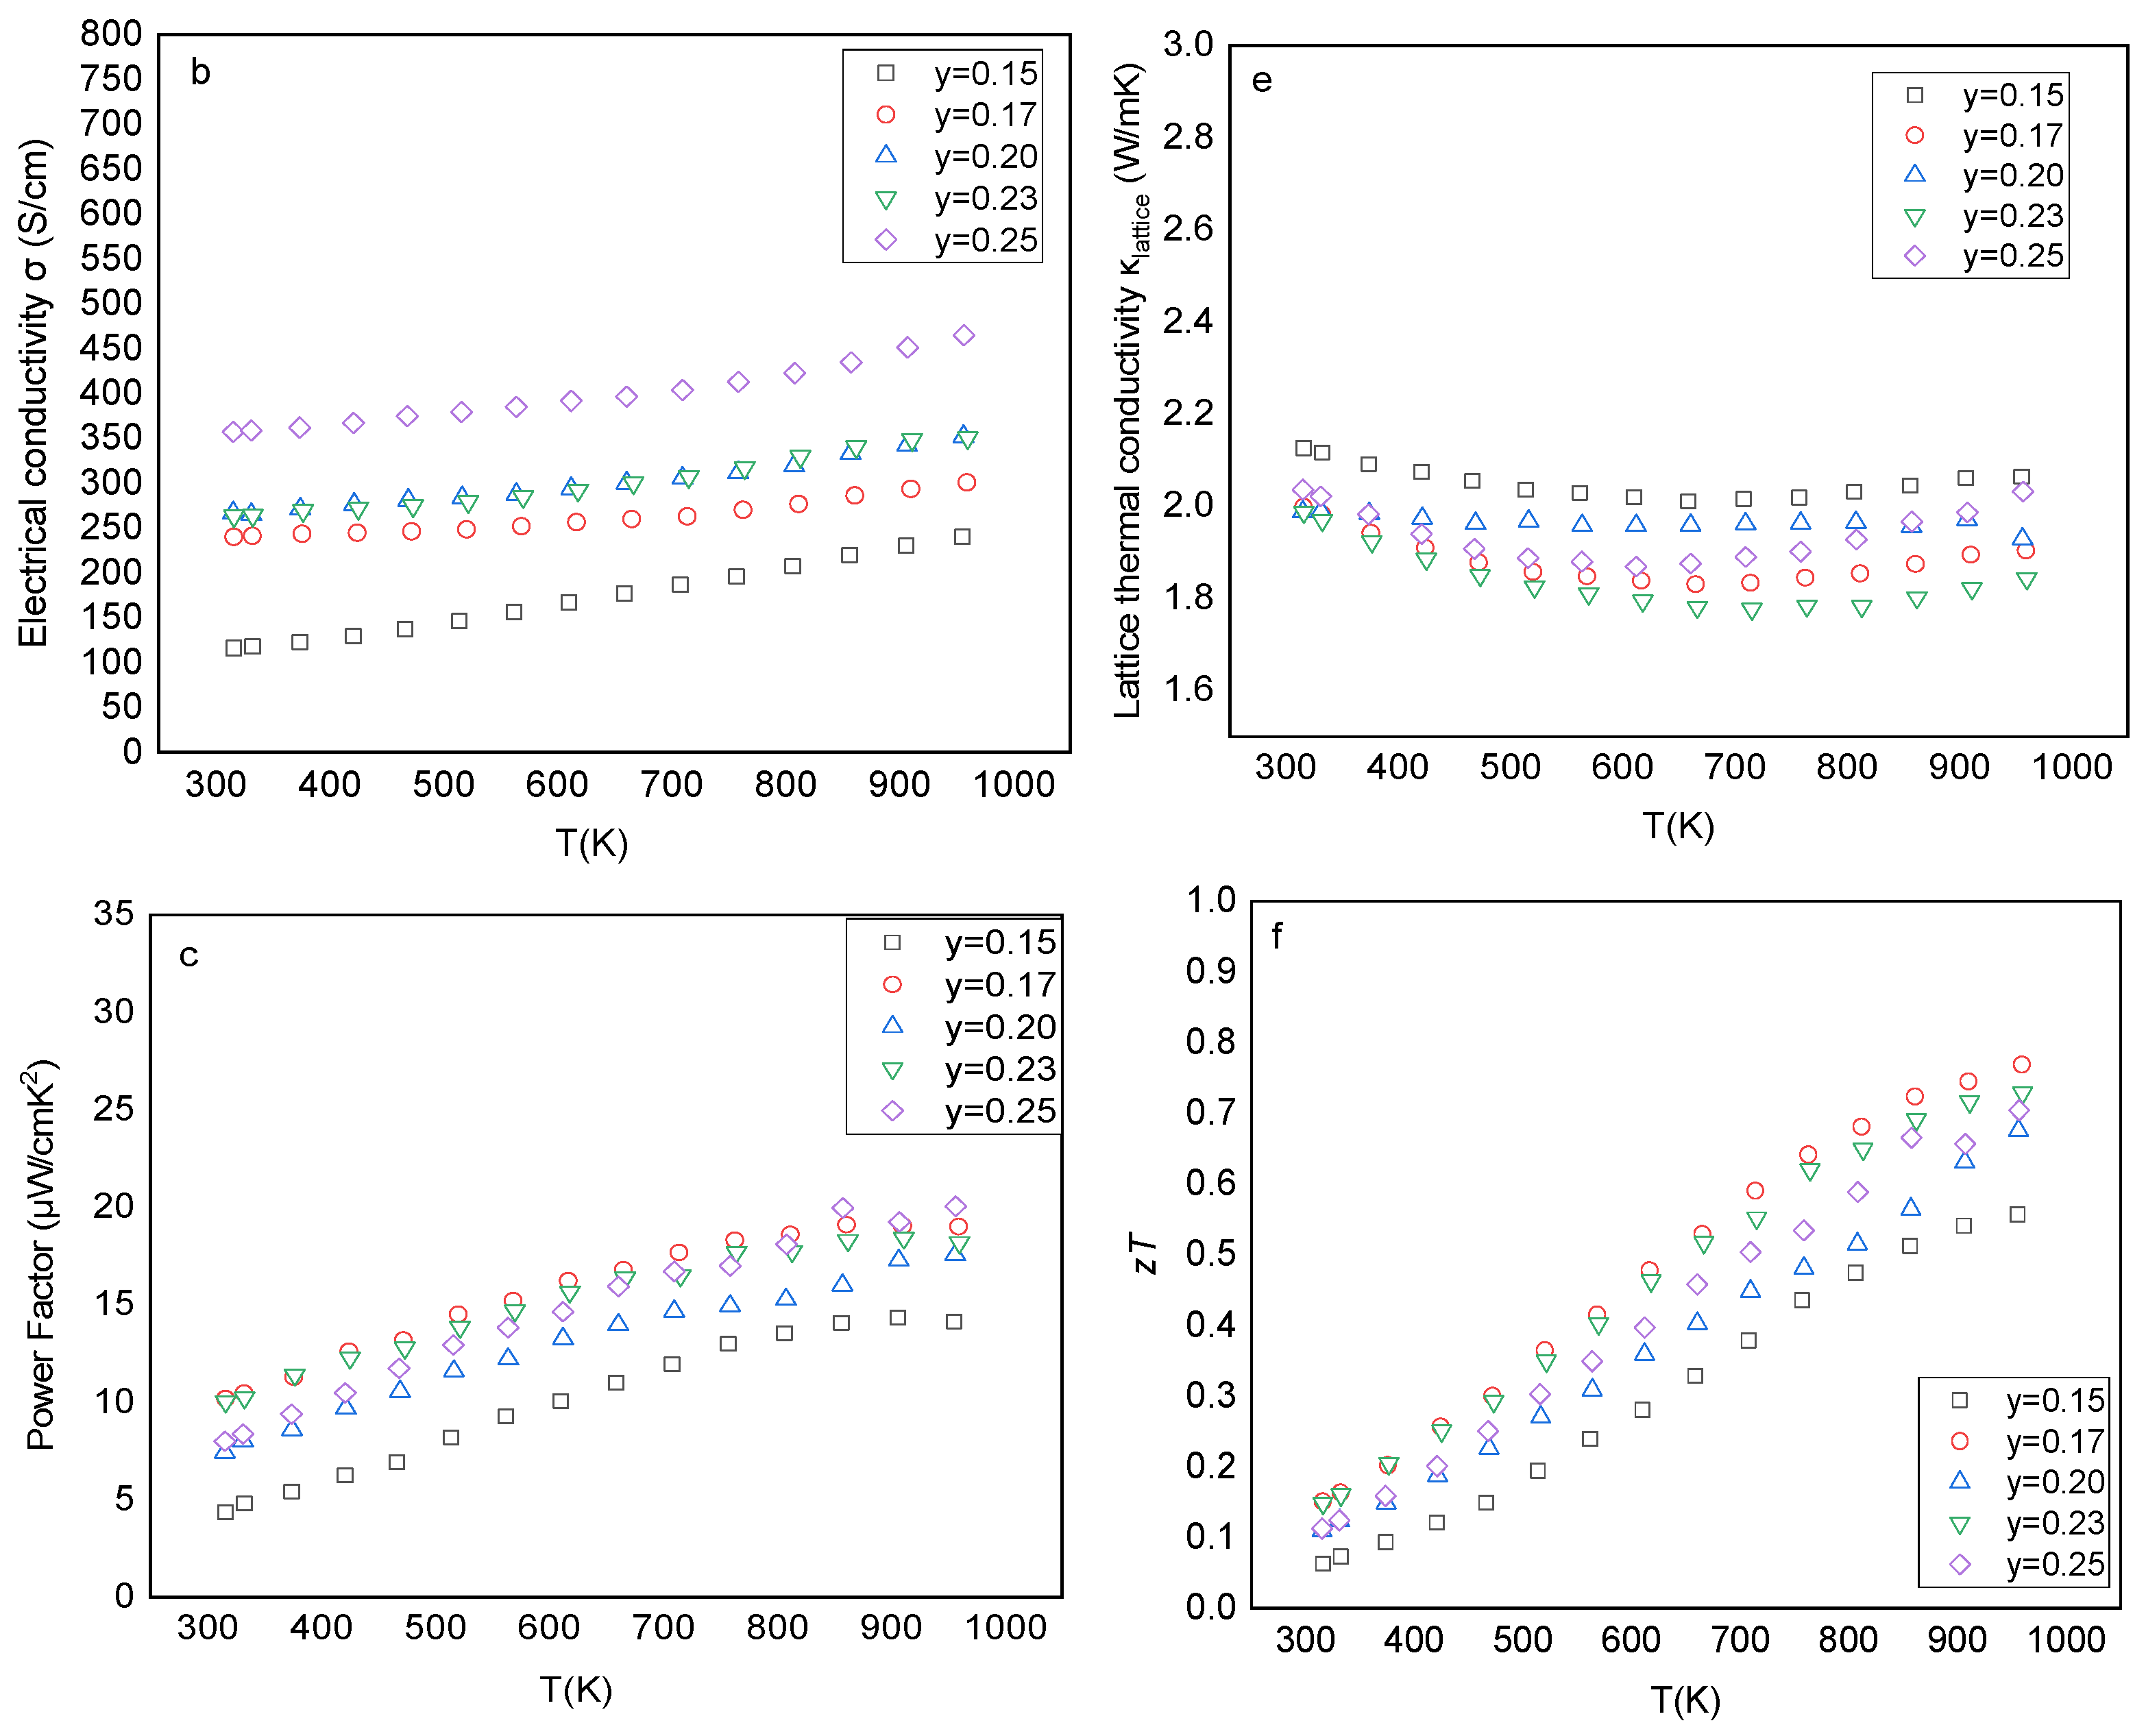
2.2.2. Thermoelectric Properties

In Figure 7a–c the Seebeck coefficient and electrical conductivity data, along with the calculated power factors, are presented. Seebeck coefficient (Figure 7a) increases with increasing temperature, reaches a maximum value at around 750 K and then starts to decrease suggesting the onset of bipolar excitation. The Sb substitution with Sn in Hf0.4Zr0.2Ti0.4CoSb1-ySny solid solutions, introduces holes into the system, and thus the carrier concentration increases. Consequently, samples with y = 0.15 and y = 0.17 present the highest S values ~257 μV/K at 759 K, indicating lower carrier concentration as expected. Furthermore, samples with y = 0.17 and 0.15 present almost similar Seebeck coefficient values, suggesting similar charge carrier concentrations but different carrier mobilities according to electrical conductivity measurements. Additionally, samples with y = 0.23 and y = 0.25 present a higher S at room temperature than y = 0.2. This could be attributed to Sn loss during milling, resulting in a deviation from the nominal composition and therefore to lower charge carrier concentration. At high temperatures, Hf0.4Zr0.2Ti0.4CoSb0.75Sn0.25 presented the lowest S~208 μV/K, while Hf0.4Zr0.2Ti0.4CoSb0.77Sn0.23 and Hf0.4Zr0.2Ti0.4CoSb0.8Sn0.2 remained a little bit higher (S~225 μV/K). Figure 7b demonstrates that the electrical conductivity increases with increasing Sn content. Despite the different doping level of samples with y = 0.20 and 0.23, their σ values are almost identical at all temperatures, indicating a higher carrier mobility in the Hf0.4Zr0.2Ti0.4CoSb0.8Sn0.2 sample. Electrical conductivity rises with increasing temperature in all samples, revealing again the presence of a thermally activated carrier mobility that is resulted by the enhanced grain boundary scattering. The calculated Power factors (PF = S2σ) are presented in Figure 7c. Despite the low Seebeck coefficient, the high electrical conductivity of Hf0.4Zr0.2Ti0.4CoSb0.75Sn0.25 contributed to achieving the highest PF = 20 μW/K2cm at 980 K. This result corresponds to a 16% improvement in PF comparative to Hf0.4Zr0.2Ti0.4CoSb0.8Sn0.2, which was our starting material.
The total and lattice thermal conductivity plots of the investigated compounds are displayed in Figure 7d,e. At room temperature, the thermal conductivity of samples with y = 0, 17, 0.20, 0.23 present lower κ values (~2.13 W/mK) than that of y = 0.15 and 0.25. However, all samples exhibit relatively low thermal conductivity values at room temperature in the range of 2.23–2.12 W/mK. At temperatures above 500 K, κtot gradually increases and reaches the highest value of 2.80 W/mK for Hf0.4Zr0.2Ti0.4CoSb0.75Sn0.25. To further understand the influence of substitution level, the lattice thermal conductivity was again calculated (Section 2.1.2). The enhanced phonon scattering with increasing temperature lowers the heat flux and results in reduced lattice thermal conductivity. However, the onset of bipolar diffusion at 700 K results in a slight increase of lattice thermal conductivity for almost all samples. The lowest κlattice = 1.85 W/mK was recorded by Hf0.4Zr0.2Ti0.4CoSb0.77Sn0.23 at 960 K.
The dimensionless figure of merit zT is presented in Figure 7f. The results reveal that the best thermoelectric performance is obtained for Hf0.4Zr0.2Ti0.4CoSb0.83Sn0.17 composition. The mechanically alloyed compounds with the optimal Hf/Zr/Ti and Sn/Sb ratios led to a high zT of 0.77 at 960 K, a value that corresponds to 15% improvement with respect to that of Hf0.4Zr0.2Ti0.4CoSb0.8Sn0.2. It has been found that the substitution level of 17% Sn for Sb is the most effective in Hf0.4Zr0.2Ti0.4CoSb1-ySny compounds were prepared by mechanical alloying.

3. Materials and Methods

3.1. Synthesis and Consolidation

High purity elemental Hf (99.6% Alfa Johnson Matthey GmbH, Germany), Zr (99% US Research Nanomaterials Inc, USA), Ti (99.9% Alfa Johnson Matthey GmbH, Germany), Co (99.8% Alfa Johnson Matthey GmbH, Germany), Sb (99.9% Alfa Johnson Matthey GmbH, Germany) and Sn (99.85% Alfa Johnson Matthey GmbH, Germany) were weighted following the nominal compositions, presented in Table 1 and Table 4, in a glovebox under Ar atmosphere and were loaded to a tungsten carbide vial along with 10 mm balls. The milling process lasted 6 h and was carried out in a planetary mill at 450 rpm. The ball to material ratio was 15:1. The as-milled powders were loaded in graphite dies and were hot-pressed into high density pellets under the same compaction conditions, at temperatures 1160–1180 K for 1 h under a pressure of 50 MPa.

3.2. Structure and Morphology

The crystal structure was verified by powder X-ray diffraction (XRD) using Rigaku Miniflex diffractometer with Cu-Ka source (λ = 0.15405 nm). The scan speed was set at 4°/min and the scan step at 0.01°. The lattice parameter was estimated using the EXPO2014 software. The microstructure and the chemical composition of the samples were studied using scanning electron microscopy (SEM; JEOL JSM-6610LV) and energy dispersive X-ray spectroscopy (EDS; Bruker. nano 129 eV XFLASH Detector 5010) respectively. The chemical composition of the half-Heusler alloys was determined by choosing several areas of the same sample and averaging the composition. Samples suitable for TEM analysis were prepared by evenly dispersing crushed material on ultrathin lacey C-films supported on 3.05 mm Cu grids. A JEOL 2011 microscope, operating at an accelerating voltage of 200 kV and with a point resolution of 0.25 nm was employed for transmission electron microscopy (TEM, HRTEM) experiments. Elemental analysis was performed in an EDS detector (EDAX Apollo XLT TEM-SDD) with a resolution of 135 eV (Mn K line).

3.3. Thermoelectric Measurements

The thermal conductivity (κ = D·Cp·ρ) was calculated from diffusivity (D) and Specific heat (Cp) measurements by a Netzsch LFA 457 and the geometrical density (ρ) of the samples. A standard pyroceram 9606 sample was used as a reference for calculations of the specific heat capacity. The electrical conductivity and Seebeck coefficient were measured by a standard four-probe method (ZEM-3, Ulvac-Riko, Japan) in an He atmosphere to ensure homogeneous distribution of heat inside the furnace and prevent oxidation at elevated temperatures. All measurements were carried out in the temperature range between 300 K and 980 K.

4. Conclusions

In this work, Hf0.6-xZrxTi0.4CoSb0.8Sn0.2 solid solutions were prepared by MA in an attempt to reduce Hf concentration and material’s cost. The isoelectronic substitution of Hf with Zr resulted in lower power factors and zTs, as expected. However, the decreased thermal conductivity of Hf0.4Zr0.2Ti0.4CoSb0.8Sn0.2 suggested that this composition would be a good selection for further investigation regarding thermoelectric performance. To this end, the effect of charge carrier concentration was investigated by preparing Hf0.4Zr0.2Ti0.4CoSb1-ySny samples in order to optimize the Sn/Sb doping. Hf0.4Zr0.2Ti0.4CoSb0.83Sn0.17 reached the highest zT of 0.77 at 960 K, a value that corresponds to an improvement of 15% with respect to that of Hf0.4Zr0.2Ti0.4CoSb0.8Sn0.2. The use of a single-step and cost-effective preparation method, like mechanical alloying in combination with a decreased Hf usage without losing much of the TE conversion efficiency, will be crucial for the commercialization of half-Heusler materials in the near future.

Author Contributions

Conceptualization, T.K.; Data curation, I.I.; Formal analysis, I.I. and A.D.; Funding acquisition, T.K.; Investigation, I.I., A.D., Y.G. and T.K.; Methodology, T.K.; Supervision, T.K.; Writing—original draft, I.I.; Writing—review & editing, Y.G. and T.K. All authors have read and agreed to the published version of the manuscript.

Funding

This research was supported by the M-Era. Net project “MarTEnergy”, funded by the Cyprus Research Promotion Foundation (P2P/KOINA/M-ERA.NET/ 0317/04) and the Ministry of Science Technology and Space, Israel.

Institutional Review Board Statement

Not applicable.

Informed Consent Statement

Not applicable.

Data Availability Statement

All the data is available within the manuscript.

Conflicts of Interest

The authors declare no conflict of interest.

References

  1. Rowe, D.M. CRC Handbook of Thermoelectrics; CRC Press: Boca Raton, FL, USA, 1995. [Google Scholar] [CrossRef]
  2. Zhao, L.D.; Dravid, V.P.; Kanatzidis, M.G. The panoscopic approach to high performance thermoelectrics. Energy Environ. Sci. 2014, 7, 251–268. [Google Scholar] [CrossRef]
  3. Kanatzidis, M.G. Nanostructured thermoelectrics: The new paradigm? Chem. Mater. 2010, 22, 648–659. [Google Scholar] [CrossRef]
  4. Chen, S.; Ren, Z. Recent progress of half-Heusler for moderate temperature thermoelectric applications. Mater. Today 2013, 16, 387–395. [Google Scholar] [CrossRef]
  5. Graf, T.; Felser, C.; Parkin, S.S.P. Simple rules for the understanding of Heusler compounds. Prog. Solid State Chem. 2011, 39, 1–50. [Google Scholar] [CrossRef]
  6. Zeier, W.G.; Schmitt, J.; Hautier, G.; Aydemir, U.; Gibbs, Z.M.; Felser, C.; Snyder, G.J. Engineering half-Heusler thermoelectric materials using Zintl chemistry. Nat. Rev. Mater. 2016, 1, 16032. [Google Scholar] [CrossRef]
  7. Culp, S.R.; Simonson, J.W.; Poon, S.J.; Ponnambalam, V.; Edwards, J.; Tritt, T.M. (Zr,Hf)Co(Sb,Sn) half-Heusler phases as high-temperature (>700 °C) p-type thermoelectric materials. Appl. Phys. Lett. 2008, 93, 022105. [Google Scholar] [CrossRef]
  8. Schwall, M.; Balke, B. On the phase separation in n-type thermoelectric half-Heusler materials. Materials 2018, 11, 649. [Google Scholar] [CrossRef] [Green Version]
  9. Yan, X.; Joshi, G.; Liu, W.; Lan, Y.; Wang, H.; Lee, S.; Simonson, J.W.; Poon, S.J.; Tritt, T.M.; Chen, G.; et al. Enhanced thermoelectric figure of merit of p-type half-heuslers. Nano Lett. 2011, 11, 556–560. [Google Scholar] [CrossRef]
  10. Schwall, M.; Balke, B. Phase separation as a key to a thermoelectric high efficiency. Phys. Chem. Chem. Phys. 2013, 15, 1868–1872. [Google Scholar] [CrossRef]
  11. Rausch, E.; Balke, B.; Deschauer, T.; Ouardi, S.; Felser, C. Charge carrier concentration optimization of thermoelectric p-type half-Heusler compounds. APL Mater. 2015, 3, 041516. [Google Scholar] [CrossRef]
  12. Krez, J.; Schmitt, J.; Jeffrey Snyder, G.; Felser, C.; Hermes, W.; Schwind, M. Optimization of the carrier concentration in phase-separated half-Heusler compounds. J. Mater. Chem. A 2014, 2, 13513–13518. [Google Scholar] [CrossRef] [Green Version]
  13. Ioannou, I.; Ioannou, P.S.; Delimitis, A.; Gelbstein, Y.; Giapintzakis, I.; Kyratsi, T. High thermoelectric performance of p-type half-Heusler (Hf,Ti)Co(Sb,Sn) solid solutions fabricated by mechanical alloying. J. Alloys Compd. 2021, 858, 158330. [Google Scholar] [CrossRef]
  14. Bhattacharya, S.; Pope, A.L.; Littleton IV, R.T.; Tritt, T.M.; Ponnambalam, V.; Xia, Y.; Poon, S.J. Effect of Sb doping on the thermoelectric properties of Ti-based half-Heusler compounds, TiNiSn1-xSbx. Appl. Phys. Lett. 2000, 77, 2476–2478. [Google Scholar] [CrossRef] [Green Version]
  15. Rausch, E.; Castegnaro, M.V.; Bernardi, F.; Martins Alves, M.C.; Morais, J.; Balke, B. Short and long range order of Half-Heusler phases in (Ti,Zr,Hf)CoSb thermoelectric compounds. Acta Mater. 2016, 115, 308–313. [Google Scholar] [CrossRef]
  16. Rausch, E.; Balke, B.; Stahlhofen, J.M.; Ouardi, S.; Burkhardt, U.; Felser, C. Fine tuning of thermoelectric performance in phase-separated half-Heusler compounds. J. Mater. Chem. C 2015, 3, 10409–10414. [Google Scholar] [CrossRef]
  17. Culp, S.R.; Poon, S.J.; Hickman, N.; Tritt, T.M.; Blumm, J. Effect of substitutions on the thermoelectric figure of merit of half-Heusler phases at 800 °C. Appl. Phys. Lett. 2006, 88, 042106. [Google Scholar] [CrossRef]
  18. Joshi, G.; Dahal, T.; Chen, S.; Wang, H.; Shiomi, J.; Chen, G.; Ren, Z. Enhancement of thermoelectric figure-of-merit at low temperatures by titanium substitution for hafnium in n-type half-Heuslers Hf0.75-xTixZr0.25NiSn0.99Sb0.01. Nano Energy 2013, 2, 82–87. [Google Scholar] [CrossRef] [Green Version]
  19. Appel, O.; Schwall, M.; Mogilyansky, D.; Köhne, M.; Balke, B.; Gelbstein, Y. Effects of microstructural evolution on the thermoelectric properties of spark-plasma-sintered Ti0.3Zr0.35Hf0.35NiSn half-heusler compound. J. Electron. Mater. 2013, 42, 1340–1345. [Google Scholar] [CrossRef]
  20. Yan, X.; Liu, W.; Wang, H.; Chen, S.; Shiomi, J.; Esfarjani, K.; Wang, H.; Wang, D.; Chen, G.; Ren, Z. Stronger phonon scattering by larger differences in atomic mass and size in p-type half-Heuslers Hf1−xTixCoSb0.8Sn 0.2. Energy Environ. Sci. 2012, 5, 7543–7548. [Google Scholar] [CrossRef]
  21. Yan, X.; Liu, W.; Chen, S.; Wang, H.; Zhang, Q.; Chen, G.; Ren, Z. Thermoelectric property study of nanostructured p-type half-heuslers (Hf, Zr, Ti)CoSb0.8 Sn0.2. Adv. Energy Mater. 2013, 3, 1195–1200. [Google Scholar] [CrossRef]
  22. 22. U.S. Geological Survey. Metal Prices in the United States through 2010. 2012; pp. 1–204. Available online: http://pubs.usgs.gov/sir/2012/5188/ (accessed on 20 February 2022).
  23. He, R.; Kim, H.S.; Lan, Y.; Wang, D.; Chen, S.; Ren, Z. Investigating the thermoelectric properties of p-type half-Heusler Hfx(ZrTi)1-xCoSb0.8Sn0.2 by reducing Hf concentration for power generation. RSC Adv. 2015, 4, 64711–64716. [Google Scholar] [CrossRef]
  24. Benzoudji, F.; Miloud Abid, O.; Seddik, T.; Yakoubi, A.; Khenata, R.; Meradji, H.; Uğur, G.; Uğur, S.; Ocak, H.Y. Insight into the structural, elastic, electronic, thermoelectric, thermodynamic and optical properties of MRhSb (M = Ti, Zr, Hf) half-Heuslers from ab initio calculations. Chin. J. Phys. 2019, 59, 434–448. [Google Scholar] [CrossRef]
  25. Rausch, E.; Balke, B.; Ouardi, S.; Felser, C. Long-Term Stability of (Ti/Zr/Hf)CoSb1-xSnx Thermoelectric p-Type Half-Heusler Compounds Upon Thermal Cycling. Energy Technol. 2015, 3, 1217–1224. [Google Scholar] [CrossRef]
  26. Chauhan, N.S.; Bathula, S.; Gahtori, B.; Kolen’ko, Y.V.; Dhar, A. Enhanced Thermoelectric Performance in Hf-Free p-Type (Ti, Zr)CoSb Half-Heusler Alloys. J. Electron. Mater. 2019, 48, 6700–6709. [Google Scholar] [CrossRef]
  27. Page, A.; Van Der Ven, A.; Poudeu, P.F.P.; Uher, C. Origins of phase separation in thermoelectric (Ti, Zr, Hf)NiSn half-Heusler alloys from first principles. J. Mater. Chem. A 2016, 36, 13949–13956. [Google Scholar] [CrossRef]
  28. Suryanarayana, C. Mechanical alloying and milling. Prog. Mater. Sci. 2001, 46, 1–184. [Google Scholar] [CrossRef]
  29. Chauhan, N.S.; Bathula, S.; Vishwakarma, A.; Bhardwaj, R.; Kumar Johari, K.; Gahtori, B.; Dhar, A. Facile fabrication of p- and n-type half-Heusler alloys with enhanced thermoelectric performance and low specific contact resistance employing spark plasma sintering. Mater. Lett. 2018, 228, 250–253. [Google Scholar] [CrossRef]
  30. Gandi, A.N.; Schwingenschlögl, U. Thermoelectric Properties of the XCoSb (X: Ti,Zr,Hf) Half-Heusler alloys. Phys. Status Solidi Basic Res. 2017, 254, 1700419. [Google Scholar] [CrossRef]
  31. Slade, T.J.; Grovogui, J.A.; Kuo, J.J.; Anand, S.; Bailey, T.P.; Wood, M.; Uher, C.; Snyder, G.J.; Dravid, V.P.; Kanatzidis, M.G. Understanding the thermally activated charge transport in NaPbMSbQm +2(Q = S, Se, Te) thermoelectrics: Weak dielectric screening leads to grain boundary dominated charge carrier scattering. Energy Environ. Sci. 2020, 13, 1509–1518. [Google Scholar] [CrossRef]
  32. Wood, M.; Kuo, J.J.; Imasato, K.; Snyder, G.J. Improvement of Low-Temperature zT in a Mg3Sb2–Mg3Bi2 Solid Solution via Mg-Vapor Annealing. Adv. Mater. 2019, 31, 1902337. [Google Scholar] [CrossRef]
  33. Kuo, J.J.; Kang, S.D.; Imasato, K.; Tamaki, H.; Ohno, S.; Kanno, T.; Snyder, G.J. Grain boundary dominated charge transport in Mg3Sb2-based compounds. Energy Environ. Sci. 2018, 11, 429–434. [Google Scholar] [CrossRef] [Green Version]
  34. Kim, H.S.; Gibbs, Z.M.; Tang, Y.; Wang, H.; Snyder, G.J. Characteriza tion of Lorenz number with Seebeck coefficient measurement. APL Mater. 2015, 3, 041506. [Google Scholar] [CrossRef] [Green Version]
  35. Kuo, J.J.; Wood, M.; Slade, T.J.; Kanatzidis, M.G.; Snyder, G.J. Systematic over-estimation of lattice thermal conductivity in materials with electrically-resistive grain boundaries. Energy Environ. Sci. 2020, 13, 1250. [Google Scholar] [CrossRef]
  36. Schrade, M.; Berland, K.; Eliassen, S.N.H.; Guzik, M.N.; Sørby, M.H.; Jenuš, P.; Hauback, B.C.; Tofan, R. The role of grain boundary scattering in reducing the thermal conductivity of polycrystalline X NiSn (X = Hf, Zr, Ti) half-Heusler alloys. Sci. Rep. 2017, 7, 13760. [Google Scholar] [CrossRef]
  37. Rausch, E.; Balke, B.; Ouardi, S.; Felser, C. Enhanced thermoelectric performance in the p-type half-Heusler (Ti/Zr/Hf)CoSb0.8Sn0.2 system via phase separation. Phys. Chem. Chem. Phys. 2014, 16, 25258–25262. [Google Scholar] [CrossRef]
  38. Joshi, H.; Rai, D.P.; Hnamte, L.; Laref, A.; Thapa, R.K. A theoretical analysis of elastic and optical properties of half Heusler MCoSb (M = Ti, Zr and Hf). Heliyon 2019, 5, e01155. [Google Scholar] [CrossRef] [Green Version]
  39. Nishino, Y.; Deguchi, S.; Mizutani, U. Thermal and transport properties of the Heusler-type Fe2 VAl1-x Gex (0 ≤ x ≤ 0.20) alloys: Effect of doping on lattice thermal conductivity, electrical resistivity, and Seebeck coefficient. Phys. Rev. B Condens. Matter Mater. Phys. 2006, 74, 115115. [Google Scholar] [CrossRef]
  40. Slack, G.A. Effect of isotopes on low-temperature thermal conductivity. Phys. Rev. 1957, 105, 829–831. [Google Scholar] [CrossRef]
  41. Abeles, B. Lattice thermal conductivity of disordered semiconductor alloys at high temperatures. Phys. Rev. 1963, 131, 1906–1911. [Google Scholar] [CrossRef]
  42. Hu, C.; Xia, K.; Chen, X.; Zhao, X.; Zhu, T. Transport mechanisms and property optimization of p-type (Zr, Hf)CoSb half-Heusler thermoelectric materials. Mater. Today Phys. 2018, 7, 69–76. [Google Scholar] [CrossRef]
  43. Yang, J.; Meisner, G.P.; Chen, L. Strain field fluctuation effects on lattice thermal conductivity of ZrNiSn-based thermoelectric compounds. Appl. Phys. Lett. 2004, 85, 1140–1142. [Google Scholar] [CrossRef]
Figure 1. (a) X-ray powder diffraction patterns of Hf0.6-xZrxTi0.4CoSb0.8Sn0.2 powders prepared by 6 h mechanical alloying; and (b) the X-ray powder diffraction patterns of hot-pressed Hf0.6-xZrxTi0.4CoSb0.8Sn0.2 pellets and the theoretical pattern of TiCoSb.
Inorganics 10 00051 g001aInorganics 10 00051 g001b
Figure 2. Typical back-scattered image and elemental mapping of (Hf,Zr,Ti)Co(Sb,Sn) hot-pressed samples synthesized via MA.
Inorganics 10 00051 g002
Figure 3. (a) TEM image of the particles’ morphology at the Hf0.4Zr0.2Ti0.4CoSb0.8Sn0.2 sample. The SAD pattern inset, coming from one of these particles, is viewed along [111]. (b) HRTEM image of a representative nanocrystalline particle, predominately revealing.
Inorganics 10 00051 g003
Figure 4. Temperature-dependent Seebeck coefficient (a), electrical conductivity (b), Power factor (c), total thermal conductivity (d), lattice thermal conductivity (e) and thermoelectric figure-of-merit zT (f) of Hf0.6-xZrxTi0.4CoSb0.8Sn0.2 samples.
Inorganics 10 00051 g004aInorganics 10 00051 g004b
Figure 5. The lattice thermal conductivity at room temperature (the line is guide to the eye) (a) and the theoretical disorder scattering parameter due to mass fluctuations ΓM as function of Zr concentration (b).
Inorganics 10 00051 g005
Figure 6. X-ray powder diffraction patterns of Hf0.4Zr0.2Ti0.4CoSb1-ySny (y = 0.15–0.25) hot-pressed pellets.
Inorganics 10 00051 g006
Figure 7. Temperature-dependent Seebeck coefficient (a), electrical conductivity (b), Power factor (c), total thermal conductivity (d), lattice thermal conductivity (e) and thermoelectric figure-of-merit zT (f) Hf0.4Zr0.2Ti0.4CoSb1-ySny samples.
Inorganics 10 00051 g007aInorganics 10 00051 g007b
Table 1. Lattice parameter, geometrical density and relative density based on the crystallographic density of the hot-pressed Hf0.6-xZrxTi0.4CoSb0.8Sn0.2 samples.
CompositionLattice
Parameter (nm)
Geometrical
Density (g/cm3)
Relative
Density (%)
Hf0.6Ti0.4CoSb0.8Sn0.20.5999.1397
Hf0.5Zr0.1Ti0.4CoSb0.8Sn0.20.6018.5994
Hf0.4Zr0.2Ti0.4CoSb0.8Sn0.20.6018.5196
Hf0.3Zr0.3Ti0.4CoSb0.8Sn0.20.6028.1495
Hf0.2Zr0.4Ti0.4CoSb0.8Sn0.20.6018.1298
Zr0.6Ti0.4CoSb0.8Sn0.20.5997.5096
Table 2. Nominal and chemical composition of hot-pressed Hf0.6-xZrxTi0.4CoSb0.8Sn0.2 samples as determined by EDS.
Nominal CompositionHfZrTiCoSbSn
Hf0.6Ti0.4CoSb0.8Sn0.20.56-0.451.020.840.14
Hf0.5Zr0.1Ti0.4CoSb0.8Sn0.20.450.120.431.010.840.14
Hf0.4Zr0.2Ti0.4CoSb0.8Sn0.20.350.220.421.020.840.15
Hf0.3Zr0.3Ti0.4CoSb0.8Sn0.20.270.330.430.980.860.13
Hf0.2Zr0.4Ti0.4CoSb0.8Sn0.20.170.430.440.990.850.12
Zr0.6Ti0.4CoSb0.8Sn0.2-0.620.430.970.840.13
Table 3. Nominal and chemical composition of the hot-pressed Hf0.4Zr0.2Ti0.4CoSb0.8Sn0.2 sample as determined by EDS and TEM.
ElementNominalSEMTEM
Hf0.40.350.42
Zr0.20.220.19
Ti0.40.420.41
Co11.020.99
Sb0.80.840.75
Sn0.20.150.23
Sb + Sn10.990.98
Table 4. The lattice parameter, geometrical density and relative density based on the crystallographic density of the hot-pressed Hf0.4Zr0.2Ti0.4CoSb1-ySny samples.
Sn(y)Lattice
Parameter (nm)
Geometrical
Density (g/cm3)
Relative
Density (%)
0.150.6018.4796
0.170.6008.4495
0.200.6018.5196
0.230.6008.86100
0.250.6008.3094
Table 5. Nominal and chemical composition of hot-pressed Hf0.4Zr0.2Ti0.4CoSb1-ySny samples as determined by EDS.
Nominal CompositionHfZrTiCoSbSn
Hf0.4Zr0.2Ti0.4CoSb0.85Sn0.150.360.220.431.010.880.09
Hf0.4Zr0.2Ti0.4CoSb0.83Sn0.170.360.230.441.000.870.11
Hf0.4Zr0.2Ti0.4CoSb0.8Sn0.20.350.220.421.020.840.15
Hf0.4Zr0.2Ti0.4CoSb0.77Sn0.230.360.220.441.000.850.13
Hf0.4Zr0.2Ti0.4CoSb0.75Sn0.250.360.220.431.010.790.19
Publisher’s Note: MDPI stays neutral with regard to jurisdictional claims in published maps and institutional affiliations.

