2. Results
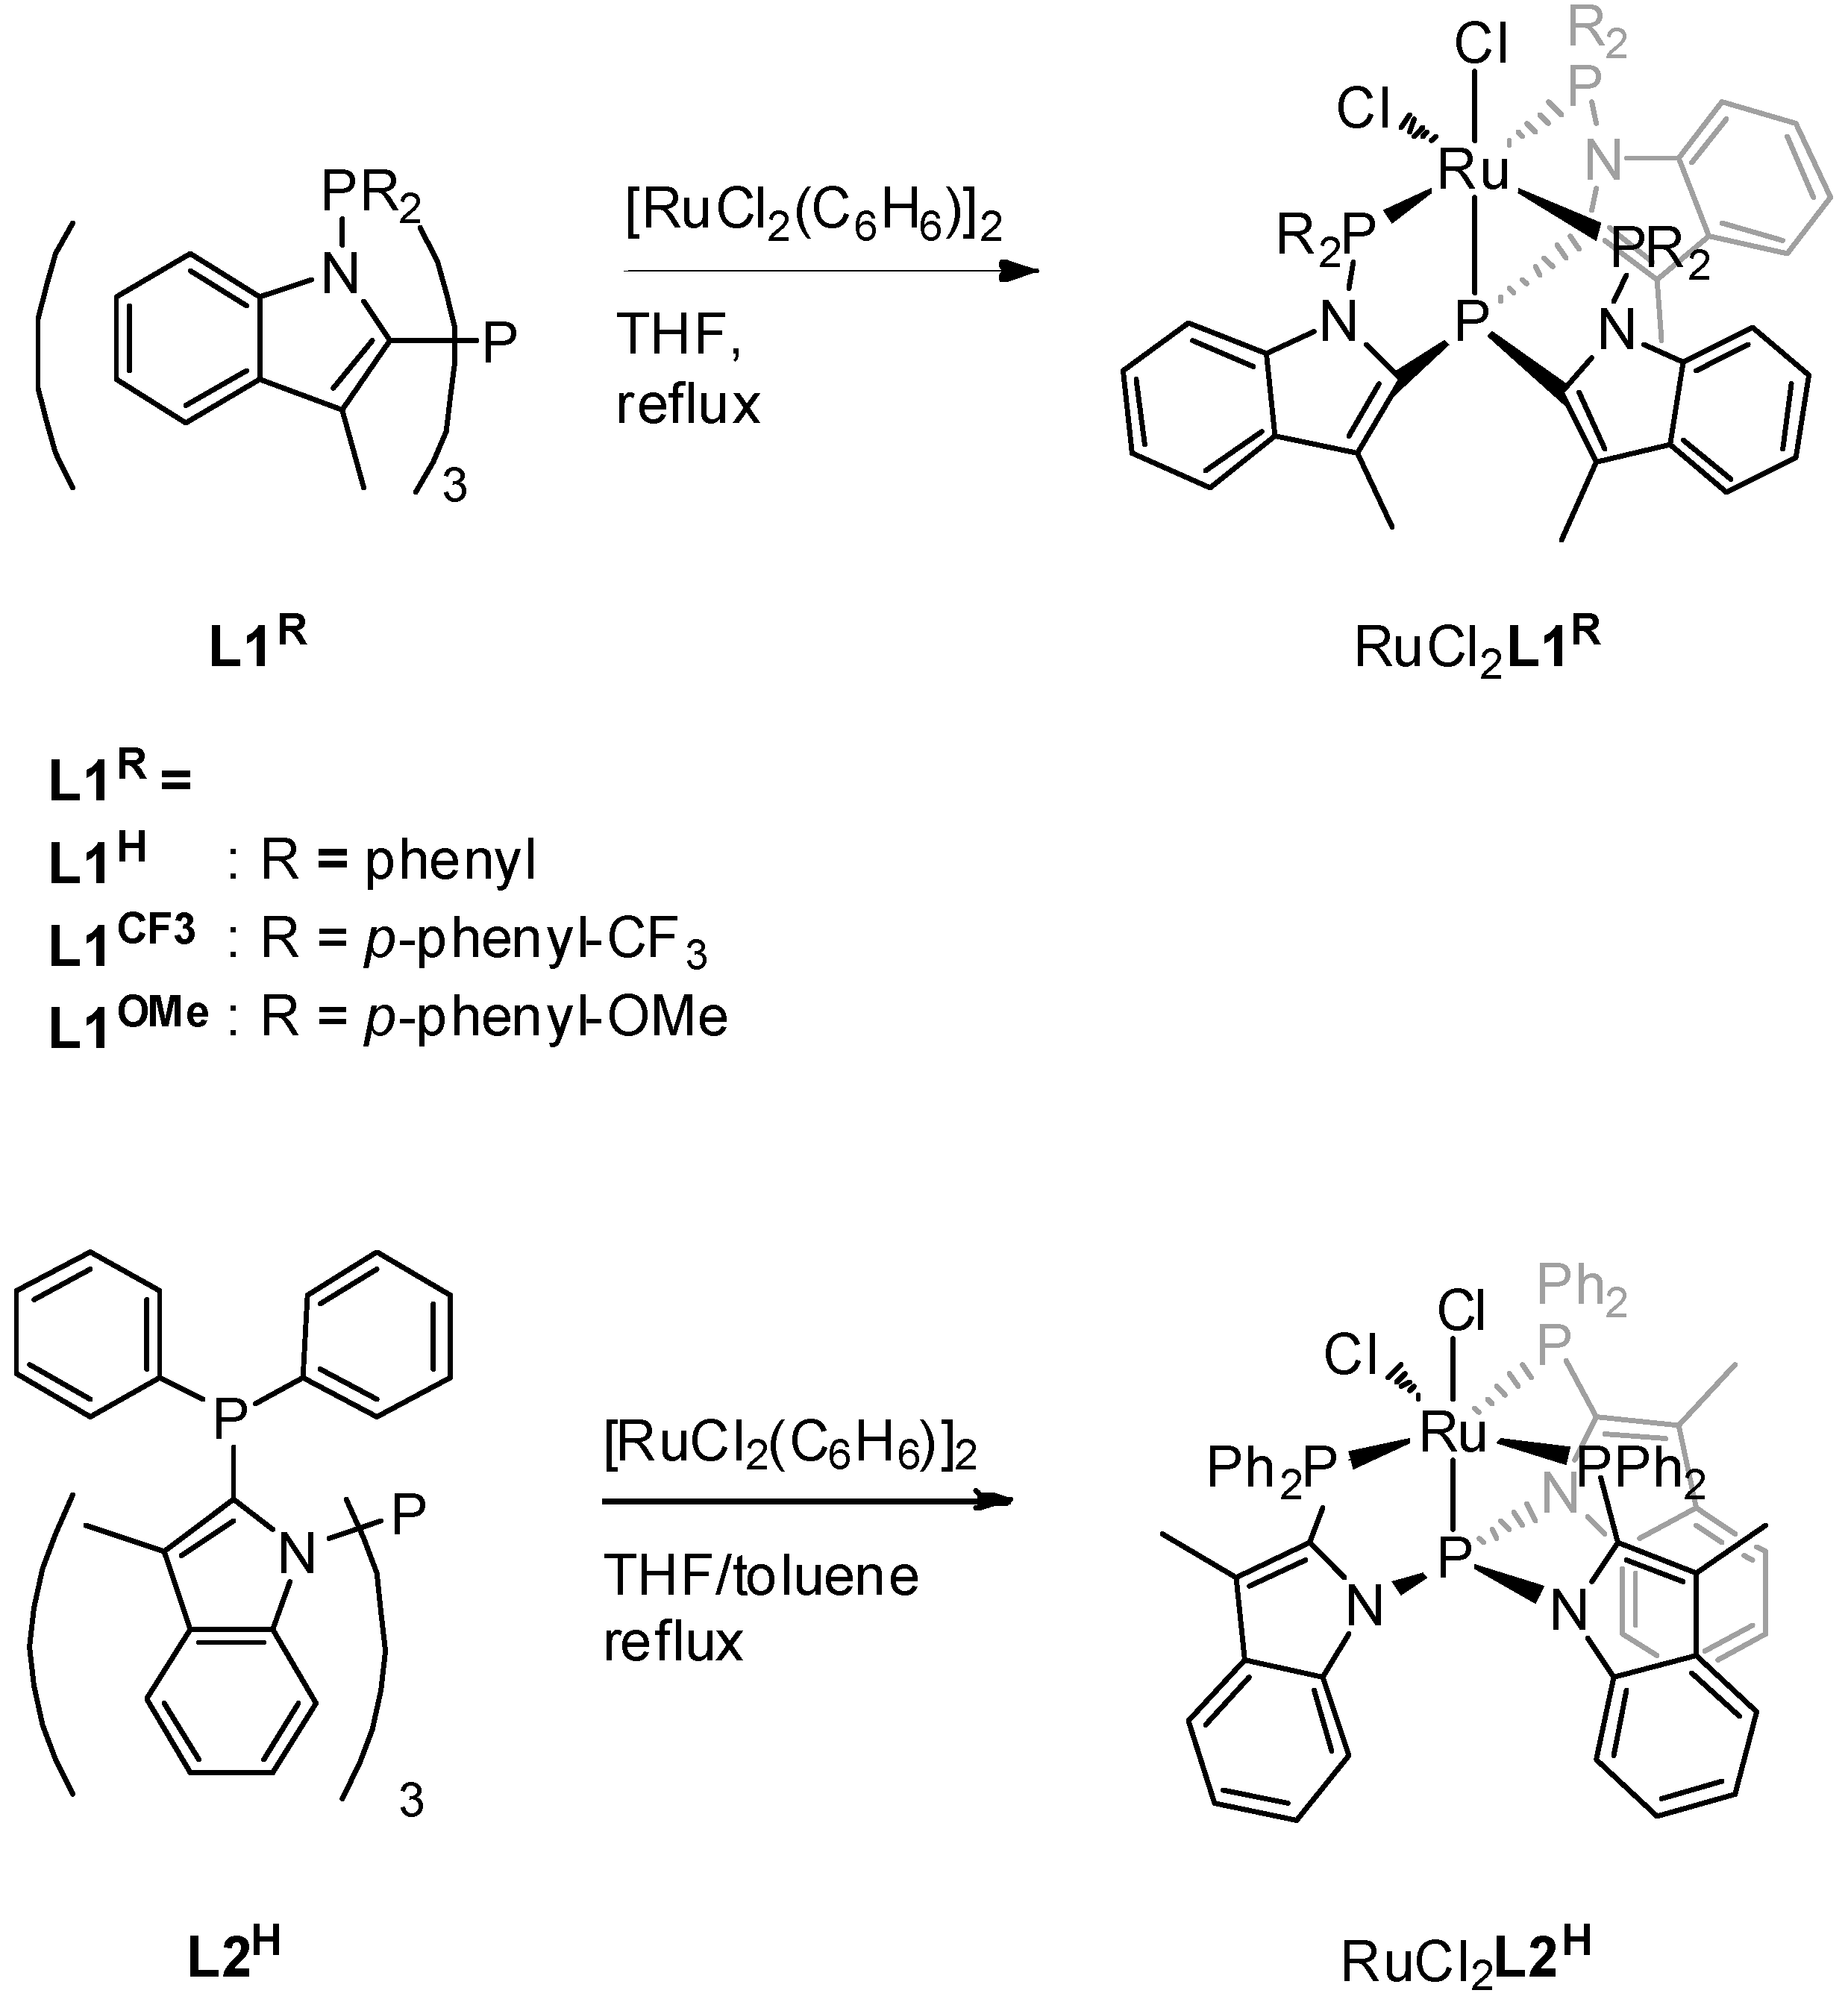
Ligands
L1H and
L2H were prepared in two steps from 3-methylindole as previously reported by our group [
14,
15]. The new ligands
L1CF3 and
L1OMe were prepared in a similar way to
L1H, by reacting tris-2-(3-methylindolyl)phosphine [
17] with the corresponding chlorodiarylphosphine (
Figure 1).
The reaction of
L1H with [Ru(η
6-benzene)Cl(μ-Cl)]
2 in refluxing THF for 16 h led to the formation of the octahedral complex RuCl
2L1H in quantitative yield (
Figure 2). Surprisingly, the other ligands did not react with this ruthenium precursor in refluxing THF. Even after 36 h, only trace amounts of the target complexes were observed using ex-situ
31P NMR spectroscopy, and mainly signals of the unreacted ligand were present. Reactions in refluxing THF/toluene (1:3) mixture at 120 °C for a prolonged time of 64 h did lead to the formation of complexes RuCl
2L1CF3, RuCl
2L1OMe, and RuCl
2L2H in >50% isolated yields.
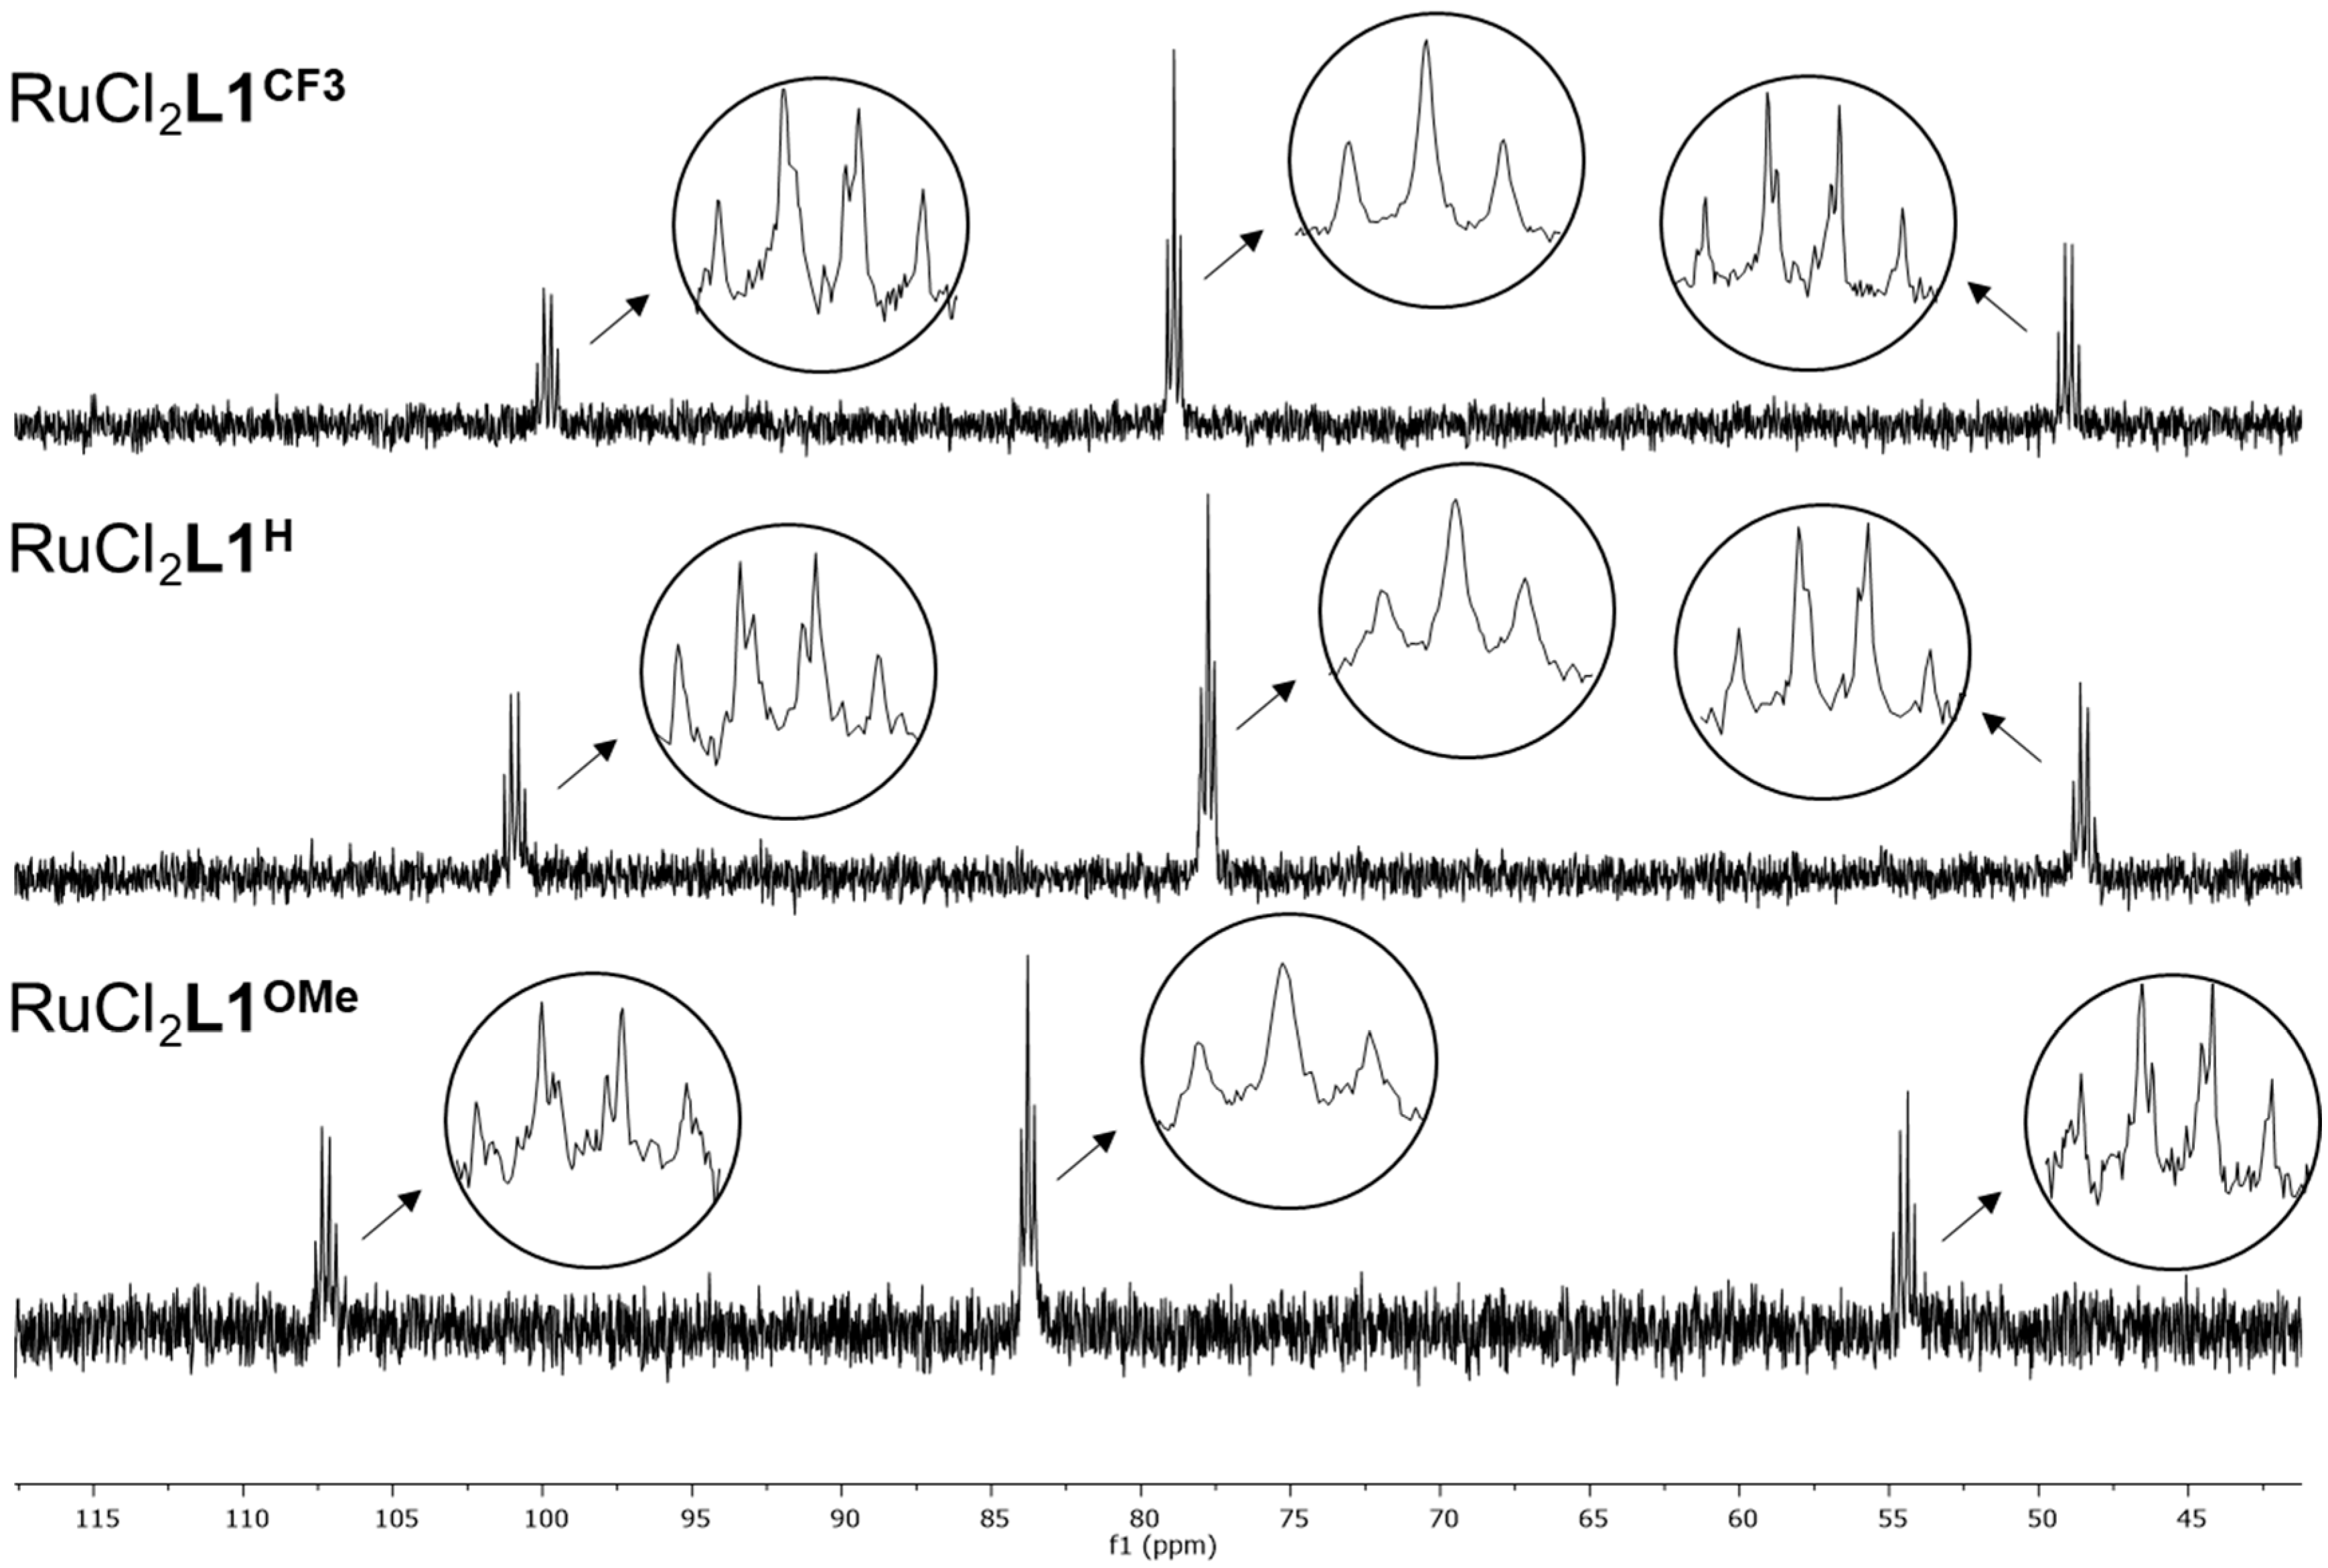
All three
L1-based RuCl
2L1 complexes show similar
31P NMR spectra: three signals in a ratio 1(td):2(t):1(td) (
Figure 3). This splitting pattern indicates the formation of a symmetric complex. Ruthenium(II) complexes tend to form octahedral 18-valence electron complexes, and X-ray analysis and NMR spectroscopy confirmed that complex RuCl
2L1H indeed features an octahedral geometry with the two chlorides in mutual
cis position and all four phosphines bound to the metal center [
15]. The above factors and the similarity of the
31P NMR spectra of the other
L1-based complexes point to the same octahedral geometry around the metal center.
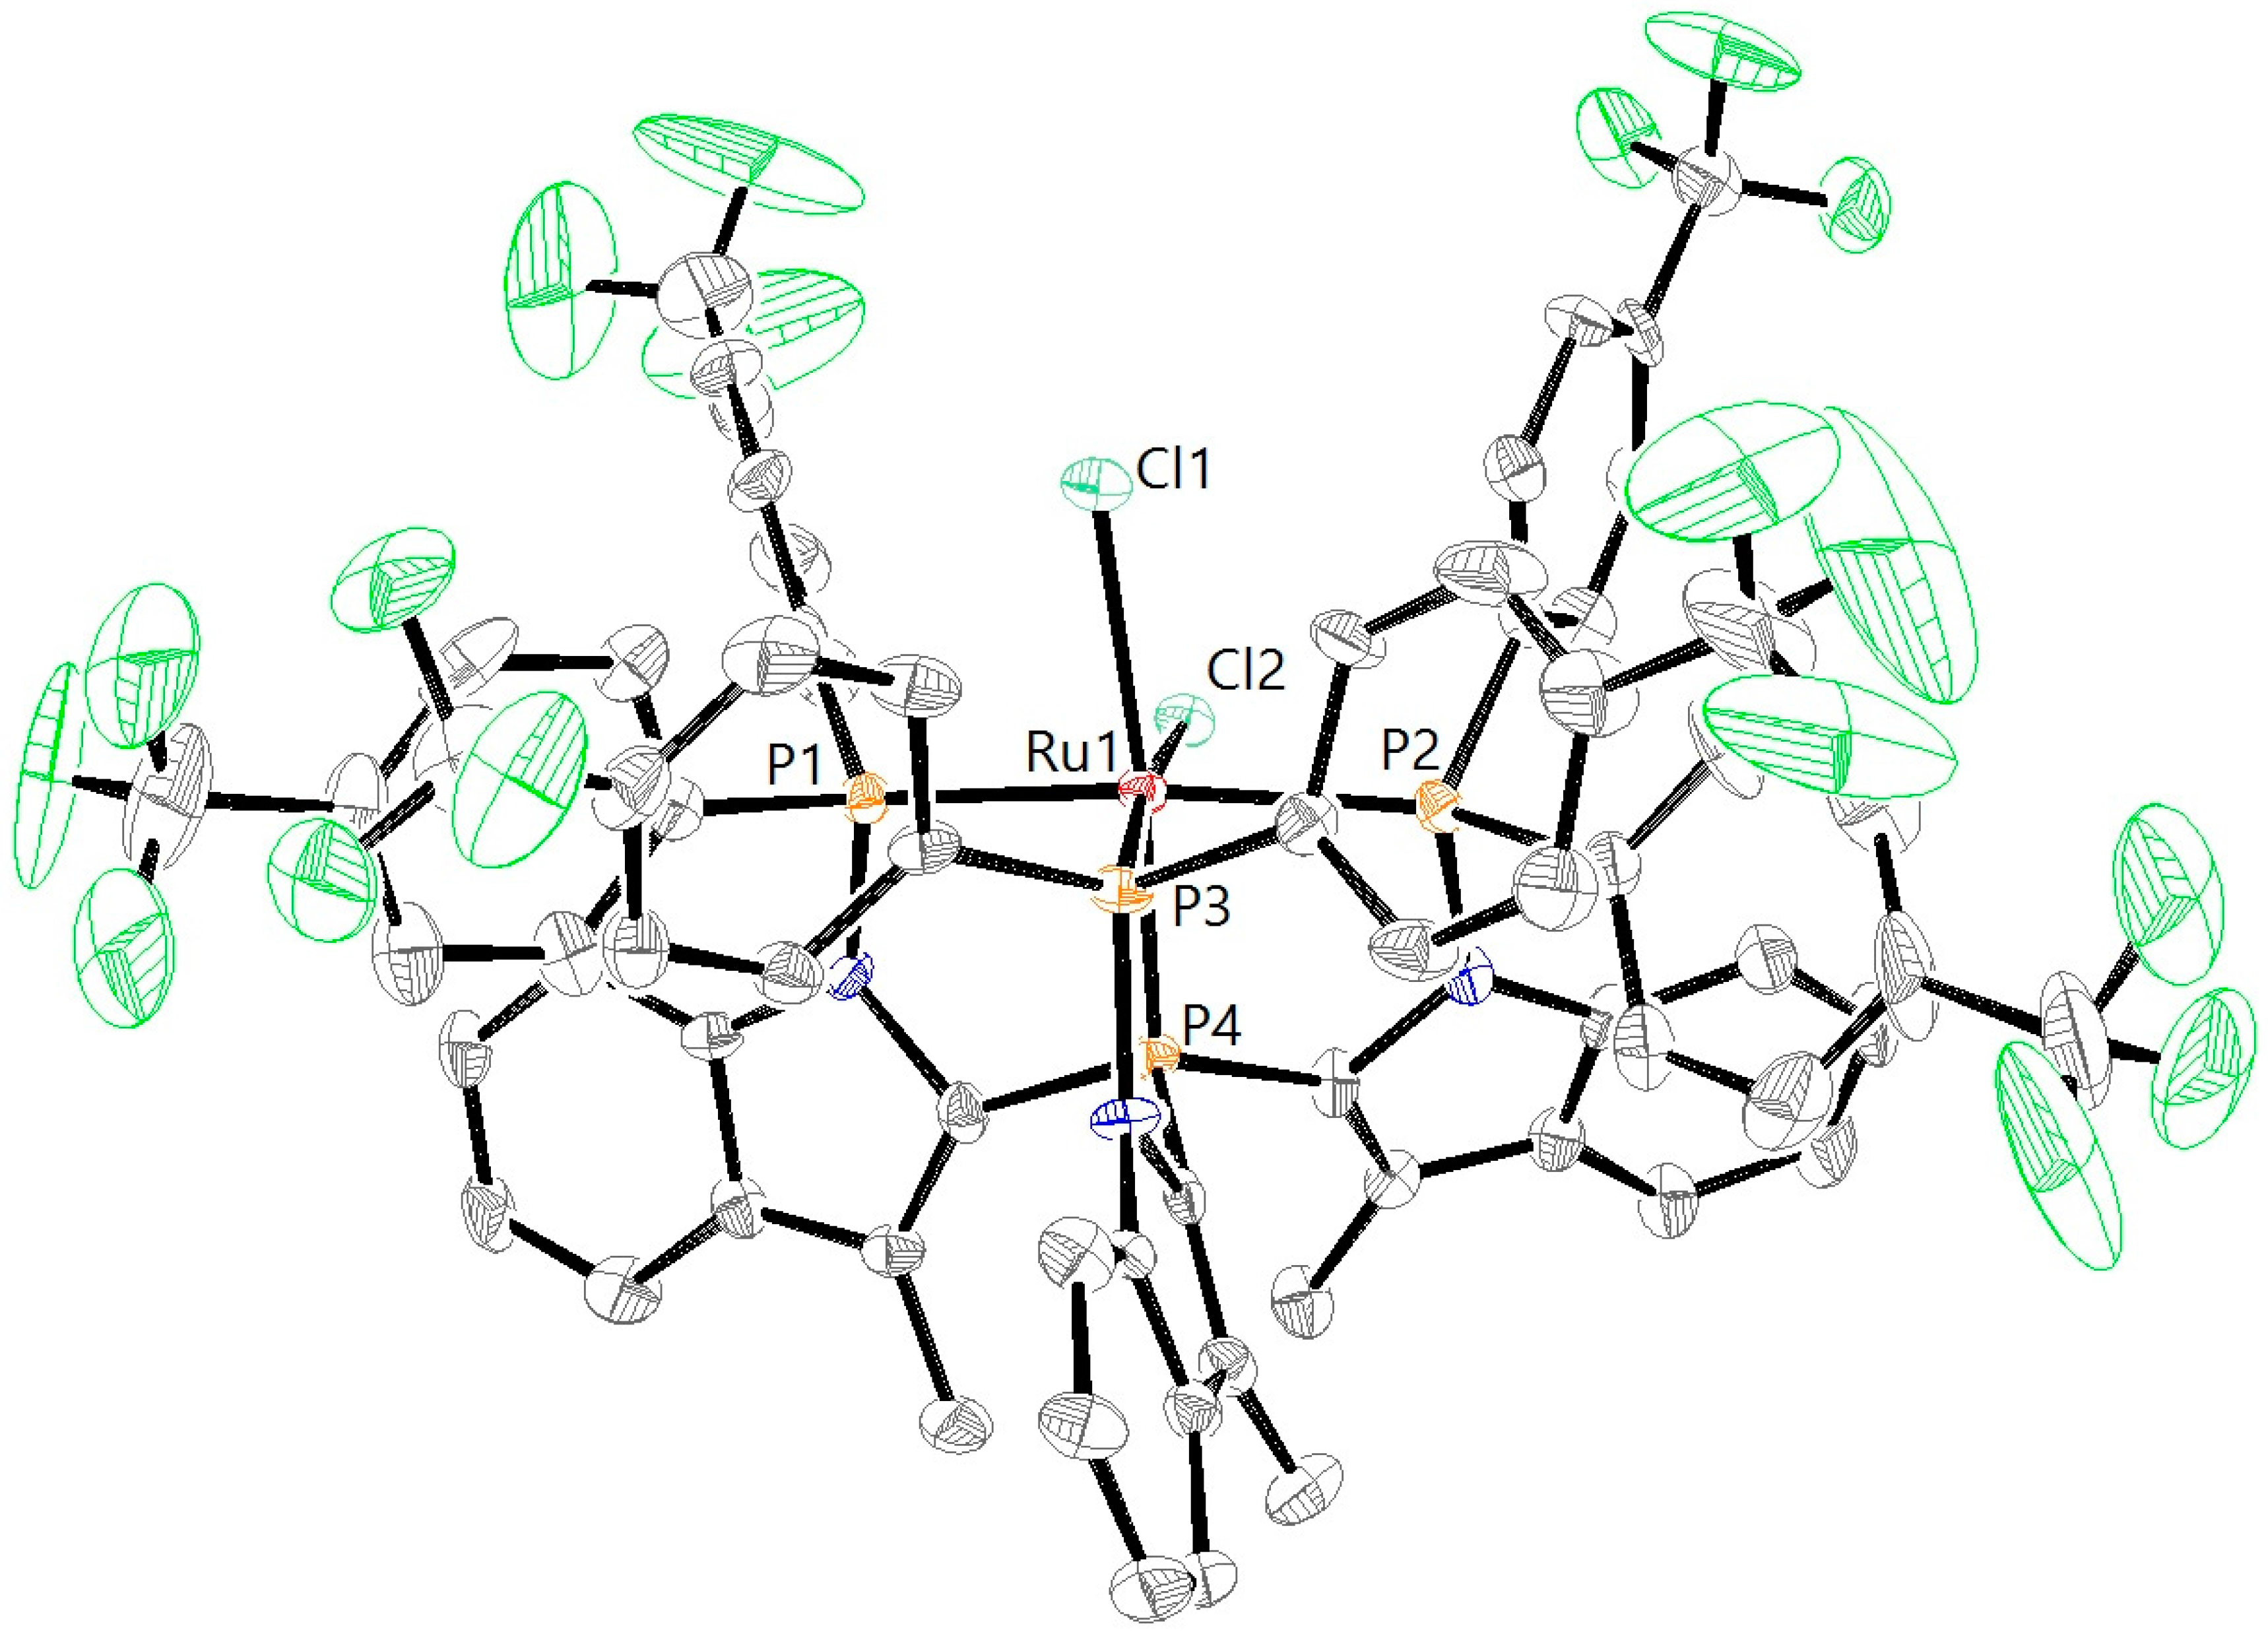
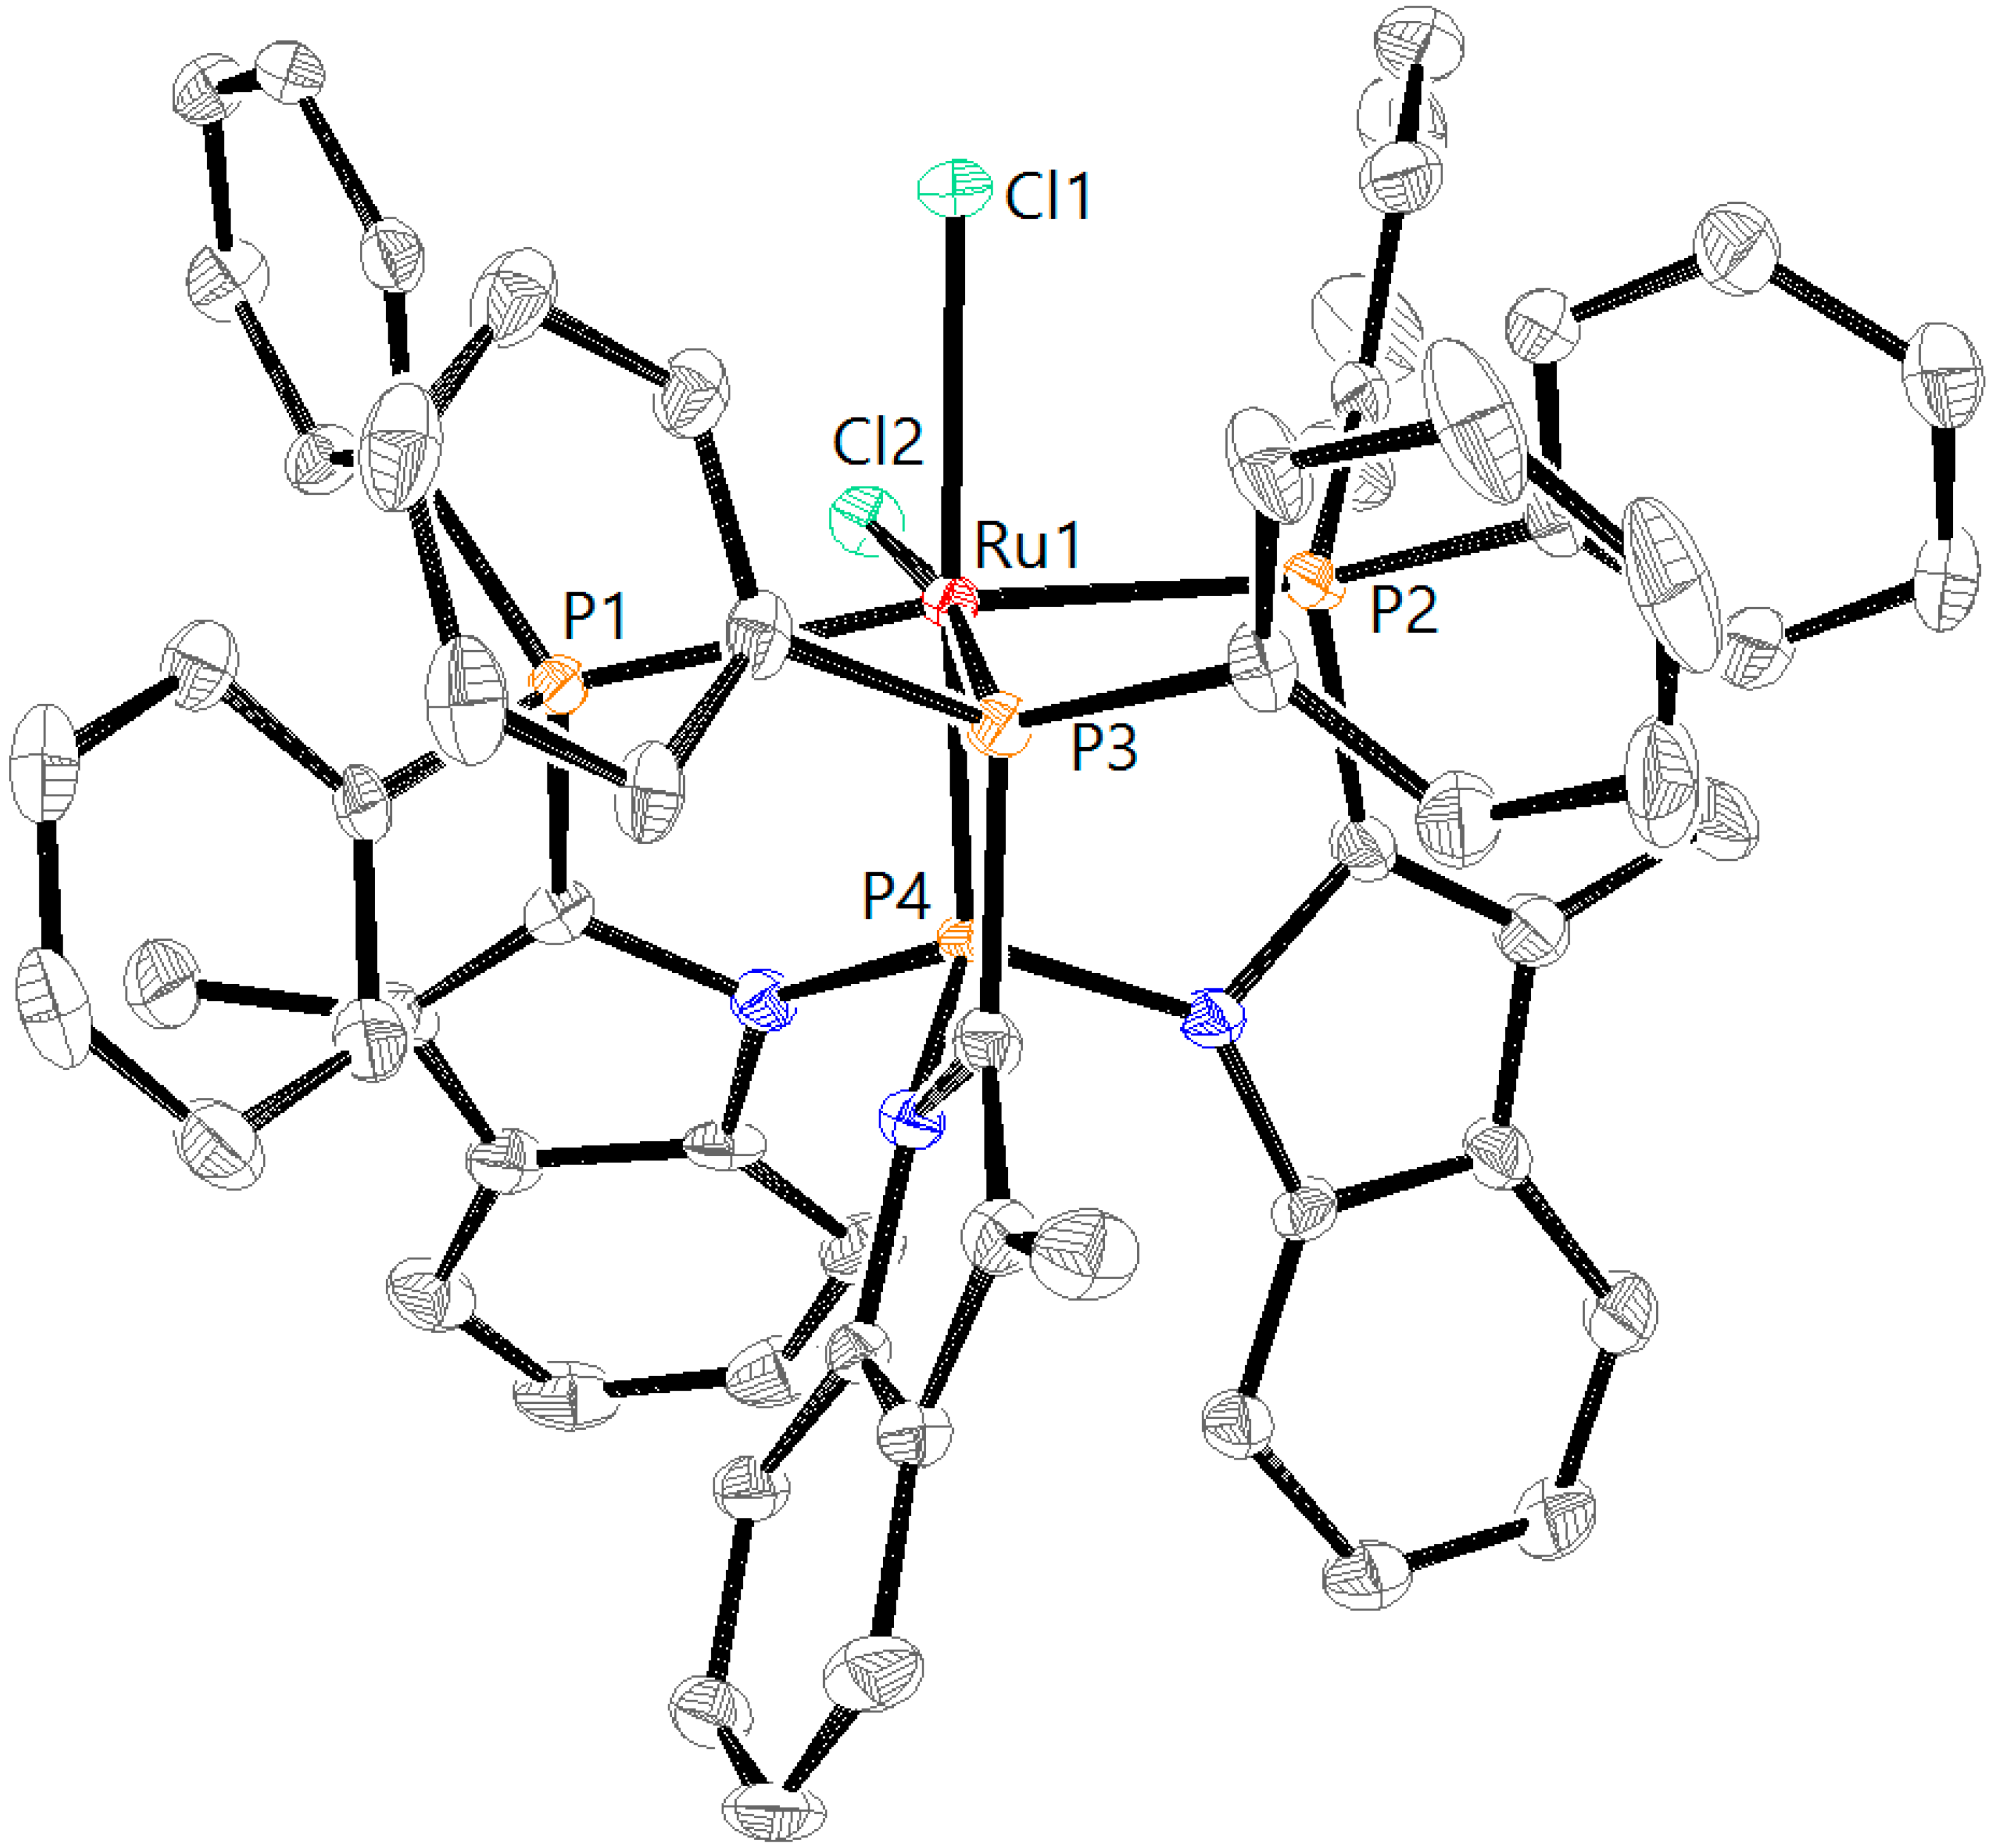
Layering of a dichloromethane solution of RuCl
2L1CF3 with pentane resulted in the formation of crystals suitable for single-crystal X-ray diffraction. The crystal structure (
Figure 4) of RuCl
2L1CF3 indeed shows an overall octahedral geometry with the chlorido ligands in
cis position, in accordance with the observed
31P NMR splitting pattern. The P1–Ru–P2 angle in RuCl
2L1CF3 (157.78(6)°) is comparable to the one previously reported for RuCl
2L1H (160.04(3)°) (
Table 1). The P1–Ru, P2–Ru and P3–Ru bond lengths are all slightly smaller in RuCl
2L1CF3 (2.3097(19) Å, 2.3445(19) Å and 2.2383(17) Å, respectively) compared with RuCl
2L1H (2.3189(9) Å, 2.3727(9) Å and 2.2671(9) Å). The –CF
3 groups clearly point away from the metal center, so steric effects do not play a significant role in the coordination chemistry. The
Cs symmetry observed in solution by
31P NMR spectroscopy for both RuCl
2L1H and RuCl
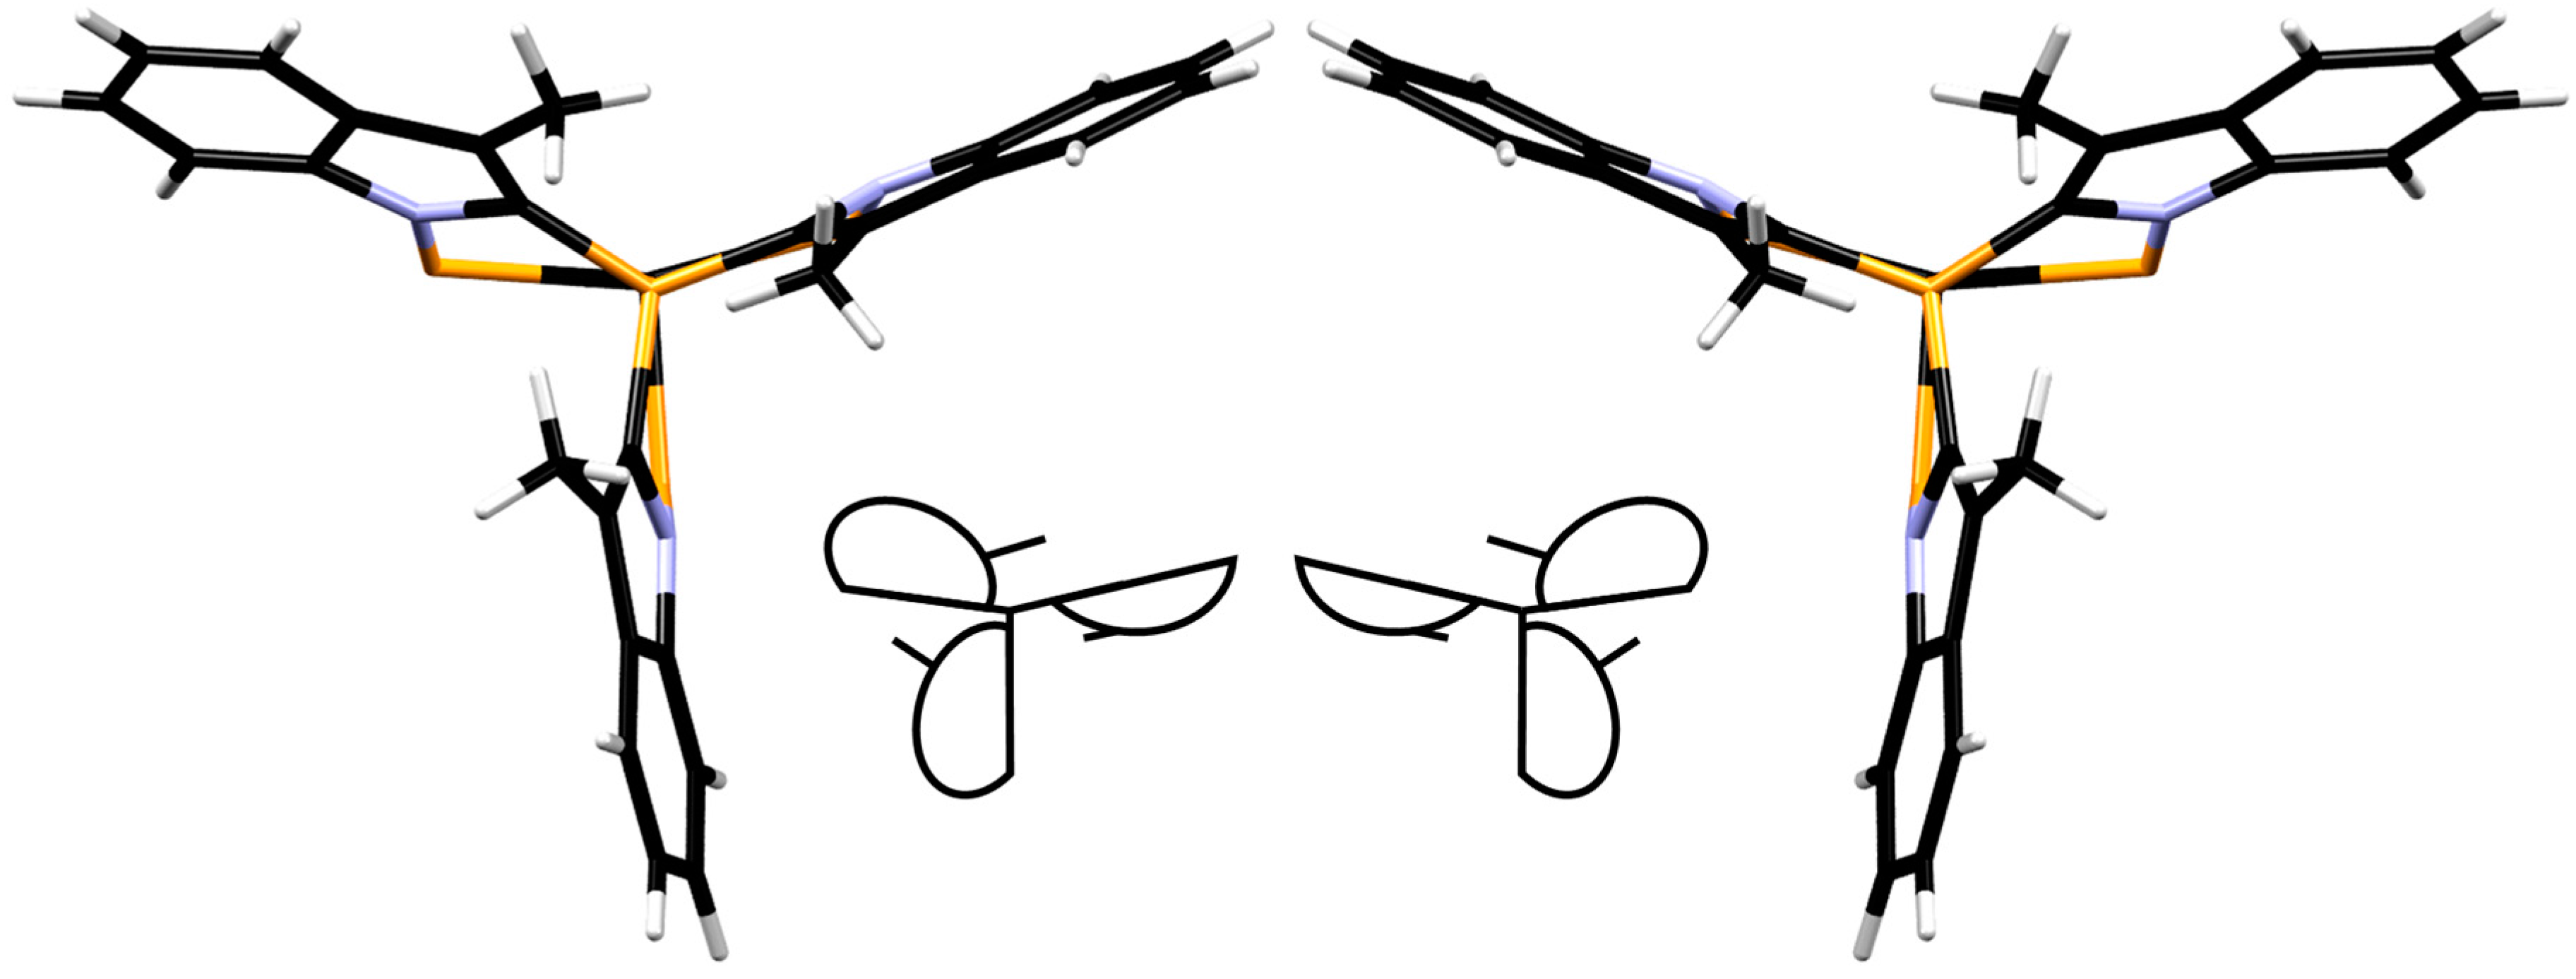
2L1CF3 is not present in the solid state, as the unit cell contains two rotamers. This becomes evident when the symmetry-equivalent molecules in the crystal structure of RuCl
2L1CF3 are viewed from the bottom: the indolyl moieties either all point clockwise, or counter-clockwise (
Figure 5, showing the bottom view of RuCl
2L1CF3 and a schematic representation). In solution, these two rotamers seem to rapidly interchange on the NMR timescale, resulting in one signal for the two mutually
trans phosphines. Likely, the methyl groups of the indolyl moiety do not create enough steric repulsion to suppress this process. Despite several attempts, no crystals suitable for X-ray diffraction of the RuCl
2L1OMe complex were obtained.
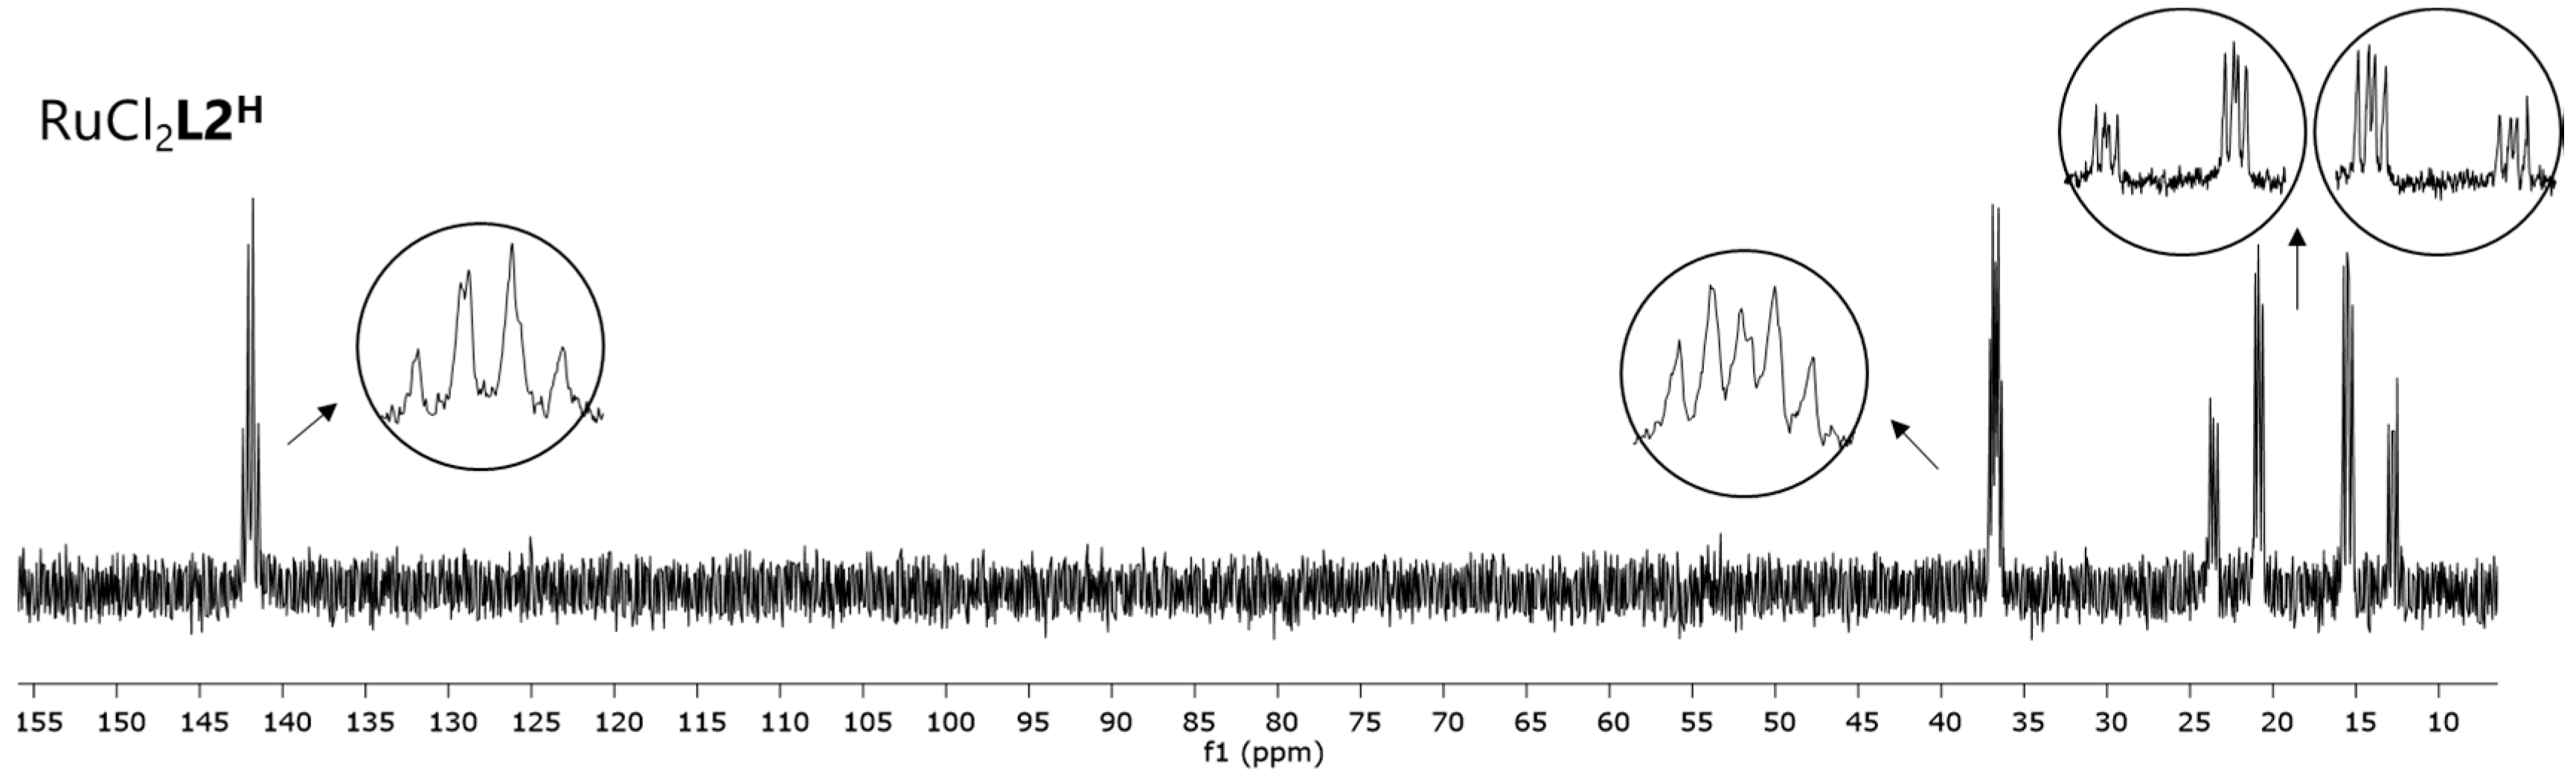
Interestingly, complex RuCl
2L2H, which is based on the linkage isomer of
L1H, ligand
L2H, displays a different
31P NMR spectrum (
Figure 6). The four signals, two triplets of doublets and two doublets of doublets of doublets with an AX pattern, each integrating one phosphine, indicate the formation of a complex with a different symmetry. Crystals obtained by layering of a DCM solution of RuCl
2L2H with pentane at 5 °C were of sufficient quality for X-ray crystallography. The corresponding structure of complex RuCl
2L2H (
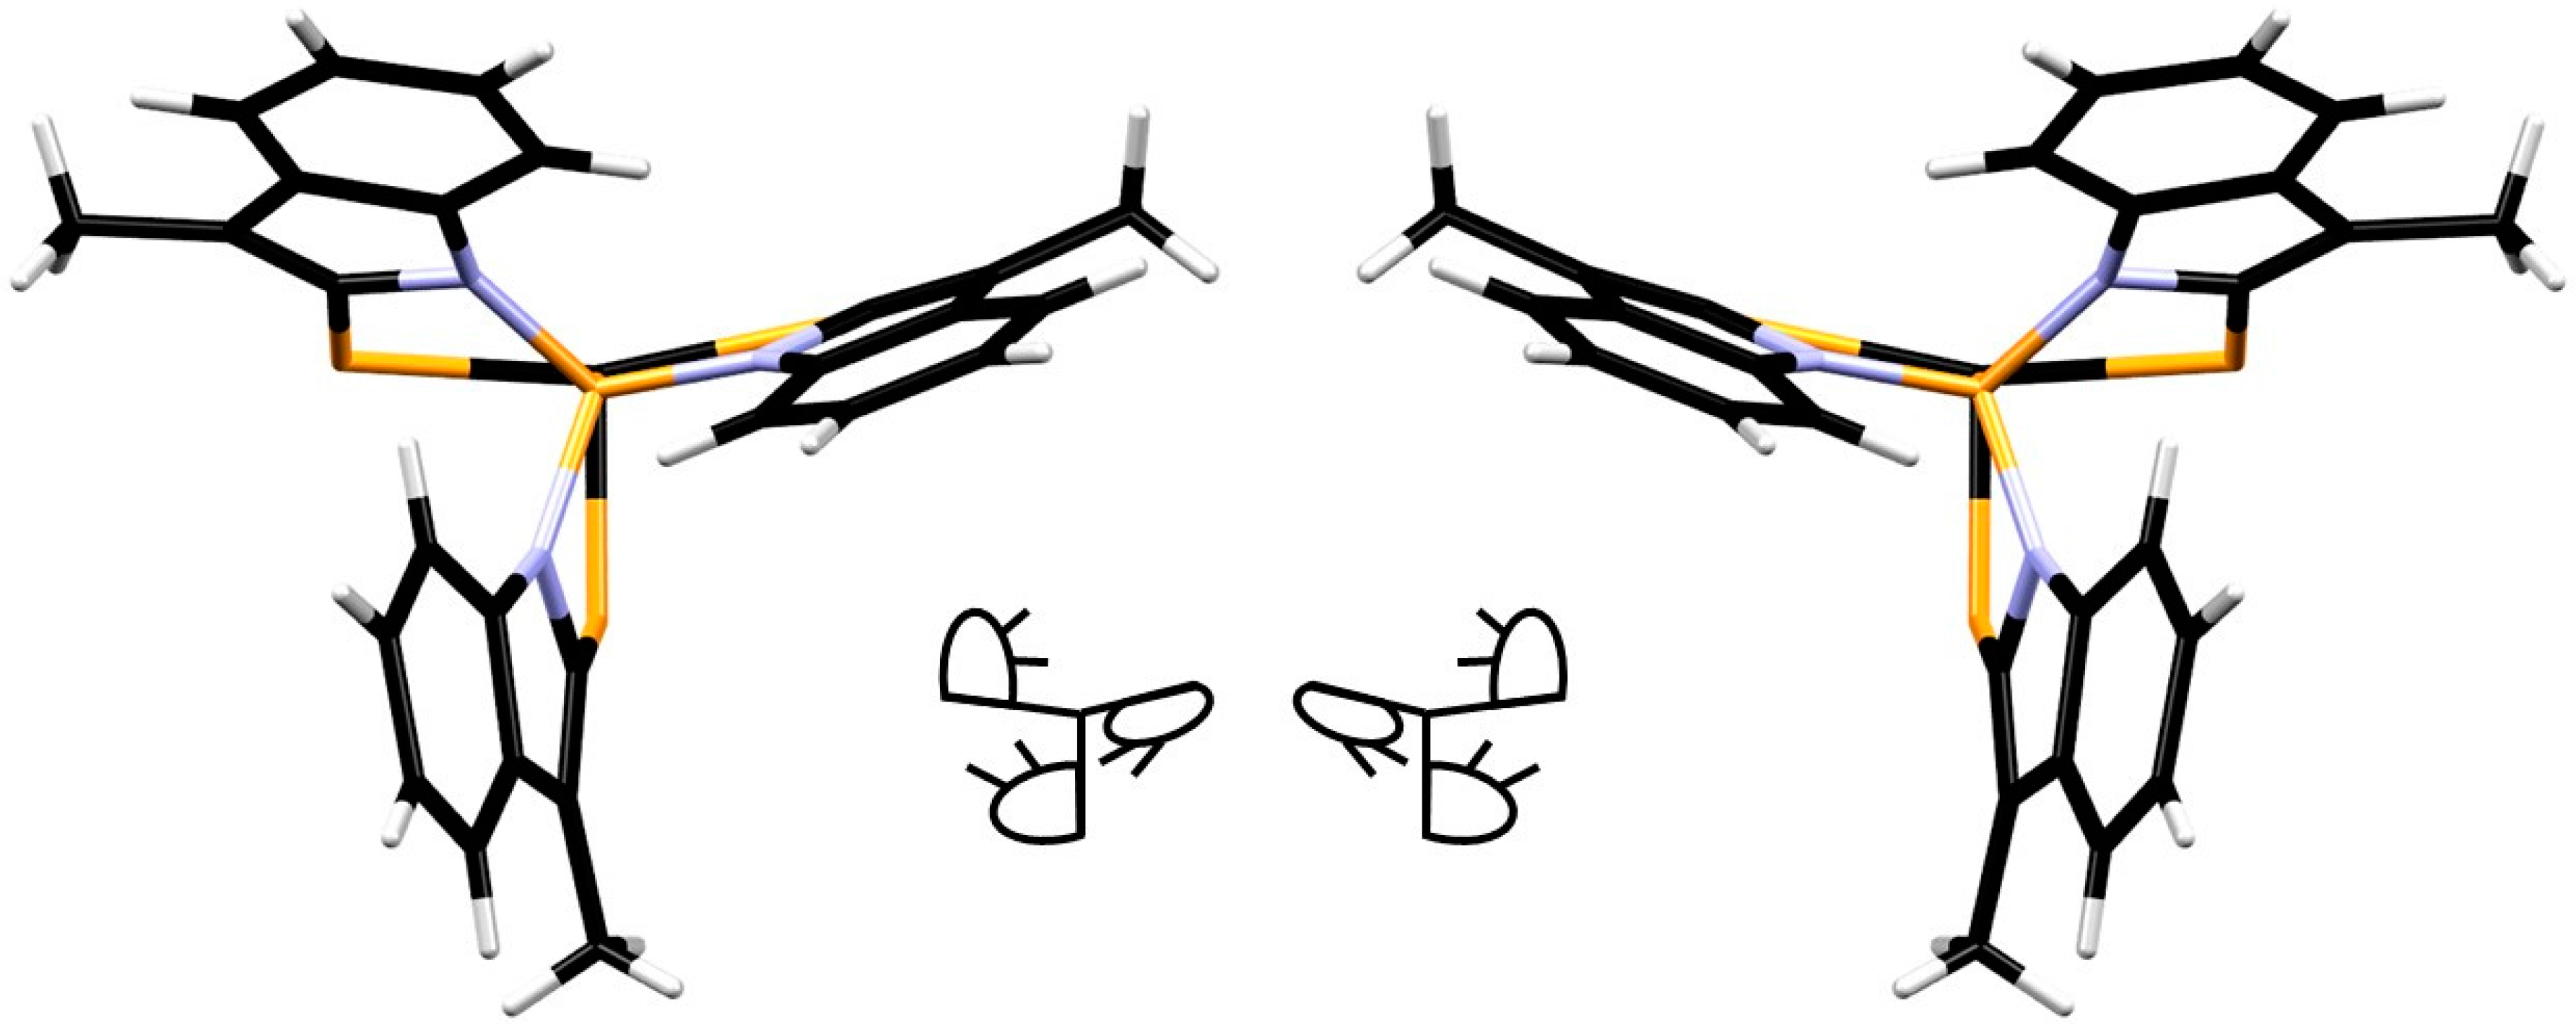
Figure 7) helps to understand the origin of the AX pattern, as the bottom view displays much more steric hindrance around the central phosphorus atom P4 (vide infra).
However, different than the
L1-based complexes, where the methyl groups are pointing towards the central phosphine (
Figure 5), in complex RuCl
2L2H, the bulkier phenyl rings of the indolyl moiety point towards the central phosphine (
Figure 8). From the crystal structure, it appears that these phenyl rings should encounter more hindrance toward inversion and it therefore seems likely that this process is associated with a high energy barrier in solution. As a result, the two phosphine atoms (P1 and P2,
Figure 7) in
trans position become inequivalent, leading to the observed AX pattern in the
31P NMR spectrum as a result of the P1–P2 coupling.
The crystal structure of RuCl
2L2H further reveals minor differences in the coordination around the ruthenium center compared with RuCl
2L1H (
Table 1). The P1–Ru, P2–Ru, and P3–Ru bond lengths become slightly larger (2.3295(8) Å, 2.4079(8) and 2.2913(8) Å), but the P4–Ru bond (2.1363(8) Å) shortens, which is in line with a more π-acidic character of the tris(amido)phosphine P4 atom.
Two-electron reduction of RuCl
2L1H under an N
2 atmosphere led to the formation of the RuN
2L1H complex, which features a characteristic infrared band corresponding to the coordinated N
2 at 2125 cm
−1 (
Table 2) [
15]. To explore if the electronic properties of the ligands
L1CF3,
L1OMe, and
L2H have an influence on the binding of N
2 to Ru
0, the corresponding N
2 complexes were generated in situ by reacting the ruthenium(+II) complexes with two equivalents of KC
8 (
Figure 9). The extent of activation of the N
2 bond was quantified by measuring the N≡N stretch frequency with infrared spectroscopy, as this is a direct measure for the ligand-dependent π-back-donation.
Table 2 shows the N
2 stretch frequencies of the Ru
0N
2L complexes.
As expected, the complex coordinated with the less electron-rich, CF
3 substituted ligand shows a band with a higher wavenumber in the infrared spectrum (2136 cm
−1), as a result of weaker metal-to-N
2 π-back-donation. The complex coordinated to the more electron-rich OMe substituted ligand shows a band at 2113 cm
−1, thus revealing stronger π-back-donation to N
2. Clearly, the peripheral phosphines induce measurable electronic effects on the
d-orbitals of the ruthenium center; the phosphines
cis to the N
2 ligand become stronger σ-donors and weaker π-acceptors in
L1OMe and vice versa for
L1CF3, which changes the binding properties of the N
2 ligand. Going from RuN
2L1H (2125 cm
−1) to the structural isomer RuN
2L2H (2136 cm
−1), the N
2 stretch frequency increases by 11 cm
−1. This is likely a result of the more π-acidic pivotal P-atom (atom P4,
Figure 10, top) of the tris(amido)phosphine donor ligand, which competes with the N
2 ligand for π-back-donation from the same metal
d-orbitals. Thus, substitution of the phosphine
trans to the N
2 ligand for a more π-acidic group leads to weaker π-back-donation of Ru to N
2. These results show that the electronic properties of the dinitrogen complexes can be tuned by ligand design, either by manipulating the substitutions on the donor atoms coordinated
cis to N
2 or by changing the π-acidity of the atom bound
trans to N
2.
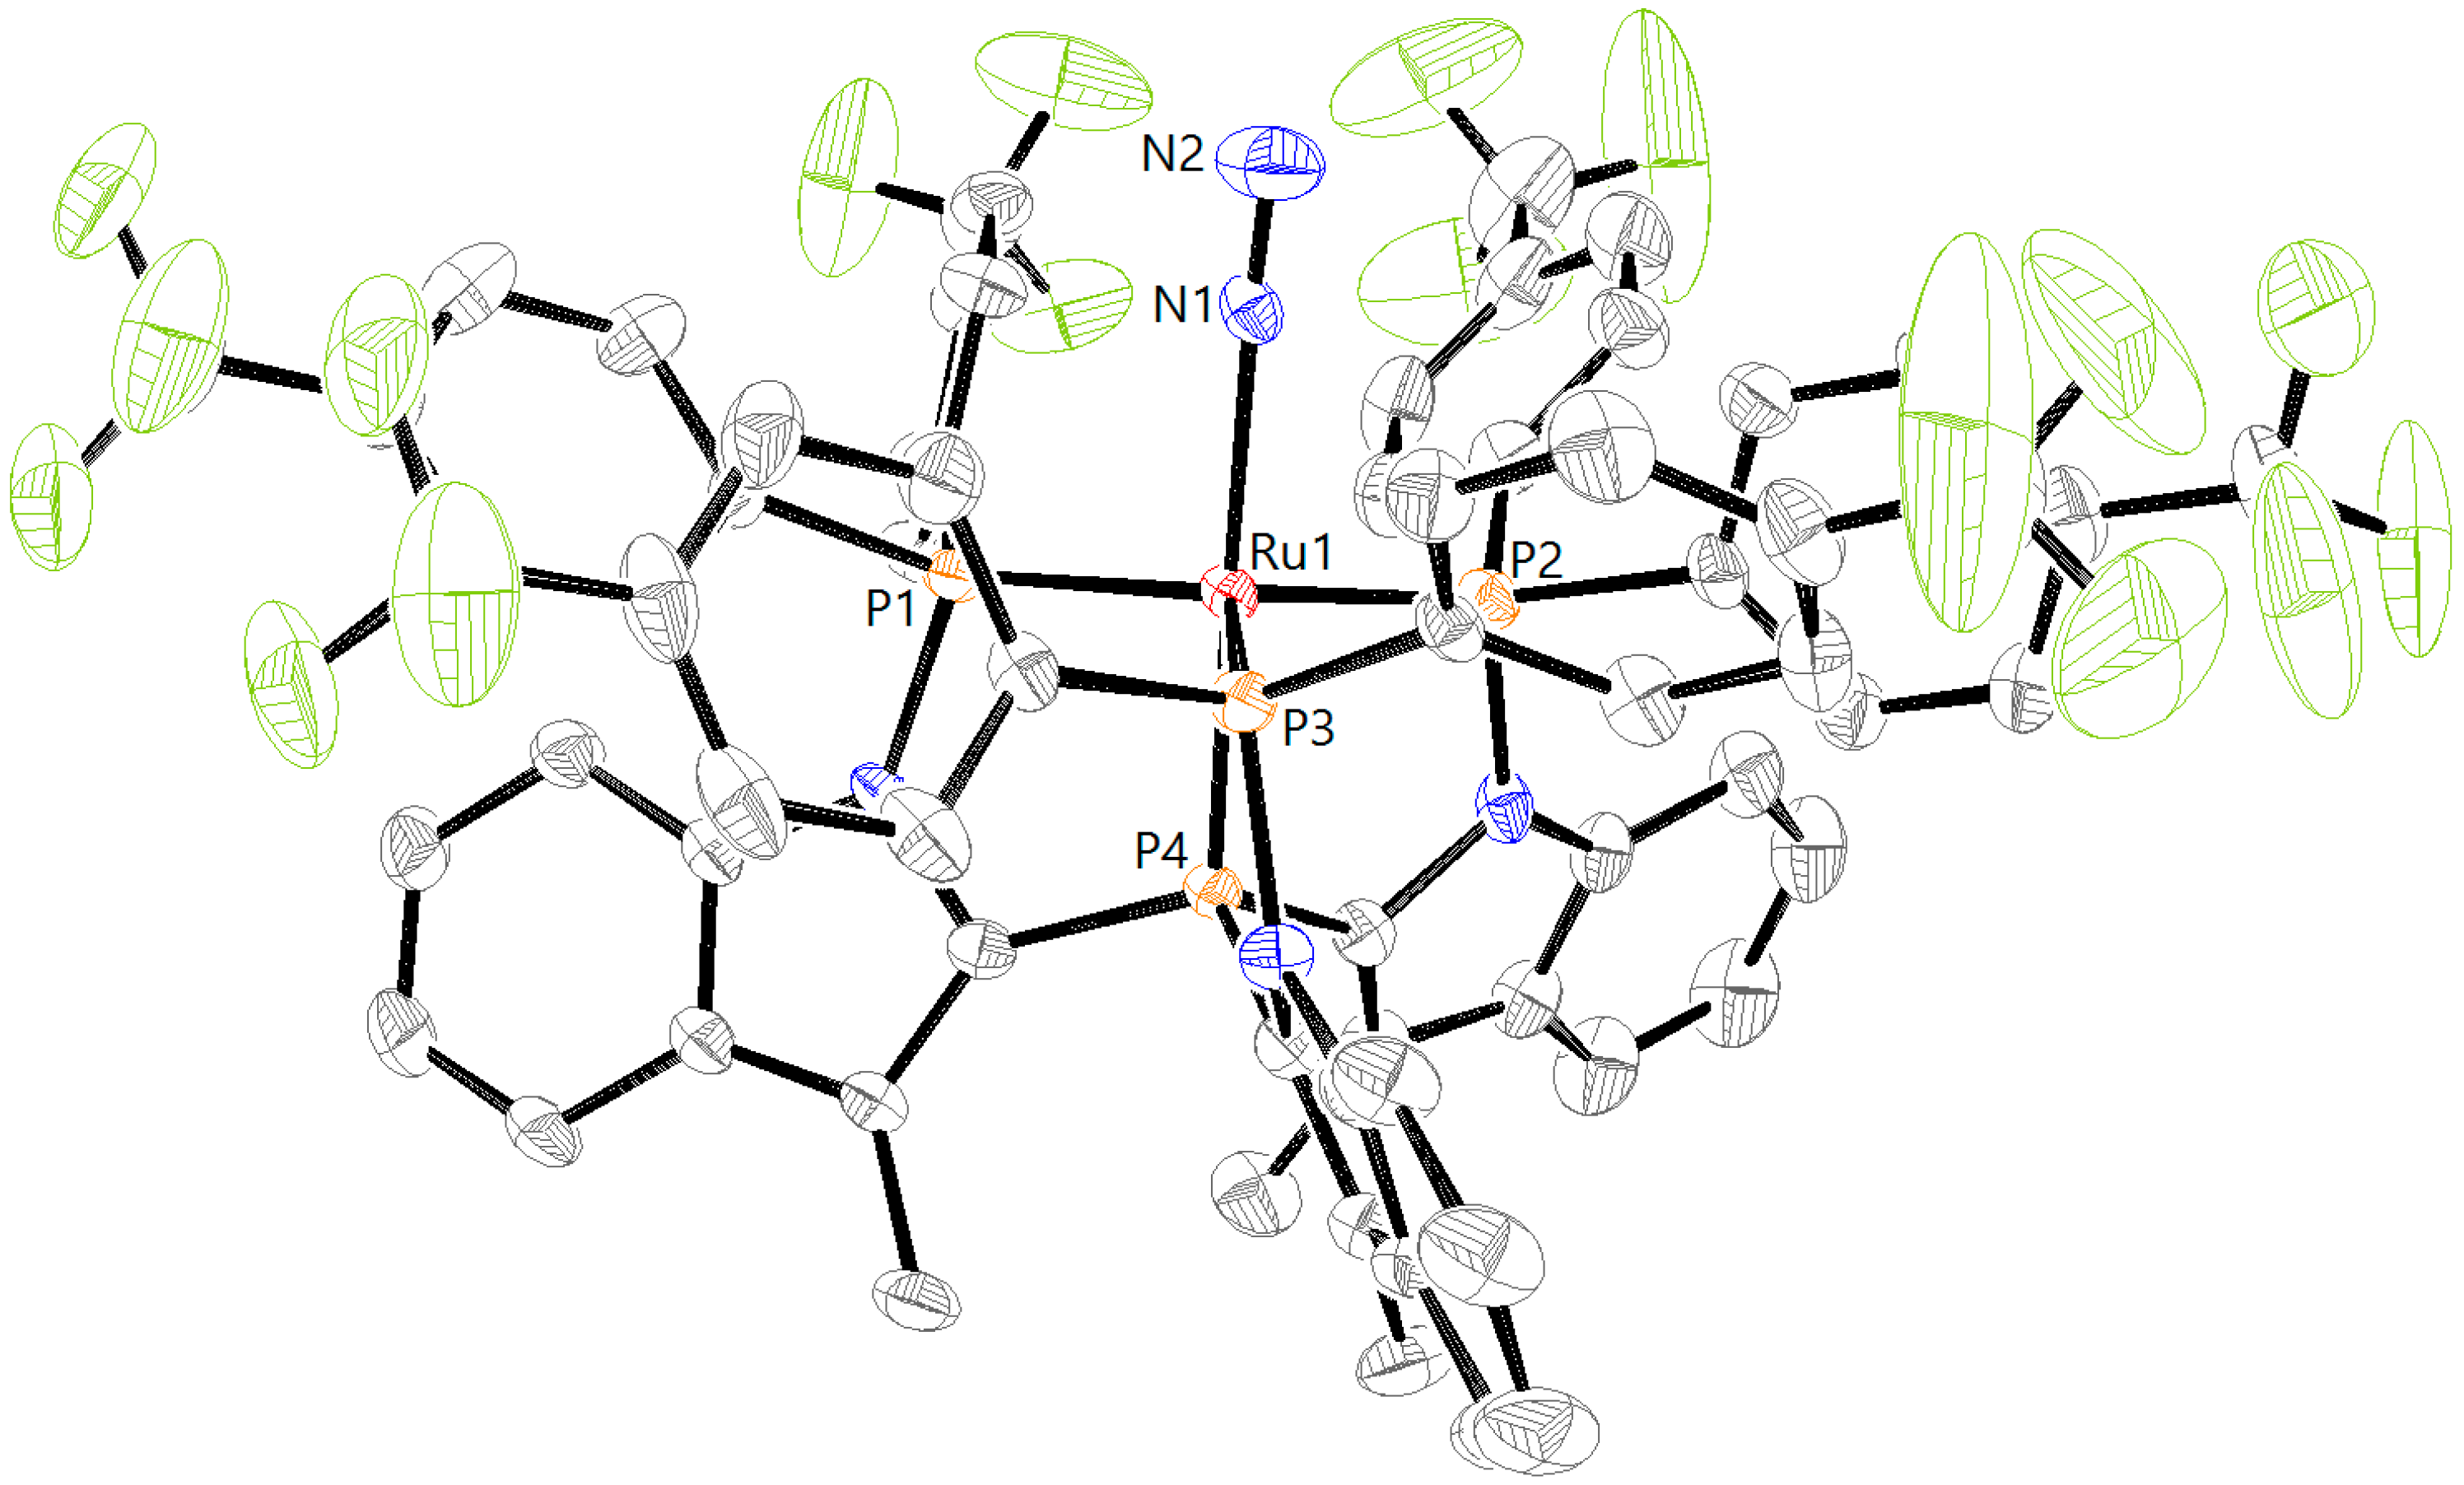
Layering of a THF solution of RuN
2L1CF3 with pentane resulted in the formation of single crystals suitable for X-ray diffraction (
Figure 10). Similar to the RuN
2L1H complex reported previously [
15], RuN
2L1CF3 also shows a trigonal bipyramidal geometry. The N≡N bond is slightly shorter in RuN
2L1CF3 (1.064(5)°) than in RuN
2L1H (1.085(5)°) (
Table 1), which is in accordance with the observed trend in the activation of the N
2 stretch frequency (
Table 2). In solution, these complexes remain trigonal bipyramidal, as judged from the occurrence of a doublet and a quartet in all
31P NMR spectra.
The dinitrogen ligand in all of these ruthenium complexes is weakly coordinating as judged by the relatively small IR-shifts compared to that of free N
2 (ν = 2359 cm
−1) (
Table 2). Preliminary experiments show no dinitrogen reduction to ammonia when complex RuCl
2L1H was subjected to excess reductant (KC
8) in the presence of acid ({H(OEt
2)
2}{BArF
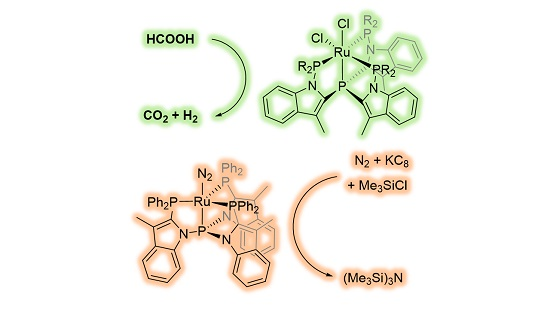
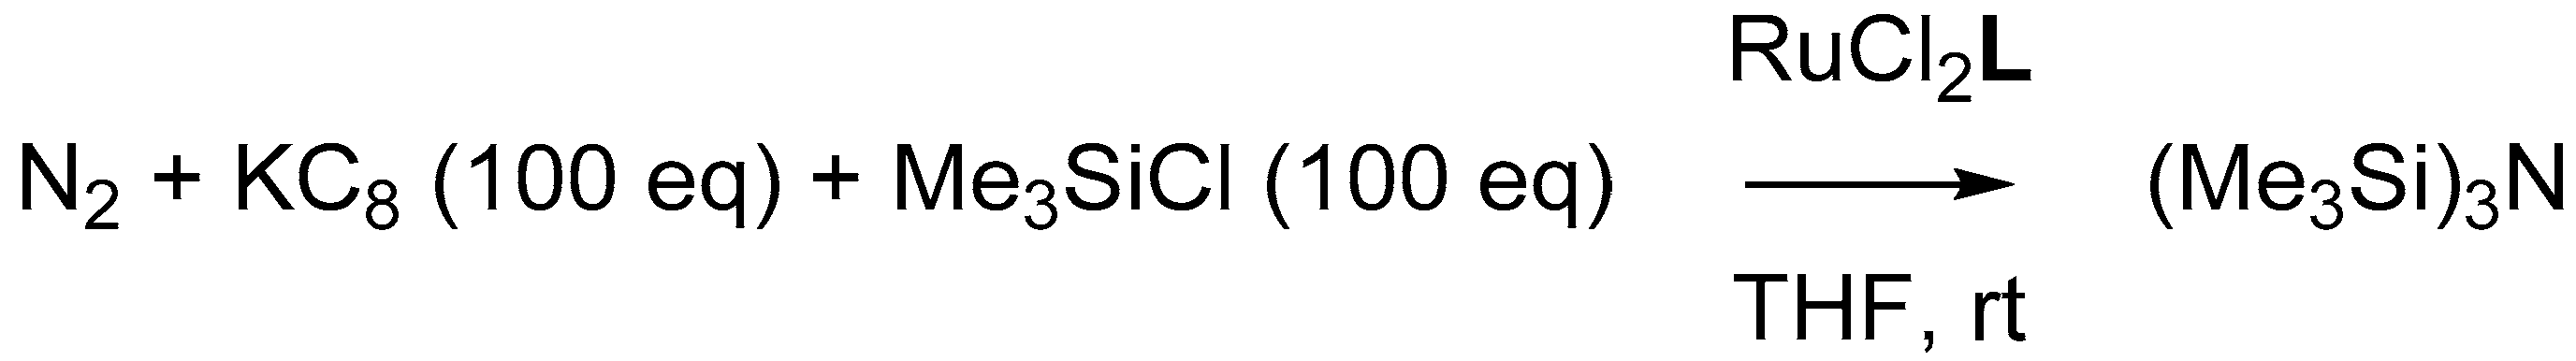
24}). Therefore, we set out to explore the reactivity of the tripodal tetraphosphine ruthenium(II) complexes for dinitrogen reduction with chlorosilanes (
Figure 11), which follows a different mechanism [
24].
A mixture of the RuCl
2L complexes with 100 equiv of KC
8 and 100 equiv of chlorotrimethylsilane in 10 mL THF at room temperature under an atmosphere of dinitrogen was stirred for 1 day, whereafter an aliquot of the reaction mixture was analyzed by GC. Modest yields of ~1.5 equivalents of (Me
3Si)
3N relative to Ru were detected, regardless of the complex used (
Table 3). The use of metallic sodium as reductant or longer reaction times did not increase the overall yield. In the absence of ruthenium only traces of (Me
3Si)
3N could be detected.
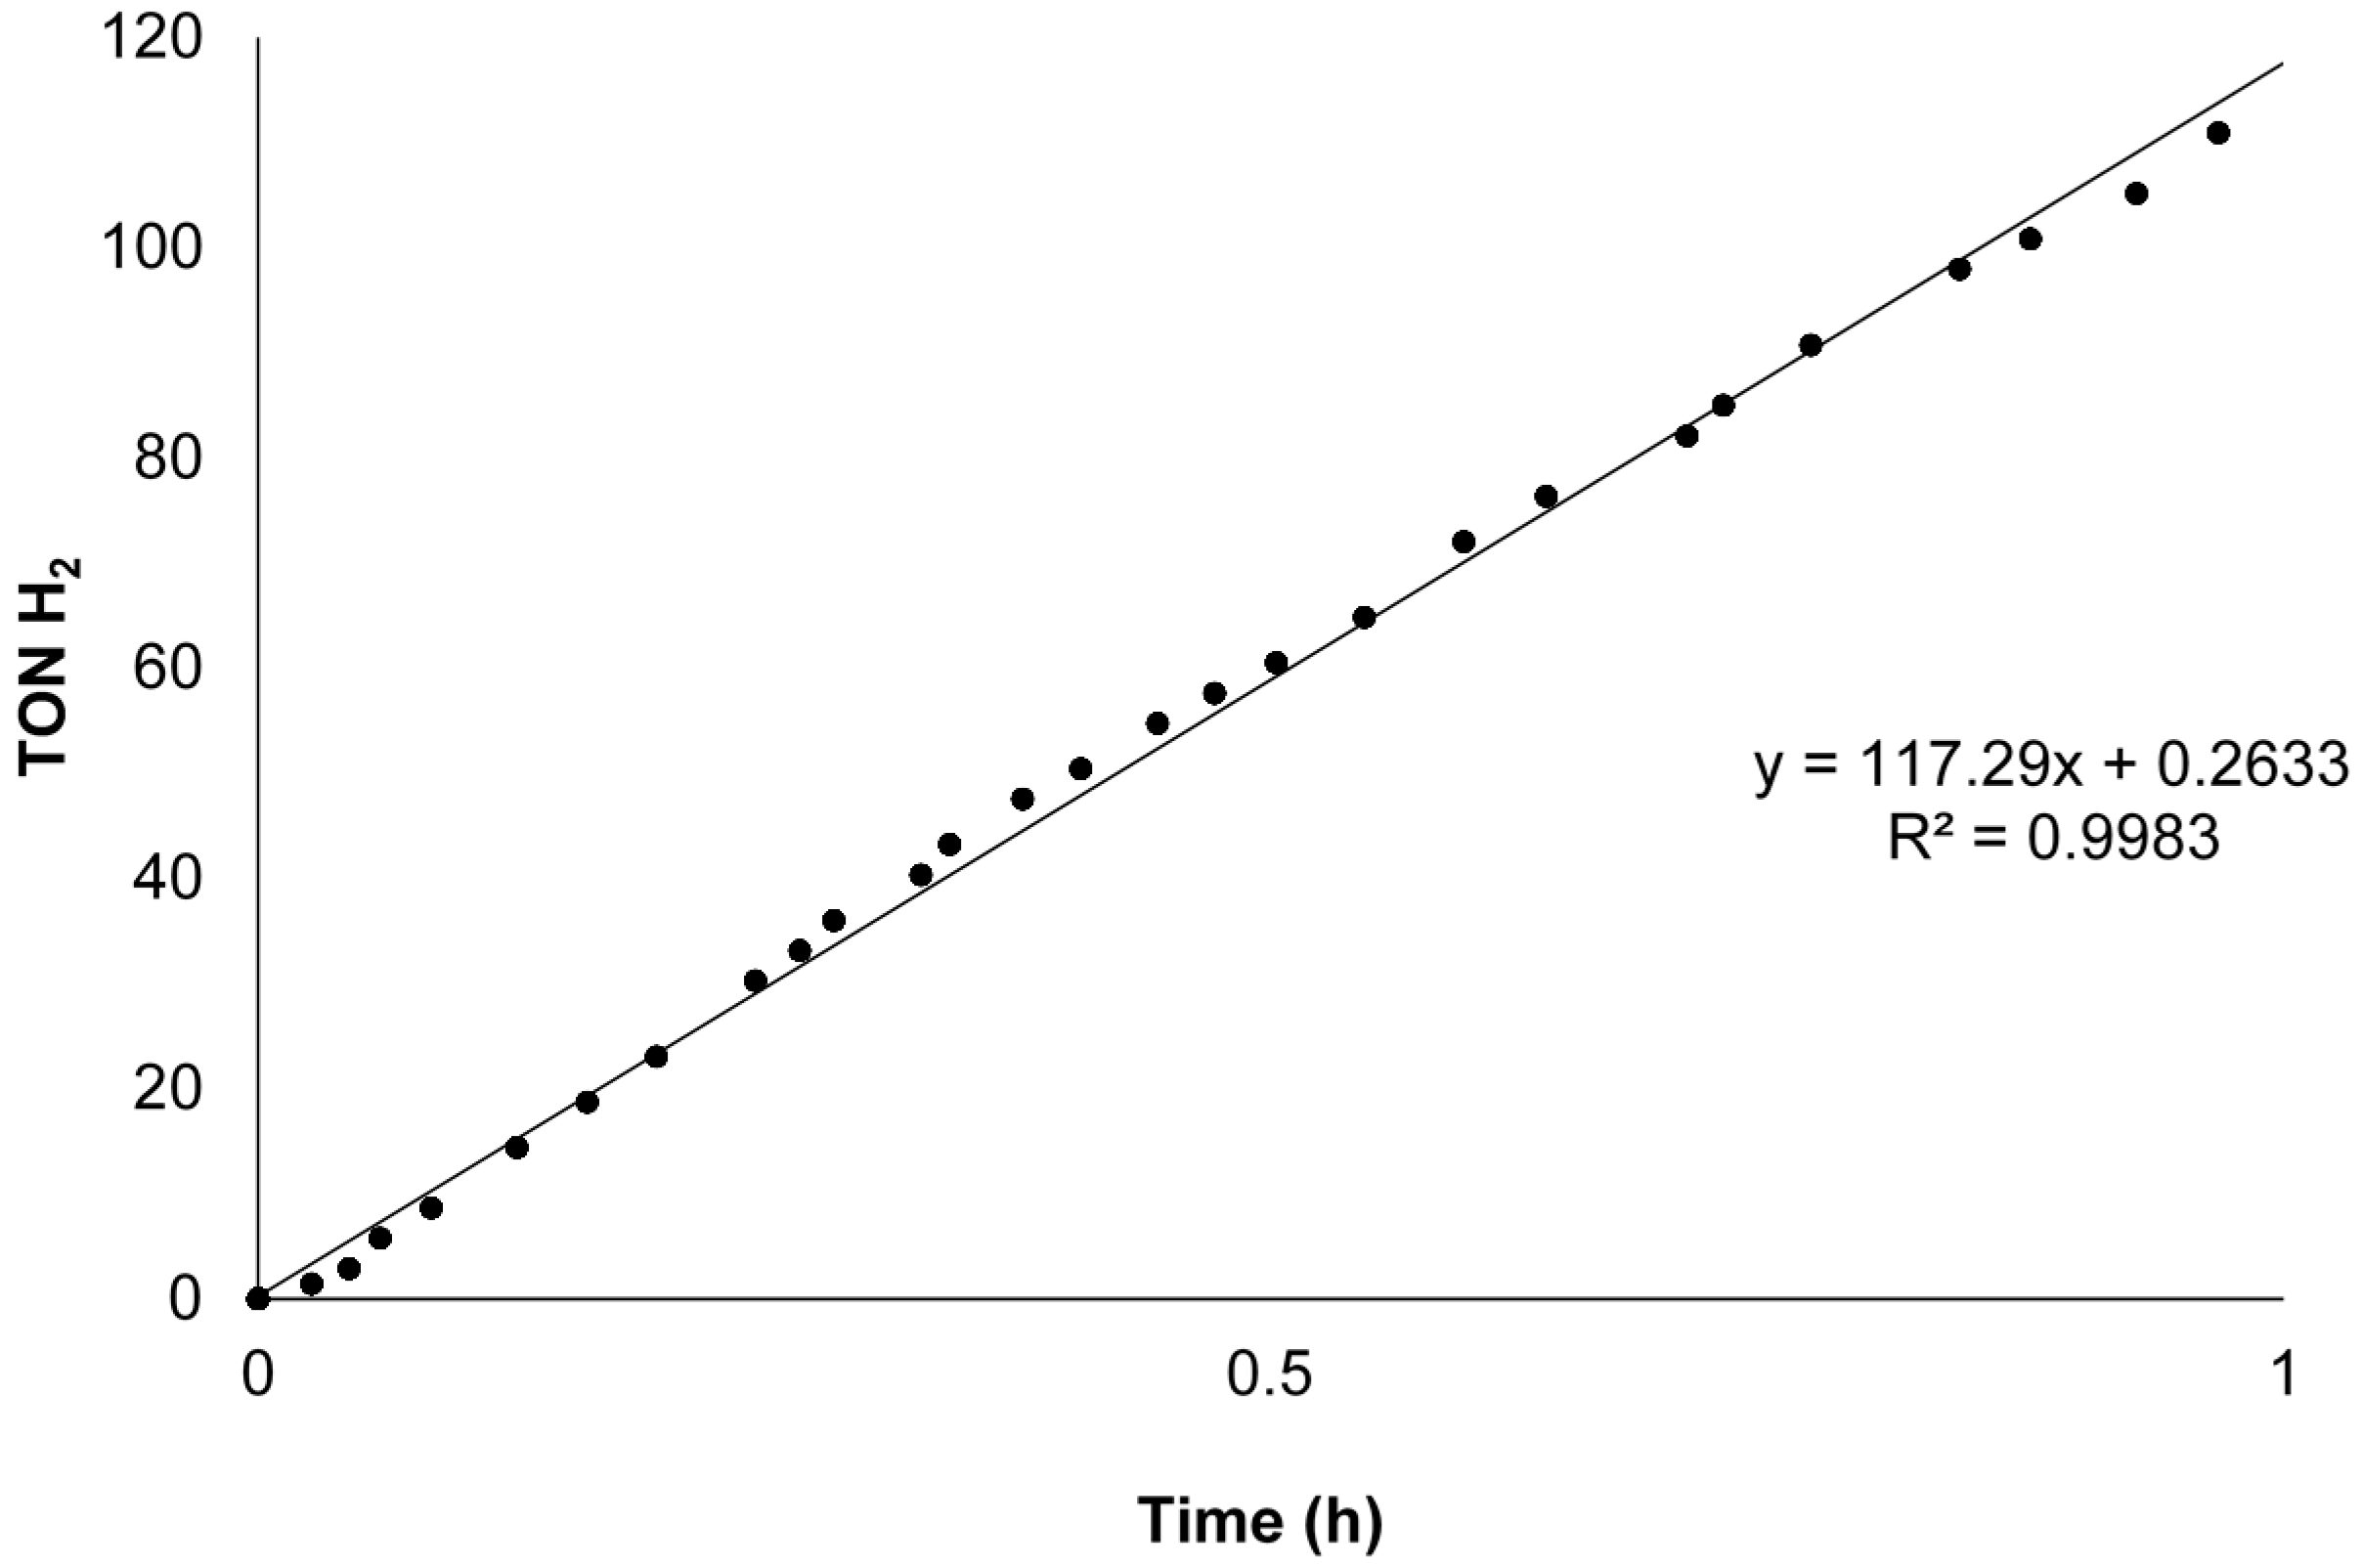
To gain more insight on the N
2 activation using these novel ruthenium complexes, the reduction was followed in time for complexes RuCl
2L1H and RuCl
2L2H, analyzing aliquots of the reaction mixture every hour. The reaction profile shows an incubation period of 1 h before product formation is observed (
Figure 12). Such an incubation period was also reported for various other iron and cobalt systems that were investigated for N
2 reduction under comparable conditions [
24,
25,
26], and which all showed similar activities for the formation of tris(trimethylsilyl)amine, regardless of the initial catalyst structure. It was speculated that the catalytically active species are generated after ligand dissociation from these iron and cobalt pre-catalysts. The exact nature of the reported catalysts could not be elucidated, as no dinitrogen-containing species were detected in these previous studies; however, test experiments pointed to a molecular nature of the catalyst [
24,
25].
Given that our complexes also show an incubation period and that electronic effects induced by ligand modification do not affect the catalytic activity, we speculate that our Ru-complexes are all pre-catalysts. To further test this hypothesis, we performed a catalytic reaction with [Ru(η6-benzene)Cl(μ-Cl)]2 in the absence of any tripodal indolyl-phosphine ligand under the same reaction conditions. Comparable amounts (1.29 equiv relative to Ru) of silylamine were formed in this control experiment, which indeed suggests ligand dissociation to activate the catalyst. Thus, these ligands cannot prevent metal leaching under the strongly reducing conditions used. Ex-situ 31P NMR spectroscopy of the RuCl2L1H catalytic system showed the absence of the signals of the ruthenium complex pointing to decomposition of the pre-catalyst under the applied conditions.
Next, we investigated the potential of these Ru-species in the catalytic dehydrogenation of formic acid (
Figure 13), given our interest in the reversible storage of H
2 into liquid fuels [
27,
28,
29,
30,
31,
32,
33]. For Ru-catalysts, formic acid dehydrogenation is accelerated when more electron-rich ligands are employed, as was shown by Himeda et al., who used a series of bipyridine ligands with various substituents at the
para position (–OH, –OMe, –Me, –CO
2H, and –H) [
34]. With the various substituted tripodal tetraphosphine ligands
L1 and
L2 in hand, we anticipated to observe similar effects for the corresponding complexes in the formic acid dehydrogenation. The RuCl
2L complexes are coordinatively saturated, which necessitates chloride abstraction using AgBF
4 to allow for substrate activation. Addition of 1.2 mmol of formic acid under nitrogen to a refluxing solution of a mixture of Ru-precatalyst (8.5 µmol) and AgBF
4 (17 µmol) in 3 mL THF pre-activated for 2 h (initial concentration of formic acid: 0.4 M, substrate to catalyst ratio: 140) led to gas production within 1–5 min. The reactions were monitored volumetrically with a gas burette for one hour (see experimental section for a schematic representation). A typical time profile of the dehydrogenation reaction with catalyst RuCl
2L1OMe is displayed in
Figure 14. The overall results of the different catalysts used in the dehydrogenation of formic acid are presented in
Table 4. The gas outlet was analyzed using gas chromatography, which confirmed presence of both CO
2 and H
2, while no traces of CO were detected (detection limit of the GC for carbon monoxide was δ = 10 ppm). Under the described conditions, all the substrate is used within less than 2 h. Subsequent addition of aliquots of formic acid allowed for continuation of the reaction without an observed decrease in activity for at least 6 h.
Complexes RuCl
2L1OMe, RuCl
2L1H, and RuCl
2L2H follow the same trend as noticed by Himeda [
34], with the most electron-rich complex RuCl
2L1OMe giving the highest activity (Turnover frequency (TOF) = 121 h
−1) followed by RuCl
2L1H (TOF = 76 h
−1) and the least electron-rich RuCl
2L2H (TOF = 33 h
−1). Interestingly, the RuCl
2L1CF3 complex (TOF = 124 h
−1) shows a comparable, even slightly higher activity to the electron-rich RuCl
2L1OMe complex. The reason for this unusual observation is currently not clear. The TOFs found for the RuCl
2L complexes in the formic acid decomposition reaction are relatively low compared to reported systems based on Ir and Ru. For instance TOF of 487,500 h
−1 was obtained with [Cp*Ir(L)Cl]Cl (L = 2,2’-bis-2-imidazoline) in neat HCOOH at 90 °C [
36], TOF of 24,000 h
−1 in boiling HCOOH/dioxane using [K(dme)
2][RuH(trop
2dad)] (trop
2dad = 1,4-bis(5H-dibenzo[a,d]cyclohepten-5-yl)-1,4-diazabuta-1,3-diene [
37], TOF of 4556 h
−1 with the more related Ru(H)
2(P4) complexes (P4 =
meso-1,1,4,7,10,10-hexaphenyl-1,4,7,10-tetraphosphadecane) in HCOOH/
N,N-dimethyloctylamine/propylene carbonate mixtures at 80 °C [
38]. However, these initial results show that the RuCl
2L complexes are active in the dehydrogenation of formic acid and that the reactivity can be steered by ligand modification. Further reactivity studies with these complexes should be performed to elucidate the mechanism of the reaction and to find the maximum capacities (stability, temperature, solvent) of these catalysts.
3. Materials and Methods
All reactions were carried out under an atmosphere of nitrogen or argon using standard Schlenk techniques or in the glovebox. Reagents were purchased from commercial suppliers and used without further purification. THF, pentane, hexane, and Et
2O were distilled from sodium benzophenone ketyl. These solvents were degassed using the freeze–pump–thaw method (three cycles) and stored under dinitrogen atmosphere. CH
2Cl
2 was distilled from CaH
2 under dinitrogen. NMR spectra (
1H,
31P, and
13C{
1H,
31P}) were measured on a Bruker DRX 500, Bruker AV 400, Bruker DRX 300, or on a Bruker AV 300 spectrometer (Bruker, Billerica, MA, USA). IR spectra (ATR mode) were recorded with a Bruker Alpha-p FT-IR spectrometer (Bruker, Billerica, MA, USA). High resolution mass spectra were recorded on a JEOL AccuTOF LC, JMS-T100LP mass spectrometer (JEOL, Tokyo, Japan) using cold electron-spray ionization (CSI) at −40 °C. GC measurements were performed on a Shimadzu GC-17A Gas Chromatograph (Shimadzu Corporation, Kyoto, Japan) with a Supelco SPB-1 fused silica capillary column. Tris-2-(3-methylindolyl)phosphine [
14],
L1H [
14],
L2H [
14] and potassium graphite (KC
8) [
39] were prepared according to literature procedures. Chlorobis[4-(trifluoromethyl)phenyl]phosphine (Alfa Aesar, Haverhill, MA, USA) and chlorobis[4-methoxyphenyl]phosphine (Sigma Aldrich, St. Louis, MO, USA) are commercially available chemicals and were used as received.
Tris-2-(3-methyl-N-di[4-(trifluoromethyl)phenyl]phosphinoindolyl)phosphine (L1CF3) was prepared in the analogous way to L1H using chlorobis[4-(trifluoromethyl)phenyl]phosphine: To a solution of tris-2-(3-methylindolyl)phosphine (1.9 g, 4.53 mmol) in THF (50 mL) was added n-BuLi (2.5 M in hexanes, 5.7 mL, 14.3 mmol) at −78 °C. The resulting solution was stirred for 1 h and chlorobis[4-(trifluoromethyl)phenyl]phosphine (3.5 mL, 14.0 mmol) was added. The reaction mixture was stirred for 16 h and allowed to warm slowly to room temperature. The resulting suspension was concentrated in vacuo and dissolved in CH2Cl2 (total amount of 50 mL including washing of the pads). The suspension was filtered through a pad of basic alumina and subsequently through a pad of SiO2. The solvent was removed under reduced pressure and resulted in a yellow foam. This yellow foam was purified by SiO2 chromatography using a gradient from pure hexane to 2% Et2O in hexane. Yield: 2.66 g (42%). 1H NMR (300 MHz CDCl3) δ: 7.44 (d, J = 8.6 Hz, 15H), 7.33–7.22 (m, 6H), 7.21–7.14 (m, 6H), 7.11 (t, J = 7.6 Hz, 3H), 6.93 (t, J = 7.8 Hz, 3H), 6.59 (d, J = 8.4 Hz, 3H), 2.14 (s, 9H). 19F NMR (282 MHz, CDCl3) δ = −60.78 ppm. 31P NMR (121 MHz, CDCl3) δ: 32.63 (d, J = 151.2 Hz, 3P), −76.09 (q, J = 151.6 Hz, 1P). 13C NMR (75 MHz, CDCl3) δ: 1140.28, 140.13, 139.77, 139.53, 139.36, 133.67, 131.91, 131.71, 131.62, 131.43, 129.27, 125.60, 125.53, 125.42, 125.33, 123.72, 122.00, 121.21, 119.50, 113.97, 9.94 ppm.
Tris-2-(3-methyl-N-di[4-methoxyphenyl]phosphinoindolyl)phosphine (L1OMe) was prepared in the analogous way to L1H using chlorobis[4-methoxyphenyl]phosphine: To a solution of tris-2-(3-methylindolyl)phosphine (2.20 g, 5.22 mmol) in THF (50 mL) was added n-BuLi (2.5 M in hexanes, 6.6mL, 16.44 mmol) at −78 °C. The resulting solution was stirred for 1 h and chlorobis[4-methoxyphenyl]phosphine (4.83 g, 17.23 mmol) dissolved in 10 mL THF was added. The reaction mixture was stirred for 3 days and allowed to warm to room temperature. The resulting suspension was concentrated in vacuo, dissolved in CH2Cl2 (total amount of 50 mL including washing of the pads) and filtered through a pad of basic alumina. Evaporation of the solvent and trituration with Et2O yielded a white solid which was recrystallized from vapor diffusion evaporation of Et2O to a concentrated THF solution. Washing with Et2O and drying under vacuum yielded the ligand in pure form. Yield: 4.03 g (67%). 1H NMR (300 MHz, (CD3)2CO): δ 7.46 (d, J = 7.9, 1.0 Hz, 3H), 7.39–7.27 (m, 6H), 7.20–7.07 (m, 6H), 7.05–6.95 (t, 3H), 6.94–6.81 (m, 12H), 6.77 (d, 6H), 3.74 (s, 18H), 2.01 (s, 9H) ppm. 31P NMR (122 MHz, (CD3)2CO): δ 36.83 (d, J = 166.0 Hz, 3P), −76.21 (q, J = 166.7, 1P) ppm. 13C NMR (75 MHz, (CD3)2CO) δ: 161.42, 141.33, 141.16, 134.63, 134.33, 134.06, 134.03, 127.95, 127.78, 127.58, 127.38, 124.22, 123.07, 120.83, 119.56, 115.06, 114.91, 114.86, 114.81, 114.77, 55.52, 9.87 ppm.
RuCl2L1CF3: L1CF3 (1.3732 g, 0.99 mmol) and [Ru(η6-benzene)Cl(μCl)]2 (249.3 mg, 0.50 mmol) were suspended in THF (4 mL) and toluene (8 mL) and stirred at 60 °C for 64 h. After cooling, the yellow precipitated complex was filtered, washed with toluene (1 × 2 mL) and pentane (3 × 3 mL), and dried overnight in the vacuum oven at 40 °C. Yield: 0.9914 g (64%) of a yellow solid. Recrystallization of the complex by layering a DCM solution with pentane at 5 °C gave crystals suitable for X-ray diffraction analysis. 1H NMR (300 MHz, CDCl3): δ 7.72 (dd, J = 10.8, 8.0 Hz, 3H), 7.59 (dt, J = 10.5, 5.3 Hz, 4H), 7.53–7.31 (m, 8H), 7.24 (t, J = 7.6 Hz, 4H), 7.18–7.01 (m, 7H), 6.99–6.81 (m, 7H), 6.11 (d, J = 8.5 Hz, 2H), 5.86 (d, J = 8.5 Hz, 1H), 2.93 (s, 6H), 2.69 (s, 3H) ppm. 31P NMR (122 MHz, CDCl3): δ 99.83 (dt, J = 31.5, 26.4 Hz, 1P), 78.90 (t, J = 26.3 Hz, 2P), 49.00 (dt, J = 30.3, 26.7 Hz, 1P) ppm. 13C NMR (75 MHz, CDCl3): δ 134.83, 134.73, 133.95, 133.82, 132.74, 132.63, 132.31, 132.18, 131.43, 131.31, 129.54, 128.96, 128.73, 128.49, 128.18, 128.05, 127.88, 127.74, 127.68, 127.58, 127.44, 126.91, 126.76, 126.44, 126.30, 125.15, 124.71, 124.64, 122.90, 122.45, 122.32, 120.76, 120.22, 117.80, 115.44, 115.00, 13.64, 12.27, 11.99. ppm. Mass Analysis (CSI) [C69H45Cl1F18N3P4Ru]+: calc: 1518.1024 found 1518.1067.
RuCl2L1OMe: L1OMe (1.02 g, 0.88 mmol) and [Ru(η6-benzene)Cl(μCl)]2 (227.9 mg, 0.45 mmol) were suspended in THF (4 mL) and toluene (8 mL) and stirred at 120 °C for 3 days leaving a pale brown solution. Upon cooling of the reaction mixture, an off-white solid precipitated. This solid was filtered and washed with hexane (3 × 3 mL) and dried overnight in the vacuum oven at 40 °C, resulting in the product as a brown-white solid. Yield: 1.15 g of an off-white solid (97.8%). 1H NMR (300 MHz, CDCl3): δ 7.66 (d, J = 8.0 Hz, 2H), 7.58 (d, J = 7.9 Hz, 1H), 7.44–7.32 (m, 4H), 7.32–7.24 (m, 1H), 7.24–7.02 (m, 10H), 6.89 (q, J = 7.8, 6.9 Hz, 4H), 6.77 (t, J = 7.8 Hz, 1H), 6.68 (d, J = 8.5 Hz, 4H), 6.28 (d, J = 8.5 Hz, 2H), 6.24 (d, J = 7.9 Hz, 2H), 6.12 (d, J = 8.5 Hz, 4H), 5.90 (d, J = 8.5 Hz, 1H), 3.70 (d, J = 1.8 Hz, 12H), 3.62 (s, 6H), 2.84 (s, 6H), 2.60 (s, 3H) ppm. 31P NMR (121 MHz, CDCl3): δ 107.24 (dt, J = 32.0, 26.0 Hz, 1P), 83.78 (t, J = 26.6 Hz, 2P), 54.51 (dt, J = 30.9, 26.9 Hz, 1P) ppm. 13C{1H,31P} NMR (75 MHz, CDCl3): δ = 159.95, 159.46, 139.85, 139.70, 135.39, 135.35, 135.27, 133.02, 132.98, 132.86, 123.72, 123.69, 121.47, 121.27, 120.20, 117.09, 113.38, 113.29, 112.88, 112.72, 112.03, 111.96, 111.89, 77.43, 77.00, 76.58, 54.90, 54.82, 54.79, 11.92, 11.68 ppm. Mass Analysis (CSI) [C69H63ClN3O6P4Ru]+: calc: 1290.2399 found: 1290.2400.
RuCl2L2H: L2H (587.3 mg, 0.60 mmol) and [Ru(η6-benzene)Cl(μ-Cl)]2 (150.1 mg, 0.30 mmol) were suspended in THF (3 mL) and toluene (6 mL) and stirred at 120 °C for 64 h. After cooling, 20 mL of hexane was added, which resulted in the precipitation of a yellow solid. The solid was filtered, washed with hexane (3 × 3 mL), and dried overnight in the vacuum oven at 60 °C. Yield: 477.5 mg (69.1%) of a yellow solid. Recrystallization of the complex by layering a DCM solution with pentane at 5 °C gave crystals suitable for X-ray diffraction analysis. 1H NMR (300 MHz, CDCl3): δ 7.90 (dd, J = 11.6, 7.7 Hz, 2H), 7.84–7.65 (m, 6H), 7.60 (d, J = 7.8 Hz, 1H), 7.53 (t, J = 9.3 Hz, 3H), 7.45 (d, J = 7.8 Hz, 1H), 7.37 (t, J = 7.6 Hz, 1H), 7.32–7.12 (m, 9H), 7.11–6.92 (m, 6H), 6.90–6.75 (m, 7H), 6.70 (d, J = 8.4 Hz, 1H), 6.36 (t, J = 8.4 Hz, 3H), 6.23 (dd, J = 7.5 Hz, 2H), 1.97 (s, 3H), 1.72 (s, 3H), 1.40 (s, 3H) ppm. 31P NMR (121 MHz, CDCl3): δ 144.43 (dt, J = 38.9, 37.8 Hz, 1P), 39.22 (dt, J = 45.0, 23.6 Hz, 1P), 24.70 (ddd, J = 328.6, 31.0, 21.1 Hz, 1P), 16.62 (ddd, J = 331.4, 39.7, 25.6 Hz, 1P) ppm. 13C NMR (75 MHz, CDCl3): δ 134.83, 134.73, 133.95, 133.82, 132.74, 132.63, 132.31, 132.18, 131.43, 131.31, 129.54, 128.73, 128.49, 128.18, 128.05, 127.88, 127.74, 127.68, 127.58, 127.44, 126.91, 126.76, 126.44, 126.31, 125.15, 124.71, 124.64, 122.90, 122.45, 122.32, 120.76, 120.22, 117.80, 115.44, 115.00, 13.64, 12.27, 11.99 ppm. Mass Analysis (CSI) [C63H51ClN3P4Ru]+: calc: 1110.1789; found: 1110.1779.
3.1. Reduction of RuCl2L to RuN2L
RuCl
2L (±17 µmol) and KC
8 (2–3 equiv) were transferred to a flame-dried Schlenk flask in the glovebox. THF (2 mL) was added and the suspension was stirred for two to three hours; after filtration, a red solution was obtained. Part of this solution was used for in-situ infrared spectrometry, part of the solution was used for in-situ
31P NMR analysis, and the rest of the solution was set for crystallization via slow diffusion evaporation of pentane. Applying this procedure to RuCl
2L1OMe led to formation of a purple solution after filtration, which did not show an infrared band after two hours. However, after one day, the solution turned more red and the corresponding infrared band could be detected. The infrared analysis of the thus obtained solutions yielded the corresponding infrared bands as given in
Table 2. The
31P-NMR analysis showed the presence of one doublet and one quartet, indicative of a symmetric species, which corresponds with the proposed trigonal bipyramidal geometry.
3.2. Catalysis: Dinitrogen Reduction
The catalyst (33 µmol) and KC8 (100 equiv) were transferred to a 100 mL flame-dried Schlenk flask equipped with a glass stirring bar in the glovebox. 10 mL of dry THF was added, followed by the addition of the chlorotrimethylsilane (100 equiv). The suspension was stirred overnight. A quantity of 10 µL of n-decane was added as internal standard, whereafter a filtered aliquot of the reaction mixture was measured on the Gas-GC.
3.3. Catalysis in Time: Dinitrogen Reduction
The same procedure as for the normal nitrogen reduction was used, adding the 10 µL of n-decane right away and taking a filtered aliquot of the reaction mixture every hour, which was subsequently measured on the Gas-GC.
3.4. Catalysis: Formic Acid Dehydrogenation
Hydrogen evolution was initiated by the addition of formic acid (45 μL, 1.2 mmol) to a solution of catalyst (±8.5 μmol) in refluxing THF (3 mL) in a 10 mL reaction flask equipped with a condenser. The gas was cooled via a condenser, with the outlet connected to a burette filled with water (
Figure 15). The displacement of the water level in the burette was measured in time. The second burette was also filled with water and used to compensate for pressure buildup, keeping the water levels at equal height. The results are shown in
Table 5.
TOF
H2 was calculated using Equation (1) [
40].
Vobs: measured gas volume displacement cylinder [mL]; Vm: molar gas volume: 24.49 [mL/mmol]; ncat: amount of catalyst [mmol].
3.5. X-ray Diffraction Analysis
Crystallographic data was obtained using a Bruker D8 Quest Eco diffractometer equipped with a Triumph monochromator. The intensities were integrated with the SAINT software package [
41]. Multiscan absorption correction and scaling was performed with
SADABS [
42]. The structure was solved with Intrinsic Phasing Methods using
SHELXT [
43]. Least-squares refinement was performed with
SHELXL 2013 [
44] against
F2 of all reflections. Non-hydrogen atoms were refined freely with anisotropic displacement parameters. All hydrogen atoms were located in difference Fourier maps and refined with a riding model. All structures have solvent-accessible voids filled with disordered solvent. Their contribution to the structure factors in the refinement was taken into account with the PLATON/SQUEEZE approach [
45] (
Table 6).
RuCl
2L1CF3: The structure contains voids (2544 Å
3 per unit cell) filled with disordered solvent molecules. Their contribution to the structure factors was secured by back-Fourier transformation using the SQUEEZE routine of the PLATON package [
45], resulting in 671 electrons per unit cell which corresponds to 16 disordered molecules of CH
2Cl
2 per unit cell. Alerts A and most Alerts B generated by the IUCr checkCIF program resulted from large displacement parameters of F atoms implying intense rotation of the CF
3 groups of the
L1CF3 ligand. Thirteen FCF reflections below θ-min were obscured by the beam-stop which generated Alert B.
RuCl
2L2H: The structure contains voids (1518 Å
3 per unit cell) filled with disordered solvent molecules. Their contribution to the structure factors was secured by back-Fourier transformation using the SQUEEZE routine of the PLATON package [
45], resulting in 503 electrons per unit cell which corresponds to 12 disordered molecules of CH
2Cl
2 per unit cell. Eleven FCF reflections below θ-min were obscured by the beam-stop which generated Alert B by the IUCr checkCIF program.
RuN
2L1CF3: The structure contains voids (2224 Å
3 per unit cell) filled with disordered solvent molecules. Their contribution to the structure factors was secured by back-Fourier transformation using the SQUEEZE routine of the PLATON package [
45], resulting in 514 electrons per unit cell which corresponds to 12 disordered molecules of pentane per unit cell. Alerts A generated by the IUCr checkCIF program resulted from large displacement parameters of F atoms implying intense rotation of the CF
3 groups of the
L1CF3 ligand. Thirteen FCF reflections below θ-min were obscured by the beam-stop which generated Alert B.

 ,
, 


