Article

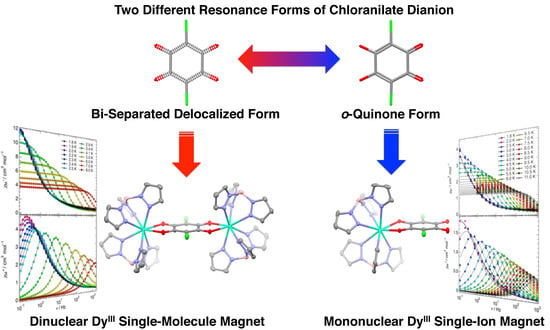
Field-Induced Slow Magnetic Relaxation of Mono- and Dinuclear Dysprosium(III) Complexes Coordinated by a Chloranilate with Different Resonance Forms

1
Department of Chemistry, Faculty of Science, Fukuoka University, 8-19-1 Nanakuma, Jonan-ku, Fukuoka 814-0180, Japan
2
Department of Chemistry, Graduate School of Science, Tohoku University, 6-3 Aramaki-Aza-Aoba, Aoba-ku, Sendai, Miyagi 980-8578, Japan
3
Advanced Institute for Materials Research (AIMR), Tohoku University, 2-1-1 Katahira, Aoba-ku, Sendai, Miyagi 980-8577, Japan
4
School of Materials Science and Engineering, Nankai University, Tianjin 300350, China
*
Author to whom correspondence should be addressed.
Submission received: 14 November 2017 / Revised: 15 December 2017 / Accepted: 28 December 2017 / Published: 30 December 2017
(This article belongs to the Special Issue Single-Molecule Magnets)

Abstract

:
We synthesized the dinuclear and mononuclear dysprosium(III) complexes [{Dy(Tp)2}2(Cl2An)]·2CH2Cl2 (1) and [Co(Cp)2][Dy(Tp)2(Cl2An)] (3), where Cl2An2− and Tp are the chloranilate and hydrotris(pyrazolyl)borate ligand, respectively. In addition, the magnitude of the magnetic coupling between the lanthanide centers through the Cl2An2− bridge has been probed through the synthesis of [{Gd(Tp)2}2(Cl2An)]·2CH2Cl2 (2), which is a gadolinium(III) analogue of 1. Complexes 13 were characterized by infrared (IR) spectroscopy, elemental analysis, single-crystal X-ray diffraction, and SQUID measurements. IR and single-crystal X-ray structural analyses confirm that the coordination environments of the lanthanide(III) centers in 1 and 3 are similar to each other; i.e., eight-coordinated metal centers, each occupied by an N6O2 donor set from two Tp ligands and one Cl2An2− ligand. The coordination geometries of the lanthanide(III) centers in 1 and 2 are distorted triangular dodecahedral, while that in the mononuclear complex 3 is square antiprismatic, where the Cl2An2− ligand takes the bi-separated delocalized form in 1 and 2, and the o-quinone form in 3. Alternating-current (AC) magnetic studies clearly reveal that both 1 and 3 exhibit field-induced slow relaxations of magnetization that occur via Raman and direct processes. Complexes 1 and 3 exhibit different spin relaxation behavior, which reflects the coordination geometry around each DyIII center and its nuclearity, as well as the molecular packing in the crystal lattice. Although the magnetic analysis of 2 revealed negligible magnetic coupling, Cl2An2− bridges with small biases may form in the dinuclear complexes, which play roles in the spin relaxation dynamics through dipolar interactions.

Graphical Abstract

1. Introduction

Molecule-based nanomagnets, such as single-molecule magnets (SMMs) [1,2,3,4,5,6,7] and single-ion magnets (SIMs) [8,9,10,11,12], are strictly low-dimensional magnetic systems that exhibit magnetization blocking at low temperatures, quantum tunneling of magnetization (QTM) [13], and quantum coherence [14,15]. Accordingly, SMMs have attracted a great deal of interest as promising candidates for quantum computing [16], high-density information storage [17], and more recently, molecular spintronic materials [18,19,20,21].
Early surveys of SMMs were focused on polynuclear cluster complexes with high nuclearities due to the realization of large ground spin states [2]. However, it is rather difficult to combine a large ground spin state with a large magnetic anisotropy, since the entire molecular symmetry in a polynuclear cluster complex often increases with an increasing nuclearity, leading to a small magnetic anisotropy as a consequence. Therefore, the realization of polynuclear cluster complexes with large spin ground states and large magnetic anisotropies is still a significant challenge.
On the other hand, more recent frontline SMMs studies have tended to focus on enhancing magnetic anisotropy, rather than augmenting ground spin states, which is a much more informative method for increasing the blocking temperature and the activation energy barrier. From these perspectives, studies into SMMs, and more recently, SIMs, based on trivalent lanthanide (LnIII), ions have proceeded at a rapid pace because of their significant magnetic anisotropies that arise from both spin-orbit coupling and crystal-field splitting, where crystal-field splitting is normally much smaller than spin-orbit coupling in LnIII ions [22,23]. Hence, it is very important to investigate small changes in ligand-field strength associated with the coordination geometries of LnIII ions. However, the relationship between the coordination geometry of the LnIII ion and the slow magnetic relaxation of SMMs or SIMs is still largely unclear, because it is very difficult to systematically control the coordination geometries and the ligand-field strengths of LnIII ions. We noticed that chloranilate (Cl2An2−) is a promising organic ligand for investigating the above-mentioned LnIII-based SMMs or SIMs. The dianionic form of Cl2An2− has a delocalized π system with resonance structures that are represented by p-quinone, o-quinone, tetraquinone, and bi-separated delocalized forms (Scheme 1) [24,25]. The coordination geometry and the ligand-field strength of the central LnIII ion can be fine-tuned by combining Cl2An2− with a suitable ancillary ligand, while maintaining a similar coordination environment. Hydrotris(pyrazolyl)borate (Tp) ligands are scorpionate ligands [26] that exhibit hard σ-donating characteristics and have been used to stabilize trivalent LnIII metal centers. Thus, we chose Tp as the ancillary ligand.
Based on the above idea, we successfully synthesized mononuclear and dinuclear dysprosium(III) complexes bearing the Cl2An2− ligand and Tp as auxiliary ligands, in which the Cl2An2− ligand adopts the o-quinone and bi-separated delocalized forms, respectively. Comparisons of the spin-relaxation dynamics for the mononuclear and dinuclear complexes will aid in our understanding of dipolar interactions mediated by bridging Cl2An2− ligands in dinuclear complexes. Herein, we report the syntheses, single-crystal X-ray structures, and detailed magnetic properties of two types of complexes, namely [{Dy(Tp)2}2(μ-Cl2An2−)]·2CH2Cl2 and [Co(Cp)2][Dy(Tp)2(Cl2An2−)], which display slow magnetic relaxations under small static direct-current (DC) magnetic fields.

2. Results and Discussion

2.1. Syntheses and Characterizations

The [{Ln(Tp)2}2(μ-Cl2An2−)] dinuclear complexes (1: Ln = Dy; 2: Ln = Gd) are readily formed by the reaction of 4 equiv. of KTp and 1 equiv. of Na2Cl2An with 2 equiv. of the corresponding lanthanide chloride salt in water. The subsequent slow diffusion of hexane into a concentrated CH2Cl2 solution of 1 gave purple rod-shaped crystals, with two CH2Cl2 solvates per dinuclear unit, suitable for single-crystal X-ray diffraction studies [27]. On the other hand, reaction of 1 with 1 equiv. of cobaltocene (Co(Cp)2, Cp = cyclopentadienide) in a N2-filled glovebox led to the formation of the mononuclear [Co(Cp)2][Dy(Tp)2(Cl2An2−)] complex (3); 3 crystallized without any solvent molecules. Therefore, to the best of our knowledge, complexes 13 are the first heteroleptic systems containing the Cl2An2− and Tp ligands. Infrared (IR) spectroscopy provides complementary information to that obtained by single-crystal X-ray studies with respect to structural features (Figure 1). Complexes 1 and 2 have similar masses (162.5 amu for 1 and 157.25 amu for 2), so large differences in their IR spectra were not observed, although some peaks are shifted. The IR absorptions associated with the bridging Cl2An2− ligand in both 1 and 2 are typified by predominant C–Cl and C–O vibrations at ~850 and 1528 cm−1, respectively. In contrast, 3 has three characteristic absorption bands centered at 833, 1540, and 1643 cm−1. The first two absorption bands are assigned to C–Cl and C–O vibrations, while the third absorption band is considered to correspond to C=O vibrations. This result is a promising indication that the Cl2CA2− ligand in 3 is in the o-quinone form [28]. Furthermore, the presence of the ancillary Tp ligands in 13 is confirmed by characteristic absorptions in their IR spectra at approximately 2470 cm−1 (c.f., KTp, νB–H = ~2440 cm−1) [29].

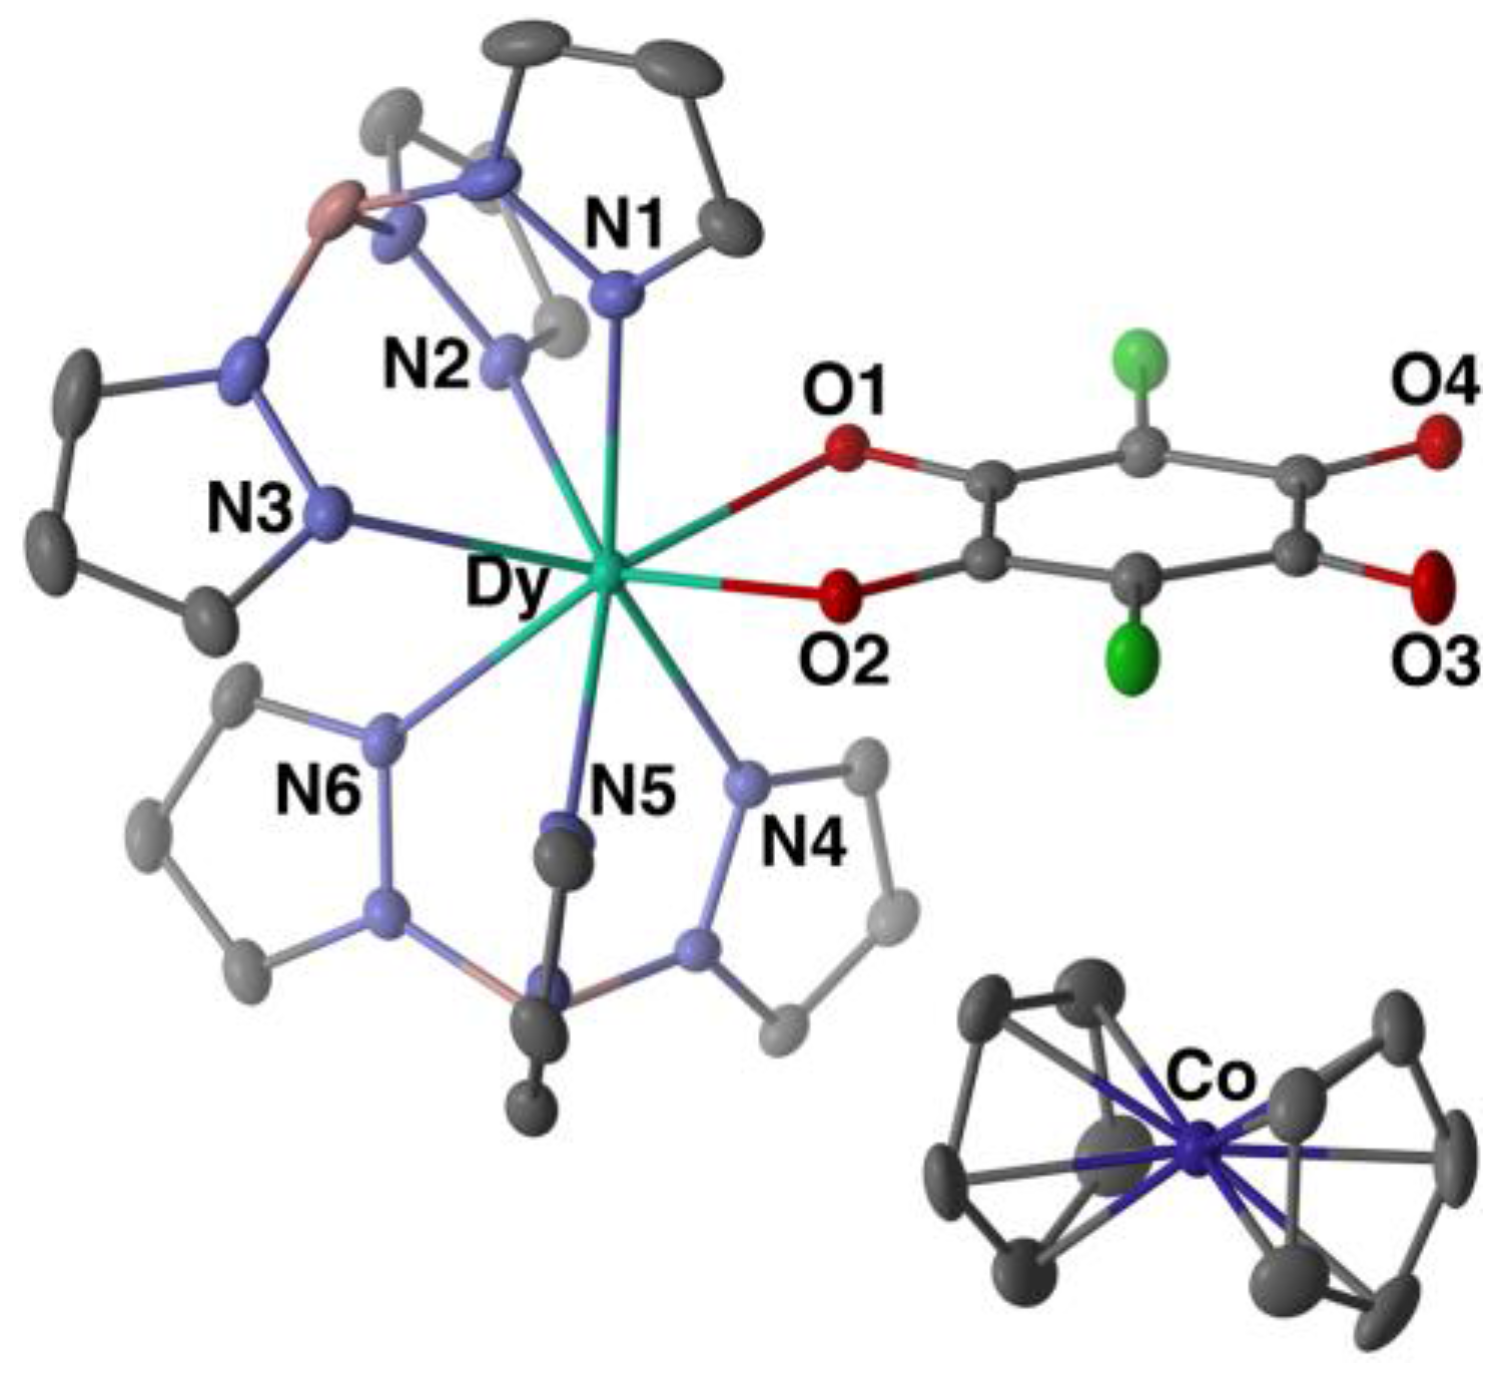
2.2. Molecular Structure Descriptions

The molecular structures of neutral dinuclear complexes 1 and 2 are isostructural and belong to the monoclinic P21/n space group (No. 14) (Figure 2). Both 1 and 2 are centrosymmetric complexes with two LnIII centers bridged by a bis-bidentate Cl2An2− ligand; consequently, only half of the dimer unit is unique. The coordination environments around the LnIII centers in 1 and 2 are eight-coordinated with six N atoms from the two Tp capping ligands, and two O atoms from the Cl2An2− bridge. The eight-coordinate LnIII centers adopt slightly distorted triangular dodecahedral geometries based on continuous shape measures (CShMs) [30,31] of 0.785 for 1 and 0.831 for 2.
The bond distances within the rings of quinoidal ligands, such as Cl2An2−, bound to metal ions provide strong information about the electronic structures of the ligands (Scheme 1). The o-quinone form is usually found in mononuclear complexes through terminal bidentate coordination modes, whereas the bi-separated delocalized form is often found in polynuclear complexes and coordination polymers through bis-bidentate coordination modes. The C–O bond distances in the Cl2An2− ring of 1 are 1.255(2) Å and 1.259(2) Å , while the similar distances in 2 are 1.258(4) Å, and 1.261(4) Å. The C–C bond distances are 1.393(3) Å, 1.396(3) Å, and 1.534(2) Å for 1, and 1.389(5) Å, 1.393(5) Å, and 1.537(4) Å for 2. These values confirm that the Cl2An2− bridging moieties in complexes 1 and 2 adopt the bi-separated delocalized forms, which also is strongly supported by the IR data. The respective intramolecular LnIII···LnIII distances through the Cl2An2− bridges are 8.6622(5) Å for 1 and 8.7042(5) Å for 2. In addition, the shortest intermolecular Ln···Ln distances of 8.7398(5) Å for 1 and 8.9781(5) Å for 2 are comparable with the intramolecular distances.
The anionic mononuclear complex 3 cocrystallized with [Co(Cp)2]+ in its crystal lattice, and was found to belong to the monoclinic P21/c space group (No. 14) (Figure 3). The coordination environment around the DyIII center of the anionic monomer 3 is structurally similar to those in dimers 1 and 2, differing only slightly in bond distances and angles. The eight-coordinate DyIII center features a distorted square antiprismatic geometry, according to the CShM value of 1.116, in which the two square faces are defined by N1, N5, N9, and O1, and N3, N7, N11, and O2. The Cl2An2− moiety of 3 acts as a terminal capping ligand, unlike in dimers 1 and 2. Hence, the resonance structure of Cl2An2− in the anionic monomer 3 differs significantly from those in 1 and 2 (vide supra). Indeed, the Cl2An2− C–O ring bond distances in 3 are 1.275(3) Å, 1.275(3) Å, 1.228(3) Å, and 1.234(3) Å, while the C–C bond distances are 1.376(4) Å, 1.382(4) Å, 1.419(4) Å, 1.427(4) Å, 1.519(3) Å, and 1.563(4) Å. These values clearly indicate both single and double-bond character. The Cl2An2− moiety in complex 3 is therefore in the o-quinone form. Finally, each anionic monomer in 3 is well separated in the crystal lattice, with closest intermolecular DyIII···DyIII distances of 9.5145(4) Å.

2.3. Magnetic Properties

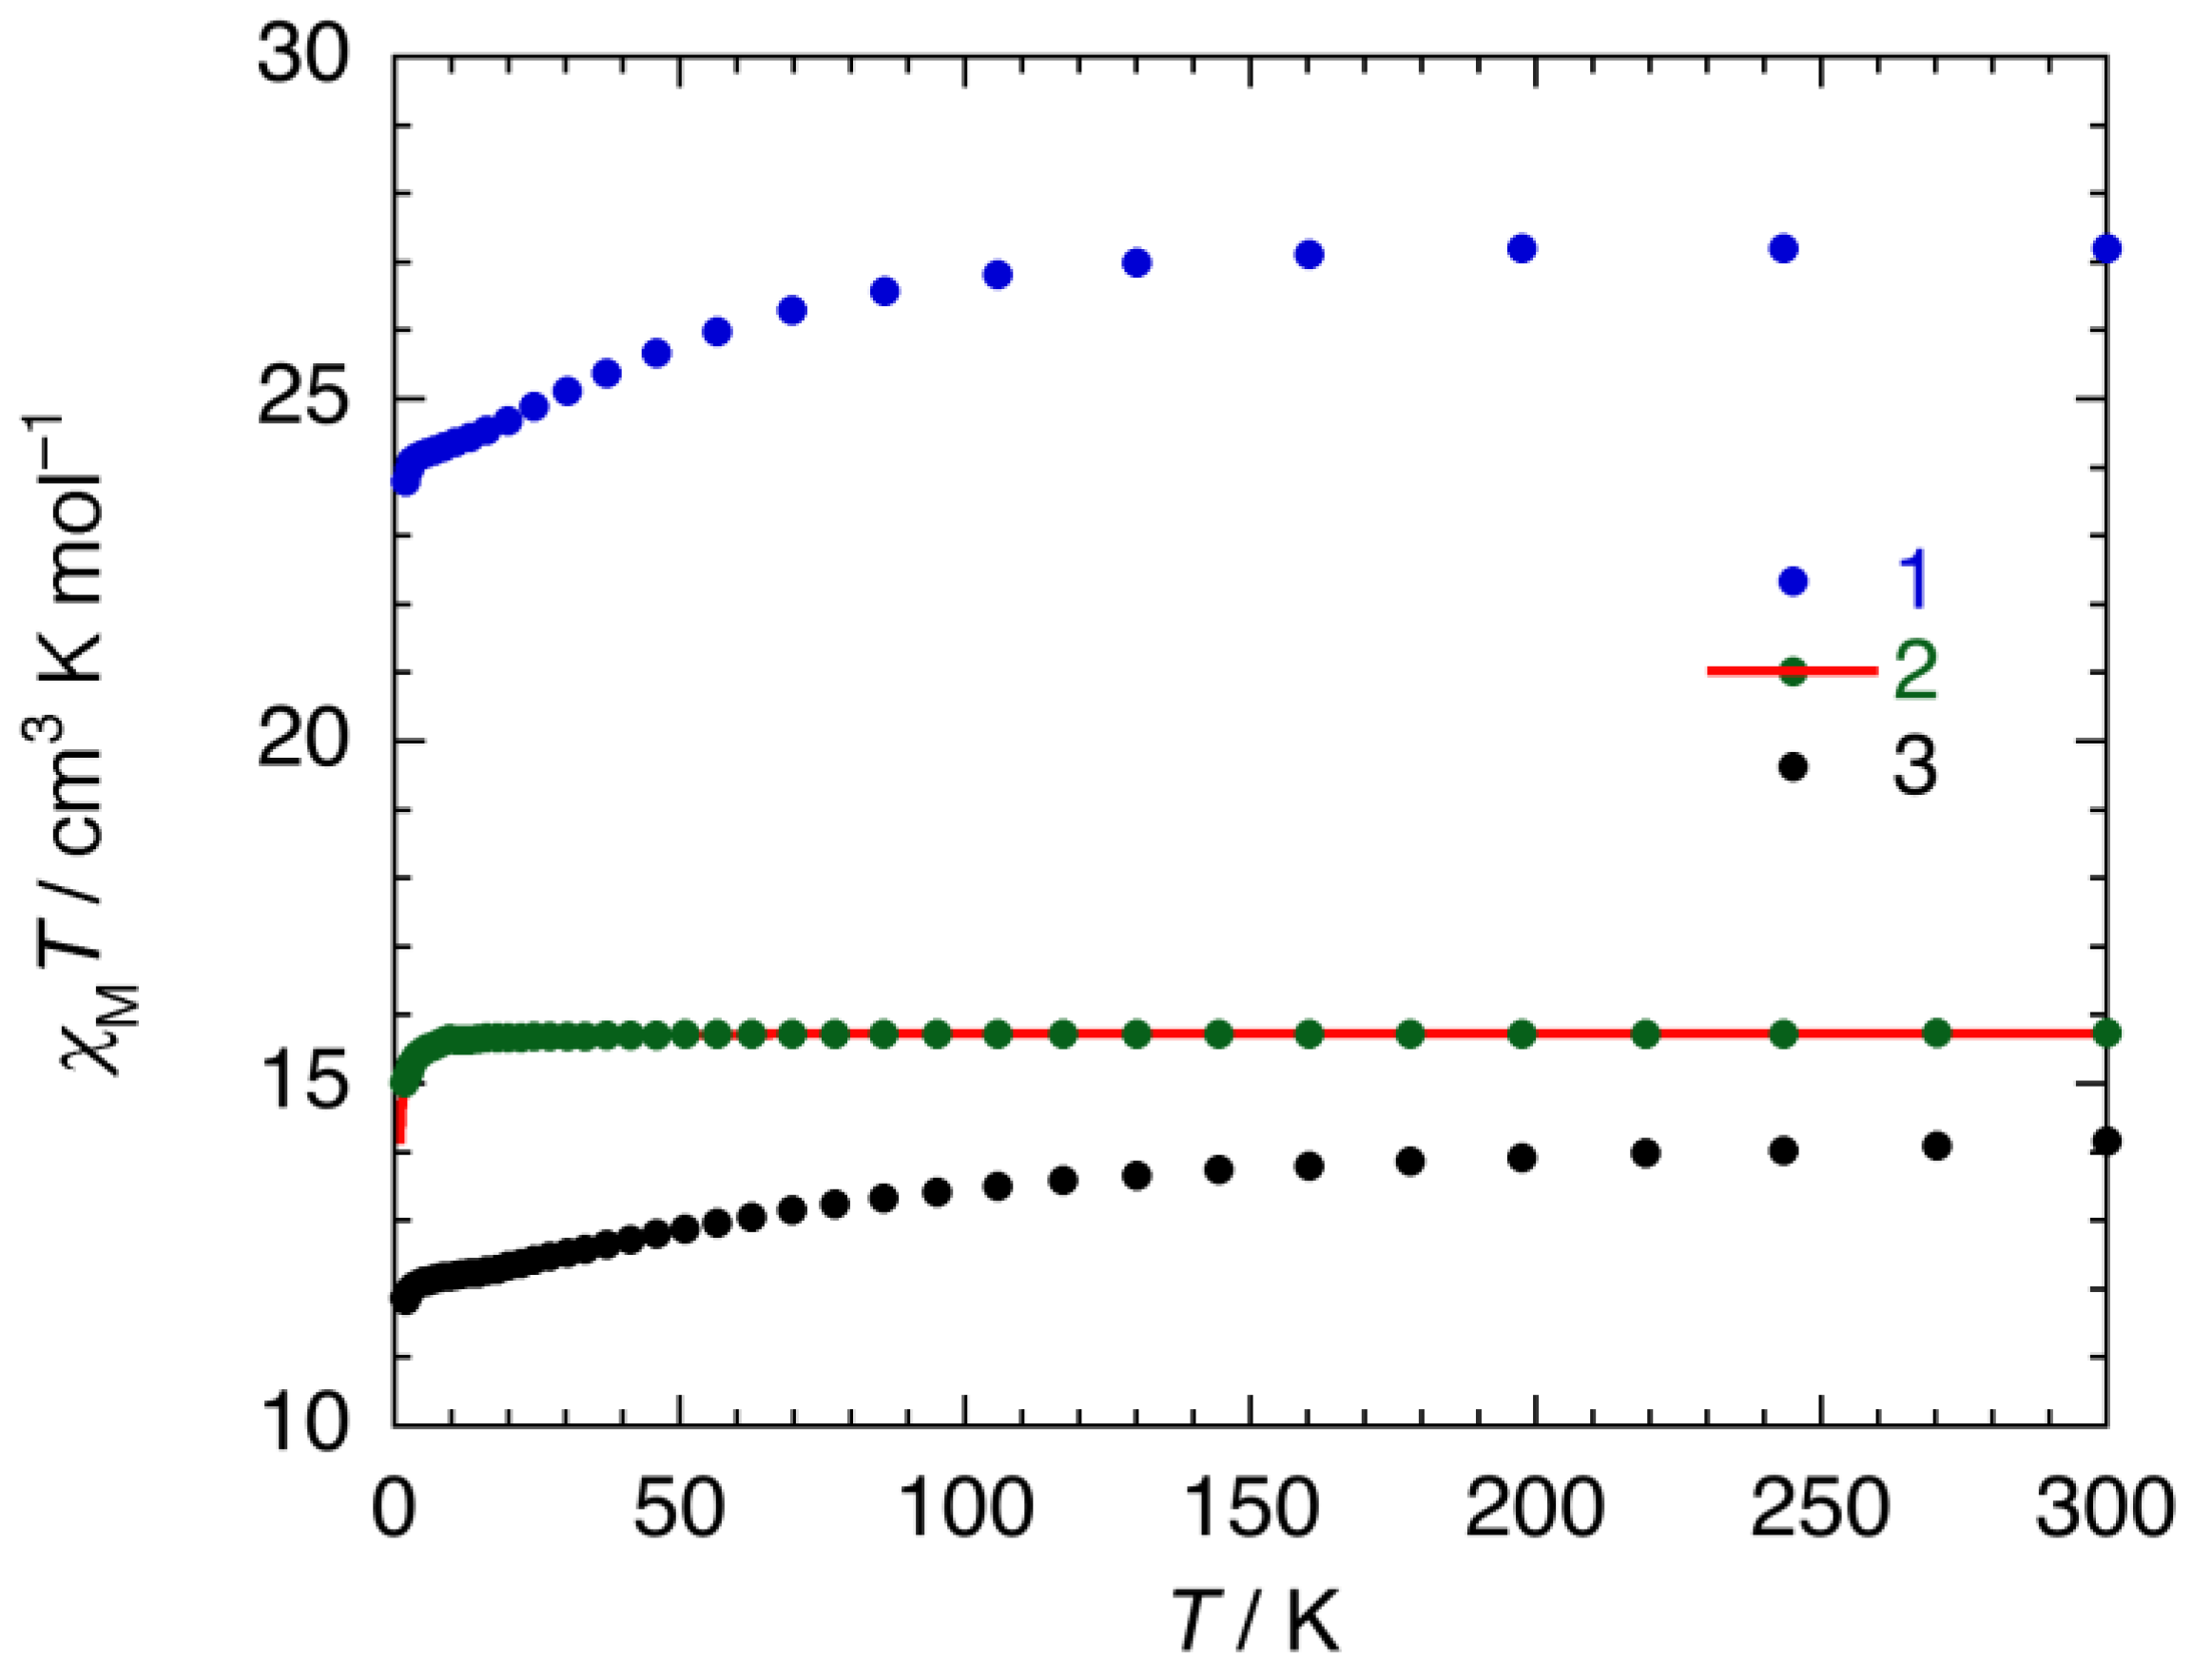
2.3.1. Static Magnetic Properties

DC magnetic susceptibility (χM) measurements on 1 were carried out in the 1.8–295 K temperature (T) range in an applied 0.1 T DC field (Figure 4). The value of χMT at 295 K for 1 was determined to be 28.29 cm3·K·mol−1, which is in good agreement with the expected value of 28.34 cm3·K·mol−1 for two uncoupled DyIII ions (6H15/2 with g = 4/3). The χMT value remained constant over the 100–300 K T range, below which it decreased smoothly to a value of 23.83 cm3·K·mol−1 at 1.8 K, due to the depopulation of excited Stark sublevels in the crystal-field state. The magnetization (M) of 1 increased rapidly with an increasing magnetic field (H) to 7 T (M = 10.55 μB) without saturation at 1.8 K, indicating very strong magnetic anisotropy (Figure S1, Supplementary Materials). Moreover, no hysteresis was observed for 1 above 1.8 K using a conventional SQUID. The detailed determination of the magnetic-exchange coupling constant (J), i.e., magnitude and sign (ferromagnetic or antiferromagnetic), of a polynuclear Ln complex is difficult because of its complicated 4f electronic structure. In contrast, the electronic structure of the GdIII ion contains a half-filled 4f orbital system, leading to no orbital angular momentum, and can be analyzed as a simple spin-only case (8S7/2 with g = 2). Hence, the qualitative magnitude of J for 1 can be indirectly determined from that of the GdIII analogue (2). T-dependent χMT measurements were performed in the 1.8–300 K T range in an applied DC magnetic field of 0.05 T (Figure 4). The χMT value of 2 was determined to be 15.75 cm3·K·mol−1 at 300 K, which corresponds to the spin-only value of two uncoupled GdIII ions with g = 2.00; the χMT value remained constant to 10 K. Further lowering of the temperature to 1.80 K lowered the χMT value to 15.02 cm3·K·mol−1. Furthermore, the H-dependent isothermal M data at 1.8 K for 2 show a steady increase with increasing magnetic field, reaching saturation at a value of 14.0 μB at 7 T (Figure S1, Supplementary Materials). The magnetic behavior of 2 is the result of the competition between antiferromagnetic exchange between the GdIII centers via the Cl2An2− bridge, and single-ion anisotropy arising from the GdIII ion. To determine whether intermolecular isotropic magnetic exchange or single-ion magnetic anisotropy dominates, plots of χMT vs. T, and M vs. H for 2 were constructed using the spin Hamiltonian given by Equation (1):
H ^ = H ^ HDVV + H ^ ZFS + H ^ Zeeman = 2 J Gd 1 - Gd 2 S ^ Gd 1 S ^ Gd 2 + 2 D Gd [ S ^ Gd ,   z 2 S Gd ( S Gd + 1 ) 3 ] + 2 E Gd ( S ^ Gd ,   x 2 S ^ Gd ,   y 2 ) + g μ B S ^ T H
where SGd1 and SGd2 are the spin operators for GdIII ions (S = 7/2), JGd1–Gd2 is the isotropic magnetic exchange coupling constant between two GdIII centers, DGd and EGd are the axial and rhombic zero-field splitting (ZFS) parameters that are associated with an S = 7/2 GdIII ion, respectively, g is the isotropic g factor, and μB is the Bohr magneton. This model fitted the χMT vs. T plot well over the entire 1.8 to 300 K temperature range, and the M vs. H plot at 1.80 K yielded JGd1–Gd2/kB = −0.0066 K, DGd/kB = 0.17 K, and EGd/kB = 1.1 × 10⁻⁵ (≈ 0) K, with g = 2.00 (Figure 4 and Figure S1, Supplementary Materials). The calculated g factor is close to the spin-only value, and a negligible antiferromagnetic interaction between the two GdIII centers through the Cl2An2− bridge, and a large ZFS contribution (|D| >> |J|) were found for 2. Except for organic radical bridging ligands, magnetic interactions between paramagnetic LnIII centers via common organic bridging ligands are well-known to be very weak in general, because 4f orbitals are shielded by outer 6s and 5d orbitals. The two GdIII centers in 2 are also well-separated by a diamagnetic spacer, namely the Cl2An2− bridge (vide supra). Therefore, the small calculated J value might be meaningless. As an alternative, we subsequently attempted to fit the magnetic data for 2 by considering only single-ion anisotropy with the mean-field approximation (zJ′), as given by Equation 2:
H ^ = H ^ ZFS + H ^ Zeeman + H ^ MFA = 2 D Gd [ S ^ Gd ,   z 2 S Gd ( S Gd + 1 ) 3 ] + 2 E Gd ( S ^ Gd ,   x 2 S ^ Gd ,   y 2 ) + g μ B S ^ T H z J S ^ T S ^ T
This model also fitted the χMT vs. T plot well over the entire 1.8 to 300 K temperature range, and the M vs. H plot at 1.80 K provided DGd/kB = 0.18 K, EGd/kB = 1.8 × 10⁻⁴ (≈ 0) K, and g = 2.00 with a negligible zJ′/kB value (~ −10−5 K). Hence, the χMT value for 3 at 300 K is 14.16 cm3·K·mol−1, which is in good agreement with that of the free DyIII ion (6H15/2 with g = 4/3). The χMT product gradually decreased with decreasing T, and finally reached a minimum value of 11.87 cm3·K·mol−1 at 1.8 K. This magnetic behavior is ascribable to the thermal depopulation of the crystal-field state. The M vs. H plot of 3 at 1.8 K displays significant magnetic anisotropy and does not reach saturation up to 7 T (M = 5.10 μB).

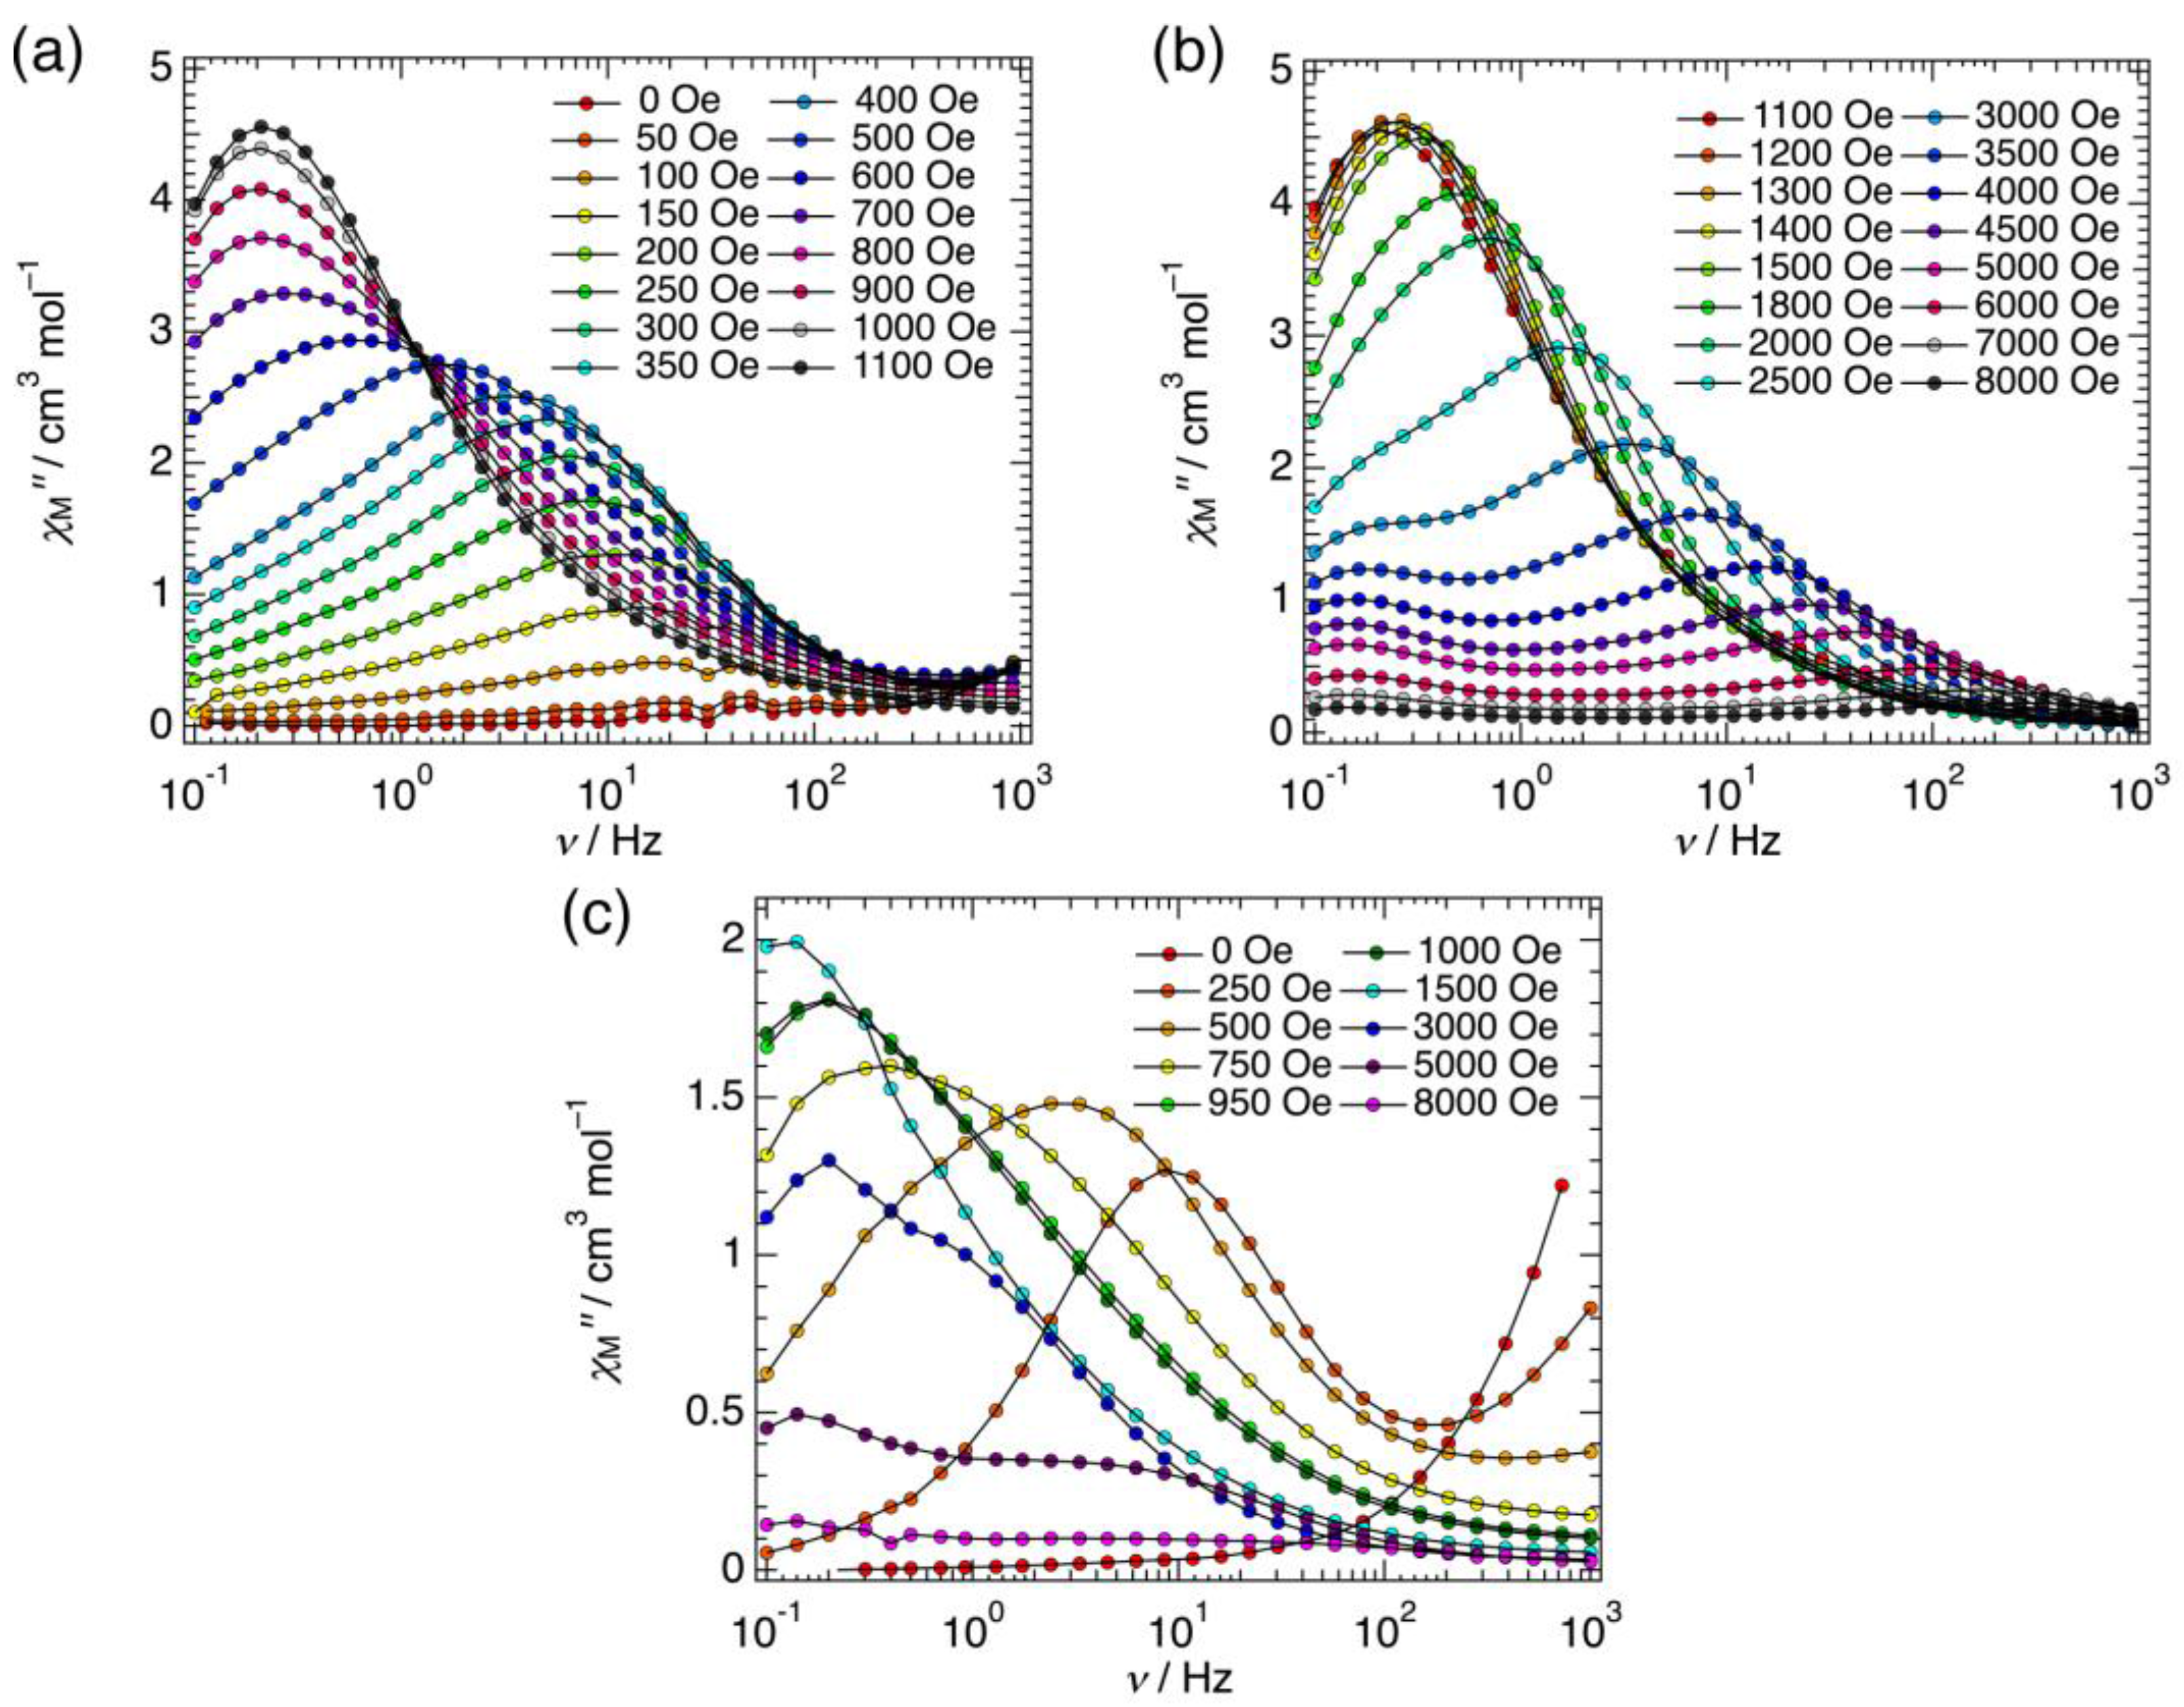
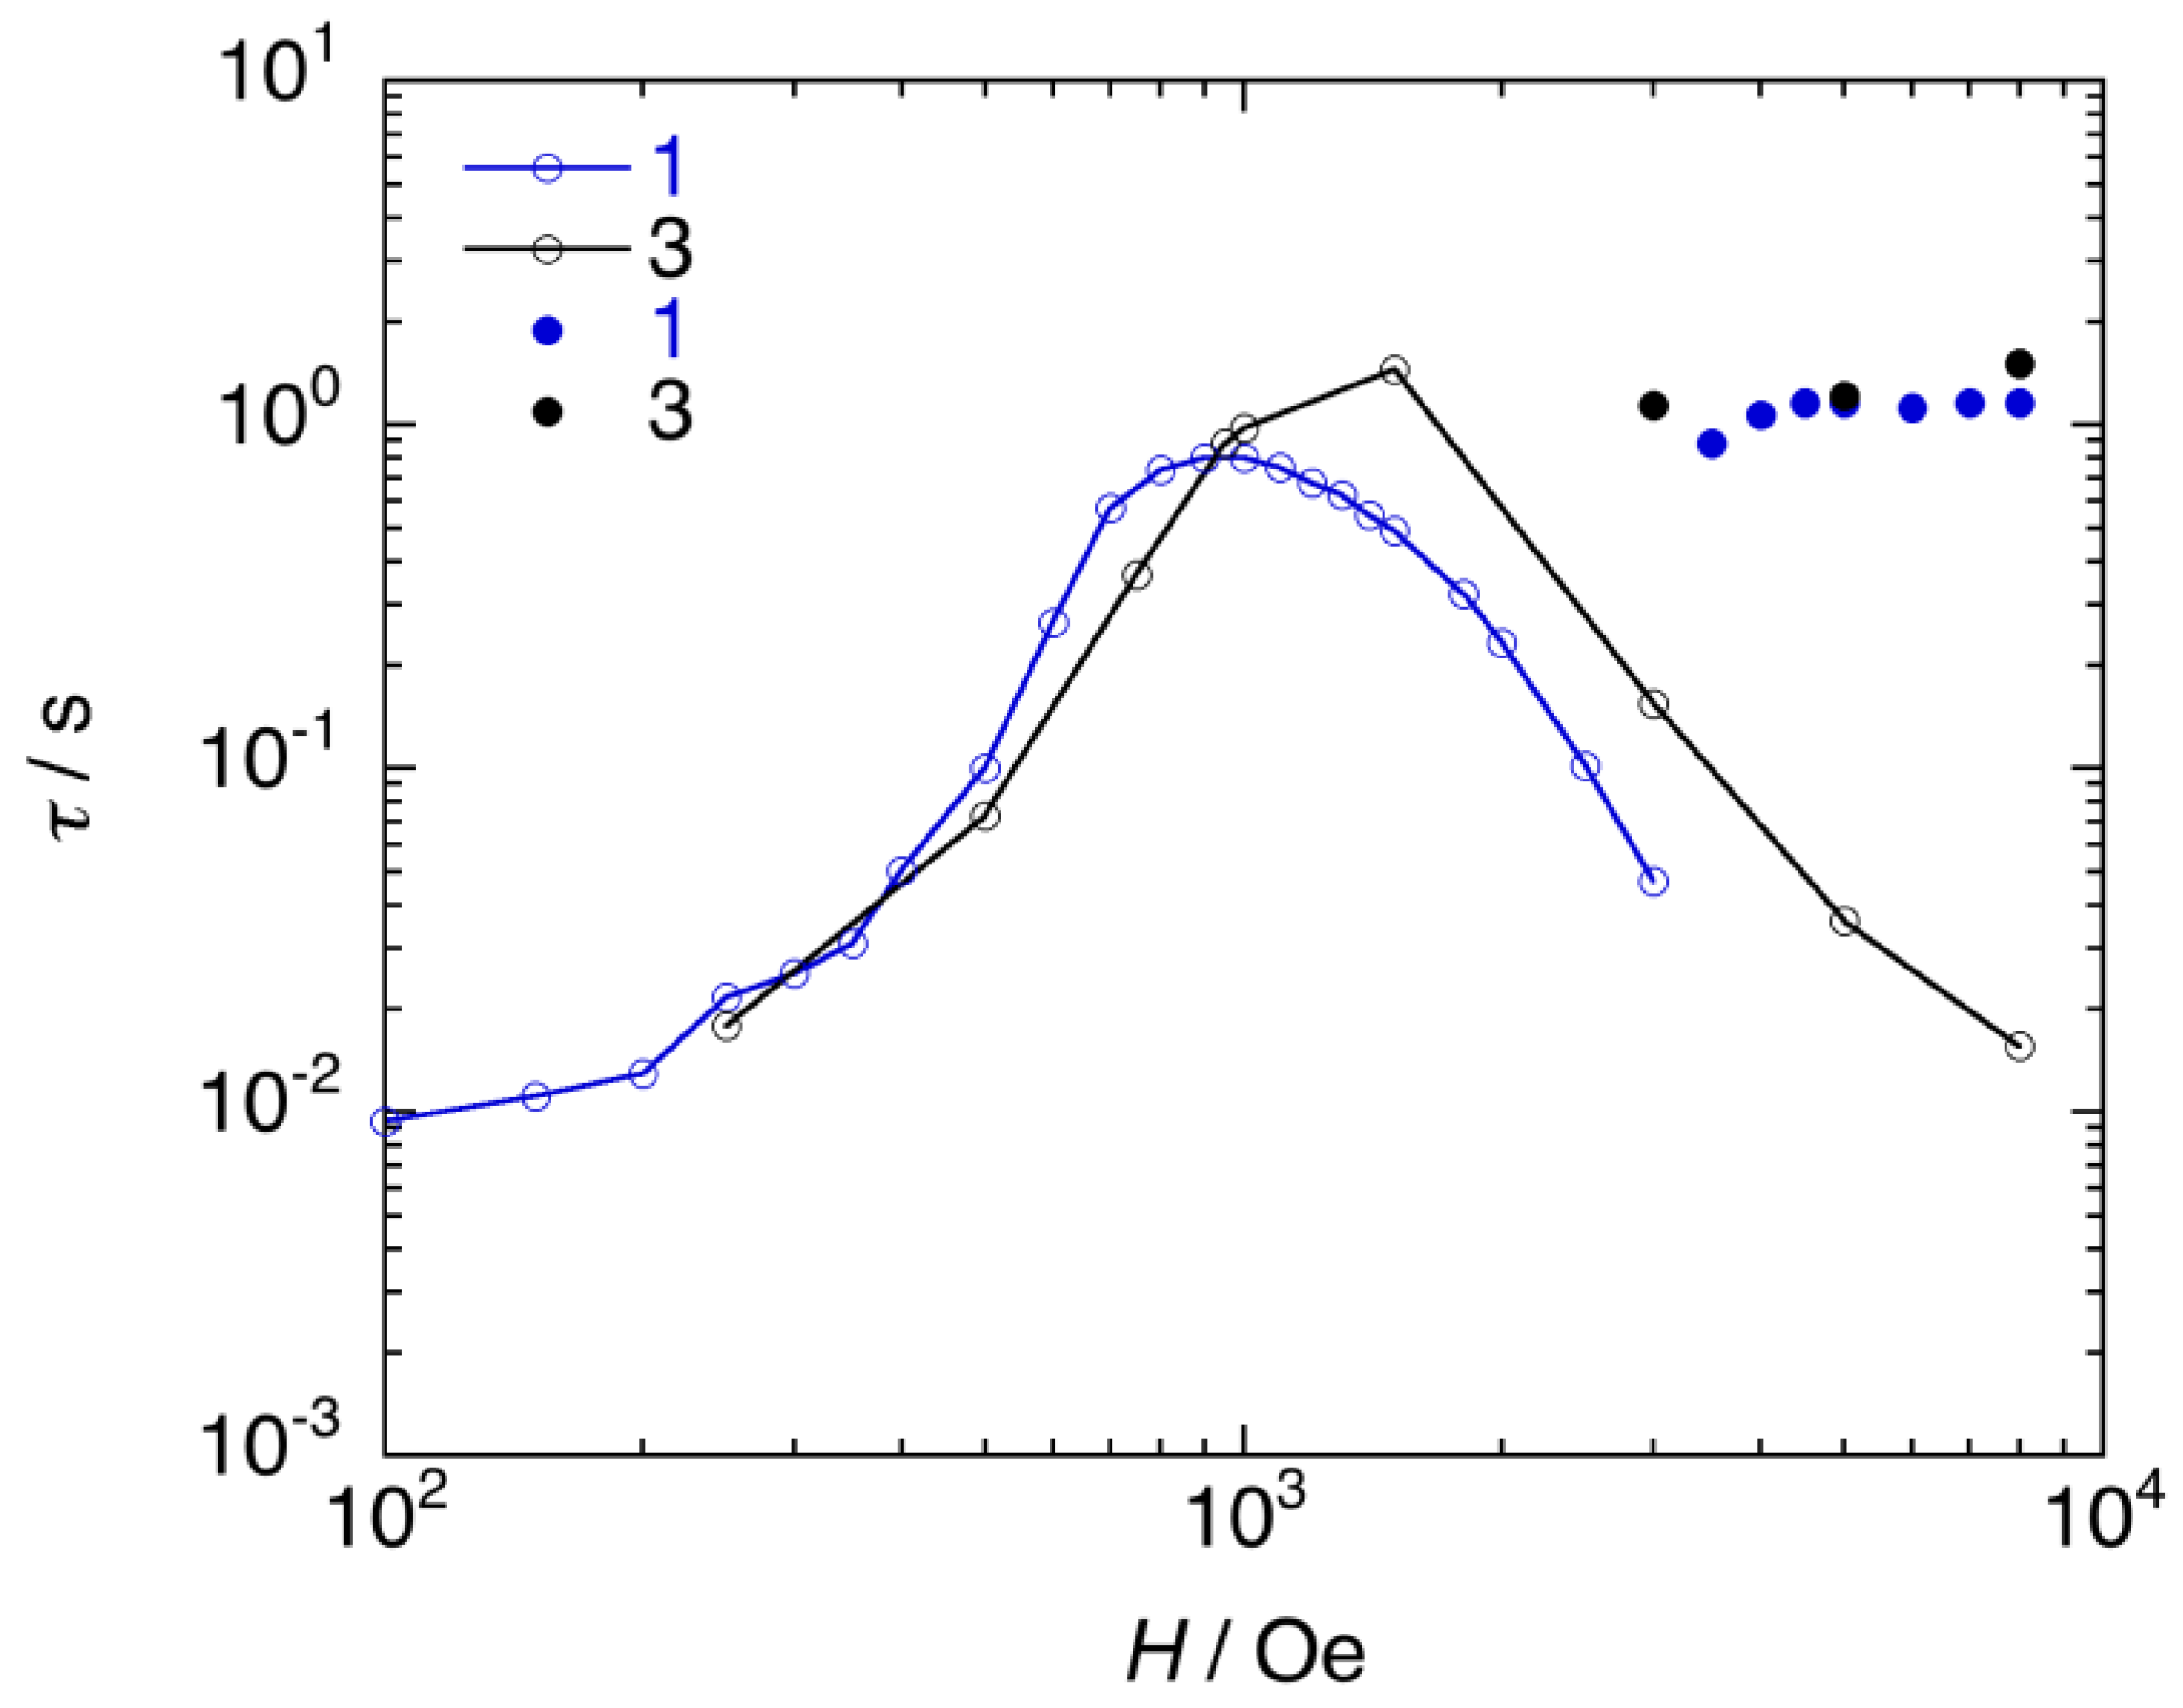
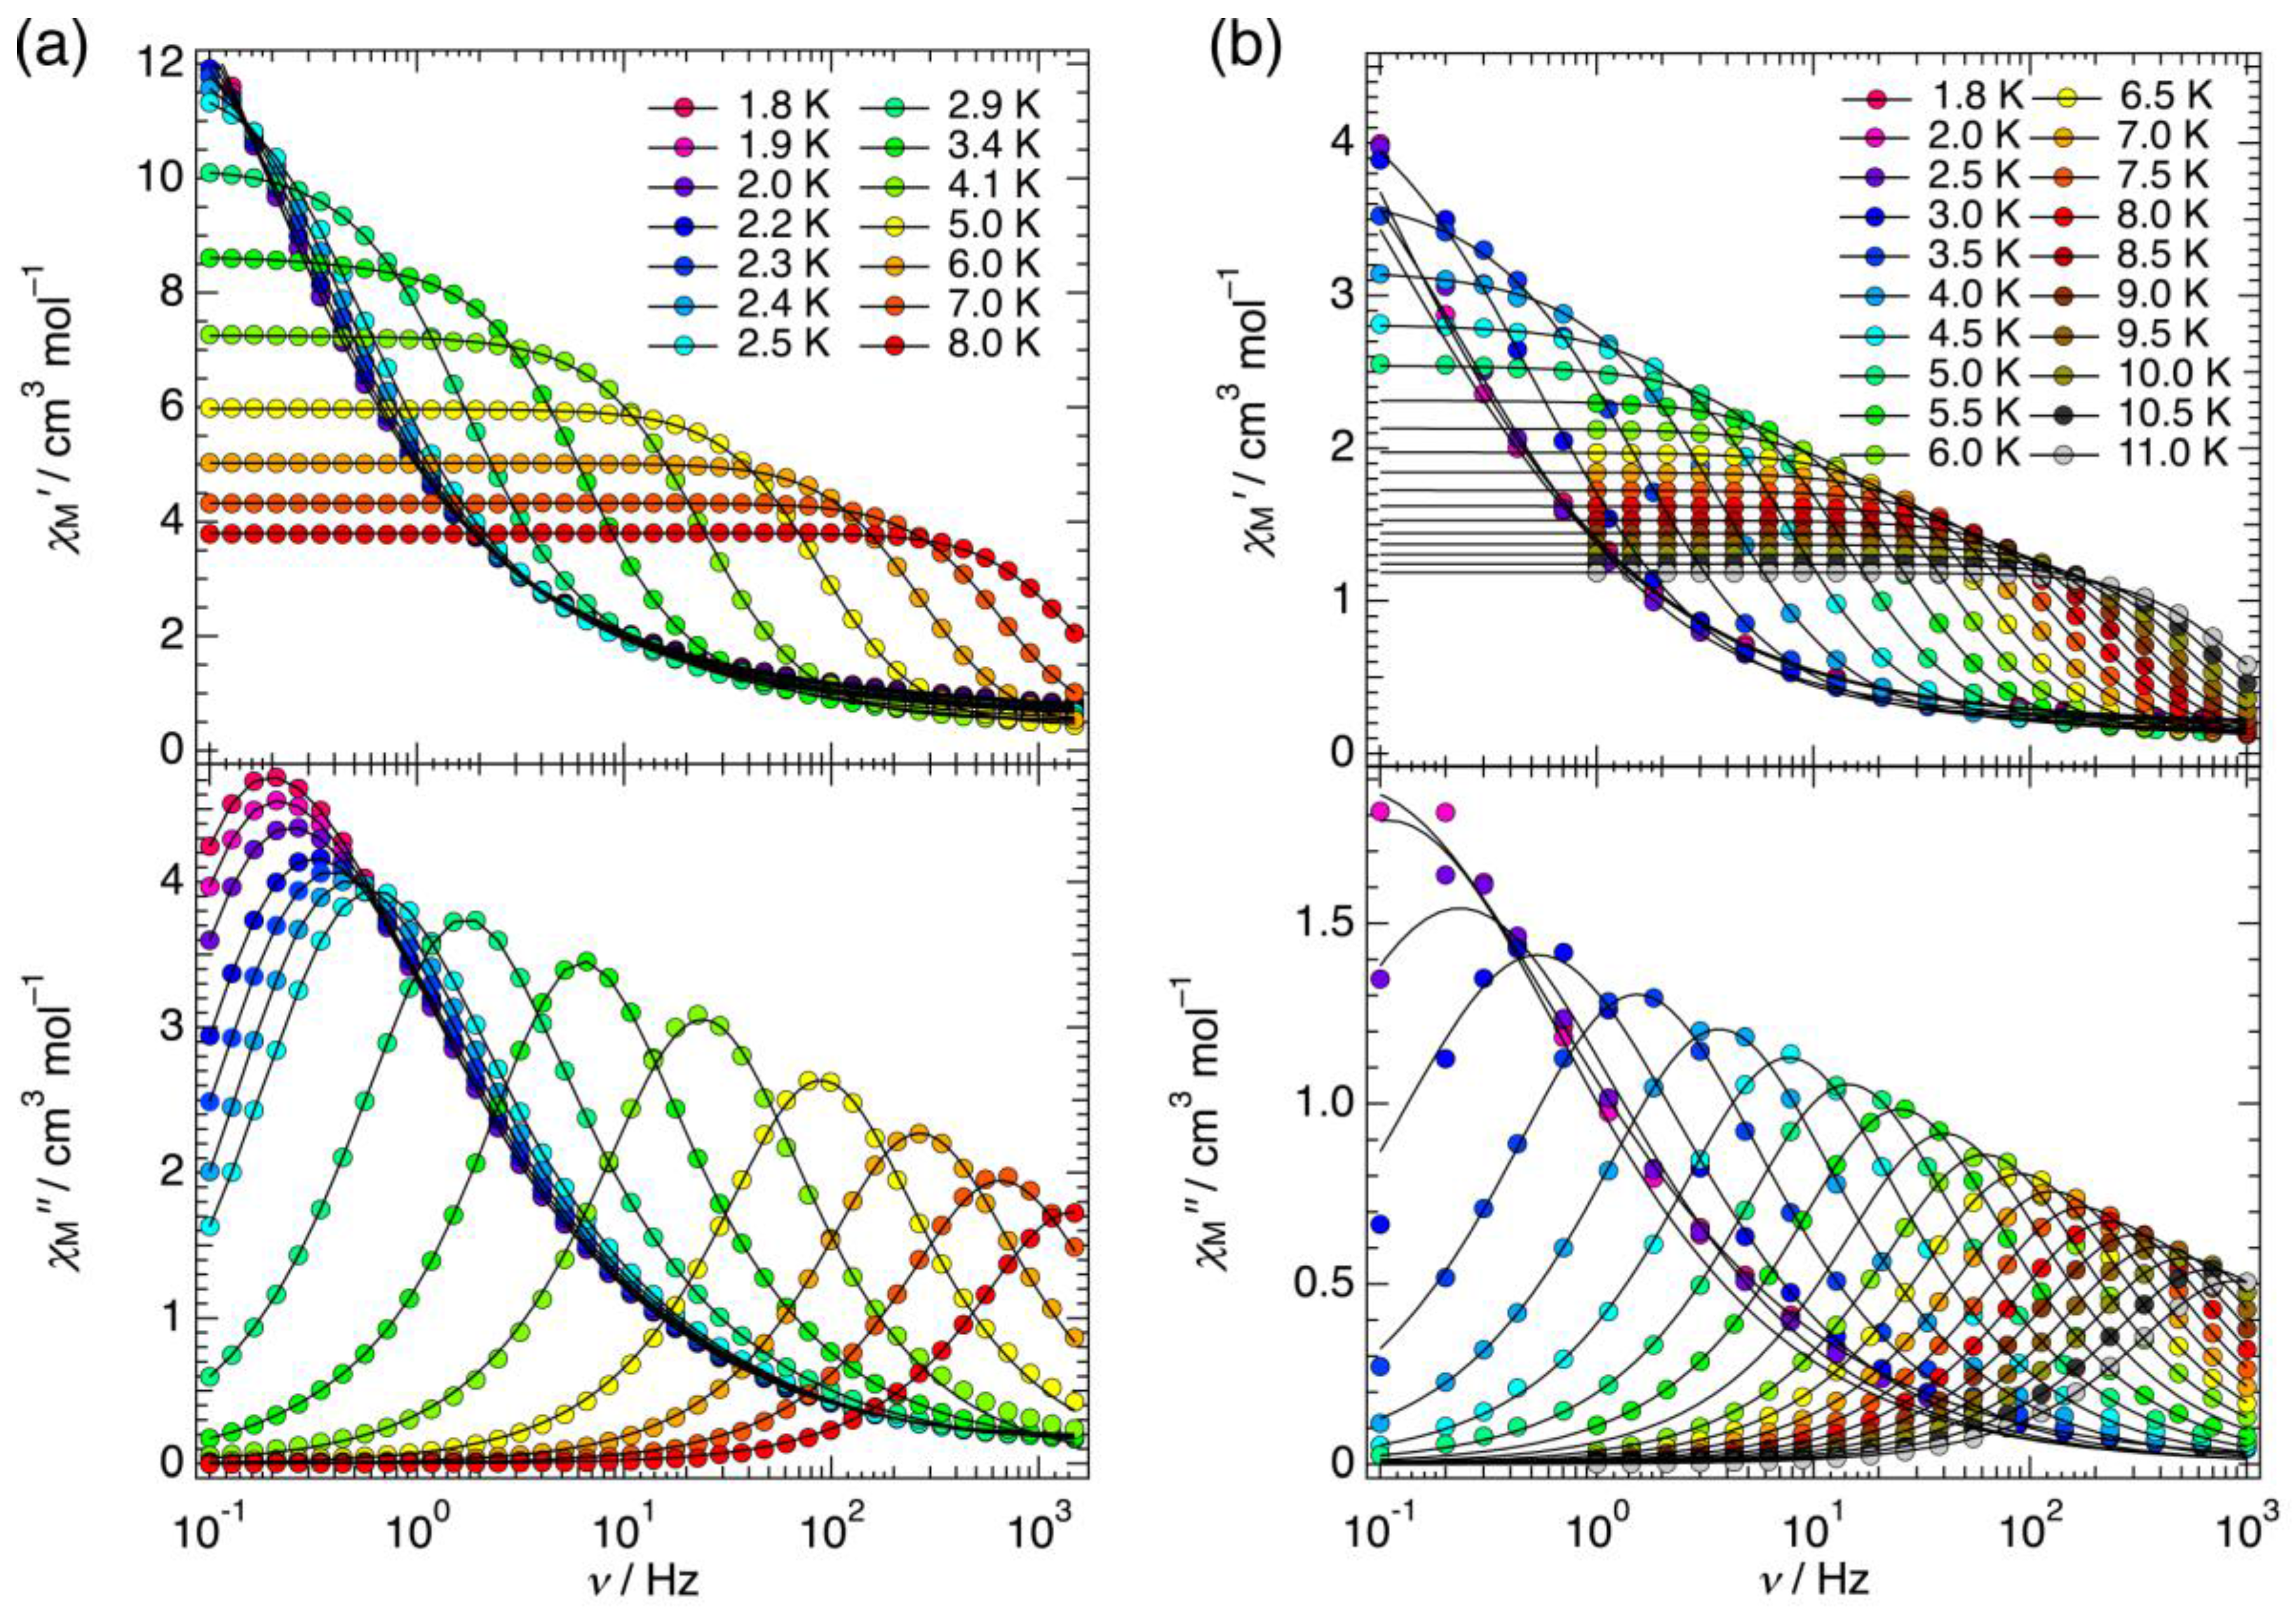
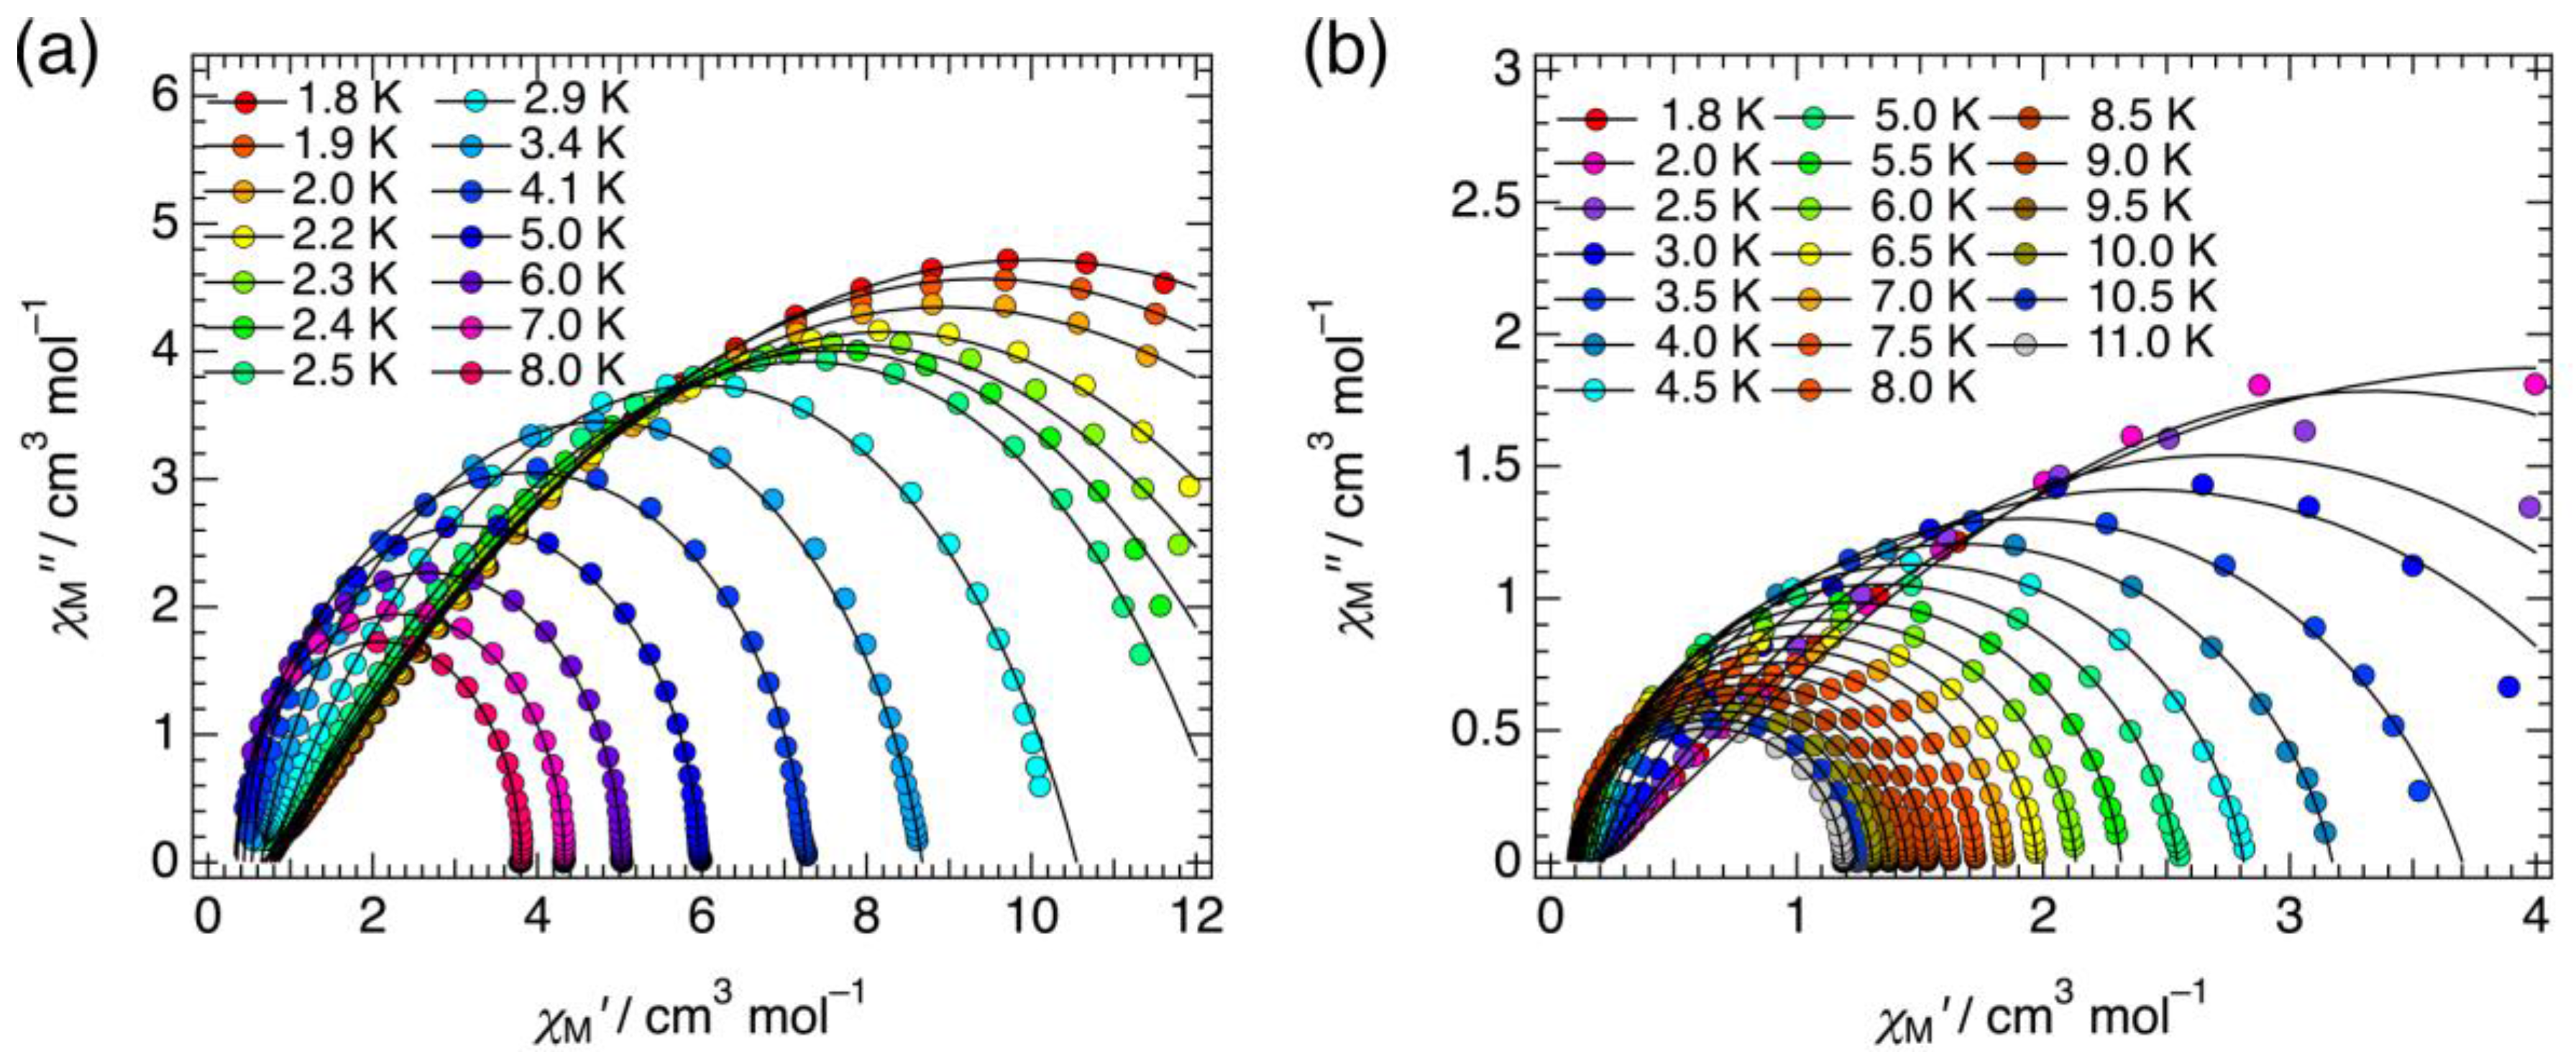
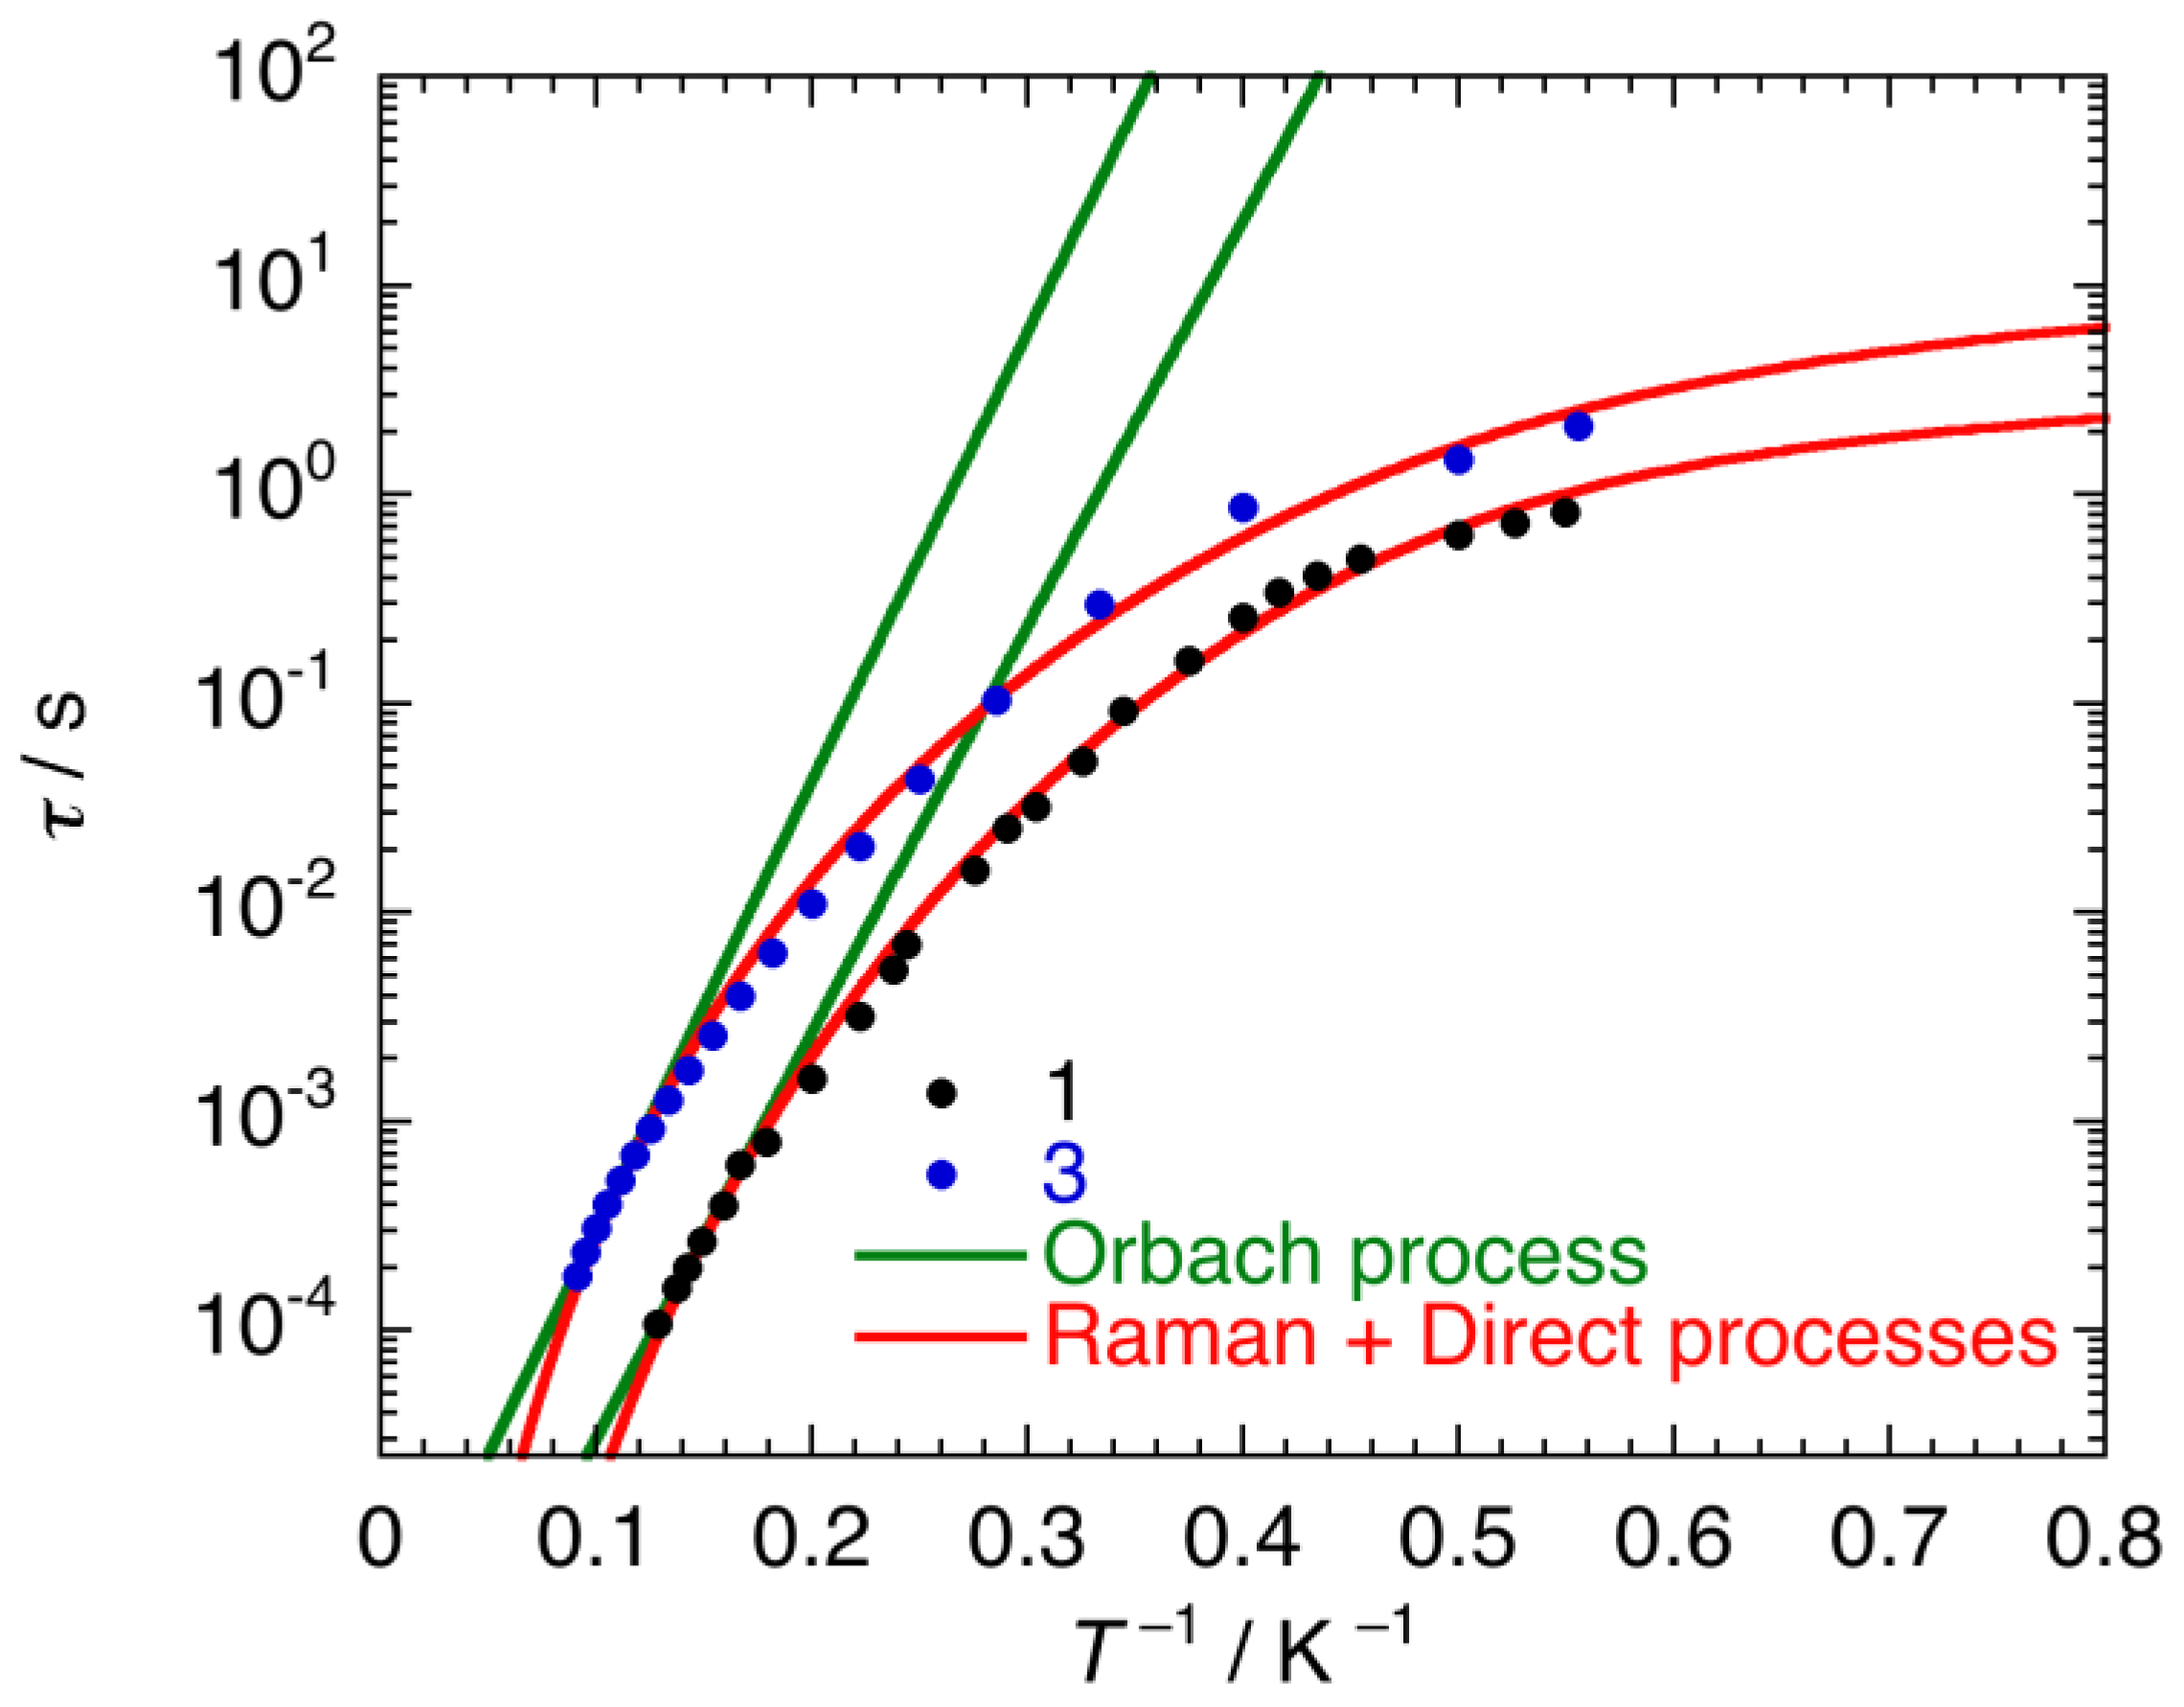
2.3.2. Dynamic Magnetic Properties

To study the slow relaxation of the magnetization of both 1 and 3, alternate-current (AC) susceptibility measurements were performed at a fixed T of 1.8 K with a DC field (HDC) that varied between 0 and 8000 Oe (Figure 5 and Figure 6). The χM″ signals for 1 and 3 in the absence of an applied field increased with increasing frequency (ν), but exhibited only tailing, and no apparent peaks were observed due to blocking in the available ν range. Subsequently, ν-dependent non-zero χM″ signals clearly appeared at small static HDC. This result clearly indicates that zero-field QTM [13] and/or dipolar interactions [32] are suppressed, and/or the non-negligible transverse magnetic anisotropy [33] is broken by the application of HDC in the ground state. Each χM″ peak maximum for 1 shifted to lower ν with an increasing applied HDC up to ~950 Oe. Further increases in HDC resulted in the maximum χM″ shifting to higher ν. Similarly, the maximum χM″ value for 3 shifted to lower ν, reaching a minimum at ~1500 Oe, above which it shifted to higher ν. Therefore, the optimum HDC values for 1 and 3 were determined to be ~950 Oe for 1 and ~1500 Oe for 3, which was used in the T- and ν-dependent AC susceptibility experiments (Figure 7, Figure 8 and Figure S2, Supplementary Materials).
In addition, the other striking feature for both 1 and 3 is the clear presence of two distinct relaxation processes at higher HDC fields: the HDC-dependent component and the HDC-independent component, which are thermal and QTM relaxation modes, respectively (Figure 6).
Both 1 and 3 show ν-dependent χM″ at their respective optimum HDC. The relaxation time (τ) can be extracted at each blocking temperature using a generalized Debye model (Figure 7). Here, Argand plots [34] (χM′ vs. χM″ plot) for 1 and 3 were semicircular with small α parameters in the 0.0063–0.31 range for 1 and the 0.035–0.44 range for 3 (Figure 8).
The linear regions at higher T in the semi-logarithmic plots of τ vs. 1/T (Arrhenius plots) for 1 and 3 were used to calculate the thermal energy barrier (Δeff) for magnetization reversal, known as Orbach relaxation [35], which provided Δeff/kB = 44.7 K and τ0 = 3.43 × 10⁻⁷ s for 1, and Δeff/kB = 49.4 K and τ0 = 2.12 × 10⁻⁶ s for 2 (Figure 9). However, the Arrhenius plots for 1 and 3 deviate from linearity at lower T. Such magnetic relaxation behavior for 1 and 3 suggests the coexistence of thermal relaxation processes and other operative relaxation processes. Hence, τ for 1 and 3 in the given temperature range were analyzed by Equation 3:
τ 1 = τ 0 1 exp ( Δ eff k B T ) + C T n + A T + τ QTM
where the first, second, third, and fourth terms represent Orbach, Raman [35,36,37,38,39], direct [35,36,37,38,39], and QTM processes, respectively. Data for 1 and 3 were analytically reproduced using Equation 3 with appropriate terms for the Raman and direct processes. The best fit was obtained with C = 6.12 × 10⁻³ s−1·K−7.02 and A = 0.323 s−1·K−1 for 1, while C = 7.22 × 10⁻³ s−1·K−5.71 and A = 0.106 s−1·K−1 were best for 3 (Figure 9). Generally, the power index (n) of T for a Raman process is 9 because of Kramers ions. The n values of 1 and 3 are lower than the expected value, which might be attributable to the involvement of both optical and acoustic Raman processes during magnetic relaxation [38]. Therefore, both Raman and direct processes dominate the spin dynamics of 1 and 3. Complexes 1 and 3 exhibit different spin-relaxation behavior, which reflect the coordination geometries around their DyIII centers and their nuclearities, as well as crystal-lattice molecular packing. In addition, although the magnetic analysis of 2 did not reveal any magnetic exchange coupling via the Cl2An2− ligand, the dinuclear complex 1 might create a small bias that allows for tunneling at zero field.

3. Experimental Section

3.1. Materials and Methods

Co(Cp)2, DyCl3·6H2O, GdCl3·6H2O, Na2Cl2An·3H2O, and all of the solvents were purchased from Wako Pure Chemical Industries, Ltd. (Osaka, Japan) KTp was purchased from Tokyo Chemical Industry (TCI) Co., Ltd. (Tokyo, Japan). All of the chemicals were reagent grade and were used as received. Both CH2Cl2 and hexane were super dehydrated grade and deoxidized grade. Unless otherwise noted, reactions and subsequent manipulations were performed under aerobic conditions at room temperature, while compound 3 was prepared under an inert N2 atmosphere using standard glovebox techniques.

3.2. Synthesis of [{Dy(Tp)2}2(μ-Cl2An)]·2CH2Cl2 (1)

This complex was prepared from modification of the original method of Kaizaki et al. [26]. An aqueous solution (5 mL) of DyCl3·6H2O (75.4 mg, 0.2 mmol) was added dropwise to a stirred aqueous solution (5 mL) of Na2Cl2An·3H2O (30.7 mg, 0.1 mmol) and KTp (100.8 mg, 0.4 mmol), resulting in a fine purple precipitate immediately. After stirring for 10 min, the purple solid was isolated via filtration, washed with a small amount of H2O (2 × 5 mL) and Et2O (3 × 5 mL), and dried in vacuo. The purple solid was then dissolved in CH2Cl2, and the resultant purple solution was filtered. Diffusion of hexane into the filtrate yielded purple rod-shaped crystals suitable for single-crystal X-ray diffraction analysis within 1 week. Yield: 144.5 mg (52%). Anal. Calcd. for C44H44B4Cl6Dy2N24O4: C, 34.01; H, 2.85; N, 21.63%. Found: C, 33.98; H, 2.90; N, 21.72%.

3.3. Synthesis of [{Gd(Tp)2}2(μ-Cl2An)]·2CH2Cl (2)

This complex was prepared according to the same method as that for 1 with GdCl3·6H2O instead of DyCl3·6H2O. Yield: 48%. C44H44B4Cl6Gd2N24O4: calcd. C 34.24, H 2.87, N 21.78; found C 34.56, H 2.91, N 21.94.

3.4. Synthesis of [Co(Cp)2][Dy(Tp)2(Cl2An)] (3)

In a N2-filled glovebox, Co(Cp)2 dissolved in PhMe (5 mL) was added to a solution of 1 in the same solvent (5 mL). The color of the reaction mixture changed to yellowish green. Upon stirring the mixture, bright yellow microcrystalline solid appeared immediately, which was collected by filtration, washed with a small amount of Et2O (5 mL), and allowed to dry on the filter for 15 min. The yellowish green solid was then dissolved in MeCN, and the resulting pale yellow solution was filtered. Slow diffusion of Et2O into the filtrate gave red block-shaped crystals suitable for single-crystal X-ray diffraction analysis for two weeks. Yield: 83%. Anal. Calc. for C34H30B2Cl2CoDyN12O4: C, 41.47; H, 3.07; N, 17.07. Found: C, 41.33; H, 3.14; N, 16.87%.

3.5. Single-crystal X-ray Crystallography Data Collection and Refinement

Single-crystals of 1, 2, and 3 were coated with Nujol and were quickly mounted on MicroLoops (MiTeGen LLC., Ithaca, NY, USA) and immediately cooled in a N2 cold stream to avoid decomposition. Data collection was performed on a Rigaku R-AXIS RAPID II IP diffractometer (Rigaku Corporation, Tokyo, Japan) with graphite-monochromated Mo Kα radiation (λ = 0.71075 Å) and a low-temperature apparatus. The crystal dimensions for 1, 2, and 3 were 0.60 × 0.15 × 0.10, and 0.50 × 0.10 × 0.10, and 0.60 × 0.20 × 0.10 mm, respectively. Data for 1, 2, and 3 were collected at 163(1), 100(1) and 108(1)K, respectively. Data integration, preliminary data analysis, and absorption corrections were performed using the Rigaku CrystalClear-SM 1.4.0 SP1 [40] and the CrystalStructure 4.1.1 [41] crystallographic software packages. The molecular structures were solved using direct methods included in SIR2011 [42] and refined using the SHELXL program [43]. All nonhydrogen atoms were refined anisotropically. All hydrogen atoms were introduced as fixed contributors. CCDC-1584512, -1584513 and -1584514 for 1, 2, and 3 contain the supplementary crystallographic data for this paper, and can be obtained free of charge from The Cambridge Crystallographic Data Centre via www.ccdc.cam.ac.uk/data_request/cif.

3.6. Physical Measurements

Elemental analyses were performed by the Technical Support Division, Research and Analytical Centre for Giant Molecules, Graduate School of Science, Tohoku University. Fourier transform infrared (FTIR) spectra were acquired as KBr disks at room temperature on a JASCO FT/IR-410 spectrophotometer (JASCO Corporation, Tokyo, Japan). Magnetic data were collected on a Quantum Design MPMS3 or MPMS-5S superconducting quantum interference device (SQUID) magnetometer (Quantum Design Japan, Inc., Tokyo, Japan). All of the magnetic measurements were performed on finely ground microcrystalline powders in a calibrated gelatin capsule. DC susceptibility measurements were performed in the T range of 1.8–300 K in a DC field of 0.05 T or 0.1 T. Field-dependent dc magnetization measurements were performed from −7 to +7 T at 1.8 K. AC susceptibility measurements were performed in the T range of 1.8–20 K in a 3 Oe AC field, oscillating at frequencies of 1 and 997 or 1488 Hz in different applied DC fields. Magnetic susceptibility data were corrected for diamagnetic contributions from the sample holder as well as for the core diamagnetism of each sample estimated using Pascal’s constants [44].

4. Conclusions and Outlook

The dinuclear and mononuclear [{Dy(Tp)2}2(μ-Cl2An)] and [Co(Cp)2][Dy(Tp)2(Cl2An)] eight-coordinate complexes were synthesized. The two complexes have similar N6O2 coordination environments that are based on the dianionic Cl2An2− ligand and Tp as auxiliary ligands. However, each Cl2An2− moiety adopts the bi-separated delocalized form in dinuclear [{Dy(Tp)2}2(μ-Cl2An)], and the o-quinone form in mononuclear [Co(Cp)2][Dy(Tp)2(Cl2An)]. Therefore, in this work, both complexes were magnetically characterized to examine how the donor strength affects the slow relaxation of the magnetization. Dynamic magnetic measurements clearly reveal that both of the complexes exhibit temperature-dependent slow relaxations of magnetization facilitated by multiple relaxation pathways. Their spin dynamics are different, reflecting the coordination geometries around the DyIII centers and their nuclearities, as well as crystal-lattice molecular packing. The redox-active Cl2An2− ligand is a good candidate for the future construction of redox-switchable SMMs, as anilate derivatives readily undergo redox reactions to form both diamagnetic and paramagnetic species; such redox-switchable SMMs and/or SIMs that may be applied in future technologies, such as molecular spintronics. Furthermore, we are currently constructing dinuclear complexes of all other lanthanides bridged with the Cl2An2− moiety. This effort will provide valuable insight into the electronic structures, magnetic properties, and trends observed in the series of dinuclear [{Ln(Tp)2}2(μ-Cl2An)] complexes.

Supplementary Materials

The following are available online at www.mdpi.com/2304-6740/6/1/7/s1. Cif and cif-checked files. Figure S1: Field dependence of magnetization plots of 13 at 1.8 K. The solid red lines were fitted to the data as described in the text.; Figure S2: Temperature dependence of χM′ and χM″ products at given frequencies in an applied DC field of 950 Oe for 1 and 1500 Oe for 3, respectively. Solid black lines serve as guides.
Supplementary File 1

Acknowledgments

This work was partially supported by JSPS KAKENHI (Grant-in-Aid for Scientific Research (C) and Coordination Asymmetry) Grant Numbers 16K05735 and 17H05390 (Ryuta Ishikawa and Satoshi Kawata), the Central Research Institute of Fukuoka University Grant Numbers 171041 (Ryuta Ishikawa) and 171011 (Satoshi Kawata).

Author Contributions

Ryuta Ishikawa conceived and designed the experiment; Ryuta Ishikawa, Shoichi Michiwaki, Takeshi Noda, Kouki Matsubara and Satoshi Kawata executed the synthesis and characterization; Ryuta Ishikawa, Keiichi Katoh and Masahiro Yamashita executed magnetic measurements; Ryuta Ishikawa analyzed the all data and wrote the paper.

Conflicts of Interest

The authors declare no conflict of interest.

References

  1. Sessoli, R.; Gatteschi, D.; Caneschi, A.; Novak, M.A. Magnetic bistability in a metal-ion cluster. Nature 1993, 365, 141–143. [Google Scholar] [CrossRef]
  2. Christou, G.; Gatteschi, D.; Hendrickson, D.N.; Sessoli, R. Single-molecule magnets. MRS Bull. 2000, 25, 66–71. [Google Scholar] [CrossRef]
  3. Gatteschi, D.; Sessoli, R.; Villain, J. Molecular Nanomagnets; Oxford University Press: Oxford, UK, 2006. [Google Scholar]
  4. Jeon, I.-R.; Clerac, R. Controlled association of single-molecule magnets (SMMs) into coordination networks: towards a new generation of magnetic materials. Dalton. Trans. 2012, 41, 9569–9586. [Google Scholar] [CrossRef] [PubMed]
  5. Demir, S.; Jeon, I.-R.; Long, J.R.; Harris, T.D. Radical ligand-containing single-molecule magnets. Coord. Chem. Rev. 2015, 289–290, 149–176. [Google Scholar] [CrossRef]
  6. Sessoli, R.; Powell, A.K. Strategies towards single molecule magnets based on lanthanide ions. Coord. Chem. Rev. 2009, 253, 2328–2341. [Google Scholar] [CrossRef]
  7. Woodruff, D.N.; Winpenny, R.E.P.; Layfield, R.A. Lanthanide single-molecule magnets. Chem. Rev. 2013, 113, 5110–5148. [Google Scholar] [CrossRef] [PubMed]
  8. Craig, G.A.; Murrie, M. 3d Single-ion magnets. Chem. Soc. Rev. 2015, 44, 2135–2147. [Google Scholar] [CrossRef] [PubMed]
  9. Frost, J.M.; Harriman, K.L.M.; Murugesu, M. The rise of 3-d single-ion magnets in molecular magnetism: towards materials from molecules? Chem. Sci. 2016, 7, 2470–2491. [Google Scholar] [CrossRef] [PubMed]
  10. Bar, A.K.; Pichon, C.; Sutter, J.-P. Magnetic anisotropy in two- to eight-coordinated transition–metal complexes: Recent developments in molecular magnetism. Coord. Chem. Rev. 2016, 308, 346–380. [Google Scholar] [CrossRef]
  11. Meng, Y.S.; Jiang, S.D.; Wang, B.W.; Gao, S. Understanding the magnetic anisotropy toward single-ion magnets. Acc. Chem. Res. 2016, 49, 2381–2389. [Google Scholar] [CrossRef] [PubMed]
  12. McAdams, S.G.; Ariciu, A.-M.; Kostopoulos, A.K.; Walsh, J.P.S.; Tuna, F. Molecular single-ion magnets based on lanthanides and actinides: Design considerations and new advances in the context of quantum technologies. Coord. Chem. Rev. 2017, 346, 216–239. [Google Scholar] [CrossRef]
  13. Gatteschi, D.; Sessoli, R. Quantum Tunneling of Magnetization and Related Phenomena in Molecular Materials. Angew. Chemie Int. Ed. 2003, 42, 268–297. [Google Scholar] [CrossRef] [PubMed]
  14. Schlegel, C.; van Slageren, J.; Manoli, M.; Brechin, E.K.; Dressel, M. Direct observation of quantum coherence in single-molecule magnets. Phys. Rev. Lett. 2008, 101, 147203. [Google Scholar] [CrossRef] [PubMed]
  15. Bader, K.; Dengler, D.; Lenz, S.; Endeward, B.; Jiang, S.-D.; Neugebauer, P.; van Slageren, J. Room temperature quantum coherence in a potential molecular qubit. Nat. Commun. 2014, 5, 5304. [Google Scholar] [CrossRef] [PubMed]
  16. Leuenberger, M.N.; Loss, D. Quantum computing in molecular magnets. Nature 2001, 410, 789–793. [Google Scholar] [CrossRef] [PubMed]
  17. Mannini, M.; Pineider, F.; Sainctavit, P.; Danieli, C.; Otero, E.; Sciancalepore, C.; Talarico, A.M.; Arrio, M.-A.; Cornia, A.; Gatteschi, D.; Sessoli, R. Magnetic memory of a single-molecule quantum magnet wired to a gold surface. Nat. Mater. 2009, 8, 194–197. [Google Scholar] [CrossRef] [PubMed]
  18. Bogani, L.; Wernsdorfer, W. Molecular spintronics using single-molecule magnets. Nat. Mater. 2008, 7, 179. [Google Scholar] [CrossRef] [PubMed]
  19. Camarero, J.; Coronado, E. Molecular vs. inorganic spintronics: the role of molecular materials and single molecules. J. Mater. Chem. 2009, 19, 1678–1684. [Google Scholar] [CrossRef]
  20. Sanvito, S. Molecular spintronics. Chem. Soc. Rev. 2011, 40, 3336–3355. [Google Scholar] [CrossRef] [PubMed]
  21. Clemente-Juan, J.M.; Coronado, E.; Gaita-Arino, A. Magnetic polyoxometalates: from molecular magnetism to molecular spintronics and quantum computing. Chem. Soc. Rev. 2012, 41, 7464–7478. [Google Scholar] [CrossRef] [PubMed]
  22. Sorace, L.; Benelli, C.; Gatteschi, D. Lanthanides in molecular magnetism: old tools in a new field. Chem. Soc. Rev. 2011, 40, 3092–3104. [Google Scholar] [CrossRef] [PubMed]
  23. Liddle, S.T.; van Slageren, J. Improving f-element single molecule magnets. Chem. Soc. Rev. 2015, 44, 6655–6669. [Google Scholar] [CrossRef] [PubMed]
  24. Kitagawa, S.; Kawata, S. Coordination compounds of 1,4-dihydroxybenzoquinone and its homologues. Structures and properties. Coord. Chem. Rev. 2002, 224, 11–34. [Google Scholar] [CrossRef]
  25. Mercuri, M.L.; Congiu, F.; Concas, G.; Sahadevan, S.A. Recent advances on anilato-based molecular materials with magnetic and/or conducting properties. Magnetochemistry 2017, 3, 1. [Google Scholar] [CrossRef]
  26. Trofimenko, S. Recent advances in poly(pyrazolyl)borate (scorpionate) chemistry. Chem. Rev. 1993, 93, 943–980. [Google Scholar] [CrossRef]
  27. Abdus Subhan, M.; Kawahata, R.; Nakata, H.; Fuyuhiro, A.; Tsukuda, T.; Kaizaki, S. Synthesis, structure and spectroscopic properties of chloranilate-bridged 4f–4f dinuclear complexes: A comparative study of the emission properties with Cr–Ln complexes. Inorganica Chim. Acta 2004, 357, 3139–3146. [Google Scholar] [CrossRef]
  28. Ishikawa, R.; Horii, Y.; Nakanishi, R.; Ueno, S.; Breedlove, B.K.; Yamashita, M.; Kawata, S. Field-induced single-ion magnetism based on spin-phonon relaxation in a distorted octahedral high-spin cobalt(II) complex. Eur. J. Inorg. Chem. 2016, 2016, 3233–3239. [Google Scholar] [CrossRef]
  29. Apostolidis, C.; Rebizant, J.; Kanellakopulos, B.; von Ammon, R.; Dornberger, E.; Müller, J.; Powietzka, B.; Nuber, B. Homoscorpionates (hydridotris(1-pyrazolyl)borato complexes) of the trivalent 4f ions. The crystal and molecular structure of [(HB(N2C3H3)3)3LnIII, (Ln = Pr, Nd). Polyhedron 1997, 16, 1057–1068. [Google Scholar] [CrossRef]
  30. Casanova, D.; Alemany, P.; Bofill, J.M.; Alvarez, S. Shape and symmetry of heptacoordinate transition-metal complexes: Structural trends. Chem. Eur. J. 2003, 9, 1281–1295. [Google Scholar] [CrossRef] [PubMed]
  31. Alvarez, S.; Alemany, P.; Casanova, D.; Cirera, J.; Llunell, M.; Avnir, D. Shape maps and polyhedral interconversion paths in transition metal chemistry. Coord. Chem. Rev. 2005, 249, 1693–1708. [Google Scholar] [CrossRef]
  32. Guo, Y.-N.; Xu, G.-F.; Wernsdorfer, W.; Ungur, L.; Guo, Y.; Tang, J.; Zhang, H.-J.; Chibotaru, L.F.; Powell, A.K. Strong axiality and ising exchange interaction suppress zero-field tunneling of magnetization of an asymmetric Dy2 single-molecule magnet. J. Am. Chem. Soc. 2011, 133, 11948–11951. [Google Scholar] [CrossRef] [PubMed]
  33. Ungur, L.; Chibotaru, L.F. Magnetic anisotropy in the excited states of low symmetry lanthanide complexes. Phys. Chem. Chem. Phys. 2011, 13, 20086–20090. [Google Scholar] [CrossRef] [PubMed]
  34. Cole, K.S.; Cole, R.H. Dispersion and absorption in dielectrics I. Alternating current characteristics. J. Chem. Phys. 1941, 9, 341–351. [Google Scholar] [CrossRef]
  35. Orbach, R. Spin-lattice relaxation in rare-earth salts. Proc. R. Soc. Lond. A Math. Phys. Eng. Sci. 1961, 264, 458–484. [Google Scholar] [CrossRef]
  36. Orbach, R. On the theory of spin-lattice relaxation in paramagnetic salts. Proc. Phys. Soc. 1961, 77, 821–826. [Google Scholar] [CrossRef]
  37. Abragam, A.; Bleaney, B. Electron Paramagnetic Resonance of Transition Ions; Clarendon Press: Oxford, UK, 1970. [Google Scholar]
  38. Shrivastava, K.N. Theory of spin–lattice relaxation. Phys. Status Solidi 1983, 117, 437–458. [Google Scholar] [CrossRef]
  39. Scott, P.L.; Jeffries, C.D. Spin-lattice relaxation in some rare-earth salts at helium temperatures; observation of the phonon bottleneck. Phys. Rev. 1962, 127, 32–51. [Google Scholar] [CrossRef]
  40. CrystalClear-SM; Version 1.4.0 SP1; Rigaku and Rigaku/MSC: The Woodlands, TX, USA, 2008.
  41. CrystalStructure; Version 4.1.1; Rigaku and Rigaku/MSC: The Woodlands, TX, USA, 2015.
  42. Burla, M.C.; Caliandro, R.; Camalli, M.; Carrozzini, B.; Cascarano, G.L.; Giacovazzo, C.; Mallamo, M.; Mazzone, A.; Polidori, G.; Spagna, R. SIR2011: A new package for crystal structure determination and refinement. J. Appl. Crystallogr. 2012, 45, 357–361. [Google Scholar] [CrossRef]
  43. Sheldrick, G.M. A short history of SHELX. Acta Crystallogr. Sect. A 2008, 64, 112–122. [Google Scholar] [CrossRef] [PubMed]
  44. Kahn, O. Molecular Magnetism; VCH: Weinheim, Germany, 1993. [Google Scholar]
Scheme 1. Resonance structures in chloranilate (Cl2An2−).
Inorganics 06 00007 sch001
Figure 1. Infrared (IR) spectra for 13 at room temperature.
Inorganics 06 00007 g001
Figure 2. Molecular structure of 1. H atoms and lattice solvent molecules are omitted for clarity.
Inorganics 06 00007 g002
Figure 3. Molecular structure of 3. H atoms are omitted for clarity.
Inorganics 06 00007 g003
Figure 4. T dependence of χMT products for 13. The solid red line represents fit to the data, which is described in the text.
Inorganics 06 00007 g004
Figure 5. Variable-field χM″ for 1 (a and b) and 3 (c) at 1.8 K for direct-current (DC) fields of 0–8000 Oe, over the frequency range of 0.1–1000 Hz. Solid black lines serve as guides.
Inorganics 06 00007 g005
Figure 6. HDC-dependece of τ for 1 and 3 at 1.8 K indicating two distinct relaxation processes: HDC-dependent component (blue open circles for 1 and blue open circles for 3) and HDC-independent ones (blue filled circles for 1 and black filled circles for 3). Solid lines serve as guides.
Inorganics 06 00007 g006
Figure 7. ν-dependent χM′ and χM″ in the T range 1.8–8.0 K in an applied HDC of 950 Oe for 1 (a) and in the T range 1.8–11.0 K in an applied HDC of 1500 Oe for 3 (b), respectively. Solid black lines represent best fits to a generalized Debye model.
Inorganics 06 00007 g007
Figure 8. Argand plots at given temperatures in an applied DC field of 950 Oe for 1 (a) and 1500 Oe for 3 (b), respectively. Solid black lines are best-fit lines.
Inorganics 06 00007 g008
Figure 9. T-dependece of τ for 1 and 3 at 950 and 1500 Oe, respectively. Solid lines were fitted to the data as described in the text.
Inorganics 06 00007 g009

