Impact of the Subunit Arrangement on the Nonlinear Absorption Properties of Organometallic Complexes with Ruthenium(II) σ-Acetylide and Benzothiadiazole as Building Units §

 , ,
, , 
Abstract
:
1. Introduction
2. Results
2.1. Linear Optical Properties
2.2. Molecular Orbital Calculation
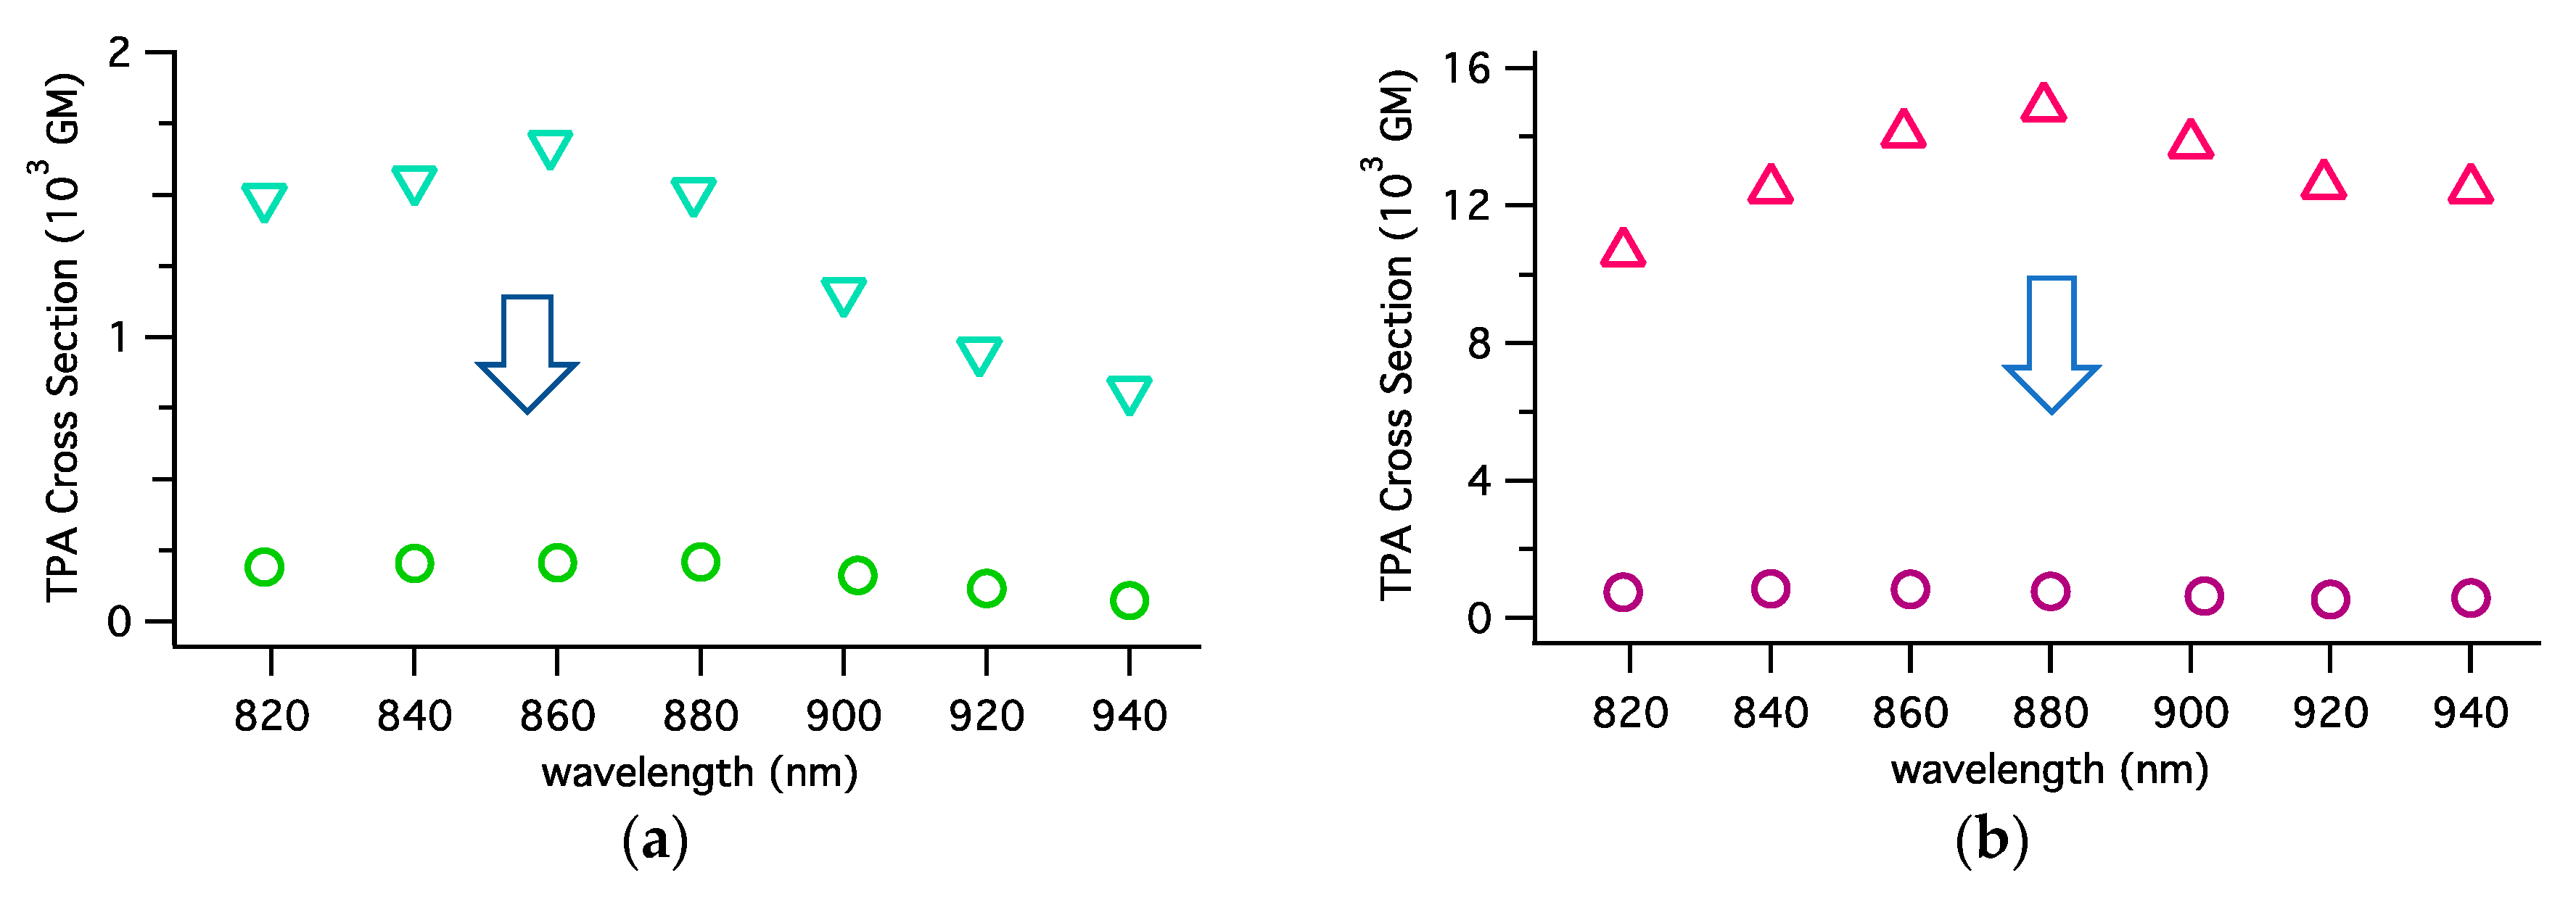
2.3. Nonlinear Absorption Properties
3. Discussion
4. Materials and Methods
4.1. General
4.2. Nonlinear Absorption Measurements
5. Conclusions
Supplementary Materials
Author Contributions
Funding
Acknowledgments
Conflicts of Interest
References
- He, G.S.; Tan, L.-S.; Zheng, Q.; Prasad, P.N. Multiphoton absorbing materials: Molecular designs, characterizations, and applications. Chem. Rev. 2008, 108, 1245–1330. [Google Scholar] [CrossRef] [PubMed]
- Pawlicki, M.; Collins, H.A.; Denning, R.G.; Anderson, H.L. Two-photon absorption and the design of two-photon dyes. Angew. Chem. Int. Ed. 2009, 48, 3244–3266. [Google Scholar] [CrossRef]
- Fillaut, J.L. Design of ruthenium–alkynyl complexes as nonlinear optical chromophores. Display Imaging 2016, 2, 115–134. [Google Scholar]
- Colombo, A.; Nisic, F.; Dragonetti, C.; Marinotto, D.; Oliveri, I.P.; Righetto, S.; Lobello, M.G.; De Angelis, F. Unexpectedly high second-order nonlinear optical properties of simple Ru and Pt alkynyl complexes as an analytical springboard for NLO-active polymer films. Chem. Commun. 2014, 50, 7986–7989. [Google Scholar] [CrossRef] [PubMed] [Green Version]
- Nisic, F.; Colombo, A.; Dragonetti, C.; Garoni, E.; Marinotto, D.; Righetto, S.; De Angelis, F.; Lobello, M.G.; Salvatori, P.; Biagini, P.; et al. Functionalized ruthenium dialkynyl complexes with high second-order nonlinear optical properties and good potential as dye sensitizers for solar cells. Organometallics 2015, 34, 94–104. [Google Scholar] [CrossRef]
- Colombo, A.; Dragonetti, C.; Marinotto, D.; Righetto, S.; Griffini, G.; Turri, S.; Akdas-Kilig, H.; Fillaut, J.L.; Amar, A.; Boucekkine, A.; et al. Nonlinear optical properties of intriguing Ru σ-acetylide complexes and the use of a photocrosslinked polymer as a springboard to obtain SHG active thin films. Dalton Trans. 2016, 45, 11052–11060. [Google Scholar] [CrossRef]
- Durand, R.J.; Gauthier, S.; Achelle, S.; Groizard, T.; Kahlal, S.; Saillard, J.Y.; Barsella, A.; Le Poul, N.; Robin Le Guen, F. Push–pull D–π–Ru–π–A chromophores: Synthesis and electrochemical, photophysical and second-order nonlinear optical properties. Dalton Trans. 2018, 47, 3965–3975. [Google Scholar] [CrossRef]
- McDonagh, A.M.; Humphrey, M.G.; Samoc, M.; Luther-Davies, B. Organometallic complexes for nonlinear optics. 17. Synthesis, third-order optical nonlinearities, and two-photon absorption cross section of an alkynylruthenium dendrimer. Organometallics 1999, 18, 5195–5197. [Google Scholar] [CrossRef]
- McDonagh, A.M.; Powell, C.E.; Morrall, J.P.; Cifuentes, M.P.; Humphrey, M.G. Convergent synthesis of alkynylbis(bidentatephosphine)ruthenium dendrimers. Organometallics 2003, 22, 1402–1413. [Google Scholar] [CrossRef]
- Roberts, R.L.; Schwich, T.; Corkery, T.C.; Cifuentes, M.P.; Green, K.A.; Farmer, J.D.; Low, P.J.; Marder, T.B.; Samoc, M.; Humphrey, M.G. Organometallic Complexes for Nonlinear Optics. 45. Dispersion of the Third-Order Nonlinear Optical Properties of Triphenylamine-Cored Alkynylruthenium Dendrimers. Adv. Mater. 2009, 21, 2318–2322. [Google Scholar] [CrossRef]
- Simpson, P.V.; Watson, L.A.; Barlow, A.; Wang, G.; Cifuentes, M.P.; Humphrey, M.G. Record Multiphoton Absorption Cross-Sections by Dendrimer Organometalation. Angew. Chem. Int. Ed. Engl. 2016, 55, 2387–2391. [Google Scholar] [CrossRef]
- Girardot, C.; Lemercier, G.; Mulatier, J.-C.; Chauvin, J.; Baldeck, P.L.; Andraud, C. Novel ruthenium(II) and zinc(II) complexes for two-photon absorption related applications. Dalton Trans. 2007, 3421–3426. [Google Scholar] [CrossRef] [PubMed]
- Akl, J.; Sasaki, I.; Lacroix, P.G.; Hugues, V.; Vicendo, P.; Bocé, M.; Mallet-Ladeira, S.; Blanchard-Desce, M.; Malfant, I. trans- and cis-(Cl,Cl)-[RuII(FT)Cl2(NO)](PF6): promising candidates for NO release in the NIR region. Photochem. Photobiol. Sci. 2016, 15, 1484–1491. [Google Scholar] [CrossRef]
- Colombo, A.; Dragonetti, C.; Roberto, D.; Ugo, R.; Falciola, L.; Luzzati, S.; Kotowski, D. A Novel Diruthenium Acetylide Donor Complex as an Unusual Active Material for Bulk Heterojunction Solar Cells. Organometallics 2011, 30, 1279–1282. [Google Scholar] [CrossRef]
- Canola, S.; Mardegan, L.; Bergamini, G.; Villa, M.; Acocella, A.; Zangoli, M.; Ravotto, L.; Vinogradov, S.A.; Di Maria, F.; Ceroni, P.; et al. One- and two-photon absorption properties of quadrupolar thiophene-based dyes with acceptors of varying strengths. Photochem. Photobiol. Sci. 2019. [Google Scholar] [CrossRef] [PubMed]
- Garoni, E.; Nisic, F.; Colombo, A.; Fantacci, S.; Griffini, G.; Kamada, K.; Roberto, D.; Dragonetti, C. Perylenetetracarboxy-3,4:9,10-diimide derivatives with large two-photon absorption activity. New J. Chem. 2019, 43, 1885–1893. [Google Scholar] [CrossRef]
- Iagatti, A.; Patrizi, B.; Basagni, A.; Marcelli, A.; Alessi, A.; Zanardi, S.; Fusco, R.; Salvalaggio, M.; Bussotti, L.; Foggi, P. Photophysical properties and excited state dynamics of 4,7-dithien-2-yl-2,1,3-benzothiadiazole. Phys. Chem. Chem. Phys. 2017, 19, 13604–13613. [Google Scholar] [CrossRef] [PubMed]
- Liu, X.T.; Zhao, Y.; Ren, A.M.; Feng, J.K. A comparative study of one- and two-photon absorption properties of pyrene and perylene diimide derivatives. J. Mol. Model. 2011, 17, 1413–1425. [Google Scholar] [CrossRef]
- Kamada, K.; Ohta, K.; Yoichiro, I.; Kondo, K. Two-photon absorption properties of symmetric substituted diacetylene: Drastic enhancement of the cross section near the one-photon absorption peak. Chem. Phys. Lett. 2003, 372, 386–393. [Google Scholar] [CrossRef]
- Kamada, K.; Iwase, Y.; Sakai, K.; Kondo, K.; Ohta, K. Cationic two-photon absorption chromophores with double- and triple-bond cores in symmetric/asymmetric arrangements. J. Phys. Chem. C 2009, 113, 11469–11474. [Google Scholar] [CrossRef]
- Albota, M.; Beljonne, D.; Brédas, J.-L.; Ehrlich, J.E.; Fu, J.-Y.; Heikal, A.A.; Hess, S.E.; Kogej, T.; Levin, M.D.; Marder, S.R.; et al. Design of Organic Molecules with Large Two-Photon Absorption Cross Sections. Science 1998, 281, 1653–1656. [Google Scholar] [CrossRef] [PubMed] [Green Version]
- Sheik-Bahae, M.; Said, A.A.; Wei, T.H.; Hagan, D.J.; Van Stryland, E.W. Sensitive measurement of optical nonlinearities using a single beam. IEEE J. Quantum Electron. 1990, 26, 760–769. [Google Scholar] [CrossRef]
- Kamada, K.; Matsunaga, K.; Yoshino, A.; Ohta, K. Two-photon-absorption-induced accumulated thermal effect on femtosecond Z-scan experiments studied with time-resolved thermal-lens spectrometry and its simulation. J. Opt. Soc. Am. B 2002, 20, 529–537. [Google Scholar] [CrossRef]
- Kamada, K.; Ohta, K.; Kubo, T.; Shimizu, A.; Morita, Y.; Nakasuji, K.; Kishi, R.; Ohta, S.; Furukawa, S.; Takahashi, H.; et al. Strong two-photon absorption of singlet diradical hydrocarbons. Angew. Chem. Int. Ed. 2007, 46, 3544–3546. [Google Scholar] [CrossRef] [PubMed]
- Triadon, A.; Grelaud, G.; Richy, N.; Mongin, O.; Moxey, G.J.; Dixon, I.M.; Yang, X.; Wang, G.; Barlow, A.; Rault-Berthelot, J.; et al. Linear and Third-Order Nonlinear Optical Properties of Fe(η5-C5Me5)(κ2-dppe)- and trans-Ru(κ2-dppe)2-Alkynyl Complexes Containing 2-Fluorenyl End Groups. Organometallics 2018, 37, 2245–2262. [Google Scholar] [CrossRef]
- Chen, Z.; Jeffery, C.J.; Morshedi, M.; Moxey, G.J.; Barlow, A.; Yang, X.; Babgi, B.A.; Dalton, G.T.; Randles, M.D.; Smith, M.K.; et al. Syntheses, Electrochemical, Linear Optical, and Cubic Nonlinear Optical Properties of Ruthenium–Alkynyl-Functionalized Oligo(phenylenevinylene) Stars. ChemPlusChem 2015, 80, 1329–1340. [Google Scholar] [CrossRef]


| Ru-1 | Ru-2 | ||
|---|---|---|---|
| S1 | 1.72 eV (720 nm), f = 0.87 | S1 | 1.65 eV (753 nm), f = 0.88 |
| HOMO → LUMO, (93.9%) | HOMO → LUMO, (99.0%) | ||
| S4 | 2.03 eV (610 nm), f = 0.19 | S9 | 2.85 eV (434 nm), f = 0.09 |
| HOMO-1 → LUMO, (6.1%) | HOMO-5 →LUMO, (88.2%) | ||
| HOMO-1 → LUMO+1, (89.6%) | HOMO → LUMO+3, (8.2%) | ||
| S11 | 3.04 eV (408 nm), f = 1.21 | S10 | 2.91 eV (427 nm), f = 1.30 |
| HOMO-1 → LUMO+4, (5.0%) | HOMO-5 → LUMO, (8.2%) | ||
| HOMO → LUMO+3, (87.8%) | HOMO → LUMO+3, (84.8%) | ||
| Wavelength/nm | ||
|---|---|---|
| Ru-1 | Ru-2 | |
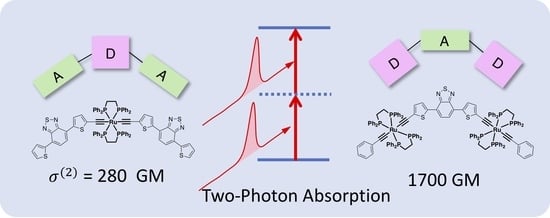
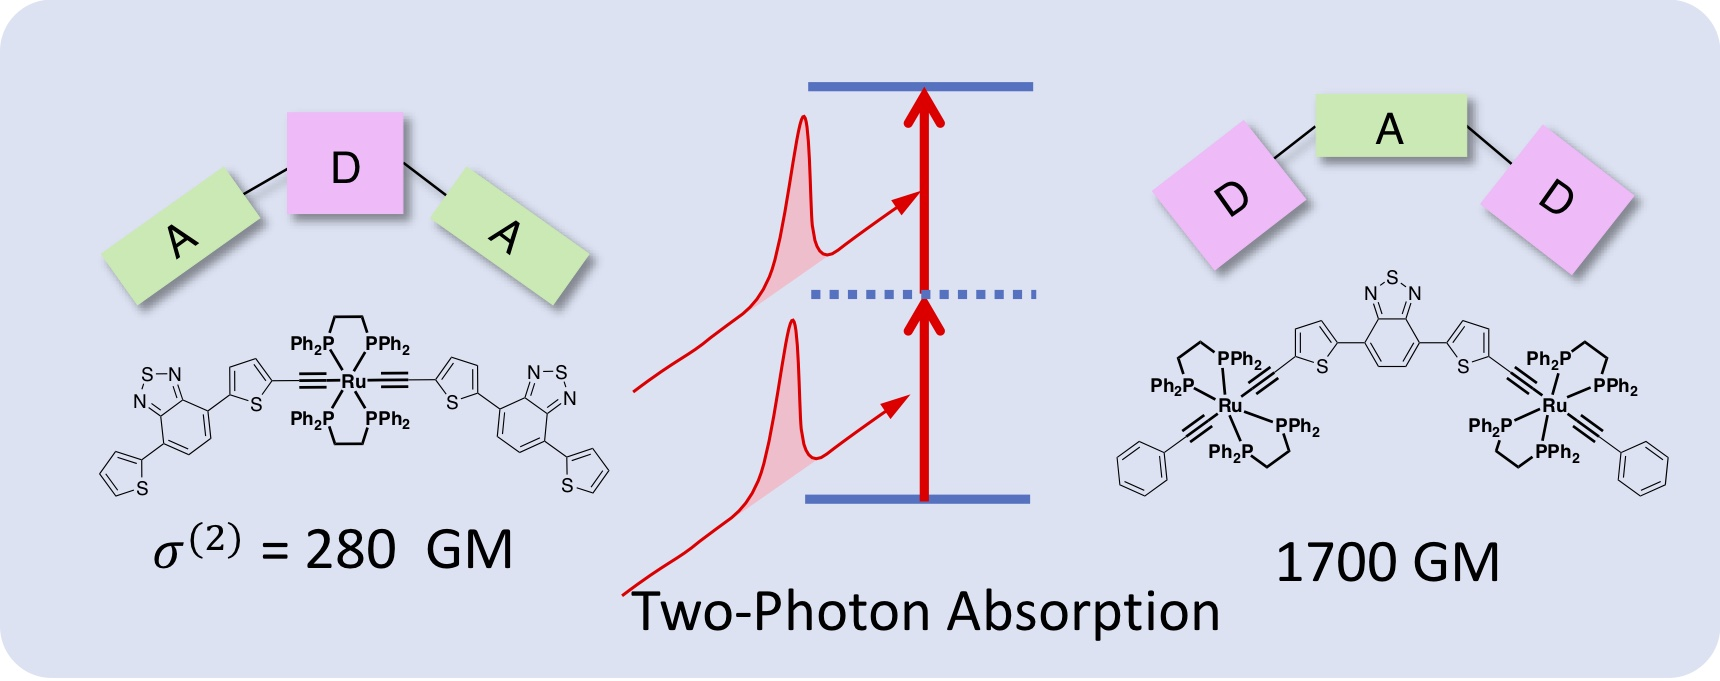
| 800 | 280 ± 40 | 1700 ± 170 ** |
| 840 | 260 ± 30 | 1100 ± 110 ** |
| 960 | 110 ± 30 | 620 ± 120 |
| 970 | 120 ± 20 | 780 ± 130 |
| Complex | |||||
|---|---|---|---|---|---|
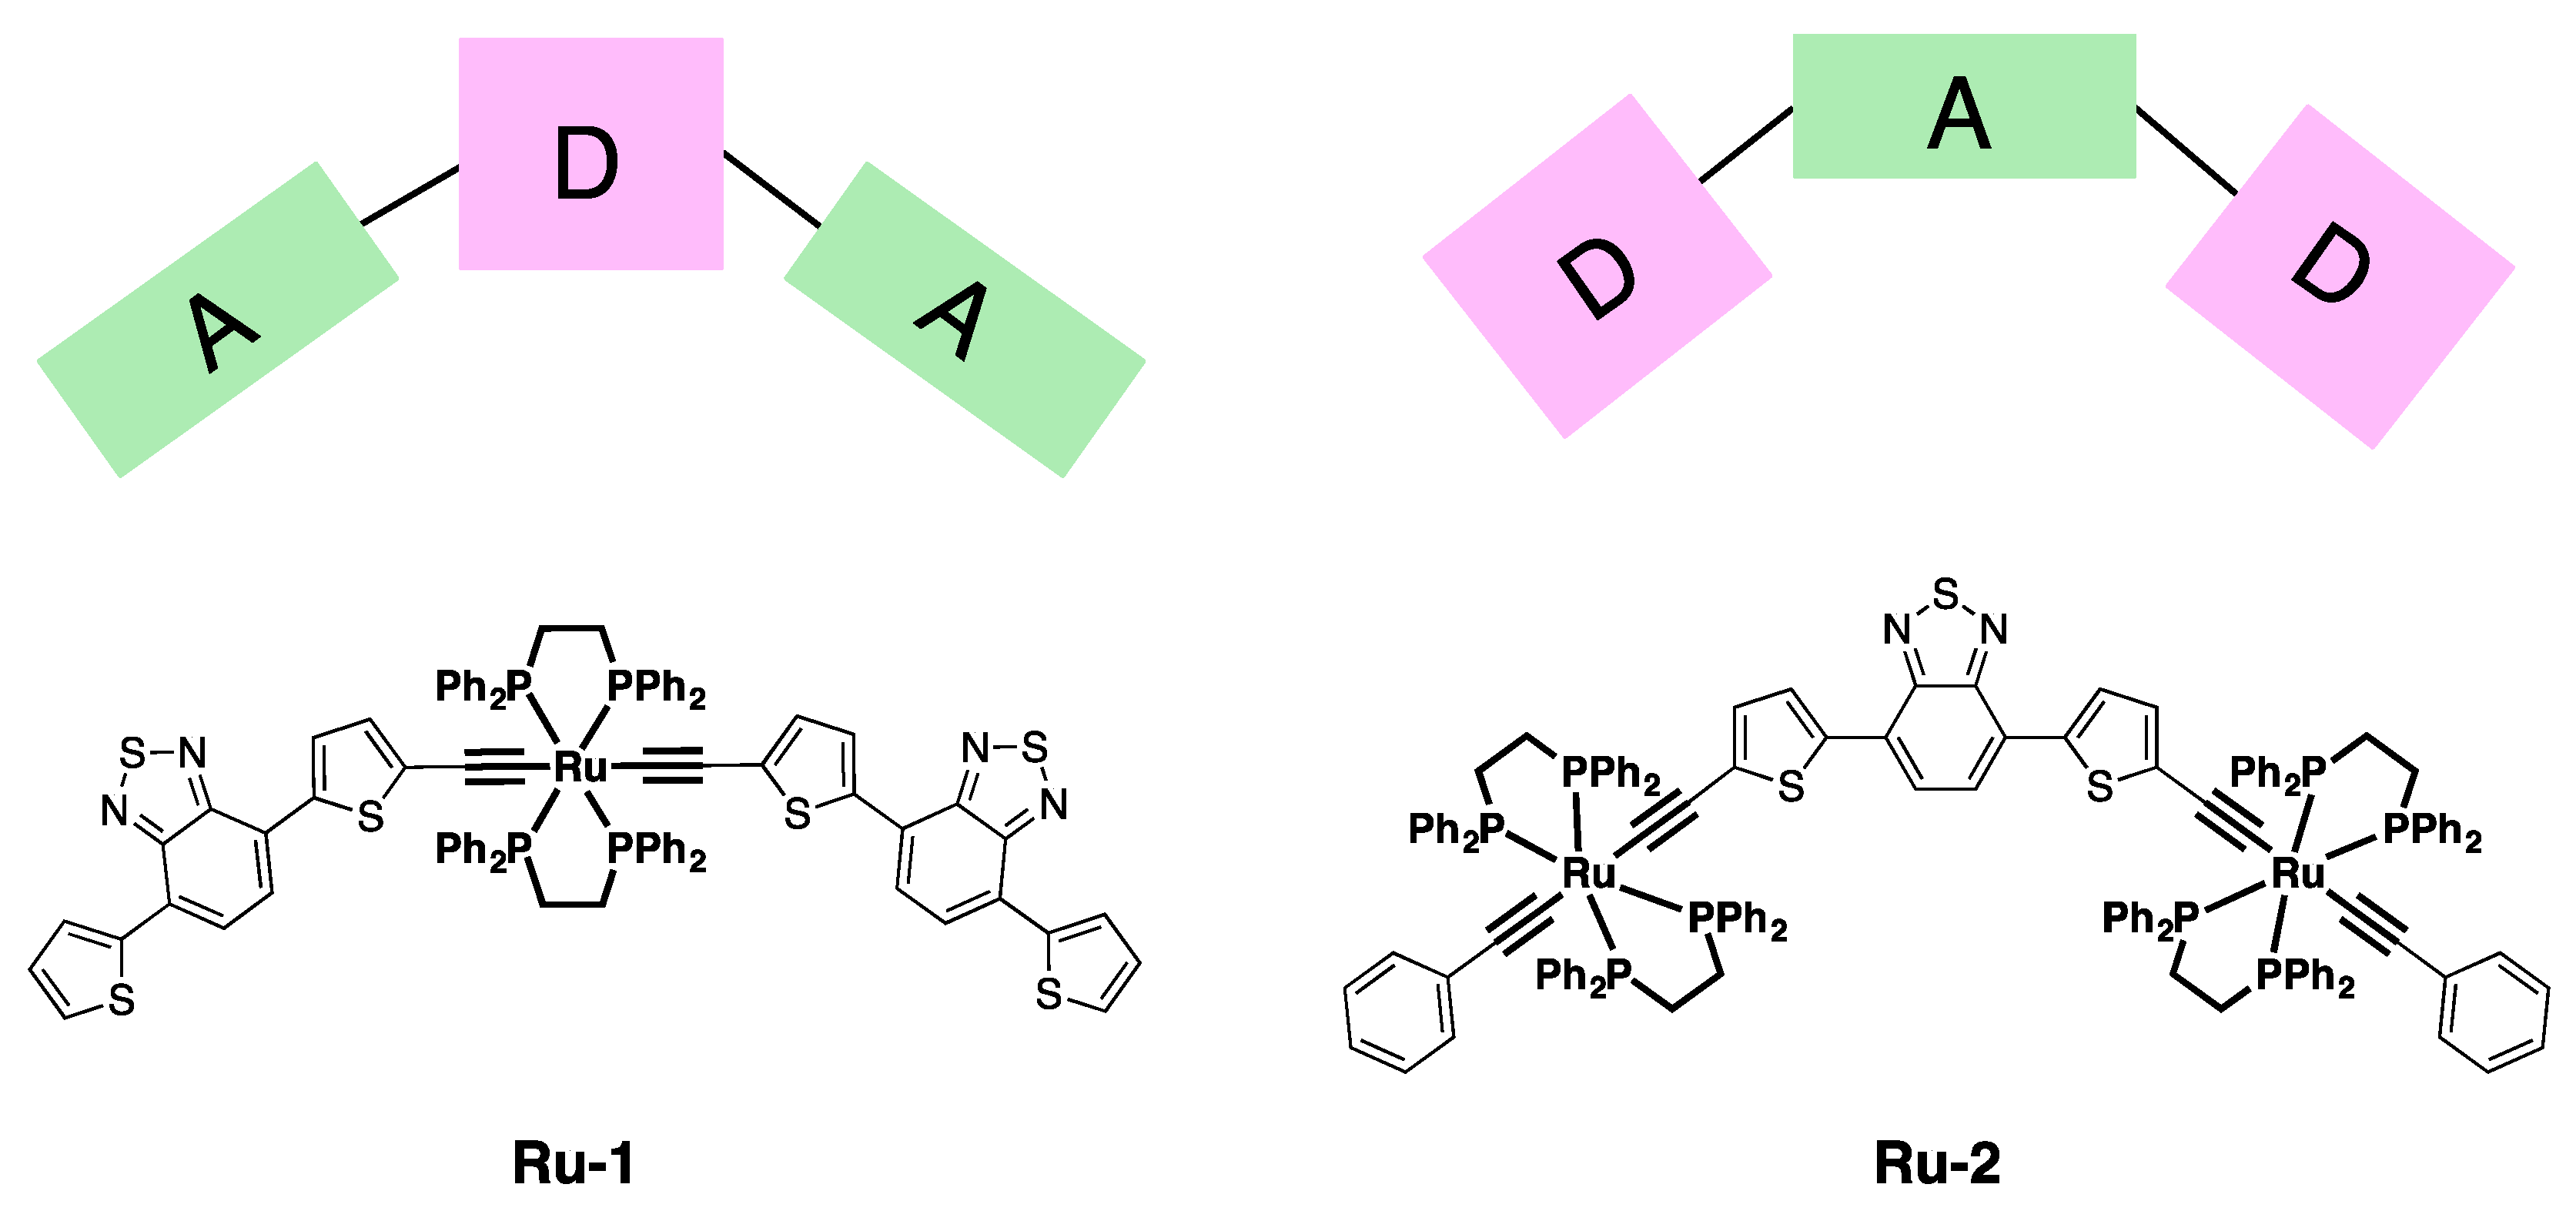
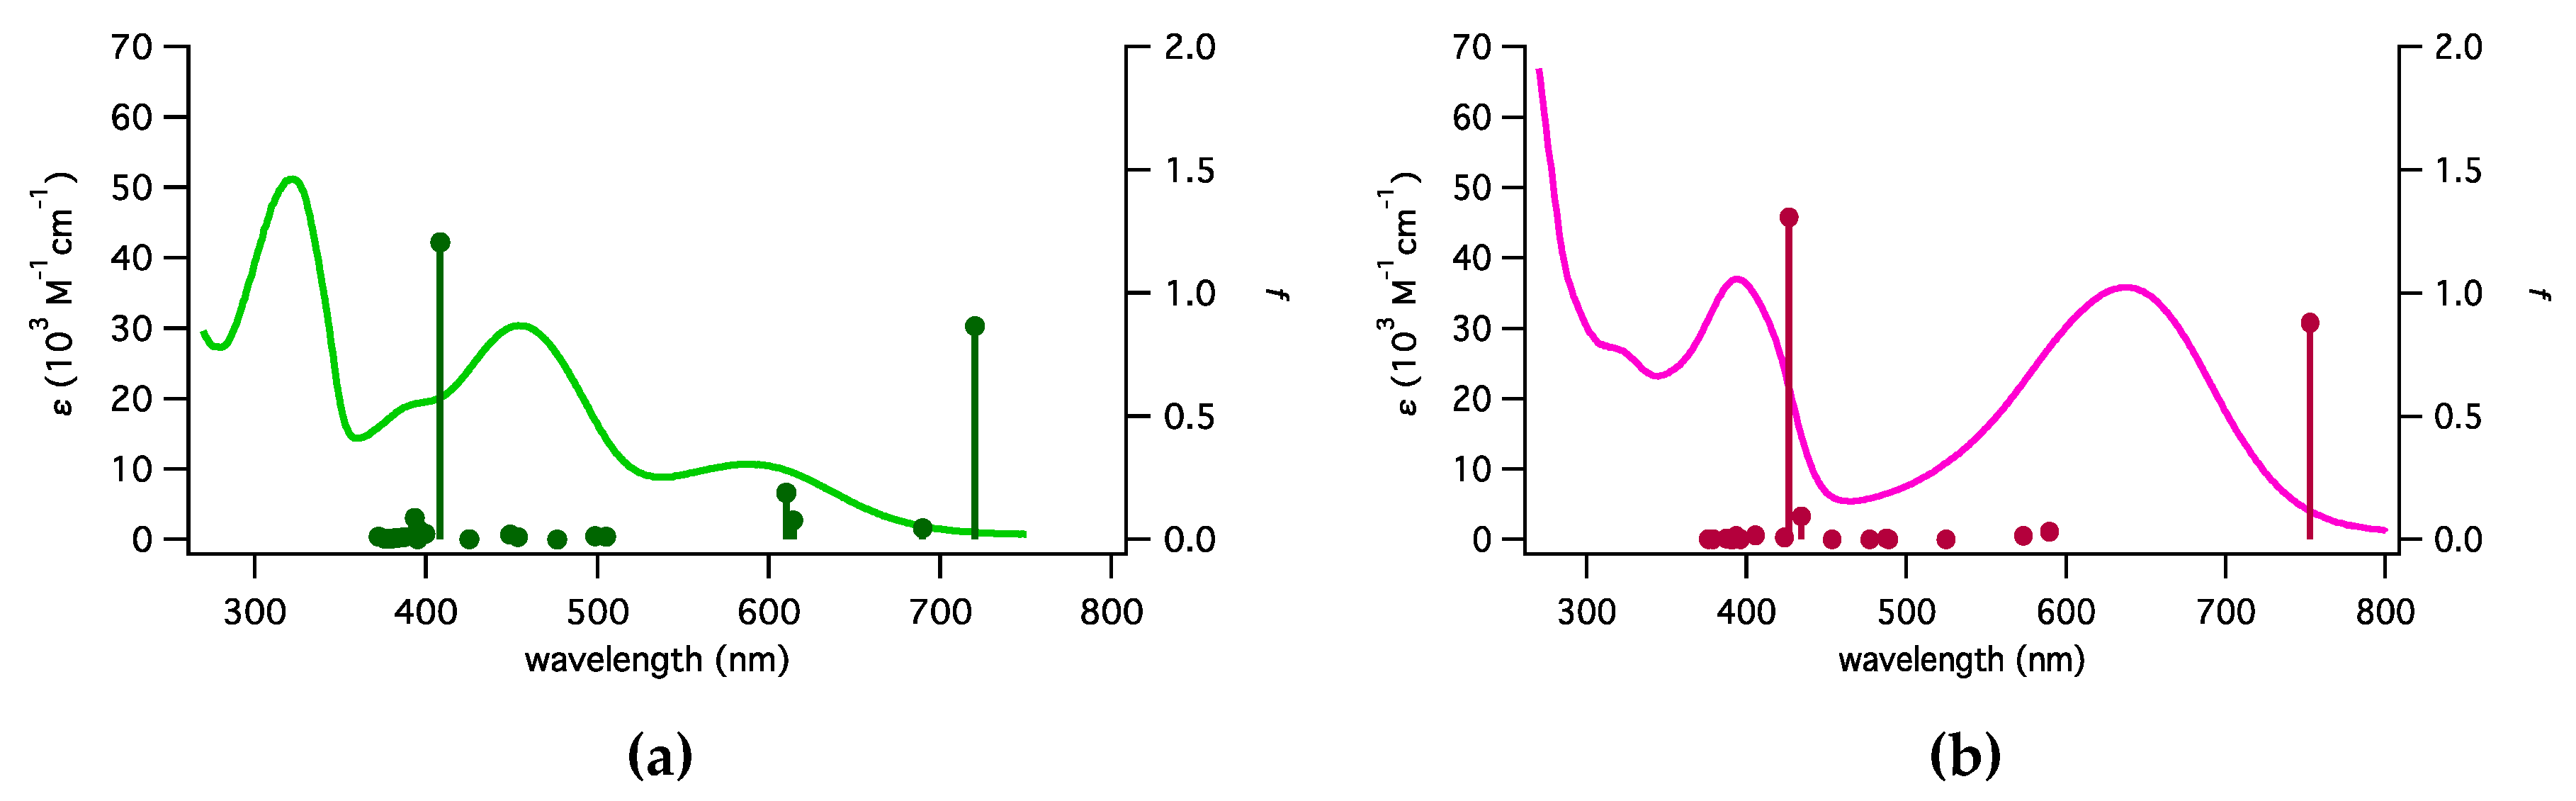
| Exp. (DCM) | Ru-1 | 2.72 (455) | 2.07 (600) | 0.258 | 15 (1) |
| Ru-2 | 3.14 (395) | 1.95 (635) | 0.122 | 67 (4.5) | |
| Calc. (vacuum) | Ru-1 | 2.03 (611) | 1.72 (721) | 0.347 | 8.3 (1) |
| Ru-2 | 2.91 (426) | 1.65 (751) | 0.067 | 220 (27) |
© 2019 by the authors. Licensee MDPI, Basel, Switzerland. This article is an open access article distributed under the terms and conditions of the Creative Commons Attribution (CC BY) license (http://creativecommons.org/licenses/by/4.0/).
Share and Cite
Garoni, E.; Colombo, A.; Kamada, K.; Dragonetti, C.; Roberto, D. Impact of the Subunit Arrangement on the Nonlinear Absorption Properties of Organometallic Complexes with Ruthenium(II) σ-Acetylide and Benzothiadiazole as Building Units §. Inorganics 2019, 7, 67. https://0-doi-org.brum.beds.ac.uk/10.3390/inorganics7050067
Garoni E, Colombo A, Kamada K, Dragonetti C, Roberto D. Impact of the Subunit Arrangement on the Nonlinear Absorption Properties of Organometallic Complexes with Ruthenium(II) σ-Acetylide and Benzothiadiazole as Building Units §. Inorganics. 2019; 7(5):67. https://0-doi-org.brum.beds.ac.uk/10.3390/inorganics7050067
Chicago/Turabian StyleGaroni, Eleonora, Alessia Colombo, Kenji Kamada, Claudia Dragonetti, and Dominique Roberto. 2019. "Impact of the Subunit Arrangement on the Nonlinear Absorption Properties of Organometallic Complexes with Ruthenium(II) σ-Acetylide and Benzothiadiazole as Building Units §" Inorganics 7, no. 5: 67. https://0-doi-org.brum.beds.ac.uk/10.3390/inorganics7050067