Morphology and Structural Stability of Bismuth-Gadolinium Co-Doped Ceria Electrolyte Nanopowders

 ,
,  , ,
, ,
Abstract
:
1. Introduction
2. Results and Discussion
3. Materials and Methods
4. Conclusions
Author Contributions
Funding
Conflicts of Interest
References
- Zhang, Y.; Knibbe, R.; Sunarso, J.; Zhong, Y.; Zhou, W.; Shao, Z.; Zhu, Z. Recent Progress on Advanced Materials for Solid-Oxide Fuel Cells Operating Below 500 °C. Adv. Mater. 2017, 29, 1700132. [Google Scholar] [CrossRef] [PubMed]
- Wang, P.; Wang, J.; Fu, L.; Wu, Y.; van Ree, T. Metal oxides in fuel cells. In Metal Oxides in Energy Technologies; Wu, Y., Ed.; Elsevier: Amsterdam, The Netherlands, 2018; pp. 17–47. [Google Scholar]
- Dell’Agli, G.; Spiridigliozzi, L.; Pansini, M.; Accardo, G.; Yoon, S.P.; Frattini, D. Effect of the carbonate environment on morphology and sintering behaviour of variously co-doped (Ca, Sr, Er, Pr) Samarium-doped Ceria in co-precipitation/hydrothermal synthesis. Ceram. Int. 2018, 44, 17935–17944. [Google Scholar] [CrossRef]
- Shao, Z.; Tadé, M.O. Application of SOFC Technology. In Energy Technology 2016; Springer International Publishing: Cham, Switzerland, 2016; pp. 247–266. [Google Scholar]
- De Marco, V.; Grazioli, A.; Sglavo, V.M. Production of planar copper-based anode supported intermediate temperature solid oxide fuel cells cosintered at 950 °C. J. Power Sources 2016, 328, 235–240. [Google Scholar] [CrossRef]
- De Marco, V.; Iannaci, A.; Rashid, S.; Sglavo, V.M. Effect of anode thickness and Cu content on consolidation and performance of planar copper-based anode-supported SOFC. Int. J. Hydrogen Energy 2017, 42, 12543–12550. [Google Scholar] [CrossRef]
- Gil, V.; Moure, C.; Durán, P.; Tartaj, J. Low-temperature densification and grain growth of Bi2O3 -doped-ceria gadolinia ceramics. Solid State Ion. 2007, 178, 359–365. [Google Scholar] [CrossRef]
- Kumar, K.; Singh, N.K.; Park, H.-S.; Parkash, O. Doping effect of copper ion (Cu2+) on the conductivity behaviour of ceria (Ce1−xCuxO1−δ) electrolyte. RSC Adv. 2016, 6, 49883–49890. [Google Scholar] [CrossRef]
- Ali, S.A.M.; Anwar, M.; Abdalla, A.M.; Somalu, M.R.; Muchtar, A. Ce0.80Sm0.10Ba0.05Er0.05O2−δ multi-doped ceria electrolyte for intermediate temperature solid oxide fuel cells. Ceram. Int. 2017, 43, 1265–1271. [Google Scholar] [CrossRef]
- Ayawanna, J.; Wattanasiriwech, D.; Wattanasiriwech, S.; Aungkavattana, P. Effects of cobalt metal addition on sintering and ionic conductivity of Sm(Y)-doped ceria solid electrolyte for SOFC. Solid State Ion. 2009, 180, 1388–1394. [Google Scholar] [CrossRef]
- Nicholas, J.D.; De Jonghe, L.C. Prediction and evaluation of sintering aids for Cerium Gadolinium Oxide. Solid State Ion. 2007, 178, 1187–1194. [Google Scholar] [CrossRef]
- Spiridigliozzi, L.; Dell’Agli, G.; Marocco, A.; Accardo, G.; Pansini, M.; Yoon, S.P.; Ham, H.C.; Frattini, D. Engineered co-precipitation chemistry with ammonium carbonate for scalable synthesis and sintering of improved Sm0.2Ce0.8O1.90 and Gd0.16Pr0.04Ce0.8O1.90 electrolytes for IT-SOFCs. J. Ind. Eng. Chem. 2018, 59, 17–27. [Google Scholar] [CrossRef]
- Spiridigliozzi, L.; Pinter, L.; Biesuz, M.; Dell’Agli, G.; Accardo, G.; Sglavo, V.M. Gd/Sm-Pr Co-Doped Ceria: A First Report of the Precipitation Method Effect on Flash Sintering. Materials 2019, 12, 1218. [Google Scholar] [CrossRef] [PubMed]
- Dell’Agli, G.; Spiridigliozzi, L.; Marocco, A.; Accardo, G.; Frattini, D.; Kwon, Y.; Yoon, S.P. Morphological and crystalline evolution of Sm-(20% mol)–doped ceria nanopowders prepared by a combined co-precipitation/hydrothermal synthesis for solid oxide fuel cell applications. Ceram. Int. 2017, 43, 12799–12808. [Google Scholar] [CrossRef]
- Biesuz, M.; Dell’Agli, G.; Spiridigliozzi, L.; Ferone, C.; Sglavo, V.M. Conventional and Field-Assisted Sintering of Nanosized Gd-doped Ceria Synthesized by Co-precipitation. Ceram. Int. 2016, 42, 11766–11771. [Google Scholar] [CrossRef]
- Biesuz, M.; Spiridigliozzi, L.; Frasnelli, M.; Dell’Agli, G.; Sglavo, V.M. Rapid densification of Samarium-doped Ceria ceramic with nanometric grain size at 900–1100 °C. Mater. Lett. 2017, 190, 17–19. [Google Scholar] [CrossRef]
- Accardo, G.; Frattini, D.; Ham, H.C.; Han, J.H.; Yoon, S.P. Improved microstructure and sintering temperature of bismuth nano-doped GDC powders synthesized by direct sol-gel combustion. Ceram. Int. 2018, 44, 3800–3809. [Google Scholar] [CrossRef]
- Accardo, G.; Frattini, D.; Ham, H.C.; Yoon, S.P. Direct addition of lithium and cobalt precursors to Ce0.8Gd0.2O1.95 electrolytes to improve microstructural and electrochemical properties in IT-SOFC at lower sintering temperature. Ceram. Int. 2019, 45, 9348–9358. [Google Scholar] [CrossRef]
- Spiridigliozzi, L.; Dell’Agli, G.; Accardo, G.; Yoon, S.P.; Frattini, D. Electro-morphological, structural, thermal and ionic conduction properties of Gd/Pr co-doped ceria electrolytes exhibiting mixed Pr3+/Pr4+ cations. Ceram. Int. 2019, 45, 4570–4580. [Google Scholar] [CrossRef]
- Sanna, S.; Esposito, V.; Christensen, M.; Pryds, N. High ionic conductivity in confined bismuth oxide-based heterostructures. APL Mater. 2016, 4, 121101. [Google Scholar] [CrossRef] [Green Version]
- Jung, D.W.; Lee, K.T.; Wachsman, E.D. Terbium and Tungsten Co-doped Bismuth Oxide Electrolytes for Low Temperature Solid Oxide Fuel Cells. J. Korean Ceram. Soc. 2014, 51, 260–264. [Google Scholar] [CrossRef] [Green Version]
- Jolley, A.G.; Jayathilake, R.; Wachsman, E.D. Optimizing rhombohedral Bi2O3 conductivity for low temperature SOFC electrolytes. Ionics 2019. [Google Scholar] [CrossRef]
- Wang, J.; Chen, X.; Xie, S.; Chen, L.; Wang, Y.; Meng, J.; Zhou, D. Bismuth tungstate/neodymium-doped ceria composite electrolyte for intermediate-temperature solid oxide fuel cell: Sintering aid and composite effect. J. Power Sources 2019, 428, 105–114. [Google Scholar] [CrossRef]
- Jung, D.W.; Duncan, K.L.; Wachsman, E.D. Effect of total dopant concentration and dopant ratio on conductivity of (DyO1.5)x–(WO3)y–(BiO1.5)1−x−y. Acta Mater. 2010, 58, 355–363. [Google Scholar] [CrossRef]
- Li, G.; Li, L.; Feng, S.; Wang, M.; Zhang, L.; Yao, X. An Effective Synthetic Route for a Novel Electrolyte: Nanocrystalline Solid Solutions of (CeO2)1−x(BiO1.5)x. Adv. Mater. 1999, 11, 146–149. [Google Scholar] [CrossRef]
- Chen, X.L.; Eysel, W. The Stabilization of β-Bi2O3 by CeO2. J. Solid State Chem. 1996, 127, 128–130. [Google Scholar] [CrossRef]
- Bourja, L.; Bakiz, B.; Benlhachemi, A.; Ezahri, M.; Valmalette, J.C.; Villain, S.; Gavarri, J.R. Structural and Raman Vibrational Studies of CeO2-Bi2O3 Oxide System. Adv. Mater. Sci. Eng. 2009, 2009, 1–4. [Google Scholar] [CrossRef]
- Zagaynov, I.V.; Fedorov, S.V.; Konovalov, A.A.; Antonova, O.S. Perspective ceria-based solid solution of GdxBi0.2−xCe0.8O2. Mater. Lett. 2017, 203, 9–12. [Google Scholar] [CrossRef]
- Gil, V.; Tartaj, J.; Moure, C.; Duran, P. Effect of Bi2O3 addition on the sintering and microstructural development of gadolinia-doped ceria ceramics. J. Eur. Ceram. Soc. 2007, 27, 801–805. [Google Scholar] [CrossRef]
- Li, Z.-C.; Zhang, H.; Bergman, B. Synthesis and characterization of nanostructured Bi2O3-doped cerium oxides fabricated by PVA polymerization process. Ceram. Int. 2008, 34, 1949–1953. [Google Scholar] [CrossRef]
- Dikmen, S.; Shuk, P.; Greenblatt, M. Hydrothermal synthesis and properties of Ce1−xBixO2−d solid solutions. Solid State Ion. 1998, 11, 299–307. [Google Scholar] [CrossRef]
- Prekajski, M.; Fruth, V.; Andronescu, C.; Trandafilović, L.V.; Pantić, J.; Kremenović, A.; Matović, B. Thermal stability of Ce1−xBixO2−δ (x = 0.1–0.5) solid solution. J. Alloys Compd. 2013, 578, 26–31. [Google Scholar] [CrossRef]
- Gil, V.; Tartaj, J.; Moure, C.; Duran, P. Rapid densification by using Bi2O3 as an aid for sintering of gadolinia-doped ceria ceramics. Ceram. Int. 2007, 33, 471–475. [Google Scholar] [CrossRef]
- Accardo, G.; Kim, G.S.; Ham, H.C.; Yoon, S.P. Optimized lithium-doped ceramic electrolytes and their use in fabrication of an electrolyte-supported solid oxide fuel cell. Int. J. Hydrogen Energy 2019, 44, 12138–12150. [Google Scholar] [CrossRef]
- Accardo, G.; Ferone, C.; Cioffi, R.; Frattini, D.; Spiridigliozzi, L.; Dell’Agli, G. Electrical and microstructural characterization of ceramic gadolinium-doped ceria electrolytes for ITSOFCs by sol-gel route. J. Appl. Biomater. Funct. Mater. 2016, 14, e35–e41. [Google Scholar] [CrossRef] [PubMed]
- Lutterotti, L.; Bortolotti, M.; Ischia, G.; Lonardelli, I.; Wenk, H.-R. Rietveld texture analysis from diffraction images. Z. Kristallogr. Suppl. 2007, 2007, 125–130. [Google Scholar] [CrossRef]


| Sample | Composition | Bi (mol %) |
|---|---|---|
| 0.5Bi | Bi0.005Ce0.796Gd0.199O1.898 | 0.5 |
| 2Bi | Bi0.02Ce0.784Gd0.196O1.892 | 2 |
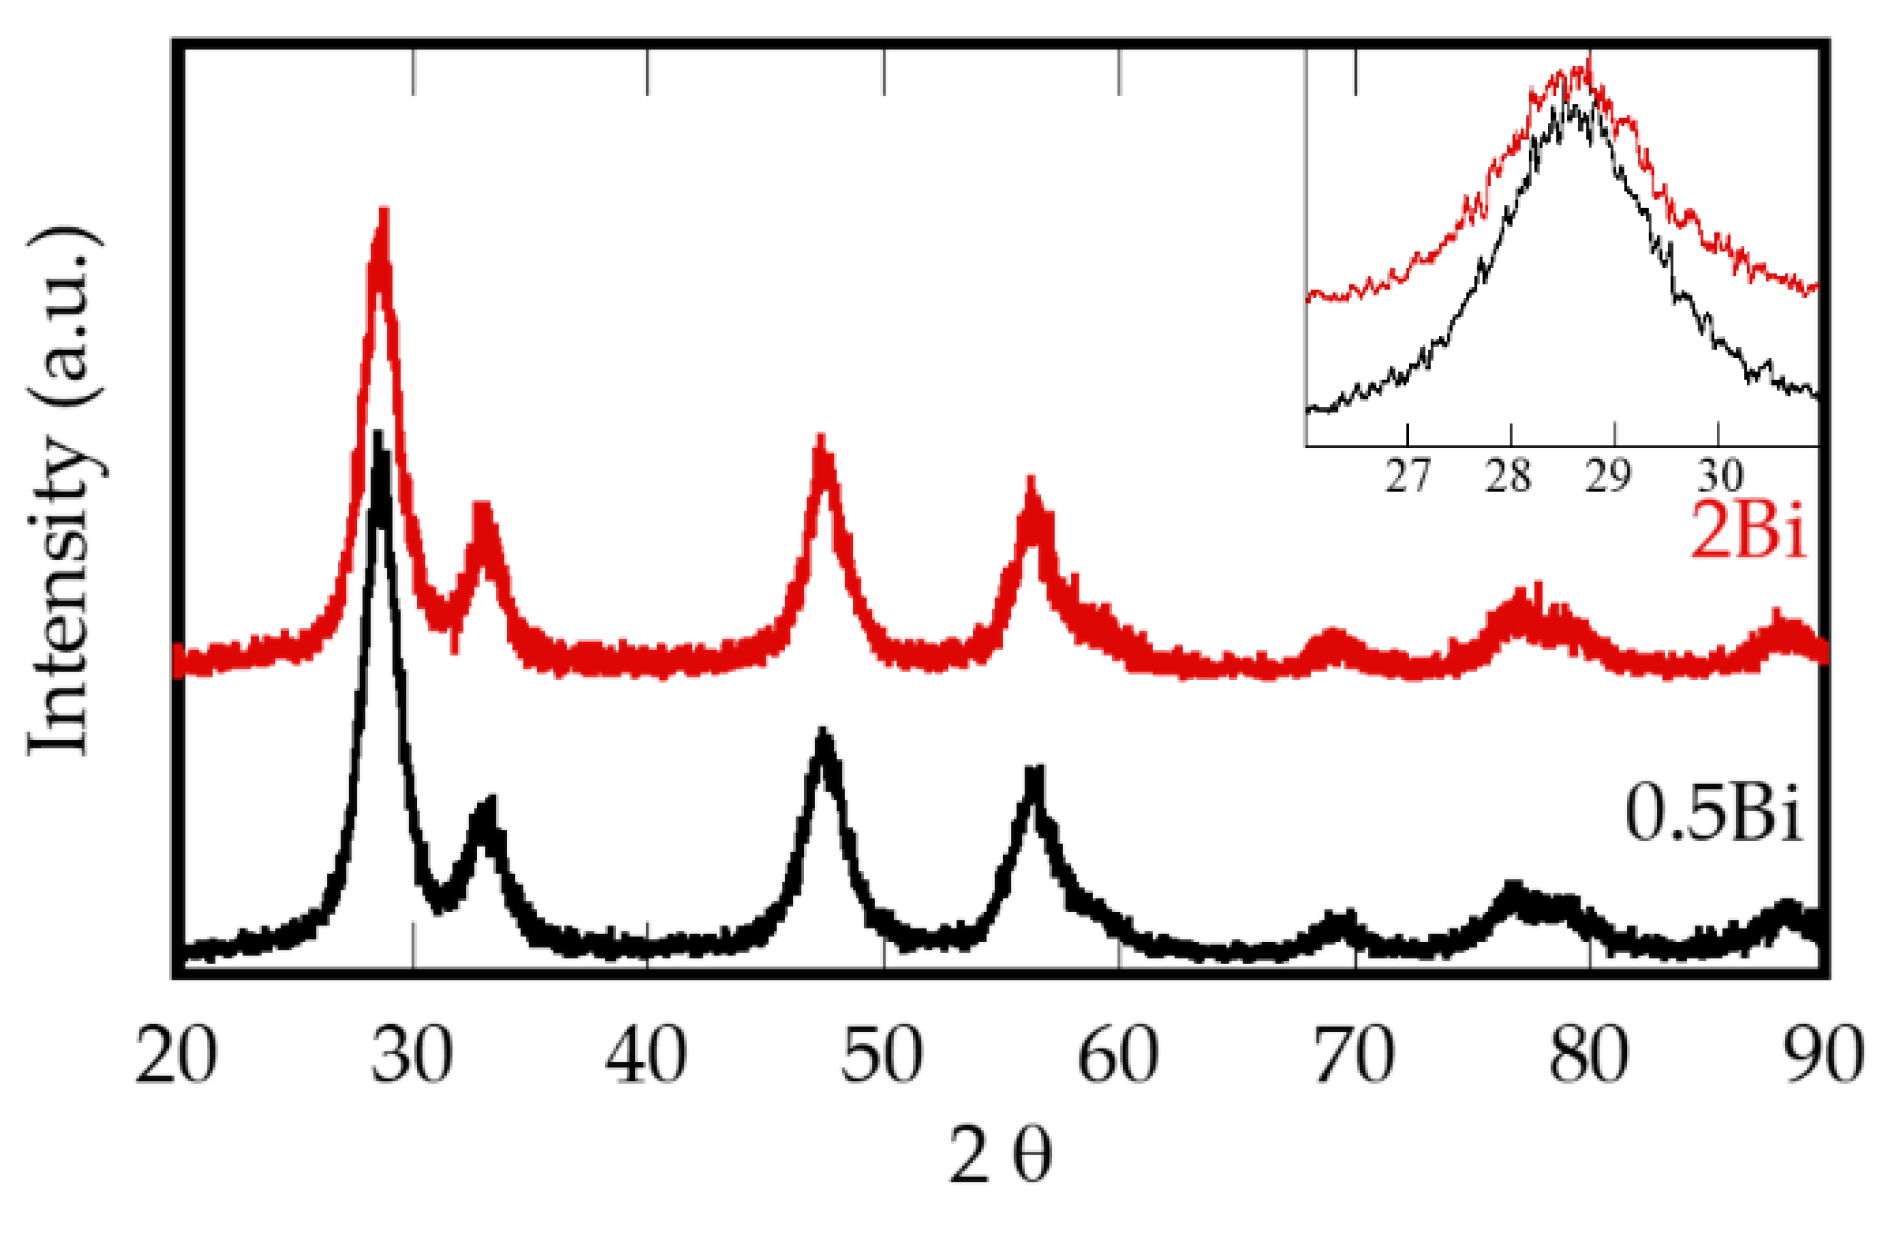
| Sample | Calcination Temperature | Lattice Parameter a (nm) | Crystal Size (nm) |
|---|---|---|---|
| 0.5Bi | 600 °C | 0.54284(5) | 18.7(2) |
| 2Bi | 600 °C | 0.54274(4) | 19.6(2) |
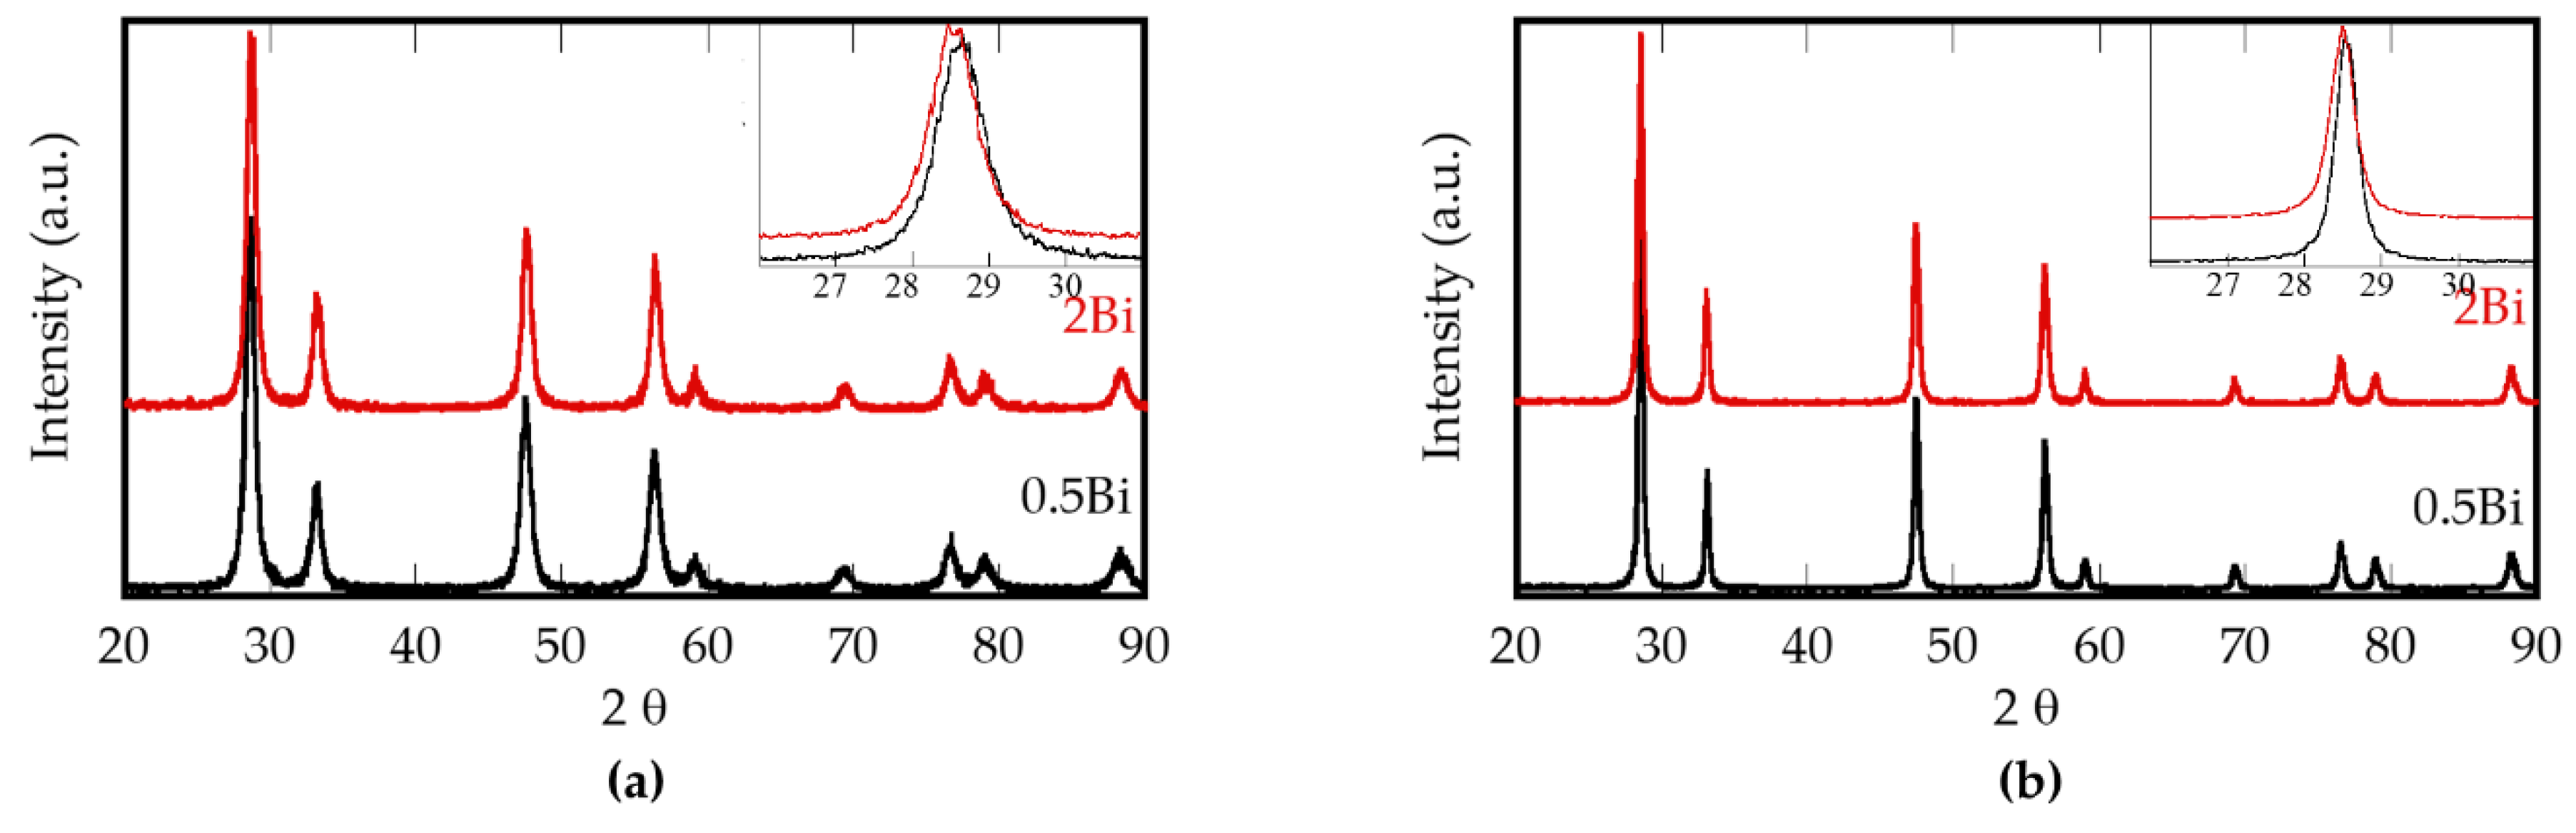
| 0.5Bi | 700 °C | 0.54270(2) | 50.9(4) |
| 2Bi | 700 °C | 0.54262(2) | 43.3(3) |
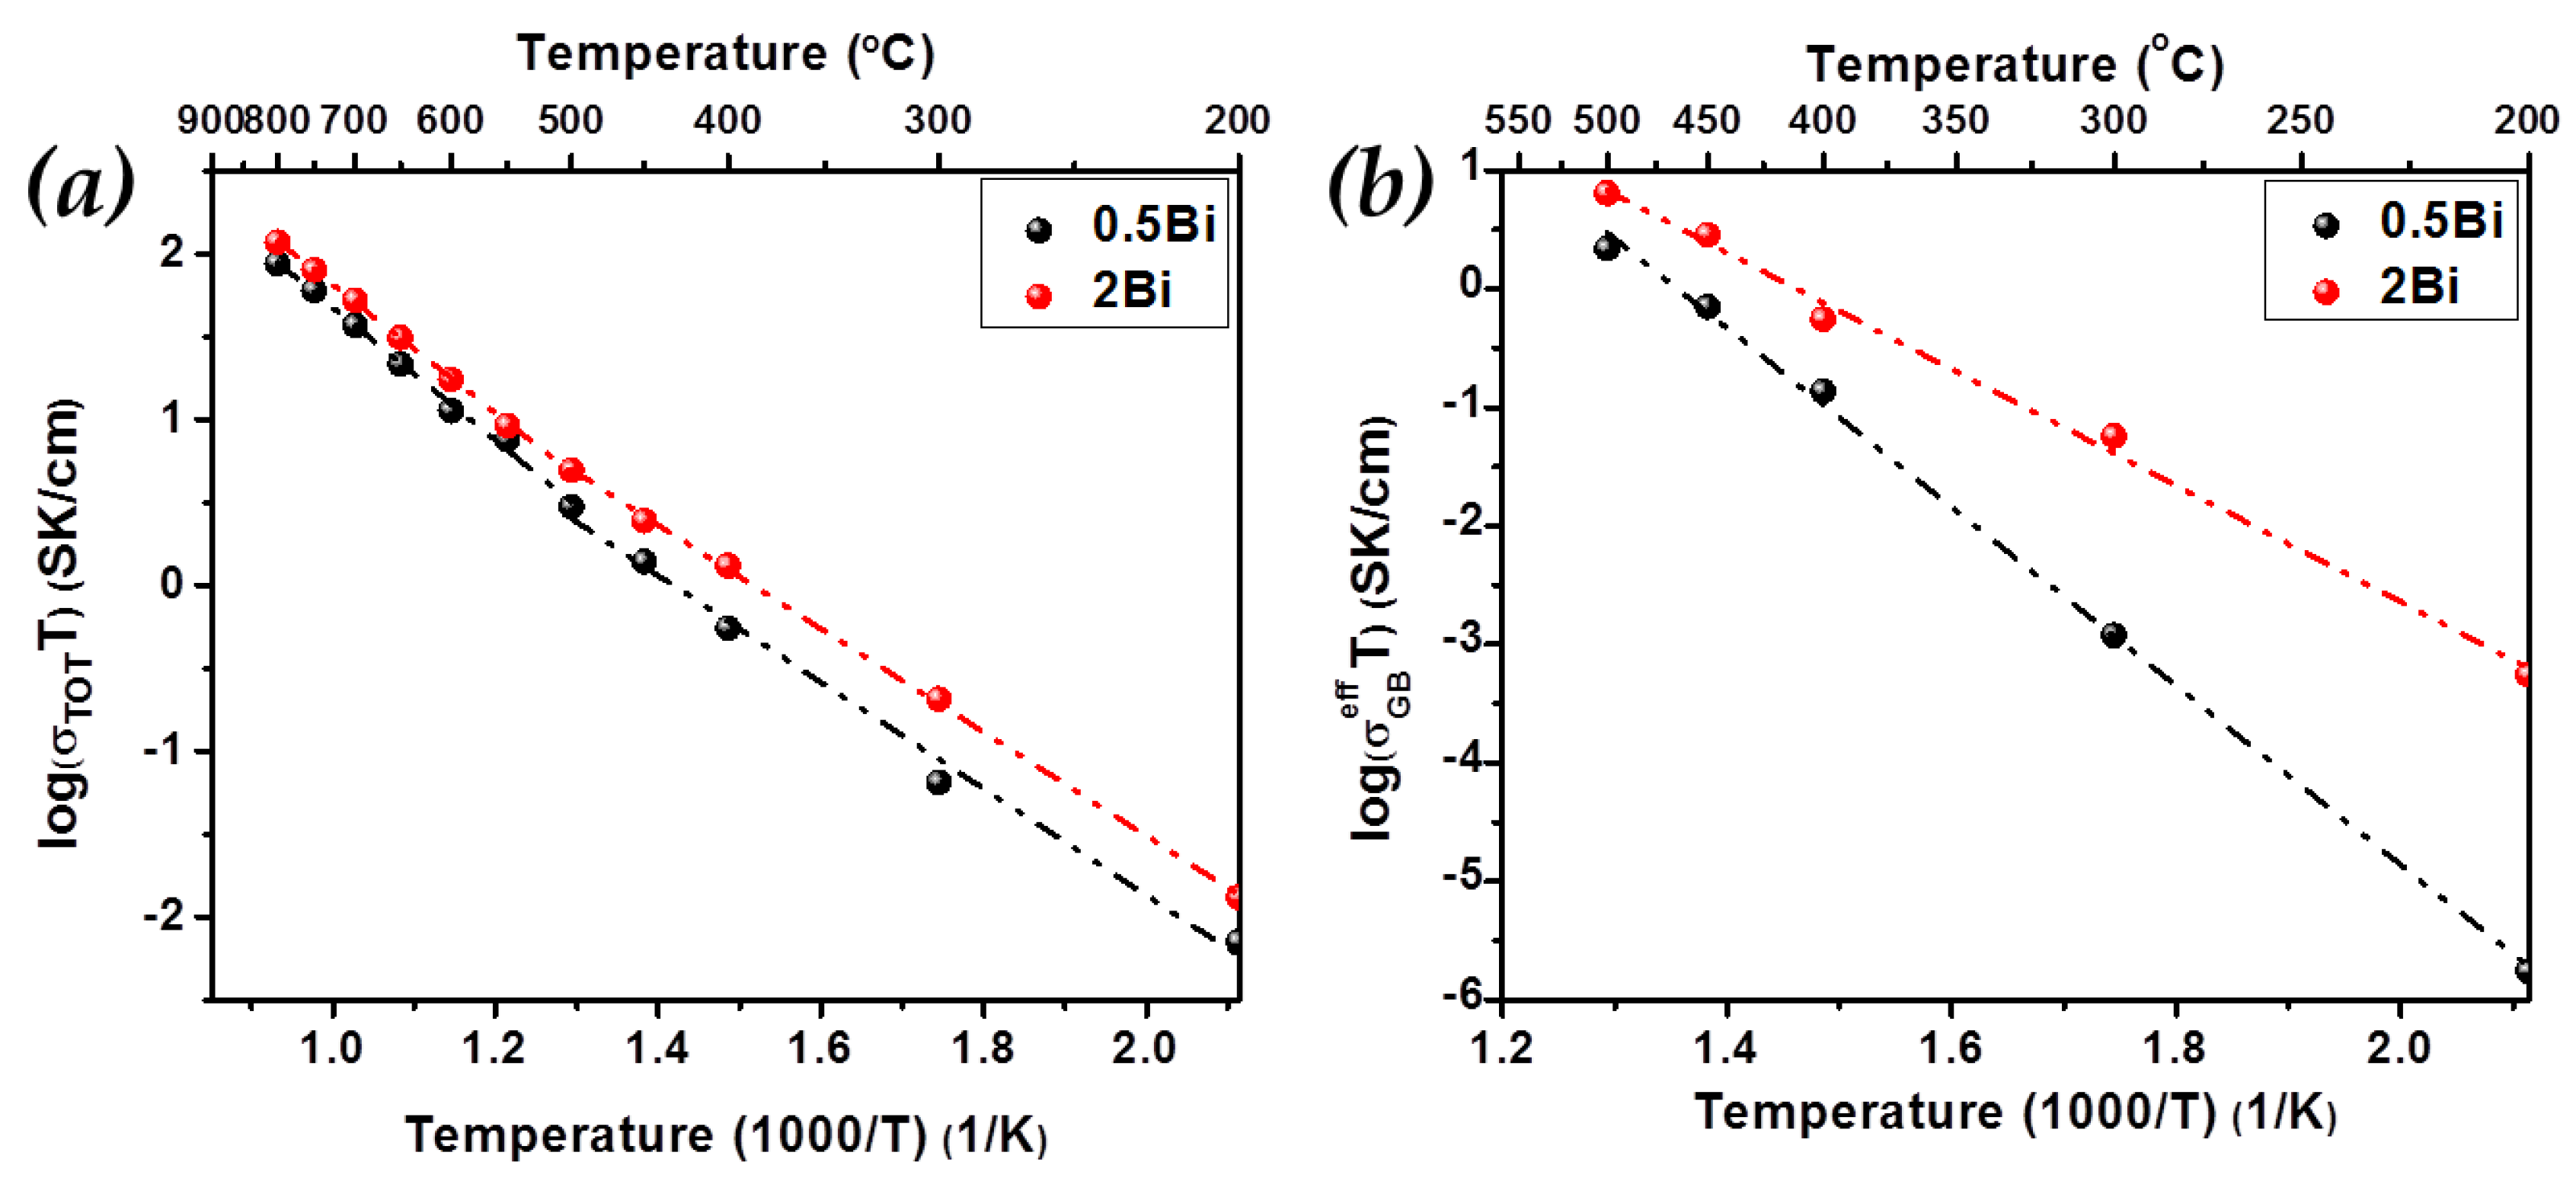
| σ/Ea | 0.5Bi | 2Bi |
|---|---|---|
| Ea(T ≤ 500 °C) (eV) | 0.63 | 0.61 |
| Ea(T ≥ 500 °C) (eV) | 0.79 | 0.76 |
| Ea(gb) (eV) | 1.49 | 0.97 |
| σ(400 °C) (S·cm−1) | 1.62 × 10⁻⁴ | 4.86 × 10⁻⁴ |
| σ(500 °C) (S·cm−1) | 2.12 × 10⁻³ | 3.62 × 10⁻³ |
| σ(550 °C) (S·cm−1) | 6.65 × 10⁻³ | 1.10 × 10⁻² |
| σ(600 °C) (S·cm−1) | 1.29 × 10⁻² | 1.99 × 10⁻² |
| σ(650 °C) (S·cm−1) | 2.33 × 10⁻² | 3.37 × 10⁻² |
| σ(700 °C) (S·cm−1) | 3.80 × 10⁻² | 5.39 × 10⁻² |
| σ(750 °C) (S·cm−1) | 5.87 × 10⁻² | 7.81 × 10⁻² |
| σ(800 °C) (S·cm−1) | 8.11 × 10⁻² | 1.10 × 10⁻¹ |
© 2019 by the authors. Licensee MDPI, Basel, Switzerland. This article is an open access article distributed under the terms and conditions of the Creative Commons Attribution (CC BY) license (http://creativecommons.org/licenses/by/4.0/).
Share and Cite
Accardo, G.; Spiridigliozzi, L.; Dell’Agli, G.; Yoon, S.P.; Frattini, D. Morphology and Structural Stability of Bismuth-Gadolinium Co-Doped Ceria Electrolyte Nanopowders. Inorganics 2019, 7, 118. https://0-doi-org.brum.beds.ac.uk/10.3390/inorganics7100118
Accardo G, Spiridigliozzi L, Dell’Agli G, Yoon SP, Frattini D. Morphology and Structural Stability of Bismuth-Gadolinium Co-Doped Ceria Electrolyte Nanopowders. Inorganics. 2019; 7(10):118. https://0-doi-org.brum.beds.ac.uk/10.3390/inorganics7100118
Chicago/Turabian StyleAccardo, Grazia, Luca Spiridigliozzi, Gianfranco Dell’Agli, Sung Pil Yoon, and Domenico Frattini. 2019. "Morphology and Structural Stability of Bismuth-Gadolinium Co-Doped Ceria Electrolyte Nanopowders" Inorganics 7, no. 10: 118. https://0-doi-org.brum.beds.ac.uk/10.3390/inorganics7100118