Article

The Influence of Co-Precipitation Technique on the Structure, Morphology and Dual-Modal Proton Relaxivity of GdFeO3 Nanoparticles

by
Yamen Albadi
1,2,*,
Maria S. Ivanova
3,
Leonid Y. Grunin
3,
Kirill D. Martinson
4,
Maria I. Chebanenko
4,
Svetlana G. Izotova
5,
Vladimir N. Nevedomskiy
6,
Rufat S. Abiev
7 and
Vadim I. Popkov
4
1
Department of Physicochemical Design of Functional Materials, Saint Petersburg State Institute of Technology, 190013 Saint Petersburg, Russia
2
Department of Analytical and Nutritional Chemistry, Faculty of Pharmacy, Al-Baath University, Homs 77, Syria
3
Department of Physics, Volga State University of Technology, 424000 Yoshkar-Ola, Russia
4
Laboratory of Materials and Processes for Hydrogen Energy, Ioffe Institute, 194021 Saint Petersburg, Russia
5
Department of Physical Chemistry, Saint Petersburg State Institute of Technology, 190013 Saint Petersburg, Russia
6
Center of Nanoheterostructure Physics, Ioffe Institute, 194021 Saint Petersburg, Russia
7
Department of Optimization of Chemical and Biotechnological Equipment, Saint Petersburg State Institute of Technology, 190013 Saint Petersburg, Russia
*
Author to whom correspondence should be addressed.
Submission received: 12 April 2021 / Revised: 30 April 2021 / Accepted: 10 May 2021 / Published: 12 May 2021
(This article belongs to the Section Inorganic Solid-State Chemistry)

Abstract

:
Nanocrystals of gadolinium orthoferrite (GdFeO3) with morphology close to isometric and superparamagnetic behavior were successfully synthesized using direct, reverse and microreactor co-precipitation of gadolinium and iron(III) hydroxides with their subsequent heat treatment in the air. The obtained samples were investigated by PXRD, FTIR, low-temperature nitrogen adsorption-desorption measurements, HRTEM, SAED, DRS and vibration magnetometry. According to the X-ray diffraction patterns, the GdFeO3 nanocrystals obtained using direct co-precipitation have the smallest average size, while the GdFeO3 nanocrystals obtained using reverse and microreactor co-precipitation have approximately the same average size. It was shown that the characteristic particle size values are much larger than the corresponding values of the average crystallite size, which indicates the aggregation of the obtained GdFeO3 nanocrystals. The GdFeO3 nanocrystals obtained using direct co-precipitation aggregate more than the GdFeO3 nanocrystals obtained using reverse co-precipitation, which, in turn, tend to aggregate more strongly than the GdFeO3 nanocrystals obtained using microreactor co-precipitation. The bandgap of the obtained GdFeO3 nanocrystals decreases with decreasing crystallite size, which is apparently due to their aggregation. The colloidal solutions of the obtained GdFeO3 nanocrystals with different concentrations were investigated by 1H NMR to measure the T1 and T2 relaxation times. Based on the obtained r2/r1 ratios, the GdFeO3 nanocrystals obtained using microreactor, direct and reverse co-precipitation may be classified as T1, T2 and T1T2 dual-modal MRI contrast agents, respectively.

Graphical Abstract

1. Introduction

To enhance the contrast of the abnormal tissue from the normal tissue on magnetic resonance imaging (MRI), contrast agents are used [1]. Contrast agents for MRI act by shortening the longitudinal and transverse relaxation times of water protons, which are denoted by T1 and T2, respectively [2]. As the T1 relaxation time decreases, the signal intensity on T1-weighted images increases and the affected regions appear brighter (positive contrast agents), while as the T2 relaxation time decreases, the signal intensity on T2-weighted images decreases and the affected regions appear darker (negative contrast agents) [3]. Since the effects of MRI contrast agents are typically more pronounced for either T1 or T2 relaxation times, they are classified as either T1 or T2 contrast agents, based on whether the relative decrease is larger for T1 or T2 [4,5]. Unlike single-mode (T1 or T2) MRI contrast agents, which do not always provide highly accurate anatomical details, T1T2 dual-modal MRI contrast agents can exhibit positive and negative contrasts, sharpen image information and improve diagnosis [6,7]. As a result, the development of T1T2 dual-modal contrast agents for MRI is scientifically and practically important.
Nanocrystalline gadolinium orthoferrite (GdFeO3) with orthorhombic perovskite structure containing gadolinium, which is involved in T1 contrast agents [8,9], and iron oxide, which is used as a T2 contrast agent as nanoparticles [10,11], seems to be promising as a T1T2 dual-modal MRI contrast agent. Gadolinium orthoferrite nanoparticles have been previously proposed as a contrast agent for MRI [12,13,14,15]. For example, Söderlind et al. [12] synthesized very small (~4 nm) GdFeO3 nanoparticles with longitudinal relaxivity r1 = 11.9 mM−1·s−1 and transverse relaxivity r2 = 15.2 mM−1·s−1, whereas Pinho et al. [13] synthesized GdFeO3 nanoparticles with an average size of 115 nm, very small T1 relaxivities (r1 = 0.59−0.60 mM−1·s−1) and larger T2 relaxivities (r2 = 3.84−5.65 mM−1·s−1). However, in order to achieve a T1T2 dual-modal contrast effect, the size of GdFeO3 nanoparticles should be sufficiently small, since with a decrease in the particle size a high specific surface area of nanoparticles is achieved, which is necessary for effective T1 relaxation with the participation of near-surface Gd3+ cations on the one hand, and the superparamagnetic state of nanoparticles at room temperature is reached, which is necessary for the manifestation of T2 MRI contrast properties on the other hand.
Gadolinium orthoferrite nanoparticles have been successfully obtained by various synthesis methods, including co-precipitation [16], hydrothermal [17], solution combustion [18], sol-gel [19], microwave [20], sonochemical [21] and heterobimetallic precursor [22]. Since it allows producing GdFeO3 nanoparticles with isometric morphology and minimal chemical impurities, the co-precipitation method is preferred. However, there are various co-precipitation techniques, such as direct, reverse and microreactor co-precipitation, which can affect the structural, dispersed, morphological and magnetic parameters of the resulting GdFeO3 nanoparticles. Therefore, it is necessary to study the effect of the co-precipitation technique on these parameters in order to obtain GdFeO3 nanoparticles with the desired properties that allow them to be further used as a T1T2 dual-modal MRI contrast agent.
In this paper, direct, reverse and microreactor co-precipitation techniques were used in the synthesis of gadolinium and iron(III) hydroxides, which were then heat-treated in the air to obtain GdFeO3 nanocrystals. The structural, dispersed, morphological and magnetic features of the obtained GdFeO3 nanoparticles have been studied in detail. Colloidal solutions of the as-synthesized GdFeO3 nanoparticles were prepared and investigated to determine their effects as contrast agents for MRI.

2. Materials and Methods

In this work, aqueous solutions of stoichiometric amounts of gadolinium nitrate hexahydrate (Gd(NO3)3·6H2O, puriss., 99.9%) and iron(III) nitrate nonahydrate (Fe(NO3)3·9H2O, pur., 98.0%) with a concentration of 0.01 mol/L for each salt were used as a source of gadolinium and iron(III) ions, while aqueous solutions of ammonia with a concentration of 0.1 mol/L prepared from aqueous ammonia (NH4OH, puriss. spec., 23.5%) were used as a precipitating medium.

2.1. Potentiometric Titrations

2.1.1. Direct Titration

In direct titration, 60 mL of 0.1 mol/L ammonia solution were added in 1-mL portions to 50 mL of 0.01 mol/L gadolinium and iron(III) nitrates solution, which was placed on a magnetic stirrer. The pH of the resulting solution after each addition was measured using a «pH-150MI» pH-meter (OOO «Izmeritel’naya Tekhnika», Moscow, Russia) with an «ESK-10603» combined pH electrode (OOO «Izmeritel’naya Tekhnika», Moscow, Russia).

2.1.2. Reverse Titration

In reverse titration, 100 mL of 0.01 mol/L gadolinium and iron(III) nitrates solution were added in 1-mL portions to 30 mL of 0.1 mol/L ammonia solution, which was placed on a magnetic stirrer. The pH of the resulting solution after each addition was measured using a «pH-150MI» pH-meter (OOO «Izmeritel’naya Tekhnika», Moscow, Russia) with an «ESK-10603» combined pH electrode (OOO «Izmeritel’naya Tekhnika», Moscow, Russia).

2.2. Synthesis

In this work, nanocrystals of gadolinium orthoferrite were synthesized by direct, reverse and ‘microreactor’ co-precipitation of gadolinium and iron(III) hydroxides at room temperature, followed by heat treatment of the obtained co-precipitated hydroxides in the air (Figure 1).

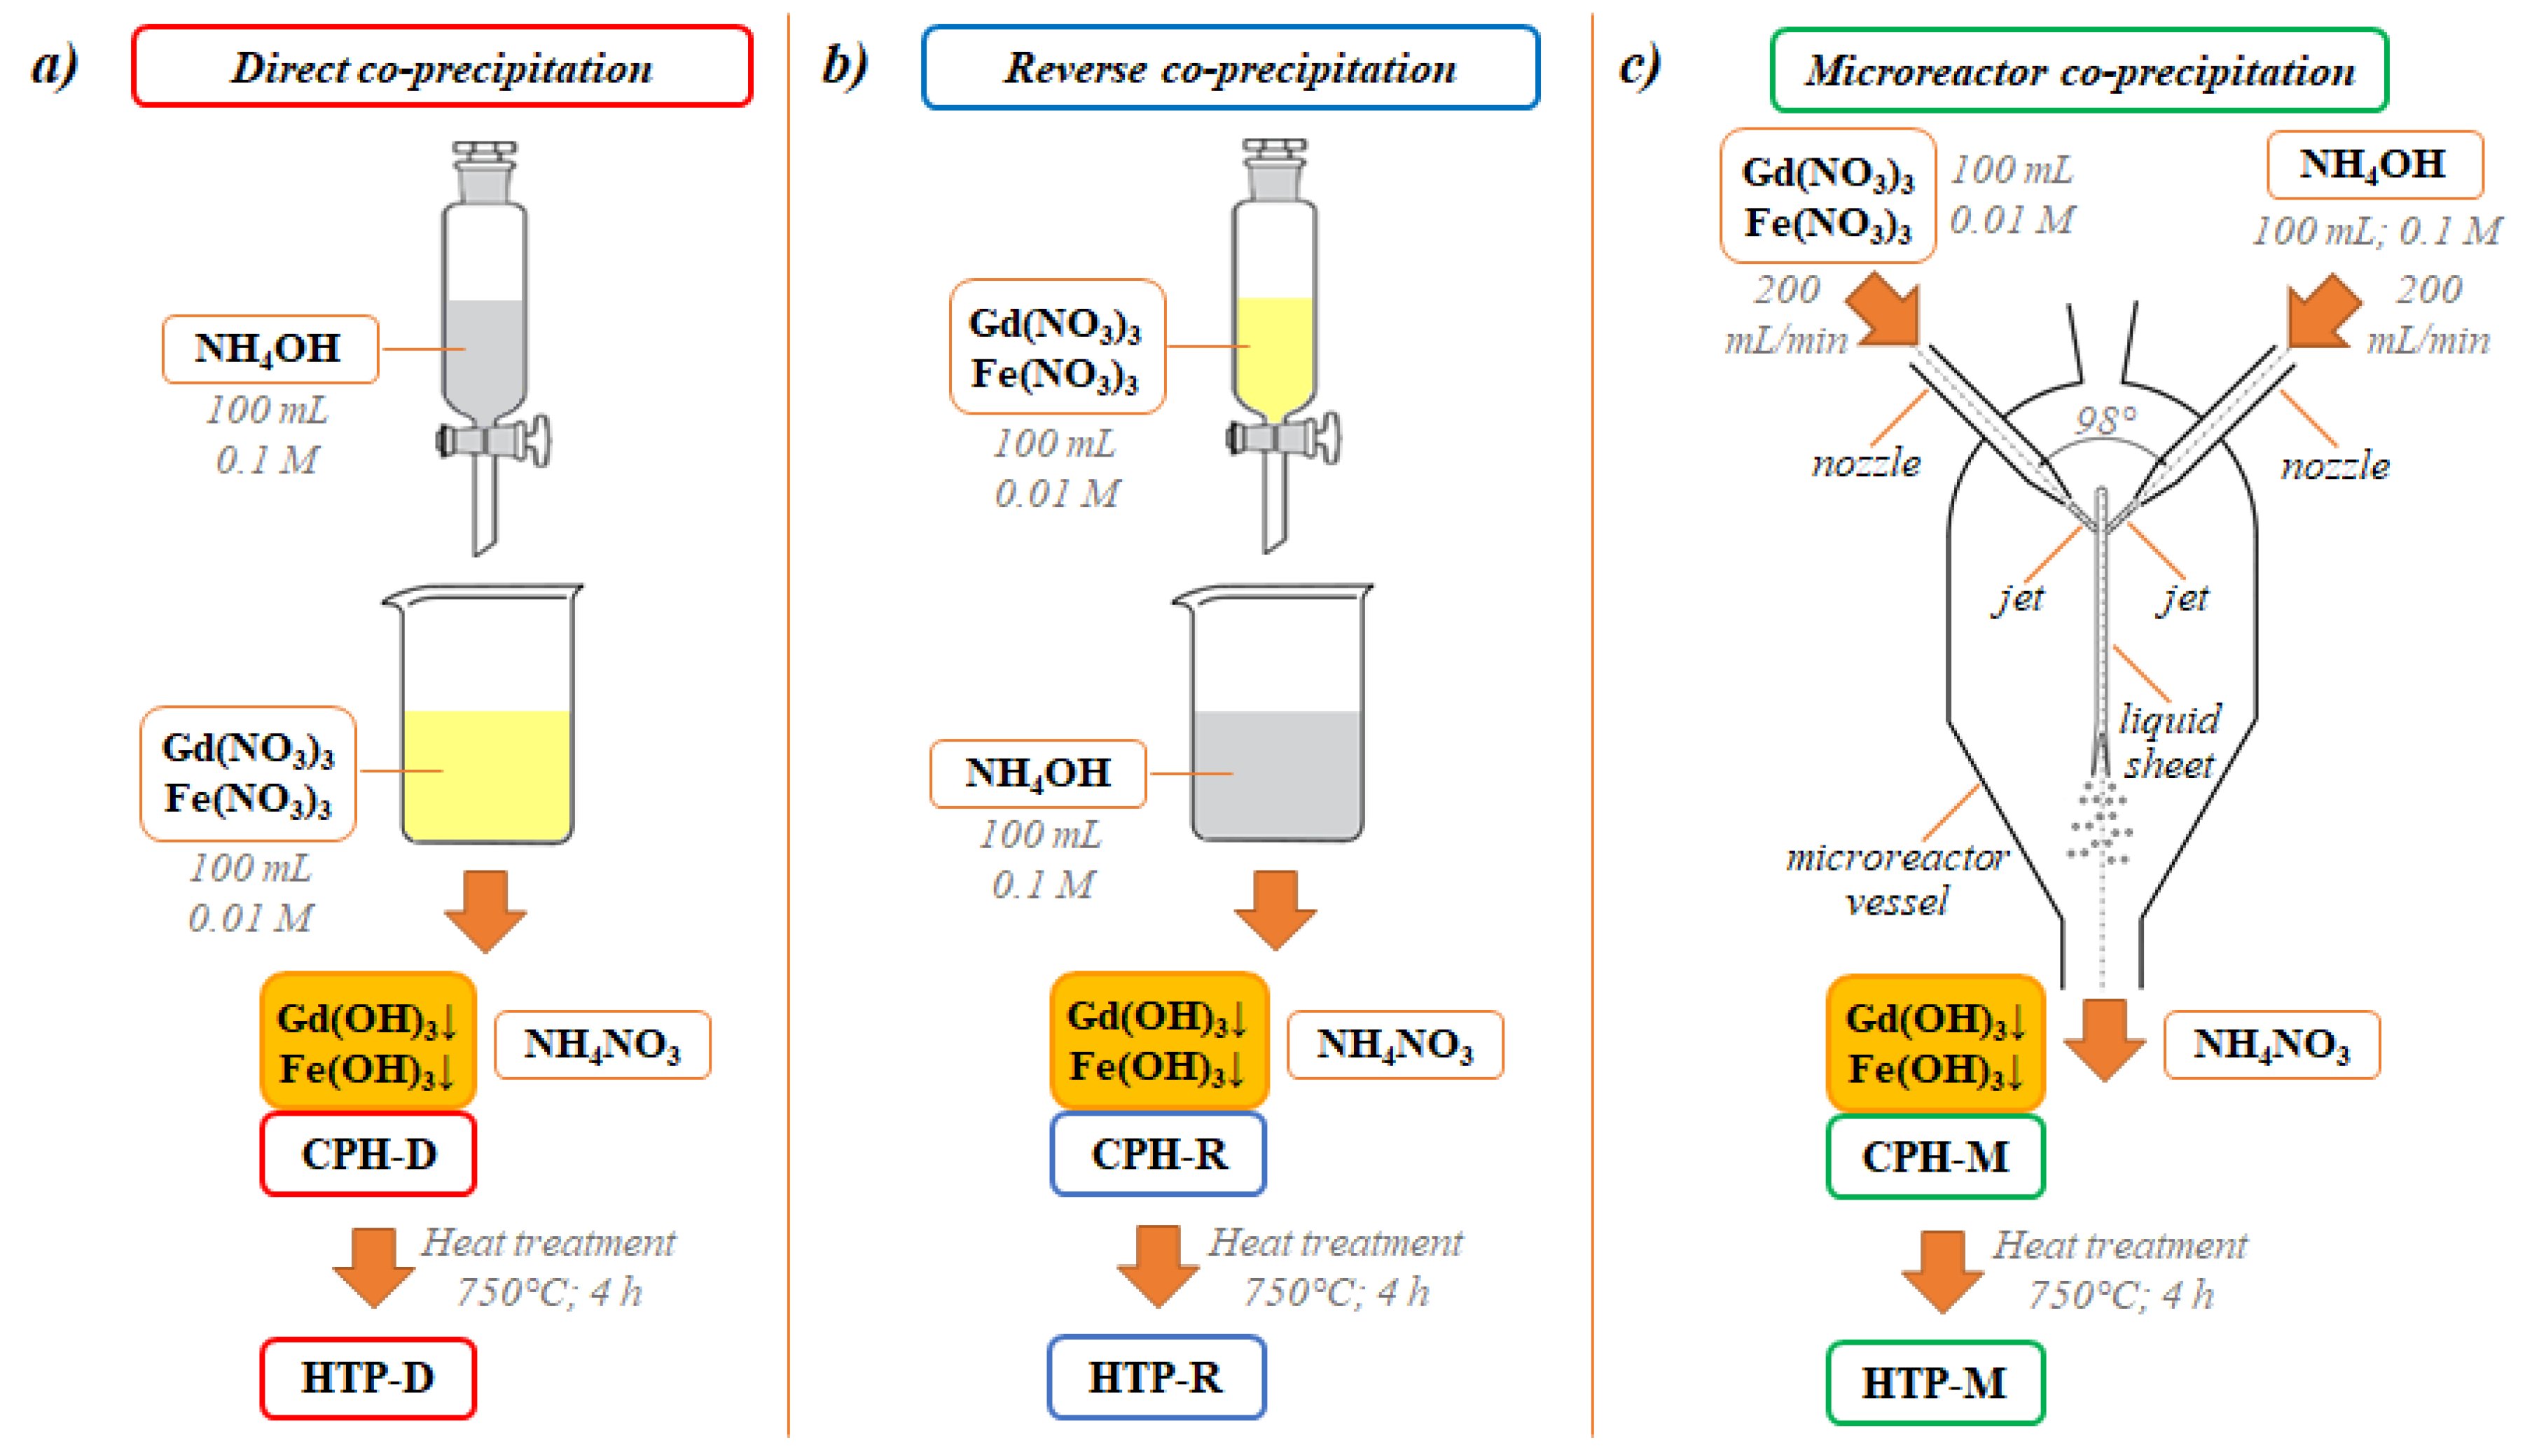
2.2.1. Co-precipitation of Gadolinium and Iron(III) Hydroxides

Direct Precipitation

In direct precipitation, 100 mL of 0.1 mol/L ammonia solution were added at an average rate of about 3 mL/min in a drop-wise manner to 100 mL of 0.01 mol/L gadolinium and iron(III) nitrates solution, which was stirred with a magnetic stirrer at a speed of 1000 rpm during the synthesis.

Reverse Precipitation

In reverse precipitation, 100 mL of 0.01 mol/L gadolinium and iron(III) nitrates solution were added at an average rate of about 2 mL/min in a drop-wise manner to 100 mL of 0.1 mol/L ammonia solution, which was stirred with a magnetic stirrer at a speed of 1000 rpm during the synthesis.

Microreactor Precipitation

In microreactor precipitation, 100 mL of 0.01 mol/L gadolinium and iron(III) nitrates solution and 100 mL of 0.1 mol/L ammonia solution were fed into a free impinging-jets microreactor through two glass nozzles with a diameter of 0.5 mm using two «Heidolph-5206» peristaltic pumps (Heidolph Instruments GmbH & Co. KG, Schwabach, Germany) at a fixed flow rate of 200 mL/min in the form of thin jets colliding in a vertical plane at an angle of 98° between them.

2.2.2. Heat Treatment of the Co-precipitated Hydroxides

The precipitates obtained by the direct, reverse and microreactor co-precipitation were separated from water by centrifugation and then dried at a temperature of 45 °C for 36 h. Thereafter, the dried samples of co-precipitated hydroxides were heated at a temperature of 750 °C for 4 h in the air. The selection of the heat treatment temperature was based on the results of differential thermal analysis (DTA) in our previous work [16].

2.3. Characterization

2.3.1. Powder X-ray Diffraction

The powder X-ray diffraction (PXRD) patterns were recorded using a «Rigaku SmartLab 3» diffractometer (Rigaku Corporation, Tokyo, Japan) in the range of 20–60° at a scan speed of 2°/min and a step width of 0.01°. The processing of the PXRD data was carried out in the «SmartLab Studio II» software. The average sizes of the obtained GdFeO3 crystallites were calculated based on the broadening of X-ray lines using Scherrer’s formula.

2.3.2. Fourier-Transform Infrared Spectroscopy

The Fourier-transform infrared (FTIR) spectra were recorded using KBr pellets on a «FSM-1202» FTIR spectrometer (OOO «Monitoring» and OOO «Infraspek», Saint Petersburg, Russia) in the range of 400–4000 cm−1.

2.3.3. Low-Temperature Nitrogen Adsorption-Desorption Isotherm Measurements

The low-temperature nitrogen adsorption-desorption isotherm measurements were carried out at 77 K on a «Micromeritics ASAP 2020» nitrogen adsorption apparatus (Micromeritics Instrument Corporation, Norcross, GA, USA). Using the obtained adsorption-desorption isotherms, the specific surface area according to Brunauer-Emmett-Teller (BET) was determined, and the pore size distribution was calculated by the Barrett-Joyner-Halenda (BJH) procedure. The characteristic particle size of GdFeO3 was estimated by spherical morphology approximation using the formula D = 6/(S·ρXRD), where D is the characteristic particle size, S is the BET specific surface area and ρXRD is the X-ray density of GdFeO3.

2.3.4. High-Resolution Transmission Electron Microscopy and Selected Area Electron Diffraction

The morphology and crystal structure were investigated by high-resolution transmission electron microscopy (HRTEM) and selected area electron diffraction (SAED) using a «JEOL JEM-100CX» transmission electron microscope (JEOL Ltd., Tokyo, Japan).

2.4. Functional Properties

2.4.1. Diffuse Reflectance Spectroscopy

The diffuse reflectance spectroscopy (DRS) spectra were obtained using an «AvaSpec-ULS2048CL-EVO» spectrophotometer (Avantes, Apeldoorn, The Netherlands) equipped with an «AvaSphere-30-REFL» integrating sphere (Avantes, Apeldoorn, The Netherlands). Spectralon was used as an optical standard. The calculation of the bandgap values of the obtained samples of GdFeO3 nanocrystals was performed using the Tauc plot for direct allowed transitions, while the potentials of the conduction and valence bands were calculated by empirical equations using the energy of free electrons and the absolute electronegativity and the obtained bandgap of GdFeO3, as discussed in [23].

2.4.2. Vibration Magnetometry

The magnetic properties were measured at room temperature (298 K) by vibration magnetometry using a «Lake Shore 7400» vibrating magnetometer (Lake Shore Cryotronics, Inc., Westerville, OH, USA). The overall magnetic characteristics were calculated according to the hysteresis loop data using the vibration method built in the magnetometer’s software.

2.4.3. Proton Nuclear Magnetic Resonance

Preparation of Samples

The obtained samples of GdFeO3 nanocrystals were selected as objects of study for sample preparation. Each of the samples under investigation with a mass of 16 mg was preliminarily crushed mechanically in an agate mortar in the presence of 2 mL of distilled water. The crushed particles in the form of a pasty mass were added to 2 L of distilled water (the resulting concentration is 8 mg/L). The stirred colloidal solution was then sequentially diluted with distilled water to obtain solutions with concentrations of 6, 4 and 2 mg/L. The prepared colloidal solutions with a volume of 0.8 mL were placed in tubes with an inner diameter of 8 mm for further investigation by proton nuclear magnetic resonance (1H NMR).

Measurement of T1 and T2 Relaxation Times

The measurements were carried out on a «Spin Track» NMR analyzer (Resonance Systems Ltd., Yoshkar-Ola, Russia) operating at a resonance frequency of 19 MHz for protons (1H). The temperature of the magnetic system was maintained at 30 °C. The duration of the 90° and 180° radiofrequency pulses were 3.3 and 6.5 μs, respectively; the ringing time of the receiving path of the NMR analyzer was 12 μs.
The Saturation-Recovery and Carr-Purcell-Meiboom-Gill (CPMG) pulse sequences were used to determine the spin-lattice (T1) and spin-spin (T2) relaxation times. In the Saturation-Recovery experiment, the following parameters were set: observation time—30 s, starting point—50 ms, number of points—16. For the CPMG experiment, the following parameters were determined: echo time—4 ms (2τ), number of echoes—3750.

3. Results and Discussion

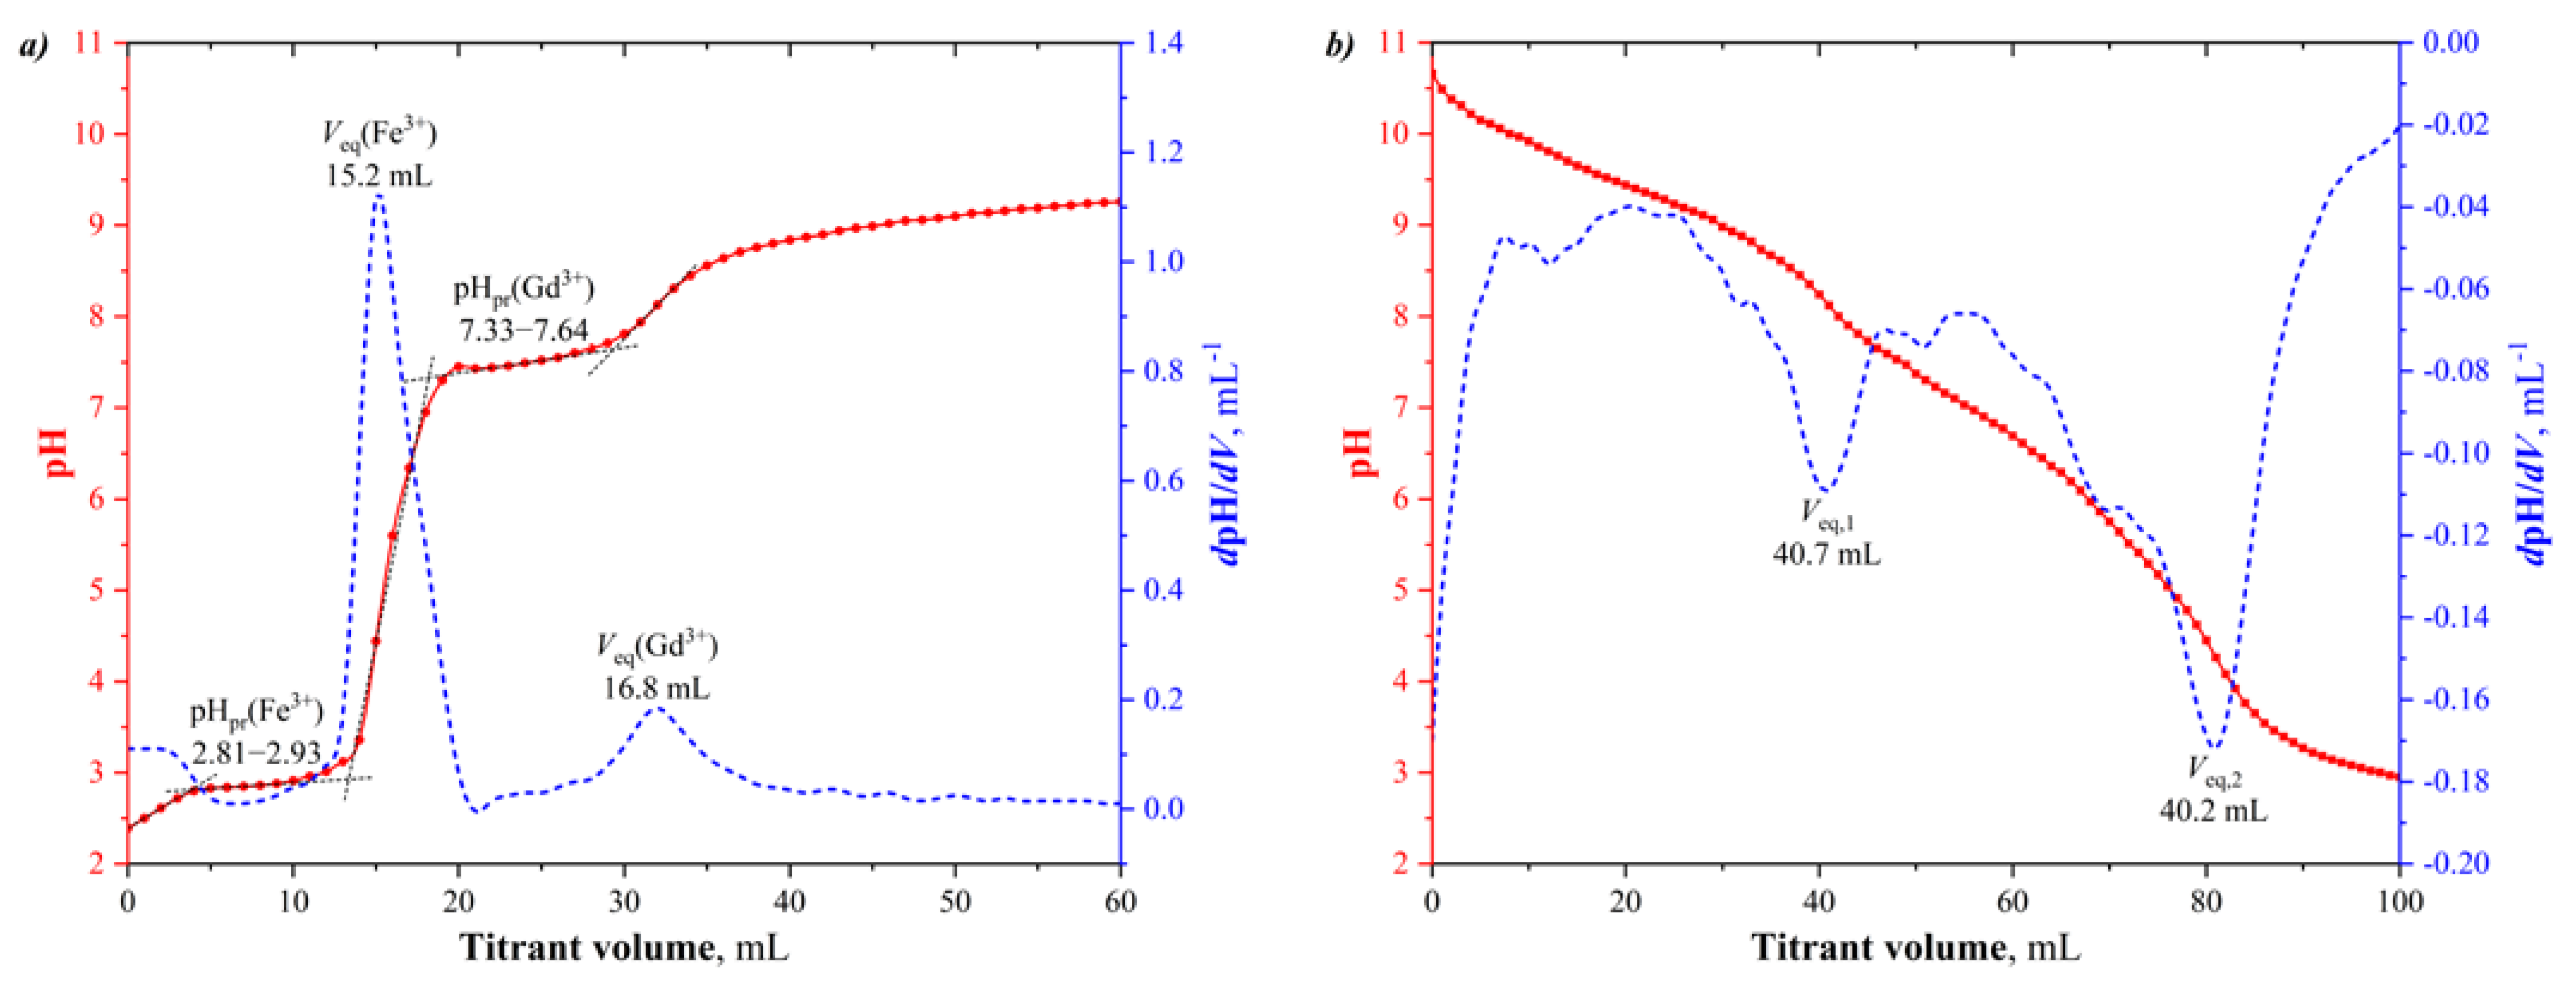
3.1. Potentiometric Titrations

3.1.1. Direct Titration

According to the obtained direct titration curve (Figure 2a, red curve), by adding the ammonia solution to the solution of gadolinium and iron(III) nitrates, the pH of the resulting solution gradually increases until the pH of precipitation (pHpr) of Fe3+ ions is reached. At this stage, the pH of the titrated solution does not change significantly, and the Fe3+ ions are precipitated in the form of iron(III) hydroxide. Thereafter, upon further addition of the ammonia solution, the pH of the resulting solution rises sharply until the pH of precipitation of Gd3+ ions is reached. At this stage, the pH of the titrated solution also does not change significantly, and the Gd3+ ions are precipitated in the form of gadolinium hydroxide.
As presented in Figure 2a, the pH of precipitation of Fe3+ ions ranges from 2.81 to 2.93, while the pH of precipitation of Gd3+ ions varies in the range of 7.33–7.64. Thus, at a pH of about 8, both iron(III) and gadolinium hydroxides already precipitate. On the other hand, the equivalent volumes (Veq) of ammonia solution required for the precipitation of Fe3+ and Gd3+ ions were determined using the first derivative of the titration curve (Figure 2a, blue curve), and amounted to about 15.2 mL and 16.8 mL, respectively. The difference between the experimental equivalent volumes and the calculated ones (15 mL each) can be explained by the fact that ammonia is volatile; therefore, its concentration decreases during titration.

3.1.2. Reverse Titration

The obtained reverse titration curve is presented in Figure 2b (red curve). When the solution of gadolinium and iron(III) nitrates is added to the ammonia solution, gadolinium and iron(III) hydroxides precipitate simultaneously because the pH of the ammonia solution is sufficient to precipitate both Fe3+ and Gd3+ ions. In this case, the pH of the resulting solution gradually decreases until the pH of precipitation of Gd3+ ions is reached, below which Gd3+ ions cannot precipitate and the formed gadolinium hydroxide begins to dissolve, while the Fe3+ ions continue to precipitate. After that, upon further addition of the titrant, the pH of the resulting solution gradually decreases until the Fe3+ ions cease to precipitate and the formed iron(III) hydroxide begins to dissolve.
Based on the first derivative of the reverse titration curve (Figure 2b, blue curve), the equivalent volumes of the gadolinium and iron(III) nitrates required to precipitate Fe3+ and Gd3+ ions and dissolve the formed gadolinium and iron(III) hydroxides were found to be about 40.7 mL and 40.2 mL, respectively. The difference between the experimental equivalent volumes and the calculated ones (50 mL each) can be explained by the fact mentioned above.
In consonance with the results of the direct and reverse titrations, a pH value above 8 can be considered suitable for the co-precipitation of gadolinium and iron(III) hydroxides. It should be noted that in our next experiments on the synthesis, the pH of the solutions obtained after the direct, reverse and microreactor co-precipitation was about 9.

3.2. Characterization

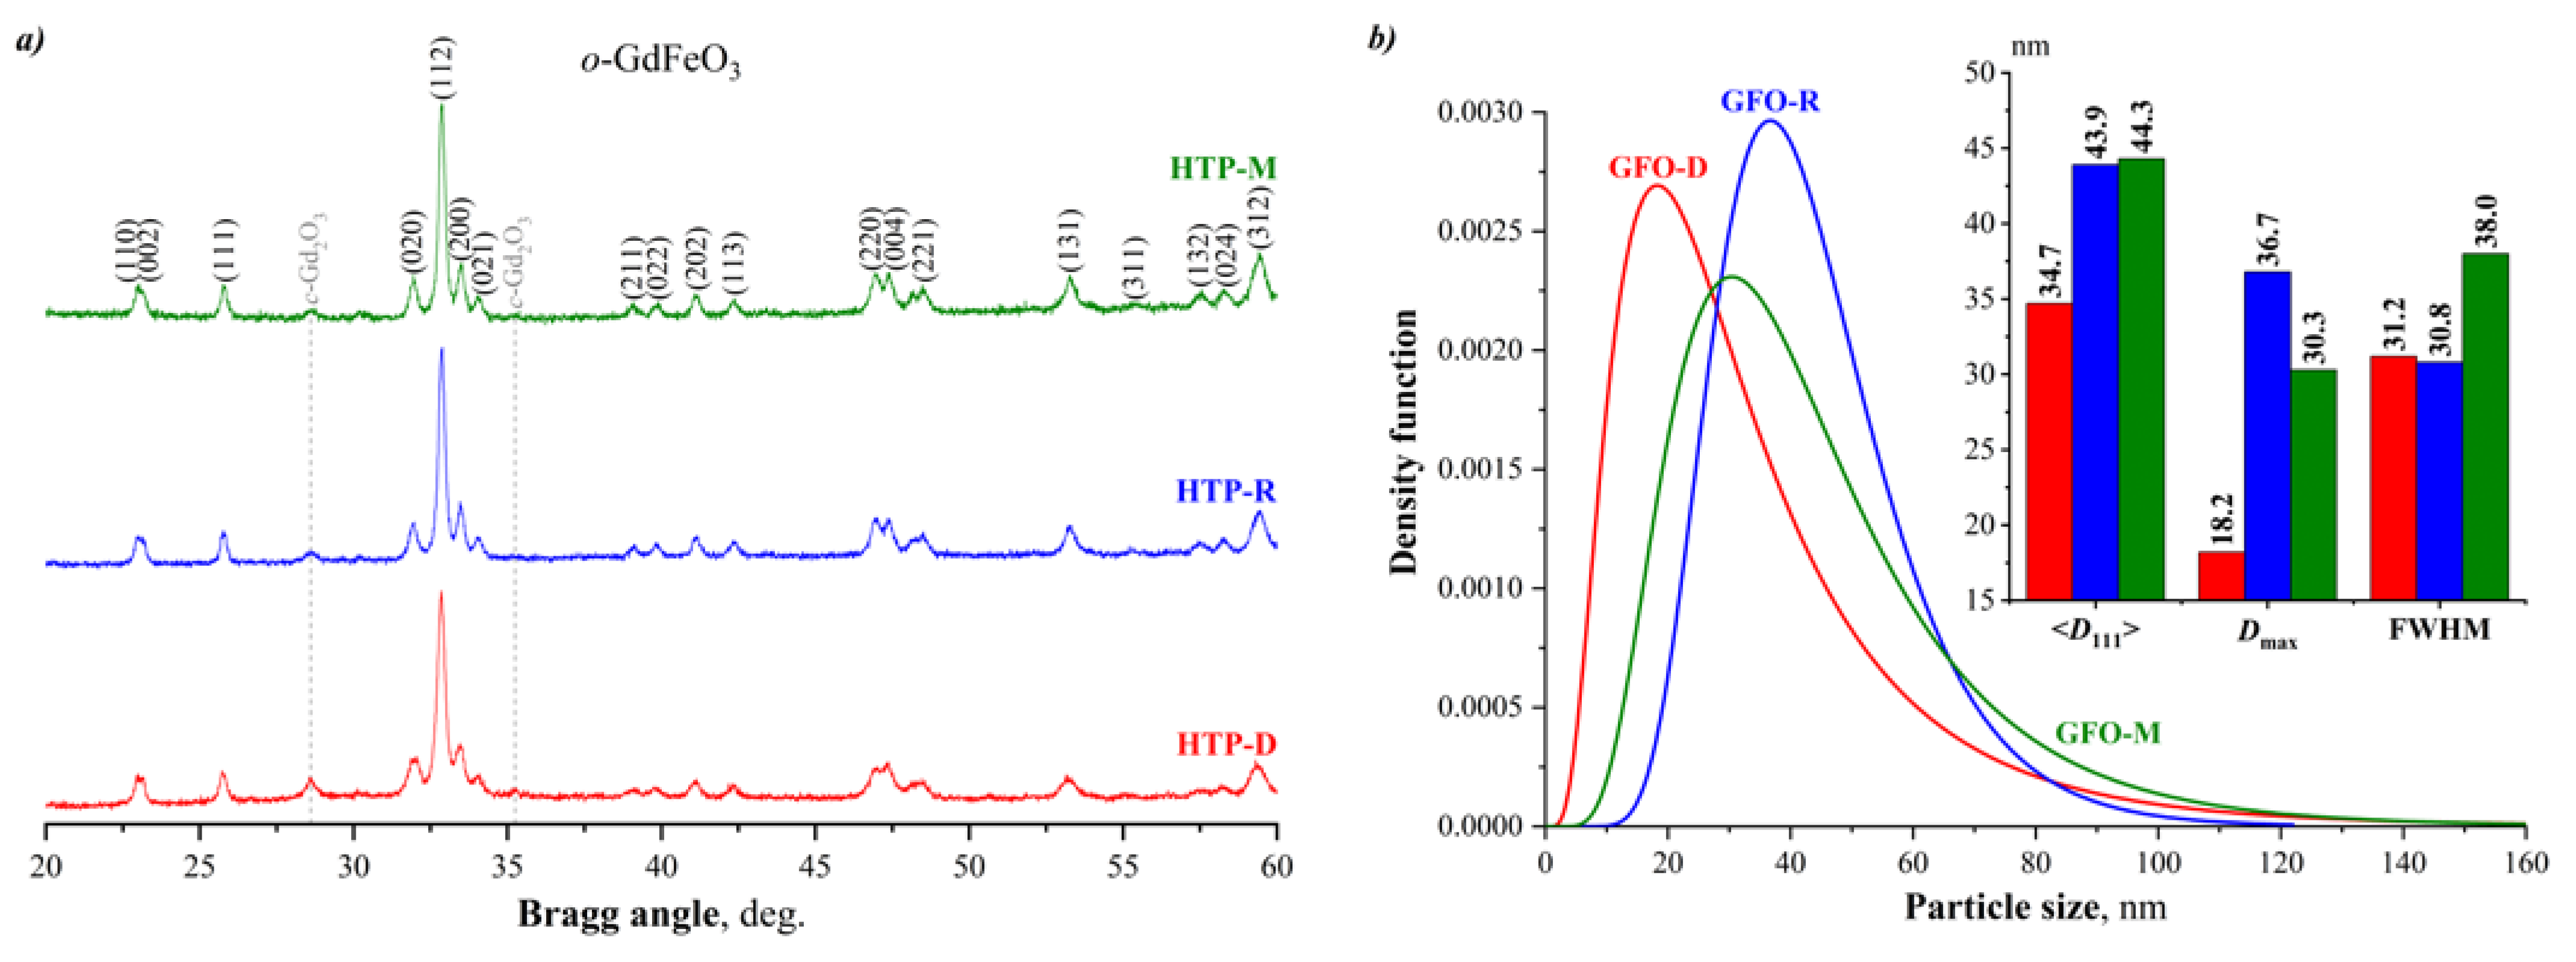
3.2.1. Powder X-ray Diffraction

According to the powder X-ray diffraction (PXRD) patterns of the initial samples, the samples of co-precipitated hydroxides (CPHs) obtained using the reverse (CPH-R) and microreactor (CPH-M) co-precipitation are X-ray amorphous, while the sample of co-precipitated hydroxides obtained using the direct co-precipitation (CPH-D) contains a crystalline phase that may be associated with crystalline hydrated iron(III) oxide (Fe2O3·nH2O). The X-ray phase analysis of all heat-treated products (HTPs) showed that the main synthesis product is orthorhombic gadolinium orthoferrite (o-GdFeO3, GFO) with a small amount of cubic gadolinium oxide (c-Gd2O3) (Figure 3a).
Based on the broadening of the (111) reflection using Scherrer’s formula, the average sizes of GdFeO3 crystallites in the obtained samples were calculated and their volume-weighted lognormal size distributions were determined (Figure 3b). The values of full width at half maximum (FWHM) of the resulting distributions were used to obtain information about the distribution width. In addition, the maximum values (max.) of the obtained distributions were used to determine the size of the majority of crystallites in each GdFeO3 sample. It was shown that in the case of direct co-precipitation the average size of GdFeO3 crystallites was the smallest (about 35 nm), which may be explained by the presence of the crystalline phase in the initial sample of co-precipitated hydroxides, while in the cases of reverse and microreactor co-precipitation, the GdFeO3 crystallites have practically the same average size (about 44 nm), but the crystallite size distribution in the case of microreactor co-precipitation is wider. This can be explained by the fact that during microreactor co-precipitation, the jet of gadolinium and iron(III) nitrates solution impinges with the jet of ammonia solution, the concentration of which is 10 times higher, i.e., there is an excess of ammonia and the pH of its solution is sufficient to precipitate both Fe3+ and Gd3+ ions; therefore, both gadolinium and iron(III) hydroxides precipitate simultaneously as in the case of reverse co-precipitation. Thus, in the cases of reverse and microreactor co-precipitation, the formed particles of co-precipitated hydroxides have approximately the same average size, and after the heat treatment, the resulting GdFeO3 nanocrystals also have practically the same average size.

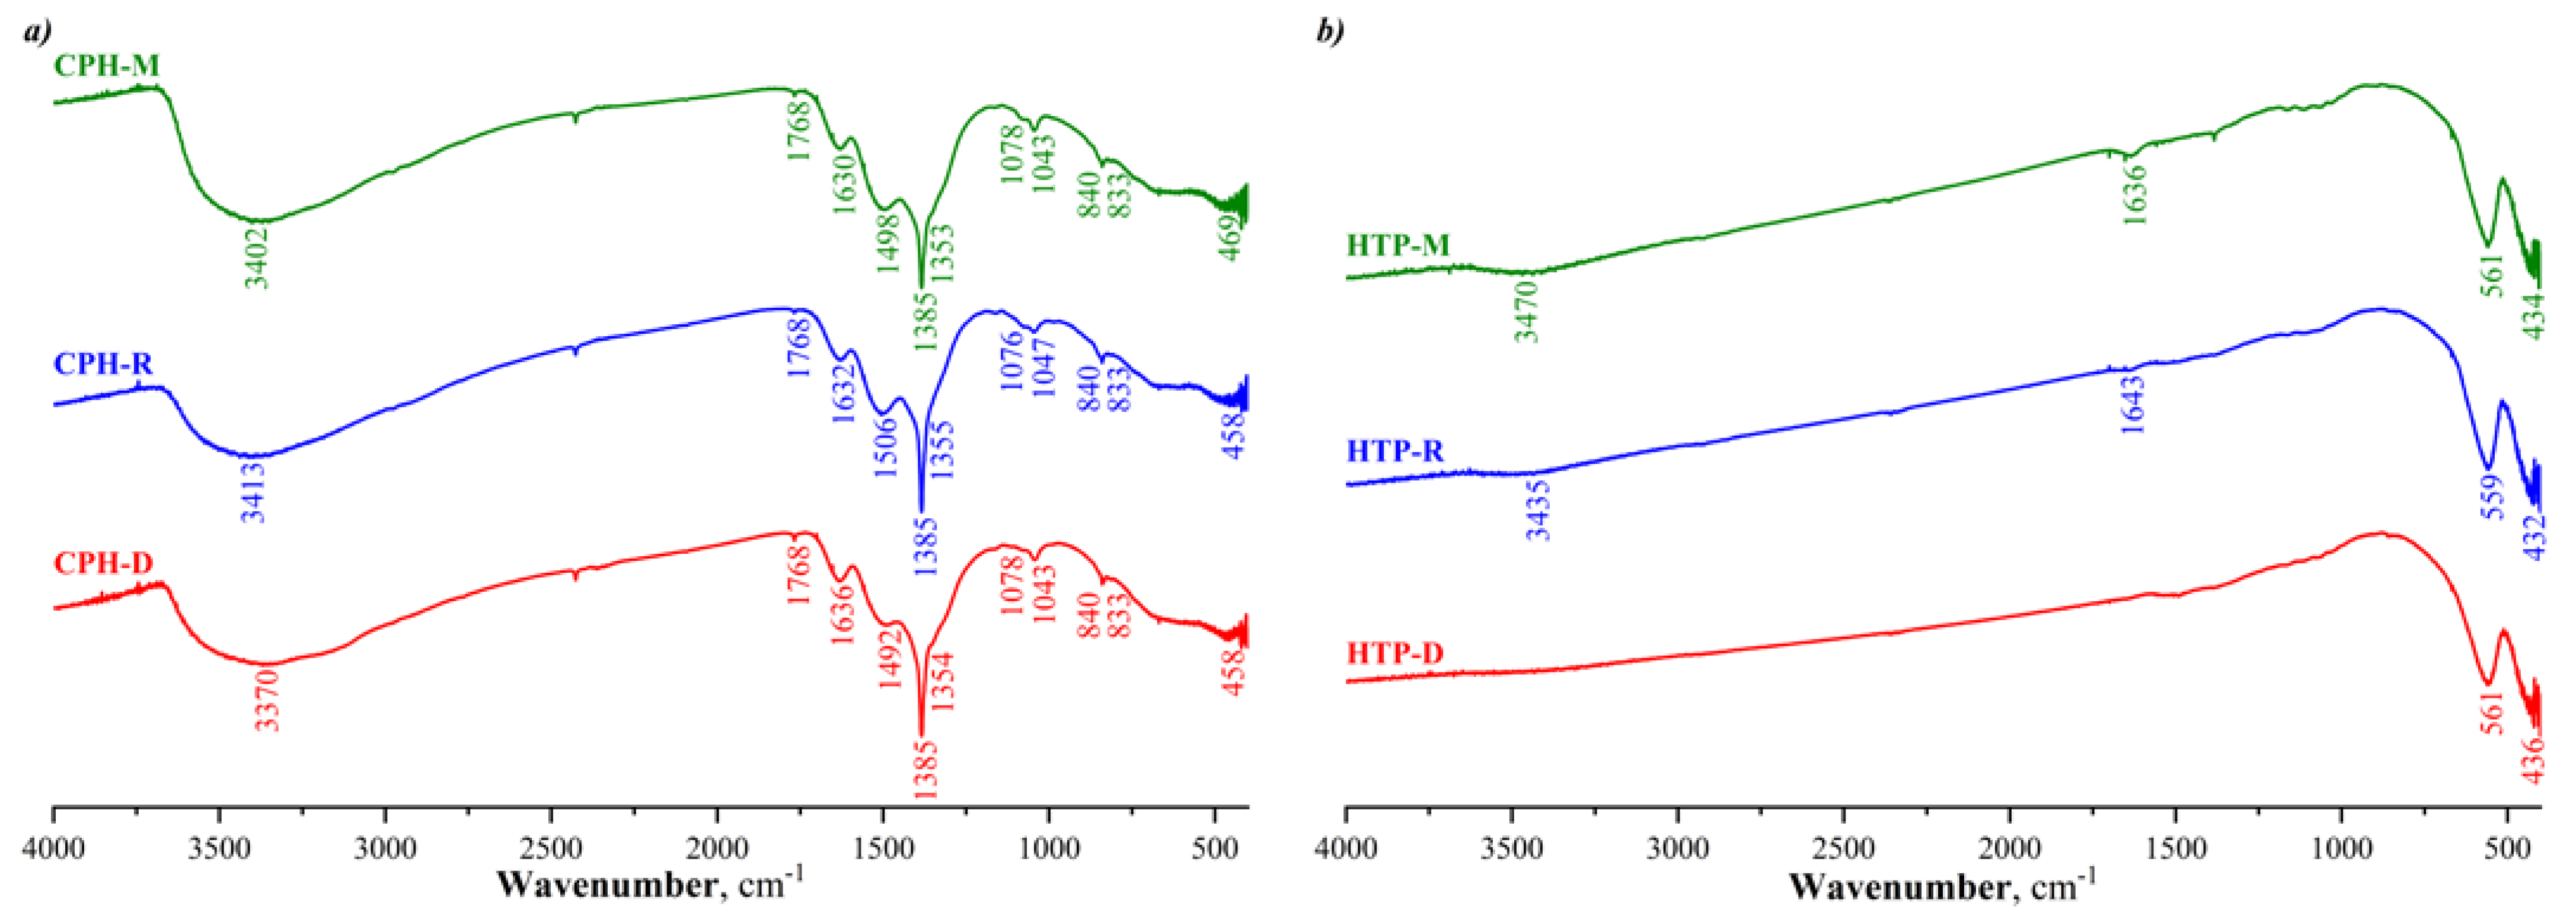
3.2.2. Fourier-Transform Infrared Spectroscopy

The samples of co-precipitated hydroxides and their heat-treated products were investigated by Fourier-transform infrared spectroscopy (FTIR), the results of which are shown in Figure 4. The wavenumbers of the observed bands in the obtained FTIR spectra and the results of their detailed analysis using the «Fityk» peak fitting program [24] (version 1.3.1, developed by M. Wojdyr) are presented in Table 1 and Table 2 for the samples of co-precipitated hydroxides and their heat-treated products, respectively.
In the FTIR spectra of the samples of co-precipitated hydroxides (Figure 4a), the broad strong band in the region of high wavenumbers centered at about 3400 cm−1 is most likely a consequence of the overlapping of asymmetric and symmetric stretching vibrations of physically adsorbed and hydrogen-bonded water, as well as stretching vibrations of OH ions. In the 750–1800 cm−1 region, several weak bands and a strong one with a complex structure are observed. These bands belong to different types of vibrations of surface anions. Nitrate ions from ammonium nitrate obtained as a result of the co-precipitation reaction may be present on the surface of co-precipitated hydroxides. In addition, as noted earlier, due to the tendency of iron [25] and, possibly, gadolinium to adsorb carbon dioxide from the ambient air when preparing reaction solutions, drying precipitates and collecting samples, the formation of carbonate and bicarbonate ions on the surface of co-precipitated hydroxides is also possible. Nitrate and carbonate ions have the same symmetry group, and upon coordination to metal ions, the IR-inactive symmetric stretching vibration of these anions becomes active due to the decrease in symmetry and can manifest itself in the region of 1040–1080 cm−1. In addition, upon coordination, the doubly degenerate asymmetric stretching vibration of the anion splits into synchronous and asynchronous vibrations, and the nature of the coordination can be determined from the magnitude of the splitting. The separation of the observed strong intense band centered at about 1385 cm−1 into vibration components suggests that the nitrate ions are present in the samples of co-precipitated hydroxides in free (1384 cm−1) and weakly coordinated (1390–1396 cm−1) states. On the contrary, carbonate ions can be coordinated with the surface as monodentate, bidentate and polydentate ligands. The observed band of bending vibration of adsorbed water centered at about 1630–1636 cm−1 consists of two vibrations, one of which disappears during the heat treatment; therefore, it can be assumed that the disappeared vibration is most likely related to the asynchronous stretching asymmetric vibration of carbonate ion. The band at about 1768 cm−1 is assigned to the stretching vibration of C = O groups coordinated to metal ions. The weak bands observed at about 833–840 cm−1 can be attributed to symmetric out-of-plane bending vibrations of surface nitrate and carbonate ions, whereas the very weak bands at about 750 cm−1 can be assigned to asymmetric in-plane bending vibrations of these anions. In the region of wavenumbers less than 700 cm−1, the blurred broad bands at about 672–689 cm−1 may be related to the M-OH stretching vibrations, while the observed bands centered at about 458–469 cm−1 may be attributed to the M-O stretching vibrations. It should be pointed out that the presence of these two bands confirms the formation of amorphous co-precipitated hydroxides.
In the FTIR spectra of the heat-treated products (Figure 4b), there are practically no bands corresponding to vibrations of anions, which indicates that the surface is cleaned. In the region of low wavenumbers, strong bands are observed at about 559–561 cm−1, which, according to the literature data, can be assigned to the Gd-O and Fe-O stretching vibrations in the Gd-O-Fe and Fe-O-Fe systems [26]. A detailed analysis of the structure of this band shows that it includes two vibrations at about 554–556 and 593–597 cm−1. As a result of comparison with the wavenumbers of vibrations of cubic iron and gadolinium oxides, it can be assumed that these two vibrations are most likely related to the Gd-O and Fe-O stretching vibrations, respectively. The bands observed at about 432–436 cm−1 (441–443 cm−1 as obtained using Fityk) are most likely attributed to the O-Fe-O bending vibrations in octahedral FeO6 groups [27]. The obtained data allow us to conclude that the bands at about 441–443, 554-556 and 593–597 cm−1 are characteristic of orthorhombic gadolinium orthoferrite. It should be noted that some shift in characteristic vibrations in the FTIR spectra of the heat-treated products in comparison with the co-precipitated hydroxides is a consequence of the formation of the crystal structure of o-GdFeO3.

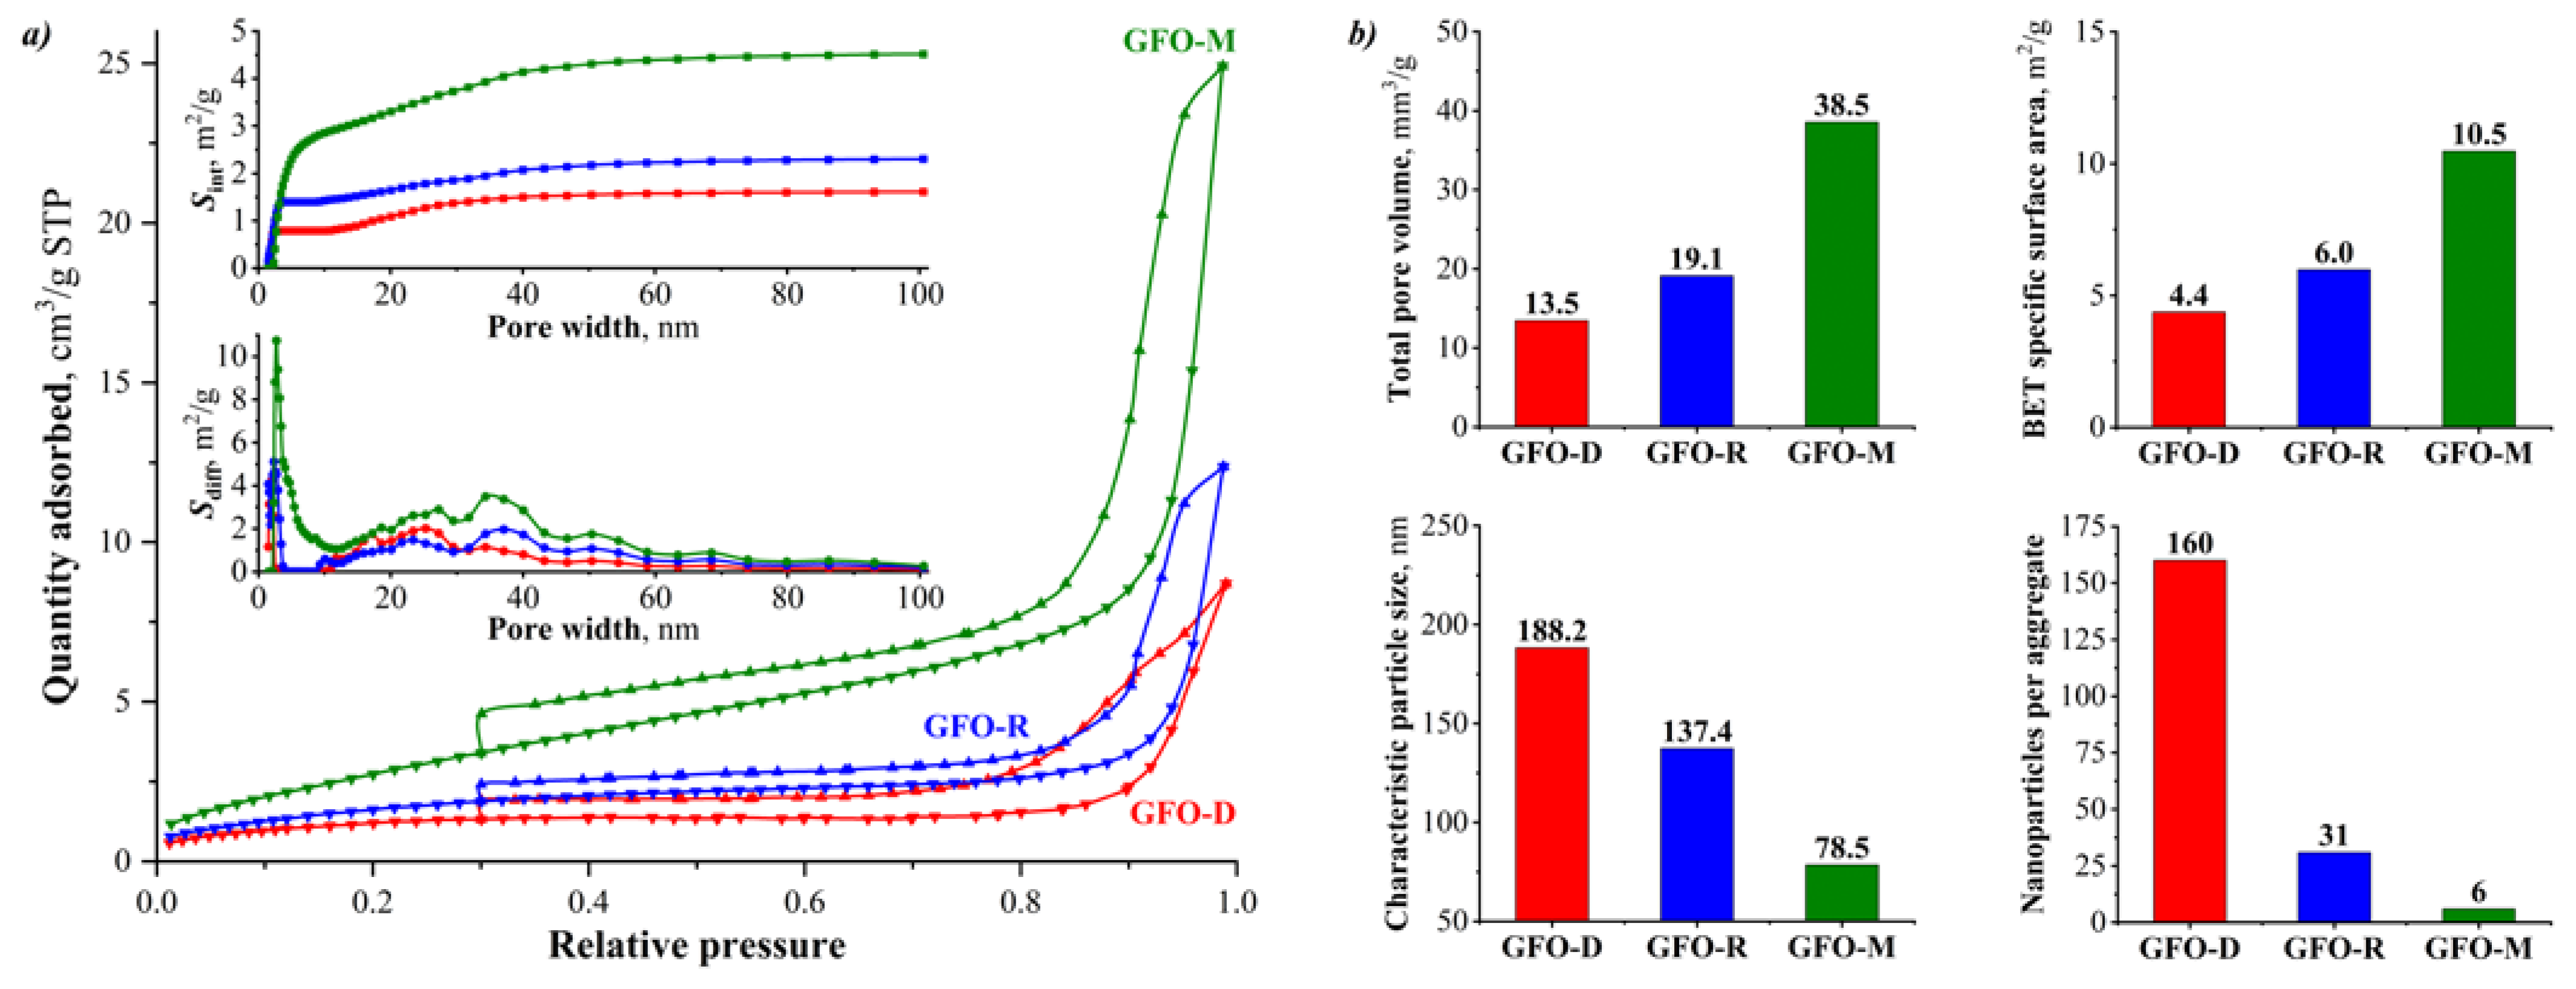
3.2.3. Low-Temperature Nitrogen Adsorption-Desorption Isotherm Measurements

To estimate the specific surface area of the GdFeO3 nanocrystals and the pore sizes in the obtained samples, the measurements of low-temperature nitrogen adsorption-desorption isotherms were carried out. Figure 5a shows the results of these measurements, as well as the integral and differential surface areas depending on the pore width in the investigated samples.
According to the IUPAC classification [28], all the obtained adsorption isotherms belong to the IV type, and the hysteresis loops belong to the H3 type, which suggests the presence of slit pores with a wide size distribution in the studied samples. These results can be explained by the presence of pores of different sizes between individual GdFeO3 nanocrystals in their aggregates. The appearance of mesopores in the obtained samples is due to the space between individual GdFeO3 nanocrystals, while macropores originate in the space between the aggregates of these nanocrystals.
The total pore volume, BET specific surface area, characteristic particle size and number of nanoparticles per aggregate based on the nitrogen adsorption-desorption data are shown in Figure 5b. According to the presented results, in the case of microreactor co-precipitation, the total pore volume was the highest (about 38.5 mm3/g) and the BET specific surface area was the largest (about 10.5 m2/g), while in the case of direct co-precipitation, the total pore volume was the lowest (about 13.5 mm3/g) and the BET specific surface area was the smallest (about 4.4 m2/g). The characteristic particle sizes, calculated from the obtained values of the BET specific surface area and the X-ray density of GdFeO3, are significantly larger than the corresponding values of the average crystallite size calculated based on the broadening of X-ray lines, which indicates the aggregation of nanocrystals and the presence of grain boundaries inaccessible for nitrogen sorption. Comparing the characteristic particle sizes with the average crystallite sizes, we found that the GdFeO3 nanocrystals obtained using direct co-precipitation tend to aggregate more than the GdFeO3 nanocrystals obtained using reverse co-precipitation, which, in turn, aggregate more strongly than the GdFeO3 nanocrystals obtained using microreactor co-precipitation. This can be explained by the fact that the use of such microreactors at the stage of co-precipitation of gadolinium and iron(III) hydroxides intensifies this process due to the intensification of mass and heat transfer and, after heat treatment of the co-precipitated hydroxides, makes it possible to obtain dispersed GdFeO3 nanoparticles.

3.2.4. High-Resolution Transmission Electron Microscopy and Selected Area Electron Diffraction

The HRTEM images of the obtained GdFeO3 samples are shown in Figure 6.
The survey HRTEM images of the GFO-D, GFO-R and GFO-M samples (Figure 6a,c,e) show a similar morphology of GdFeO3 nanoparticles, but a noticeable difference in both their size and aggregation degree. It can be seen that the size of the GFO-D nanoparticles is about 25–35 nm, which is much smaller than the size of the GFO-R and GFO-M nanoparticles (about 40–50 nm) and this direct observation is in good agreement with the PXRD results (see Section 3.2.1). It should be noted that the aggregation degree in the GFO-D and GFO-R samples seems to be higher than the aggregation degree in the GFO-M sample, in which there are more individual particles and interparticle space, which determines the specific surface area of these nanopowders (see Section 3.2.3).
The morphology of individual GdFeO3 nanoparticles for all synthesized samples (Figure 6b,d,e) is close to isometric with a slight ellipsoidal distortion. The observed nanoparticles are single-crystal, which is confirmed by the presence of visually fixed atomic planes at high magnification (Figure 6b,d,f). In addition, the aggregates of GdFeO3 nanoparticles are completely crystalline, which is confirmed by the SAED results (see the insets in Figure 6a,c,e), which are typical for polycrystalline systems.
Direct measurement of interplanar distances in the observed nanocrystals (Figure 6b,d,f) surely indicates their belonging to orthorhombic gadolinium orthoferrite. These values (0.35 nm (111), 0.22 nm (202) and 0.20 nm (220)) are in good agreement with the d-spacing values obtained by the Rietveld method from the PXRD results (3.46 Å, 2.195 Å and 1.94 Å, respectively) within method error.
Since there is no noticeable morphological difference between the GFO-D, GFO-R and GFO-M samples, the process of their formation proceeded in the same mode, and the crystallite size, the aggregation degree and the main functional characteristics of the samples are determined by the co-precipitation technique and not by the annealing parameters, which were maintained the same for all samples.

3.3. Functional Properties

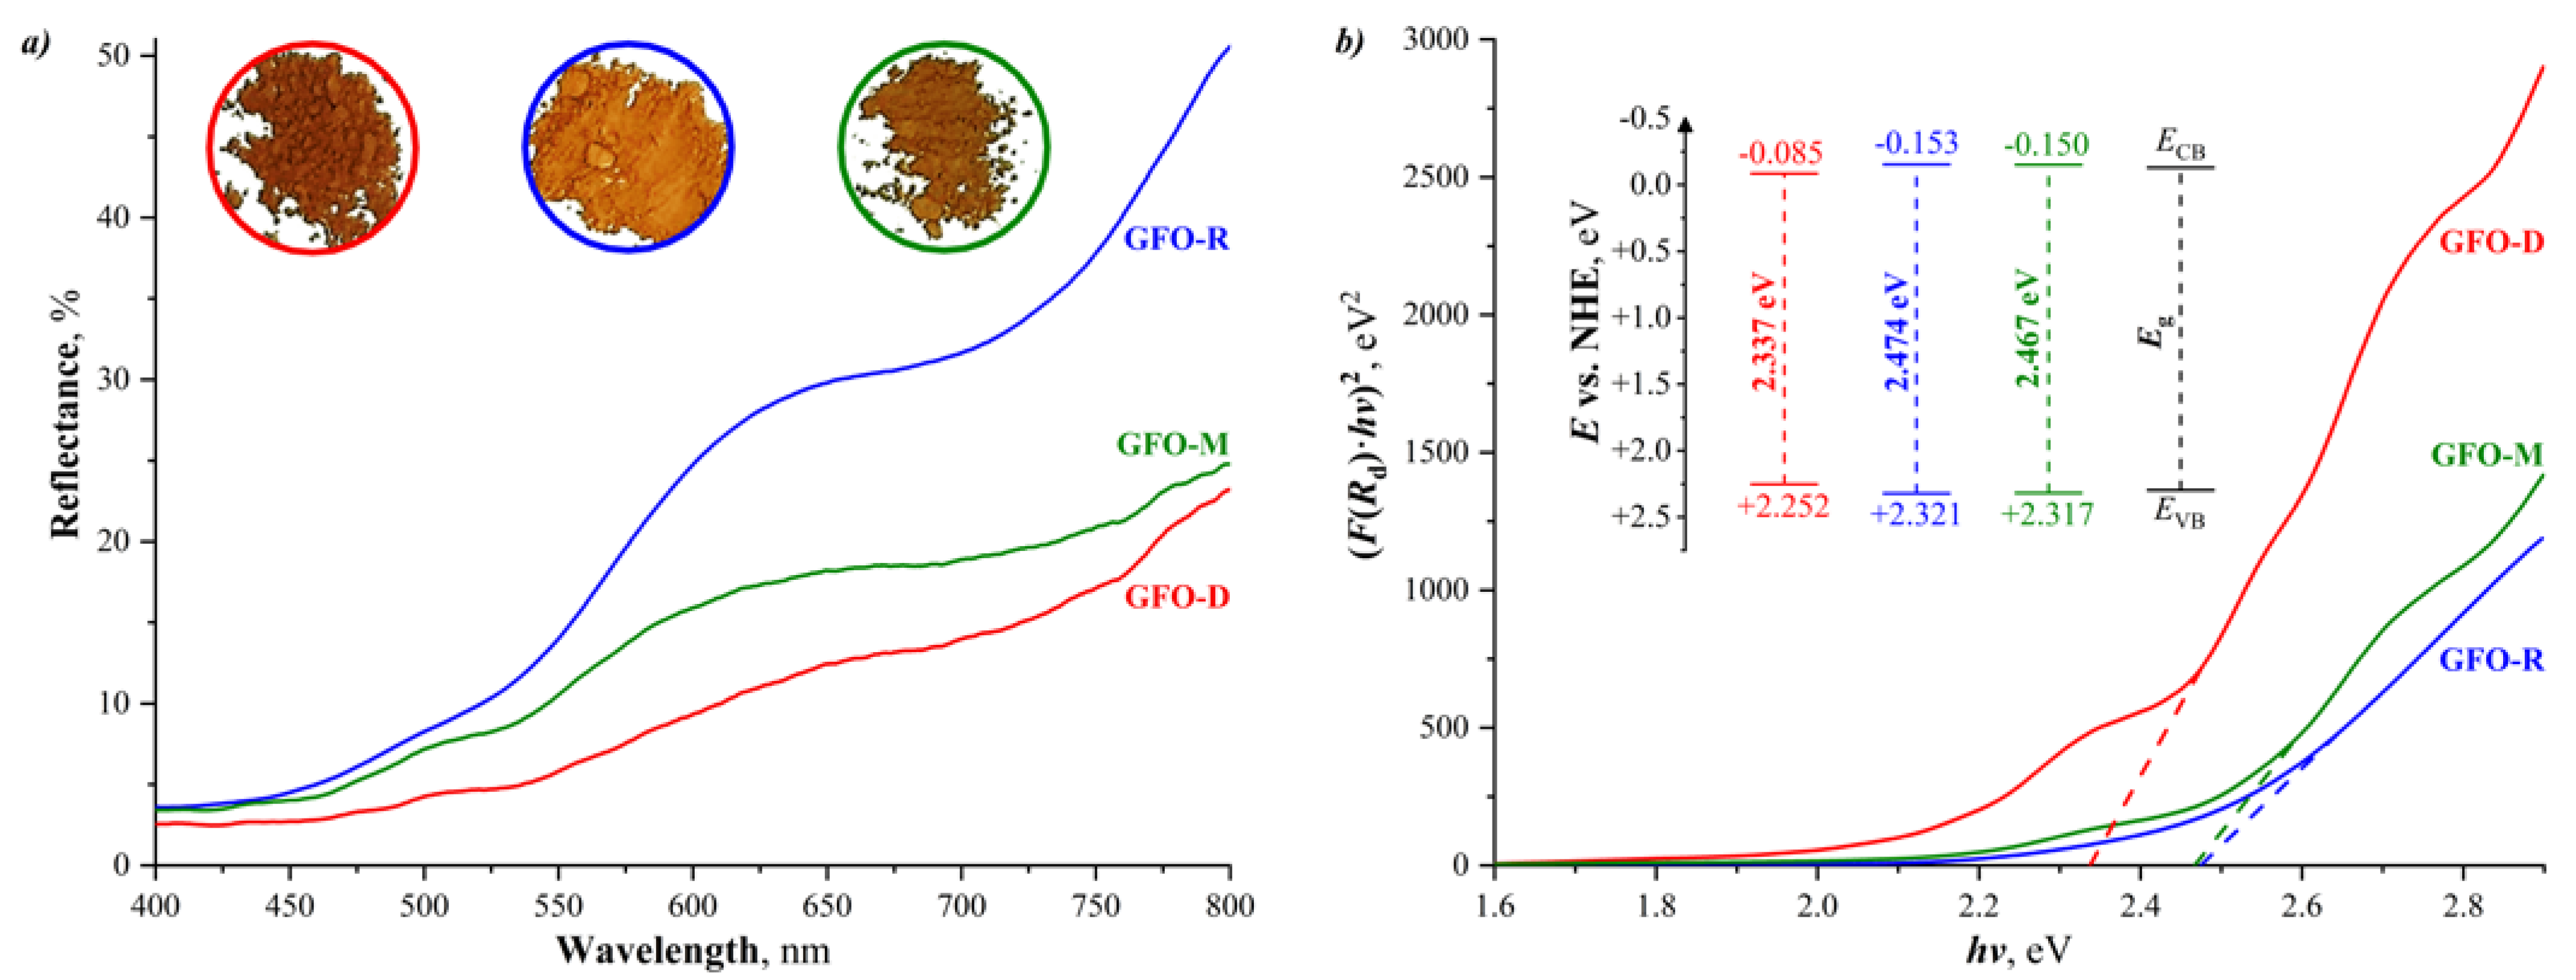
3.3.1. Diffuse Reflectance Spectroscopy

To investigate the semiconducting properties and determine the bandgap values of the obtained GdFeO3 nanocrystals, their electronic diffuse reflectance spectra were obtained, which are presented in Figure 7a.
Based on the processing of these spectra, the bandgap values were calculated using the Tauc plot for direct allowed transitions (Figure 7b), which is the dependence of the square of the product of the Kubelka-Munk function and the photon energy on the photon energy, i.e., (F(Rdhv)2 = f(hv), where Rd is the diffuse reflectance, F(Rd) = (1 − Rd)2/2Rd is the Kubelka-Munk function and hv is the photon energy. In each calculation, the section of the Tauc plot, where the experimental points have a linear relationship, was used. By extrapolating this region to the abscissa axis, we can obtain the bandgap value of the studied GdFeO3 nanocrystals. On the other hand, the potentials of the conduction and valence bands of the obtained GdFeO3 nanocrystals were calculated using empirical equations found in the literature [23].
According to the results presented, in the case of direct co-precipitation, the bandgap value and the valence band potential of the GdFeO3 nanocrystals are smaller and the conduction band potential is larger than in the cases of reverse and microreactor co-precipitation, where these values practically coincide. This allows us to conclude that the bandgap of the obtained GdFeO3 nanocrystals decreases with decreasing crystallite size, which contradicts what is expected. The bandgap value generally decreases with increasing particle size. Due to the limitation of electrons and holes, the energy of the bandgap between the valence and conduction bands increases with decreasing particle size, but here we have the opposite relationship. This may be explained by the aggregation of the obtained GdFeO3 nanocrystals. The GdFeO3 nanocrystals obtained using direct co-precipitation tend to aggregate more strongly and their characteristic size was the largest; consequently, the bandgap value, in this case, was the smallest.

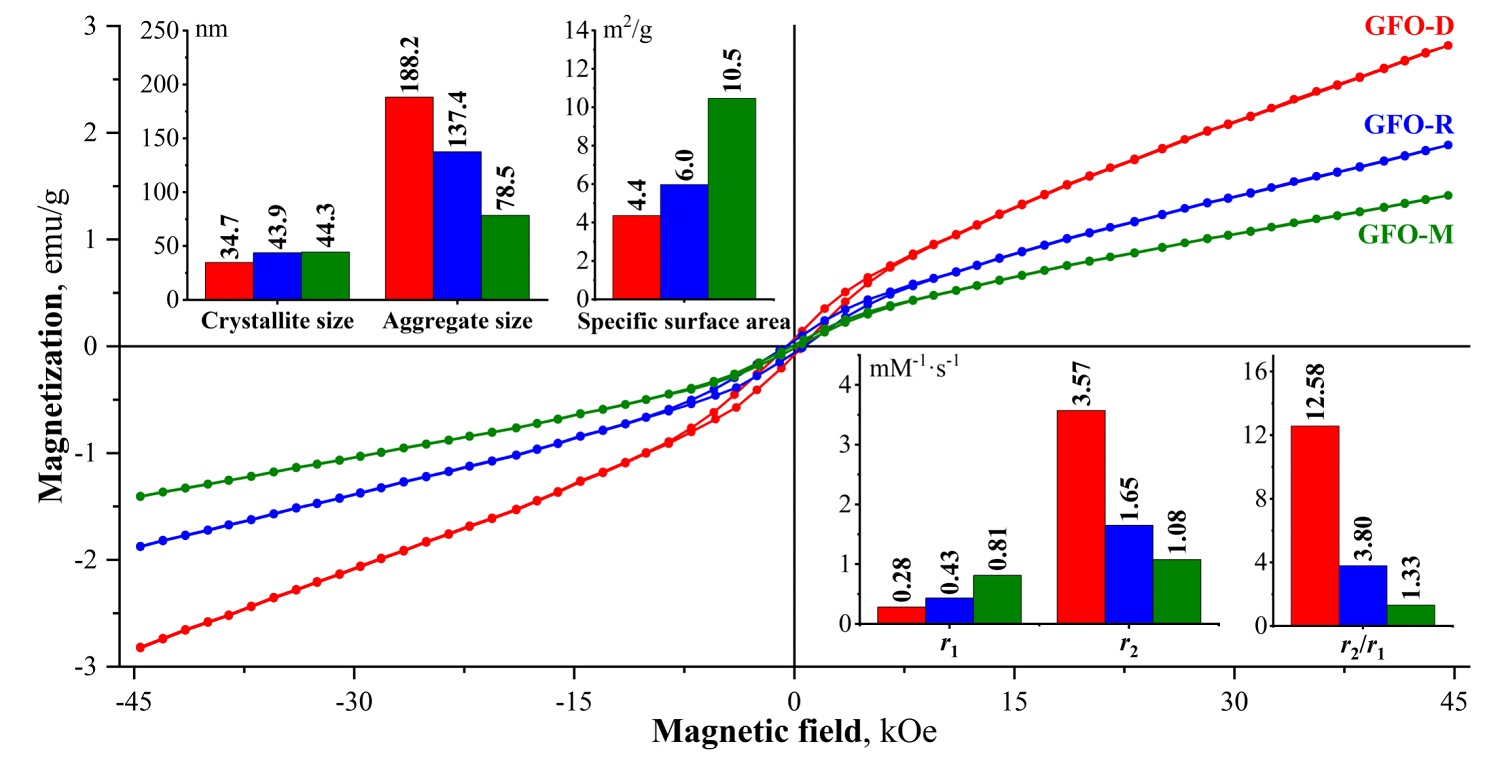
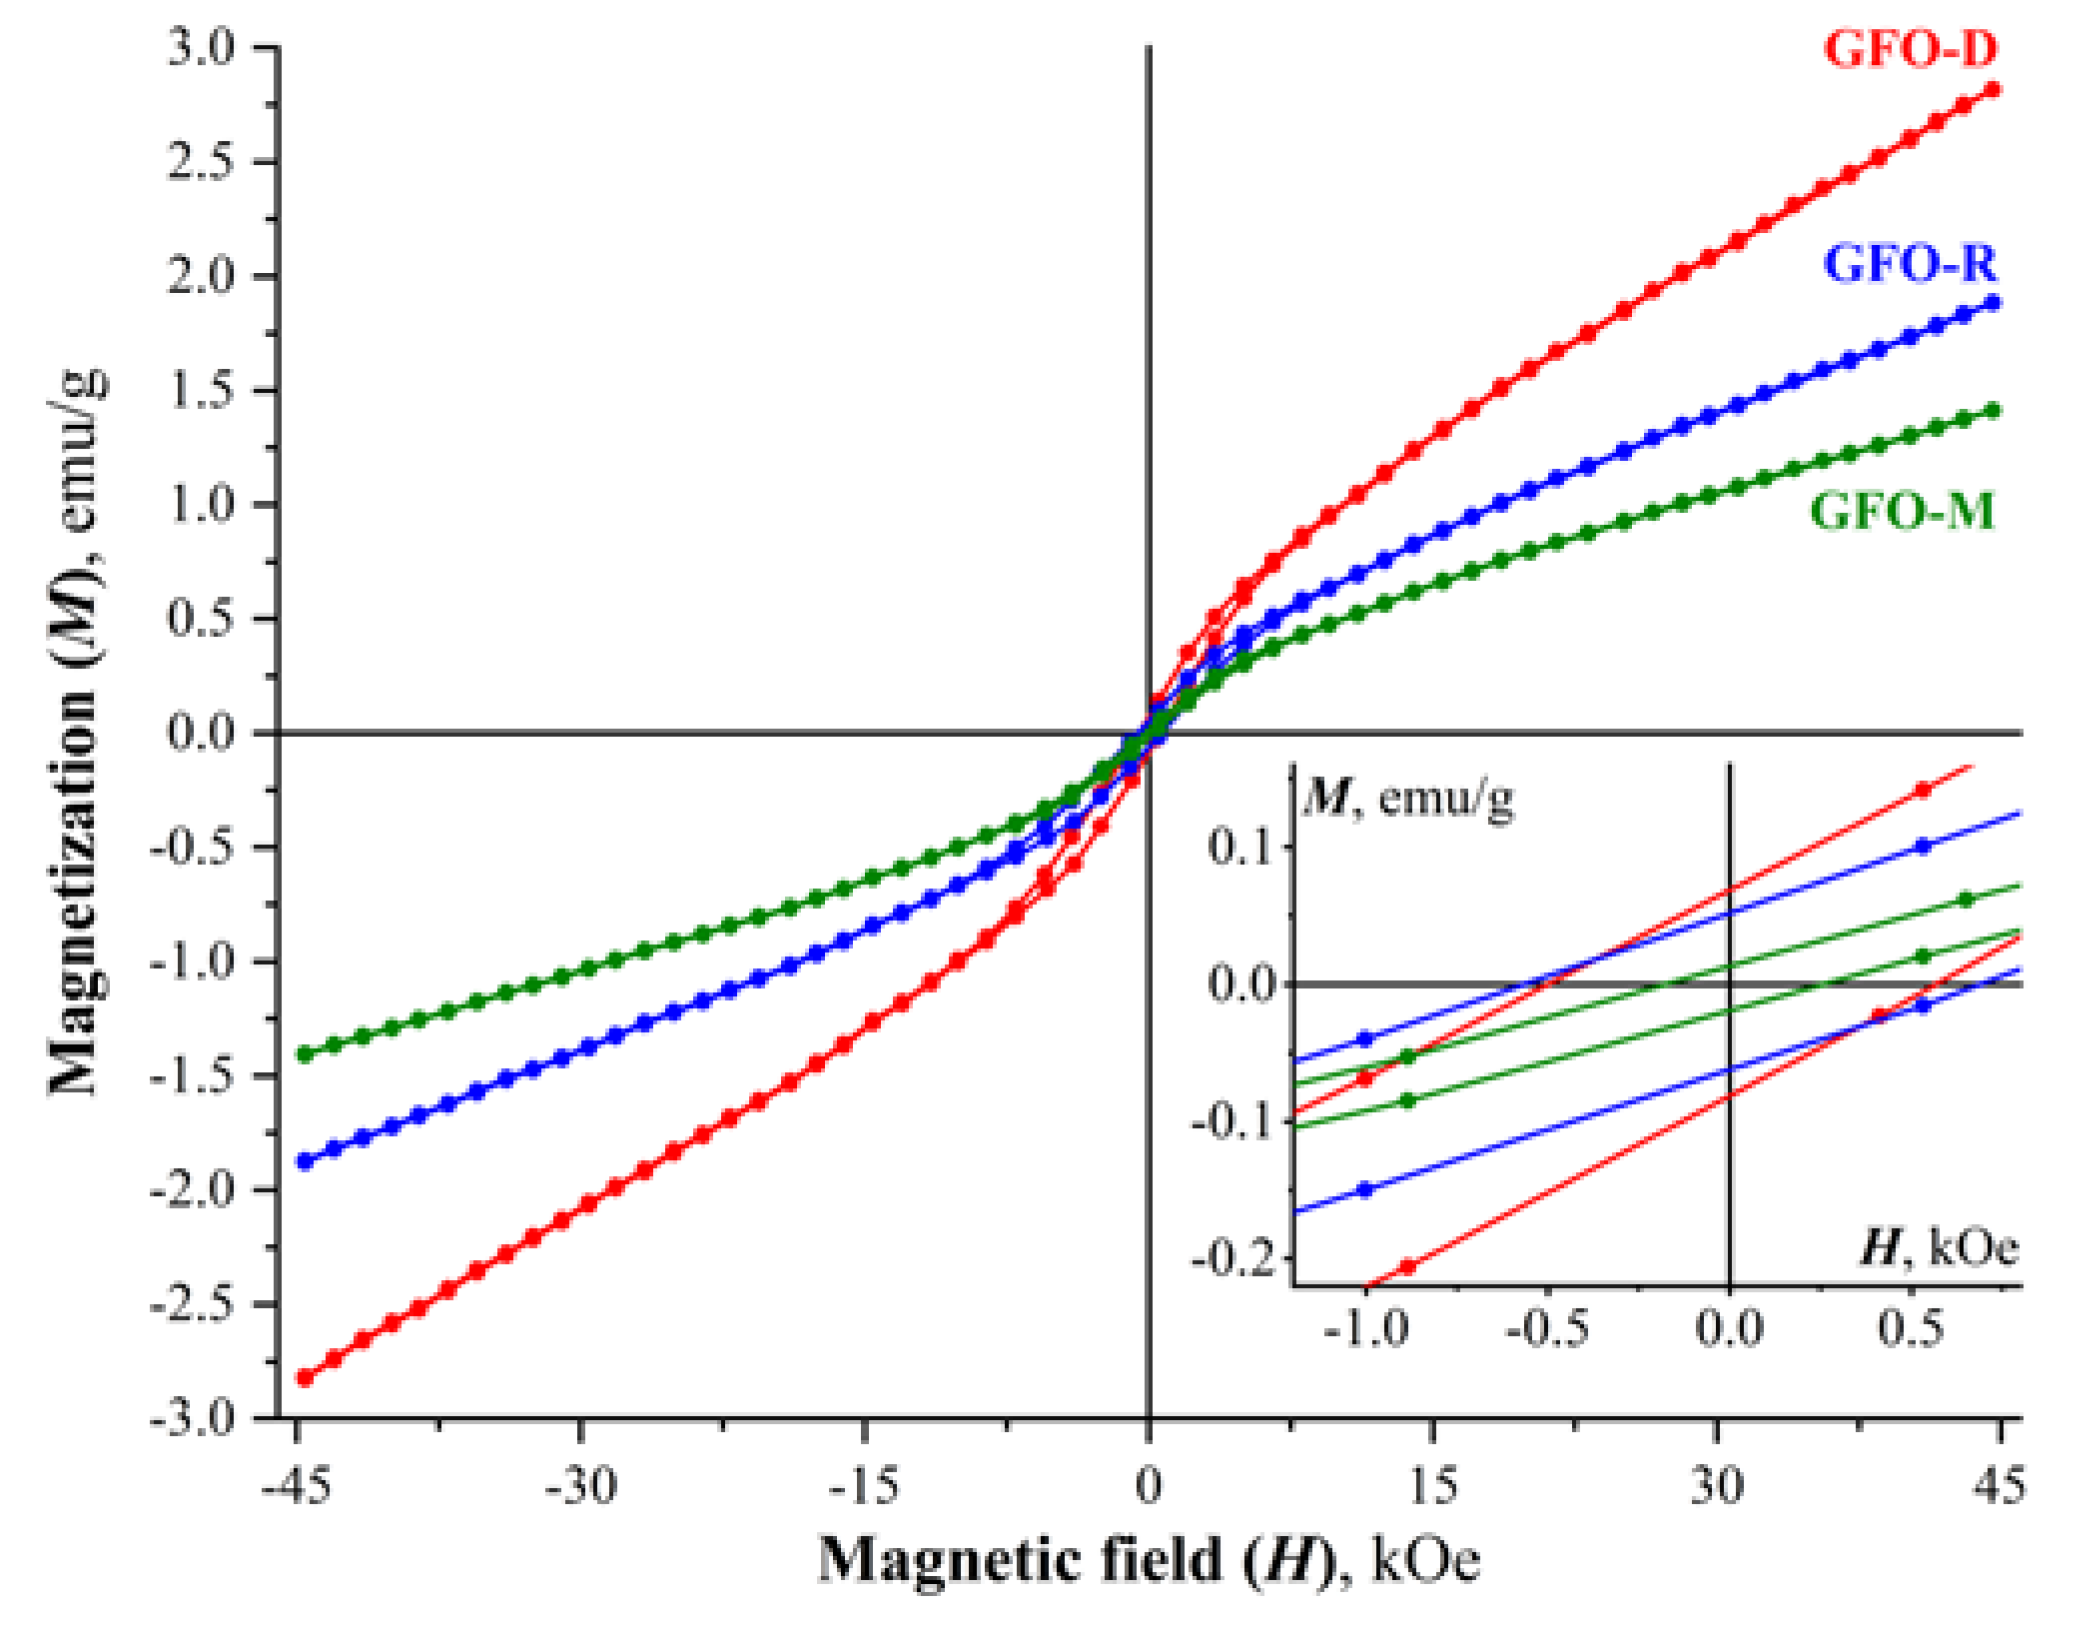
3.3.2. Vibration Magnetometry

Figure 8 shows the magnetic hysteresis loops of GdFeO3 samples obtained at room temperature (298 K) using a vibrating magnetometer.
According to the data obtained, all the observed dependences of the magnetization on the magnetic field have a characteristic S-shape with the absence of complete saturation even at an external field of 45 kOe, which, taking into account the low remanent magnetization values (Mr = 0.013–0.069 emu/g), may indicate the superparamagnetic character of the synthesized nanoparticles [29]. As shown in our previous work [16], the presence of a large number of aggregated GdFeO3 particles leads to the appearance of a more complex magnetic structure, as a result of which the observed magnetization dependences characterize not individual nanoparticles of GdFeO3, but its superparamagnetic cluster. This model is confirmed in this work, where, despite the low values of remanent magnetization and the absence of complete magnetization of all samples, even at high values of the applied field, sufficiently large values of the coercive force are still observed (Hc = 179–570 Oe). When the external magnetic field reaches its maximum values, the internal magnetic moments of superparamagnetic clusters of nanoparticles align along the field, resulting in pure magnetization, but complete saturation does not occur due to the presence of disordered surface-bound magnetic moments of the samples [30]. As the applied field decreases to zero and moves down the hysteresis loop, a small remanent magnetization remains due to the presence of cluster magnetic moments of strongly coupled nanoparticles whose collective behavior is characteristic of ferromagnets [31]. Thus, the example of three obtained samples of GdFeO3 clearly shows that the behavior of aggregated clusters of superparamagnetic nanoparticles differs significantly from the behavior of individual superparamagnetic nanoparticles.

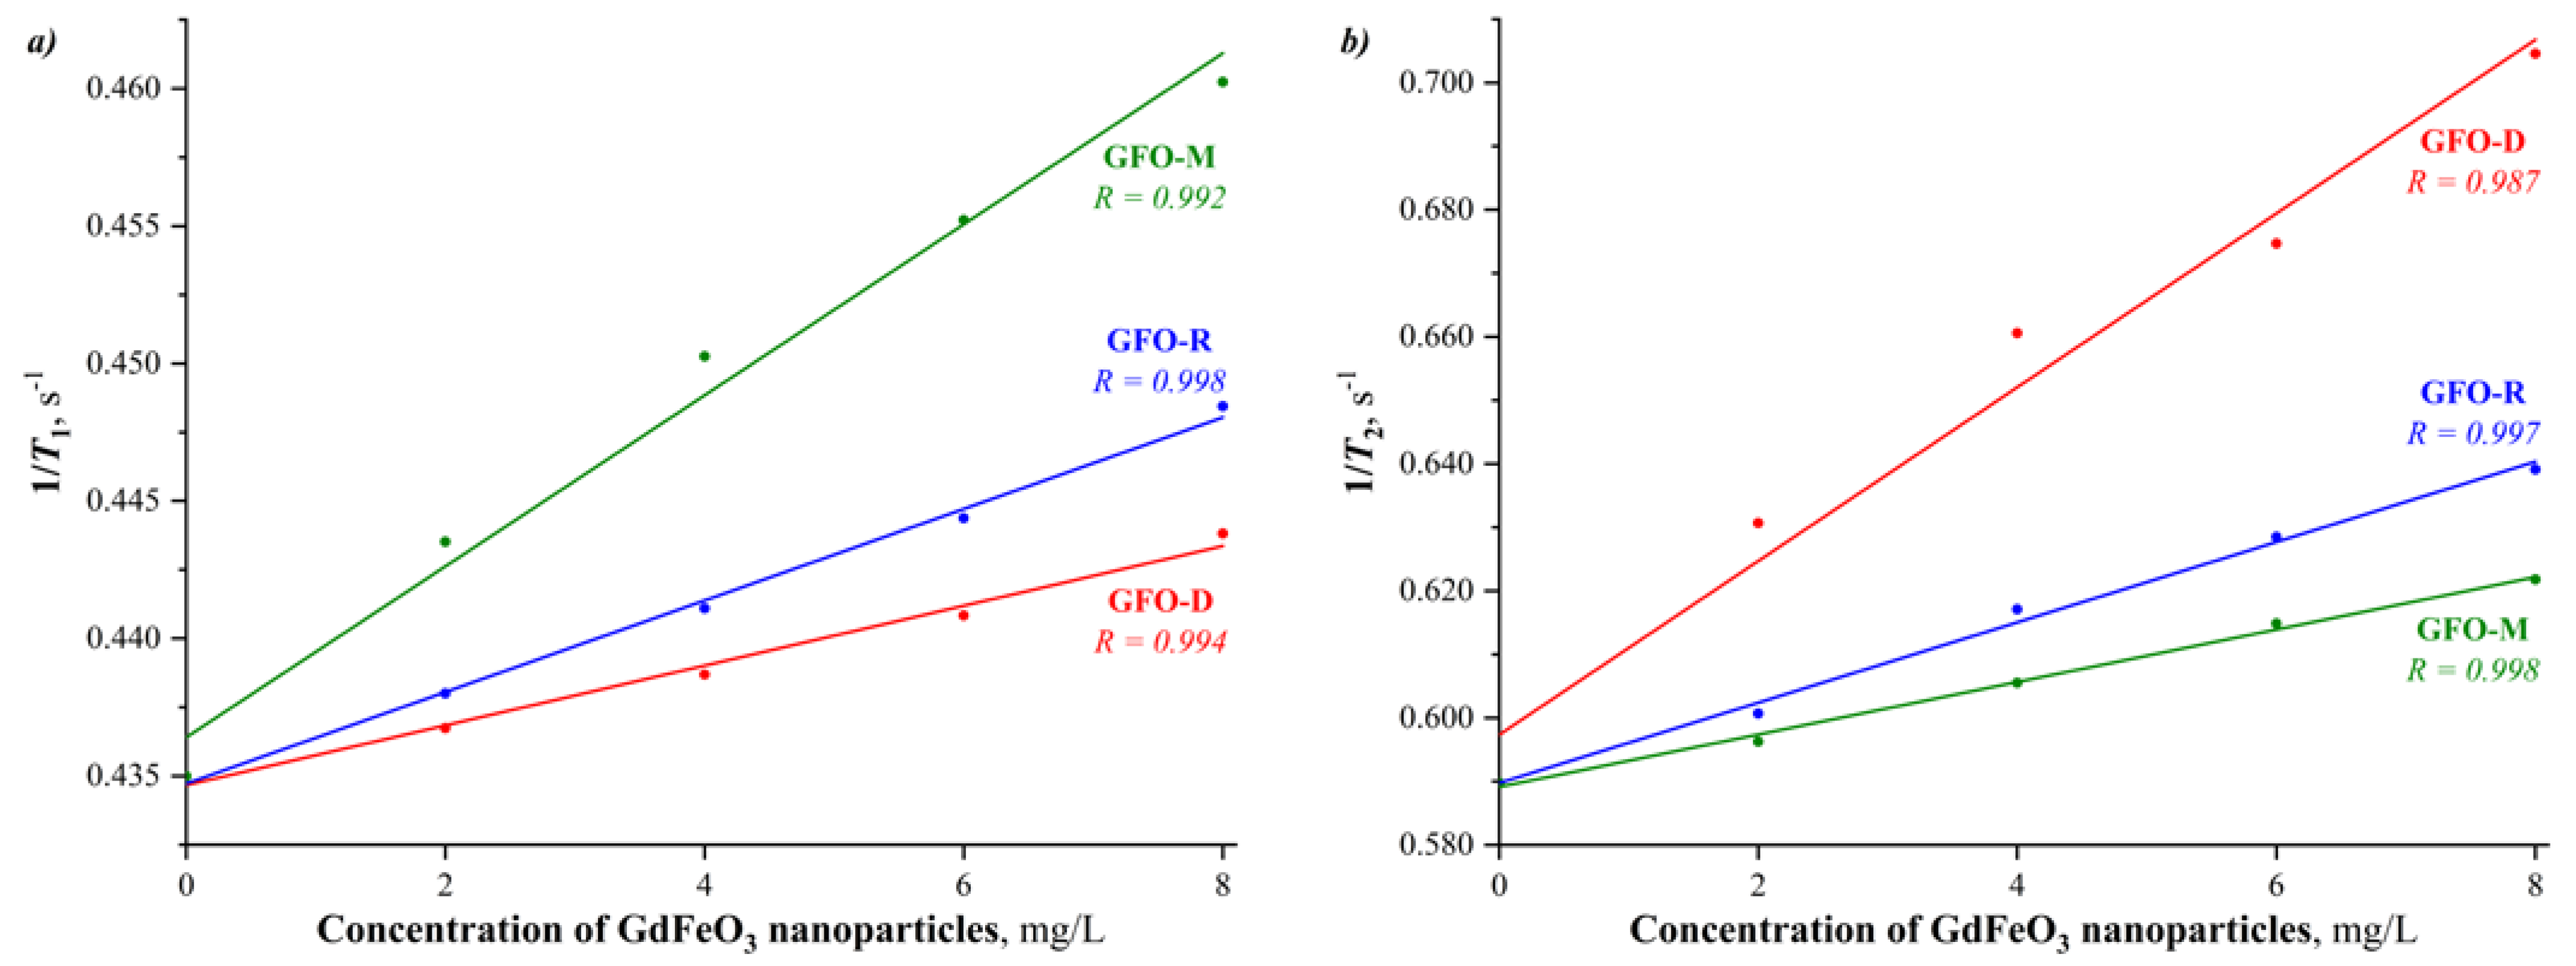
3.3.3. T1 and T2 Proton Relaxation

Taking into account that superparamagnetic GdFeO3 nanoparticles may be considered as a promising basis for T1T2 dual-modal MRI contrast agents, the longitudinal (T1) and transverse (T2) relaxation times of water protons were measured in colloidal solutions of the synthesized GdFeO3 nanoparticles with different concentrations. After that, the relaxation rates (1/T1 and 1/T2) were plotted as a function of concentration (Figure 9).
The presented MR relaxivity curves indicate an increase in longitudinal relaxivity (r1) in a row GFO-D < GFO-R < GFO-M and an increase in transverse relaxivity (r2) in a row GFO-M < GFO-R < GFO-D. These dependencies are strongly correlated with the crystallite-aggregate sizes of GdFeO3 samples and their magnetic behavior. To better understand the “structure to properties” relationship in this system, it is necessary to compare various structural, morphological and functional characteristics of the obtained nanopowders, which are summarized in Table 3. Since T1 relaxation is proportional to the available amount of high-spin Gd3+ cations on the surface of GdFeO3 nanoparticles, the T1 relaxivity (r1) should increase with an increase in the specific surface area of nanopowders (see Figure 5b). On the other hand, T2 relaxation is proportional to the superparamagnetic characteristics of GdFeO3 nanoparticles and the T2 relaxivity (r2) changes accordingly (see Figure 8).
To quantitatively describe the T1 and T2 relaxations of the obtained GdFeO3 nanoparticles, the corresponding values of relaxivities (r1 and r2) were calculated by linearizing the 1/T1 and 1/T2 dependences on concentration (Figure 9). The obtained values of relaxivity are given in Table 4, supplemented with data on the relaxivities of other orthoferrites of rare-earth elements [13]. It should be noted that the T1 relaxivity (r1) increases from 0.28 to 0.81 mM−1·s−1 with an increase in the specific surface area from 4.4 to 10.5 m2/g, which is explained by an increase in the contact amounts of high-spin paramagnetic Gd3+ cations with water protons. When comparing these values with data for other nanocrystalline rare-earth orthoferrites (Table 4), it becomes clear that the size and surface of crystallites play a key role in ensuring high values of longitudinal relaxivity. As for the T2 relaxivity (r2), its value is determined by the magnetic structure of orthoferrite nanoparticles. According to the results obtained, the T2 relaxivity (r2) increases from 1.08 to 3.57 mM−1·s−1 as the size of GdFeO3 nanoparticles decreases from 44.3 to 34.7 nm, which ensures their more pronounced superparamagnetic behavior (see details in Section 3.3.2). The r2/r1 ratio can be used to quickly and easily assess the potential of the synthesized GdFeO3 nanoparticles with respect to T1 or positive (r2/r1 < 2), T2 or negative (r2/r1 > 10) or T1T2 dual-modal (r2/r1 ~2–10) MRI contrast [32]. According to this classification, the GFO-D sample (r2/r1 = 12.58) may be considered as a T2 MRI contrast agent, the GFO-M sample (r2/r1 = 1.33) may be classified as a T1 MRI contrast agent, while the GFO-R sample (r2/r1 = 3.80) may have T1T2 dual-modal MRI contrast properties. It should be pointed out that these conclusions were made on the basis of only the r2/r1 ratio, despite the low relaxivities of the obtained GdFeO3 nanoparticles; therefore, the possibility of their potential use as T1, T2 or T1T2 dual-modal contrast agents for MRI requires further study. Interestingly, the previously investigated nanocrystalline rare-earth orthoferrites have been proposed as negative MRI contrast agents [13] (see Table 4). It is worth noting that a significant increase in the relaxivity of the synthesized GdFeO3 nanoparticles is possible with the subsequent use of additional procedures, such as dialysis of colloidal solutions [12], but taking this issue into account is beyond the scope of this work.

4. Conclusions

The approach proposed in this work, which is based on direct, reverse and microreactor co-precipitation of gadolinium and iron(III) hydroxides with their subsequent heat treatment at a temperature of 750 °C for 4 h in the air, can be successfully used for the synthesis of superparamagnetic close-to-isometric GdFeO3 nanocrystals with various crystallite sizes (34.7–44.3 nm), aggregation degrees (6–160 nanoparticles per aggregate), specific surface areas (4.4–10.5 m2/g), bandgap values (2.337–2.474 eV), longitudinal relaxivities (0.28–0.81 mM−1·s−1) and transverse relaxivities (1.08–3.57 mM−1·s−1). According to the obtained r2/r1 ratios, the synthesized GdFeO3 nanoparticles may be classified as T1 (GFO-M, r2/r1 = 1.33), T2 (GFO-D, r2/r1 = 12.58) or T1T2 dual modal (GFO-R, r2/r1 = 3.80) contrast agents for MRI, but the possibility of their potential use as such requires further study.

Author Contributions

Conceptualization: V.I.P.; methodology: R.S.A. and V.I.P.; validation: Y.A.; formal analysis: Y.A., K.D.M., S.G.I. and V.I.P.; investigation: Y.A., M.S.I., K.D.M., M.I.C. and V.N.N.; resources: V.I.P., R.S.A. and L.Y.G.; data curation: Y.A.; writing - original draft: Y.A. with contributions from V.I.P. and K.D.M.; writing - review and editing: V.I.P., S.G.I. and Y.A.; visualization: Y.A. with contribution from V.N.N. in Figure 6; supervision, project administration and funding acquisition: V.I.P. All authors have read and agreed to the published version of the manuscript.

Funding

This research was funded by the Russian Science Foundation (project No. 19-73-00286).

Institutional Review Board Statement

Not applicable.

Informed Consent Statement

Not applicable.

Acknowledgments

The authors are grateful to A. A. Sirotkin for the help in carrying out experiments using a free impinging-jets microreactor. The study was partially performed on the equipment of the Engineering Center of Saint Petersburg State Institute of Technology.

Conflicts of Interest

The authors declare no conflict of interest.

References

  1. Guleria, A.; Priyatharchini, K.; Kumar, D. Biomedical Applications of Magnetic Nanomaterials. In Applications of Nanomaterials; Elsevier: Amsterdam, The Netherlands, 2018; pp. 345–389. [Google Scholar]
  2. Laurent, S.; Henoumont, C.; Stanicki, D.; Boutry, S.; Lipani, E.; Belaid, S.; Muller, R.N.; Vander Elst, L. MRI Contrast Agents: From Molecules to Particles; Springer: Berlin/Heidelberg, Germany, 2017; ISBN 9789811025297. [Google Scholar]
  3. Xiao, Y.-D.; Paudel, R.; Liu, J.; Ma, C.; Zhang, Z.-S.; Zhou, S.-K. MRI contrast agents: Classification and application (Review). Int. J. Mol. Med. 2016, 38, 1319–1326. [Google Scholar] [CrossRef] [PubMed] [Green Version]
  4. Busquets, M.A.; Estelrich, J.; Sánchez-Martín, M.J. Nanoparticles in magnetic resonance imaging: From simple to dual contrast agents. Int. J. Nanomed. 2015, 10, 1727. [Google Scholar] [CrossRef] [PubMed] [Green Version]
  5. Geraldes, C.F.G.C.; Laurent, S. Classification and basic properties of contrast agents for magnetic resonance imaging. Contrast Media Mol. Imaging 2009, 4, 1–23. [Google Scholar] [CrossRef] [PubMed]
  6. Szpak, A.; Fiejdasz, S.; Prendota, W.; Strączek, T.; Kapusta, C.; Szmyd, J.; Nowakowska, M.; Zapotoczny, S. T1T2 Dual-modal MRI contrast agents based on superparamagnetic iron oxide nanoparticles with surface attached gadolinium complexes. J. Nanopart. Res. 2014, 16, 2678. [Google Scholar] [CrossRef] [Green Version]
  7. De, M.; Chou, S.S.; Joshi, H.M.; Dravid, V.P. Hybrid magnetic nanostructures (MNS) for magnetic resonance imaging applications. Adv. Drug Deliv. Rev. 2011, 63, 1282–1299. [Google Scholar] [CrossRef] [Green Version]
  8. Caravan, P.; Ellison, J.J.; McMurry, T.J.; Lauffer, R.B. Gadolinium(III) Chelates as MRI Contrast Agents: Structure, Dynamics, and Applications. Chem. Rev. 1999, 99, 2293–2352. [Google Scholar] [CrossRef]
  9. Hermann, P.; Kotek, J.; Kubíček, V.; Lukeš, I. Gadolinium(iii) complexes as MRI contrast agents: Ligand design and properties of the complexes. Dalton Trans. 2008, 9226, 3027. [Google Scholar] [CrossRef]
  10. Zhao, X.; Zhao, H.; Chen, Z.; Lan, M. Ultrasmall Superparamagnetic Iron Oxide Nanoparticles for Magnetic Resonance Imaging Contrast Agent. J. Nanosci. Nanotechnol. 2014, 14, 210–220. [Google Scholar] [CrossRef]
  11. Dulińska-Litewka, J.; Łazarczyk, A.; Hałubiec, P.; Szafrański, O.; Karnas, K.; Karewicz, A. Superparamagnetic Iron Oxide Nanoparticles—Current and Prospective Medical Applications. Materials 2019, 12, 617. [Google Scholar] [CrossRef] [Green Version]
  12. Söderlind, F.; Fortin, M.A.; Petoral, R.M., Jr.; Klasson, A.; Veres, T.; Engström, M.; Uvdal, K.; Käll, P.-O. Colloidal synthesis and characterization of ultrasmall perovskite GdFeO3 nanocrystals. Nanotechnology 2008, 19, 085608. [Google Scholar] [CrossRef]
  13. Pinho, S.L.C.; Amaral, J.S.; Wattiaux, A.; Duttine, M.; Delville, M.-H.; Geraldes, C.F.G.C. Synthesis and Characterization of Rare-Earth Orthoferrite LnFeO3 Nanoparticles for Bioimaging. Eur. J. Inorg. Chem. 2018, 2018, 3570–3578. [Google Scholar] [CrossRef]
  14. Athar, T.; Vishwakarma, S.K.; Bardia, A.; Khan, A.A. Super paramagnetic iron oxide and gadolinium (FeGdO3) nanopowder synthesized by hydrolytic approach passes high level of biocompatibility and MRI-based dual contrast property for competent molecular imaging and therapeutic interventions. Biomed. Phys. Eng. Express 2016, 2, 025010. [Google Scholar] [CrossRef]
  15. Deka, S.; Saxena, V.; Hasan, A.; Chandra, P.; Pandey, L.M. Synthesis, characterization and in vitro analysis of α-Fe2O3-GdFeO3 biphasic materials as therapeutic agent for magnetic hyperthermia applications. Mater. Sci. Eng. C 2018, 92, 932–941. [Google Scholar] [CrossRef]
  16. Albadi, Y.; Martinson, K.D.; Shvidchenko, A.V.; Buryanenko, I.V.; Semenov, V.G.; Popkov, V.I. Synthesis of GdFeO3 nanoparticles via low-temperature reverse co-precipitation: The effect of strong agglomeration on the magnetic behavior. Nanosyst. Phys. Chem. Math. 2020, 11, 252–259. [Google Scholar] [CrossRef] [Green Version]
  17. Tugova, E.A.; Zvereva, I.A. Formation mechanism of GdFeO3 nanoparticles under the hydrothermal conditions. Nanosyst. Phys. Chem. Math. 2013, 4, 851–856. [Google Scholar]
  18. Gimaztdinova, M.M.; Tugova, E.A.; Tomkovich, M.V.; Popkov, V.I. Synthesis of GdFeO3 nanocrystals via glycine-nitrate combustion. Condens. Phases Interfaces 2016, 18, 422–431. [Google Scholar]
  19. Li, L.; Wang, X.; Lan, Y.; Gu, W.; Zhang, S. Synthesis, Photocatalytic and Electrocatalytic Activities of Wormlike GdFeO3 Nanoparticles by a Glycol-Assisted Sol–Gel Process. Ind. Eng. Chem. Res. 2013, 52, 9130–9136. [Google Scholar] [CrossRef]
  20. Tang, P.; Hu, Y.; Lin, T.; Jiang, Z.; Tang, C. Preparation of Nanocrystalline GdFeO3 by Microwave Method and Its Visible-light Photocatalytic Activity. Integr. Ferroelectr. 2014, 153, 73–78. [Google Scholar] [CrossRef]
  21. Sivakumar, M.; Gedanken, A.; Bhattacharya, D.; Brukental, I.; Yeshurun, Y.; Zhong, W.; Du, Y.W.; Felner, I.; Nowik, I. Sonochemical Synthesis of Nanocrystalline Rare Earth Orthoferrites Using Fe(CO)5 Precursor. Chem. Mater. 2004, 16, 3623–3632. [Google Scholar] [CrossRef]
  22. Mathur, S.; Shen, H.; Lecerf, N.; Kjekshus, A.; Fjellvåg, H.; Goya, G.F. Nanocrystalline Orthoferrite GdFeO3 from a Novel Heterobimetallic Precursor. Adv. Mater. 2002, 14, 1405–1409. [Google Scholar] [CrossRef]
  23. Liu, J.; He, F.; Chen, L.; Qin, X.; Zhao, N.; Huang, Y.; Peng, Y. Novel hexagonal-YFeO3/α-Fe2O3 heterojunction composite nanowires with enhanced visible light photocatalytic activity. Mater. Lett. 2016, 165, 263–266. [Google Scholar] [CrossRef]
  24. Wojdyr, M. Fityk: A general-purpose peak fitting program. J. Appl. Crystallogr. 2010, 43, 1126–1128. [Google Scholar] [CrossRef]
  25. Ilhan, S.; Izotova, S.G.; Komlev, A.A. Synthesis and characterization of MgFe2O4 nanoparticles prepared by hydrothermal decomposition of co-precipitated magnesium and iron hydroxides. Ceram. Int. 2015, 41, 577–585. [Google Scholar] [CrossRef]
  26. Vandana, C.S.; Rudramadevi, B.H. Effect of Cu2+ substitution on the structural, magnetic and electrical properties of gadolinium orthoferrite. Mater. Res. Express 2018, 5, 046101. [Google Scholar] [CrossRef]
  27. Prakash, B.J.; Rudramadevi, B.H.; Buddhudu, S. Analysis of Ferroelectric, Dielectric and Magnetic Properties of GdFeO3 Nanoparticles. Ferroelectr. Lett. Sect. 2014, 41, 110–122. [Google Scholar] [CrossRef]
  28. Sing, K.S.W. Reporting physisorption data for gas/solid systems with special reference to the determination of surface area and porosity (Recommendations 1984). Pure Appl. Chem. 1985, 57, 603–619. [Google Scholar] [CrossRef]
  29. Naseri, M.G.; Ara, M.H.M.; Saion, E.B.; Shaari, A.H. Superparamagnetic magnesium ferrite nanoparticles fabricated by a simple, thermal-treatment method. J. Magn. Magn. Mater. 2014, 350, 141–147. [Google Scholar] [CrossRef]
  30. Abbasian, A.R.; Lorfasaei, Z.; Shayesteh, M.; Afarani, M.S. Synthesis of cobalt ferrite colloidal nanoparticle clusters by ultrasonic-assisted solvothermal process. J. Aust. Ceram. Soc. 2020, 56, 1119–1126. [Google Scholar] [CrossRef]
  31. Xu, W.-H.; Wang, L.; Wang, J.; Sheng, G.-P.; Liu, J.-H.; Yu, H.-Q.; Huang, X.-J. Superparamagnetic mesoporous ferrite nanocrystal clusters for efficient removal of arsenite from water. CrystEngComm 2013, 15, 7895. [Google Scholar] [CrossRef]
  32. Zhang, W.; Liu, L.; Chen, H.; Hu, K.; Delahunty, I.; Gao, S.; Xie, J. Surface impact on nanoparticle-based magnetic resonance imaging contrast agents. Theranostics 2018, 8, 2521–2548. [Google Scholar] [CrossRef]
Figure 1. Scheme for the synthesis of co-precipitated hydroxides (CPHs) and their heat-treated products (HTPs): (a) direct co-precipitation (D); (b) reverse co-precipitation (R); (c) microreactor co-precipitation (M).
Inorganics 09 00039 g001
Figure 2. Direct and reverse titration curves: titration of gadolinium and iron(III) nitrates with ammonia (a) and titration of ammonia with gadolinium and iron(III) nitrates (b).
Inorganics 09 00039 g002
Figure 3. (a) X-ray diffraction patterns of the heat-treated products of co-precipitated hydroxides; (b) volume-weighted lognormal size distributions of the obtained GdFeO3 crystallites and comparison of their parameters (average crystallite size, maximum and FWHM values of size distributions).
Inorganics 09 00039 g003
Figure 4. FTIR spectra of the samples of co-precipitated hydroxides (a) and their heat-treated products (b).
Inorganics 09 00039 g004
Figure 5. (a) Low-temperature nitrogen adsorption-desorption isotherms of the heat-treated products of co-precipitated hydroxides. The insets show the pore width distributions in these products: Sint = integral surface area, Sdiff = differential surface area; (b) Comparison of the results of adsorption-structural analysis of the heat-treated products of co-precipitated hydroxides.
Inorganics 09 00039 g005
Figure 6. HRTEM images of the GdFeO3 nanoparticles obtained using direct (GFO-D: a,b), reverse (GFO-R: c,d) and microreactor (GFO-M: e,f) co-precipitation techniques. The SAED patterns of the corresponding samples are shown as insets in the survey HRTEM images (a,c,e).
Inorganics 09 00039 g006
Figure 7. (a) DRS spectra of the obtained samples of GdFeO3 nanocrystals. The insets show photographs of the powders obtained after the heat treatment of the co-precipitated hydroxides; (b) Tauc plots for direct allowed transitions of the obtained samples of GdFeO3 nanocrystals. The inset shows the bandgap values and the potentials of the conduction band (ECB) and the valence band (EVB) of these nanocrystals: E = potential versus the normal hydrogen electrode (NHE).
Inorganics 09 00039 g007
Figure 8. Magnetization curves of the obtained GdFeO3 samples at 298 K.
Inorganics 09 00039 g008
Figure 9. MR relaxivity curves of the colloidal solutions of GdFeO3 nanoparticles obtained using direct (GFO-D), reverse (GFO-R) and microreactor (GFO-M) co-precipitation techniques: longitudinal (a) and transverse (b).
Inorganics 09 00039 g009
Table 1. Assignment of bands in the FTIR spectra of the samples of co-precipitated hydroxides.
Wavenumber (cm−1)Assignment
ExperimentalObtained Using Fityk
CPH-DCPH-RCPH-MCPH-DCPH-RCPH-M
458 s458 s469 s465 s478 s469 sν(M-O), M = Fe3+ or Gd3+, in amorphous CPHs
689 br m677 br m672 br mν(M-OH), M = Fe3+ or Gd3+, in amorphous CPHs
745 vw756 vw748 vwδas(CO32−, NO3), in plane bending, HOH libration
815 w 819 wδs(NO3), out of plane bending, coordinated to Fe3+ or Gd3+ or in free state
833 w833 w833 w838 w840 w839 w
840 w840 w840 w842 w845 w853 wδs(HCO3), δs(CO32−), out of plane bending, coordinated to Fe3+ or Gd3+
881 w 877 w
1043 w1047 w1043 w1043 w1044 w1044 wνs(NO3), IR-active due to coordination to Fe3+ or Gd3+
1078 w1076 w1078 w1076 w1079 w1080 wνs(CO32−), IR-active due to coordination to Fe3+ or Gd3+
1102 vw1114 vw1119 vwν’as(CO32−), synchronous, splitted, polydentate coordinated to Fe3+ or Gd3+
1162 vw1161 vw1162 vwν’as(CO32−), synchronous, splitted, polydentate coordinated to Fe3+ or Gd3+
1354 sh1355 sh1353 sh1324 s1366 s1341 sν’as(CO32−), synchronous, splitted, bidentate coordinated to Fe3+ or Gd3+
1385 s sharp1385 s sharp1385 s sharp 1384 m sharp1384 m sharp1384 m sharpνas(NO3), in free state/incoordinated
1390 m1393 m1396 mνas(NO3), monodentate coordinated to Fe3+ or Gd3+
1492 s 1506 s1498 s1499 s1510 s1502 sν”as(CO32−), ν”as(HCO3), asynchronous, splitted, bidentate coordinated to Fe3+ or Gd3+
1636 m1632 m1630 m1622 w1625 w1624 wν”as(CO32−), ν”as(HCO3), asynchronous, splitted, polydentate coordinated to Fe3+ or Gd3+ or δ(H2O) in adsorbed water
1652 m1653 m1654 mδ(H2O), in H-bonded or adsorbed water
1768 w1768 w1768 w1768 w1768 w1767 wν(C = O), coordinated to Fe3+ or Gd3+
1785 w
2361 w νas(CO2), from atmosphere
2426 sharp w2427 sharp w2427 sharp wNO3 groups
3370 br s3413 br s3402 br s3201 m3221 m3188 mνs(H2O), in H-bonded or adsorbed water
3370 s3397 s3361 sνas(H2O), in H-bonded or adsorbed water
3498 s3518 s3480 sν(OH)
3568 s3588 s3552 s
s—strong, m—medium, w—weak, sh—shoulder, br—broad, v—very.
Table 2. Assignment of bands in the FTIR spectra of the heat-treated products.
Wavenumber (cm−1)Assignment
ExperimentalObtained Using Fityk
HTP-DHTP-RHTP-MHTP-DHTP-RHTP-M
436 s432 s434 s441 s442 s443 sδ(O-Fe-O), in o-GdFeO3
561 vs559 vs561 vs556 s554 s554 sν(Gd-O), in o-GdFeO3
597 s593 s594 sν(Fe-O), in o-GdFeO3
-1643 w1636 w1655 vw1640 w1637 wδ(H2O), in H-bonded or adsorbed water
3435 br m3470 br m 3260 -mνs(H2O), in H-bonded or adsorbed water
3443 -m3402 -m3436 -mνas(H2O), in H-bonded or adsorbed water
s—strong, m—medium, w—weak, br—broad, v—very.
Table 3. Summarized characteristics of the GdFeO3 nanoparticles synthesized using different co-precipitation techniques.
SampleCrystallite Size,
nm
Aggregate Size,
nm
Specific Surface Area,
m2/g
Bandgap Value,
eV
Remanence,
emu/g
Coercivity,
Oe
GFO-D34.7188.24.42.3370.069503
GFO-R43.9137.46.02.4740.052570
GFO-M44.378.510.52.4670.013179
Table 4. Relaxivities of the synthesized GdFeO3 nanocrystals, compared with literature data for other nanocrystalline rare-earth orthoferrites.
Sampler1, mM−1·s−1r2, mM−1·s−1r2/r1Reference
GdFeO3 (GFO-D)0.283.5712.58This work
GdFeO3 (GFO-R)0.431.653.80This work
GdFeO3 (GFO-M)0.811.081.33This work
GdFeO30.605.659.42[13]
TbFeO30.689.4513.90[13]
EuFeO30.206.1830.9[13]
Publisher’s Note: MDPI stays neutral with regard to jurisdictional claims in published maps and institutional affiliations.

