Article

Diverse Coordination Numbers and Geometries in Pyridyl Adducts of Lanthanide(III) Complexes Based on β-Diketonate

1
Institut für Physikalische and Theoretische Chemie, Technische Universität Graz, A-8010 Graz, Austria
2
Institut für Anorganische Chemie, Technische Universität Graz, Stremayrgasse 9/V, A-8010 Graz, Austria
3
Departament de Química Inorgànica i Orgànica, Universitat de Barcelona, Martí i Franquès 1-11, E-31321 Barcelona, Spain
4
Departament de Mineralogia, Cristallografia i Dipòsits Minerals and Unitat de Difracció de R-X, Centre Científic i Tecnològic de la Universitat de Barcelona (CCiTUB), Universitat de Barcelona, Solé i Sabarís 1-3, 08028 Barcelona, Spain
5
Department of Chemistry, University of Louisiana at Lafayette, P.O. Box 43700, Lafayette, LA 70504, USA
6
Department of Chemistry, Faculty of Sciences, Alexandria University, Moharam Bey, Alexandria 21511, Egypt
*
Authors to whom correspondence should be addressed.
Submission received: 28 July 2021 / Revised: 24 September 2021 / Accepted: 28 September 2021 / Published: 30 September 2021
(This article belongs to the Section Coordination Chemistry)

Abstract

:
Ten mononuclear rare earth complexes of formula [La(btfa)3(H2O)2] (1), [La(btfa)3(4,4′-Mt2bipy)] (2), [La(btfa)3(4,4′-Me2bipy)2] (3), [La(btfa)3(5,5′-Me2bipy)2] (4), [La(btfa)3(terpy)] (5), [La(btfa)3(phen)(EtOH)] (6), [La(btfa)3(4,4′-Me2bipy)(EtOH)] (7), [La(btfa)3(2-benzpy)(MeOH)] (8), [Tb(btfa)3(4,4′-Me2bipy)] (9) and (Hpy)[Eu(btfa)4] (10), where btfa = 4,4,4-trifuoro-1-phenylbutane-1,3-dionato anion, 4,4′-Mt2bipy = 4,4′-dimethoxy-2,2′-bipyridine, 4,4′-Me2bipy = 4,4′-dimethyl-2,2′-bipyridine, 5,5′-Me2bipy = 5,5′-dimethyl-2,2′-bipyridine, terpy = 2,2′:6′,2′-terpyridine, phen = 1,10-phenathroline, 2-benzpy = 2-(2-pyridyl)benzimidazole, Hpy = pyridiniumH+ cation) have been synthesized and structurally characterized. The complexes display coordination numbers (CN) eight for 1, 2, 9, 10, nine for 5, 6, 7, 8 and ten for 3 and 4. The solid-state luminescence spectra of Tb-9 and Eu-10 complexes showed the same characteristic bands predicted from the Tb(III) and Eu(III) ions. The Overall Quantum Yield measured (ϕTOT) at the excitation wavelength of 371 nm for both compounds yielded 1.04% for 9 and up to 34.56% for 10.

1. Introduction

The coordination chemistry of lanthanides has been the subject of extensive studies over the last two decades as these compounds revealed unusual physicochemical characteristics including fluorescent and potent magnetic properties because of their unique 4f electrons [1,2,3,4]. Many of the lanthanide compounds have been used in technological devices such as smartphones, solar cells, solid-state lasers emitting in the UV, visible, or near-infrared (NIR) regions, optical glasses, batteries, increasing the memory storage of computers [1,2,5,6,7,8,9,10,11,12] as well as chiral sensing of biomolecules [13]. The small ionic size of lanthanide ions makes them have the ability to replace metal ions inside protein complex such as calcium [14]. Lanthanide-tagged proteins are valuable for investigating protein structure, function, and dynamics [14,15]. Additionally, lanthanides, especially, La3+ and Gd3+ block different types of calcium, potassium, and sodium channels in human and animal neurons [16]. The lanthanide(III) ions or their compounds binding to DNA and cleavage DNA is a growing topic to understand mutations that lead to cancer and treatment of this disease [17,18]. Furthermore, the in vitro and vitro cytotoxic activities of some Ln(III) complexes especially, La(III) and Ce(III), which showed very promising anti-tumor activity [19,20].
The general electronic configurations [Xe] 4f0−14 of lanthanide ions (Ln(III)) generate a variety of electronic energy levels [1,2,3,12]. The electronic transitions within the 4f orbitals are shielded by the filled 5s25p6 subshells, and as a result they are becoming less sensitive to the chemical environments around Ln(III) ions. Consequently, each lanthanide ion exhibits narrow and characteristic 4f-4f transitions except La3+ (4f0) and Lu3+ (4f14). The 4f-4f transitions in Ln(III) complexes are Laporte forbidden leading to weak light absorption [2,4] and hence the process of direct excitation of metal electrons is very inefficient. However, the most prominent feature in the lanthanide compounds is through the “antenna effect” in which the ligand or linker is used for the excitation process followed by energy transfer to the lanthanide centers, from which the emission occurs and, in this case, the forbidden 4f-transitions can be fairly enhanced, i.e., partly circumvented [1,2,3,12]. Charge-transfer, CT luminescence is generated from an allowed transition from the charge-transfer excited state to the ground state(s). Two types of charge transfers are found in lanthanide complexes: the L→MCT (the electronic transition from an organic linker-localized orbital to a metal-centered orbital) and M→LCT (the electronic transition from a metal-centered orbital to an organic linker-localized orbital). In some cases, the two processes L→MCT and M→LCT luminescence may occur with ligand-based luminescence.
The shielding role of the 4f orbitals and size of the Ln3+ cations induce high coordination numbers and flexible coordination geometries. Following Pearson’s HSAB theory, lanthanide cations are hard Lewis acids, and thus exhibit strong binding affinity for Lewis bases derived from O-donor and N-containing ligands. A large number of Ln(III) complexes have been isolated and structurally characterized with the indicated ligands and specifically with β-diketonate species [21,22,23,24,25,26,27,28,29,30]. Herein, we report the synthesis, structural characterization of a novel series of La(III), Eu(III) and Tb(III) complexes based on 4,4,4-trifluoro-1-phenyl-butane-1,3-dione (Hbtfa) and their pyridine derivatives (4,4′-Mt2bipy = 4,4′-dimethoxybipyridine, 4,4′-Me2bipy = 4,4′-dimethylbipyridine, 5,5′-Me2bipy = 5,5′-dimethylbipyridine, phen = 1,10-phenanthrolinene, terpy = 2,2′:6′, 2″-terpyridine, 2-benzpy = 2-(2-pyriyl)-benzimidazole) as well as the photoluminescent properties of Tb(III) and Eu(III) compounds.

2. Results and Discussion

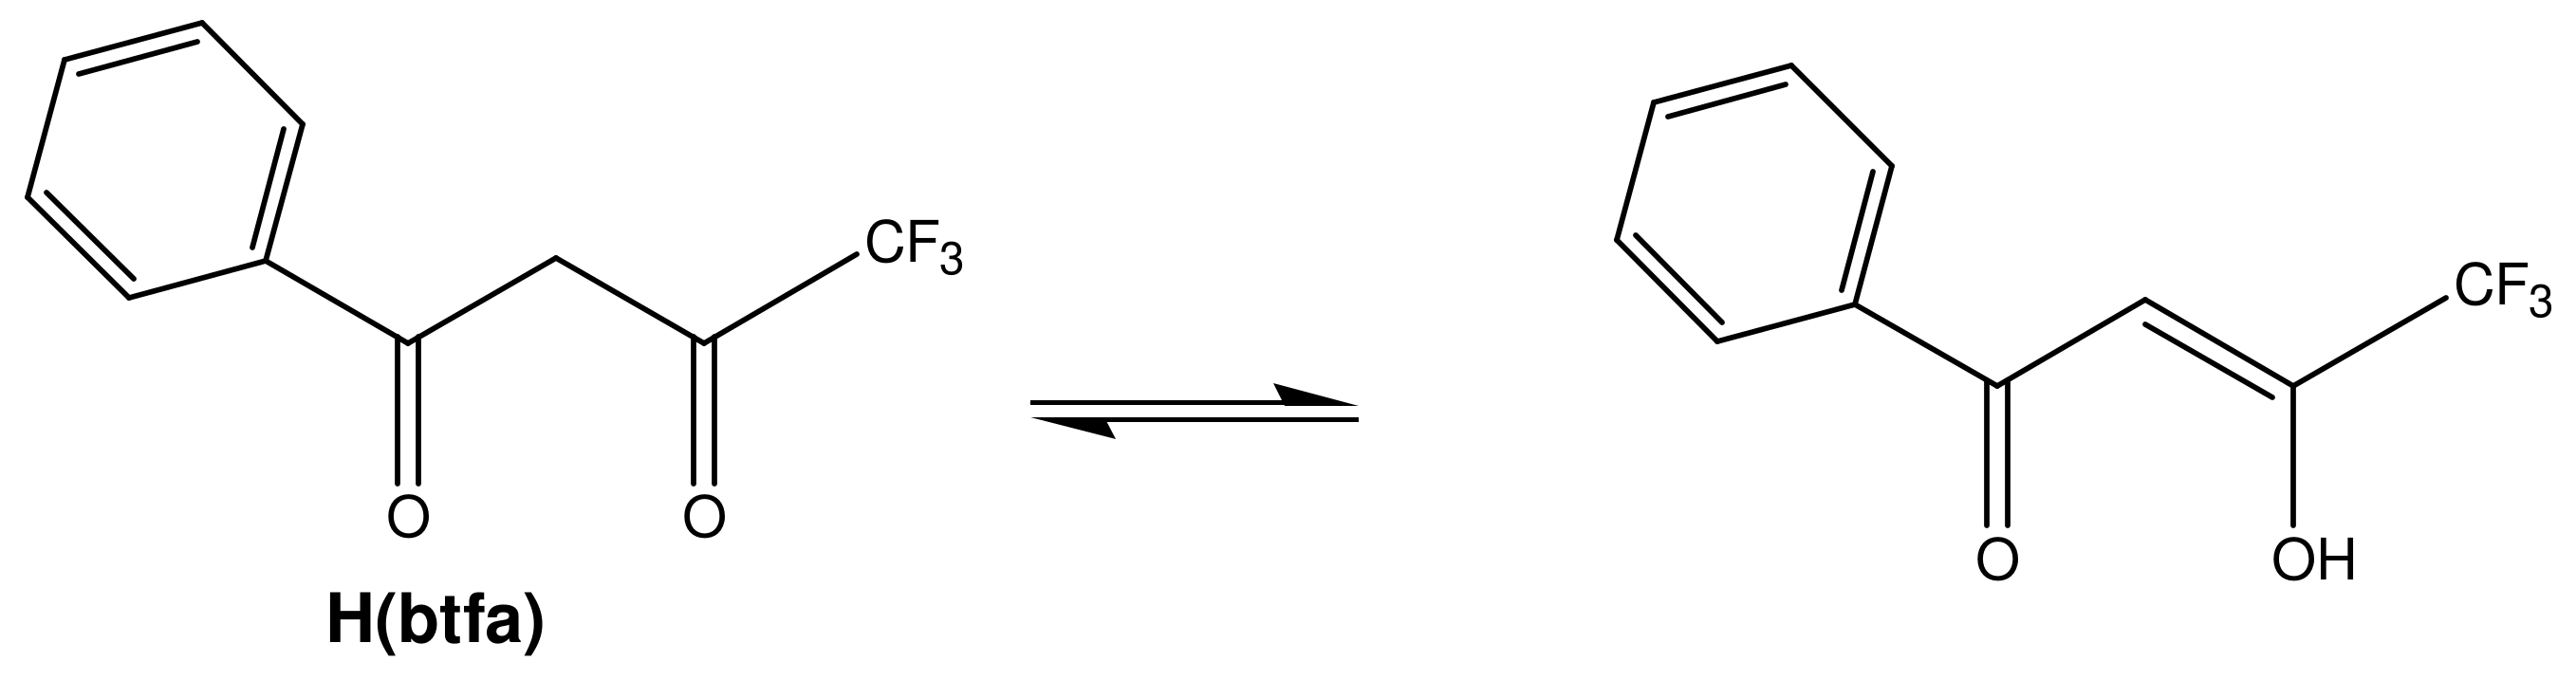
2.1. Synthetic Aspects and IR Spectra of the Complexes

The reaction of an ethanolic solution containing the stoichiometric amounts of La(NO3)3·6H2O and 4,4,4-trifluoro-1-phenylbutane-1,3-dione (Hbtfa) (Scheme 1) in the presence of NaOH (1:3:3), followed by the addition of H2O and stirring at room temperature afforded the diaqua complex [La(btfa)3(H2O)2] (1) in a reasonable high yield (78%). This complex was used as the precursor for the preparation of the La(III)-pyridyl adducts 2–8. Reactions of [La(btfa)3(H2O)2] (1) with two equivalents of 4,4′-Me2bipy and 5,5′-Me2bipy in ethanol and/or ethanol-acetone mixture resulted in the formation of bis(bipyridyl) adducts 3 and 4, respectively. Mono(pyridyl) adducts were obtained when 1:1 molar ratio of the diaqua complex 1 and 4,4′-Mt2bipy, terpy, phen and 4,4′-Me2bipy were used leading to the isolation of [La(btfa)3(4,4′-Mt2bipy)] (2), [La(btfa)3(terpy)] (5), [La(btfa)3(phen)(EtOH)] (6) and [La(btfa)3(4,4′-Me2bipy)(EtOH)] (7), respectively in a yield varies from 37 to 74%. A similar product was also formed, [La(btfa)3(2-benzpy)(MeOH)] (8) when MeOH was used as a solvent. On the other hand, the in situ reaction of Tb(NO3)3·6H2O, Hbtfa, Et3N and 4,4′-Me2bipy in ethanol produced the yellow crystalline compound [Tb(btfa)3(4,4′-Me2bipy)] (9) in 75% yield, whereas the corresponding reaction of Eu(NO3)3·6H2O, five equivalents of Hbtfa and excess pyridine (py) in ethanol led to the separation of the anionic complex (Hpy)[Eu(btfa)4] (10) (62% yield). Probably, we should mention that, with the exception of complex 9, attempts made to obtain good quality crystals suitable for X-ray analysis of Tb(III) and Eu(III)-pyridyl adducts, similar to those obtained in this work were failed and as a result only the two complexes 9 and 10 were synthesized and characterized. However, complex [Eu(btfa)3(4,4′-Me2bipy)] similar to the Tb-9 was reported [31]. The purity of the ten compounds was confirmed by elemental microanalyses (see experimental section) and also with checking their X-ray powder diffractions (Figures S1–S10, Supplementary Material Section) as well as X-ray structural analysis.
The IR spectra of the complexes under investigation display general characteristic pattern that is similar to most Ln(III) compounds containing tris- and tetrakis(β-ketonato) anions [24,25,26]. The strong vibrational band observed over the frequency range 1604–1614 cm−1 of the complexes 1–10 is assigned to the stretching frequency of the coordinated carbonyl, ν(C=O) [24,25,26]. The weak broad band observed around 3460 cm−1 reveals the ν(O-H) stretching frequency of the coordinated aqua ligands in 1.

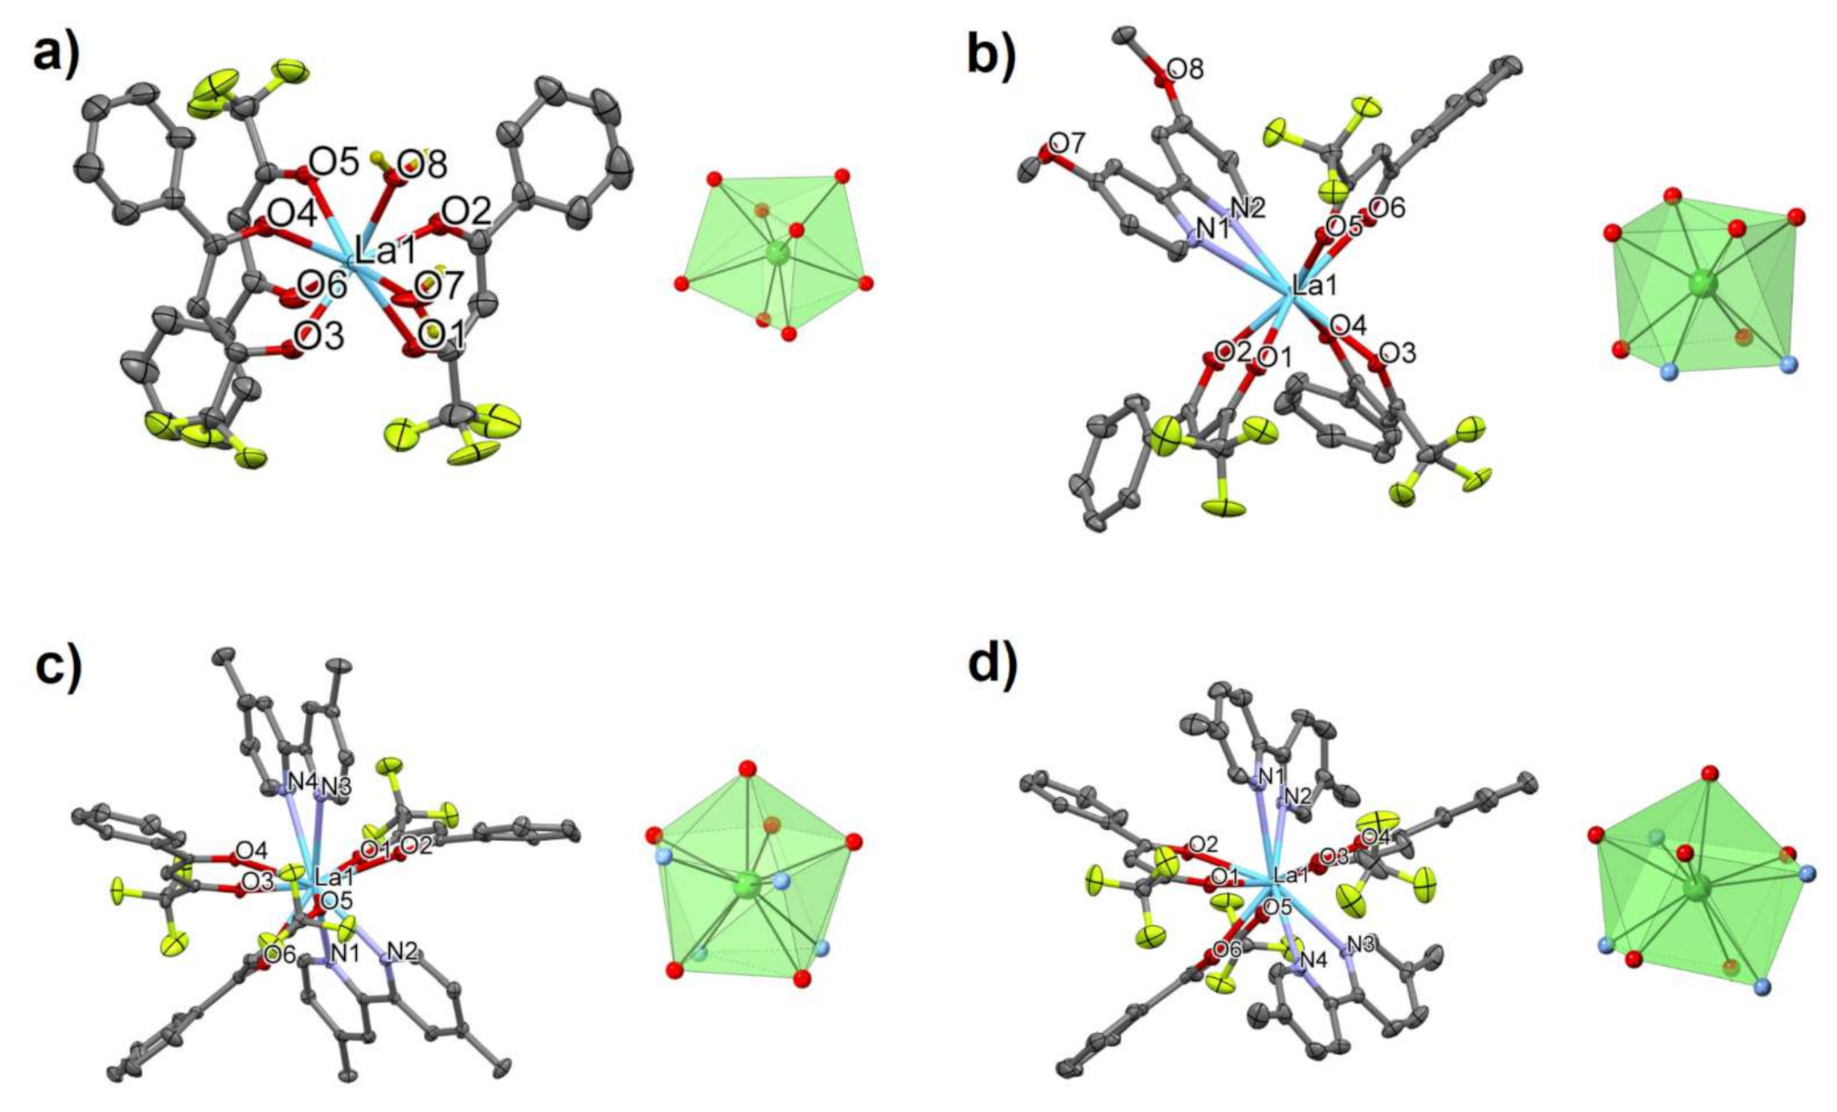
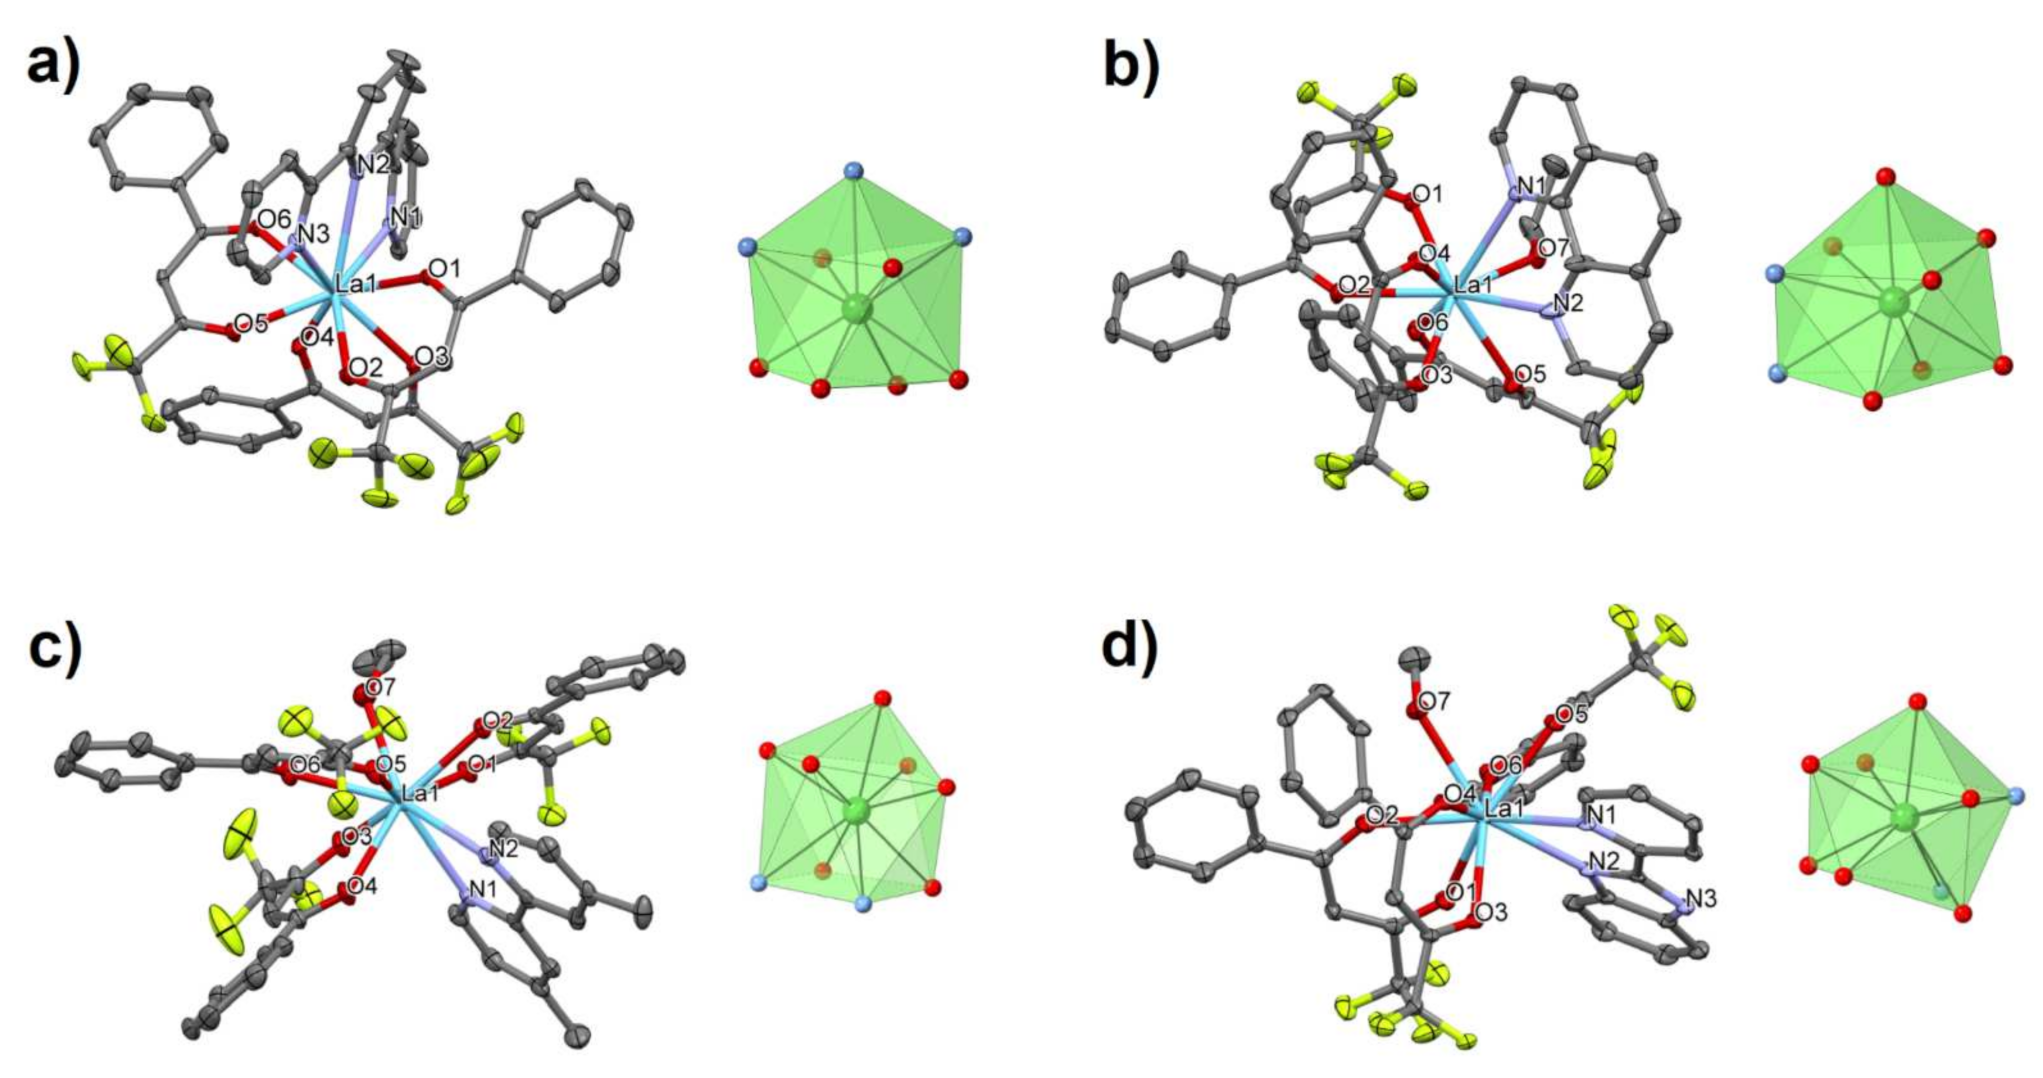
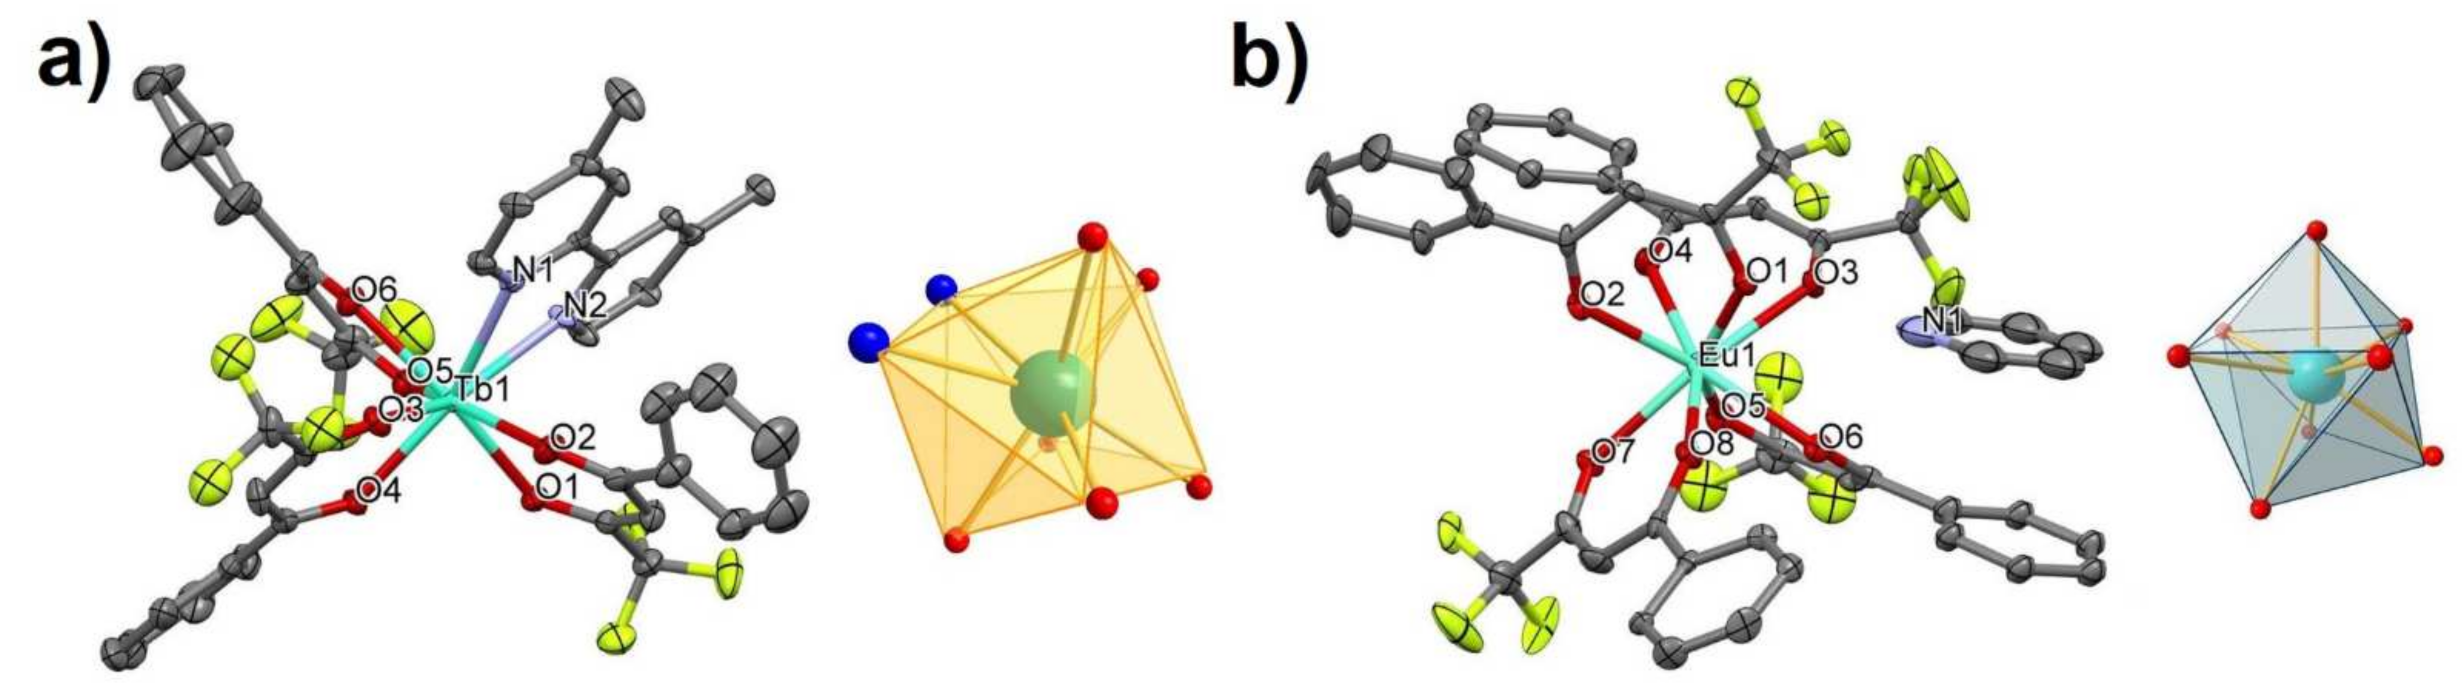
2.2. Description of the Crystal Structures 110

Partially labelled molecular plots and coordination figures of the title complexes 110 are presented in Figure 1, Figure 2 and Figure 3 and main bond parameters are summarized in Table S1, respectively. Each La(III) center of the neutral and monomeric complexes 1–8 are ligated by six oxygen donor atoms of three btfa β-diketonato ligand anions. Coordination number 8 in 1 is achieved by two oxygen atoms of terminal aqua ligands, and in 2 by the two N-donor atoms of the 4,4′-Mt2bipy chelating ligand. Their La-N/O bond lengths vary in the range from 2.407(3) to 2.6690(14) Å. The coordination number ten around La1 in 3 and 4 is completed by 4 nitrogen donor atoms of two chelating 4,4′-Me2bipy and 5,5′-Me2bipy ligands, respectively. Their La-N/O bond distances are in the range from 2.4911(14) to 2.8637(18) Å.
The CN = 9 was found in the La(III) complexes 5, 6, 7 and 8. In 5 the LaN3O6 “chromophore” around the central La1 is achieved by ligation of one tridentate terpy chelating ligand, whereas the LaN2O7 “chromophore” in 6–8 complexes is completed by ligation of two N-donor atoms of one chelating phen molecule and an O atom of terminal EtOH in 6, two N-donor atoms of one chelating 4,4′-Me2bipy molecule and an O atom of terminal EtOH in 7 and by ligation of two N-donor atoms of one 2-benzpy molecule and an O atom of terminal MeOH ligand. The La-N/O bond distances in the nine-coordinated compounds 58 are in the range from 2.4588(17) to 2.7736(18) Å. The O-La1-O bite angles of the β-diketonate groups fall in the range from 65.96(5) to 71.56(9)° in 18, and the N-La1-N bite angles of the chelating ligand molecules in 28 vary from 55.86(5) to 61.40(7)°.
In a similar coordination fashion, the two complexes [Tb(btfa)3(4,4′-Me2bipy)] (9) and (Hpy)[Eu(btfa)4] (10) display CN = 8 around. In 9, the Tb1 is formed by six oxygen atoms of three btfa anions and two N atoms of a 4,4′-Me2bipy chelating ligand. The Tb-N/O bond distances vary from 2.417(3) to 2.547(3) Å, the O-Tb-O angles from 71.33(10) to 72.12(10) Å and the N1-Tb1-N2 bite angle is 63.08(10)°. In 10, the Eu1 in the complex anion [Eu(btfa)4], the eight-coordination is achieved by the oxygen atoms of four β-diketonato anions. The bond lengths in the EuO8 coordination figure vary from 2.346(6) to 2.451(5) Å, with values of 2.381(6), 2.403(5), 2.451(5), 2.346(6), 2.362(6), 2.364(5), 2.388(6) and 2.361(6) Å, for Eu1-O1 to Eu1-O8, respectively. The O-Eu-O bite angles of the btfa ligands range from 70.81(18) to 73.0(2)°. These bond parameters are in the same range observed for other [Eu(btfa)4] complex anions with tetrabutylammonium [Eu-O from 2.340(10) to 2.435(7) Å [32] and 4-dimethylaminopyridinium [Eu-O from 2.356(2) to 2.524(2) Å] [33] as counter cations.
The continuous shape measure theory with the SHAPE software [34,35] was used to analyze the degree of distortion of the coordination polyhedra in 110 from their ideal polyhedron geometry. For title compounds with CN = 8 with respect to ideal eight-vertex polyhedra intermediate distortion between various coordination polyhedra is observed. For LaO8 of 1 the lowest shape measures (CShM’s) values correspond to triangular dodecahedron (TDD-8), Square antiprism (SAPR-8) and Biaugmented trigonal prism (BTPR-8) with values of 0.380, 2.933 and 3.009. For TbN2O6 of 9 the corresponding values are 0.589, 1.993 and 2.372, respectively and 0.360, 1.992 and 2.394 in EuO8 of 10, whereas in case of LaN2O6 of 2 the values are 2.179, 1.263 and 2.391, i.e., the lowest value observed for square antiprism (SAPR-8).
For LaO6N4 polyhedra of 3 and 4 with respect to ideal ten-vertex polyhedra intermediate distortion is observed with lowest CShM’s for Sphenocorona J87 (JSPC-10) with values of 1.587 and 1.697, respectively. The next lowest continuous shape measures correspond to Bicapped square antiprism J17 (JBSAPR-10) and Tetradecahedron (2:6:2) (TD-10).
For title compounds 5–8 with CN = 9 with respect to ideal nine-vertex polyhedra intermediate distortion between various coordination polyhedra is observed. For LaN3O6 of 5 and LaN2O7 of 6 the lowest CShM’s values correspond to spherical capped square antiprism (CSAPR-9), tricapped trigonal prism (TCTPR-9), Muffin (MFF-9), and gyroelongated square pyramid (J10) with values of 0.795, 0.840, 1.374 and 1.495, respectively for the former complex, and 0.554, 1.083, 1.497 and 1.884 in 6. For LaN2O7 of 7 the lowest CShM’s values correspond to Muffin (MFF-9), spherical capped square antiprism (CSAPR-9) and capped square antiprism (J10) with values of 0.785, 0.979 and 1.828. For LaN2O7 of 8 the lowest CShM’s values correspond to spherical capped square antiprism (CSAPR-9), tricapped trigonal prism (TCTPR-9) and Muffin (MFF-9) with values of 1.192, 1.244 and 1.455, respectively.
Packing plots of 110 are presented as Figures S11–S20 in the Supplementary Materials section. The O-H groups of the aqua and alcohol ligands in 1, 6–8 form hydrogen bonds of type O-H···O and O-H···F; the N-H group of 2-benzpy molecule in 8 forms a hydrogen bond of type N-H···O (Table 1). The aromatic ring systems in these complexes are involved in numerous π···π ring···ring and C-H/F··ring interactions, which further stabilize the packing of the mononuclear complexes (Tables S2–S11).

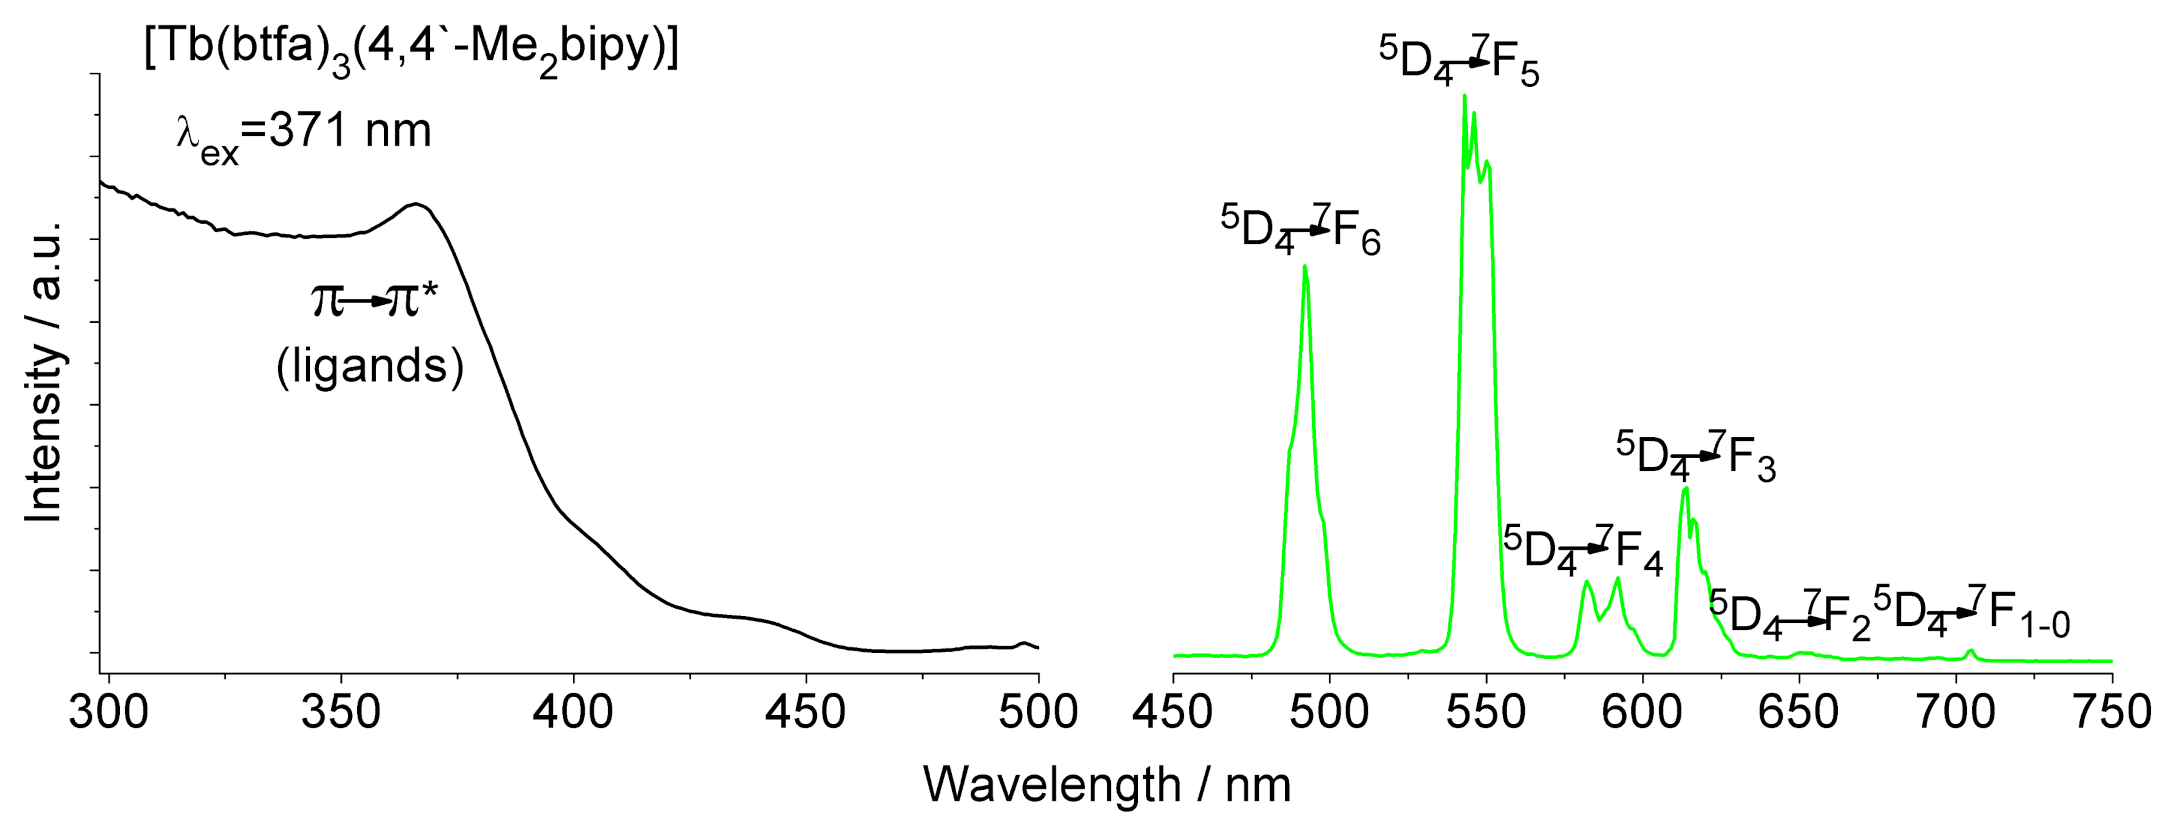
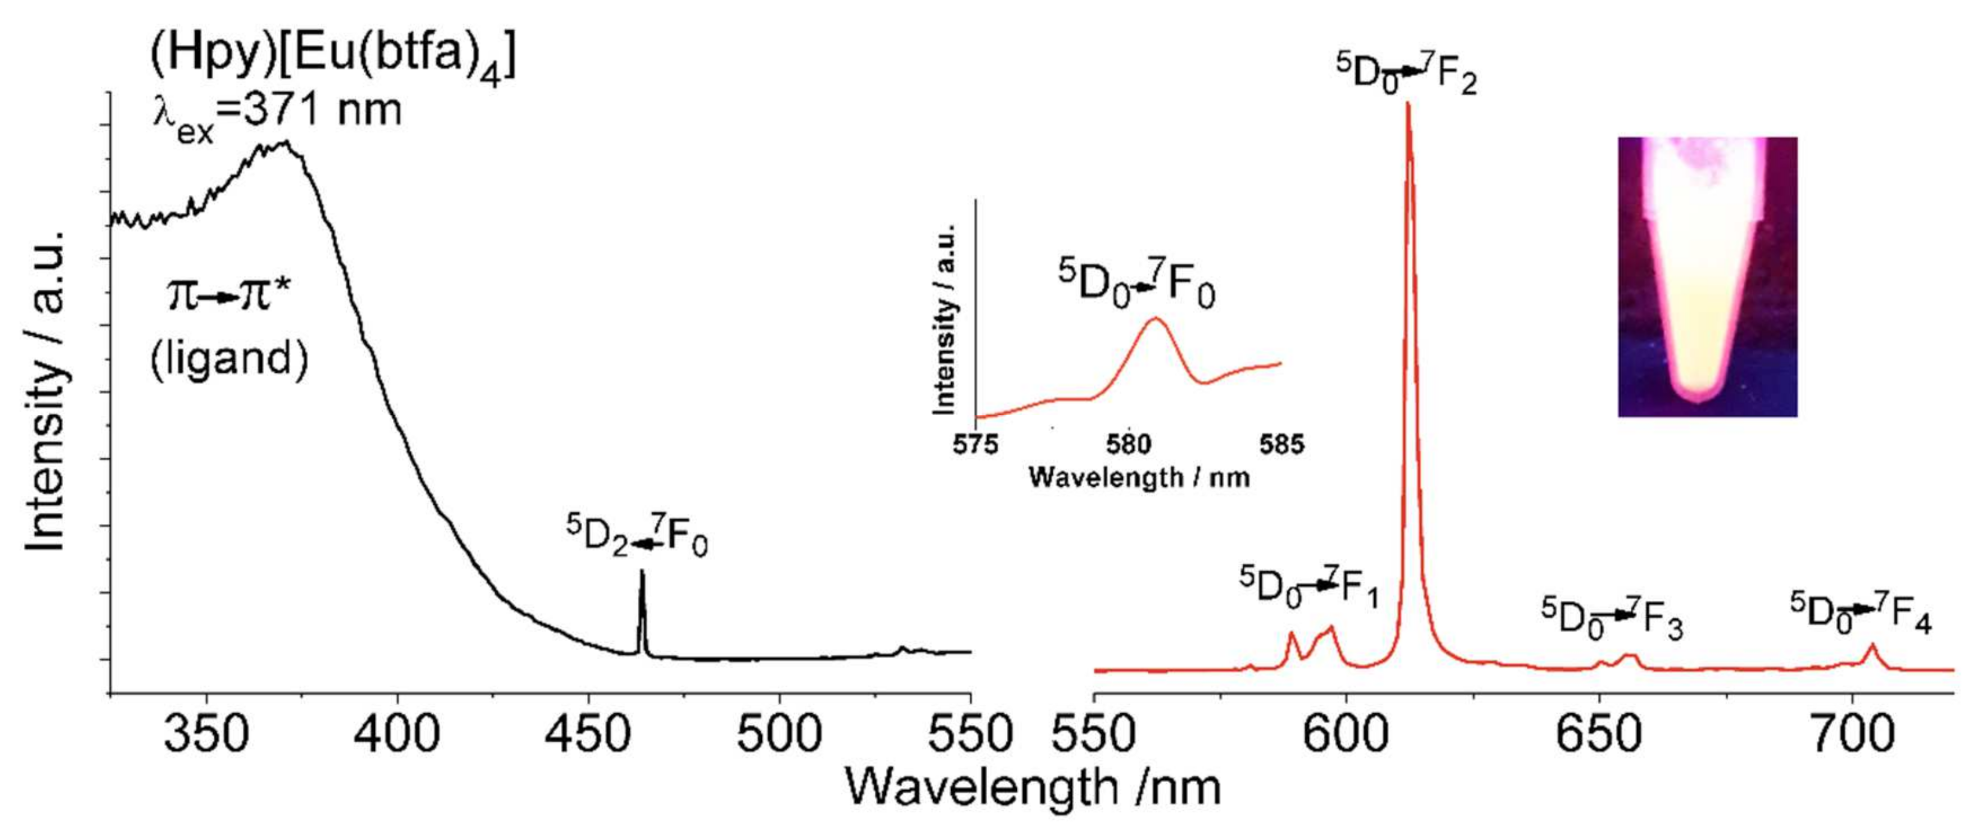
2.3. Luminescence Emission of Terbium (9) and Europium (10) Complexes

The photoluminescence of 9 and 10 was measured in the solid state at room temperature. For Compound 9 (Figure 4) the spectrum shows an intense and broad band with two peak maxima at 300 and 371 nm corresponding to the π→π* transitions of 4,4′-Me2bipy and btfa ligands, respectively [36]. The excitation wavelength for the emission spectrum (λem) is 371 nm. The first emission peak at 492 nm could be attributed to 5D47F6 transition, whereas the most intense band located at 543 nm is attributed to 5D47F5 transition. These were followed by another three peaks at 593, 614 and 650 nm, which could be assigned to 5D47F4, 5D47F3 and 5D47F2 transitions, respectively. Moreover, the very weak bands observed around 700 nm can be assigned to the 5D47F1 and 5D47F0 transitions [37,38,39].
For compound 10 (Figure 5), the excitation spectrum monitored at 613 nm (5D07F2) reveals an intense broad band at 371 nm due to the π→π* transition from the coordinated btfa ligands to the Eu(III) ion. In addition, the narrow, which was observed at 464 nm is assigned to 7F05D2 f-f transition from the central europium ion [40]. Emission spectrum of 10 (Figure 5) recorded at excitation wavelength λex = 371 nm exhibits the characteristic bands that arise from Eu(III) f-f transitions. At 580 nm (Figure 5, inset left), 5D07F0 transition appeared as the weakest intense peak. Furthermore, the pure magnetic dipole transition 5D07F1 at 591 nm, in which its intensity is practically independent of the Eu3+ environment, is divided into two components due to crystal field splitting of the 7F1 level [41]. the emission spectra of 10 is revealing four main bands at 591 (5D07F1), 613 (5D07F2), 656 (5D07F3) and 704 (5D07F4) [31,40,42]. The emission peak centered at 613 nm, which is the strongest peak and corresponds to the hypersensitive band 5D07F2 is the one responsible for the observed emission color of the sensitized europium compound. The intensity ratio between 5D07F2 and 5D07F1 is 5.45 is indicating that the emission color is shifted to the orange range and the Eu(III) ion is not placed in a position with inversion symmetry according to the coordination geometry obtained from the SHAPE measurement (TDD8-D2d) [43]. In addition, the emission spectrum was recorded at λex = 464 nm (5D27F0) (Figure S21). The luminescence spectrum showed the same characteristic bands from the europium ion when excited at the longer wavelength with a measured luminescence Quantum Yield (QY) in the solid state of 14.82% proposing the possible use of the compound for biomedical applications.
Emission time decay (τobs) monitored at 546 and 613 nm for 9 and 10, respectively have been measured in solid state. For both compounds the experimental data fits mono-exponentially indicating a single coordination sphere around the lanthanide ion (Figure 6). In order to characterize the sensitization efficiency of the btfa ligand to the excited state of the lanthanide ions, the Overall Quantum Yield (ϕTOT) have been measured at the excitation wavelength of 371 nm for both compounds yielding 1.04% for 9 and up to 34.56% for 10 (Table 2).
The measured QY at 371 nm of the Terbium compound (9) is relatively low, indicating a poor efficiency of the sensitization effect due to a potential overlap between the ligand triplet state and the terbium 5D4 emission resonance level that leads to back energy transfer [44,45,46]. On the other hand, the sensitization efficiency of the btfa ligand to Eu3+ transfer (ηsens) for 10 is 78.2% ηsens. This reflects the efficiency in which the energy is transferred from the excited states of the ligand to the excited states of the lanthanide metal and is defined as ηsens = ϕTOTLn. The calculated Eu3+ intrinsic quantum yield (ϕLn) for compound 10 is 44.19%. Since the excitation band corresponding to the 5L67F0 f-f centered excitation transition, around ~395 nm, is not seen in the excitation spectra, ϕLn could not be measured in order to compare it with the calculated one [44]. The ϕLn is calculated by ϕLn = τobsrad, where τrad is the radiative lifetime that is referred to the lifetime of an emissive compound in the absence of non-radiative processes and this value is 2.229 ms for 10. Due to Eu3+ pure magnetic dipole character of the 5D07F1 transition, τrad can be calculated using a simpler equation:
1 τ rad =   A M D , 0 · n 3 I T O T I M D
where ITOT/IMD is the ratio of integrated area of 5D0 emission bands from the corrected emission spectra to the pure magnetic dipole 5D07F1 integrated emission band and A M D , 0 and n are a constant equal to 14.65 s−1 and the refractive index in where the sample is measured (1.517 for solid state), respectively, [40,47]. The obtained results agree with other Eu(III) [31,32,36,48] and Tb(III) [49,50] β-diketonate compounds.

3. Experimental Section

3.1. Materials and Physical Measurements

4,4,4-Trifluoro-1-phenylbutane-1,3-dione, 4,4′-dimethoxy-2,2′-bipyridine 4,4′-dimethyl-2,2′-bipyridine, 5,5′-dimethyl-2,2′-bipyridine, 2,2′:6′,2′-terpyridine, 1,10-phenathroline, 2-(2-pyridyl)benzimidazole, were purchased from TCI Europe N. V. (Zwijndrecht, Belgium). Lanthanum(III) nitrate salts, Ln(NO3)3·6H2O (Ln = La, Tb and Eu) were obtained from Strem Chemicals (Kehl, Germany) and the other chemicals were of analytical grade quality. Infrared spectra of solid complexes were recorded on a Bruker Alpha P (platinum-ATR-cap) spectrometer (Bruker AXS, Madison, WI, USA). Elemental microanalyses were carried out with an Elementar Vario EN3 analyser (Langenselbold, Germany). The X-ray powder patterns (See supplement materials: Figures S1–S10). were measured on a Bruker D8 Advance diffractometer (Bruker AXS, Madison, WI, USA) with a LynxEye detector in Bragg–Brentano θ/θ geometry, with the sample dispersed thinly on a zero-background Si sample holder, λ(CuKα) = 1.54060 Å, scans from 5° to 50° 2θ, stepsize 0.02°.

3.2. Syntheses of the Complexes

[La(btfa)3(H2O)2] (1). To an ethanolic solution (40 mL) containing NaOH (6 mmol, 0.240 g, 6.0 mmol) was added Hbtfa (1.300 g, 6.0 mmol) and La(NO3)3·6H2O (0.866 g, 2.0 mmol). The solution was stirred for 1 h at room temperature. Then, 80 mL of deionized water was added to the reaction mixture and stirred overnight. The colorless precipitate, which was separated was collected by filtration and dried at 80 °C. (yield: 1.28 g, 78%), Anal Calcd for C30H22F9LaO8 (820.38 g/mol): C, 43.9; H, 2.7; N, 0.0. Found: C, 42.8; H, 2.6; N, 0.0%. Selected IR bands (ATR-IR, cm−1): 3658 (m), 3460 (br), 1608 (s), 1574 (s), 1526 (m), 1487 (m), 1465 (m), 1328 (s), 1284 (s), 1244 (m), 1180 (s), 1143 (s), 1072 (m), 944 (m), 778 (m), 695 (m), 630 (m), 580 (m).
[La(btfa)3(4,4′-Mt2bipy)] (2). The complex [La(btfa)3(H2O)2] (90 mg, 0.110 mmol) and 4,4′-dimethoxy-2,2′-bipyridine (28 mg, 0.129 mmol) were dissolved in ethanol (20 mL) and the solution was stirred for ~2 h, at room temperature. The reaction mixture was then filtered and allowed to crystallize at room temperature. After ten days, the light pink single crystals, which separated were collected by filtration and dried in air (yield: 81 mg, 73.7%). Anal. Calcd for C42H30F9LaN2O8 (1000.59 g/mol): C, 50.4; H, 3.0; N, 2.8. Found: C, 50.5 H, 3.1; N, 2.7%. Selected IR-bands (ATR-IR, cm−1): 1604 (s), 1562 (s), 1529 (m), 1487 (m), 1459 (m), 1314 (m), 1281 (s), 1245 (m), 1179 (m), 1138 (s), 1074 (m), 1038 (w), 1023 (m), 940 (w), 831 (m), 772 (s), 699 (s), 628 (m), 577 (s), 508 (m).
[La(btfa)3(4,4′-Me2bipy)2] (3). The diaqua complex 1 (103 mg, 0.126 mmol) and 4,4′-dimethyl-2,2′-bipyridine (42 mg, 0.227 mmol) were dissolved in ethanol (20 mL) and the solution was stirred for ~3 h, then filtered and allowed to crystallize at room temperature. After twenty days, the small colourless single crystals of [La(btfa)3(4,4′-Me2bipy)2], which separated were collected by filtration and dried in air (yield: 103 mg, 71.1%). Anal. Calcd for C54H42F9LaN4O6 (1152.82 g/mol): C, 56.3; H, 3.7; N, 4.9. Found: C, 56.5 H, 3.5; N, 4.7%. Selected IR-bands (ATR-IR, cm−1): 1611 (s), 1578 (m), 1531 (m), 1514 (w), 1486 (m), 1473 (m), 1441 (w), 1308 (m), 1280 (s), 1237 (m), 1179 (s), 1124 (s), 1074 (m), 1026 (w), 941 (w), 915 (w), 821 (s), 758 (s), 700 (s), 576 (s), 514 (m).
[La(btfa)3(5,5′-Me2-bipy)2] (4). The diaqua complex 1 (115 mg, 0.140 mmol) and 5,5′-dimethyl-2,2′-bipyridine (60 mg, 0.324 mmol) were dissolved in 40 mL ethanol/acetone (4:1) and the solution was stirred for ~2 h, then filtered and allowed to crystallize at room temperature. After seven days, the well grown colorless single crystals, which separated were by filtration and dried in air (yield: 139 mg, 86.0%). Anal. Calcd for C54H42F9LaN4O6 (1152.82 g/mol): C, 56.3; H, 3.7; N, 4.9. Found: C, 56.4 H, 3.5; N, 4.8%. Selected IR-bands (ATR-IR, cm−1): 1614 (s), 1593 (m), 1569 (m), 1522 (w), 1506 (w), 1384 (m), 1284 (s), 1240 (m), 1195 (m), 1179 (m), 1122 (s), 1067 (w), 1038 (w), 956 (w), 922 (w), 863 (w), 786 (s), 680 (s), 646 (w), 563 (m), 471 (w).
[La(btfa)3(terpy)] (5). The complex [La(btfa)3(H2O)2] (106 mg, 0.129 mmol) and 2,2′:6′,2”-terpyridine (32 mg, 0.137 mmol) were dissolved in 30 mL ethanol/acetone (3:1) and the solution was stirred for ~3 h, then filtered and allowed to crystallize at room temperature. After ten days, the isolated well shaped colorless single crystals were collected by filtration and dried in air (yield: 68 mg, 51.5%). Anal. Calcd for C45H29F9LaN3O6 (1017.62 g/mol): C, 53.1; H, 2.9; N, 4.1. Found: C, 52.9 H, 3.0; N, 4.2%. Selected IR-bands (ATR-IR, cm−1): 1612 (s), 1597 (m), 1574 (s), 1531 (m), 1519 (m), 1471 (s), 1316 (m), 1281 (s), 1239 (m), 1174 (m), 1144 (m), 1126 (s), 1071 (m), 1023 (w), 809 (w), 793 (w), 761 (s), 695 (s), 650 (w), 576 (s), 501 (w).
[La(btfa)3(phen)(EtOH)] (6). This complex was isolated as colorless single crystals using 1,10-phenanthroline (1:1 molar ratio) instead of 4,4′-Me2bipby and a procedure similar to that described for complex 3 (yield: 37.3%). Anal. Calc. for C44H32F9LaN2O7 (1010.62 g/mol): C, 52.3; H, 3.2; N, 2.8. Found: C, 52.2 H, 3.1; N, 2.9%. Selected IR-bands (ATR-IR, cm−1): 1609 (s), 1573 (s), 1519 (m), 1487 (m), 1468 (s), 1371 (w), 1317 (m), 1285 (s), 1243 (m), 1178 (m), 1131 (s), 1074 (m), 1025 (w), 941 (m), 843 (w), 762 (s), 700 (s), 578 (s), 510 (w).
[La(btfa)3(4,4′-Me2bipy)(EtOH)] (7). A procedure similar to that described for complex 3 was used but equimolar amounts of 4,4′-dimethyl-2,2′-bipyridine (23 mg, 0.124 mmol) and [La(btfa)3(H2O)2] were used. The complex [La(btfa)3(4,4′-Me2bipy)(EtOH)] was obtained as colorless single crystals after twelve days (yield: 73 mg, 62.9%). Anal. Calc. for C44H36F9LaN2O7 (1014.66 g/mol): C, 52.1; H, 3.6; N, 2.8. Found: C, 52.3 H, 3.4; N, 2.9%. Selected IR-bands (ATR-IR, cm−1): 1611 (s), 1579 (w), 1534 (w), 1487 (w), 1451 (s), 1317 (m), 1291 (s), 1236 (m), 1183 (m), 1136 (m), 1074 (m), 1033 (m), 1007 (m), 920 (w), 833 (s), 761 (s), 697 (m), 629 (m), 576 (m), 514 (w).
[La(btfa)3(2-benzpy)(MeOH)] (8). A mixture containing La(NO3)3·6H2O (37 mg, 0.085 mmol), NaOH (11 mg, 0.275 mmol), 2-(2-pyridyl)benzimidazole (16 mg, 0.082 mmol) and 4,4,4-trifluoro-1-(2-phenyl)-1,3-butanedion (57 mg, 0.26 mmol) dissolved in methanol and (40 mL) was stirred for ~3 h and the resulting solution was then filtered and allowed to crystallize at room temperature. After fifteen days, the separated colorless crystals of complex 8 were collected by filtration and dried in air (yield: 44 mg, 51.3%). Anal. Calc. for C43H31F9LaN3O7 (1011.62 g/mol): C, 51.0; H, 3.1; N, 4.2. Found: C, 50.9 H, 3.3; N, 4.1%. Selected IR-bands (ATR-IR, cm−1): 1611 (s), 1575 (s), 1525 (w), 1457 (m), 1433 (s), 1316 (m), 1283 (s), 1240 (m), 1183 (s), 1132 (s), 1074 (m), 1054 (m), 1026 (w), 940 (w), 833 (w), 743 (s), 699 (m), 577 (m), 504 (w).
[Tb(btfa)3(4,4-Me2bipy)] (9). A mixture containing Tb(NO3)3·6H2O (112 mg, 0.25 mmol), 4,4′-dimethyl-2,2′-bipyridine (18.4 mg, 0.1 mmol) and triethylamine (0.014 mL, 0.1 mmol) dissolved in ethanol (10 mL) was added to another ethanolic solution (10 mL) of 4,4,4-trifluoro-1-phenyl-1,3-butanedione (Hbtfa) (64.8 mg, 0.30 mmol). The mixture solution was stirred for 30 min, then filtered and allowed to stand at ambient temperature. The yellow crystals, suitable for X-ray analysis, which obtained after two weeks were collected by filtration and dried in air. (yield: 74 mg, 30% based on Tb(NO3)3·6H2O). Anal. Calc. for C42H30F9N2O6Tb (988.60 g/mol): C, 51.0; H, 3.1; N, 2.8. Found: C, 50.9; H, 3.0; N, 2.9%. Selected IR bands (cm−1): 3064 (w), 1612 (s), 1565 (s), 1489 (s), 1474 (s), 1386 (m), 1320 (s), 1293 (s), 1244 (m), 1181 (s), 1133 (s), 1076 (m), 937 (m), 830 (m), 766 (m), 701 (m), 632 (m), 580 (m), 515 (m).
(Hpy)[Eu(btfa)4] (10). An ethanolic solution (10 mL) of Eu(NO3)3·6H2O (112 mg, 0.25 mmol) was added to another ethanolic solution (10 mL) containing 4,4,4-trifluoro-1-phenyl-1,3-butanedione (Hbtfa) (318.5 mg, 1.25 mmol) and pyridine (py) (118.6 mg, 1.5 mmol). The resulting mixture was stirred for 30 min, then filtered and allowed to stand at ambient temperature. The yellow crystals, which obtained after two weeks were collected by filtration and dried in air (yield: 169 mg, 62% based on Eu(NO3)3·6H2O). Anal. Calcd for C45H30EuF12NO8 (1092.66 g/mol): C, 49.5; H, 2.8; N, 1.3. Found: C, 49.3; H, 2.7; N, 1.4%. Selected IR bands (cm−1): 3247 (w), 3175 (w), 3069 (m), 1614 (s), 1579 (s), 1538 (s), 1486 (s), 1378 (w), 1319 (s), 1292 (s), 1247 (s), 1180 (s), 1125 (s), 1075 (s), 1024 (m), 1001 (m), 942 (m), 808 (w), 795 (m), 767 (s), 717 (s), 679 (s), 631 (s), 600 (w), 578 (s), 513 (w), 458 (w), 426 (w).

3.3. Single Crystal X-ray Diffraction Analysis

Single-crystal data of 18 complexes were measured on an APEX II CCD diffractometer (Bruker-AXS; Madison, WI, USA) and those of 9 and 10 on a D8 Venture (Bruker-AXS, Madison, WI, USA). Table S12 summarizes crystallographic data, intensity data collection, and structure refinement specifications. Data collections were performed at 100(2) K with Mo–Kα radiation (λ = 0.71073 Å); computer programs APEX and SADABS [51,52] were used for data reduction, LP, and absorption corrections. The program library SHELX [53,54] was used for solution (direct methods) and refinement (full-matrix least-squares methods on F2). Anisotropic displacement parameters were applied to all non-hydrogen atoms. H atoms (Uiso) were obtained from difference Fourier maps. Additional software: Mercury [55] and PLATON [56]. CCDC deposition numbers: CCDC 2099334–CCDC 2,099,343 for 1–10, respectively.

3.4. Luminescence Measurements

Solid state fluorescence spectra of compounds 9 and 10 were recorded on a Horiba Jobin Yvon SPEX Nanolog fluorescence spectrophotometer (Fluorolog-3 v3.2, HORIBA Jovin Yvon, Cedex, France) equipped with a three slit double grating excitation and emission monochromator with dispersions of 2.1 nm/mm (1200 grooves/mm) at room temperature. The steady-state luminescence was excited by unpolarized light from a 450 W xenon CW lamp and detected at an angle of 22.5° for solid state measurement by a red-sensitive Hamamatsu R928 photomultiplier tube. The instrument was adjusted to obtain the highest Background-to-noise ratio. Spectra were corrected for both the excitation source light intensity variation (lamp and grating) and the emission spectral response (detector and grating).
The excited state decay curves were measured in the same instrument in the phosphorescence mode using a 450 W xenon pulsed lamp (λ = 371 nm, 1.5 ns pulse). The measured decays were analyzed using the Origin software package. Both decay curves fitted monoexponentially: I t = I 0   exp t τ obs . The fit quality was determined by the χ2 method of Pearson. Absolute Quantum Yield measurements were acquired in the G8 Quantum Integrating Sphere from GMP with an interior reflective coating made of Spectralon® (Zürich, Switzerland). Then, the ΦTOT was calculated following Equation (2):
Φ = E c E c b l a n k L a L c
where L a is the calculated area of the outgoing amount of light without interaction with a sample (blank) at the used λexc and L c after interaction with the sample. Ec referees to the calculated area from the emission spectrum of the sample and Ec (blank) from the emission spectrum of the Blank.

4. Conclusions

The interaction of Ln(NO3)3·6H2O (Ln = La(III) or Tb(III)) with 4,4,4-trifuoro-1-phenylbutane-1,3-dione (Hfta) in ethanol, methanol and/or mixed ROH-acetone and Et3N or NaOH in the stochiometric ratio 1:3:3 afforded the neutral mononuclear tris(β-ketonato) compounds, where in the presence di-nitrogen donor or terpy ligands allow the central Ln(III) ions display a variety of CN (8–10) and geometries: [La(btfa)3(4,4′-Mt2bipy)] (2), [La(btfa)3(4,4′-Me2bipy)2] (3), [La(btfa)3(5,5′-Me2bipy)2] (4), [La(btfa)3(terpy)] (5), [La(btfa)3(phen)(EtOH)] (6), [La(btfa)3(4,4′-Me2bipy)(EtOH)] (7), [La(btfa)3(2-benzpy)(MeOH)] (8) and [Tb(btfa)3(4,4′-Me2bipy)] (9). When excess Hfta is used, the tetrakis(β-ketonato) anionic complex (Hpy)[Eu(btfa)4] (10) was isolated. This trend in reactions of Ln(III) salts and β-diketonate derivatives seems to be universal, where many compounds and pyridyl adducts of similar structural formulas have been isolated and structurally characterized [24,25,26,31,57,58,59,60,61].
Studying the luminescence of the tris(β-ketonato) Tb (9) and tetrakis(β-ketonato) Eu (10) complexes revealed efficient energy transfer in the visible region from the ligands to the central Ln(III) ion. Similar luminescent emission trend was observed in the UV and visible regions in other related β-ketonate derivatives [24,25,26,57,58,59,60,61]. However, it should be mentioned that incorporating strong chelating polypyridyl ligands into the Ln(III)-tris(β-ketonato) significantly enhances the emission luminescent properties of the compounds in the visible and NIR regions [25,62]. Recently, it has been demonstrated that incorporation of β-diketonate into calix [4] arene ligand skeletons enhances their corresponding lanthanide-centered luminescence and magnetic relaxivity properties [63,64], which make them suitable candidates, especially Gd(III), in magnetic resonance imaging (MRI) and in developing nanomaterials for sensing and bioimaging [64].

Supplementary Materials

The following are available online at https://0-www-mdpi-com.brum.beds.ac.uk/article/10.3390/inorganics9100074/s1, Figures S1–S10: PXRD data of compounds 110, Figures S11–S20: crystal packing of compounds 110, Table S1: crystallographic data for coordination compounds 110, Tables S2–S11: Non-coordinative interactions in 110, Table S12: Crystallographic data and processing parameters of 110, Figure S21: Emission spectrum of 10 measured at the 464 nm excitation wavelength, and CCDC deposition numbers: CCDC 2099334–CCDC 2099343 for 110, respectively. These data can be obtained free of charge from The Cambridge Crystallographic Data Centre via www.ccdc.cam.ac.uk/data_request/cif.

Author Contributions

Conceptualization, F.A.M., R.V., M.F.-B. and S.S.M.; methodology, F.A.M., R.V., M.F.-B. and S.S.M.; software, F.A.M., R.C.F., M.F.-B. and R.V.; validation, F.A.M., R.V., R.C.F. and S.S.M.; formal analysis, F.B.; investigation, F.B., R.C.F., M.F.-B., À.T., S.S. and R.C.F.; resources, F.A.M., R.V. and R.C.F.; data curation, F.A.M., F.B., R.C.F., R.V., M.F.-B., S.S. and S.S.M.; writing original draft preparation, F.A.M., F.B., R.C.F., R.V., A.T., M.F.-B., S.S. and S.S.M.; writing review and editing, F.A.M., A.T., R.V. and S.S.M.; visualization, F.A.M., A.T. and R.V., M.F.-B., S.S.; supervision, F.A.M., R.V. and S.S.M.; project administration, F.A.M., R.V. and S.S.M.; funding acquisition, R.V. All authors have read and agreed to the published version of the manuscript.

Funding

Ministerio de Ciencia, Innovación y Universidades (Spain), Project PGC2018-094031-B-100.

Acknowledgments

R.V., Á.T. and S.S. acknowledge the financial support from Ministerio de Ciencia, Innovación y Universidades (Spain), Project PGC2018-094031-B-100.

Conflicts of Interest

The authors declare no conflict of interest.

References

  1. Bünzli, J.-C.G. Lanthanide Photonics: Shaping the Nanoworld. Trends Chem. 2019, 1, 751–762. [Google Scholar] [CrossRef]
  2. Bünzli, J.-C.G.; McGill, I. Rare Earth Elements, in Ullmann’s Encyclopedia of Industrial Chemistry; Wiley: Hoboken, NJ, USA, 2018; pp. 1–53. [Google Scholar]
  3. Bünzli, J.-C.G. Lanthanides, Kirk-Othmer Encyclopedia of Chemical Technology; Wiley Online Library: New York, NY, USA, 2013; pp. 1–43. [Google Scholar]
  4. Cotton, S. Lanthanide and Actinide Chemistry; John Wiley & Sons Ltd.: Chichester, UK, 2006. [Google Scholar]
  5. Mattocks, J.A.; Ho, J.V.; Cotruvo, J.A., Jr. A selective, protein-based fluorescent sensor with picomolar affinity for rare earth elements. J. Am. Chem. Soc. 2019, 141, 2857–2861. [Google Scholar] [CrossRef]
  6. Martinez-Gomez, N.C.; Vu, H.N.; Skovran, E. Lanthanide chemistry: From coordination in chemical complexes shaping our technology to coordination in enzymes shaping bacterial metabolism. Inorg. Chem. 2016, 55, 10083–10089. [Google Scholar] [CrossRef] [PubMed]
  7. Harrowfield, J.M.; Silber, H.B.; Paquette, S.J. Metal Ions in Biological Systems; Sigel, A., Sigel, H., Eds.; Marcel Dekker: New York, NY, USA, 2003. [Google Scholar]
  8. Écija, D.; Urgel, J.I.; Seitsonen, A.P.; Auwärter, W.; Barth, J.V. Lanthanide-directed assembly of interfacial coordination architectures-from complex networks to functional nanosystems. Acc. Chem. Res. 2018, 51, 365–375. [Google Scholar] [CrossRef] [PubMed]
  9. Xie, S.-F.; Huang, L.-Q.; Zhong, L.; Lai, B.-L.; Yang, M.; Chen, W.-B.; Zhang, Y.-Q.; Dong, W. Structures, single-molecule magnets, and fluorescent properties of four dinuclear lanthanide complexes based on 4-azotriazolyl-3-hydroxy-2-naphthoic acid. Inorg. Chem. 2019, 58, 5914–5921. [Google Scholar] [CrossRef] [PubMed]
  10. Greenspon, A.S.; Marceaux, B.L.; Hu, E.L. Robust lanthanide emitters in polyelectrolyte thin films for photonic applications. Nanotechnology 2018, 29, 075302. [Google Scholar] [CrossRef] [Green Version]
  11. Yao, Y.; Yin, H.-Y.; Ning, Y.; Wang, J.; Meng, Y.-S.; Huang, X.; Zhang, W.; Kang, L.; Zhang, J.-L. Strong fluorescent lanthanide salen complexes: Photophysical properties, excited-state dynamics, and bioimaging. Inorg. Chem. 2019, 58, 1806–1814. [Google Scholar] [CrossRef]
  12. Cui, Y.; Yue, Y.; Qian, G.; Chen, B. Luminescent functional metal-organic frameworks. Chem. Rev. 2012, 112, 1126–1162. [Google Scholar] [CrossRef]
  13. Staszak, K.; Wieszczycka, K.; Marturano, V.; Tylkowski, B. Lanthanides complexes—Chiral sensing of biomolecules. Coord. Chem. Rev. 2019, 397, 76–90. [Google Scholar] [CrossRef]
  14. Brayshaw, L.L.; Smith, R.C.G.; Badaoui, M.; James, A.; Irving, J.A.; Price, S.R. Lanthanides compete with calcium for binding to cadherins and inhibit cadherin-mediated cell adhesion. Metallomics 2019, 11, 914–924. [Google Scholar] [CrossRef] [Green Version]
  15. Allen, K.N.; Imperiali, B. Lanthanide-tagged proteins—an illuminating partnership. Curr. Opin. Chem. Biol. 2010, 14, 247–254. [Google Scholar] [CrossRef]
  16. Pałasz, A.; Segovia, Y.; Skowronek, R.; Worthington, J.J. Molecular neurochemistry of the lanthanides. Synapse 2019, 73, e22119. [Google Scholar] [CrossRef] [PubMed]
  17. Jastrza, R.; Nowak, M.; Skroban´ska, M.; Tolin´ska, A.; Zabiszak, M.; Gabryel, M.; Marciniak, Ł.; Kaczmarek, M.T. DNA as a target for lanthanide(III) complexes influence. Coord. Chem. Rev. 2019, 382, 145–159. [Google Scholar] [CrossRef]
  18. Campello, M.P.C.; Palma, E.; Correia, I.; Paulo, P.M.R.; Matos, A.; Rino, J.; Coimbra, J.; Pessoa, J.C.; Gambino, D.; Paulo, A.; et al. Lanthanide complexes with phenanthroline-based ligands: Insights into cell death mechanisms obtained by microscopy techniques. Dalton Trans. 2019, 48, 4611–4624. [Google Scholar] [CrossRef] [PubMed]
  19. Palizban, A.A.; Sadeghi-aliabadi, H.; Abdollahpour, F. Effect of cerium lanthanide on Hela and MCF-7 cancer cell growth in the presence of transferring. Res Pharm Sci. 2010, 5, 119–125. [Google Scholar] [PubMed]
  20. Qin, Q.P.; Wang, Z.F.; Tan, M.X.; Huang, X.L.; Zou, H.H.; Zou, B.Q.; Shi, B.B.; Zhang, S.H. Complexes of lanthanides(iii) with mixed 2,2′-bipyridyl and 5,7-dibromo-8-quinolinoline chelating ligands as a new class of promising anti-cancer agents. Metallomics 2019, 11, 1005–1015. [Google Scholar] [CrossRef]
  21. Chang, Y.-X.; Gao, N.; Wang, M.-Y.; Wang, W.-T.; Fan, Z.-W.; Ren, D.-D.; Wu, Z.-L.; Wang, W.-M. Two phenoxo-O bridged dinuclear Dy(III) complexes exhibiting distinct slow magnetic relaxation induced by different b-diketonate ligands. Inorg. Chim. Acta 2020, 505, 119499. [Google Scholar] [CrossRef]
  22. Hyre, A.S.; Doerrer, L.H. A structural and spectroscopic overview of molecular lanthanide complexes with fluorinated O-donor ligands. Coord. Chem. Rev. 2020, 404, 213098. [Google Scholar] [CrossRef]
  23. Gao, H.-L.; Wang, N.-N.; Wang, W.-M.; Shen, H.-Y.; Zhou, X.-P.; Chang, Y.-X.; Zhang, R.X.; Cui, J.-Z. Fine-tuning the magnetocaloric effect and SMMs behaviors of coplanar RE4 complexes by β-diketonate coligands. Inorg. Chem. Front. 2017, 4, 860–867. [Google Scholar] [CrossRef]
  24. Vicente, R.; Tubau, À.; Speed, S.; Mautner, F.A.; Bierbaumer, F.; Fischer, R.C.; Massoud, S.S. Slow magnetic relaxation and luminescence properties in neodymium(III)-4,4,4-Trifluoro-1-(2-naphthyl)butane-1,3-dionato complexes incorporating bipyridyl ligands. New J. Chem. 2021, 45, 14713–14723. [Google Scholar] [CrossRef]
  25. Mautner, F.A.; Bierbaumer, F.; Fischer, R.C.; Vicente, R.; Tubau, À.; Ferran, A.; Massoud, S.S. Structural characterization, magnetic and luminescent properties of praseodymium(III)-4,4,4-trifluoro-1-(2-Naphthyl)butane-1,3-dionato(1-) complexes. Crystals 2021, 11, 179. [Google Scholar] [CrossRef]
  26. Mautner, F.A.; Bierbaumer, F.; Gyurkac, M.; Fischer, R.C.; Torvisco, A.; Massoud, S.S.; Vicente, R. Synthesis, and characterization of lanthanum(III) complexes containing 4,4,4-trifluoro-1-(2-naphthalen-yl)-butane-1,3-dionate. Polyhedron 2020, 179, 114384. [Google Scholar] [CrossRef]
  27. Wu, D.-F.; Liu, Z.; Ren, P.; Liu, X.-H.; Wang, N.; Cui, J.-Z.; Gao, H.-L. A new family of dinuclear lanthanide complexes constructed from an 8-hydroxyquinoline Schiff base and β-diketone: Magnetic properties and near-infrared luminescence. Dalton Trans. 2019, 48, 1392–1403. [Google Scholar] [CrossRef]
  28. Gao, H.-L.; Huang, S.-X.; Zhou, X.-P.; Liu, Z.; Cui, J.-Z. Magnetic properties and structure of tetranuclear lanthanide complexes based on 8-hydroxylquinoline Schiff base derivative and β-diketone coligand. Dalton Trans. 2018, 47, 3503–3511. [Google Scholar] [CrossRef]
  29. Gao, H.-L.; Zhou, X.-P.; Bi, Y.-X.; Shen, H.-Y.; Wang, W.-M.; Wang, N.-N.; Chang, Y.-X.; Zhang, R.-X.; Cui, J.-Z. A Dy4 single-molecule magnet and its Gd(iii), Tb(iii), Ho(iii), and Er(iii) analogues encapsulated by an 8-hydroxyquinoline Schiff base derivative and β-diketonate coligand. Dalton Trans. 2017, 46, 4669–4677. [Google Scholar] [CrossRef]
  30. Wang, W.-M.; Zhang, H.-X.; Wang, S.-Y.; Shen, H.-Y.; Gao, H.-L.; Cui, J.-Z.; Zhao, B. Ligand field affected single-molecule magnet behavior of lanthanide(III) dinuclear complexes with an 8-hydroxyquinoline Schiff Base derivative as bridging ligand. Inorg. Chem. 2015, 54, 10610–10622. [Google Scholar] [CrossRef]
  31. Lippy, F.; Marques, L.F.; Santos, H.P.; D’Oliveira, K.A.; Botezine, N.P.; Freitas, M.C.F.; Freire, R.O.; Dutra, J.D.L.; Martins, J.S.; Legnani, C.; et al. New photo/electroluminescent europium(III) b-diketonate complex containing a p,p’ -disubstituted bipyridine ligand: Synthesis, solid state characterization, theoretical and experimental spectroscopic studies. Inorg. Chim. Acta 2017, 458, 28–38. [Google Scholar]
  32. Biju, S.; Freire, R.O.; Eom, Y.K.; Scopelliti, R.; Bünzli, J.-C.; Kim, H.K. A EuIII tetrakis(β-diketonate) dimeric complex: Photophysical properties, structural elucidation by Sparkle/AM1 calculations, and doping into PMMA films and nanowires. Inorg. Chem. 2014, 53, 8407–8417. [Google Scholar] [CrossRef] [PubMed]
  33. Rheingold, A.L.; Sweeting, L. CSD Commun, 2015.
  34. Alvarez, S.; Alemany, P.; Casanova, D.; Cirera, J.; Llunell, M.; Avnir, D. Shape maps and polyhedral interconversion paths in transition metal chemistry. Chem. Soc. Rev. 2005, 249, 1693–1708. [Google Scholar] [CrossRef]
  35. Cirera, J.; Alvarez, S. Stereospinomers of pentacoordinate iron porphyrin complexes: The case of the [Fe(porphyrinato)(CN)] anions. Dalton Trans. 2013, 42, 7002–7008. [Google Scholar] [CrossRef] [PubMed]
  36. Wang, D.; Luo, Z.; Liu, Z.; Wang, D.; Fan, L.; Yin, G. Synthesis and photoluminescent properties of Eu(III) complexes with fluorinated β-diketone and nitrogen heterocyclic ligands. Dye. Pigment. 2016, 132, 398–404. [Google Scholar] [CrossRef]
  37. Song, X.Q.; Cheng, G.Q.; Liu, Y.A. Enhanced Tb(III) luminescence by d10 transition metal coordination. Inorg. Chim. Acta 2016, 450, 386–394. [Google Scholar] [CrossRef]
  38. Zhou, Z.; Zhao, X.; Wang, Y.; Wu, B.; Shen, J.; Li, L.; Li, Q. Eu(III) and Tb(III) complexes with the nonsteroidal anti-inflammatory drug carprofen: Synthesis, crystal structure, and photophysical properties. Inorg. Chem. 2014, 53, 12275–12282. [Google Scholar] [CrossRef] [PubMed]
  39. Li, Q.; Li, T.; Wu, J. Luminescence of europium(III) and terbium(III) complexes incorporated in poly(vinylpyrrolidone) matrix. J. Phys. Chem. B 2001, 105, 12293–12296. [Google Scholar] [CrossRef]
  40. Binnemans, K. Interpretation of europium(III) spectra. Coord. Chem. Rev. 2015, 295, 1–45. [Google Scholar] [CrossRef] [Green Version]
  41. Daumann, L.J.; Tatum, D.S.; Andolina, C.M.; Pacold, J.I.; D’Aléo, A.; Law, G.-L.; Xu, J.; Raymond, K.N. Effects of ligand geometry on the photophysical properties of photoluminescent Eu(III) and Sm(III) 1-hydroxypyridin-2-one complexes in aqueous Solution. Inorg. Chem. 2016, 55, 114–124. [Google Scholar] [CrossRef]
  42. Rajamouli, B.; Sivakumar, V. Eu(III) complexes for LEDs based on carbazole- and fluorene-functionalized phenanthro-imidazole ancillary ligands: Detailed photophysical and theoretical study. ChemistrySelect 2017, 2, 4138–4149. [Google Scholar] [CrossRef]
  43. Bala, M.; Kumar, S.; Taxak, V.B.; Boora, P.; Khatkar, S.P. Optical features of efficient europium(III) complexes with β-diketonato and auxiliary ligands and mechanistic investigation of energy transfer process. J. Fluoresc. 2016, 26, 1813–1823. [Google Scholar] [CrossRef]
  44. Aebischer, A.; Gumy, F.; Bünzli, J.C.G. Intrinsic quantum yields and radiative lifetimes of lanthanide tris(dipicolinates). Phys. Chem. Chem. Phys. 2009, 11, 1346–1353. [Google Scholar] [CrossRef]
  45. De Silva, C.R.; Li, J.; Zheng, Z.; Corrales, L.R. Correlation of calculated excited-state energies and experimental quantum yields of luminescent Tb(III) β-diketonates. J. Phys. Chem. A 2008, 112, 4527–4530. [Google Scholar] [CrossRef]
  46. Sato, S.; Wada, M. Relations between intramolecular energy transfer efficiencies and triplet state energies in rare earth β-diketone chelates. Bull. Chem. Soc. Jpn. 1970, 43, 1955–1962. [Google Scholar] [CrossRef] [Green Version]
  47. Werts, M.H.V.; Jukes, R.T.F.; Verhoeven, J.W. The emission spectrum and the radiative lifetime of Eu3+ in luminescent lanthanide complexes. Phys. Chem. Chem. Phys. 2002, 4, 1542–1548. [Google Scholar] [CrossRef]
  48. Batista, H.J.; de Andrade, A.V.M.; Longo, R.L.; Simas, A.M.; de Sá, G.F.; Nao, K.; Ito, N.K.; Thompson, L.C. Synthesis, X-ray structure, spectroscopic characterization, and theoretical prediction of the structure and electronic spectrum of Eu(btfa)3·bipy and an assessment of the effect of fluorine as a β-diketone substituent on the ligand-metal energy transfer. Inorg. Chem. 1998, 37, 3542–3547. [Google Scholar] [CrossRef] [PubMed]
  49. Luo, Y.; Li, S.; Li, J.; Chen, X.; Tang, R. Synthesis, fluorescence properties of Tb(III) complexes with novel mono-substituted β-diketone ligands. J. Rare Earths 2010, 28, 671–675. [Google Scholar] [CrossRef]
  50. Jiu, H.; Liu, G.; Zhang, Z.; Fu, Y.; Chen, J.; Fan, T.; Zhang, L. Fluorescence enhancement of Tb(III) complex with a new β-diketone ligand by 1,10-phenanthroline. J. Rare Earths 2011, 29, 741–745. [Google Scholar] [CrossRef]
  51. Bruker APEX, SAINT version 8.37A; Bruker AXS Inc.: Madison, WI, USA, 2015.
  52. Sheldrick, G.M. SADABS, version 2; University of Goettingen: Goettingen, Germany, 2001.
  53. Sheldrick, G.M. A Short history of SHELX. Acta Crystallogr. A 2008, 64, 112–122. [Google Scholar] [CrossRef] [Green Version]
  54. Sheldrick, G.M. Crystal structure refinement with SHELXL. Acta Crystallogr. C Struct. Chem. 2015, 71, 3–8. [Google Scholar] [CrossRef]
  55. Macrae, C.F.; Edington, P.R.; McCabe, P.; Pidcock, E.; Shields, G.P.; Taylor, R.; Towler, T.; van de Streek, J.J. Mercury: Visualization and analysis of crystal structures. Appl. Cryst. 2006, 39, 453–457. [Google Scholar] [CrossRef] [Green Version]
  56. Speck, A.L. PLATON, a Multipurpose Crystallographic Tool; Utrecht University: Utrecht, The Netherlands, 2001. [Google Scholar]
  57. Dar, W.A.; Ahmed, Z.; Iftikhar, K. Cool white eligent emission from the yellow and blue emission bands of the Dy(III) compounds under UV-excitation. J. Photochem. Photobiol. A Chem. 2018, 356, 502–511. [Google Scholar] [CrossRef]
  58. Ansari, A.A.; Ganaie, A.B.; Iftikhar, K. Synthesis and 4f-4f absorption studies of tris(acetylacetonato)praseodymium(III) and holmium(III) complexes with imidazole and pyrazole in non-aqueous solvents. Structure elucidation by sparkle/PM7. J. Mol. Struct. 2019, 1198, 126826. [Google Scholar] [CrossRef]
  59. Ansari, A.A.; Ilmi, R.; Iftikhar, K. Hypersensitivity in the 4f–4f absorption spectra of tris(acetylacetonato)neodymium(III) complexes with imidazole and pyrazole in non-aqueous solutions. Effect of environment on hypersensitive transitions. J. Lumin. 2012, 132, 51–60. [Google Scholar] [CrossRef]
  60. Mara, D.; Artizzu, F.; Laforce, B.; Vincze, L.; Van Hecke, K.; Van Deun, R.; Kaczmarek, A.M. Novel tetrakis lanthanide β-diketonate complexes: Structural study, luminescence properties and temperature sensing. J. Lumin. 2019, 213, 343–355. [Google Scholar] [CrossRef]
  61. Yao, X.; An, G.; Li, Y.; Yan, P.; Li, W.; Li, G. Effect of nuclearity and symmetry on the single-molecule magnets behavior of seven-coordinated β-diketonate Dy(III) complexes. J. Solid State Chem. 2019, 274, 295–302. [Google Scholar] [CrossRef]
  62. Bünzli, J.-C.G. On the design of highly luminescent lanthanide complexes. Coord. Chem. Rev. 2015, 293–294, 19–47. [Google Scholar] [CrossRef]
  63. Podyachev, S.N.; Zairov, R.R.; Mustafina, A.R. 1,3-Diketone Calix[4]arene derivatives—A new type of versatile ligands for metal complexes and nanoparticles. Molecules 2021, 26, 1214. [Google Scholar] [CrossRef]
  64. Zairov, R.; Pizzanelli, S.; Dovzhenko, A.P.; Nizameev, I.; Orekhov, A.; Arkharova, N.; Podyachev, S.N.; Sudakova, S.; Mustafina, A.R.; Calucc, L. Paramagnetic relaxation enhancement in hydrophilic colloids based on Gd(III) complexes with tetrathia- and Calix[4]arenes. J. Phys. Chem. C 2020, 124, 4320–4329. [Google Scholar] [CrossRef]
Scheme 1. Structure of 4,4,4-trifluoro-1-phenylbutane-1,3-dione (Hbtfa).
Inorganics 09 00074 sch001
Figure 1. (ad) Perspective view and coordination figure of 1–4, respectively.
Inorganics 09 00074 g001
Figure 2. (ad) Perspective view and coordination figure of 5–8, respectively.
Inorganics 09 00074 g002
Figure 3. (a,b) Perspective view and coordination figure of 9 and 10, respectively.
Inorganics 09 00074 g003
Figure 4. Excitation (left) and emission (right) spectra of compound 9.
Inorganics 09 00074 g004
Figure 5. Excitation (black line) and emission (orange line) spectra of 10. Inset, left, shows an enlarged view of the 5D07F0 transition and right the emission color of the complex under UV light radiation.
Inorganics 09 00074 g005
Figure 6. Excited state decay curves at room temperature for compound 9 and 10 in the microcrystalline sample. Continuous lines represent the mono-exponential fittings of the curves.
Inorganics 09 00074 g006
Table 1. Possible hydrogen bonds in 1, 6–8.
D-H…A *)Symmetry CodeD…A (Å)D-H…A (°)
Compound 1
O7-H7A…O5[−1/2 + x, 3/2 − y, 1 − z]2.871 (3)118
O7-H7B…O8 2.771 (3)102
O8-H8A…O1[1/2 + x, 3/2 − y, 1 − z]2.710 (4)158
O8-H8B…O3[1/2 + x, 3/2 − y, 1 − z]2.732 (4)156
Compound 6
O7-H7A…F5[1 − x, −y, 1 − z]3.027 (3)103
Compound 7
O7-H7A…O6 2.741 (3)103
Compound 8
N3-H3…O3[2 − x, 2 − y, −z]2.856 (3)162
O7-H7…O2 2.657 (3)108
*) D = Donor, A = Acceptor.
Table 2. Characteristic photoluminescent data for compounds 9 and 10.
Compoundλex (nm)τobs (ms)ϕTOT (%)ϕLn (%)ηsens (%)τrad (ms)
[Tb(btfa)3(4,4′-Me2bipy)] (9)3710.1441.05---
Hpy[Eu(Btfa)4] (10)3710.98534.5644.1978.22.229
Publisher’s Note: MDPI stays neutral with regard to jurisdictional claims in published maps and institutional affiliations.

