Article

Europium-Doped Y2O3-Coated Diatomite Nanomaterials: Hydrothermal Synthesis, Characterization, Optical Study with Enhanced Photocatalytic Performance

by
Younes Hanifehpour
1,*,
Mehdi Abdolmaleki
1 and
Sang Woo Joo
2,*
1
Department of Chemistry, Sayyed Jamaleddin Asadabadi University, Asadabad 6541861841, Iran
2
School of Mechanical Engineering, Yeungnam University, Gyeongsan 712-749, Korea
*
Authors to whom correspondence should be addressed.
Submission received: 13 November 2021 / Revised: 10 December 2021 / Accepted: 11 December 2021 / Published: 14 December 2021

Abstract

:
Eu-doped Y2O3 coated diatomite nanostructures with variable Eu3+ contents were synthesized by a facile hydrothermal technique. The products were characterized by means of energy dispersive X-ray photoelectron spectroscopy (EDX), scanning electron microscopy (SEM), powder X-ray diffraction (PXRD), Brunauer–Emmett–Teller (BET), UV-vis diffuse reflectance spectroscopy, and photoluminescence spectroscopy techniques. As claimed by PXRD, the particles were crystallized excellently and attributed to the cubic phase of Y2O3. The influence of substitution of Eu3+ ions into Y2O3 lattice caused a redshift in the absorbance and a decrease in the bandgap of as-prepared coated compounds. The pore volume and BET specific surface area of Eu-doped Y2O3-coated diatomite is greater than uncoated biosilica. The sonophotocata-lytic activities of as-synthesized specimens were evaluated for the degradation of Reactive Blue 19. The effect of various specifications such as ultrasonic power, catalyst amount, and primary dye concentration was explored.

1. Introduction

Advanced oxidation processes (AOPs) have achieved a substantial research interest for decolorization of toxic organic pollutants in different wastewater. The main mechanism of AOPs is the generation of •OH radicals which have greater oxidizing performance and led to attain faster and more effective decomposition of pollutants [1,2,3,4,5,6].
One kind of AOP operation is sonocatalysis that has recently been utilized for degradation of organic contaminants [7,8,9,10,11,12]. The chemical impact of ultrasonic irradiation is raised via the acoustic cavitation and results in collapse growth, and generation of bubbles inside a solution. Through collapsing the bubbles, localized hot spots are created with elevated temperature and pressure. Take into account such sever condition, the dissolved oxygen and water molecules can encounter straight thermal dissociation to produce particularly reactive radical species such as oxygen (•O), •OH, and hydrogen (•H) operating a substantial act to oxidize organic compounds in water [13,14,15,16].
The blend of photocatalysis and sono-catalysis seems to promote the decolorization share of organic contaminants due to synergistic results [17]. Besides the generation of reactive oxygen species (ROS) through cavitation, employing ultrasound in photocatalytic procedure has other satisfaction, such as boosting the functional surface area of the catalyst through blocking the aggregation of particles, incrementing the contaminants’ mass transfer between the catalyst surfaces and solution, intercepting catalyst deactivation via constantly cleansing absorbed molecules from the catalyst surface through micro bubbling and micro streaming, and increasing the number of high temperature and pressure regions via breaking up micro-bubbles made via the ultrasound into smaller ones in the existence of catalyst nanoparticles [17,18,19].
Diatomite (diatomaceous earth), fossilized diatoms, is already used as adsorbent and carrier material. Additionally, the porous structure of diatom made it a potential heterogeneous catalyst [20,21,22]. Yttrium oxide (Y2O3) is an essential engineering compound in various fields because of its physical and chemical properties, such as relatively large bandgap energy, high melting point, and high permittivity [23,24,25,26]. Previously, Eu-doped Y2O3 nanostructures were prepared through several processes such as the combustion method [27], hydrothermal method [28], laser vaporization [29], sol gel method [30] and co-precipitation method [31], Precipitation method [32], and evaporation method [33] for various applications of thermoluminescence, photoluminescence imaging and luminescence. Lanthanide-incorporated nano-structured semiconductors have freshly been employed as active sonocatalyst and photocatalysts. With empty 5d orbitals and partly occupied 4f orbitals, Ln3+ cations could also remarkably boost the separation rate of photoinduced charge carriers within semiconductor catalysts and promote markedly the sonocatalytic performance [1,34,35,36,37,38]. The photoluminescence properties of Eu3+-doped Y2O3 nanostructures have attracted much attention due to its red phosphors characteristics in the last decade [39,40,41].
This work deals with describing a simple hydrothermal route for the preparation of coated-diatom with europium-doped Y2O3 (EuxY2−xO3) nanomaterials. The nanoparticles’ sonocatalytic activity was assessed for RB 19 (see Table 1). No report exists on the sonocatalytic degradation of Reactive Blue 19 (RB 19) in the presence of coated-diatom with europium-doped Y2O3. The sono-photocatalytic degradation of organic dye was examined and optimized and the influence of inorganic ions on the degradation effects of RB19 was investigated.

2. Experimental Methods

2.1. Chemicals and Materials

The chemicals used in this work had analytical grades and utilized with no further purification. Diatomaceous earth (97.5% SiO2), YCl3 (99.99%), ethanol (99%), and Eu(NO3)3·5H2O were purchased from Sigma-Aldrich(Seoul, Korea). RB19 was acquired from the Zhejiang Yide Chemical Company (Hangzhouwan Industrial Park, Shangyu, China).

2.2. Characterization

Using PXRD characterization at room temperature, the samples’ crystal phase composition was determined via a D8 Advance diffractometer (Bruker, Karlsruhe, Germany) with an emission current of 30 mA, monochromatic high-intensity Cu Ka radiation (λ = 1.5406 Å), and accelerating voltage of 40 kV. Elemental analyses were obtained using a linked ISIS-300, (Oxford Instruments, Abingdon, UK) (energy dispersion spectroscopy) detector. Using an electron microscope (SEM, S-4200, Hitachi, Tokyo, Japan), the surface state and the morphology were observed. Moreover, the obtained SEM images were analyzed using manual microstructure distance measurement software (Nahamin Pardazan Asia Co., Iran) to determine the diameter size distribution of obtained samples. A diffuse reflectance UV-Vis spectrophotometer was used to evaluate the samples’ optical absorption spectra (Varian Cary 3 Bio, Australia). Via a Spex FluoroMax-3 spectrometer (Longjumeau, France), photoluminescence spectra were acquired after dispersing a small amount of specimen in distilled water using ultrasound. The Specific surface areas were performed through a single point BET technique utilizing Micrometrics Gemini V and Gemini 2375. Cell para an emission current of 30 mA, an emission current of 30 mA, an emission current of 30 mA, an emission current of 30 mA, an emission current of 30 mA, an emission current of 30 mA, an emission current of 30 mA, an emission current of 30 mA, an emission current of 30 mA, an emission current of 30 mA, meters were calculated with Celref program from powder XRD patterns, and reflections have been determined and fitted using a profile fitting procedure with the Winxpow program. The reflections observed in 2θ = 10–70° were used for the lattice parameter determination.

2.3. Preparation of Eu-Doped Y2O3 Nanoparticles

Eu-doped yttrium oxide nanomaterials with various Eu contents (0–8 mol%) were acquired hydrothermally. In a typical synthesis, Eu (NO3)3.5H2O and proper molar ratios of YCl3 were dissolved first in 40 mL of deionized water. Therefore, EDTA (0.4 g) and 2 mmol NaOH were added drop-wise to the solution at moderate speed with stirring. The above solution was transferred into 100-mL autoclave with Teflon-lined stainless steel. Then it was settled in an oven at 250 °C for 72 h and finally allowed to cool to room temperature naturally. Gathering the as-prepared EuxY2-xO3 nanoparticles, they were rinsed several times with distilled water and absolute ethanol for eliminating remained impurities, and then dried for 2 h at 60 °C at vacuum. The result was a white powder.

2.4. Diatomite Coated with Eu-Doped Y2O3 Nanoparticles

The diatom was weighed and added to 25 mL deionized water and was continuously stirred to spread evenly. Then, 1.5 g Eu-doped Y2O3 compounds with various Eu content were added to the above solution to fully disperse. After 1 h of ultrasonic irradiation, the solution transferred into a 100-mL autoclave with Teflon-lined stainless steel, settled in an oven at 160 °C for 12 h, and then cools down naturally to room temperature. The final coated-diatom was obtained after washing and drying the precipitates at 60 °C.

2.5. The Evaluation of Catalytic Activity

The sonophotocatalytic activity of the diatom biosilica coated with Eu-doped yttria nanomaterial was examined to degrade RB19 as a model organic pollutant. In a general route, suspending the nanocatalyst (0.1 g) was carried out in an aqueous solution of the model dye (100 mL) of with a recognized initial concentration at pH = 6. So, the suspension was radiated into the ultrasonic bath via a 40 W compact fluorescent visible lamp armed with a cutoff filter to show visible light illumination (λ of higher than 420 nm). To determine the removal of dye, A UV–vis spectrophotometer was employed through the absorbance at λmax = 592 nm. The degradation effectiveness (DE) was calculated as follows:
D E   ( % ) = ( 1 C C 0 ) × 100
where C0 and C are the dye’s initial and ultimate concentrations within the solution (mg/L), respectively. To evaluate the nanocatalyst’s reusability, the utilized catalyst was separated from the solution, rinsed with distilled water, and utilized in a new run after drying at 70 °C.

3. Results and Discussion

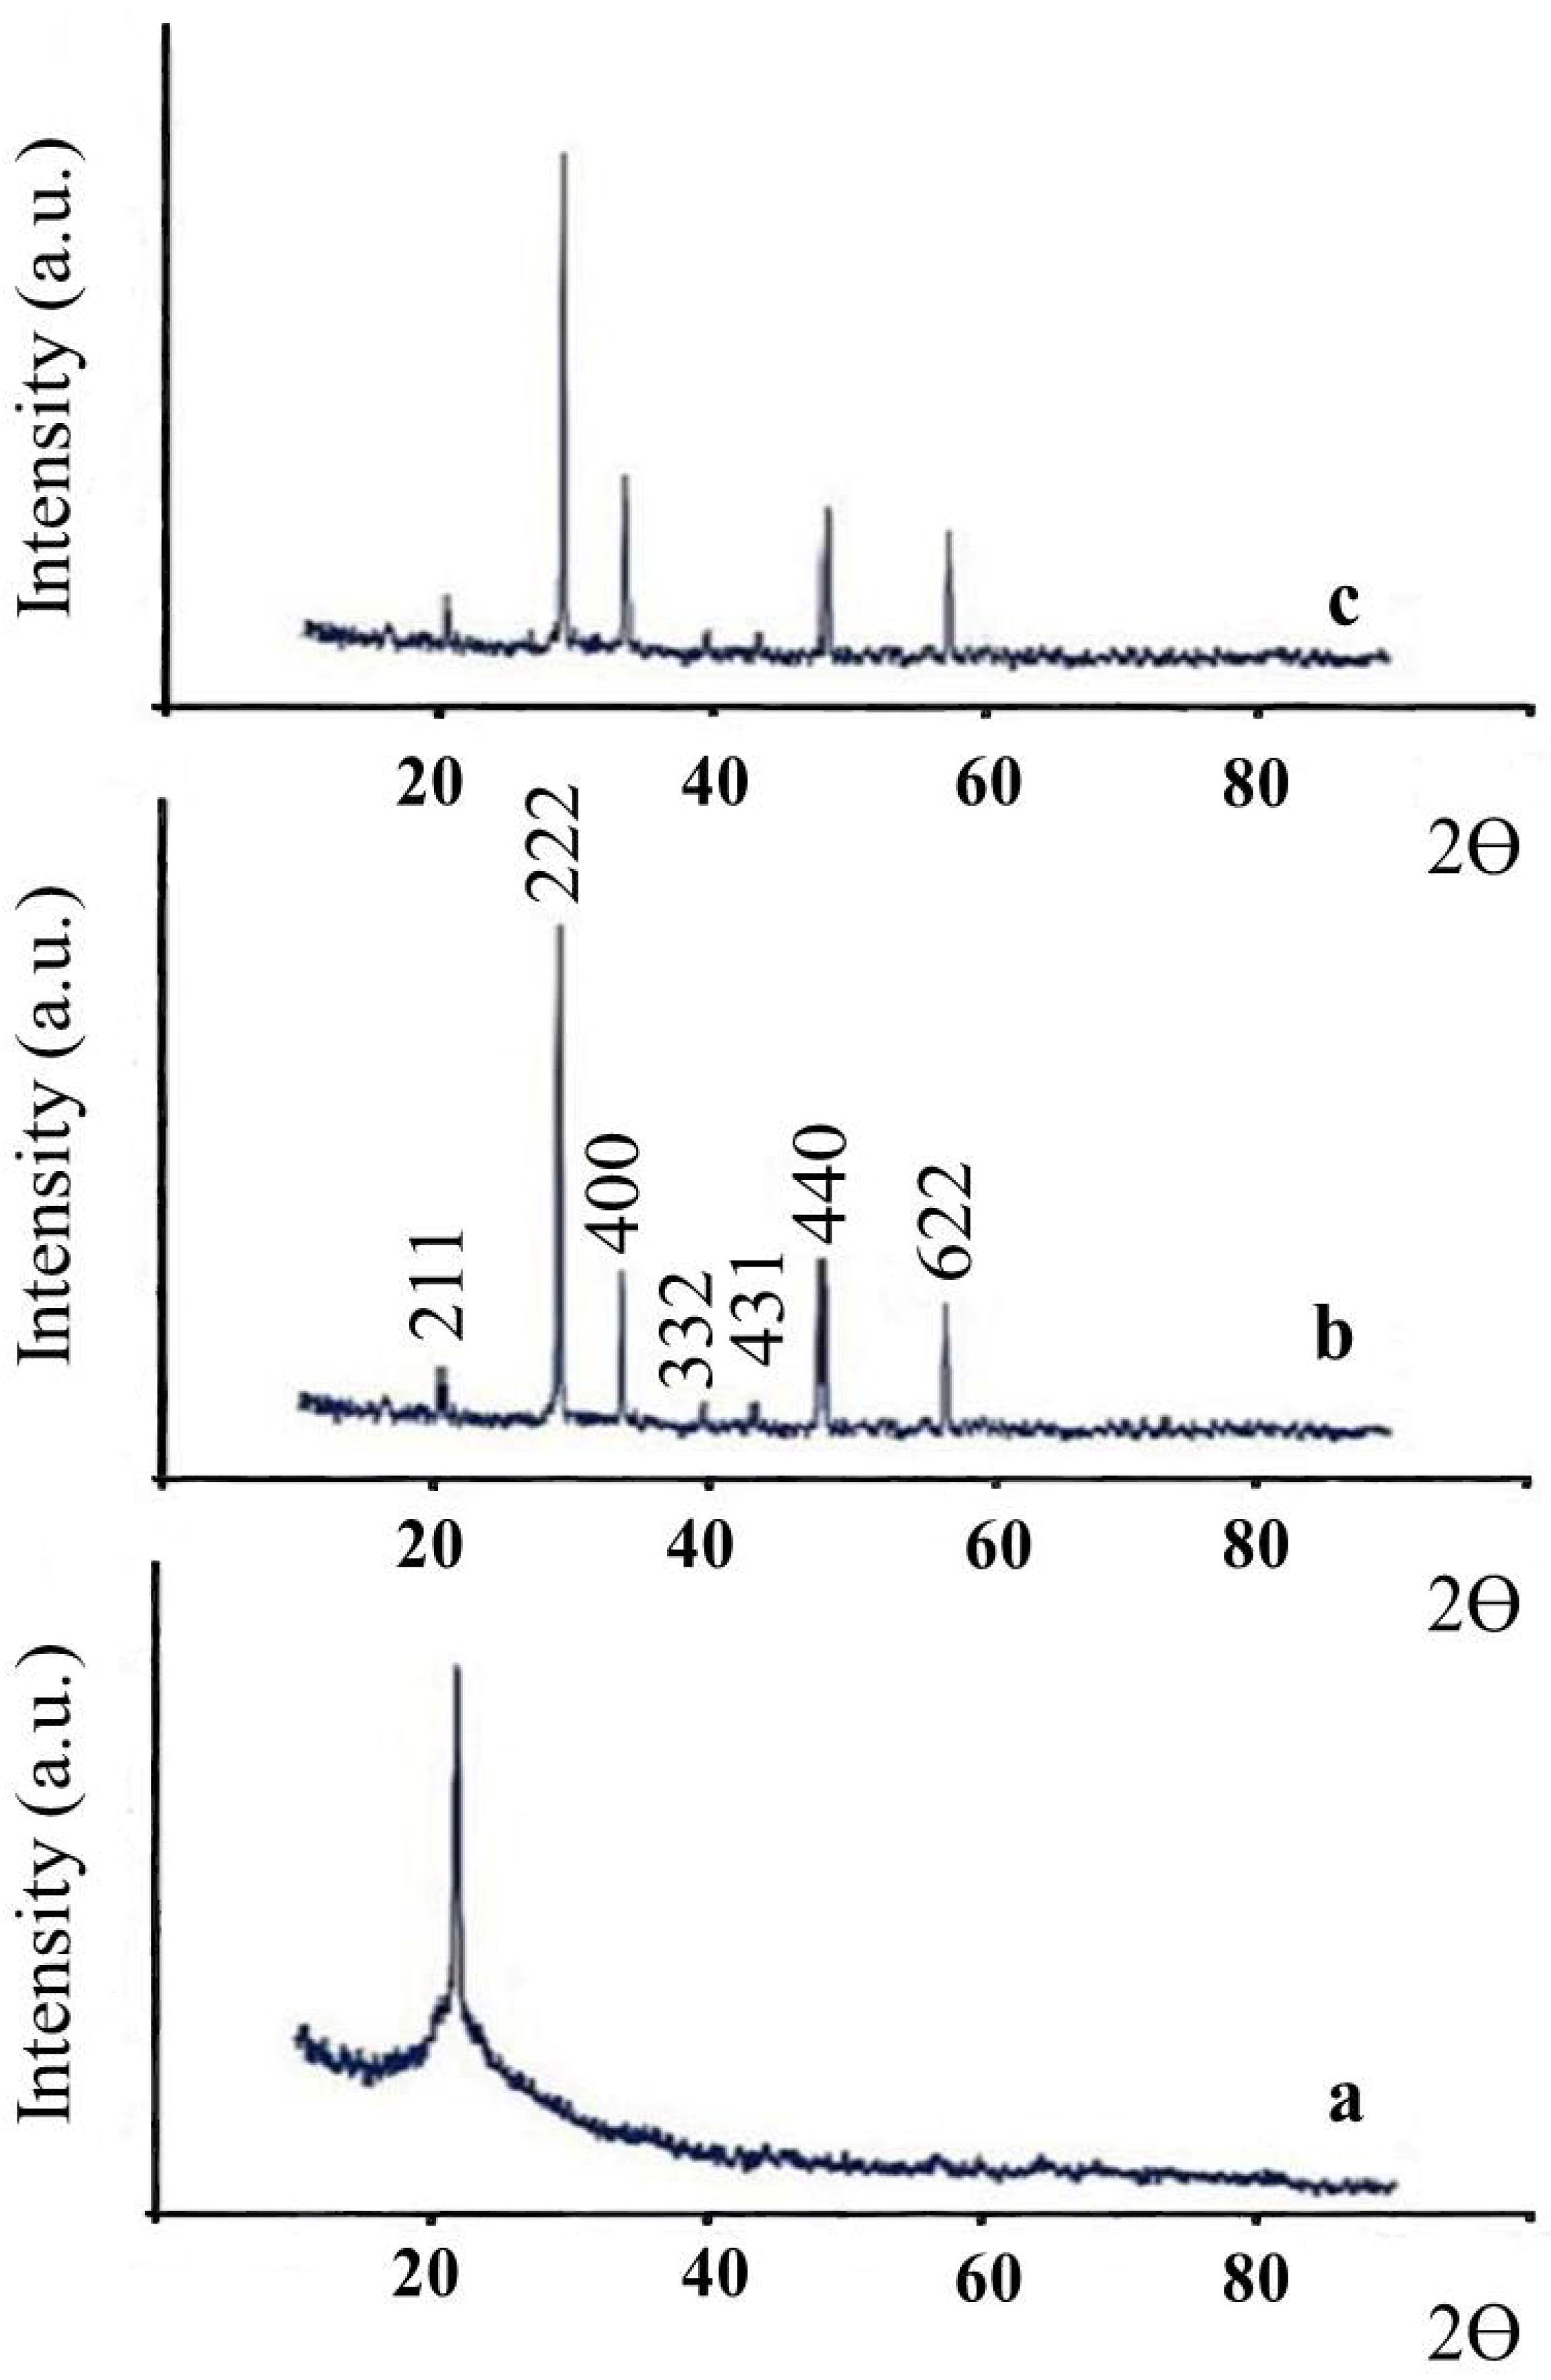
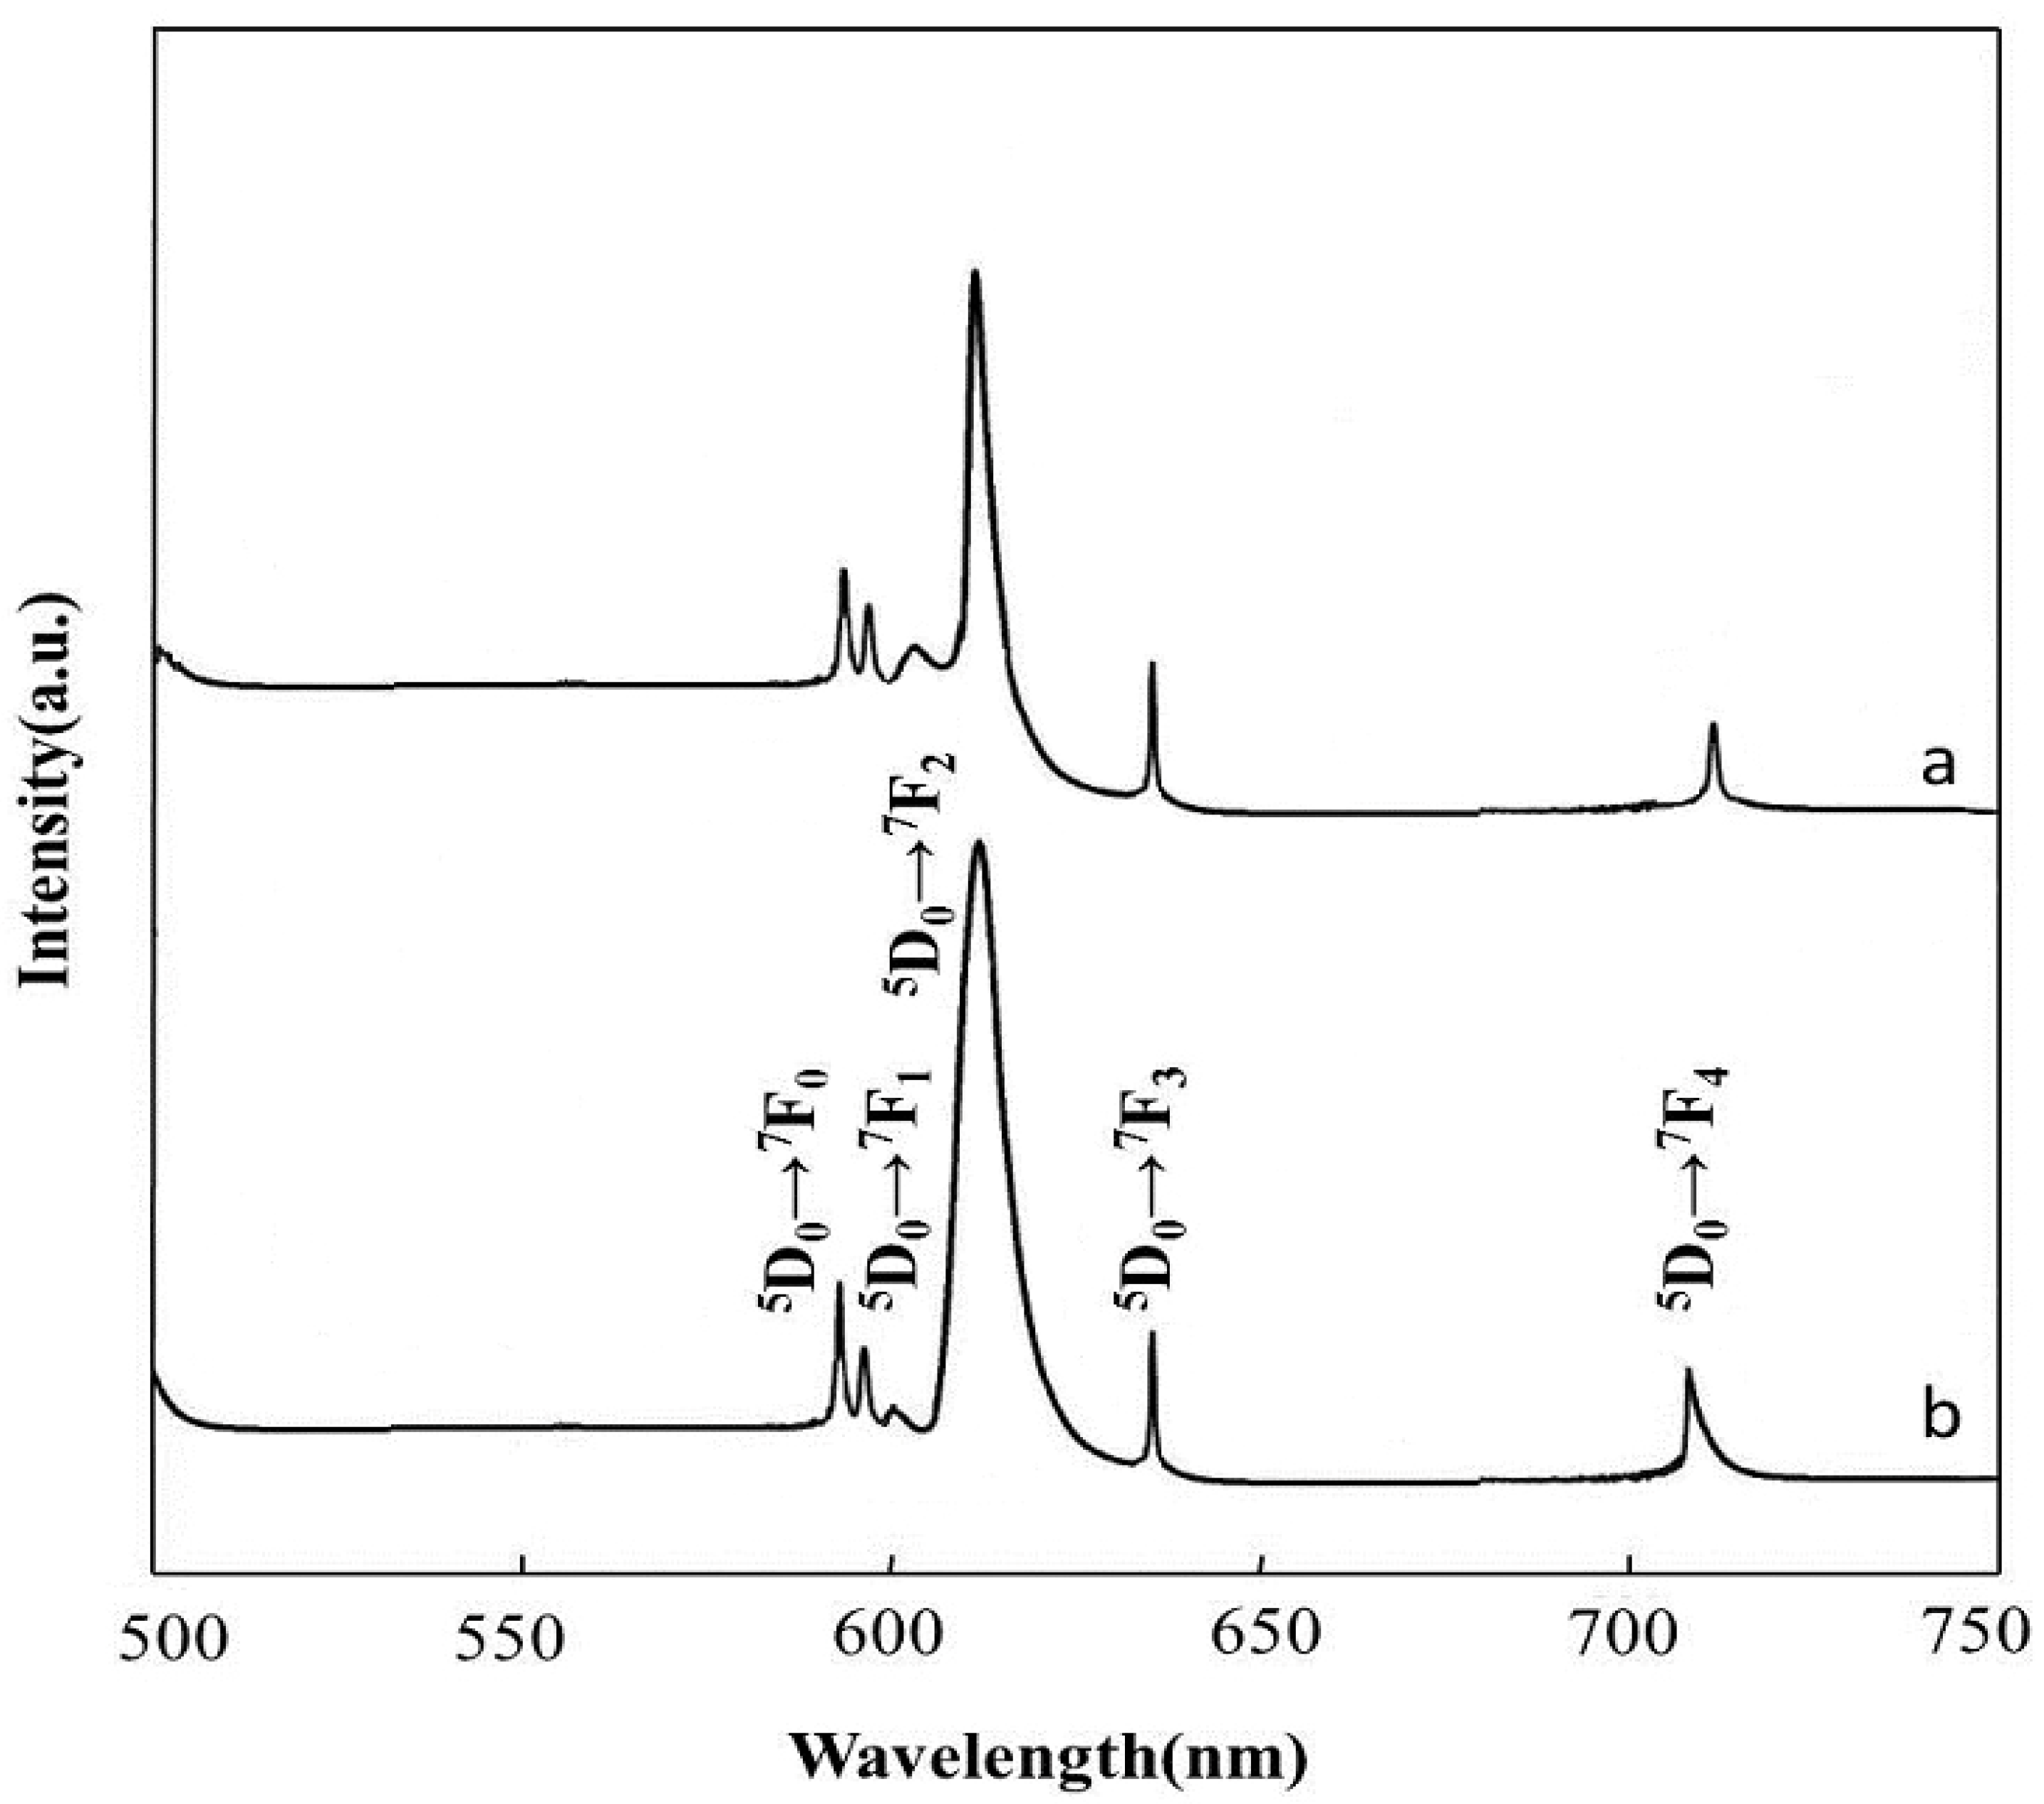
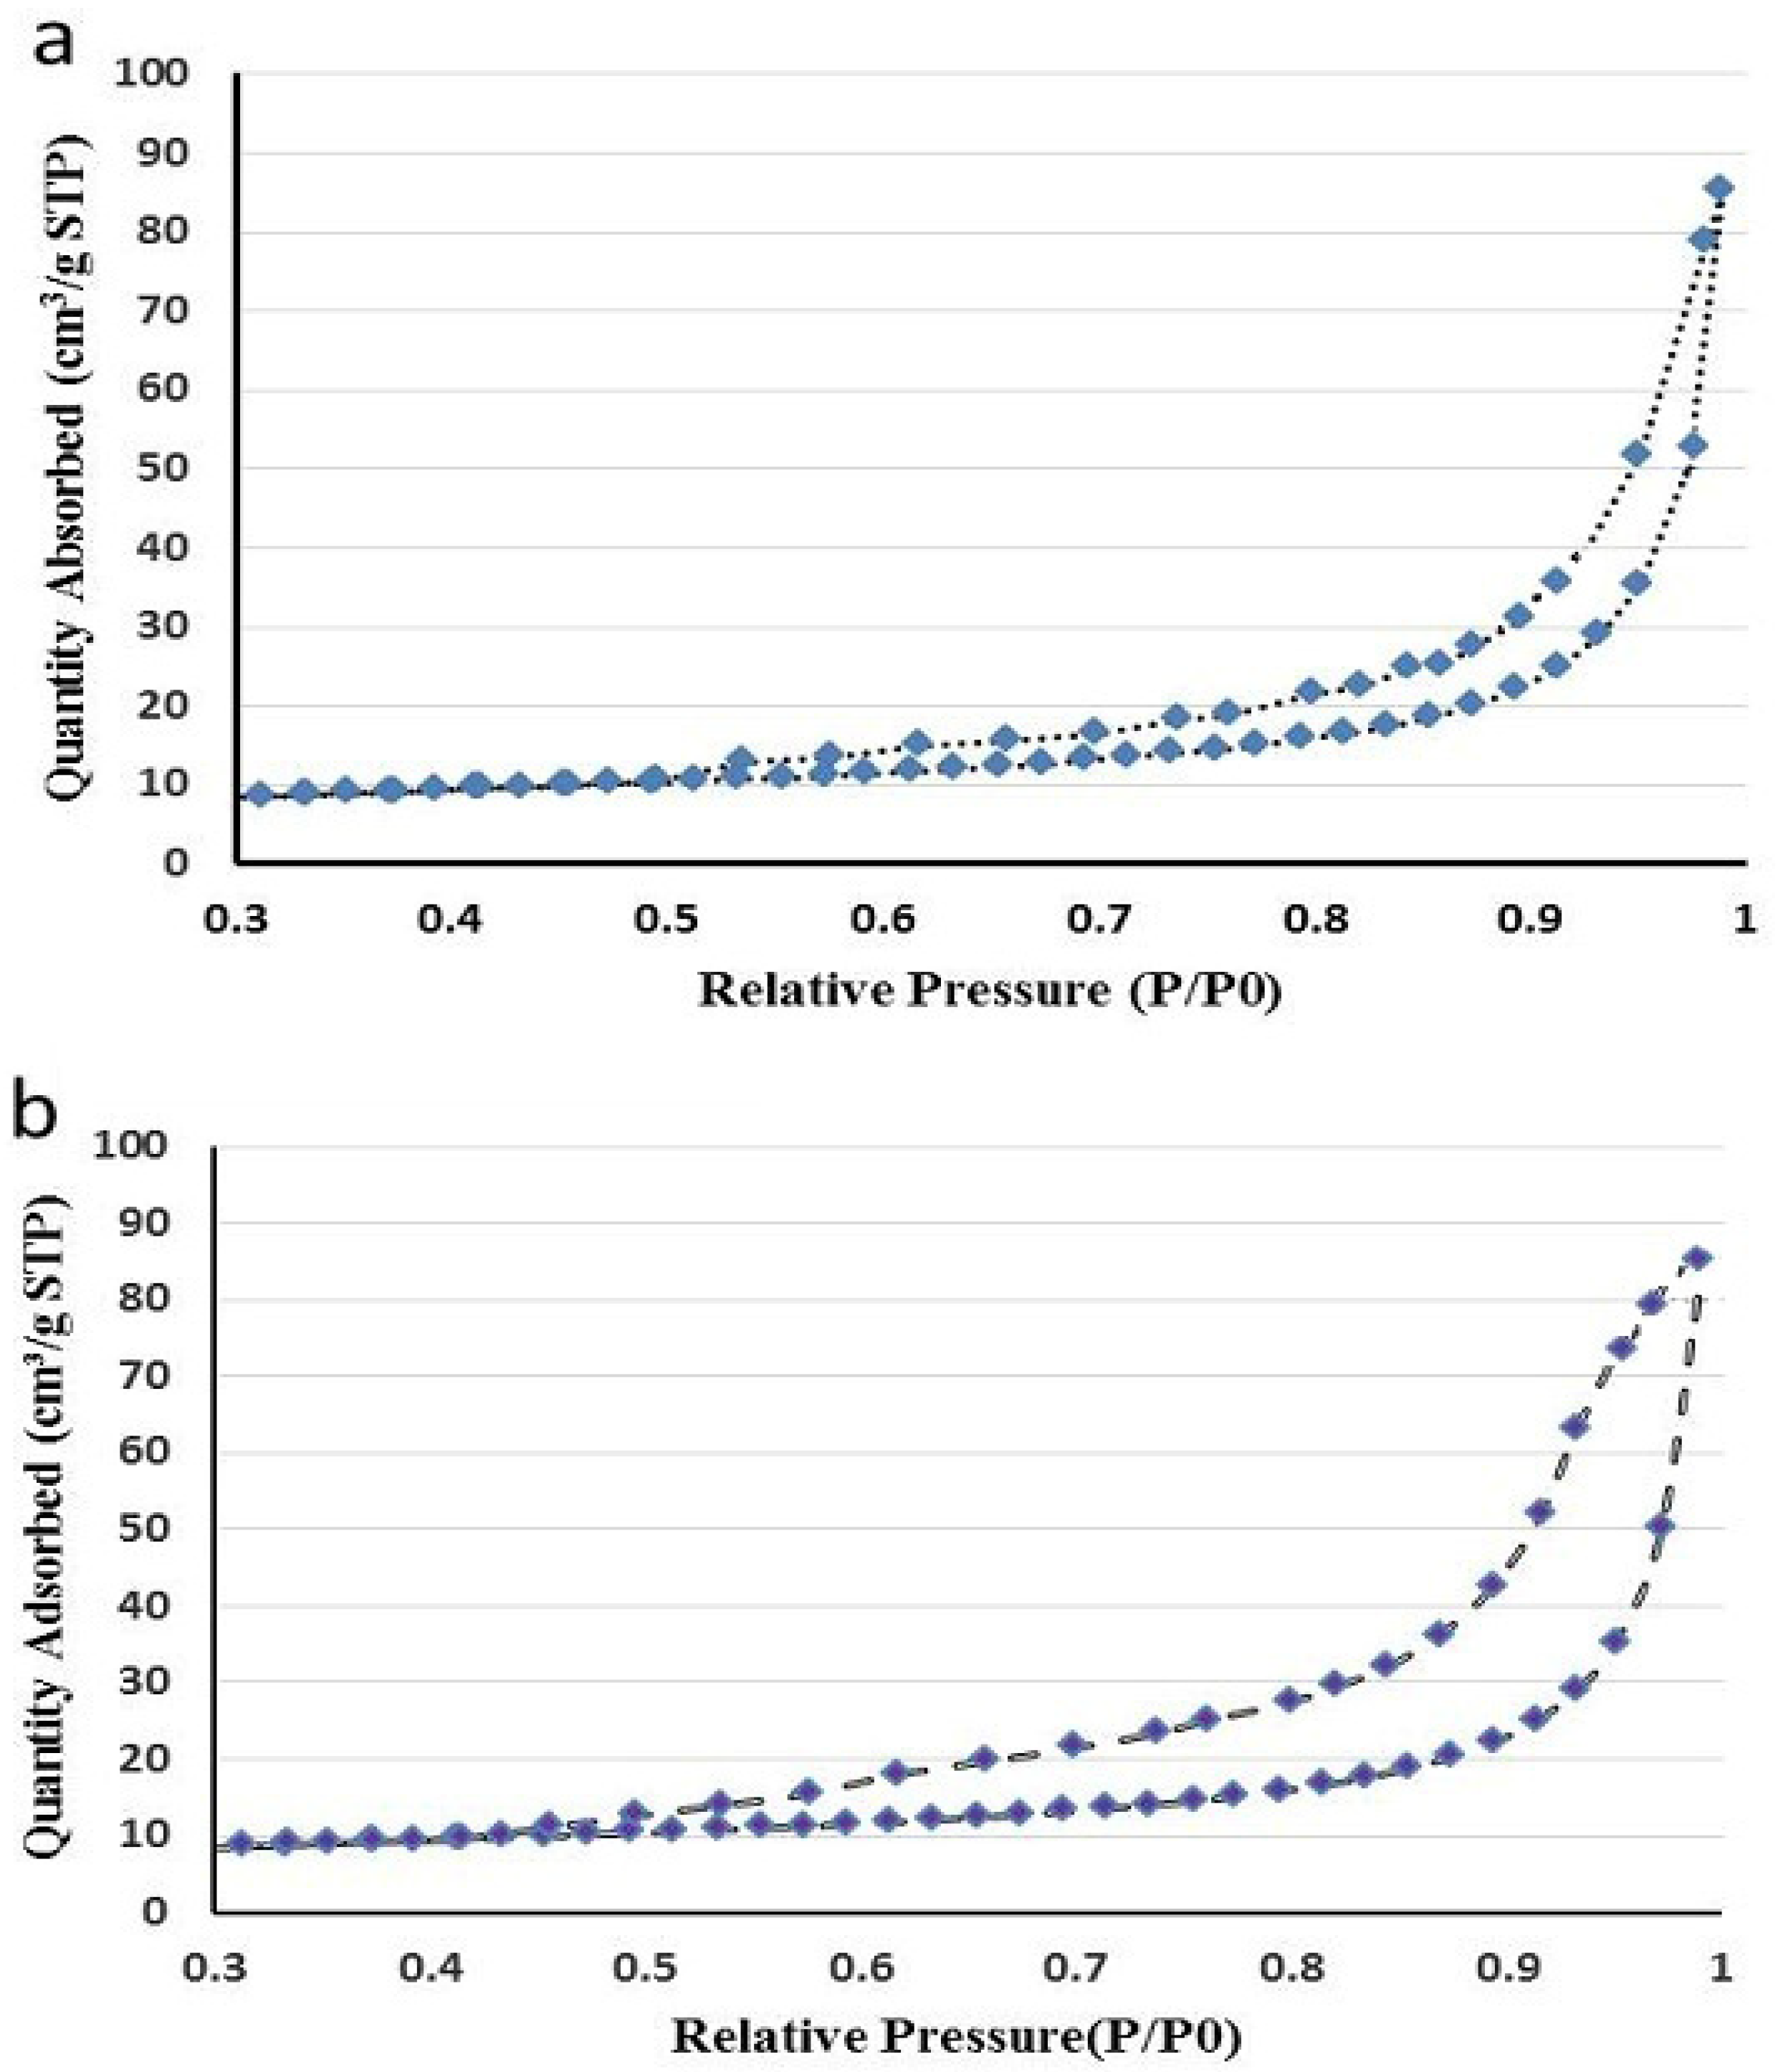
3.1. Characterizing the Synthesized Samples

Figure 1 presents the PXRD pattern of uncoated diatomite, Y2O3, and diatom-coated with Eu-doped Y2O3. The diatomite PXRD pattern is indexed readily to SiO2 (JCPDS card no. 00-001-0647) whilst the four broad and strong peaks with attributed reflections (222), (400), (440), (622) and 2θ = 29.1, 33.7, 48.6, and 58.2° are related to the cubic structure of yttria, respectively (JCPDS card no. 41-1105) [42]. The indistinguishable forms of the PXRD patterns of the Y2O3 and the coated with EuxY2-xO3 compounds propose that the surface of the diatom is equally covered. As illustrated in Figure 1, the substitution of yttria by Eu3+, only the peaks related to the Y2O3 were still noticed and no other peaks corresponding to Y(OH)3, Eu2O3 or other impurities were detected, which displays that the Eu3+ ions substitute Y3+ ions in yttria structure. A negligible shift was observed to lower diffraction for diatomite-coated with Eu-dopedY2O3 samples. This could be attributed with the Y2O3 lattice’s contraction owing to the substitution of Eu3+ ions, with a bigger radius (1.07 Å) in comparison to Y3+ ions (1.02 Å) [7,35]. The XRD pattern of diatom-coated with 6%Eu-doped Y2O3 is provided in Supplementary Materials as Figure S1.
The cell parameters of the synthesized materials were calculated from the PXRD patterns. With increasing dopant content (x), a parameter for Eu3+ increases (Figure 2). The trend for lattice constants can be correlated to the effective ionic radii of the Ln3+ ions, which results in larger lattice parameters for Eu3+ doped materials.
Figure 3 displays SEM images of the diatom-coated with 6% Eu-doped Y2O3 and uncoated sample produced by the hydrothermal route. The skeletal-remain biosilica with high porosity structure is shown in Figure 3a. High porosity and the surface morphology of diatom can be employed as the template to enhance the potential of functional materials. Figure 3b represents the image of 6% Eu-doped Y2O3 nanoparticles which diameter of these particles is around 20–60 nm. The size distribution of 6% Eu-doped Y2O3 is provided in Supplementary Materials as Figure S2 indicating the particles size mainly around 20–60 nm. Following the immobilization of 6% Eu-doped yttrium oxide, the SEM image of diatomite is seen in Figure 3c,d. Changing the mass ratio of the substrate–diatomite and the coating material–doped-Y2O3 controls the thickness of the coating layers. To achieve smooth, stable, and uniform coating, the optimum ratio is 1.5.
Figure 4 displays the TEM and HRTEM images of 6% Eu-doped Y2O3-coated diatomite at different magnification. The SAED pattern of as-prepared 6% Eu doped samples shows good crystallinity of obtained compounds (Figure 4b). The HRTEM images also confirms the nanosized coated Eu-doped Y2O3 on biosilica as shown in Figure 4c,d.The size of coated particles are around 8–20 nm, respectively. More characterization results related to various content of Eu are provided in Supplementary Materials as Figures S3–S7.
The elemental mapping of O, Y, Eu and Si in the diatom-coated with Eu-doped Y2O3 sample was shown in Figure 5 confirming the XRD outcome and purity of sample. The atomic percent of as-prepared sample are provided in Table 2 displaying the composition, elements and there is no impurity in the prepared sample.
Figure 6a shows the absorbance spectra of Eu-doped Y2O3 coated diatomite compounds. A redshift in absorbance spectra is seen with increasing dopant content.
The as-synthesized compound’s band-gap energy can be calculated from the interception of the obtained linear area with the energy axis according to (hvα)2 versus (hv) (Tauc plot) (Figure 6b). Compared to the pure sample, the doped Y2O3 has lower Eg values, and it is deducted by incrementing the dopant. Table 3 lists the band-gap energy for Eu-doped Y2O3 coated diatomite nanoparticles.
Figure 7 displays the PL spectra of the as-prepared diatom coated with 6% and 8% Eu-doped Y2O3 samples (EuxY2-xO3). Under UV irradiation, the samples present a strong emission centered at 614 nm, and other emission feature is an indication of europium cations in the cubic Y2O3 host lattice. The emission spectra are consisting of Eu3+ 5D07FJ transitions (J = 0, 1, 2, 3 and 4) with the eminent peak 5D07F2 (614 nm). Other peaks at 583 (5D07F0), 596 (5D07F1), 633 (D07F3) and 711 nm (5D07F4) were observed, respectively [43]. The schematic bandgap model for the luminescence of Eu3+ doped in Y2O3 lattice was provided in Supplementary Materials as Figure S8.
Adsorption/desorption isotherm of nitrogen for uncoated diatomite and coated with 6% Eu3+-substituted Y2O3 are shown in Figure 8. In the case of both specimens, two isotherms with obvious hysteresis loop were noticed in the pressure range of 0.3–1.0 p/p0. The BET specific surface area of biosilica is 1.5 m2/g. Additionally, the BET specific surface area of diatomite coated with 6% Eu-substituted Y2O3 (8.7 m2/g) considerably exceeds that of uncoated diatom. A superior adsorption performance is expected for coated-diatom with europium-doped Y2O3 nanoparticles.

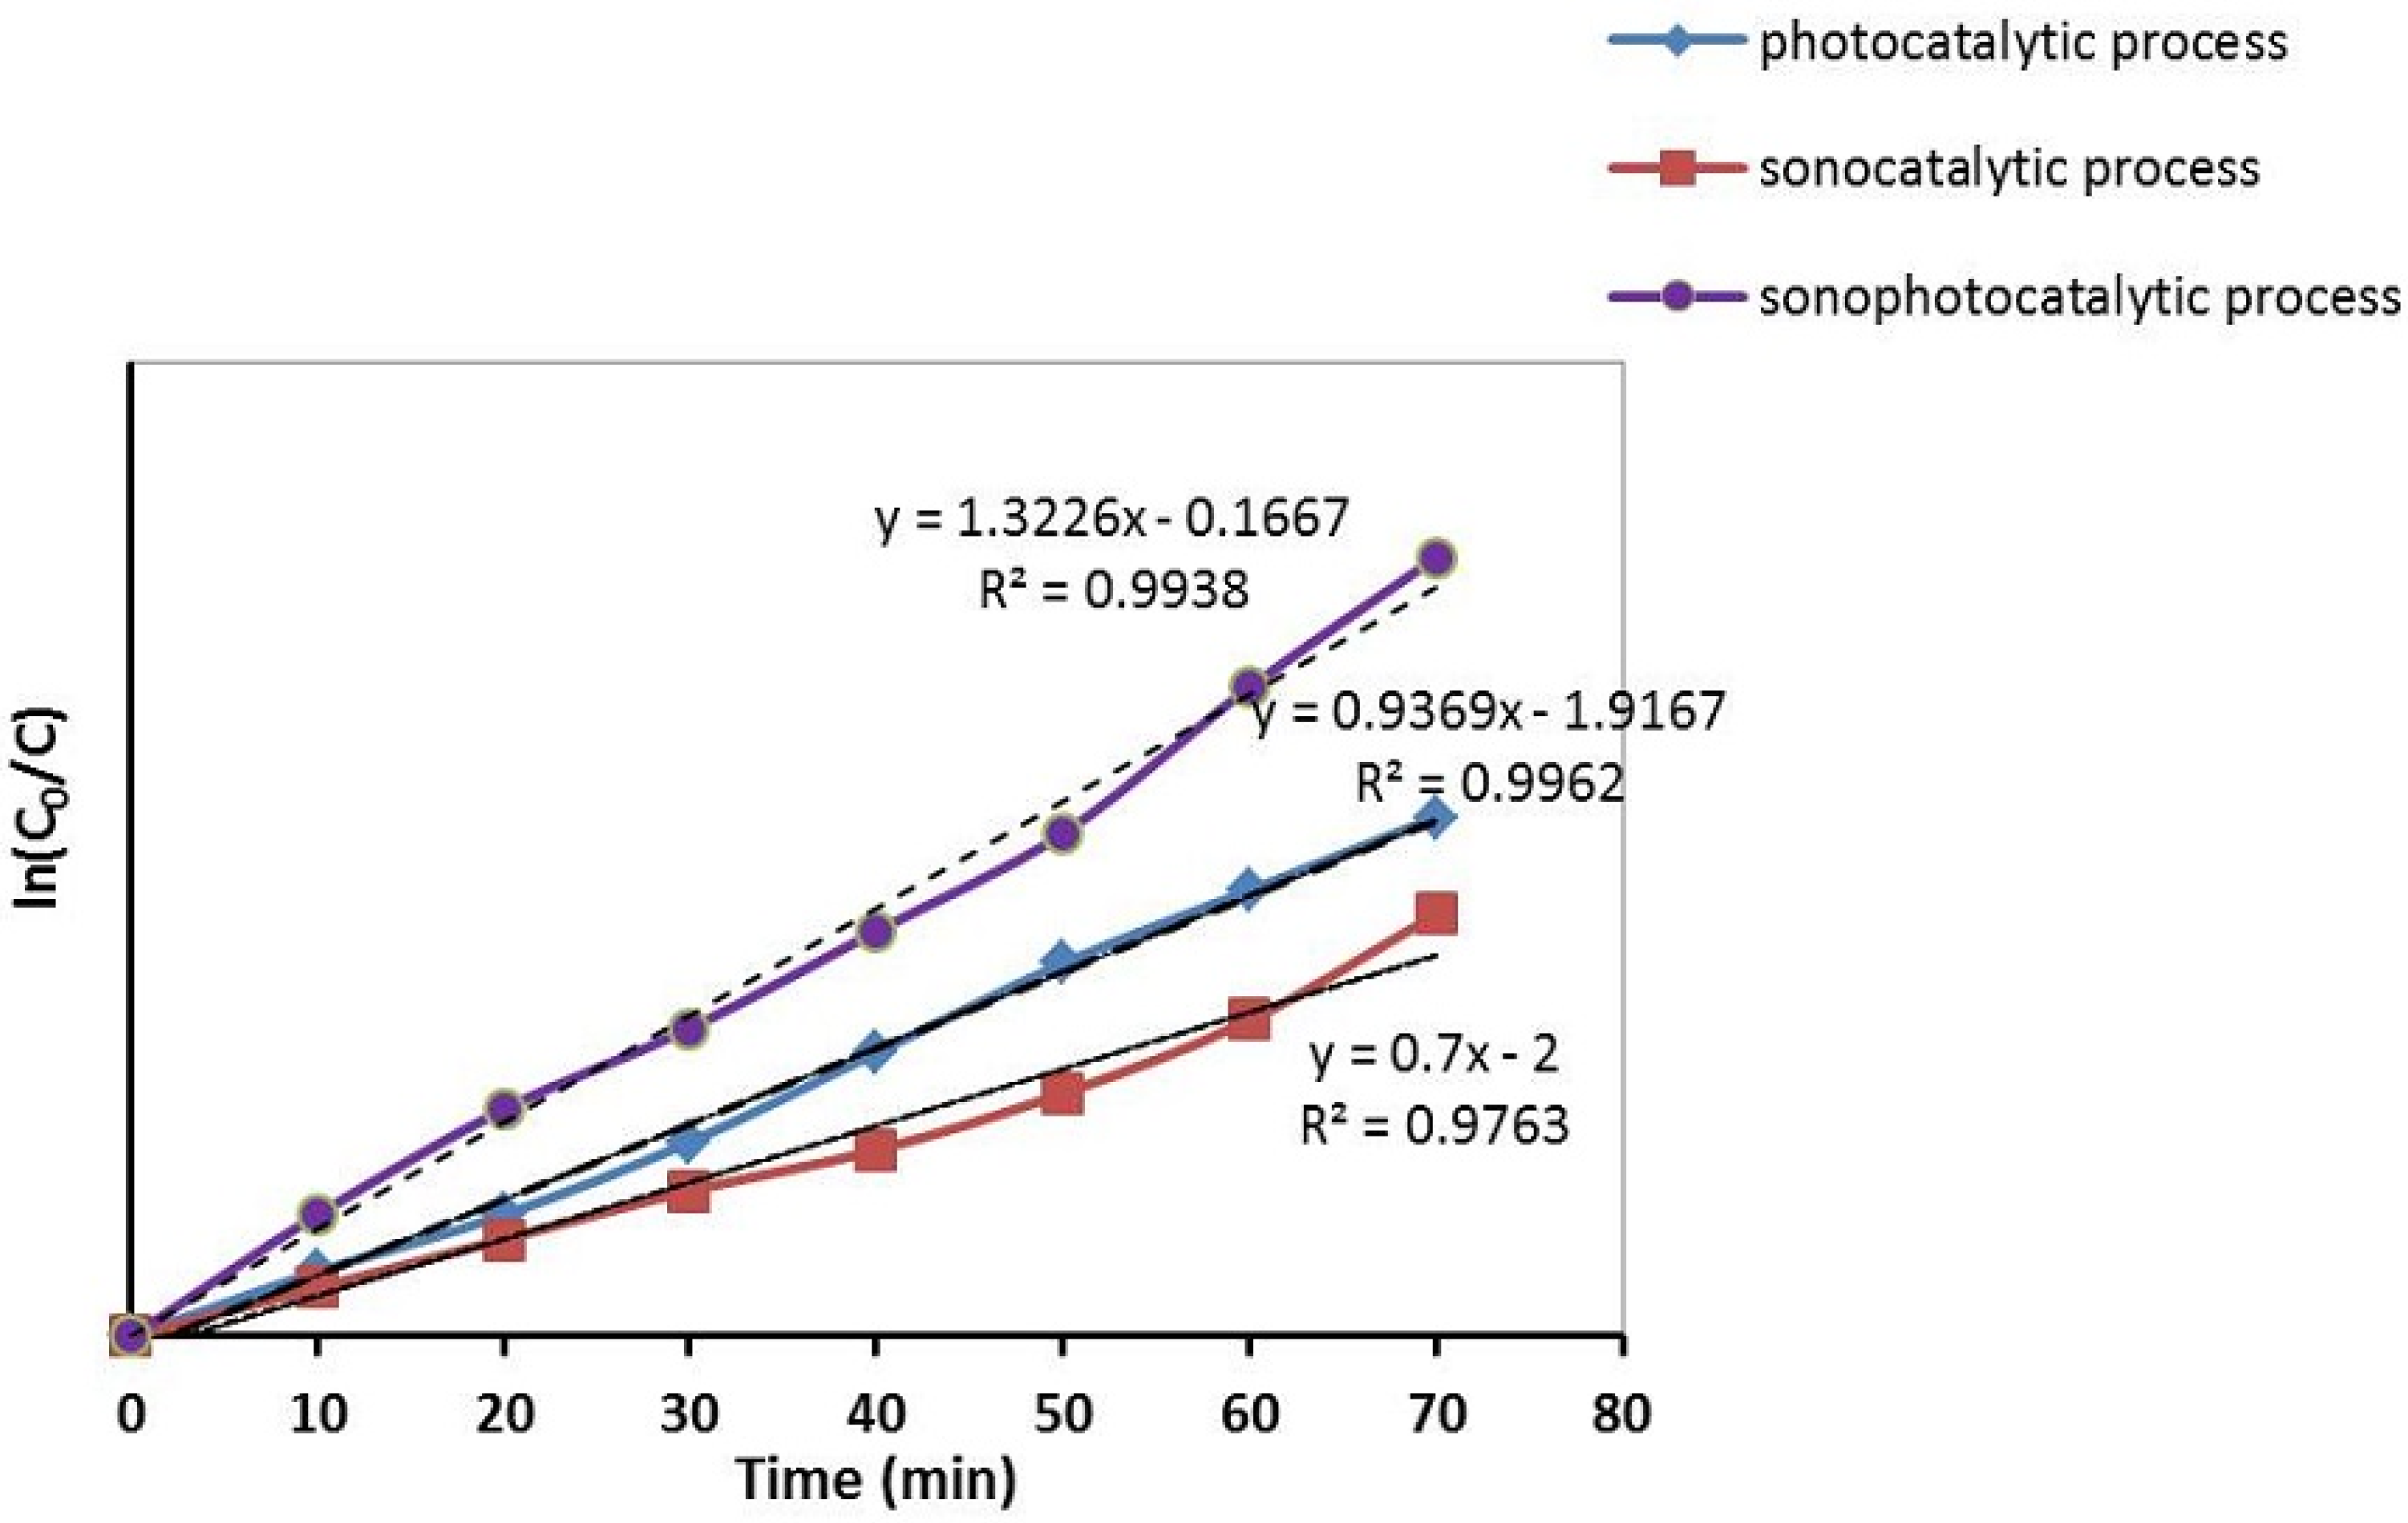
3.2. Synergistic Effect of Photocatalysis and Sonocatalysis on the Degradation of RB19 Using Diatomite Coated with Eu-Doped Y2O3 Nanoparticles

By comparative evaluations, the photo-, sono-, and sono-photocatalytic performance of the prepared diatomite coated with Eu-doped Y2O3 were assessed, for which the results are displayed in Figure 9. The degradation percent was very low in the absence of catalyst nanoparticles under light irradiation, which demonstrates that photolysis doesn’t contribute to the RB19 elimination from the solution.
The findings of the assay conducted in dark condition present that surface adsorption has no remarkable effect on degrading the dye solution. The degradation efficiency by the photocatalytic route was less than 64%. The degradation efficiency through sonocatalytic degradation (52%) was higher than sonolysis (7%). The degradation percentage was outstandingly boosted in the sonophotocatalytic process (96.45%) owing to synergistic impacts between photo- and sono-catalysis. This can be simplified as: firstly, the production of several ROSs through the integrated cavitation effects and photocatalytic procedure, secondly, the elevated mass transfer rates, thirdly, the catalyst nanoparticles disaggregation by ultrasound and the larger active surface areas, and fourthly, the creation of more hot spots through catalyst nanoparticles [17,18,19]. Figure 10 shows the spectra of the lamp used for catalytic process.
As displayed in Figure 11, the graph of (−ln (C/C0) vs. time indicates linear trend for all three sono-photocatalytic, photocatalytic and sonocatalytic processes, displaying pseudo-first-order kinetics [1,44,45]. It is apparent that the pseudo-first-order kinetic constant and degradation ability in sono-photocatalysis (kobs,sono-photo) are bigger than those for sonocatalysis (kobs,sono) and photocatalysis (kobs,photo). These outcomes totally introduce the concept of a synergistic impact.
To examine the decolorization process’s mechanism and to reveal the chief oxidative species, assays were conducted in the presence of proper scavengers of active species. As stated by Figure 12, the addition of t-BuOH (a scavenger of hydroxyl radicals) results in decreasing of 14% in the decomposition percent. By addition of oxalate (a scavenger of h+VB), the decolorization efficiency reduced to 54%. In the case of Cl and I (scavenger of hole) it reaches to 27 and 33% respectively. The dye degradation was inhibited remarkably as benzoquinone (BQ) was added (a scavenger of superoxide radicals). These results display that the superoxide radicals and h+VB were the substantial oxidative species in degradation of organic dye. In addition, the hydroxyl radicals also affect the degradation. Considering the synergistic impacts of photo- and sono-catalysis, a possible mechanism for the decolorization procedure can be proposed [17,19]:
(1) The two light irradiation and US can excite the catalyst particles to formation of electron-hole pairs:
Eu-doped Y2O3 coated diatom + ( and US) h+ + e
(2) The reaction of adsorbed oxygen molecules and electrons of conduction band lead to produce O2, HO2, and H2O2:
e + O2O2
O2 + H+→ HO2
e + H+ + HO2 → H2O2
(3) Water molecules or hydroxyl anions can be oxidized by the photogenerated holes to produce hydroxyl radicals:
OH + h+OH
h+ + H2O → OH + H+
(4) The pyrolysis of water molecule can be boosted by the US to generate hydrogen and hydroxyl radicals:
H2O + US H + OH
OH + OH → H2O2
(5) Eventually, the molecules of dye can be decomposed by the produced active spices:
Reactive blue 19 + reactive oxygen species (ROSs) → degrading dye molecules

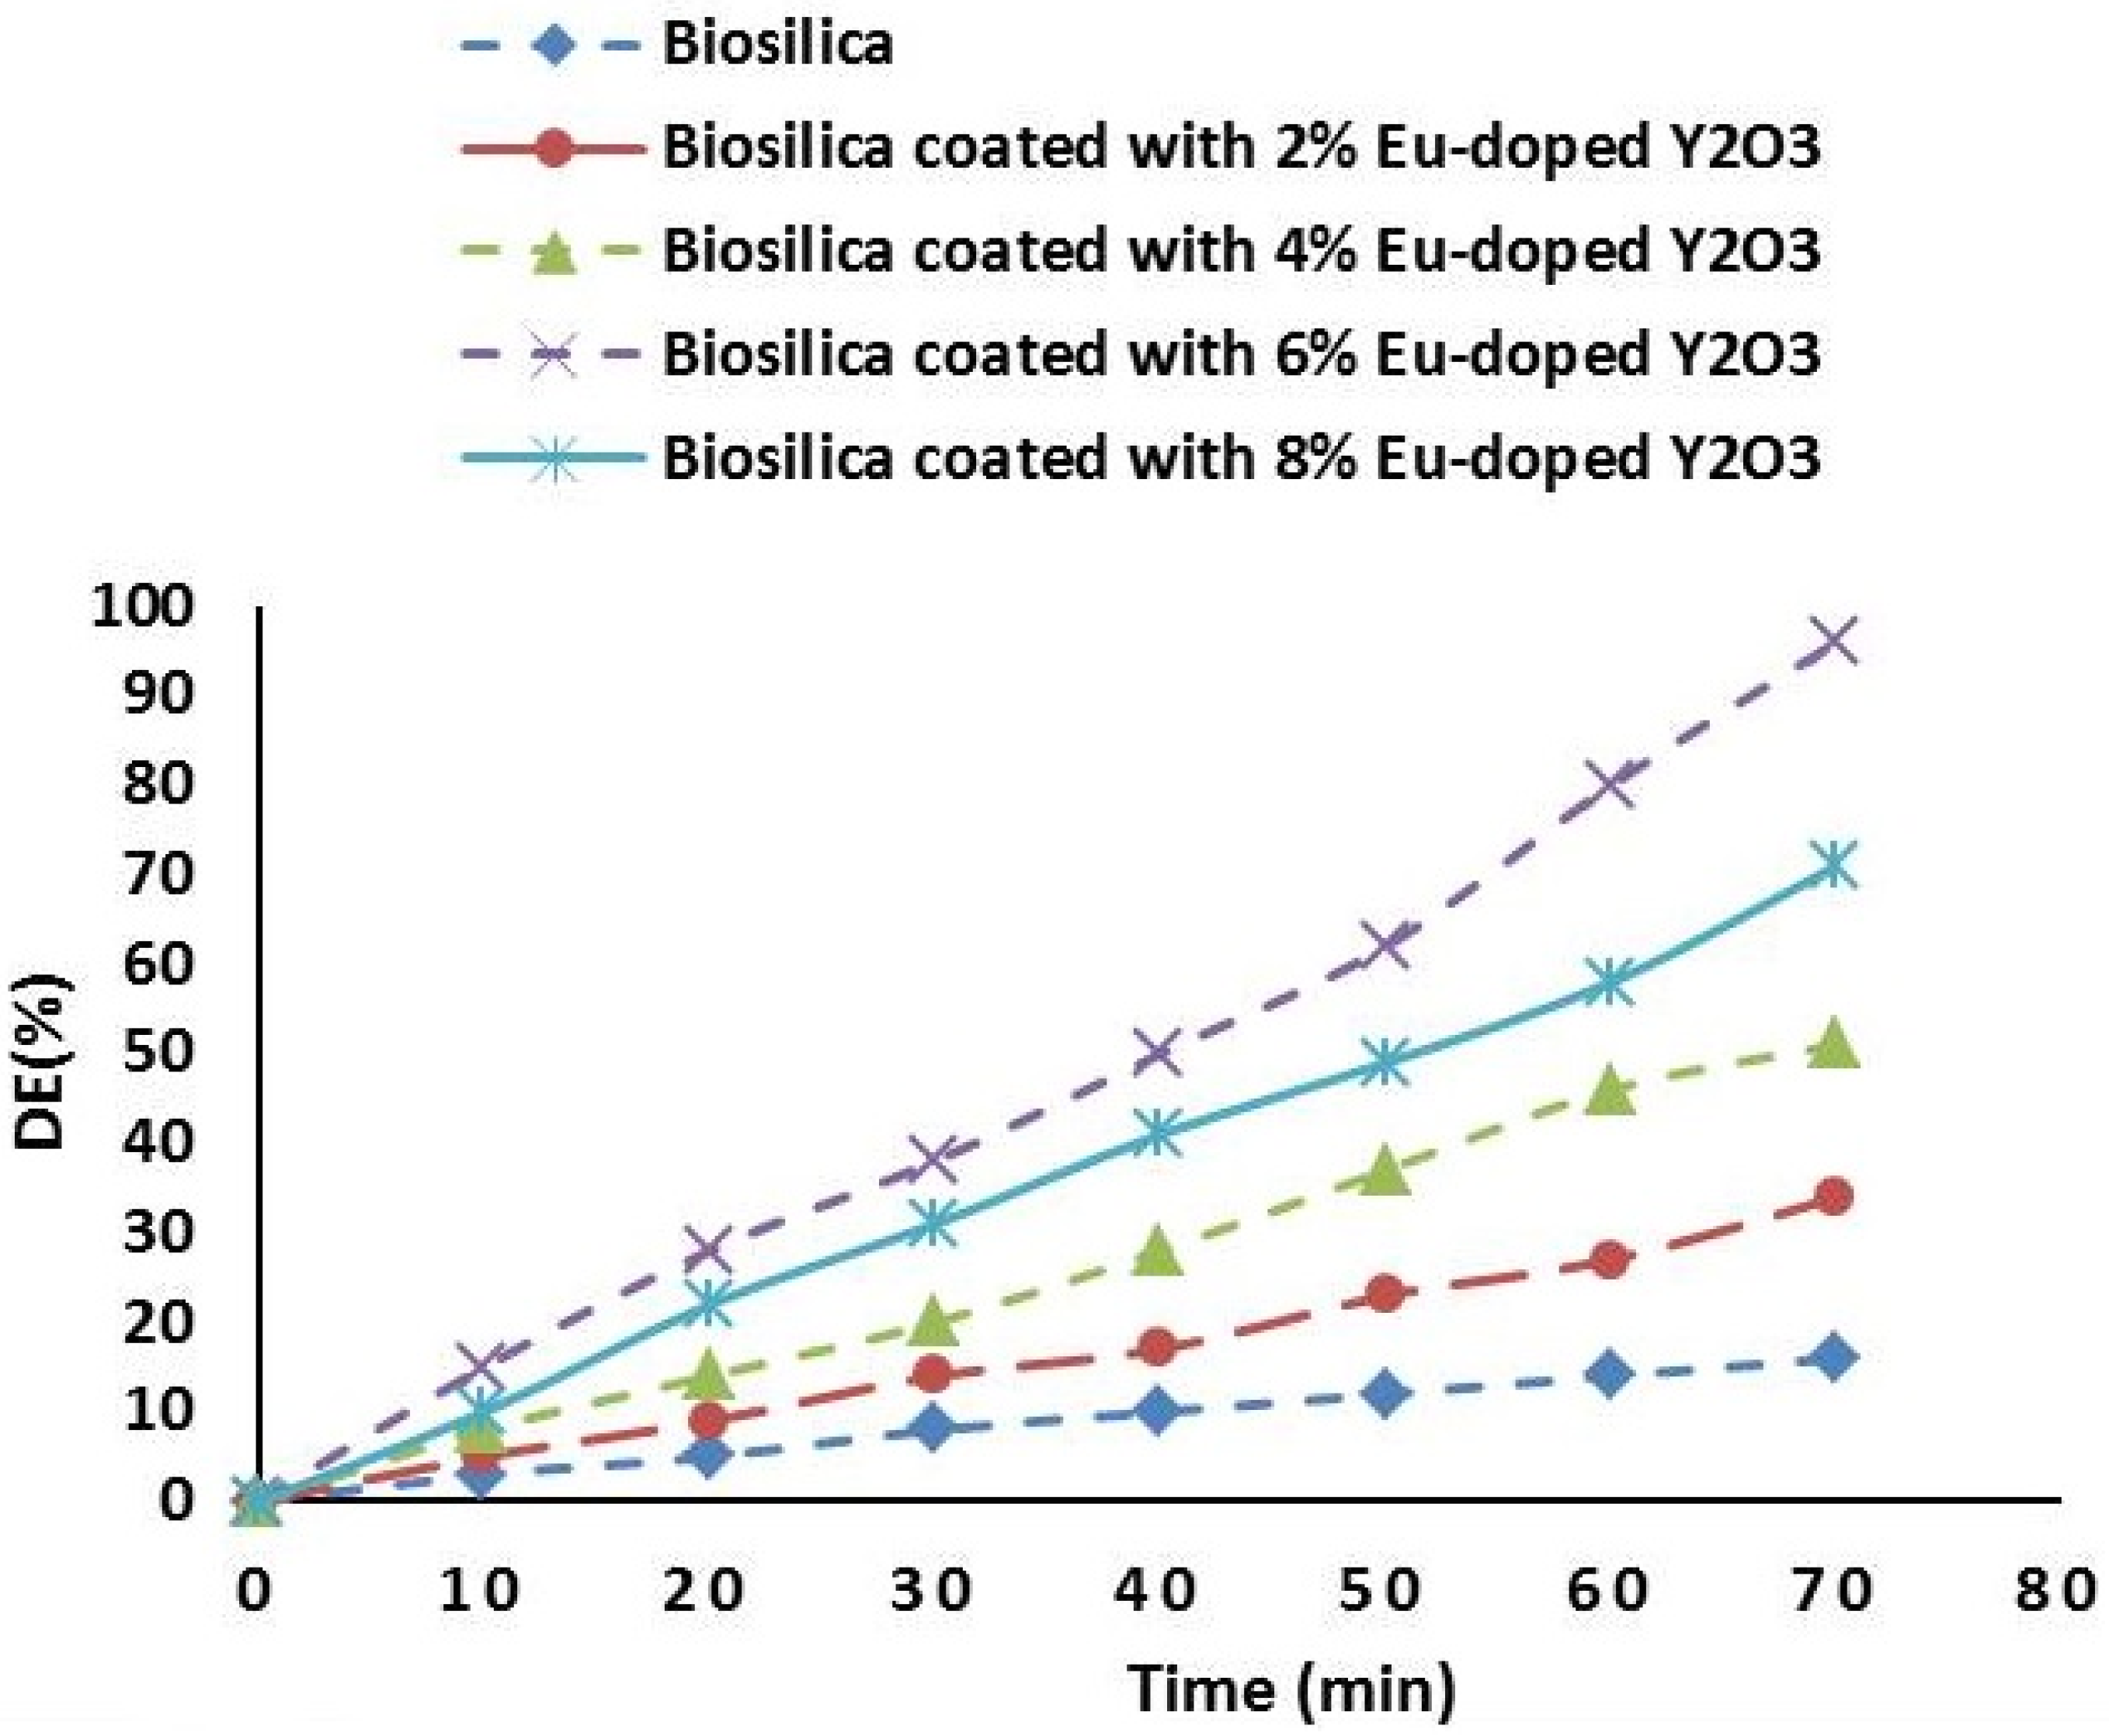
3.3. Effect of Eu3+ Content of Diatom Coated Eu-Doped Y2O3 Nanoparticles

The removal effectiveness of RB 19 over diatomite coated Eu-doped Y2O3 sonocatalysts during 70 min of sonophotolysis is shown in Figure 13. The doped samples with proper content of Eu3+ ion had much better catalytic performance compared with uncoated biosilica. For diatom coated 6% Eu doped Y2O3 nanoparticles, the highest decolorization efficiency was achieved. Two mechanisms can explain these findings. First, rare-earth cations such as Eu3+ restrain the electron–hole recombination and act as an electron scavenger. Second, the new energy level under the conduction band edge of Y2O3 is created by substituting of Eu3+ into yttria lattice [46,47]. Considering the standard redox potentials of E0 (Eu3+/Eu2+) = −0.35 V and E0 (O2/O2) = 0.338 V, the existence of Eu3+ in yttria structure can improve the following reactions [48]:
Eu3+ + e → Eu2+
Eu2+ + O2 → Eu3+ + O2●−
O2●− + H+ → HO2
2HO2→ H2O2 + O2
OH, H2O2 and O2 radicals are well-known powerful oxidants for the degrading of organic dye [49].
The UV–vis absorption spectra of RB 19 at various irradiation periods for the sonophotocatalytic process are shown in Figure 14. The reducing concentration of RB 19 during the catalytic process is used to examine the performance of the catalyst.

3.4. Primary Dye Concentration Effect

Various initial dye concentrations in the range of 20 to 40 mg/L were used in this study. As seen in Figure 15, DE % reduced from 96.54 to 49.21% in the case of initial concentration 20 to 40 mg/L. Filling the energetic sites on the catalyst’s surface by pollutants molecules at high concentration results in an astounding decrease in the degradation effectiveness. The prevention of diffusion of light to the catalyst’s surface can led to unsatisfactory performance at dense concentration of dye solution [50].

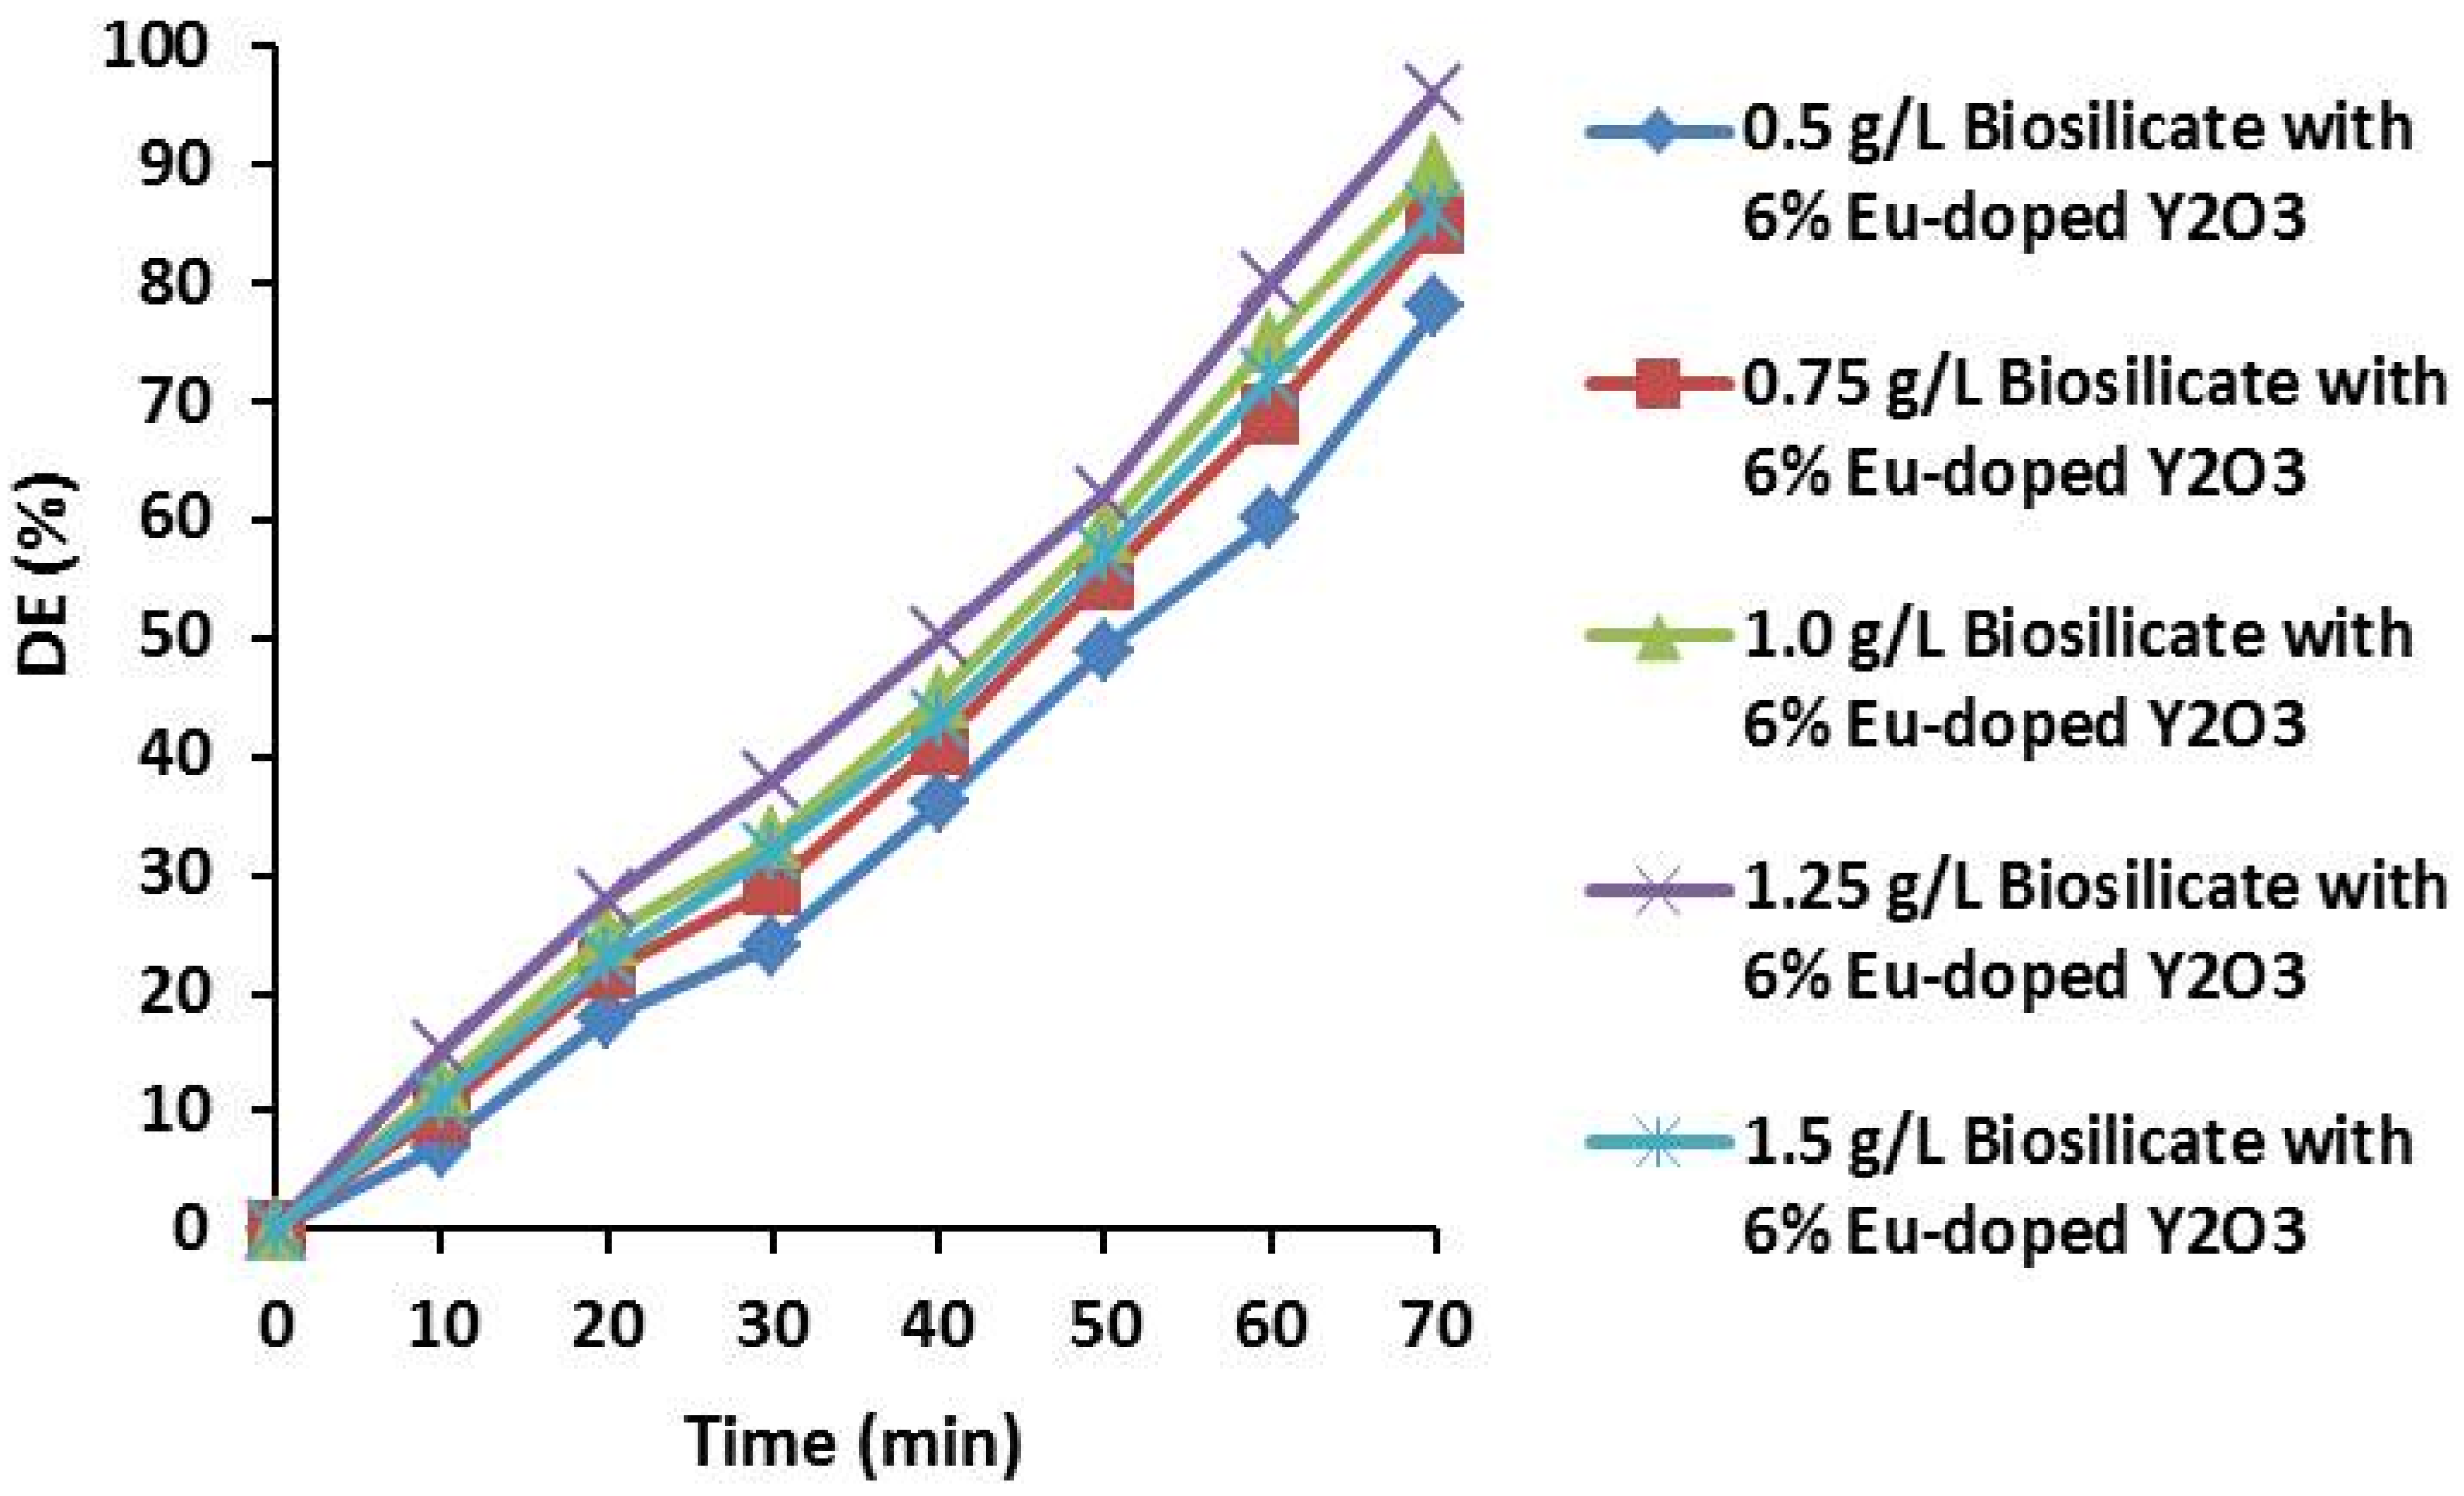
3.5. The Amount of Catalyst Effect

The effect of catalyst value on the removal percentage of RB 19 is seen in Figure 16. The sonication period and primary dye concentration were 70 min and 20 mg/L, respectively. At concentration of 0.5, 0.75, 1.0, 1.25 and 1.5 g/L, the color removal ratio was 78.43, 85.92, 90.76 and 96.45%, sequentially. The DE% increased from 0.5 to 1.25 g/L, and then reduced. This could be explained by the aggregation of catalyst beyond 1.25 g/L which led to reducing ultrasound scattering and decreasing the number of active sites [7,17].

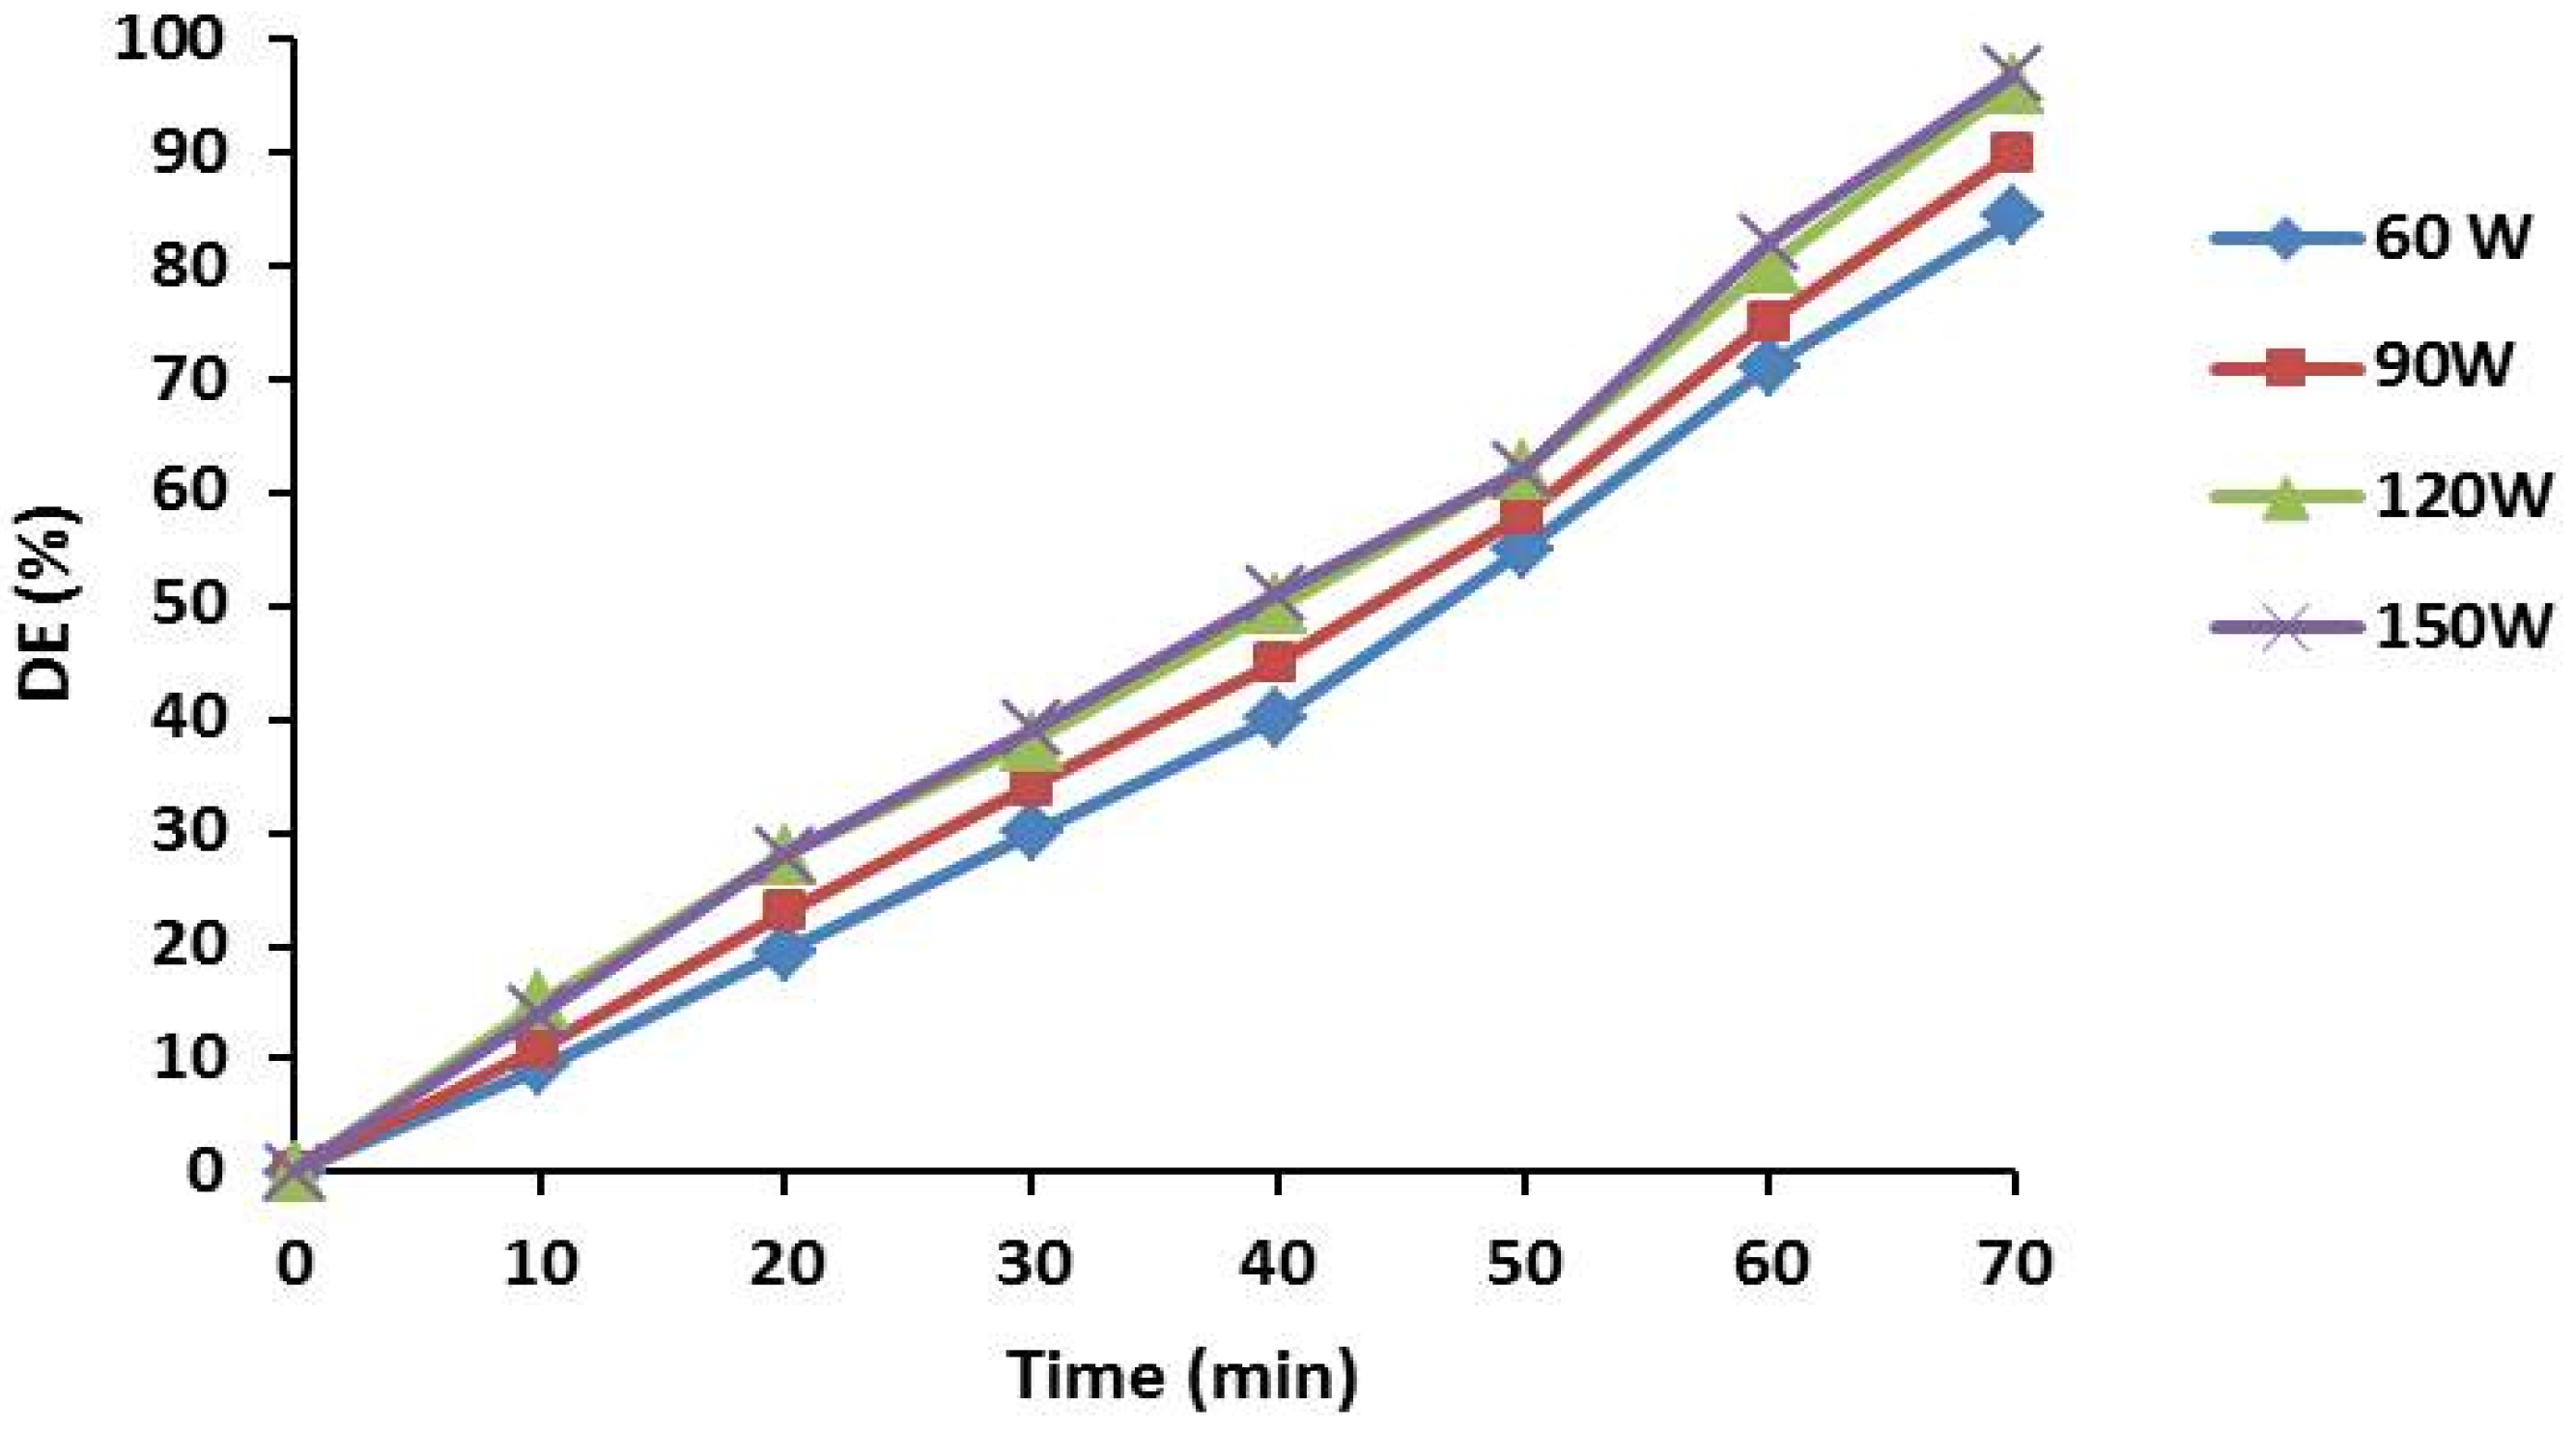
3.6. Effect of Sonication Energy

The decolorization percent of RB19 under different ultrasonic power in the range 60 to 150 W was also investigated. Employing the 50 to 150 W/L sonication power, the degradation percentage is increased from 84.17% to 96.45% (Figure 17). Enhanced degradation ratio was achieved through increasing the ultrasonic power which the production of •OH radicals increases. Moreover, the disturbance of the solution was elevated with significant power and accordingly promotes the mass transfer rate of dye, reactive species and intermediates between catalyst’s surface and the bulk solution [51]. In order to save energy, the experiments set on 120 W due to slight contrast of degradation percentage between 120 and 150 W.

3.7. Photocatalyst Recycling and Photostability

Figure 18 displays the reusability of diatomite coated 6% Eu-doped yttrium oxide, which was tested at a reaction period of 70 min, a dye concentration of 20 mg/L and 1.25 g/L of catalyst powder. These settings are the optimum operational parameters values verified through experiments. After five continuous tests, the reduction in the sono-photocatalytic procedure was slight, which validates the prepared particles’ high potential stability and reusability.
In comparison to other routine semiconductors such as TiO2, ZnO, CdS, etc., Eu-doped Y2O3 coated-diatom displays astonishing photocatalytic activity toward degradation of organic dye. It is notable that the time of degradation process is 70 min and the decolorization efficiency is over 90 percent competing with previous ordinary catalysts.

4. Conclusions

Europium-doped Y2O3-coated diatomite nanomaterials were prepared via facile hydrothermal route and employed for degradation of reactive blue 19 in an aqueous solution. Substitution of Eu3+ into yttrium oxide lattice led to a redshift in absorbance spectra and reduction of bandgap respectively. The PL spectra of as-prepared Eu-doped Y2O3 coated diatomite are composed of 5D07FJ transitions. The decolorization effectiveness of the as-synthesized compounds was much bigger in sono-photocatalytic procedure than that of other routes. 6% Eu3+-incorporated Y2O3 coated diatom exhibits the best degradation ratio. Radical scavengers reduce the sonophotocatalytic degradation percentage of R B 19 particularly subject to 1,4 benzoquinone. The results revealed that diatomite coated with Eu3+-incorporated yttrium oxide nanoparticle can be employed in numerous experimental runs with no notable drop in photocatalytic performance.

Supplementary Materials

The following are available online at https://0-www-mdpi-com.brum.beds.ac.uk/article/10.3390/inorganics9120088/s1, Figure S1: XRD pattern of diatom-coated with 6% Eu-doped Y2O3 nanoparticles; Figure S2: SEM image of 2% Eu-doped Y2O3 coated biosilica; Figure S3: SEM image of 8% Eu-doped Y2O3 coated biosilica; Figure S4: TEM image of 2% Eu-doped Y2O3-coated diatomite; Figure S5: TEM image of 8% Eu-doped Y2O3-coated diatomite; Figure S6: EDX spectra of 2% Eu-doped Y2O3-coated diatomite; Figure S7: EDX spectra of 2% Eu-doped Y2O3-coated diatomite; Figure S8: Schematic band-gap model for the luminescence of Eu3+ doped in Y2O3.

Author Contributions

Y.H., supervision, writing—review and editing; M.A. formal analysis; and S.W.J., project administration and editing. All authors have read and agreed to the published version of the manuscript.

Funding

This work was funded by the grant NRF-2019R1A5A8080290 of the National Research Foundation of Korea.

Acknowledgments

The authors thank the Core Research Support Center for Natural Products and Medical Materials (CRCNM) of Yeungnam University for technical support (XRD, EDX, SEM, TEM and PL analyses).

Conflicts of Interest

The authors declare no conflict of interest.

References

  1. Hanifehpour, Y.; Soltani, B.; Amani-Ghadim, A.R.; Hedayati, B.; Khomami, B.; Joo, S.W. Synthesis and characterization of samarium-doped ZnS nanoparticles: A novel visible light responsive photocatalyst. Mater. Res. Bull. 2016, 76, 411. [Google Scholar] [CrossRef]
  2. Ahmed, S.; Rasul, M.G.; Martens, W.N.; Brown, R.; Hashib, M.A. Heterogeneous photocatalytic degradation of phenols in wastewater: A review on current status and developments. Desalination 2010, 261, 3. [Google Scholar] [CrossRef] [Green Version]
  3. Yuan, B.; Wang, Y.; Bian, H.; Shen, T.; Wu, Y.; Chen, Z. Nitrogen doped TiO2 nanotube arrays with high photoelectrochemical activity for photocatalytic applications. Appl. Surf. Sci. 2013, 280, 523. [Google Scholar] [CrossRef]
  4. Daghrir, R.; Drogui, P.; Delegan, N.; El Khakani, M.A. Electrochemical degradation of chlortetracycline using N-doped Ti/TiO2 photoanode under sunlight irradiations. Water Res. 2013, 47, 6801. [Google Scholar] [CrossRef]
  5. Giannakis, S.; Andrew Lin, K.-Y.; Ghanbari, F. A review of the recent advances on the treatment of industrial wastewaters by Sulfate Radical-based Advanced Oxidation Processes (SR-AOPs). Chem. Eng. J. 2021, 406, 127083. [Google Scholar] [CrossRef]
  6. Karim, A.V.; Hassani, A.; Eghbali, P.; Nidheesh, P.V. Nanostructured modified layered double hydroxides (LDHs)-based catalysts: A review on synthesis, characterization, and applications in water remediation by advanced oxidation processes. Curr. Opin. Solid State Mater. Sci. 2022, 26, 100965. [Google Scholar] [CrossRef]
  7. Khataee, A.; Karimi, A.; Arefi-oskoui, S.; Darvishi, R.; Soltani, C.; Hanifehpour, Y.; Soltani, B.; Joo, S.W. Sonochemical synthesis of Pr-doped ZnO nanoparticles for sonocatalytic degradation of Acid Red 17. Ultrason. Sonochem. 2015, 22, 371. [Google Scholar] [CrossRef] [PubMed]
  8. Eskandarloo, H.; Badiei, A.; Behnajady, M.A.; Ziarani, G.M. Ultrasonic-assisted sol–gel synthesis of samarium, cerium co-doped TiO2 nanoparticles with enhanced sonocatalytic efficiency. Ultrason. Sonochem. 2015, 26, 281. [Google Scholar] [CrossRef]
  9. Khataee, A.; Karimi, A.; Darvishi, R.; Soltani, C.; Safarpour, M.; Hanifehpour, Y.; Joo, S. Europium-doped ZnO as a visible light responsive nanocatalyst: Sonochemical synthesis, characterization and response surface modeling of photocatalytic process. Appl. Catal. A Gen. 2014, 488, 160. [Google Scholar] [CrossRef]
  10. Savun-Hekimoğlu, B.; Ince, N.H. Optimization of Methylparaben Degradation by Sonocatalysis. Ultrason. Sonochem. 2019, 58, 104623. [Google Scholar] [CrossRef]
  11. Fan, G.; Yang, S.; Du, B.; Luo, J.; Lin, X.; Li, X. Sono-photo hybrid process for the synergistic degradation of levofloxacin by FeVO4/BiVO4: Mechanisms and kinetics. Environ. Res. 2022, 204, 112032. [Google Scholar] [CrossRef] [PubMed]
  12. Al-Musawi, T.J.; McKay, G.; Rajiv, P.; Mengelizadeh, N.; Balarak, D. Efficient sonophotocatalytic degradation of acid blue 113 dye using a hybrid nanocomposite of CoFe2O4 nanoparticles loaded on multi-walled carbon nanotubes. J. Photochem. Photobiol. A Chem. 2021, 424, 113617. [Google Scholar] [CrossRef]
  13. Saharan, P.; Chaudhary, G.R.; Lata, S.; Mehta, S.K.; Mor, S. Ultra fast and effective treatment of dyes from water with the synergistic effect of Ni doped ZnO nanoparticles and ultrasonication. Ultrason. Sonochem. 2015, 22, 317. [Google Scholar] [CrossRef]
  14. Villaroel, E.; Silva-Agredo, J.; Petrier, C.; Taborda, G.; Torres-Palma, R.A. Ultrasonic degradation of acetaminophen in water: Effect of sonochemical parameters and water matrix. Ultrason. Sonochem. 2014, 21, 1763. [Google Scholar] [CrossRef]
  15. Bansal, P.; Chaudhary, G.R.; Mehta, S.K. Comparative study of catalytic activity of ZrO2 nanoparticles for sonocatalytic and photocatalytic degradation of cationic and anionic dyes. Chem. Eng. J. 2015, 280, 475. [Google Scholar] [CrossRef]
  16. Chakma, S.; Moholkar, V.S. Investigation in mechanistic issues of sonocatalysis and sonophotocatalysis using pure and doped photocatalysts. Ultrason. Sonochem. 2015, 22, 287. [Google Scholar] [CrossRef] [PubMed]
  17. Anju, S.G.; Yesodharan, S.; Yesodharan, E.P. Zinc oxide mediated sonophotocatalytic degradation of phenol in water. Chem. Eng. J. 2012, 84, 189–190. [Google Scholar] [CrossRef]
  18. Khataee, A.; Saadi, S.; Safarpour, M.; Joo, S.W. Sonocatalytic performance of Er-doped ZnO for degradation of a textile dye . Ultrason. Sonochem. 2015, 27, 379. [Google Scholar] [CrossRef]
  19. Khataee, A.; Soltani, R.D.C.; Karimi, A.; Joo, S.W. Sonocatalytic degradation of a textile dye over Gd-doped ZnO nanoparticles synthesized through sonochemical process. Ultrason. Sonochem. 2015, 23, 219. [Google Scholar] [CrossRef]
  20. Agdi, K.; Bouaid, A.; Esteban, A.M.; Hernando, P.F.; Azmani, A.; Camara, C. Removal of atrazine and four organophosphorus pesticides from environmental waters by diatomaceous earth-remediation method. J. Environ. Monit. 2000, 2, 420. [Google Scholar] [CrossRef]
  21. Alvarez, E.; Blanco, J.; Avila, P.; Knapp, C. Activation of monolithic catalysts based on diatomaceous earth for sulfur dioxide oxidation. Catal. Today 1999, 53, 557. [Google Scholar] [CrossRef]
  22. Li, F.; Xing, Y.; Huang, M.; Li, K.L.; Yu, T.T.; Zhang, Y.X.; Losic, D. MnO2 nanostructures with three-dimensional (3D) morphology replicated from diatoms for high-performance supercapacitors. J. Mater. Chem. A 2015, 3, 7855. [Google Scholar] [CrossRef]
  23. Wilk, G.D.; Wallace, R.M.; Anthony, J.M. High-κ gate dielectrics: Current status and materials properties considerations. J. Appl. Phys. 2001, 89, 5243. [Google Scholar] [CrossRef]
  24. Basavegowda, N.; Mishra, K.; Raju, S.; Thombal, K.; Kaliraj, Y.R.; Lee, Y.R. Sonochemical Green Synthesis of Yttrium Oxide (Y2O3) Nanoparticles as a Novel Heterogeneous Catalyst for the Construction of Biologically Interesting 1,3-Thiazolidin-4-ones. Catal. Lett. 2017, 147, 2630–2639. [Google Scholar] [CrossRef]
  25. Alford, N.M.; Birchall, J.D.; Clegg, W.J.; Harmer, M.A.; Kendall, K.; Jones, D.H. Physical and mechanical properties of YBa2Cu3O7-δ superconductors. J. Mater. Sci. 1988, 23, 761. [Google Scholar] [CrossRef]
  26. Hu, C.; Xiang, W.; Chen, P.; Li, Q.; Xiang, R.; Zhou, L. Influence of Y2O3 on densification, flexural strength and heat shock resistance of cordierite-based composite ceramics. Ceram. Int. 2021, 48, 74–81. [Google Scholar] [CrossRef]
  27. Brahme, N.; Gupta, A.; Prasad Bisen, D.; Kher, R.S.; Dhoble, S.J. Thermoluminescence and mechanoluminescence of Eu doped Y2O3 nanophosphors. Phys. Procedia 2012, 29, 97–103. [Google Scholar] [CrossRef] [Green Version]
  28. Shin, W.G.; Park, M.; Kim, J.; Joo, S.W.; Cho, I.; Sohn, Y. Photoluminescence imaging of Eu (III) doped Y2O3 nanorods on a Si substrate deposited by an electrospray technique. Thin Solid Films 2014, 565, 293–299. [Google Scholar] [CrossRef]
  29. Kostyukov, A.I.; Snytnikov, V.N.; Snytnikov, V.N.; Ishchenko, A.V.; Rakhmanova, M.I.; Molokeev, M.S.; Krylov, A.S.; Aleksandrovsky, A.S. Luminescence of monoclinic Y2O3: Eu nanophosphor produced via laser vaporization. Opt. Mater. 2020, 104, 109843. [Google Scholar] [CrossRef]
  30. Eid, J.; Pierre, A.C.; Baret, G. Preparation and characterization of transparent Eu doped Y2O3 aerogel monoliths, for application in luminescence. J. Non Cryst. Solids 2005, 351, 218–227. [Google Scholar] [CrossRef]
  31. Lee, M.; Oh, S.; Yi, S. Preparation of Eu-doped Y2O3 luminescent nanoparticles in nonionic reverse microemulsions. J. Colloid Interface Sci. 2000, 226, 65–70. [Google Scholar] [CrossRef]
  32. Mariscal-Becerra, L.; Vazquez-Arregu ın, R.; Balderas, U.; Carmona-Tellez, S.; Murrieta Sanchez, H.; Falcony, C. Luminescent characteristics of layered yttrium oxide nano-phosphors doped with europium. J. Appl. Phys. 2017, 121, 125111. [Google Scholar] [CrossRef]
  33. Lamiri, L.; Guerbous, L.; Samah, M.; Boukerika, A.; Ouhenia, S. Structural, morphological and steady state photoluminescence spectroscopy studies of red Eu3+-doped Y2O3 nanophosphors prepared by the sol-gel method. Luminescence 2015, 30, 1336–1343. [Google Scholar] [CrossRef]
  34. Hanifehpour, Y.; Soltani, B.; Amani-Ghadim, A.; Hedayati, B.; Khomami, B.; Joo, S.W. Praseodymium-doped ZnS nanomaterials: Hydrothermal synthesis and characterization with enhanced visible light photocatalytic activity. J. Ind. Eng. Chem. 2016, 34, 41. [Google Scholar] [CrossRef]
  35. Khataee, A.; Khataee, A.; Fathinia, M.; Hanifehpour, Y.; Joo, S.W. Kinetics and Mechanism of Enhanced Photocatalytic Activity under Visible Light Using Synthesized PrxCd1–xSe Nanoparticles. Ind. Eng. Chem. Res. 2013, 52, 13357. [Google Scholar] [CrossRef]
  36. Hamnabard, N.; Hanifehpour, Y.; Khomami, B.; Joo, S.W. Synthesis, characterization and photocatalytic performance of Yb-doped CdTe nanoparticles. Mater. Lett. 2015, 145, 253. [Google Scholar] [CrossRef]
  37. Panwar, S.; Upadhyay, G.K.; Purohit, L.P. Gd-doped ZnO: TiO2 heterogenous nanocomposites for advance oxidation process. Mater. Res. Bull. 2022, 145, 11534. [Google Scholar] [CrossRef]
  38. Keerthana, S.P.; Yuvakkumar, R.; Ravi, G.; Al-Sehemi, A.G.; VelauthapillaI, D. Synthesis of pure and lanthanum-doped barium ferrite nanoparticles for efficient removal of toxic pollutants. J. Hazard. Mater. 2021, 424, 127604. [Google Scholar] [CrossRef] [PubMed]
  39. Kumar, Y.; Pal, M.; Herrera, M.; Mathew, X. Effect of Eu ion incorporation on the emission behavior of Y2O3 nanophosphors: A detailed study of structural and optical properties. Opt. Mater. 2016, 60, 159–168. [Google Scholar] [CrossRef]
  40. Bakovets, V.V.; Yushina, I.V.; Antonova, O.V.; Pomelova, T.A. Correction of the band gap of Y2O3: Eu3+ phosphor. Opt. Spectrosc. 2016, 121, 862–866. [Google Scholar] [CrossRef]
  41. Wang, W.; Zhu, P. Red photoluminescent Eu3+-doped Y2O3 nanospheres for LED-phosphor applications: Synthesis and characterization. Opt. Express 2018, 26, 34820. [Google Scholar] [CrossRef] [PubMed]
  42. Qipeng, L.; Yanbing, H.; Aiwei, T.; Zhihui, F.; Feng, T.; XiaoJun, L. Synthesis and Characterization of Y2O3: Er3+ Upconversion Materials with Nanoporous Structures. J. Nanosci. Nanotechnol. 2011, 11, 9671–9675. [Google Scholar] [CrossRef]
  43. Phan, T.; Phan, M.; Vu, N.; Anh, T.; Yu, S.C. Luminescent properties of Eu-doped Y2O3 nanophosphors. Phys. Status Solid A 2004, 201, 2170–2174. [Google Scholar] [CrossRef]
  44. Daneshvar, H.; Seyed Dorraji, M.S.; Amani-Ghadim, A.R.; Rasoulifard, M.H. Enhanced sonocatalytic performance of ZnTi nano-layered double hydroxide by substitution of Cu (II) cations. Ultrason. Sonochem. 2019, 58, 104632. [Google Scholar] [CrossRef] [PubMed]
  45. Seyed Dorraji, M.S.; Amani-Ghadim, A.R.; Rasoulifard, M.H.; Daneshvar, H.; Sistani Zadeh Aghdam, B.; Tarighati, A.R.; Hosseini, S.F. Photocatalytic activity of g-C3N4: An empirical kinetic model, optimization by neuro-genetic approach and identification of intermediates. Chem. Eng. Res. Des. 2017, 127, 113–125. [Google Scholar] [CrossRef]
  46. Alemi, A.; Hanifehpour, Y.; Joo, S.W.; Min, B.-K. Synthesis of novel LnxSb2−xSe3 (Ln: Lu3+, Ho3+, Nd3+) nanomaterials via co-reduction method and investigation of their physical properties. Colloids. Surf. A Physicochem. Eng. Asp. 2011, 390, 142. [Google Scholar] [CrossRef]
  47. Alemi, A.; Hanifehpour, Y.; Joo, S.W.; Khandar, A.; Morsali, A.; Min, B. Co-reduction synthesis of new LnxSb2−xSe3 (Ln: Nd3+, Lu3+, Ho3+) nanomaterials and investigation of their physical properties. Phys. B 2011, 406, 2801–2806. [Google Scholar] [CrossRef]
  48. Lide, D.R. CRC Handbook of Chemistry and Physics; Taylor & Francis: Boca Raton, FL, USA, 2006. [Google Scholar]
  49. Korake, P.V.; Kadam, A.N.; Garadkar, K.M. Photocatalytic activity of Eu3+-doped ZnO nanorods synthesized via microwave assisted technique. J. Rare Earths 2014, 32, 306. [Google Scholar] [CrossRef]
  50. Pang, Y.L.; Abdullah, A.Z.; Bhatia, S. Review on sonochemical methods in the presence of catalysts and chemical additives for treatment of organic pollutants in wastewater. Desalination 2011, 277, 1. [Google Scholar] [CrossRef]
  51. Hou, L.; Zhang, H.; Wang, L.; Chen, L. Ultrasound-enhanced magnetite catalytic ozonation of tetracycline in water. Chem. Eng. J. 2013, 229, 577. [Google Scholar] [CrossRef]
Figure 1. The PXRD pattern of diatomite (a), Y2O3 (b) and diatom-coated with 8%-Eu doped Y2O3 (c) nanoparticles.
Inorganics 09 00088 g001
Figure 2. The lattice constant of EuxY2-xO3 (x = 0 to 0.08) dependent upon Eu3+ doping on Y3+ sites.
Inorganics 09 00088 g002
Figure 3. SEM images of natural diatomite (a), 6% Eu-doped Y2O3 (b) and 6% Eu-doped Y2O3-coated diatomite at different magnification (c,d).
Inorganics 09 00088 g003
Figure 4. (a) TEM image, (b) SAED pattern, (c,d) HRTEM images at different magnifications of 6% Eu-doped Y2O3-coated diatomite.
Inorganics 09 00088 g004
Figure 5. EDX spectra of diatom coated with 6% Eu-doped Y2O3 nanoparticles. (a) elemental mapping; (b) XRD.
Inorganics 09 00088 g005
Figure 6. (a) Absorbance spectra and (b) Tauc plot of diatom coated with Y2O3 (a), 4% Eu-doped Y2O3 (b), 6% Eu-doped Y2O3 (c), 8%Eu-doped Y2O3 (d) at room temperature.
Inorganics 09 00088 g006
Figure 7. The PL spectra of (a) diatom coated with 6% Eu-doped Y2O3 and (b) 8% Eu-doped Y2O3.
Inorganics 09 00088 g007
Figure 8. Adsorption–desorption isotherm of nitrogen for diatomite (a) and diatom coated with 6% Eu-doped Y2O3 (b).
Inorganics 09 00088 g008
Figure 9. Comparison of different catalytic processes in decolorization of reactive blue 19, [Dye] = 20 mg/L, [Catalyst] = 1.25 g/L, pH = 6.
Inorganics 09 00088 g009
Figure 10. The spectrum of the lamp used for catalytic process.
Inorganics 09 00088 g010
Figure 11. First-order kinetic plot for sono-photocatalytic, sonocatalytic and photocatalytic processes, [Dye] = 20 mg/L, [Catalyst] = 1.25 g/L, pH = 6.
Inorganics 09 00088 g011
Figure 12. The effects of various scavengers on decolorizing of reactive blue 19, [Dye] = 20 mg/L, [Catalyst] = 1.25 g/L, pH = 6, [Scavenger] = 5 mM.
Inorganics 09 00088 g012
Figure 13. The decolorization of RB19 with different Eu3+ content, [Dye] = 20 mg/L, [Catalyst] = 1.25 g/L, pH = 6.
Inorganics 09 00088 g013
Figure 14. Degradation of Reactive blue 19 under ultrasonic irradiation using diatomite coated with 6% Eu-doped yttrium oxide.
Inorganics 09 00088 g014
Figure 15. RB 19 concentration influence on degradation efficiency, [Catalyst] = 1.25 g/L, pH = 6.
Inorganics 09 00088 g015
Figure 16. Influence of diatomite coated 6% Eu-doped Y2O3 concentration on the decolorization of RB19, [Dye] = 20 mg/L, pH = 6.
Inorganics 09 00088 g016
Figure 17. Ultrasound power effect on the degrading RB 19 by diatomite coated 6% Eu-doped Y2O3. [Catalyst] = 1.25 g/L, pH = 6 and [dye] = 20 mg/L.
Inorganics 09 00088 g017
Figure 18. Reusability of the diatomite coated 6% Eu-doped yttrium oxide nanostructures within five runs. [Catalyst] = 1.25 g/L, [dye] = 20 mg/L, pH = 6 and the reaction time = 70 min.
Inorganics 09 00088 g018
Table 1. The characteristics of C.I. reactive blue 19.
Chemical Structure Inorganics 09 00088 i001
Color index nameReactive Blue 19
Molecular formulaC22H16N2Na2O11S3
Color index number219-949-9
λmax (nm)592
Mw (g/mol)626.54
Table 2. The atomic percent of 6% Eu-doped Y2O3-coated diatomite.
ElementLine Typewt%Atomic %Factory Standard
OK series55.5069.38Yes
SiK series39.5028.27Yes
YL series3.882.21Yes
EuM series1.120.14Yes
Total: 100.00100.00
Table 3. Bandgap energy of diatom coated with Eu-doped Y2O3 nanostructures.
SampleBand Gap (eV)
Diatom coated with Y2O34.94
diatom coated with 4% Eu-doped Y2O34.73
diatom coated with 6% Eu-doped Y2O34.64
diatom coated with 8% Eu-doped Y2O34.53
Publisher’s Note: MDPI stays neutral with regard to jurisdictional claims in published maps and institutional affiliations.

