Next Article in Journal
Vector Transmission of Tomato Yellow Leaf Curl Thailand Virus by the Whitefly Bemisia tabaci: Circulative or Propagative?
Next Article in Special Issue
Organic Farming and Cover-Crop Management Reduce Pest Predation in Austrian Vineyards
Previous Article in Journal
Unraveling the Mode of Action of Cordyceps fumosorosea: Potential Biocontrol Agent against Plutella xylostella (Lepidoptera: Plutellidae)
Previous Article in Special Issue
Mutual and Opposing Responses of Carabid Beetles and Predatory Wasps to Local and Landscape Factors in Vineyards
 
 
Comment published on 26 July 2021, see Insects 2021, 12(8), 671.
Article

Unexpected Effects of Local Management and Landscape Composition on Predatory Mites and Their Food Resources in Vineyards

1
Institute of Plant Protection, University of Natural Resources and Life Sciences Vienna (BOKU), Gregor-Mendel-Straße 33, 1180 Vienna, Austria
2
Julius Kühn-Institute (JKI), Institute for Plant Protection in Fruit Crops and Viticulture, Geilweilerhof, 76833 Siebeldingen, Germany
*
Author to whom correspondence should be addressed.
Submission received: 20 January 2021 / Revised: 12 February 2021 / Accepted: 17 February 2021 / Published: 19 February 2021
(This article belongs to the Special Issue Improving Functional Biodiversity in Vineyards)

Abstract

:

Simple Summary

Sustainable agriculture becomes more important for biodiversity conservation and environmental protection. Viticulture is characterized by relatively high pesticide inputs, which could decrease arthropod populations and biological pest control in vineyards. This problem could be counteracted with management practices such as the implementation of diverse vegetation cover in the vineyard inter-rows, reduced pesticide input in integrated or organic vineyards, and a diverse landscape with trees and hedges. We examined the influence of these factors on predatory mites, which play a crucial role as natural enemies for pest mites on vines, and pollen as important alternative food source for predatory mites in 32 organic and integrated Austrian vineyards. Predatory mites benefited from integrated pesticide management and spontaneous vegetation cover in vineyard inter-rows. Pest mite populations were very low and sometimes completely absent on vines. This showed that agri-environmental schemes should consider less intensive pesticide use and spontaneous vegetation cover in the vineyard inter-row due to the beneficial effect on predatory mite populations and their related biological control potential in vineyards.

Abstract

Viticultural practices and landscape composition are the main drivers influencing biological pest control in vineyards. Predatory mites, mainly phytoseiid (Phytoseiidae) and tydeoid mites (Tydeidae), are important to control phytophagous mites (Tetranychidae and Eriophyidae) on vines. In the absence of arthropod prey, pollen is an important food source for predatory mites. In 32 paired vineyards located in Burgenland/Austria, we examined the effect of landscape composition, management type (organic/integrated), pesticide use, and cover crop diversity of the inter-row on the densities of phytoseiid, tydeoid, and phytophagous mites. In addition, we sampled pollen on vine leaves. Typhlodromus pyri Scheuten was the main phytoseiid mite species and Tydeus goetzi Schruft the main tydeoid species. Interestingly, the area-related acute pesticide toxicity loading was higher in organic than in integrated vineyards. The densities of phytoseiid and tydeoid mites was higher in integrated vineyards and in vineyards with spontaneous vegetation. Their population also profited from an increased viticultural area at the landscape scale. Eriophyoid mite densities were extremely low across all vineyards and spider mites were absent. Biological pest control of phytophagous mites benefits from less intensive pesticide use and spontaneous vegetation cover in vineyard inter-rows, which should be considered in agri-environmental schemes.

1. Introduction

Plant diversity at the local and landscape scale plays a crucial role for herbivorous pest species, natural enemies, and their interactions in agroecosystems [1,2,3]. Large crop monocultures in simple landscapes could promote pest outbreaks because of two main reasons: (1) food is not a limiting resource for herbivores, specialized to feed on the crop species in monocultures (i.e., resource concentration hypothesis), and (2) the lack of alternative food resources, oviposition sites, overwintering locations, and shelter for natural enemies hinder their permanent establishment in monocultures (i.e., natural enemy hypothesis) [2,4,5,6]. Thus, the nearly unlimited food resources and the lack of natural enemies constitute ideal conditions for specialized herbivores in such agroecosystems. In contrast, pest abundance might also be dependent on non-crop habitats as alternative food resources or for overwintering [7], which could limit the positive feedback of simple landscapes for pest outbreaks.
However, studies evaluating the natural enemy hypothesis [4,5] have provided divergent results—high plant diversity increased the abundance of natural enemies, resulting in lower pest densities in peach orchards and cacao agroforestry systems [8,9], whereas such positive plant diversity effects were not observed in annual crops such as squash and cabbage [10,11].
Along the same line, the predictions of the resource concentration hypothesis [4,5] were verified for the cereal leaf beetle [12], the turnip root fly [11], and the potato leafhopper [13], but not for the squash bug [10] or the Andean potato weevil [14]. The effects of large monocultures and alternative habitats at landscape scale on pests and their natural enemies seem to differ with regard to the respective crop system and the pest species [15]. One reason for the diverging results could be related to pest stochasticity, which could mask the positive effects of landscape complexity on pest outbreaks [16].
Viticulture is a perennial, monoculture crop system distributed on all continents but Antarctica [17], and is found in Mediterranean, oceanic, continental, and steppe climates [18]. In contrast to arable crops, vineyards are characterized by relatively large non-productive inter-rows whose vegetation may constitute diverse ecosystems [19,20]. The vegetation composition can vary greatly depending on vineyard management (differing in tillage intensity, herbicide use, mowing frequency, different cover crop mixtures, or spontaneous vegetation), soil type, and climatic conditions [20,21]. Vegetation management of vineyard inter-rows clearly influence biodiversity and ecosystem service provision in vineyards [22,23,24]. Decreasing management intensity with temporary or permanent vegetation cover in the inter-rows increases plant species richness [19,20], which is beneficial for insect–flower interactions [25] and results in diverse arthropod populations [26,27,28,29]. Native cover crops in particular enhance plant-dwelling arthropod diversity in vineyards compared to exotic cover crops [30].
Different pest species may significantly reduce grape quality and quantity beyond economic thresholds [31]. Therefore, biological control is an important factor to promote sustainable viticulture [17] and decrease the use of insecticides and acaricides in order to achieve the EU policy goal of halving pesticide use by 2030 [32]. It has been shown that landscape composition influences the effectiveness of natural enemies of some pest species. Diverse landscapes have reduced infestation of grape berry moth and insecticide applications in Spanish vineyards [16]. Similarly, mealybug and mite infestation decreased when the proportion of semi-natural habitats (SNHs) increased in the landscape [33]. Furthermore, surrounding SNHs harbor phytoseiid mites [34], which could disperse into nearby vineyards [35].
Spider mites (Acari: Tetranychidae) and eriophyoid mites (Acari: Eriophyidae) are important phytophagous mites in viticulture that can create problems in vineyards due to the loss of grape yield and quality [36]. The damage caused by spider mites are, e.g., leaf discoloration, loss of chlorophyll, and leaf drop, whereas eriophyoid mites cause, e.g., death of overwintering buds, blisters on vine leaves, and the development of lateral shoots [36]. Currently, there are no severe problems regarding phytophagous mites in Austrian viticulture. Compared to spider mite outbreaks in the second half of the 19th and 20th centuries, pest mite populations are nowadays often low in European vineyards, due to the biological control by predators such as phytoseiid mites (Acari: Phytoseiidae) [36]. Furthermore, some tydeoid mite species (Acari: Tydeidae) also prey on eriophyoid mites [37,38]. The successful establishment of stable generalist predatory mite populations on vines is important to maintain effective biological pest control, which is also dependent on alternative food resources such as other mite species [39] or pollen and fungi [39,40,41]. The nutritive species-specific value of pollen differs in relation to development and reproduction of phytoseiid mite species [42,43]. Pollen is also an important food source for tydeoid mites [44,45]. Inter-row vegetation [23] at the local scale and SNHs at the landscape scale provide these pollen resources during the vegetation period [46,47].
Natural enemy populations are strongly affected by pesticide use. Organic vineyards were found to exhibit higher population densities and species richness of phytoseiid mites compared with conventional vineyards in Italy [48] and Portugal [49]. Along the same line, organic vineyards had a higher abundance of arthropod predators compared to conventional vineyards in Italy [50] and also showed a higher and stable predation rate of the grape berry moth in France [51]. In organic viticulture, only inorganic and bio-pesticides are permitted (but no herbicides), whereas in conventional viticulture, a broad range of also synthetic pesticides can be applied [50]. It is considered that the choice of pesticides, their calculated toxicity loads [52], and the treatment frequency are major factors for natural enemy populations, including phytoseiid mites [53,54]. The treatment frequency index (TFI) does not take the toxicity of the sprayed products towards non-target organisms into account [33,55,56,57] and is related to the recommended product-specific dose, which could differ between European countries due to their division into climatic zones during the registration process of plant protection products [58]. The acute insecticide toxicity loading (AITL) tries to reflect toxicity loads on the basis of LD50 values for honeybees and environmental persistence of the active ingredients [59]. As this index is not related to the sprayed area, an area-related index needs to be calculated (for details, see Section 2.6. in the Material and Methods).
To the best of our knowledge, this is the first scientific article investigating the effects of two local management practices (pesticide and ground cover management) and landscape composition on predatory mites and their food sources (phytophagous mites and pollen) in vineyards. Furthermore, we calculated a novel area-related toxicity index for organic and integrated vineyards and compared it with another pesticide intensity index. Three main questions guided this article: (i) Which field or landscape scale parameters show the strongest effect on the densities of phytoseiid, tydeoid, and phytophagous mites? (ii) Does organic management, reduced pesticide input, or the use of species-rich cover crops increase predatory mite density and diversity? (iii) Does landscape diversity and a higher proportion of SNHs increase pollen availability, diversity, and consequently also phytoseiid mite densities in vineyards?

2. Materials and Methods
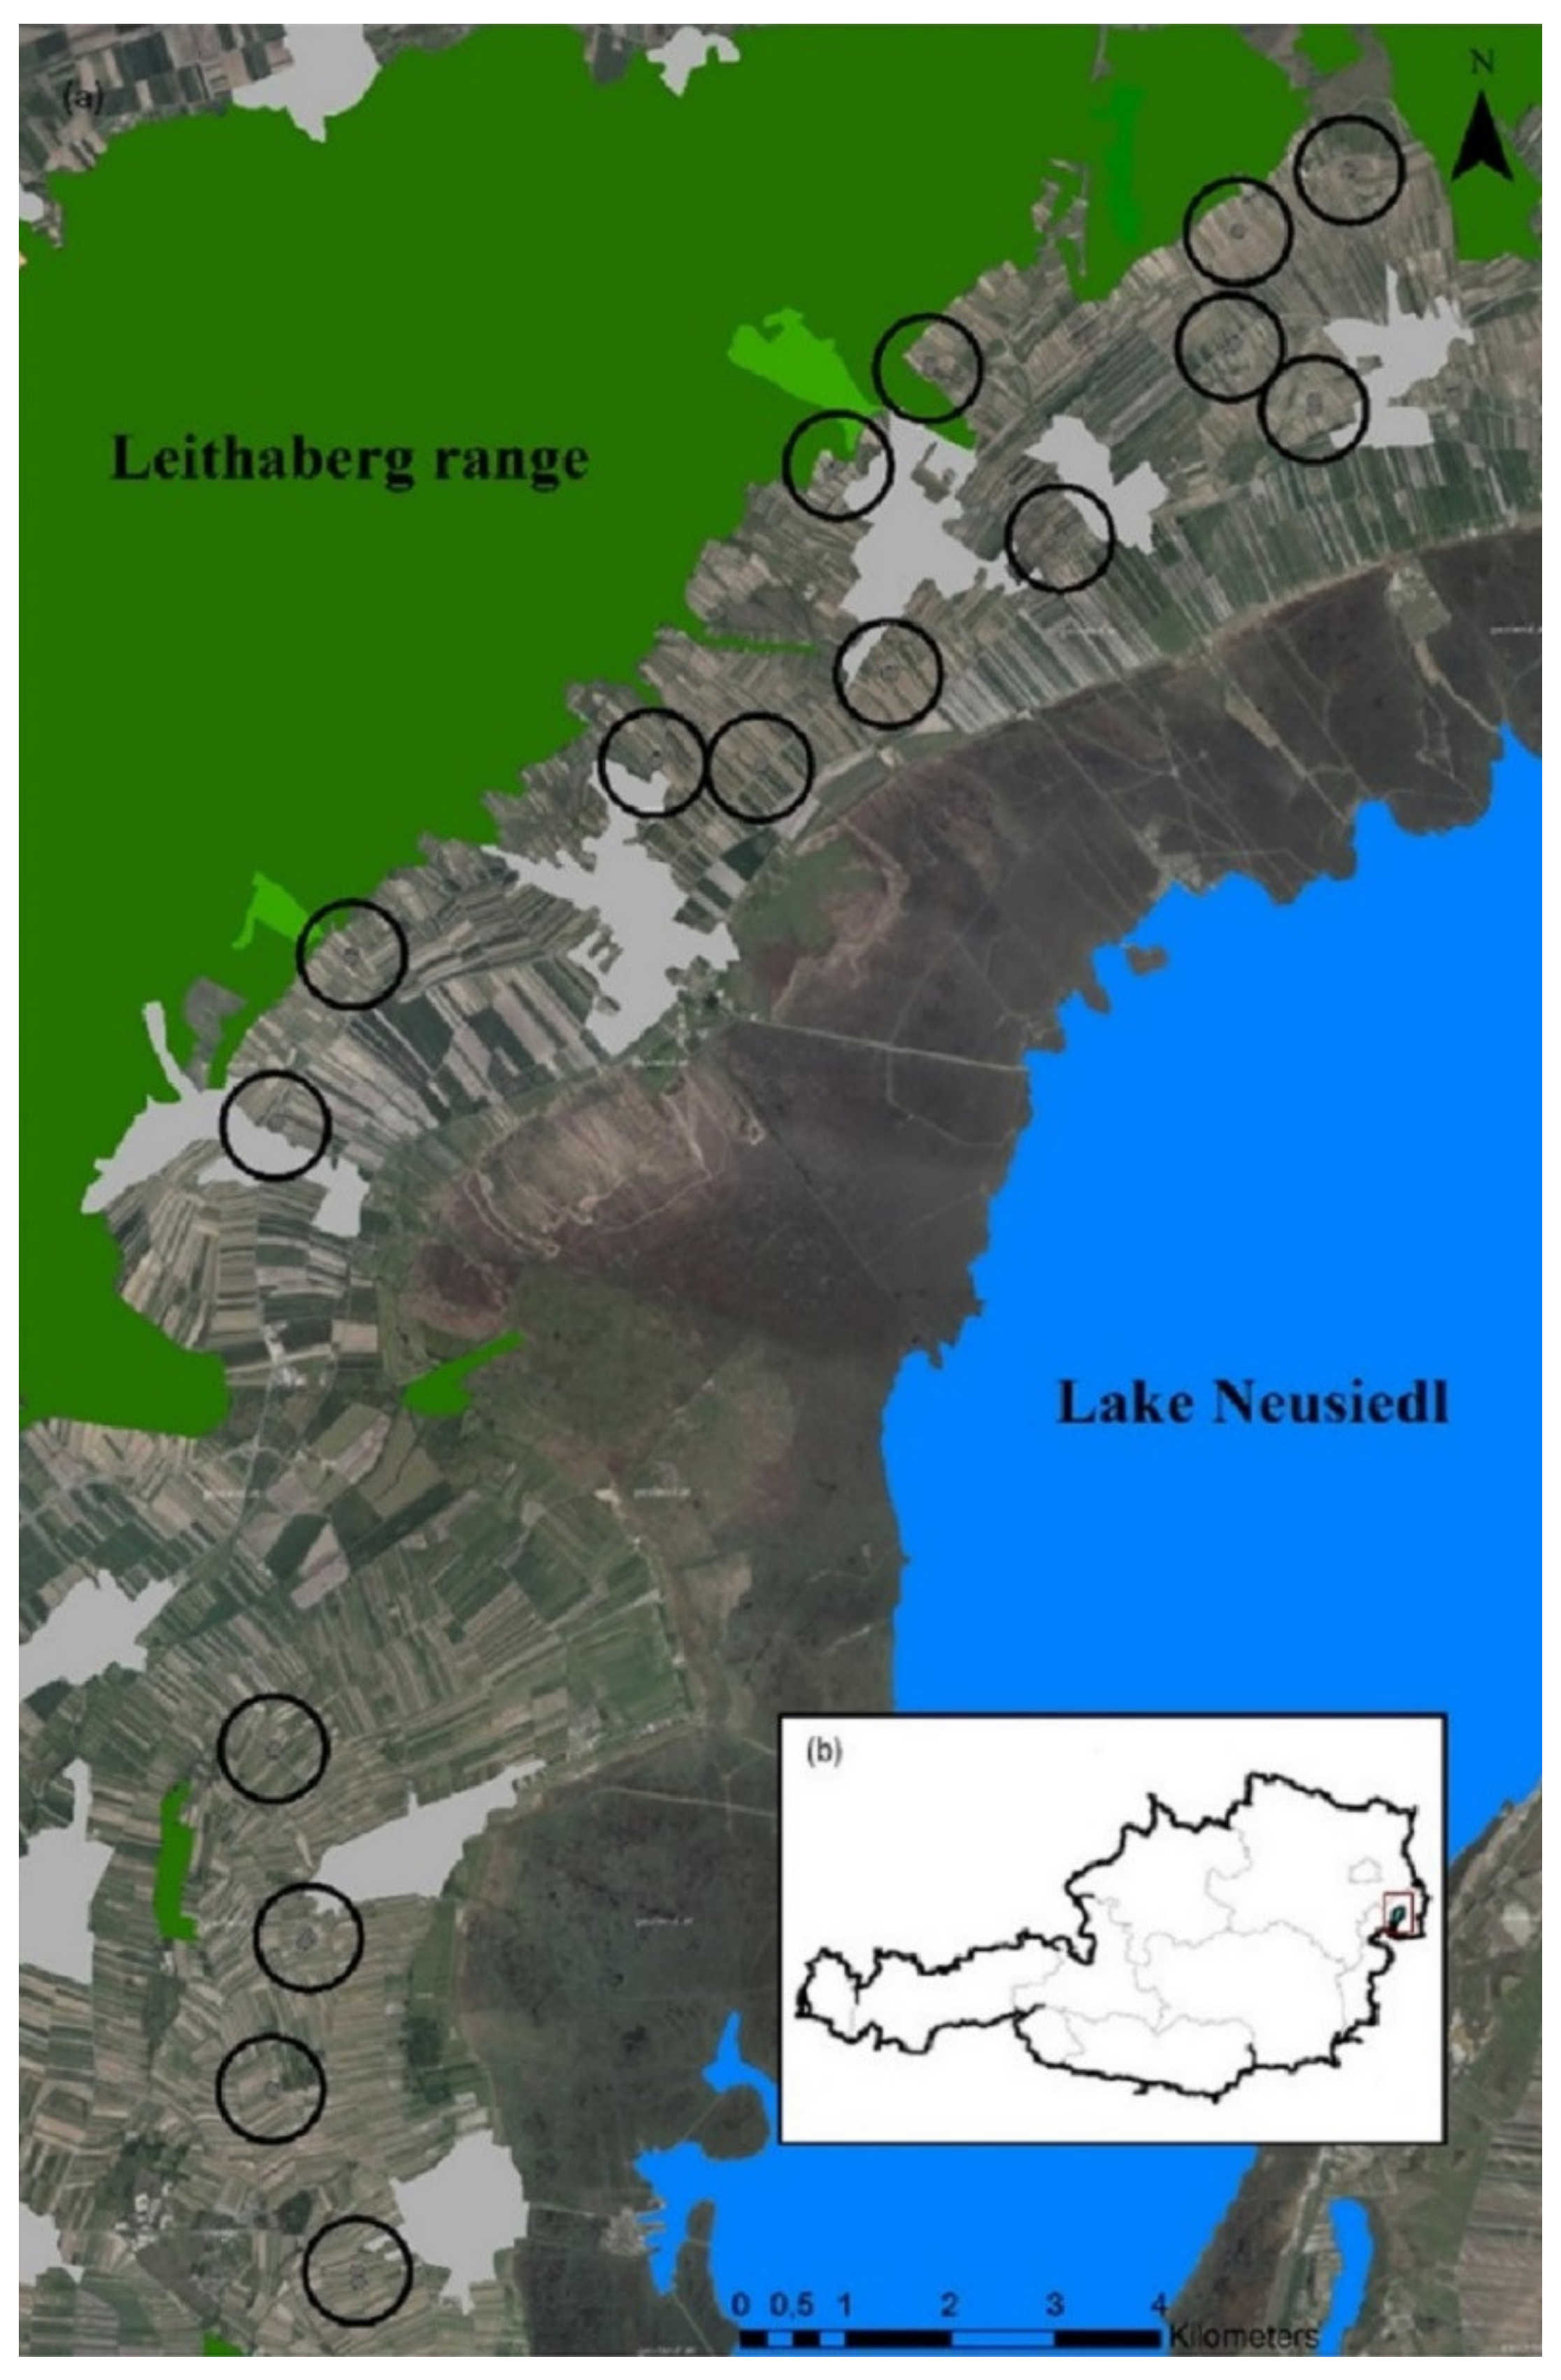
2.1. Study Sites

Overall, we selected 32 commercial vineyards, located in Burgenland (Austria) in the wine-growing region Leithaberg (47°54′55.2754″ N; 16°41′40.4453″ E) (Figure 1). The climate is warm temperate [18], the 10-year (2010–2019) average temperature was 11.6 °C, and total annual precipitation was 574 mm [60]. This region is characterized by a small-scaled mosaic of SNHs, vineyards, and arable fields. SNHs include meadow orchards, dry grasslands, fallows, woods, single trees, and hedges. Vineyards are situated on plain or hilly terrain and their scale is typically small (0.25–1.5 ha), long, and narrow, consisting only out of a few rows managed with the trellis system (2.25 × 0.9 m) with a trunk height of about 0.9 m. Vineyards are planted with a wide range of different white and red grapevine varieties.
Vineyards were selected according to three different criteria: (i) pairs of vineyards (maximum distance of 200 m) differing according to the farming system: organic and integrated vineyards (integrated vineyards are characterized by the implementation of integrated pest management practices with a focus on preventive measures to reduce the use of pesticides by considering the threshold of damage principle and by supporting natural enemies [17,36]) (see Table S1 for further information on applied active ingredients of organic and integrated vineyards); (ii) inter-row cover crop type: high diversity (20–34 species seeded), low diversity (4–9 species) cover crop mixtures, and spontaneous vegetation cover (no seeding of cover crops for at least 5 years); and (iii) the surrounding landscape composition differing in the proportion of SNHs, vineyards, and total agricultural area within a 500 m radius around each studied vineyard. Details on individual vineyard management practices (e.g., frequency and timing of tillage operations or pesticide applications, age of the vineyards) were gathered by personal interviews with all winegrowers on the basis of a structured questionnaire in 2019. We noted that during these interviews the winegrowers mentioned that Typhlodromus pyri Scheuten was released at a large scale at the Leithaberg vineyards around the 1990s and 2000s due to problems with spider mites. These applications were performed through an inoculation of the vineyards with textile strips or cut vine twigs from a donor vineyard, which already harbored T. pyri.

2.2. Mite Sampling

Mite sampling was conducted 5 times between May and August 2019 (7 May, 3 June, 1 July, 29 July, and 26 August) along a 30 m transect in each vineyard. The mites were sampled on vine leaves according to the protocol from Boller [62] and Hill and Schlamp [63] by randomly collecting 25 vine leaves from the whole canopy along the transect. The leaves were stored overnight in a refrigerator at +4 °C in a 2 L container that was filled with water and 1 mL of detergent. The leaves were then washed through a sieve tower with a 630 µm mesh sieve for the rough parts; 63 µm for predator, spider, and tydeoid mites; and 32 µm for the eriophyoid mites. The content from the second and third sieve were each washed onto filter paper with a Büchner funnel and dyed with methylene blue (Methylene blue, Merk, Darmstadt, Germany) and diluted 1:3 with tap water. The abundance was counted with a stereomicroscope (Leica M80, Wetzlar, Germany) at 25× magnification for phytoseiid, tydeoid, and spider mites at the family level [64,65]. Eriophyoid mites were counted at species level with 50× magnification [64,66]. Furthermore, phytoseiid and tydeoid mites were selected from the filter paper and mounted in Hoyer’s medium [67], and then species identification was carried out with a light microscope (Zeiss Axioplan 2 imaging, Oberkochen, Germany) at 200× and 400× magnification and phase contrast. Phytoseiid mites were identified after the identification key for Phytoseiidae from Tixier et al. [68] and tydeoid mites were identified with the key for Tydeidae from Da Silva et al. [37]. The leaf area of the vine leaves was measured after the extraction of the mites with a Li-COR Modell 3100 area meter (Lincoln, NE, USA) to calculate mite density per 100 cm2.

2.3. Pollen Sampling

Pollen samples were collected in parallel to the mite samples 5 times along the same 30 m transect. Per vineyard, 15 randomly chosen samples were collected according to the method from Addison et al. [69]. A 5 cm long stripe of invisible sticky tape was adhered onto the upper surface of grapevine leaves at the beginning of the petiole and centered on the mid-rib. A 19 × 19 mm square was cut out from each stripe and mounted with a glycerine (Glycerin Rotipuran, Roth, Karlsruhe, Germany) and fuchsin solution (Fuchsine basic (C.I. 42510) Roth, Karlsruhe, Germany) on slides to increase the contrast of the pollen grains [70]. The pollen grains were identified at family level with a key from Beug [71] and a light microscope (Nikon Optiphot 2, Tokyo, Japan) at 400× magnification. Due to similar morphological characteristics of the pollen grains, we merged the pollen types Amaranthaceae with Caryophyllaceae, and Moraceae were merged with Urticaceae. When it was not possible to identify the pollen grains at family level, we classified them as arboreal pollen (AP) or non-arboreal pollen (NAP). Non-identifiable pollen was categorized as NA (not able to identify). To reach a representative subsample, we used the method from Rossi et al. [72], counting the pollen grains with 200× magnification (Nikon Optiphot 2, Tokyo, Japan) on 4 equidistant transects [72], which were then extrapolated to pollen grain numbers per square centimeter.

2.4. Vegetation Survey

Vegetation surveys in the inter-rows of the vineyard transects were performed in spring (April) and summer (June–July) in four 1 m2 plots with approximately 6 m spacing between them. In each plot, the vegetation cover was recorded as a percentage according to the scale of Londo [73] (total vegetation cover). Vegetation cover data in spring and summer were then used for further analysis.

2.5. Landscape Survey

Landscape mapping was based on the EUNIS habitat type classification scheme [74] within a 500 m radius around each studied vineyard. This scale was selected on the basis of previous natural pest control studies of the project team and other studies (e.g., [75,76]). In addition, this radius also covers the distance for the aerial dispersal of different phytoseiid mite species ranging between 10 and 200 m [77,78]. Landscape configuration was mapped in the field on the basis of the existing information of the land utilization mapping from Burgenland, Austria [61], and was later digitized and analyzed with ArcGIS [79] and RStudio [80] with the R package “landscapemetrics” [81]. The landscape was aggregated into 14 habitat classes and summarized into 4 landscape parameters as percentages: proportion of woody SNHs (hedgerow, solitary trees, tree rows, and woodland), total SNHs (fallow, grassland, grass strip from field margins, and woody SNHs), vineyards, and total agriculture (vineyards and arable crops). Four additional habitat classes (artificial and constructed entities, ponds and rivers, roads, and yards) were not included in the statistical analysis. Additionally, we computed the minimum distance to the next woody SNHs (in m) and the Shannon’s landscape diversity index (SHDI) as explanatory variables for statistical modelling (Table S2). The parameter woody SNHs and distance to the next woody SNHs were calculated because phytoseiid mites could disperse from woody margins into vineyards [35].

2.6. Area-Related Acute Pesticide Contact Toxicity Loading (aAPTLc)

The spraying regimes of each vineyard built the basis for the calculation of our area-related acute pesticide contact toxicity loading (aAPTLc) for each vineyard, modified after DiBartolomeis et al. [59] with a difference in that we used a hazard quotient (HQ) for honeybees [82] for all used pesticides in order to refer to the field area (ha) and a different scaling factor, with the formula
a A P T L c = i = 1 n x i a m o u n t   o f   a p p l i e d   a c t i v e   i n g r e d i e n t   g / h a h o n e y   b e e   c o n t a c t   L D 50   µ g / b e e × h a l f l i f e   d a y s ln 2 ×   10 4
The number of applied active ingredients is indicated with n. Honeybee contact LD50 and half-life values (soil degradation in days) for each applied active ingredient were obtained through the Pesticide Properties Database (PPDB) [83] and the Bio-Pesticides Database (BPDB) [83]. The amount of the applied active ingredient (g/h) was calculated by multiplying the concentration (%) of the active ingredient for each pesticide product [84] with the applied dose of the product (g) at the field level (ha). A scaling factor of 10−4 was chosen for a better visual comparison of the aAPTLc values. Four (out of 38) active ingredients with missing values were excluded from the calculation. As we wanted to include the frequently applied potassium bicarbonate (especially in organic vineyards) for the aAPTLc calculation, despite the missing half-life value, we assumed the half-life of 7 days on the basis of expert knowledge and a registration report draft of a potassium bicarbonate product [85].
We could not calculate an aAPTLc on the basis of predatory mites due to lacking information of LR50 values for T. pyri for too many applied active ingredients (12 LR50 values out of 38 were missing). Therefore, we compared the aAPTLc with a specific categorical toxicity rating for phytoseiid mites. The categorical toxicity rating of the spraying regimes from all vineyards was calculated for the species T. pyri after Hassan [86]. For the calculation, we used the maximum harmful effect of the used active ingredients with a minor modification regarding the numerical scaling (scaling: harmless (<40% decrease of beneficial capacity) = 0.4, slightly harmful (40–80% decrease of beneficial capacity) = 0.8, and harmful (>80% decrease of beneficial capacity) = 1) according to the classification of the German plant protection register [87,88]. The categorical toxicity rating for T. pyri was then calculated for each vineyard through summing up the numerical scaled values from all applied active ingredients.

2.7. Data Analysis

The statistical analysis and visualization was performed with R version 3.6.3 [89] and R Studio [80] including the R package “FD” [90], “lattice” [91], “effects” [92,93], “stats” [89], “corrplot” [94], “lme4” [95], “MuMIn” [96], and “ggplot2” [97]. The densities of eriophyoid mite species were very low, and thus they were merged for each sampling date prior to statistical analysis. Exploration of the data (detection of outliers, homogeneity of the variance, collinearity, and distribution of the response variable) were performed according to Zuur et al. [98]. Due to the data type, detected outliers, and non-normal distribution of the residuals of the response variables, we transformed the data with log10 and before transformation, the value 1 was added (log10(y + 1)) [99,100,101]. The transformed data were only used for modelling but not for Figure 2. Explanatory variables with a collinearity of cor ≥ ±0.5 were not included in the same model. Generalized linear models (GLM with Gaussian distribution) [89] were chosen instead of the generalized linear mixed models (GLMM) because the inclusion of the random effect in the GLMMs—paired vineyards nested within landscape circles—resulted in very low variances, estimated at zero for the random effect, which leads to possible boundary problems in most models [102]. GLMs were computed to analyze which date, field (vineyard management, cover crops, aAPTLc, total number of pesticide applications (one application can consist of several different pesticides on the same application date), vegetation cover in spring and summer (Table 1)), and/or landscape parameters (proportion of SNHs, proportion of woody SNHs, proportion of vineyards, distance to nearest woody SNHs) affected phytoseiid, tydeoid, and eriophyoid mites and pollen densities. Additionally, for phytoseiid mites, the densities of tydeoid and eriophyoid mites and pollen were also included in the modelling process and for eriophyoid mites, phytoseiid mites were included. Furthermore, to measure the independency of predictors, we calculated the variance inflation factor (VIF) with the package “car” [92]. When VIF > 5, explanatory variables and their interactions were removed from GLMs due to high collinearity between explanatory variables [98,103]. For each variable, a set of 42 models were formulated by combining the non-collinear explanatory variables that were previously mentioned.
The selection of the most parsimonious model was based on the use of the second order Akaike Information Criterion corrected for small sample size (AICc) [104] from the package “AICcmodavg” [105]. We used a minimum difference between the most parsimonious models of Δi of 2 [106] to select the most parsimonious models [107].
Correlations between the aAPTLc and phytoseiid mite densities in relation to the sampling date, categorical toxicity rating for T. pyri and the phytoseiid mite densities, the total aAPTLc, and the categorical toxicity rating for T. pyri were tested with Spearman’s correlation [108,109] and the R package “psych” [110].
The pollen diversity data were split into 2 datasets corresponding to spring (sampling dates: 7 May and 3 June) and summer (sampling dates: 1 July, 29 July, and 26 August). A non-metric multidimensional scaling (NMDS) with the R package “vegan” [111] was chosen to examine main gradients of variation and show patterns of similarities between pollen communities on grapevine leaves of the investigated vineyards differing in cover crops [112]. The stress value was used to indicate a possible danger of false interpretation of the plots [113]. Field parameters (cover crop type; plant cover in spring and summer; and aggregated cover of Amaranthaceae, Asteraceae, Plantaginaceae, and Poaceae), landscape parameters (SHDI, minimum distance to next woody SNHs, proportion of SNHs, and proportion of total agriculture), and densities of phytoseiid mites were fitted onto the NMDS for the visualization of possible relations of important traits regarding to the community composition [114].

3. Results

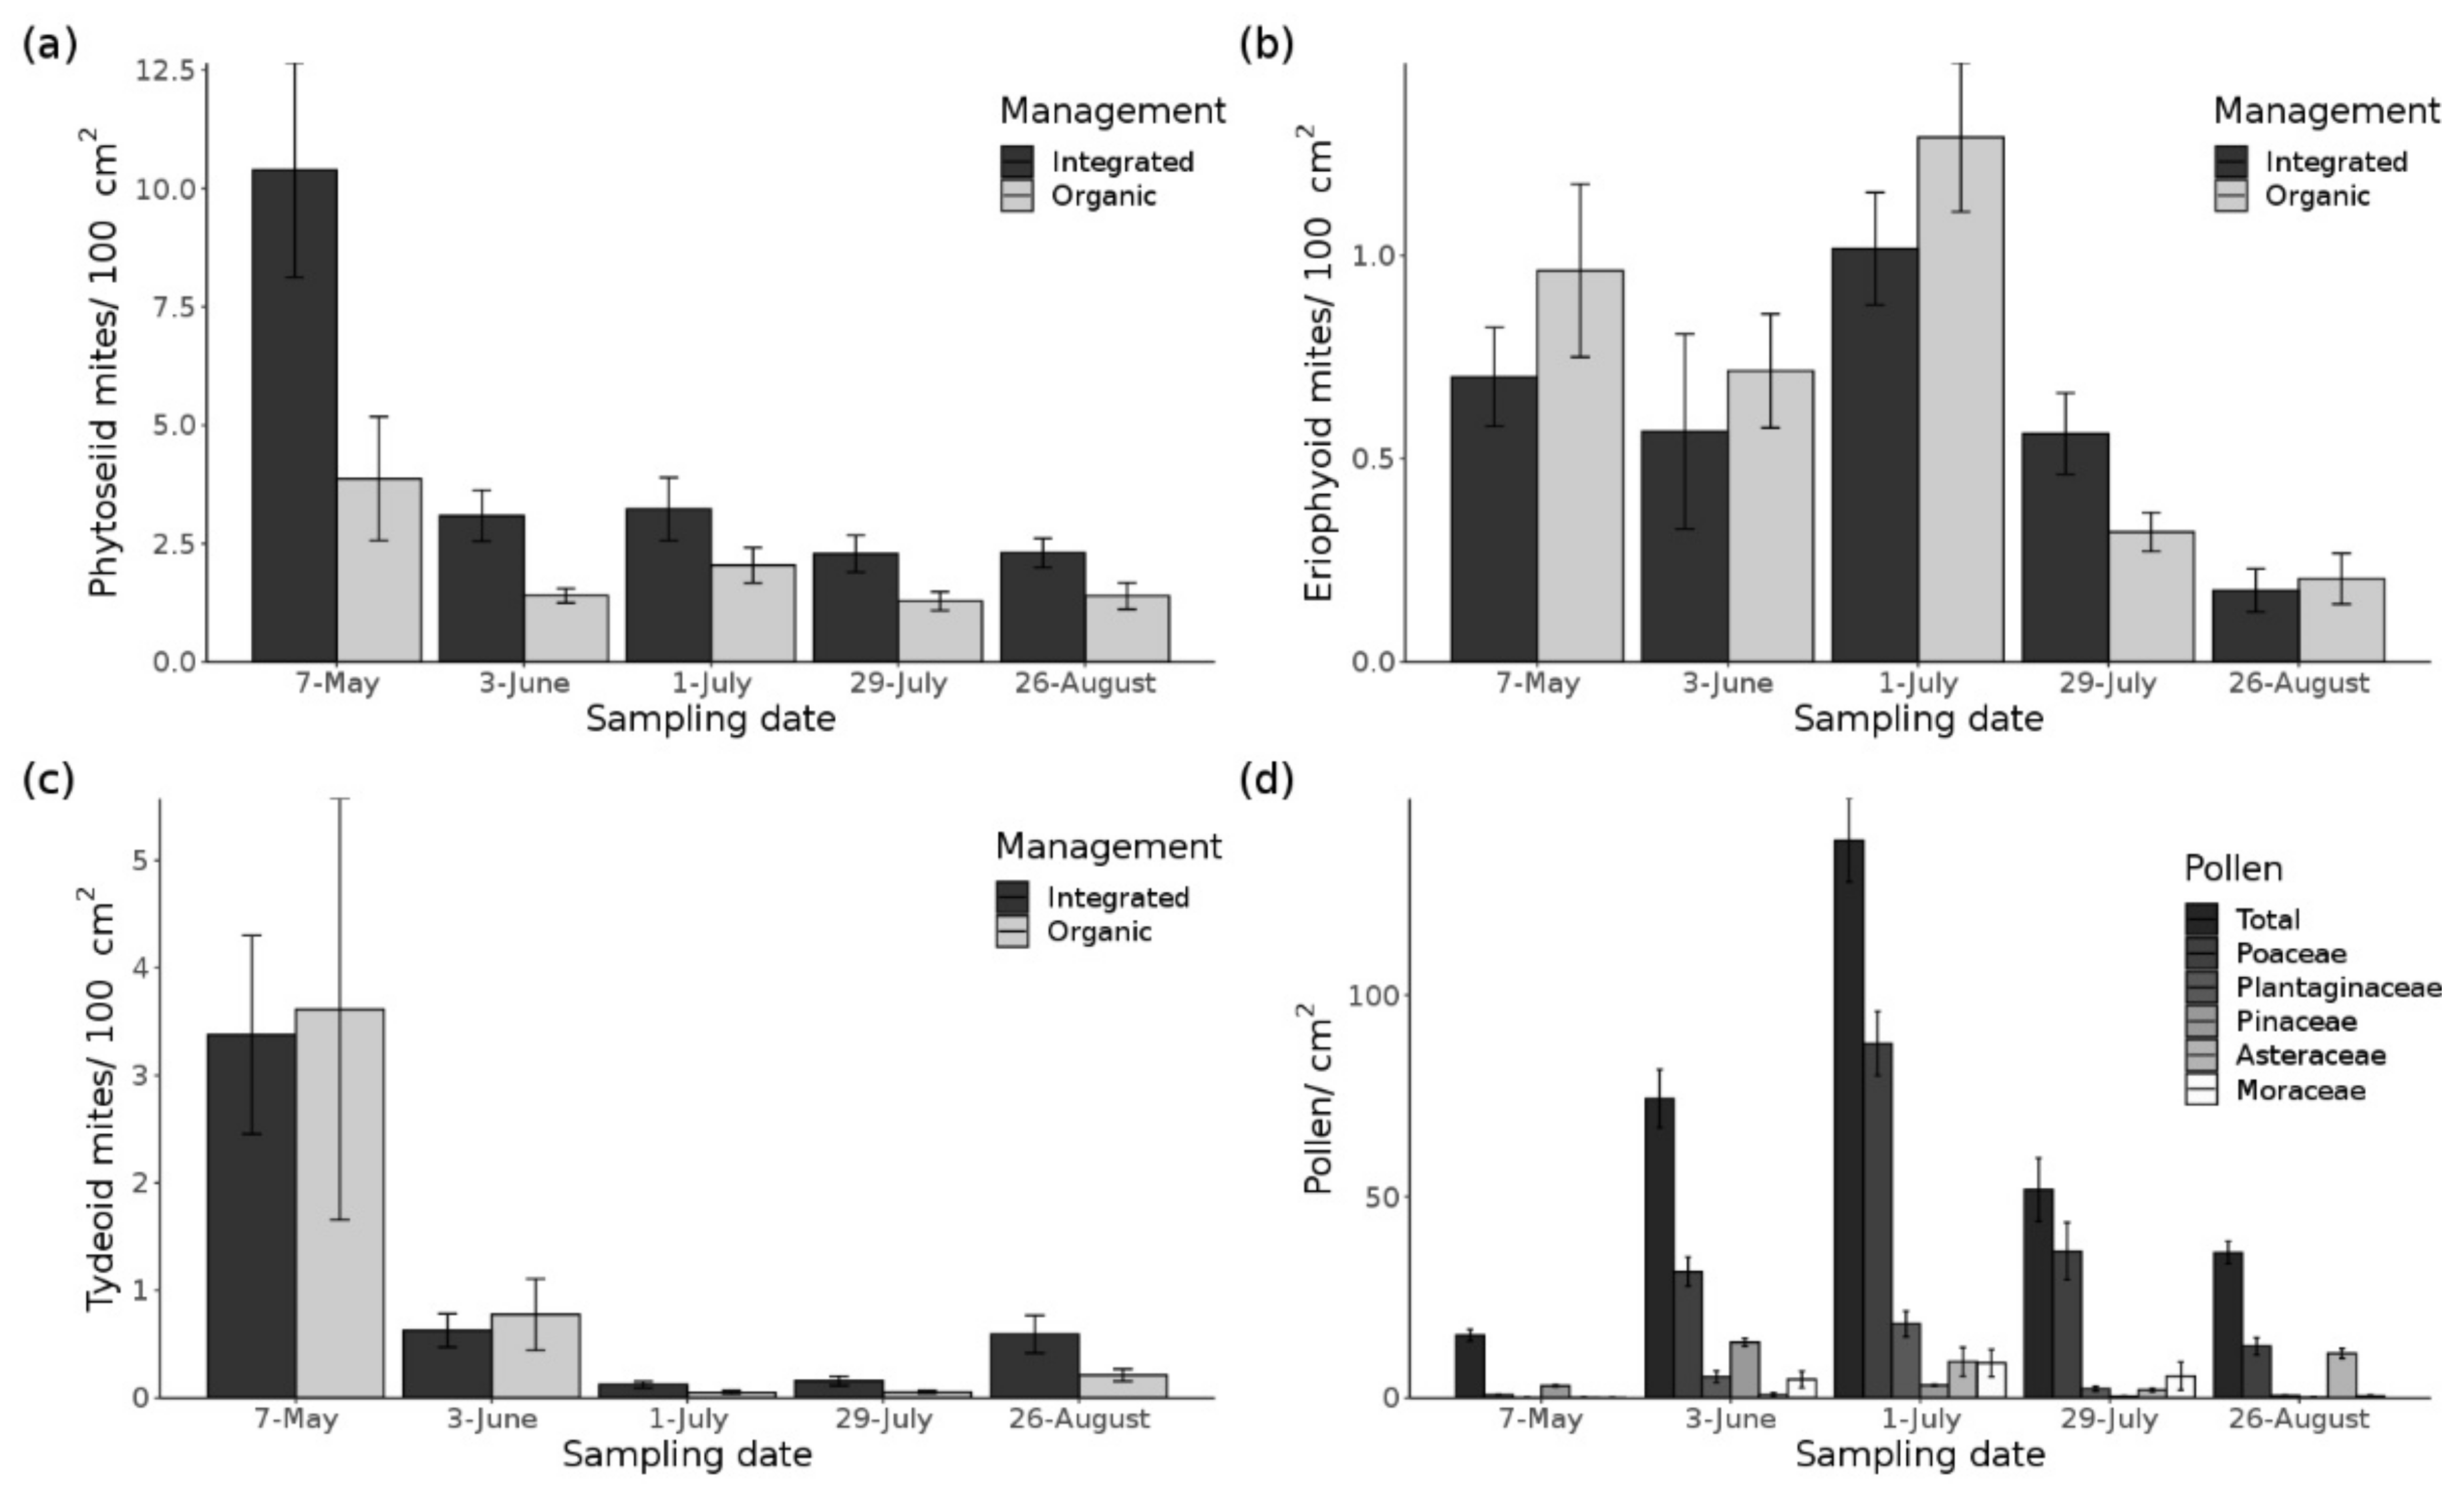
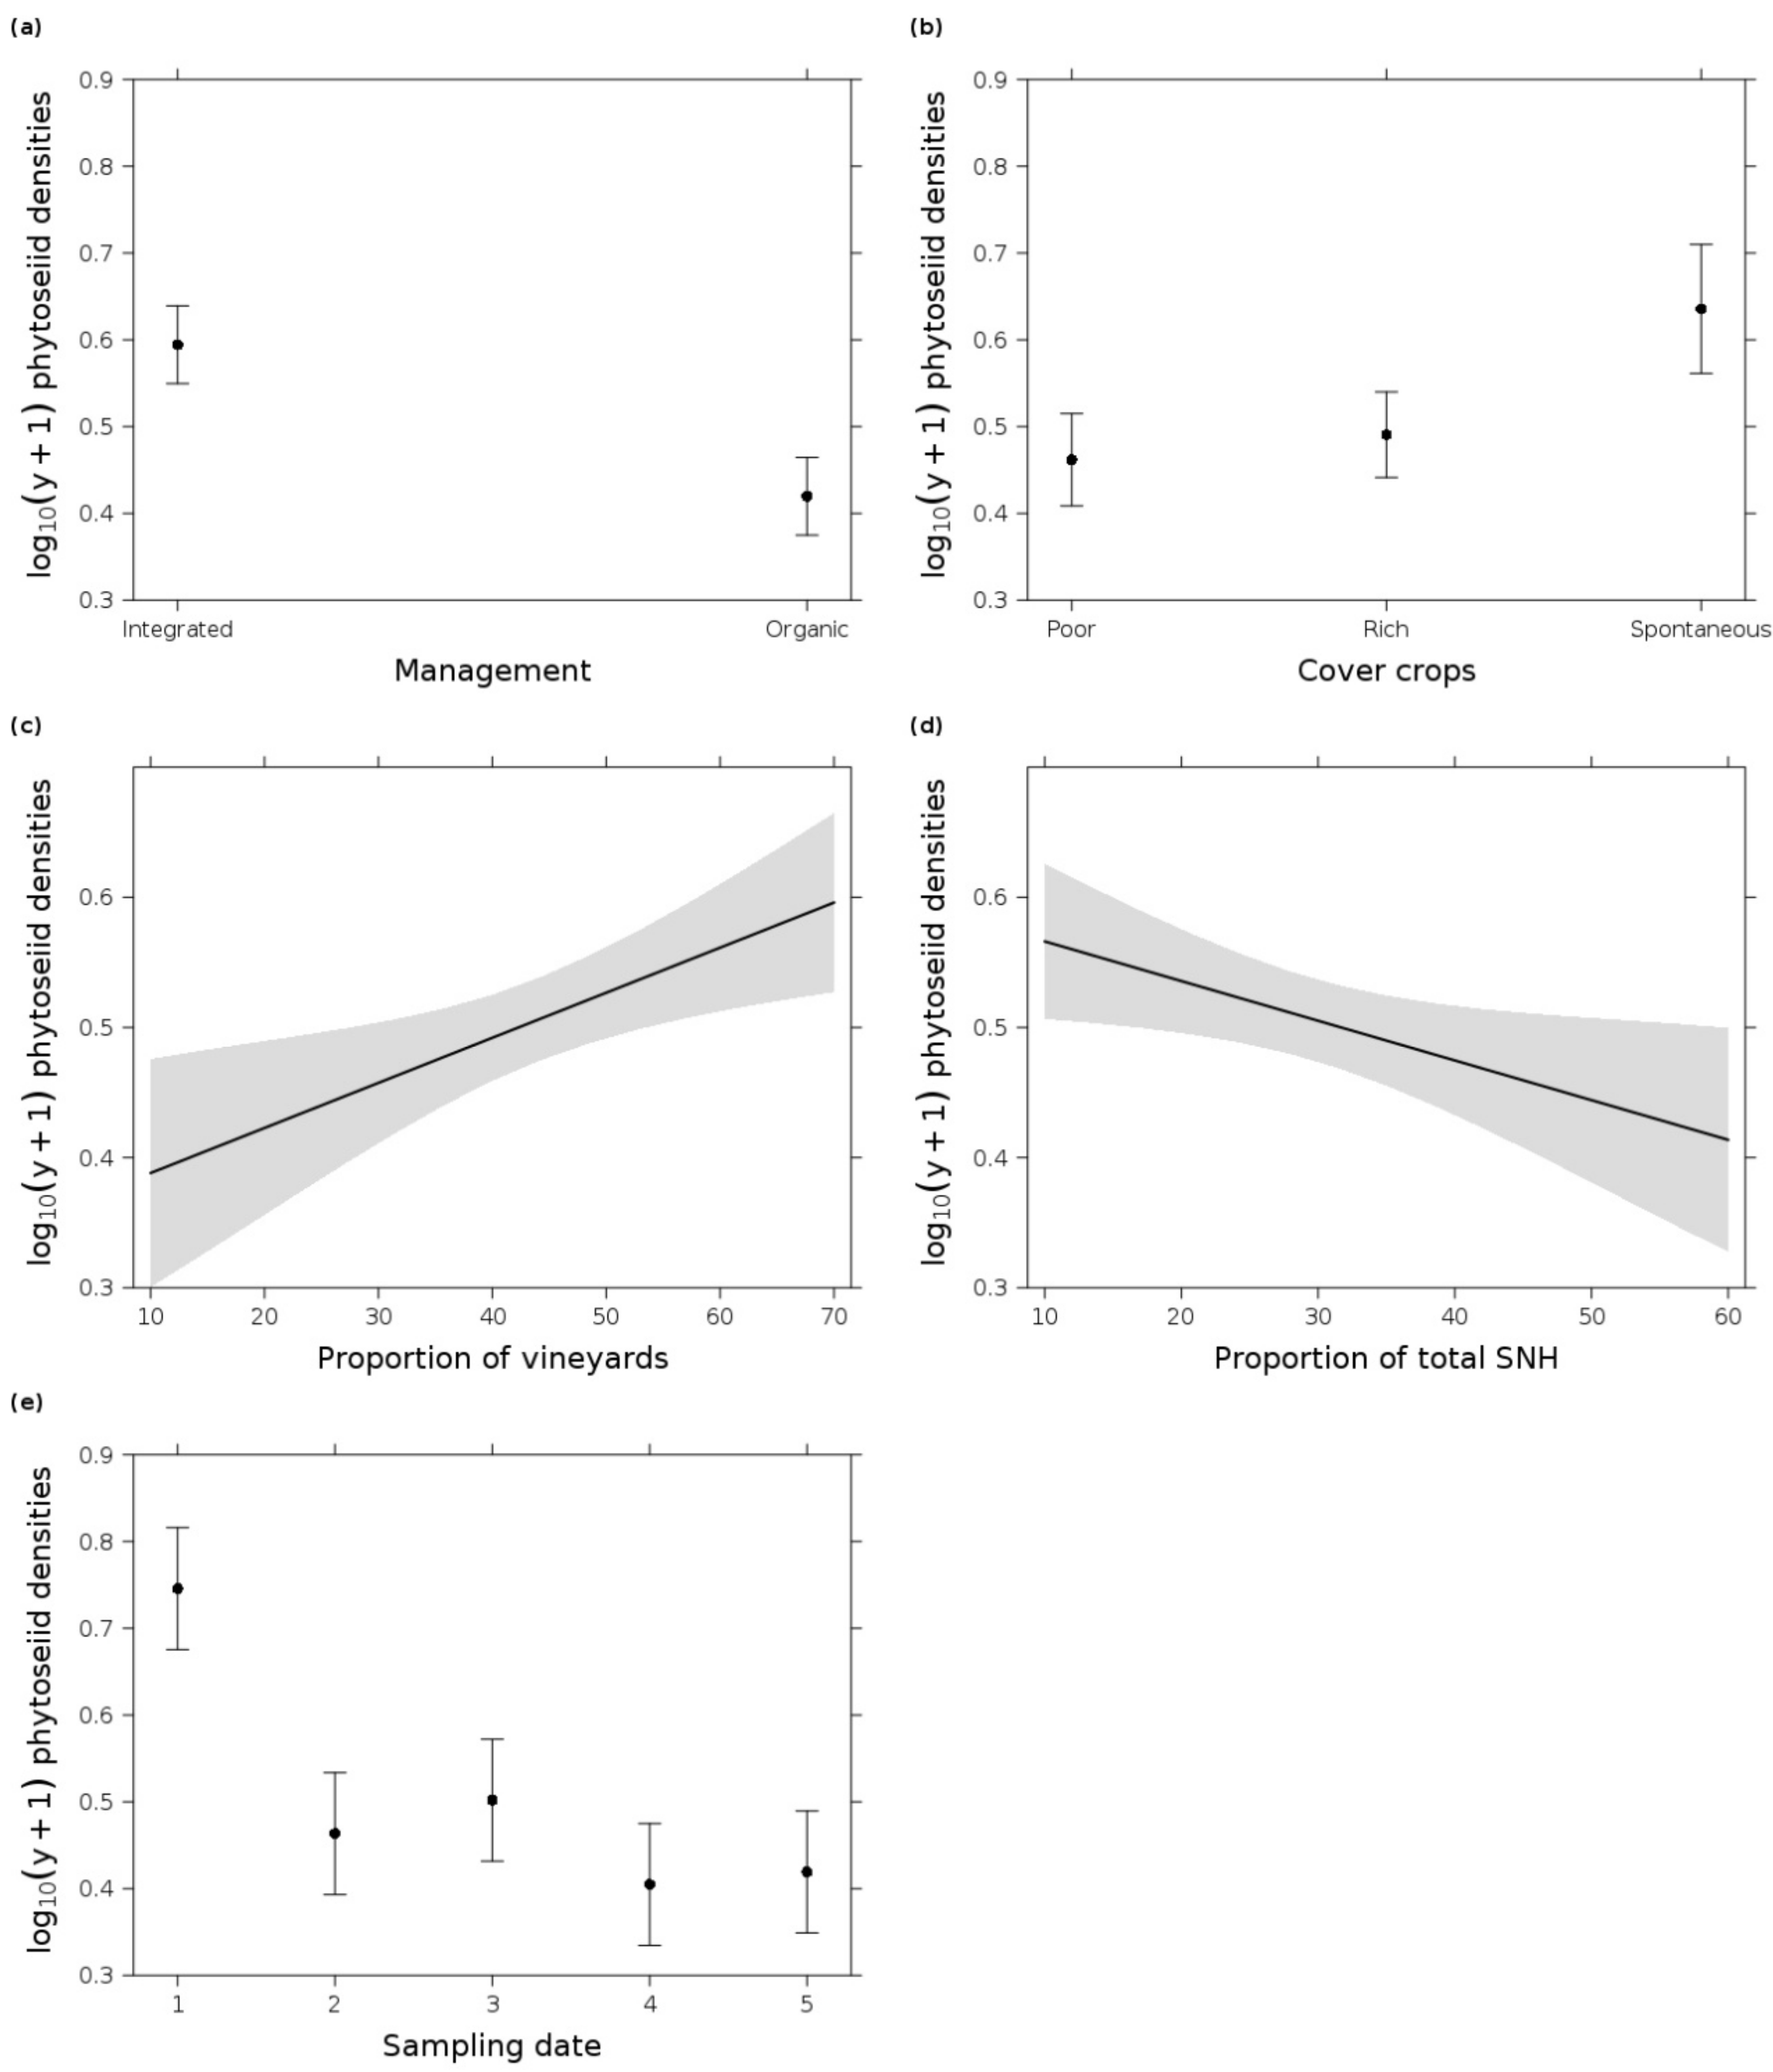
3.1. Phytoseiid Mites
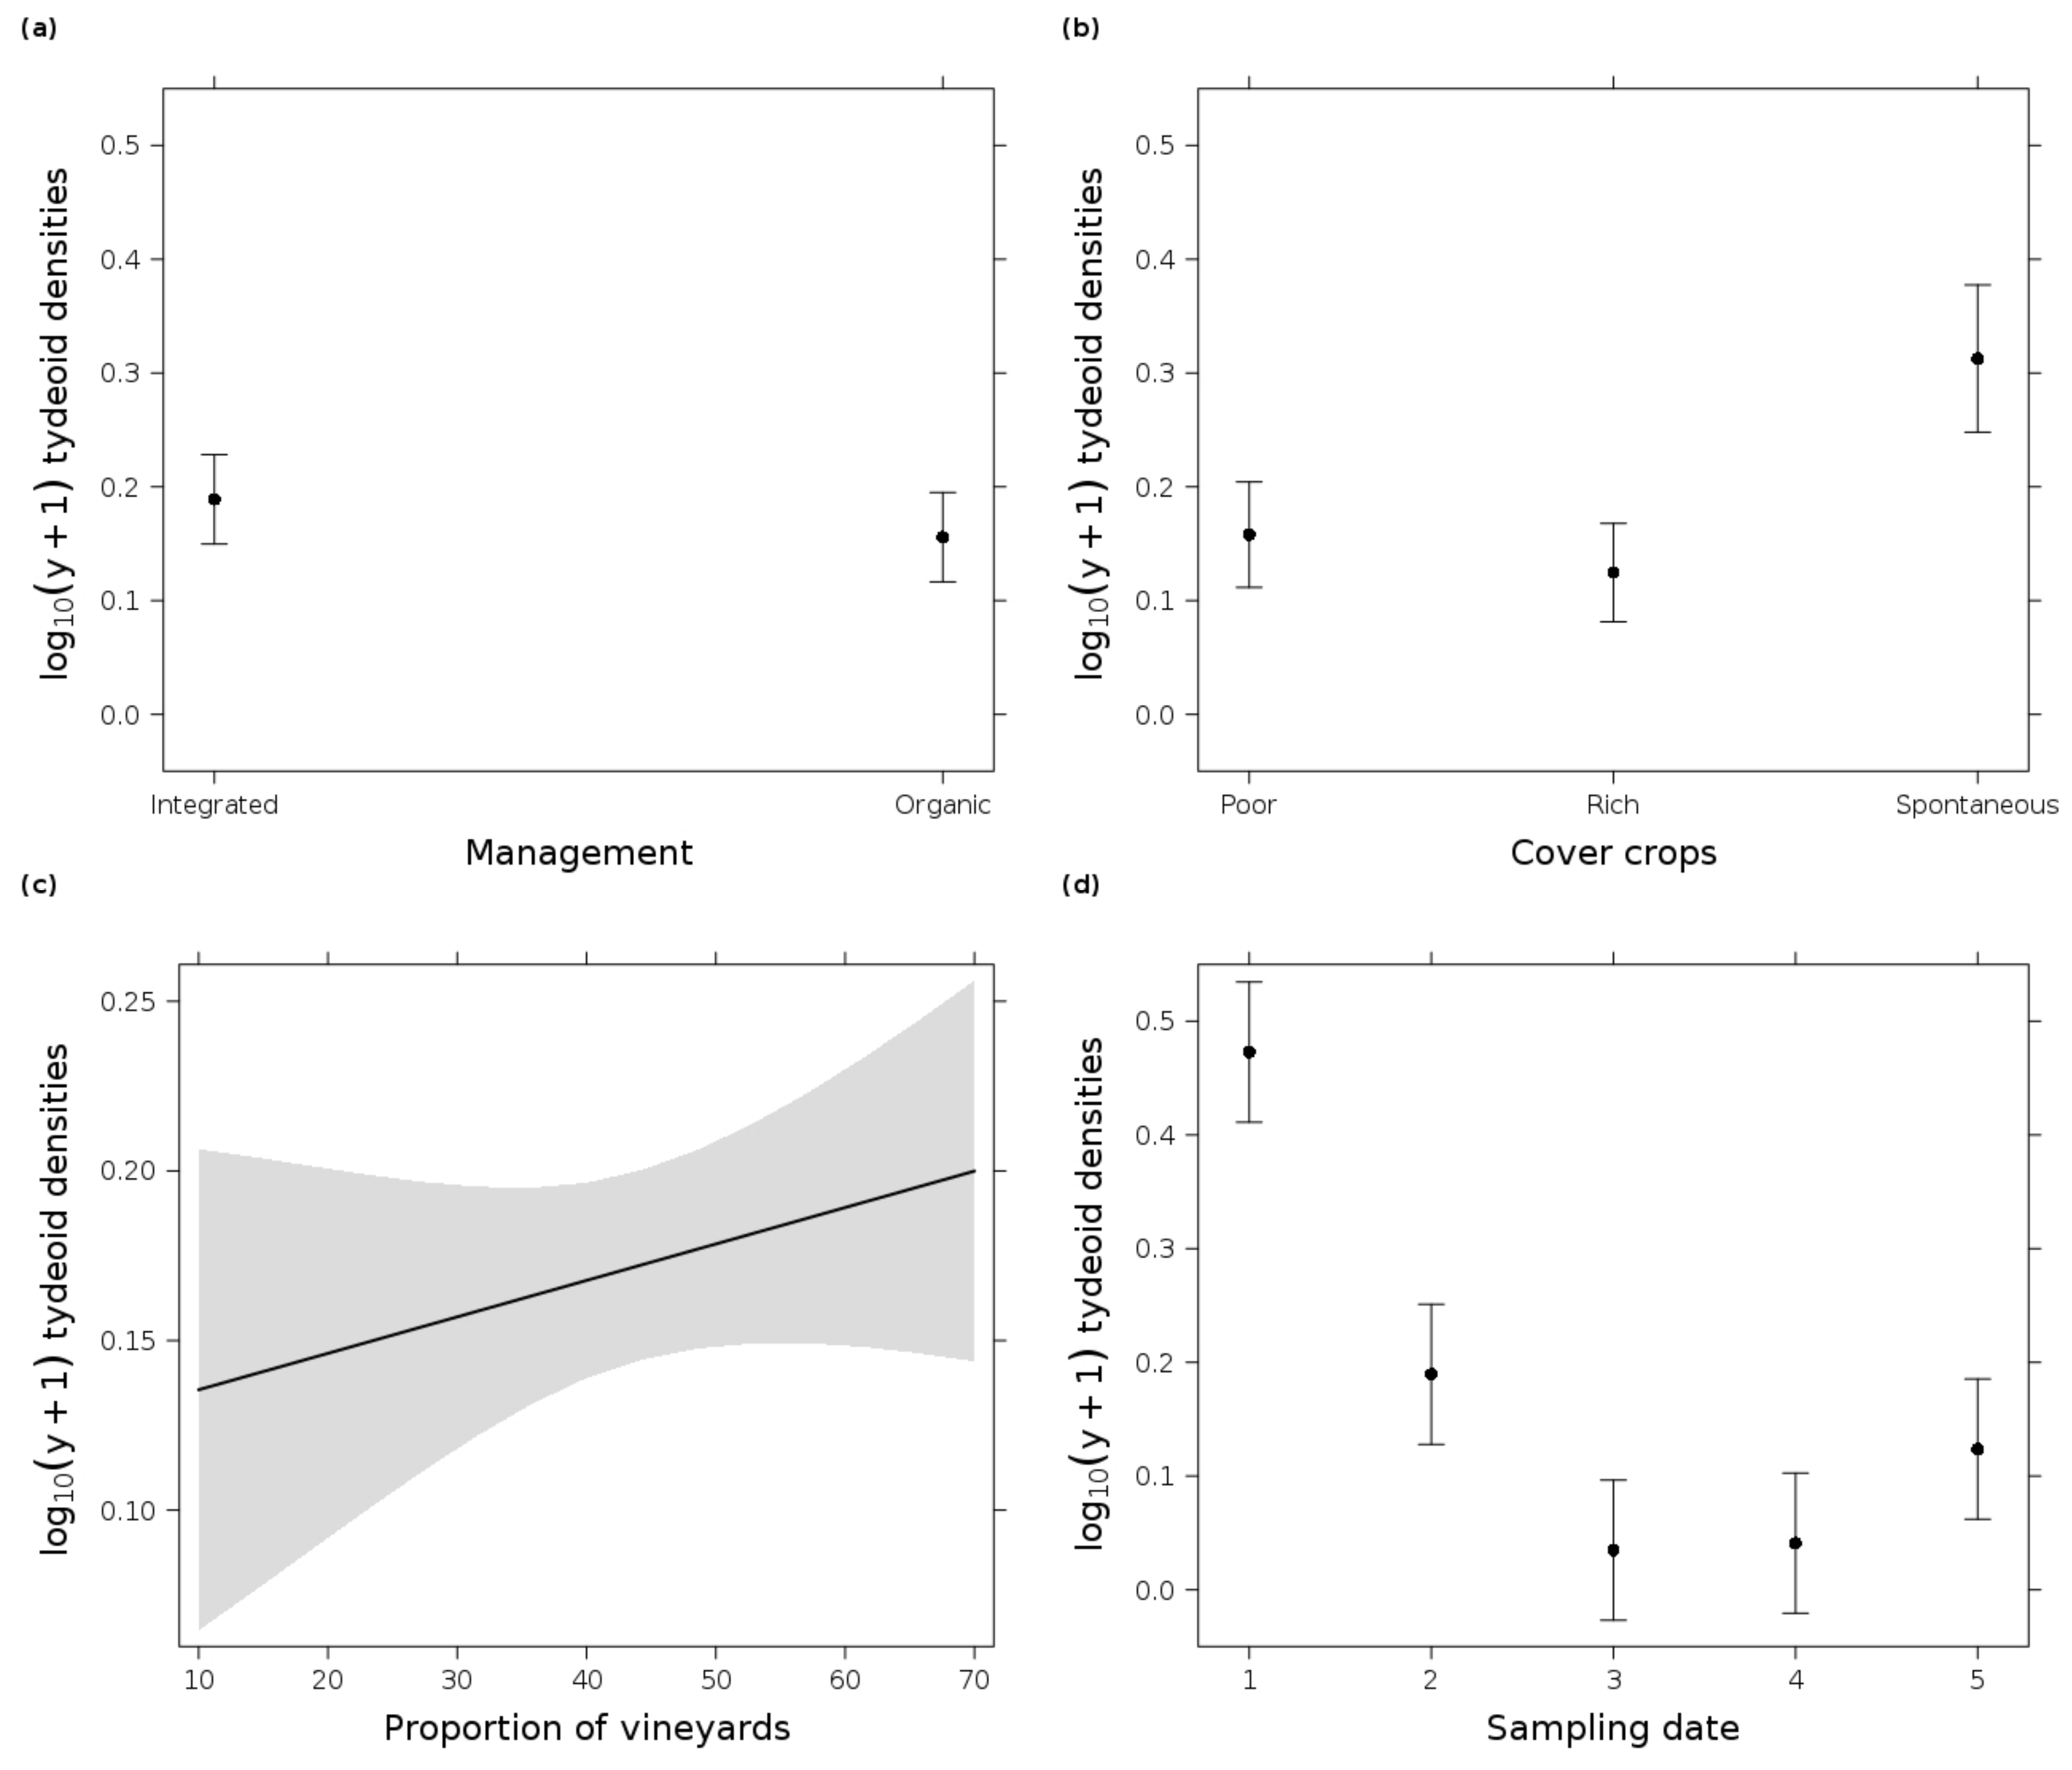
The overall mean phytoseiid mite density per 100 cm2 vine leaf area was 7.13 ± 7.98 SD (standard deviation) at the beginning of the sampling season, which decreased to 1.85 ± 1.25 at the last sampling date (split into organic and integrated in Figure 2). Out of 6912 sampled phytoseiid mite individuals, we identified three different species with a clear dominance of T. pyri (98.73% of all sampled phytoseiid mites), followed by Euseius finlandicus (Oudemans) (0.65%) and Paraseiulus talbii (Athias-Henriot) (0.62%). Consequently, statistical analysis focused only on the phytoseiid mite densities due to the low overall species richness. Phytoseiid mite populations were present in all vineyards throughout the growing season. The most parsimonious GLM (Table 2) showed that field and landscape parameters affected phytoseiid mite densities over time. The highest phytoseiid mite densities were recorded at the first sampling date with more than twice as many individuals than at other sampling dates (Figure 2). Integrated vineyards had higher phytoseiid mite densities than organic vineyards. Additionally, vineyards with spontaneous vegetation cover exhibited higher phytoseiid mite densities than vineyards with cover crop mixtures. Regarding the landscape parameters, phytoseiid mite densities increased with higher proportion of vineyards at the landscape scale. Vice versa, the increase of SNHs led to a decrease of these mites (Figure 3). Animal food sources (phytophagous and tydeoid mites) did not improve model fit; pollen abundance was only included in the second most parsimonious model (slightly outside the Δi range, Δi = 2.13). The detailed information of the pesticide toxicity loading expressed as aAPTLc showed a difference between the management types. The index for organic (19.91 ± 6.69) was almost twice as high as the integrated vineyards (10.63 ± 14.59) (see also boxplots in Figure S1), but it did not improve model fit according to AICc ranking. This difference due to the spraying regime was also recognizable in the amount of total pesticide applications, which was about one-third higher in organic (9.69 ± 1.7) than in integrated (6.31 ± 2.24) vineyards. The majority of the applied pesticides were fungicides (synthetic fungicides, sulfur, and copper) (Table 1). Nevertheless, there was a moderate correlation between the aAPTLc and the categorical toxicity rating for T. pyri (R = 0.62, p < 0.001). A similar relationship was also shown between the aAPTLc and the phytoseiid mite densities in relation to the sampling date with a negative moderate correlation (R = −0.45, p < 0.001). No correlation was found between the categorical toxicity rating for T. pyri and the phytoseiid mite densities (R = −0.095, p = 0.23) (correlations and their significance are shown in Figure S2).

3.2. Tydeoid Mites

Out of 981 sampled tydeoid mite individuals, Tydeus goetzi Schruft was the only identified species. At the beginning of the season, the mean density of T. goetzi was 3.5 ± 6.02 SD per 100 cm2 leaf area, which decreased to 0.4 ± 0.55 at the end of the season (Figure 2). The most parsimonious GLM (Table 2) indicated significant effects of the sampling date and cover crop type at the field scale. Tydeoid mite densities decreased throughout the season and only increased slightly at the end of the season. Highest densities were found in vineyards with spontaneous vegetation in the inter-row. The next two parsimonious GLMs (Table 2) showed that tydeoid mites were slightly more abundant in integrated compared to organic vineyards and their densities increased with higher proportions of vineyards at the landscape scale (Figure 4).

3.3. Phytophagous Mites
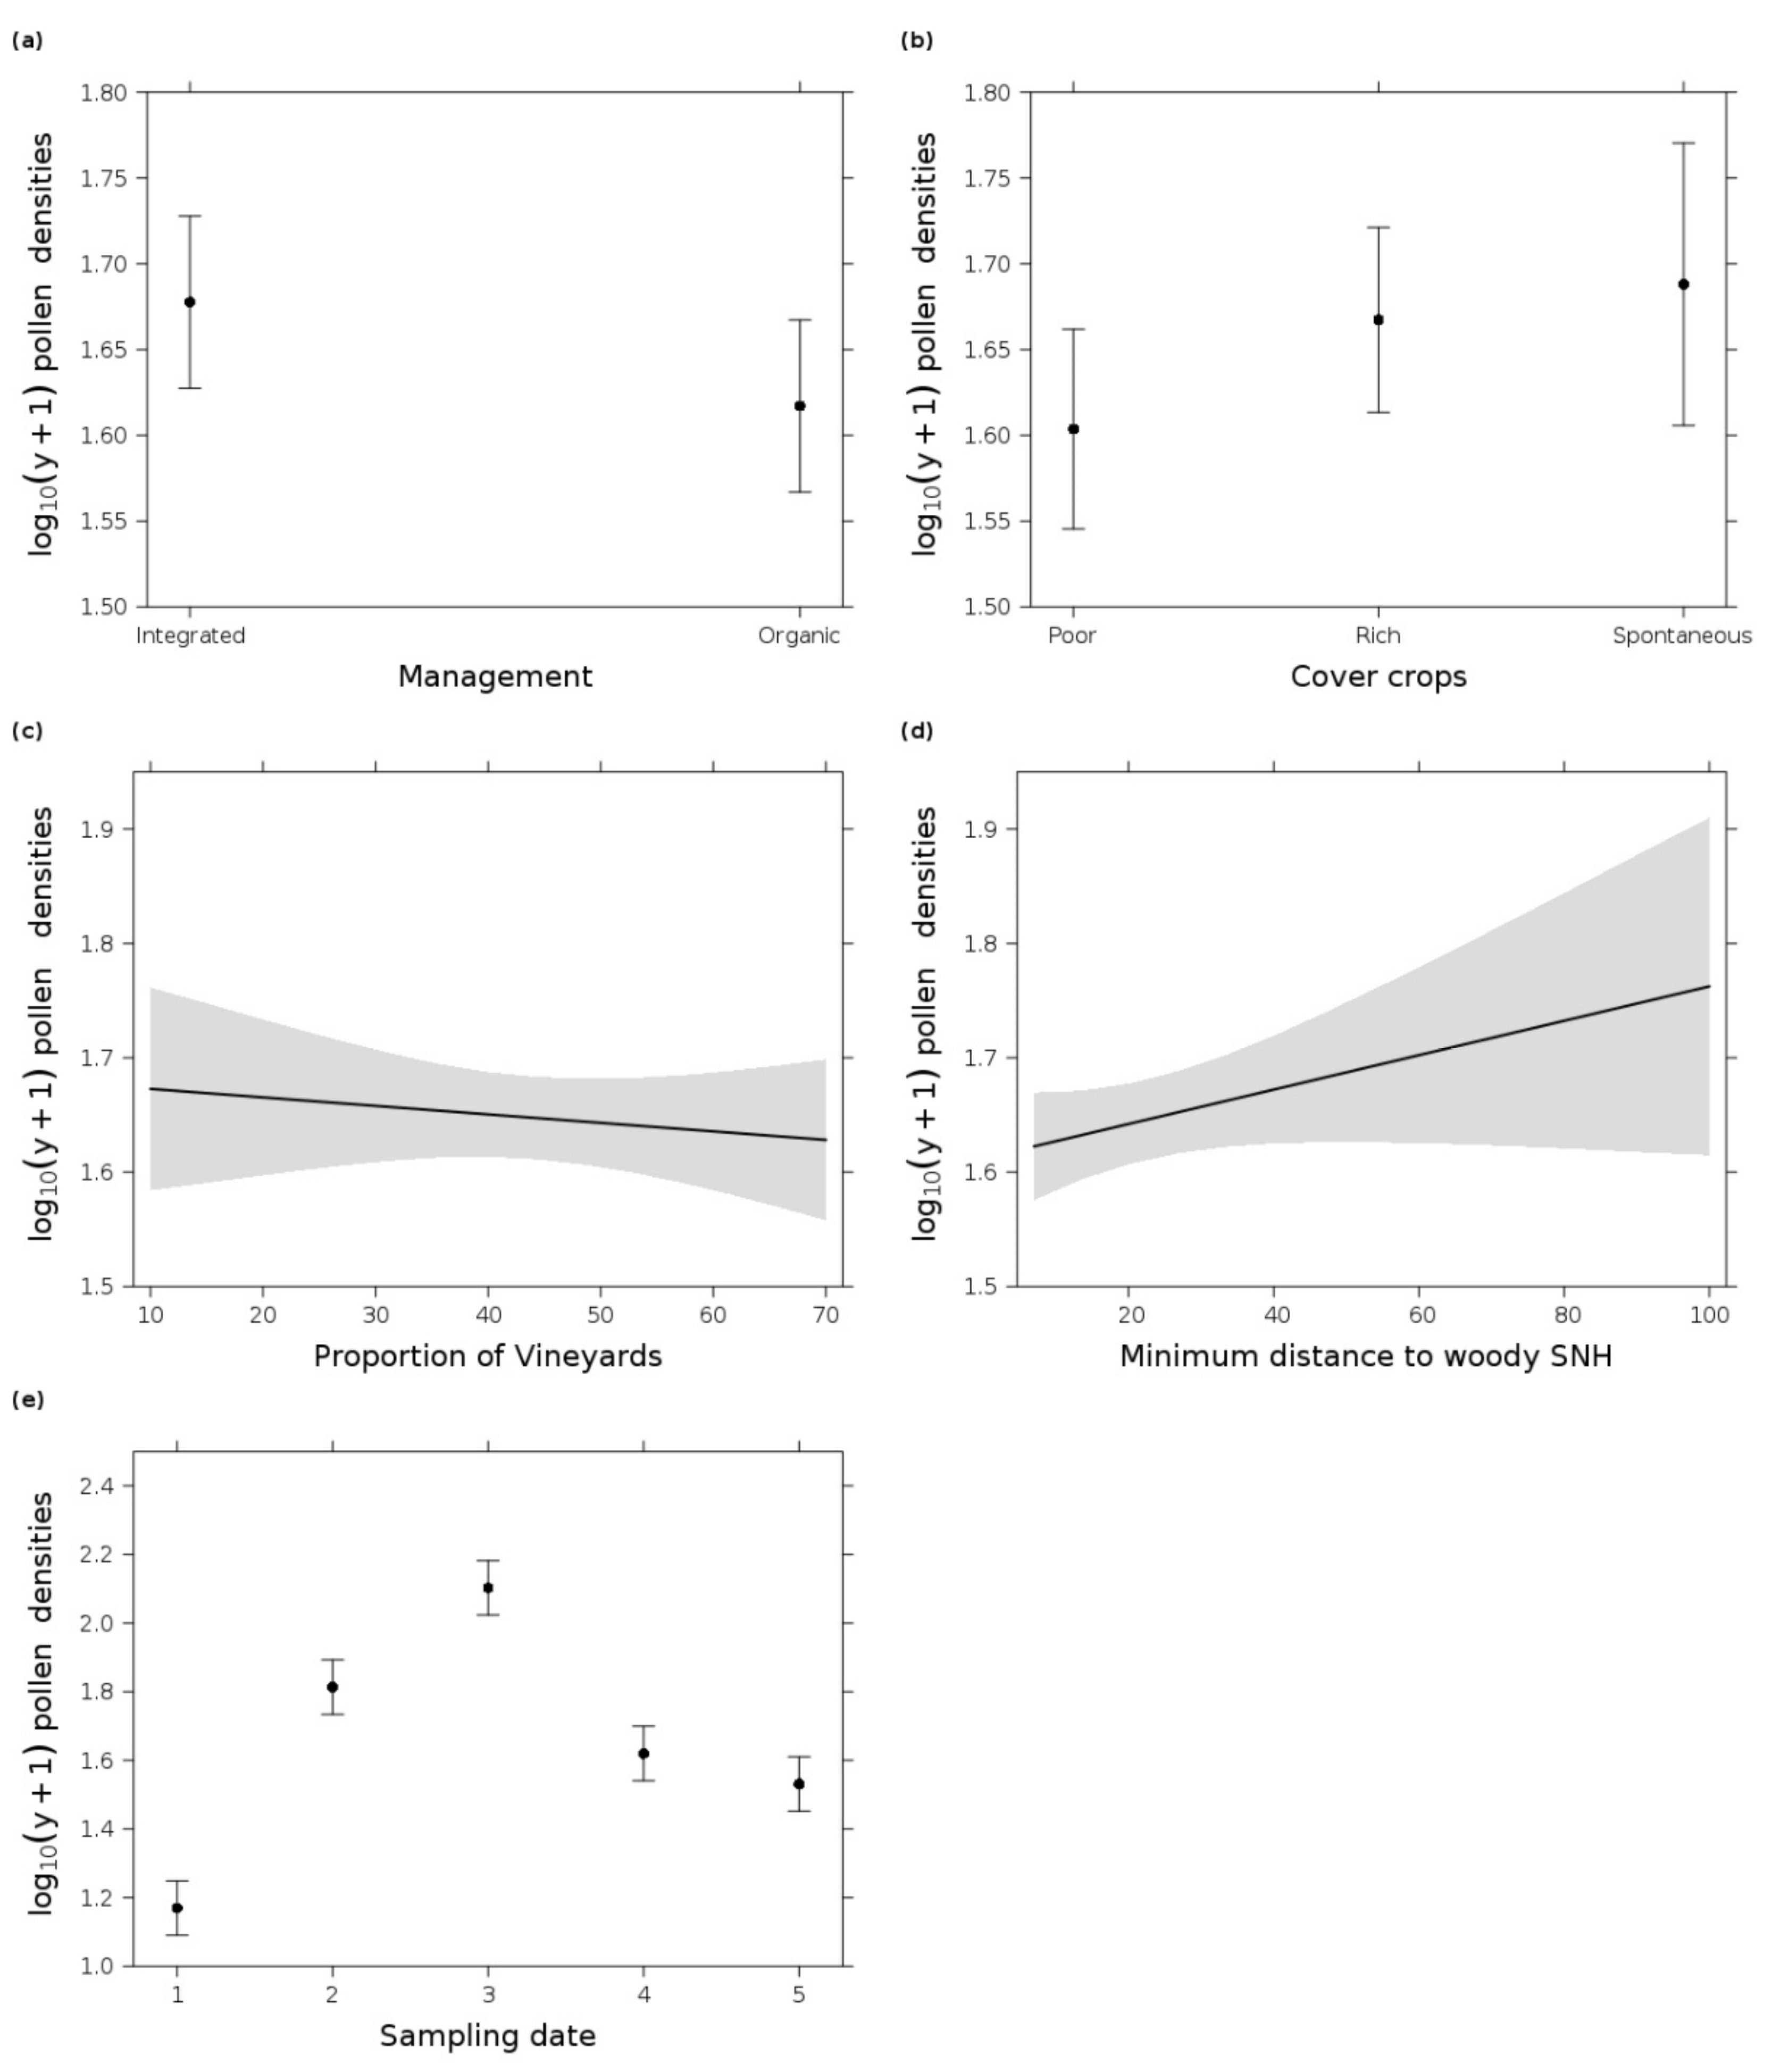
Eriophyoid mites, but not spider mites, were present in the grapevine canopy. The species Colomerus vitis (Pagenstecher) and Calepitirimerus vitis (Nalepa) were present in very low densities at the beginning of the growing season (Col. vitis: 0.6 mean ± 0.53 SD per 100 cm2 leaf area; Cal. vitis: 0.23 ± 0.29) and at the end of the sampling period (Col. vitis: 0.03 ± 0.06; Cal. vitis: 0.16 ± 0.18) (merged together in Figure 2). Considered together as eriophyoid mites per leaf, only 0–4 mites per leaf (minimum and maximum) occurred throughout the whole sampling season. The population fluctuated over time and they were also absent in some vineyards, especially at the end of the season. The most parsimonious GLM (Table 2) showed that the herbivorous mite density fluctuated over time and increased when the vegetation cover and the phytoseiid mite density increased. Furthermore, at the landscape scale, their densities decreased with higher proportions of vineyards (Figure 5), which was the exact opposite to the phytoseiid mite models. The second most parsimonious GLM (Δi 1.03) (Table 2) contained the same variables but excluding the variable phytoseiid mite density. The third most parsimonious GLM (Δi 1.97, Table 2) contained, in addition to the above-mentioned model, also the vegetation cover in spring, which also increased the herbivorous mite density (Figure 5).

3.4. Pollen

Pollen grains were always present on vine leaves, and the densities peaked at the beginning of June with up to 138.41 mean ± 58.35 SD pollen grains per square centimeter vine leaf and dropped to 36.06 ± 15.66 pollen grains at the end of the sampling season (Figure 2). The average pollen density across all sampling dates was 63.21 ± 56.83 pollen grains per square centimeter vine leaf. Altogether, 30 different pollen types were identified and the three most frequently found pollen types were found to be derived from the Poaceae family (56.47%), followed by Plantaginaceae (8.3419%) and Pinaceae (7.324%) (Table S3). The GLM analysis showed eight more or less equally parsimonious models, which included field and landscape parameters (Table 2). Overall, pollen density was highest in integrated vineyards and in vineyards with spontaneous vegetation cover. Surprisingly, pollen densities increased further away from woody elements at the landscape scale and slightly decreased when the proportion of vineyards increased (Figure 6). The NMDS showed no distinguishable aggregation of the pollen diversity on vine leaves in relation to cover crops in inter-rows in spring but a lot of vineyards were clearly associated with pollen from Amaranthaceae, Caryophyllaceae, Betulaceae, Juglandaceae, Poaceae, Plantaginaceae, and Pinaceae and with arboreal and non-arboreal pollen. SHDI, the proportion of agricultural land use, and the cover of Amaranthaceae in the vineyard inter-rows were important traits in relation to spring pollen composition (Figure S3). A different trend was recognizable for the summer pollen composition, where only the proportion of SNHs was an important trait. No aggregation of the pollen composition to cover crops was recognizable in summer. It must be considered that the NMDS of the summer pollen diversity had a stress value of 0.24 and should therefore be interpreted with care (Figure S4).

4. Discussion

Our findings demonstrated that different vineyard management practices at the field scale and the composition of the surrounding landscape were important factors for mites in the vine canopy. Predatory mite densities benefited from integrated vineyard management with spontaneous vegetation cover. At the landscape scale, predatory mites profited from a higher proportion of surrounding vineyards. The reduced use of pesticides was likely the main factor and may have increased predatory mite densities and also explained the seasonal abundance of the phytoseiid mite species T. pyri. In the absence of phytophagous mites, phytoseiid mite populations occurred at low levels throughout the sampling season, which is an important indicator of the effective pest control potential in the investigated vineyards [36]. Neither landscape diversity nor a higher proportion of semi-natural elements affected pollen density, whereas field parameters such as integrated management, species-rich cover crops, or spontaneous vegetation cover may lead to higher pollen densities on vine leaves. Phytoseiid mite densities showed only a very weak response to pollen densities. Regarding phytophagous mites, spider mites were absent in all vineyards, and densities of eriophyoid mites were very low during the whole season. Overall, predatory and phytophagous mite densities were influenced by sampling date in accordance with several other studies [34,35,115,116,117] with a peak for predatory mites at the beginning of May.

4.1. Integrated Management and Low Pesticide Use Increased Predatory Mite Densities

The management type (organic vs. integrated) was one major factor that influenced predatory mite densities. Both phytoseiid and tydeoid mite populations were greater in vineyards under integrated than under organic management. Our findings in Austrian vineyards contrasted with other studies, which showed that phytoseiid mite populations benefited from organic management [48,49]. An explanation for these opposing results could be related to the country-specific pesticide applications, which were higher in organic than integrated vineyards in Austria compared to a recent study in French vineyards with the opposite situation [33]. A possible reason for that difference could be related to the different climatic conditions in each country [18], the local complex of pests and diseases [17], or the greater reliance on prophylactic use of pesticides [31] in conventional viticulture. Similar to Austria, pesticide applications in organic vineyards were higher and phytoseiid densities lower compared to conventional vineyards in Germany and Switzerland [118,119]. The main reason for the higher application frequency in organic vineyards compared to conventional ones in Austria, Germany, and Switzerland is the use of copper and sulfur instead of synthetic fungicides against mildew fungus diseases. Several other studies clearly demonstrated that phytoseiid and tydeoid mite densities were higher in vineyards without pesticide application compared to pesticide-treated vineyards [48,49,120,121]. In Germany, phytoseiid mite populations increased when the fungicide applications were reduced [119,122]. Along the same line, integrated vineyards in this study had less fungicide applications and higher phytoseiid mite densities than organic ones. In this context, the timing of sulfur applications, pre- or post-bloom, affects predatory mite populations, where post-bloom results in the lowest population densities [123]. It is important to look beyond application frequencies and amounts because different active ingredients cause different harmful effects on phytoseiid and tydeoid mites (e.g., mancozeb, meptyldinocap, myclobutanil, paraffinic oil, spinosad, sulfur) [53,54,124,125,126]. The selected aAPTLc index [59] reflects the acute toxicity load on the basis of honeybees as LD50 values for all relevant active ingredients due to the problem that not all LR50 values were available for phytoseiid mites. Interestingly, the toxicity load was almost twice as high in organic than in integrated vineyards. To cope with the drawback that bees could respond differently to pesticides than predatory mites, the aAPTLc was correlated with the categorical toxicity rating based on T. pyri. The results showed that the aAPTLc correlated moderately with the categorical toxicity rating for T. pyri and the aAPTLc also correlated moderately negative with the predatory mite densities. In contrast, the categorical toxicity rating for T. pyri showed no correlation with the predatory mite densities. We suggest that this could be related to the higher pesticide resistance of T. pyri field populations [127] compared to lab strains, which are usually used for ecotoxicological tests [128]. This could be one possible reason why neither aAPTLc nor the categorical toxicity rating based on T. pyri were included in the most parsimonious models. Overall, phytoseiid and tydeoid mites benefited from the less intensive use of fungicides in integrated vineyards, which were the most commonly applied pesticides in the studied vineyards. The reduced input of inorganic fungicides such as sulfur and copper seemed to have a positive effect.

4.2. The Cover Crop Type Influenced the Mite Populations

The densities of phytoseiid and tydeoid mites and pollen were highest in vineyards with spontaneous vegetation cover. These findings confirmed the crucial role of cover crops or rather, in this case, spontaneous vegetation cover in vineyard inter-rows [27,29]. Spontaneous vegetation consists of plant communities that are adapted to the local conditions with a high proportion of native plants. Two recent studies showed that native cover crops enhanced arthropod diversity [30] and native grasses increased natural enemy abundance [129] in vineyards. Cover crops in general are also important because they provide pollen on vine leaves for phytoseiid [40,43,46,47,130] and tydeoid mites [44,45]. Our results are in line with two other studies, which showed that cover crops were important management measures increasing phytoseiid mite populations [23,131]. This is different for tydeoid mites, Vogelweith and Thiéry [29] discovered that their population were higher in bare soil compared to inter-rows with cover crops because of increased natural enemy populations in cover crops. Another important factor regarding vegetation cover as reservoir for phytoseiid mites is due to the similar seasonal activity pattern of their populations in the inter-row vegetation and on vine leaves [132]. This may enhance the possible dispersal potential of predatory mites from cover crops onto vine leaves, which was already shown for phytoseiid mites on peach [133] and citrus trees [134].
Eriophyoid mite densities were very low (between 0 and 4 mites per leaf) and far beyond reaching any economic threshold level. Standard thresholds for economic injuries for Cal. vitis are above 280 mites per leaf [135], and leaves have been shown to develop normally when they were infested with about 20–30 Col. vitis [136]. The absence of spider mites could be due to a stable phytoseiid mite population with effective biological control potential [137]. Additionally, the negligible use of insecticides and acaricides in the examined vineyards should also promote high phytoseiid mite abundances that control phytophagous mites [36]. The influence of vegetation cover and phytoseiid mite densities on the phytophagous mite population should be interpreted with care, due to the very low population densities of eriophyoid mites in the current study.

4.3. Predatory Mite Densities Benefited from Surrounding Vineyards

Our results showed that higher proportion of vineyards in the landscape were associated with increased predatory mite densities in vineyards. Furthermore, phytoseiid mite densities decreased when SNHs increased. These findings were in contrast with other studies, which showed positive relations between higher landscape diversity or higher shares of SNHs promoting biological control of different pests in vineyards [16,138,139,140]. Several studies demonstrated that SNHs (e.g., hedgerows, maple trees) were an important natural reservoir for phytoseiid mites [34,141], from where they could migrate into nearby vineyards [35,142,143] after their extinction by pesticides or when vineyards were newly established. As Austrian viticultural landscapes are comparably diverse with small-scaled vineyards containing a high proportion of SNHs (10–55%) at the landscape-scale, pesticides (here fungicides) are the most probable limiting factor for predatory mites. The aerial dispersal distance of phytoseiid mites is low and lies between 10 and 200 m through a single or multiple dispersal events during a vegetation season [77,78]. Phytoseiid mites could also disperse between adjacent vineyards, when these vineyards already contained high phytoseiid mite populations [142], which could explain the results of this study. Predatory mite populations seemed to benefit more from adjacent vineyards than from SNHs, probably due to the already established, stable populations and a diverse ecosystem in the studied vineyard inter-rows. The missing effect of SNHs was already shown for phytoseiid mite densities in a recent French study, indicating no effect of landscape complexity [144]. However, conceivable variables that were not measured in our study, the effect of grape varieties [116], the occurrence of mildew fungi [39,41], or the population-specific pesticide resistance of mites [120,127] could also mask the effect of SNHs.
In contrast, eriophyoid mite densities, which were far below economic threshold levels [135,136], decreased with higher proportions of vineyards at the landscape scale.
Therefore, we could not confirm the resource concentration hypothesis [4,5] for eriophyoid mites in vineyards or the natural enemy hypothesis [4,5] for predatory mites. This could be most likely linked to the very low pest mite densities, which masked predator–prey interactions. Phytoseiid mites on vines use, as generalists, a broad spectrum of nutritive food sources (e.g., pollen, fungi) [39] and therefore they can retain in stable populations also in the temporal absence of phytophagous mites. This could be similar for tydeoid mites, which also feed on pollen, fungi [44,45,117], and eriophyoid mites [38].

4.4. Low Diversity of Phytoseiids

A diversity survey of phytoseiid species in Austrian vineyards conducted in 1985 in Burgenland close to our study region indicated the occurrence of five species, namely, Phytoseius bakeri Chant (relative abundance: 46.52%), T. pyri (45.39%), Amblyseius andersoni (Chant) (4.20%), E. finlandicus (3.81%), and P. talbii (0.08%) [145]. These findings showed that the co-dominant species P. bakeri was replaced by the dominant T. pyri (98.73%), A. andersoni also disappeared, and E. finlandicus (0.65%) and P. talbii (0.62%) were only present in negligible densities in 2019. Similar results were recorded from phytoseiid mite samplings in German vineyards in 2014 [115] and 2018 [119]. Three potential causes may be put forward to explain the current dominance of T. pyri in vineyards. (1) This dominance could be related to the pesticide resistance of T. pyri populations [120,127], which were released in large numbers as biocontrol agents in the previous 20–30 years in the study region. (2) Due to these frequent releases resulting in higher population densities than other native species, T. pyri was able to eliminate other phytoseiid mite species [146]. (3) Climate warming increased the likelihood of heat waves in the last two decades [147], and the dominance of T. pyri might be attributed to a high heat-tolerance compared to other phytoseiid species native in Austria. These assumptions, however, should be verified in continuative experiments. Tydeus goetzi as the only identified tydeoid mite species in the Austrian study region was also found as the dominant species in Germany in recent studies [115,119].

4.5. Factors Influencing Pollen Availability

Pollen is a staple food resource for most phytoseiid [46,47] and tydeoid mites [44,45]. Several field and landscape-scale variables influence pollen densities on vine leaves. We suppose that integrated vineyards exhibited higher pollen densities due to lower pesticide application rates, reducing the possible roll of events from large application droplets or blow off through airblast by the fans of the spraying machinery, which could both remove pollen from the leaves [148]. In comparison to species-rich and species-poor cover crops, spontaneous vegetation supplied most pollen on vine leaves. The landscape was also an important influencing factor and indicated that the distance to woody elements was an essential factor and the vine leaves contained more pollen farther away from these elements. It is likely that pollen was deposited on the vine leaves mostly through aerial dispersal [149]. Hedges and trees therefore might act as pollen filters in comparison to vineyards. For example, a study from Duso et al. [47] showed that the pollen abundance was lower on vine leaves than on leaves from hedgerows, which surrounded the vineyards. Nevertheless, complex landscapes most likely increase pollen densities at the landscape scale [144], which explains why a higher proportion of vineyards leads to a minor decrease of the pollen densities. The NMDS showed no aggregation of the pollen communities in response to cover crop types. As a whole, landscape diversity and viticultural practices were drivers for pollen density and diversity. Due to their high nutritional value for phytoseiid mites, pollen from trees and grasses are especially important [43]. In the current study, grass pollen and different arboreal pollen, e.g., from birch, pine, and walnut, were most abundant. Therefore, pollen supply seems to be sufficient for phytoseiid and tydeoid mites in order to retain in stable populations in the vine canopy throughout the vegetation period.

5. Conclusions

The biological control of phytophagous mites is an important part in sustainable viticulture. We concluded that biodiversity at the vineyard and landscape level and viticultural practices such as integrated pest management are crucial for maintaining viable predatory mite populations. The reduction of the amount and frequency of pesticide applications seems to be the most important factor to reduce the harmfulness to non-target organisms. Furthermore, for increasing plant diversity and predatory mite densities, diverse spontaneous vegetation should be favored over low-diversity cover crop mixtures in vineyard inter-rows. Our results show that spontaneous vegetation cover should be more considered in the regulations of the Austrian agri-environmental program, which currently requires participating wine growers in the erosion mitigation measure to seed cover crop mixtures. The aAPTLc index is useful to quantify and evaluate the toxicity load for non-target organisms as it extends beyond simple treatment frequency indices. This study shows the great potential of low pesticide use and spontaneous vegetation cover for maintaining pest control services in viticultural landscapes.

Supplementary Materials

The following are available online at https://0-www-mdpi-com.brum.beds.ac.uk/2075-4450/12/2/180/s1: Table S1. Summary of the active ingredients of different types of pesticides applied in the investigated vineyards in 2019. Table S2: Mean and standard deviation (SD) of the landscape parameters in 2019. Table S3: List of all pollen types found on vine leaves during the sampling period of 2019. Figure S1: Boxplots of the different pesticide indexes of organic and integrated vineyards. Figure S2: Spearman’s correlation plots. Figure S3: NMDS (non-metric multidimensional scaling) plot displaying the ordination of the pollen types in spring 2019. Figure S4: NMDS (non-metric multidimensional scaling) plot displaying the ordination of the pollen types in summer 2019.

Author Contributions

Conceptualization, S.W., A.W., M.R. and S.M.; methodology, C.H., S.W., S.M. and B.P.; mite sampling and determination, S.M.; pollen determination and landscape analysis, B.P.; area-related acute pesticide contact toxicity loading preparation, C.H. and S.M.; data analysis and validation, S.M. and S.W.; investigation, S.M. and B.P.; resources, S.W.; data curation, S.M.; writing—original draft preparation, S.M.; writing—review and editing, S.W., A.W., C.H., M.R. and B.P.; visualization, S.M.; supervision, S.W. and A.W.; project administration, S.W.; funding acquisition, S.W. All authors have read and agreed to the published version of the manuscript.

Funding

Open Access Funding by the Austrian Science Fund (FWF). This research was funded by the research project SECBIVIT, which was funded through the 2017–2018 Belmont Forum and BiodivERsA joint call for research proposals, under the BiodivScen ERA-Net COFUND program, with the funding organizations: Agencia Estatal de Investigación (Ministerio de ciencia e innovación/Spain); Austrian Science Fund (FWF) (grant number I 4025-B32); Federal Ministry of Education and Research (BMBF/Germany); VDI/VDE-IT Projektträger; French National Research Agency (ANR); Netherlands Organization for Scientific Research (NWO); National Science Foundation (grant #1850943); and Romanian Executive Agency for Higher Education, Research, Development, and Innovation Funding (UEFISCDI).

Institutional Review Board Statement

Not applicable.

Data Availability Statement

The data presented in this study are openly available in Zenodo at: http://0-doi-org.brum.beds.ac.uk/10.5281/zenodo.4450163.

Acknowledgments

We would like to thank all winegrowers who provided their vineyards as study sites. Furthermore, we are grateful to Ahmad Aldelemi, Eva Dillschneider, Lina Weissengruber, Lisa Sitavanc, and Vincenzo Diecidue for support during field and laboratory work, as well as landscape mapping. We are grateful for the support during statistical analysis by Friedrich Leisch and critical review of the final version of this article by Siegrid Steinkellner.

Conflicts of Interest

The authors declare no conflict of interest.

References

  1. Altieri, M.A. How best can we use biodiversity in agroecosystems? Outlook Agric. 1991, 20, 15–23. [Google Scholar] [CrossRef]
  2. Landis, D.A.; Wratten, S.D.; Gurr, G.M. Habitat Management to Conserve Natural Enemies of Arthropod Pests in Agriculture. Annu. Rev. Entomol. 2000, 45, 175–201. [Google Scholar] [CrossRef]
  3. Haddad, N.M.; Crutsinger, G.M.; Gross, K.; Haarstad, J.; Knops, J.M.H.; Tilman, D. Plant species loss decreases arthropod diversity and shifts trophic structure. Ecol. Lett. 2009, 12, 1029–1039. [Google Scholar] [CrossRef]
  4. Root, R.B. Organization of a Plant-Arthropod Association in Simple and Diverse Habitats: The Fauna of Collards (Brassica oleracea). Ecol. Monogr. 1973, 43, 95–124. [Google Scholar] [CrossRef]
  5. Russell, E.P. Enemies Hypothesis: A Review of the Effect of Vegetational Diversity on Predatory Insects and Parasitoids. Environ. Entomol. 1989, 18, 590–599. [Google Scholar] [CrossRef] [Green Version]
  6. O’Rourke, M.E.; Petersen, M.J. Extending the ‘resource concentration hypothesis’ to the landscape-scale by considering dispersal mortality and fitness costs. Agric. Ecosyst. Environ. 2017, 249, 1–3. [Google Scholar] [CrossRef]
  7. Tscharntke, T.; Karp, D.S.; Chaplin-Kramer, R.; Batáry, P.; DeClerck, F.; Gratton, C.; Hunt, L.; Ives, A.; Jonsson, M.; Larsen, A.; et al. When natural habitat fails to enhance biological pest control—Five hypotheses. Biol. Conserv. 2016, 204, 449–458. [Google Scholar] [CrossRef] [Green Version]
  8. Wan, N.F.; Ji, X.Y.; Jiang, J.X. Testing the enemies hypothesis in peach orchards in two different geographic areas in eastern China: The role of ground cover vegetation. PLoS ONE 2014, 9. [Google Scholar] [CrossRef] [PubMed] [Green Version]
  9. Novais, S.M.A.; Macedo-Reis, L.E.; Neves, F.S. Predatory beetles in cacao agroforestry systems in Brazilian Atlantic forest: A test of the natural enemy hypothesis. Agrofor. Syst. 2017, 91, 201–209. [Google Scholar] [CrossRef]
  10. Harmon, J.P.; Hladilek, E.E.; Hinton, J.L.; Stodola, T.J.; Andow, D.A. Herbivore response to vegetational diversity: Spatial interaction of resources and natural enemies. Popul. Ecol. 2003, 45, 75–81. [Google Scholar] [CrossRef]
  11. Björkman, M.; Hambäck, P.A.; Hopkins, R.J.; Rämert, B. Evaluating the enemies hypothesis in a clover-cabbage intercrop: Effects of generalist and specialist natural enemies on the turnip root fly (Delia floralis). Agric. For. Entomol. 2010, 12, 123–132. [Google Scholar] [CrossRef]
  12. Kheirodin, A.; Cárcamo, H.A.; Costamagna, A.C. Contrasting effects of host crops and crop diversity on the abundance and parasitism of a specialist herbivore in agricultural landscapes. Landsc. Ecol. 2020, 35, 1073–1087. [Google Scholar] [CrossRef]
  13. Miklasiewicz, T.J.; Hammond, R.B. Density of potato leafhopper (Homoptera: Cicadellidae) in response to soybean-wheat cropping systems. Environ. Entomol. 2001, 30, 204–214. [Google Scholar] [CrossRef] [Green Version]
  14. Parsa, S.; Ccanto, R.; Rosenheim, J.A. Resource concentration dilutes a key pest in indigenous potato agriculture. Ecol. Appl. 2011, 21, 539–546. [Google Scholar] [CrossRef] [PubMed]
  15. Karp, D.S.; Chaplin-Kramer, R.; Meehan, T.D.; Martin, E.A.; DeClerck, F.; Grab, H.; Gratton, C.; Hunt, L.; Larsen, A.E.; Martínez-Salinas, A.; et al. Crop pests and predators exhibit inconsistent responses to surrounding landscape composition. Proc. Natl. Acad. Sci. USA 2018, 115, E7863–E7870. [Google Scholar] [CrossRef] [PubMed] [Green Version]
  16. Paredes, D.; Rosenheim, J.A.; Chaplin-Kramer, R.; Winter, S.; Karp, D.S. Landscape simplification increases vineyard pest outbreaks and insecticide use. Ecol. Lett. 2020. [Google Scholar] [CrossRef] [PubMed]
  17. Vincent, C.; Isaacs, R.; Bostanian, N.J.; Lasnier, J. Principles of Arthropod Pest Management in Vineyards. In Arthropod Management in Vineyards: Pests, Approaches, and Future Directions; Bostanian, N.J., Vincent, C., Isaacs, R., Eds.; Springer: Dordrecht, The Netherlands, 2012; pp. 1–16. ISBN 978-94-007-4032-7. [Google Scholar]
  18. Kottek, M.; Grieser, J.; Beck, C.; Rudolf, B.; Rubel, F. World map of the Köppen-Geiger climate classification updated. Meteorol. Z. 2006, 15, 259–263. [Google Scholar] [CrossRef]
  19. Kazakou, E.; Fried, G.; Richarte, J.; Gimenez, O.; Violle, C.; Metay, A. A plant trait-based response-and-effect framework to assess vineyard inter-row soil management. Bot. Lett. 2016, 163, 373–388. [Google Scholar] [CrossRef]
  20. Hall, R.M.; Penke, N.; Kriechbaum, M.; Kratschmer, S.; Jung, V.; Chollet, S.; Guernion, M.; Nicolai, A.; Burel, F.; Fertil, A.; et al. Vegetation management intensity and landscape diversity alter plant species richness, functional traits and community composition across European vineyards. Agric. Syst. 2020, 177. [Google Scholar] [CrossRef]
  21. Fried, G.; Cordeau, S.; Metay, A.; Kazakou, E. Relative importance of environmental factors and farming practices in shaping weed communities structure and composition in French vineyards. Agric. Ecosyst. Environ. 2019, 275, 1–13. [Google Scholar] [CrossRef]
  22. Winter, S.; Bauer, T.; Strauss, P.; Kratschmer, S.; Paredes, D.; Popescu, D.; Landa, B.; Guzmán, G.; Gómez, J.A.; Guernion, M.; et al. Effects of vegetation management intensity on biodiversity and ecosystem services in vineyards: A meta-analysis. J. Appl. Ecol. 2018, 55, 2484–2495. [Google Scholar] [CrossRef] [Green Version]
  23. Burgio, G.; Marchesini, E.; Reggiani, N.; Montepaone, G.; Schiatti, P.; Sommaggio, D. Habitat management of organic vineyard in Northern Italy: The role of cover plants management on arthropod functional biodiversity. Bull. Entomol. Res. 2016, 106, 759–768. [Google Scholar] [CrossRef] [PubMed]
  24. Paiola, A.; Assandri, G.; Brambilla, M.; Zottini, M.; Pedrini, P.; Nascimbene, J. Exploring the potential of vineyards for biodiversity conservation and delivery of biodiversity-mediated ecosystem services: A global-scale systematic review. Sci. Total Environ. 2020, 706. [Google Scholar] [CrossRef] [PubMed]
  25. Kehinde, T.; Samways, M.J. Insect-flower interactions: Network structure in organic versus conventional vineyards. Anim. Conserv. 2014, 17, 401–409. [Google Scholar] [CrossRef]
  26. Geldenhuys, M.; Gaigher, R.; Pryke, J.S.; Samways, M.J. Diverse herbaceous cover crops promote vineyard arthropod diversity across different management regimes. Agric. Ecosyst. Environ. 2021, 307. [Google Scholar] [CrossRef]
  27. Sáenz-Romo, M.G.; Martínez-García, H.; Veas-Bernal, A.; Carvajal-Montoya, L.D.; Martínez-Villar, E.; Ibáñez-Pascual, S.; Marco-Mancebón, V.S.; Pérez-Moreno, I. Effect of ground-cover management on predatory mites (Acari: Phytoseiidae) in a Mediterranean vineyard. Vitis J. Grapevine Res. 2019, 58, 25–32. [Google Scholar] [CrossRef]
  28. Sáenz-Romo, M.G.; Veas-Bernal, A.; Martínez-García, H.; Campos-Herrera, R.; Ibáñez-Pascual, S.; Martínez-Villar, E.; Pérez-Moreno, I.; Marco-Mancebón, V.S. Ground cover management in a Mediterranean vineyard: Impact on insect abundance and diversity. Agric. Ecosyst. Environ. 2019, 283. [Google Scholar] [CrossRef]
  29. Vogelweith, F.; Thiéry, D. Cover crop differentially affects arthropods, but not diseases, occurring on grape leaves in vineyards. Aust. J. Grape Wine Res. 2017, 23, 426–431. [Google Scholar] [CrossRef]
  30. Eckert, M.; Mathulwe, L.L.; Gaigher, R.; Joubert-van der Merwe, L.; Pryke, J.S. Native cover crops enhance arthropod diversity in vineyards of the Cape Floristic Region. J. Insect Conserv. 2020, 24, 133–149. [Google Scholar] [CrossRef]
  31. Isaacs, R.; Saunders, M.C.; Bostanian, N.J. Pest Thresholds: Their Development and Use in Vineyards for Arthropod Management. In Arthropod Management in Vineyards: Pests, Approaches, and Future Directions; Bostanian, N.J., Vincent, C., Isaacs, R., Eds.; Springer: Dordrecht, The Netherlands, 2012; pp. 17–36. ISBN 978-94-007-4032-7. [Google Scholar]
  32. Communication from the Commission to the European Parliament, the Council, the E. Economic and Social Committee and the Committee of the Regions. A Farm to Fork Strategy for a Fair, Healthy and Environmentally-Friendly Food System COM(2020) 381 Final. Available online: https://eur-lex.europa.eu/legal-content/EN/TXT/?uri=CELEX:52020DC0381 (accessed on 7 September 2020).
  33. Muneret, L.; Thiéry, D.; Joubard, B.; Rusch, A. Deployment of organic farming at a landscape scale maintains low pest infestation and high crop productivity levels in vineyards. J. Appl. Ecol. 2018, 55, 1516–1525. [Google Scholar] [CrossRef]
  34. Duso, C.; Malagnini, V.; Paganelli, A.; Aldegheri, L.; Bottini, M.; Otto, S. Pollen availability and abundance of predatory phytoseiid mites on natural and secondary hedgerows. BioControl 2004, 49, 397–415. [Google Scholar] [CrossRef]
  35. Tixier, M.S.; Kreiter, S.; Auger, P. Colonization of vineyards by phytoseiid mites: Their dispersal patterns the plot and their fate. Exp. Appl. Acarol. 2000, 24, 191–211. [Google Scholar] [CrossRef]
  36. Duso, C.; Pozzebon, A.; Kreiter, S.; Tixier, M.S.; Candolfi, M.; Kreiter, S. Management of phytophagous mites in European vineyards. In Arthropod Management in Vineyards: Pests, Approaches, and Future Directions; Bostanian, N.J., Vincent, C., Isaacs, R., Eds.; Springer: Dordrecht, The Netherlands, 2012; pp. 191–217. ISBN 9789400740327. [Google Scholar]
  37. Da Silva, G.L.; Metzelthin, M.H.; Da Silva, O.S.; Ferla, N.J. Catalogue of the mite family Tydeidae (Acari: Prostigmata) with the world key to the species. Zootaxa 2016, 4135, 1–68. [Google Scholar] [CrossRef] [PubMed]
  38. Schruft, G. Das Vorkommen von Milben aus der Familie Tydeidae (Acari) an Reben. Z. Angew. Entomol. 1972, 71, 124–133. [Google Scholar] [CrossRef]
  39. McMurtry, J.A.; De Moraes, G.J.; Sourassou, N.F. Revision of the lifestyles of phytoseiid mites (Acari: Phytoseiidae) and implications for biological control strategies. Syst. Appl. Acarol. 2013, 18, 297–320. [Google Scholar] [CrossRef] [Green Version]
  40. Boller, E.; Frey, B. Blühende Rebberge in der Ostschweiz: 1 Zur Bedeutung des Pollens für die Raubmilben. Schweizierische Z. Obs. Weinbau 1990, 126, 401–405. [Google Scholar]
  41. Pozzebon, A.; Duso, C. Grape downy mildew Plasmopara viticola, an alternative food for generalist predatory mites occurring in vineyards. Biol. Control. 2008, 45, 441–449. [Google Scholar] [CrossRef]
  42. Schausberger, P. Vergleichende Untersuchungen über den Einfluß unterschiedlicher Nahrung auf die Präimaginalentwicklung und die Reproduktion von Amblyseius aberrans Oud. und Amblyseius finlandicus Oud. (Acarina, Phytoseiidae). J. Appl. Entomol. 1992, 113, 476–486. [Google Scholar] [CrossRef]
  43. Engel, R.; Ohnesorge, B. Die Rolle von Ersatznahrung und Mikroklima im System Typhlodromus pyri Scheuten (Acari, Phytoseiidae)—Panonychus ulmi Koch (Acari, Tetranychidae) auf Weinreben I. Untersuchungen im Labor. J. Appl. Entomol. 1994, 118, 129–150. [Google Scholar] [CrossRef]
  44. Knop, N.F.; Hoy, M.A. Biology of a tydeid mite, Homeopronematus anconai (n. comb.) (Acari: Tydeidae), important in San Joaquin Valley vineyards. Hilgardia 1983, 51, 1–30. [Google Scholar] [CrossRef] [Green Version]
  45. Hessein, N.A.; Perring, T.M. The importance of alternate foods for the mite Homeopronematus anconai (Acari: Tydeidae). Ann. Entomol. Soc. Am. 1988, 81, 488–492. [Google Scholar] [CrossRef]
  46. Wiedmer, U.; Boller, E. Blühende Rebberge in der Ostschweiz: 2. Zum Pollenangebot auf den Rebblättern. Schweiz. Z. Obs. Weinbau 1990, 426–431. [Google Scholar]
  47. Duso, C.; Malagnini, V.; Paganelli, A.; Aldegheri, L.; Bottini, M. Phytoseiid mites—Pollen relationships: Observations in a vineyard and the surrounding vegetation. In Acarid Phylogeny and Evolution: Adaptation in Mites and Ticks; Bernini, F., Nanelli, R., Nuzzace, G., de Lillo, E., Eds.; Springer: Dordrecht, The Netherlands, 2002; pp. 373–387. ISBN 978-94-017-0611-7. [Google Scholar]
  48. Sabbatini Peverieri, G.; Simoni, S.; Goggioli, D.; Liguori, M.; Castagnoli, M. Effects of variety and management practices on mite species diversity in Italian vineyards. Bull. Insectol. 2009, 62, 53–60. [Google Scholar]
  49. Silva, D.E.; Nascimento, J.M.D.; Meira, A.D.A.; Johann, L.; Costa Corrêa, L.L.; Rodrigues, R.; Ferla, N.J.; Correâ, L.L.C.; Rodrigues, R.; Ferla, N.J. Phytoseiid mites under different vineyard managements in the subregions of Lima and Cávado of the Vinho Verde region in Portugal. Syst. Appl. Acarol. 2019, 24, 918–928. [Google Scholar] [CrossRef]
  50. Caprio, E.; Nervo, B.; Isaia, M.; Allegro, G.; Rolando, A. Organic versus conventional systems in viticulture: Comparative effects on spiders and carabids in vineyards and adjacent forests. Agric. Syst. 2015, 136, 61–69. [Google Scholar] [CrossRef]
  51. Muneret, L.; Auriol, A.; Thiéry, D.; Rusch, A. Organic farming at local and landscape scales fosters biological pest control in vineyards. Ecol. Appl. 2019, 29. [Google Scholar] [CrossRef] [PubMed] [Green Version]
  52. Nash, M.A.; Hoffmann, A.A.; Thomson, L.J. Identifying signature of chemical applications on indigenous and invasive nontarget arthropod communities in vineyards. Ecol. Appl. 2010, 20, 1693–1703. [Google Scholar] [CrossRef] [PubMed]
  53. Gadino, A.N.; Walton, V.M.; Dreves, A.J. Impact of Vineyard Pesticides on a Beneficial Arthropod, Typhlodromus pyri (Acari: Phytoseiidae), in Laboratory Bioassays. J. Econ. Entomol. 2011, 104, 970–977. [Google Scholar] [CrossRef]
  54. Bernard, M.B.; Cole, P.; Kobelt, A.; Horne, P.A.; Altmann, J.; Wratten, S.D.; Yen, A.L. Reducing the impact of pesticides on biological control in Australian vineyards: Pesticide mortality and fecundity effects on an indicator species, the predatory mite Euseius victoriensis (Acari: Phytoseiidae). J. Econ. Entomol. 2010, 103, 2061–2071. [Google Scholar] [CrossRef] [PubMed]
  55. Gravesen, L. OECD Survey of National Pesticide Risk Indicators, 1999–2000. Available online: http://www.oecd.org/env/ehs/pesticides-biocides/1934154.pdf (accessed on 6 April 2020).
  56. Halberg, N.; Verschuur, G.; Goodlass, G. Farm level environmental indicators; are they useful? An overview of green accounting systems for European farms. Agric. Ecosyst. Environ. 2005, 105, 195–212. [Google Scholar] [CrossRef] [Green Version]
  57. Van Bol, V.; Claeys, S.; Debongnie, P.; Godfriaux, J.; Pussemier, L.; Steurbaut, W.; Maraite, H. Pesticide indicators. Pestic. Outlook 2003, 14, 159–163. [Google Scholar] [CrossRef]
  58. European Parliament; Council of the European Union Regulation (EC) No 1107/2009 of the European Parliament and of the Council of 21 October 2009 Concerning the Placing of Plant Protection Products on the Market and Repealing Council Directives 79/117/EEC and 91/414/EEC, COD 2006/0136. Available online: https://eur-lex.europa.eu/legal-content/EN/ALL/?uri=CELEX%3A32009R1107 (accessed on 10 September 2020).
  59. DiBartolomeis, M.; Kegley, S.; Mineau, P.; Radford, R.; Klein, K. An assessment of acute insecticide toxicity loading (AITL) of chemical pesticides used on agricultural land in the United States. PLoS ONE 2019, 14. [Google Scholar] [CrossRef] [Green Version]
  60. BOKU Institut für Pflanzenschutz Wetterstatistik. Available online: http://rebschutz.boku.ac.at (accessed on 20 March 2020).
  61. Amt der Burgenländischen Landesregierung Geodaten Burgenland. Available online: https://geodaten.bgld.gv.at/de/downloads.html (accessed on 23 October 2019).
  62. Boller, E. Eine einfache Ausschwemm-Methode zur schnellen Erfassung von Raubmilben, Thrips und anderen Kleinarthropoden im Weinbau. Schweiz. Z. Obs. Weinbau 1984, 120, 16–17. [Google Scholar]
  63. Hill, K.; Schlamp, H.A. Einsatz der Waschmethode zur Ermittlung des Raubmilbenbesatzes auf Rebblättern. Die Wein Wiss. 1984, 39, 255–262. [Google Scholar]
  64. Walter, D.E.; Lindquist, E.E.; Smith, I.M.; Cook, D.R.; Krantz, G.W.; Cook, D.R.; Krantz, G.W.; Cook, D.R.; Krantz, G.W. Order Trombidiformes. In A Manual of Acarology, 3rd ed.; Walter, D.E., Krantz, G.W., Eds.; Texas Tech University Press: Lubbock, TX, USA, 2009; pp. 233–420. ISBN 978-0-89672-620-8. [Google Scholar]
  65. Lindquist, E.E.; Krantz, G.W.; Walter, D.E. Order Mesostigmata. In A Manual of Acarology, 3rd ed.; Walter, D.W., Krantz, G.E., Eds.; Texas Tech University Press: Lubbock, TX, USA, 2009; pp. 124–232. ISBN 978-0-89672-620-8. [Google Scholar]
  66. Lindquist, E.E.; Amrine, J.W. 1.1.2 Systematics, diagnoses for major taxa, and keys to families and genera with species on plants of economic importance. In Eriophyoid Mites Their Biology, Natural Enemies and Control; Lindquist, E.E., Sabelis, M.W., Bruin, J., Eds.; World Crop Pests; Elsevier: Amsterdam, The Netherlands, 1996; Volume 6, ISBN 9780080531236. [Google Scholar]
  67. Walter, D.E.; Krantz, G.W. Collection, Rearing, and Preparing Specimens. In A Manual of Acarology, 3rd ed.; Walter, D.E., Krantz, G.W., Eds.; Texas Tech University Press: Lubbock, TX, USA, 2009; pp. 83–96. ISBN 978-0-89672-620-8. [Google Scholar]
  68. Tixier, M.S.; Baldassar, A.; Duso, C.; Kreiter, S. Phytoseiidae in European grape (Vitis vinifera L.): Bio-ecological aspects and keys to species (Acari: Mesostigmata). Zootaxa 2013, 3721, 101–142. [Google Scholar] [CrossRef] [PubMed] [Green Version]
  69. Addison, J.A.; Hardman, J.M.; Walde, S.J. Pollen availability for predaceous mites on apple: Spatial and temporal heterogeneity. Exp. Appl. Acarol. 2000, 24, 1–18. [Google Scholar] [CrossRef]
  70. Jones, G.D. Pollen analyses for pollination research, unacetolyzed pollen. J. Pollinat. Ecol. 2012, 9, 1–12. [Google Scholar] [CrossRef]
  71. Beug, H.-J. Leitfaden der Pollenbestimmung für Mitteleuropa und angrenzende Gebiete; Verlag Friedrich Pfeil: München, Germany, 2015; ISBN 9783899370430. [Google Scholar]
  72. Rossi, V.; Caffi, T.; Legler, S.E. Dynamics of ascospore maturation and discharge in Erysiphe necator, the causal agent of grape powdery mildew. Phytopathology 2010, 100, 1321–1329. [Google Scholar] [CrossRef] [PubMed]
  73. Londo, G. The decimal scale for releves of permanent quadrats. Vegetatio 1976, 33, 61–64. [Google Scholar] [CrossRef]
  74. European Environment Agency (EEA) EUNIS Habitat Type. Available online: https://eunis.eea.europa.eu/habitats.jsp (accessed on 23 October 2019).
  75. Jackson, H.B.; Fahrig, L. Are ecologists conducting research at the optimal scale? Glob. Ecol. Biogeogr. 2015, 24, 52–63. [Google Scholar] [CrossRef]
  76. Redlich, S.; Martin, E.A.; Steffan-Dewenter, I. Landscape-level crop diversity benefits biological pest control. J. Appl. Ecol. 2018, 55, 2419–2428. [Google Scholar] [CrossRef]
  77. Hoy, M.A.; Groot, J.J.R.; van de Baan, H.E. Influence of aerial dispersal on persistence and spread of pesticide-resistant Metaseiulus occidentalis in California almond orchards. Entomol. Exp. Appl. 1985, 37, 17–31. [Google Scholar] [CrossRef] [Green Version]
  78. Jung, C.; Croft, B.A. Aerial dispersal of phytoseiid mites (Acari: Phytoseiidae): Estimating falling speed and dispersal distance of adult females. Oikos 2001, 94, 182–190. [Google Scholar] [CrossRef]
  79. Environmental System Research Institute ArcGIS Desktop. Available online: http://desktop.arcgis.com/de (accessed on 23 October 2019).
  80. RStudio Team RStudio. Integrated Development for R; RStudio, Inc.: Boston, MA, USA. Available online: http://www.rstudio.com (accessed on 20 April 2020).
  81. Hesselbarth, M.H.K.; Sciaini, M.; With, K.A.; Wiegand, K.; Nowosad, J. Landscapemetrics: An open-source R tool to calculate landscape metrics. Ecography 2019, 42, 1648–1657. [Google Scholar] [CrossRef] [Green Version]
  82. OEPP/EPPO. Environmental risk assessment scheme for plant protection products, Chapter 10: Honeybees. Bull. OEPP/EPPO Bull. 2010, 40, 323–331. [Google Scholar]
  83. Lewis, K.A.; Tzilivakis, J.; Warner, D.J.; Green, A. An international database for pesticide risk assessments and management. Hum. Ecol. Risk Assess. An Int. J. 2016, 22, 1050–1064. [Google Scholar] [CrossRef] [Green Version]
  84. Austrian Federal Office for Food Safety (BAES). Pflanzenschutzmittel-Register—Verzeichnis der in Österreich Zugelassenen/Genehmigten Pflanzenschutzmittel. Available online: https://psmregister.baes.gv.at/psmregister/faces/main?_afrLoop=3293465951961555&_afrWindowMode=0&_adf.ctrl-state=18vmkamvgh_4 (accessed on 20 April 2020).
  85. National Assessment—Federal Republic of Germany Draft Registration Report—Central Zone, Product Code: ACH-07547-F-0-SPKumar: 007547-00/10. Available online: https://www.bvl.bund.de/SharedDocs/Downloads/04_Pflanzenschutzmittel/01_zulassungsberichte/007547-00-10.pdf?__blob=publicationFile&v=3 (accessed on 9 April 2020).
  86. Hassan, S.A. Standard methods to test the side-effects of pesticides on natural enemies of insects and mites developed by the lOBC/WPRS Working Group ‘Pesticides and Beneficial Organisms. Bull. OEPP/EPPO Bull. 1985, 15, 214–255. [Google Scholar] [CrossRef]
  87. Abteilung für Pflanzenschutzmittel und Anwendungstechnik Datenanforderungen und Entscheidungskriterien der Europäischen Union und der Bundesrepublik Deutschland im Zulassungsverfahren für Pflanzenschutzmittel. Mitt. Biol. Bundesanst. Land Forstwirtsch. 1998, 354, 1–156.
  88. Bundesamt für Verbraucherschutz und Lebensmittelsicherheit Verzeichnis zugelassener Pflanzenschutzmittel. Available online: https://apps2.bvl.bund.de/psm/jsp/index.jsp (accessed on 4 August 2020).
  89. R Core Team. R: A Language and Environment for Statistical Computing; R Foundation for Statistical Computing: Vienna, Austria. Available online: https://www.r-project.org (accessed on 20 April 2020).
  90. Laliberté, E.; Legendre, P.; Shipley, B. FD: Measuring Functional Diversity from Multiple Traits, and Other Tools for Functional Ecology (R Package Version 1.0-12). Available online: https://cran.r-project.org/web/packages/FD/index.html (accessed on 20 April 2020).
  91. Sarkar, D. Lattice: Multivariate Data Visualization with R.; Springer: New York, NY, USA, 2008; ISBN 978-0-387-75968-5. [Google Scholar]
  92. Fox, J.; Weisberg, S. An R Companion to Applied Regression, 3rd ed.; Sage: Thousand Oaks, CA, USA, 2019; ISBN 0-387-98454-2. [Google Scholar]
  93. Fox, J. Effect Displays in R for Generalised Linear Models. J. Stat. Softw. 2003, 8, 1–27. [Google Scholar] [CrossRef] [Green Version]
  94. Wei, T.; Simko, V. R Package “Corrplot”: Visualization of a Correlation Matrix (Version 0.84). Available online: https://github.com/taiyun/corrplot (accessed on 20 April 2020).
  95. Bates, D.; Maechler, M.; Bolker, B.; Walker, S. Fitting Linear Mixed-Effects Models Using lme4. J. Stat. Softw. 2015, 67, 1–48. [Google Scholar] [CrossRef]
  96. Bartoń, K. MuMIn: Multi-Model Inference. R Package Version 1.43.17. Available online: https://cran.r-project.org/package=MuMIn (accessed on 20 April 2020).
  97. Wickham, H. ggplot2: Elegant Graphics for Data Analysis; Springer: New York, NY, USA, 2016; ISBN 978-3-319-24277-4. [Google Scholar]
  98. Zuur, A.F.; Ieno, E.N.; Elphick, C.S. A protocol for data exploration to avoid common statistical problems. Methods Ecol. Evol. 2010, 1, 3–14. [Google Scholar] [CrossRef]
  99. O’Hara, R.B.; Kotze, D.J. Do not log-transform count data. Methods Ecol. Evol. 2010, 1, 118–122. [Google Scholar] [CrossRef] [Green Version]
  100. Curran-Everett, D. Explorations in statistics: The log transformation. Adv. Physiol. Educ. 2018, 42, 343–347. [Google Scholar] [CrossRef] [PubMed]
  101. Feng, C.; Wang, H.; Lu, N.; Chen, T.; He, H.; Lu, Y.; Tu, X.M. Log-transformation and its implications for data analysis. Shanghai Arch. Psychiatry 2014, 26, 105–109. [Google Scholar] [CrossRef]
  102. Bolker, B.M.; Gardner, B.; Maunder, M.; Berg, C.W.; Brooks, M.; Comita, L.; Crone, E.; Cubaynes, S.; Davies, T.; de Valpine, P.; et al. Strategies for fitting nonlinear ecological models in R, AD Model Builder, and BUGS. Methods Ecol. Evol. 2013, 4, 501–512. [Google Scholar] [CrossRef] [Green Version]
  103. Montgomery, D.C.; Peck, E.A.; Vining, G.G. Introduction to Linear Regression Analysis, 5th ed.; John Wiley & Sons, Inc.: Hoboken, NJ, USA, 2012; ISBN 978-0-470-54281-1. [Google Scholar]
  104. Posada, D.; Buckley, T.R. Model selection and model averaging in phylogenetics: Advantages of akaike information criterion and bayesian approaches over likelihood ratio tests. Syst. Biol. 2004, 53, 793–808. [Google Scholar] [CrossRef]
  105. Mazerolle, M.J. AICcmodavg: Model Selection and Multimodel Inference Based on (Q)AIC(c). R P Package Version 2.3-0. Available online: https://cran.r-project.org/web/packages/AICcmodavg/index.html (accessed on 20 April 2020).
  106. Burnham, K.P.; Anderson, D.R. Model Selection and Multimodel Inference a Practical Information-Theoretic Approach, 2nd ed.; Springer: New York, NY, USA, 2002; ISBN 0-387-95364-7. [Google Scholar]
  107. Motulsky, H.; Christopoulos, A. Fitting Models to Biological Data using Linear and Nonlinear Regression: A Practical Guide to Curve Fitting; Oxford University Press: Oxford, UK, 2004; ISBN 1425919448. [Google Scholar]
  108. Weaver, K.F.; Morales, V.; Dunn, S.L.; Godde, K.; Weaver, P.F. Pearson’s and Spearman’s Correlation. In An Introduction to Statistical Analysis in Research; Weaver, K.F., Morales, V., Dunn, S.L., Godde, K., Weaver, P.F., Eds.; John Wiley & Sons, Inc.: Hoboken, NJ, USA, 2017; pp. 435–471. ISBN 9781119454205. [Google Scholar]
  109. Schober, P.; Schwarte, L.A. Correlation coefficients: Appropriate use and interpretation. Anesth. Analg. 2018, 126, 1763–1768. [Google Scholar] [CrossRef]
  110. Revelle, W. psych: Procedures for Psychological, Psychometric, and Personality Research, R package version 2.0.9. Available online: https://cran.r-project.org/package=psych (accessed on 20 April 2020).
  111. Oksanen, J.; Guillaume Blanchet, F.; Friendly, M.; Kindt, R.; Legendre, P.; McGlinn, D.; Minchin, P.R.; O’Hara, R.B.; Simpson, G.L.; Solymos, P.; et al. Vegan: Community Ecology Package. R Package Version 2.5-6. Available online: https://cran.r-project.org/package=vegan (accessed on 20 April 2020).
  112. Paliy, O.; Shankar, V. Application of multivariate statistical techniques in microbial ecology. Mol. Ecol. 2016, 25, 1032–1057. [Google Scholar] [CrossRef] [PubMed] [Green Version]
  113. Clarke, K.R. Non-parametric multivariate analyses of changes in community structure. Aust. J. Ecol. 1993, 18, 117–143. [Google Scholar] [CrossRef]
  114. Oksanen, J. Multivariate Analysis of Ecological Communities in R: Vegan Tutorial. Available online: https://www.mooreecology.com/uploads/2/4/2/1/24213970/vegantutor.pdf (accessed on 20 April 2020).
  115. Hoffmann, C.; Köckerling, J.; Biancu, S.; Gramm, T.; Michl, G.; Entling, M.H. Can flowering greencover crops promote biological control in German vineyards? Insects 2017, 8, 121. [Google Scholar] [CrossRef] [PubMed] [Green Version]
  116. Duso, C.; Vettorazzo, E. Mite population dynamics on different grape varieties with or without phytoseiids released (Acari: Phytoseiidae). Exp. Appl. Acarol. 1999, 23, 741–763. [Google Scholar] [CrossRef]
  117. Duso, C.; Pozzebon, A.; Capuzzo, C.; Malagnini, V.; Otto, S.; Borgo, M. Grape downy mildew spread and mite seasonal abundance in vineyards: Effects on Tydeus caudatus and its predators. Biol. Control. 2005, 32, 143–154. [Google Scholar] [CrossRef]
  118. Linder, C.; Viret, O.; Spring, J.-L. Viticulture integree et bio-organique: Synthese de sept ans d’observation. Rev. Suisse Vitic. Arboric. Hortic. 2006, 38, 235–244. [Google Scholar]
  119. Reiff, J.M.; Ehringer, M.; Hoffmann, C.; Entling, M.H. Fungicide reduction favors the control of phytophagous mites under both organic and conventional viticulture. Agric. Ecosyst. Environ. 2021, 305. [Google Scholar] [CrossRef]
  120. Hluchý, M.; Pospíšil, Z.; Zacharda, M. Phytophagous and predatory mites (Acari: Tetranychidae, Eriophyidae, Phytoseiidae, Stigmaeidae) in South Moravian vineyards, Czechoslovakia, treated with various types of chemicals. Exp. Appl. Acarol. 1991, 13, 41–52. [Google Scholar] [CrossRef]
  121. James, D.G.; Price, T.S.; Wright, L.C.; Perez, J. Abundance and phenology of mites, leafhoppers, and thrips on pesticide-treated and untreated wine grapes in southcentral Washington. J. Agric. Urban Entomol. 2002, 19, 45–54. [Google Scholar]
  122. Pennington, T.; Kraus, C.; Alakina, E.; Entling, M.H.; Hoffmann, C. Minimal pruning and reduced plant protection promote predatory mites in Grapevine. Insects 2017, 8, 86. [Google Scholar] [CrossRef] [PubMed] [Green Version]
  123. Costello, M.J. Impact of sulfur on density of Tetranychus pacificus (Acari: Tetranychidae) and Galendromus occidentalis (Acari: Phytoseiidae) in a central California vineyard. Exp. Appl. Acarol. 2007, 42, 197–208. [Google Scholar] [CrossRef] [Green Version]
  124. Pozzebon, A.; Duso, C.; Pavanetto, E. Side effects of some fungicides on phytoseiid mites (Acari, Phytoseiidae) in north-Italian vineyards. J. Pest Sci. 2002, 75, 132–136. [Google Scholar] [CrossRef]
  125. Kemmitt, G.; Valverde-Garcia, P.; Hufnagl, A.; Bacci, L.; Zotz, A. The impact of three commonly used fungicides on Typhlodromus pyri (Acari: Phytoseiidae) in European vineyards. J. Econ. Entomol. 2015, 108, 611–620. [Google Scholar] [CrossRef]
  126. English-Loeb, G.; Norton, A.P.; Gadoury, D.M.; Seem, R.C.; Wilcox, W.F. Control of powdery mildew in wild and cultivated grapes by a tydeid mite. Biol. Control. 1999, 14, 97–103. [Google Scholar] [CrossRef]
  127. Maixner, M. Studies on the insecticide resistance of the predatory mite Typhlodromus pyri on grapevines of the wine-region Mosel-Saar-Ruwer. Mitt. Biol. Bundesanst. Land Forstwirtsch. Berlin Dahl. 1990, 257, 118. [Google Scholar]
  128. Blümel, S.; Bakker, F.M.; Baier, B.; Brown, K.; Candolfi, M.P.; Goßmann, A.; Grimm, C.; Jäckel, B.; Nienstedt, K.; Schirra, K.J.; et al. Laboratory residual contact test with the predatory mite Typhlodromus pyri Scheuten (Acari: Phytoseiidae) for regulatory testing of plant protection products. In Guidelines to Evaluate Side-Effects of Plant Protection Products to Non-Target Arthropods; Candolfi, M.P., Blümel, S., Forster, R., Bakker, F.M., Grimm, C., Hassan, S.A., Heimbach, U., Mead, M., Reber, B.F., Schmuck, R., Vogt, H., Eds.; IOBC/WPRS: Gent, Belgium, 2000; pp. 121–143. ISBN 92-9067-129-7. [Google Scholar]
  129. Daane, K.M.; Hogg, B.N.; Wilson, H.; Yokota, G.Y. Native grass ground covers provide multiple ecosystem services in Californian vineyards. J. Appl. Ecol. 2018, 55, 2473–2483. [Google Scholar] [CrossRef] [Green Version]
  130. Lorenzon, M.; Pozzebon, A.; Duso, C. Effects of potential food sources on biological and demographic parameters of the predatory mites Kampimodromus aberrans, Typhlodromus pyri and Amblyseius andersoni. Exp. Appl. Acarol. 2012, 58, 259–278. [Google Scholar] [CrossRef]
  131. Mailloux, J.; Le Bellec, F.; Kreiter, S.; Tixier, M.S.; Dubois, P. Influence of ground cover management on diversity and density of phytoseiid mites (Acari: Phytoseiidae) in Guadeloupean citrus orchards. Exp. Appl. Acarol. 2010, 52, 275–290. [Google Scholar] [CrossRef] [PubMed]
  132. De Villiers, M.; Pringle, K.L. The presence of Tetranychus urticae (Acari: Tetranychidae) and its predators on plants in the ground cover in commercially treated vineyards. Exp. Appl. Acarol. 2011, 53, 121–137. [Google Scholar] [CrossRef]
  133. Wari, D.; Funayama, K.; Kishimoto, H.; Toyama, M.; Sonoda, S. Molecular verification of dispersal of phytoseiid mites from groundcover plants to tree leaves in Japanese peach orchards. Biol. Control. 2015, 80, 143–155. [Google Scholar] [CrossRef]
  134. Sahraoui, H.; Kreiter, S.; Lebdi-Grissa, K.; Tixier, M.S. Sustainable weed management and predatory mite (acari: Phytoseiidae) dynamics in Tunisian citrus orchards. Acarologia 2016, 56, 517–532. [Google Scholar] [CrossRef] [Green Version]
  135. Duffner, K. Untersuchungen zur Biologie, Morphologie und Bekämpfung der Kräuselmilbe Calepitrimerus vitis Nalepa 1905 (Acari, Eriophyoidea). Ph.D. Thesis, University of Freiburg, Freiburg im Breisgau, Germany, 1999. [Google Scholar]
  136. Duso, C.; De Lillo, E. 3.2.5 Grape. In Eriophyoid Mites Their Biology, Natural Enemies and Control; Lindquist, E.E., Sabelis, M.W., Bruin, J., Eds.; World Crop Pests; Elsevier: Amsterdam, The Netherlands, 1996; Volume 6, pp. 571–582. ISBN 9780080531236. [Google Scholar]
  137. Hluchý, M. Zur biologischen Bekämpfung der Kräuselmilbe Calepitrimerus vitis Nalepa (Acari, Eriophyidae) auf der Weinrebe durch die Raubmilbe Typhlodromus pyri Scheuten (Acari, Phytoseiidae). J. Appl. Entomol. 1993, 116, 449–458. [Google Scholar] [CrossRef]
  138. Rusch, A.; Delbac, L.; Thiéry, D. Grape moth density in Bordeaux vineyards depends on local habitat management despite effects of landscape heterogeneity on their biological control. J. Appl. Ecol. 2017, 54, 1794–1803. [Google Scholar] [CrossRef] [Green Version]
  139. Wilson, H.; Miles, A.F.; Daane, K.M.; Altieri, M.A. Landscape diversity and crop vigor influence biological control of the western grape leafhopper (E. elegantula Osborn) in vineyards. PLoS ONE 2015, 10. [Google Scholar] [CrossRef] [Green Version]
  140. Judt, C.; Guzmán, G.; Gómez, J.A.; Cabezas, J.M.; Entrenas, J.A.; Winter, S.; Zaller, J.G.; Paredes, D. Diverging effects of landscape factors and inter-row management on the abundance of beneficial and herbivorous arthropods in andalusian vineyards (Spain). Insects 2019, 10, 320. [Google Scholar] [CrossRef] [Green Version]
  141. Gavinelli, F.; Fusaro, S.; Ivan, D.; Ragusa, S.; Paoletti, M.G. Unpredicted ecological and ecosystem services of biodiversity. Spontaneous vegetation, hedgerows, and maple trees as useful landscape components to increase predatory mite population in agroecosystems. Appl. Soil Ecol. 2020, 154. [Google Scholar] [CrossRef]
  142. Tixier, M.S.; Kreiter, S.; Auger, P.; Weber, M. Colonization of Languedoc vineyards by phytoseiid mites (Acari: Phytoseiidae): Influence of wind and crop environment. Exp. Appl. Acarol. 1998, 22, 523–542. [Google Scholar] [CrossRef]
  143. Tixier, M.S.; Kreiter, S.; Cheval, B.; Guichou, S.; Auger, P.; Bonafos, R. Immigration of phytoseiid mites from surrounding uncultivated areas into a newly planted vineyard. Exp. Appl. Acarol. 2006, 39, 227–242. [Google Scholar] [CrossRef]
  144. Kreiter, S.; Sentenac, G.; Rusch, A.; Zriki, G.; Thiery, J.; Delbac, L.; Madejsky, M.; Guisset, M.; Tixier, M.S. Effects of the plot landscape and pollen concentration on phytoseiid mites (Acari: Phytoseiidae) in three French viticultural regions. In Proceedings of the AFPP—11e Conférence Internationale sur les Ravageurs et Auxiliaires en Agriculture, Montpellier, France, 25–26 October 2017; pp. 361–370. [Google Scholar]
  145. Fischer-Colbrie, P.; El-Borolossy, M. Untersuchungen zum Einfluß des Klimas, der Pflanzenart und der Wirtstiere auf das Vorkommen verschiedener Raubmilbenarten im österreichischen Obst- und Weinbau. Pflanzenschutzberichte 1990, 51, 101–124. [Google Scholar]
  146. Ahmad, S.; Pozzebon, A.; Duso, C. Predation on heterospecific larvae by adult females of Kampimodromus aberrans, Amblyseius andersoni, Typhlodromus pyri and Phytoseius finitimus (Acari: Phytoseiidae). Exp. Appl. Acarol. 2015, 67, 1–20. [Google Scholar] [CrossRef] [PubMed]
  147. Kingsolver, J.G.; Diamond, S.E.; Buckley, L.B. Heat stress and the fitness consequences of climate change for terrestrial ectotherms. Funct. Ecol. 2013, 27, 1415–1423. [Google Scholar] [CrossRef]
  148. Landers, A.J. Spray technology for grapevines. In Compendium of Grape Diseases, Disorders, and Pests; Wilcox, W.F., Gubler, W.D., Uyemoto, J.K., Eds.; The American Phytopathological Society: St. Paul, MN, USA, 2015; pp. 185–192. ISBN 978-0-89054-479-2. [Google Scholar]
  149. Faegri, K.; Iversen, J.; Waterbolk, H.T. Textbook of Pollen Analysis, 2nd ed.; Munksgaard: Copenhagen, Denmark, 1964. [Google Scholar]
Figure 1. Image of the study area: (b) study area located in eastern Austria at the Neusiedlersee-Hügelland (Leithaberg); (a) aerial image [61] with the location of the vineyards including woods (green) and the lake Neusiedl (blue). Each circle (diameter of 500 m) includes two paired vineyards differing in management type (integrated versus organic).
Insects 12 00180 g001
Figure 2. Densities in different scales (mean ± standard deviation (SD)) from 2019 of (a) phytoseiid, (b) eriophyoid, and (c) tydeoid mites per 100 cm2 vine leaf area for each sampling date split between integrated and organic vineyards. Densities (mean ± SD) of (d) pollen per square centimeter on vine leaves per sampling date with the total pollen and split into five most abundant pollen types. The pollen type Moraceae was merged with Urticaceae due to similar morphological characteristics.
Insects 12 00180 g002
Figure 3. Effect plots of log10(y + 1) phytoseiid mite densities per 100 cm2 vine leaf area in response to (a) management (organic and integrated), (b) cover crop type (poor = species-poor, rich = species-rich cover crop mixture, and spontaneous = spontaneous vegetation), (c) proportion of vineyards in the landscape, (d) proportion of total semi-natural habitats (SNHs) in the landscape, and (e) sampling date in 2019 (1 = 7 May, 2 = 3 June, 3 = 1 July, 4 = 29 July, and 5 = 26 August) from the most parsimonious GLM (date + management + cover crop type + proportion of vineyards + proportion of total semi-natural habitats (SNHs)). Error bars/gray shading indicate 0.95 confidence intervals.
Insects 12 00180 g003
Figure 4. Effect plots of log10(y + 1) tydeoid mite densities per 100 cm2 vine leaf area in response to (a) management (organic and integrated), (b) cover crop type (poor = species-poor, rich = species-rich cover crop mixture, and spontaneous = spontaneous vegetation cover), (c) proportion of vineyards in the landscape, and (d) sampling date in 2019 (1 = 7 May, 2 = 3 June, 3 = 1 July, 4 = 29 July, and 5 = 26 August). (b,d) originate from the most parsimonious GLM (date + cover crop type); (a,c) from the third most parsimonious GLM (date + management + cover crop type + proportion of vineyards, Δi = 1.8). Error bars/gray shading indicate 0.95 confidence intervals.
Insects 12 00180 g004
Figure 5. Effect plots of log10(y + 1) eriophyoid mite densities per 100 cm2 vine leaf area in response to (a) vegetation cover in summer, (b) vegetation cover in spring, (c) proportion of vineyards in the landscape, (d) phytoseiid mite densities per 100 cm2 leaf area, and (e) sampling date in 2019 (1 = 7 May, 2 = 3 June, 3 = 1 July, 4 = 29 July, and 5 = 26 August). (a,ce) originated from the most parsimonious GLM (date + proportion of vineyards + vegetation cover summer + densities of phytoseiid mites) and (b) from the third most parsimonious GLM (date + proportion of vineyards + vegetation cover summer + vegetation cover spring, Δi = 1.97). Error bars/gray shading indicate 0.95 confidence intervals.
Insects 12 00180 g005
Figure 6. Effect plots of log10(y + 1) pollen densities per square centimeter vine leaf area in response to (a) management (organic and integrated), (b) cover crop type (poor = species-poor, rich = species-rich cover crop mixture, and spontaneous = spontaneous vegetation cover), (c) proportion of vineyards in the landscape, (d) minimum distance to next woody semi-natural habitats (SNHs), and (e) sampling date in 2019 (1 = 7 May, 2 = 3 June, 3 = 1 July, 4 = 29 July, and 5 = 26 August). (a,d,e) originated from most parsimonious GLM (date + management + minimum distance to next woody SNHs), (b) from the fifth most parsimonious GLM (date + cover crop type, Δi = 1.49), and (c) from the eight most parsimonious GLM (date + management + proportion of vineyards + minimum distance to next woody SNHs, Δi = 1.84). Error bars/gray shading indicate 0.95 confidence intervals.
Insects 12 00180 g006
Table 1. Summary of management-related numeric explanatory variables (mean ± SD): pesticide use and inter-row vegetation cover split between organic (n = 16) and integrated (n = 16) vineyards. The number of pesticide applications (total) is subdivided into a more precise list of applications of different pesticides. For further information of the used active ingredients, see Table S1.
Management-Related Numeric Explanatory VariablesOrganicIntegrated
aAPTLc (area-related acute pesticide contact toxicity loading)19.91 ± 6.6910.63 ± 14.59
Categorical toxicity rating for Typhlodromus pyri14.65 ± 3.5713.19 ± 5.13
Number of pesticide applications (total)9.69 ± 1.76.31 ± 2.24
Insecticide applications0 ± 00.25 ± 0.45
Acaricide applications0.25 ± 0.450.38 ± 0.5
Synthetic fungicide applications0 ± 05.79 ± 2.58
Sulfur applications9.19 ± 1.64.13 ± 1.84
Copper applications8.88 ± 1.841.25 ± 0.83
Potassium bicarbonate applications4.44 ± 2.760 ± 0
Vegetation cover in spring (%)82.38 ± 18.9480.84 ± 19.51
Vegetation cover in summer (%)61.70 ± 22.2640.36 ± 24.78
Table 2. AICc (second-order Akaike Information Criterion) values for model selection of the response variables, out of 42 different generalized linear models (GLMs), Δi = difference between AICc to the next best model. SNHs = semi-natural habitats.
Response
Variable
Best ModelAICcΔiAdjusted R2
Phytoseiid mite densitiesnull model37.22--
date + management + cover crop type + proportion of vineyards + proportion of total SNHs−45.870.00.44
date + management + cover crop type + proportion of vineyards + proportion of total SNHs + pollen total−43.742.130.44
Tydeoid mite densitiesnull model9.22--
date + cover crop type−90.550.00.49
date + management + cover crop type−89.710.840.49
date + management + cover crop type + proportion of vineyards−88.751.800.49
date + management + cover crop type + proportion of total SNHs−87.972.580.49
Eriophyoid mite densitiesnull model−158.21--
date + proportion of vineyards + vegetation cover summer + densities of phytoseiid mites−221.320.00.36
date + proportion of vineyards + vegetation cover summer−220.291.030.35
date + proportion of vineyards + vegetation cover summer + vegetation cover spring−219.351.970.35
date + vegetation cover summer −218.203.120.34
Pollen densitiesnull model150.85--
date + management + minimum distance to the next woody SNHs−10.430.00.65
date + management−10.040.390.65
date + minimum distance to the next woody SNHs−9.720.710.65
date−9.530.900.64
date + cover crop type−8.941.490.65
date + management + cover crop type + minimum distance to the next woody SNHs−8.641.790.65
date + management + cover crop type−8.601.830.65
date + management + proportion of vineyards + minimum distance to the next woody SNHs−8.591.840.65
date + management + proportion of total SNHs + minimum distance to the next woody SNHs−8.342.090.65
Publisher’s Note: MDPI stays neutral with regard to jurisdictional claims in published maps and institutional affiliations.

