Article

Mitochondrial Genomes of Two Asexual Trichogramma (Hymenoptera: Trichogrammatidae) Strains and Comparison with Their Sexual Relatives

1
Department of Entomology, Nanjing Agricultural University, Nanjing 210095, China
2
Key Laboratory of Integrated Pest Management in Crops in Eastern China (Nanjing Agricultural University), Ministry of Agriculture, Nanjing 210095, China
*
Author to whom correspondence should be addressed.
Submission received: 19 May 2022 / Revised: 30 May 2022 / Accepted: 15 June 2022 / Published: 16 June 2022
(This article belongs to the Section Insect Systematics, Phylogeny and Evolution)

Abstract

:

Simple Summary

Sexual reproduction is dominant in animals, while asexual lineages are rare and evolutionarily short-lived. However, sexual reproduction has substantial costs, such as male production, inputs to courtship and mating, increased risk of predator exposure, and sexually transmitted diseases. A large body of theories has been proposed to explain the paradox of sex. One favored explanation is that asexuals are more likely to accumulate a greater number of deleterious mutations, known as Muller’s ratchet. Trichogramma is a genus of egg parasitoid wasps and is widely used as a biological control agent for agricultural and forest pests. With asexual lineages in at least 16 species, Trichogramma provides an excellent model to investigate the causes and consequences of asexual reproduction. In this study, we sequenced and assembled two asexual Trichogramma mitogenomes, representing two divergent origins of asexual reproduction. The asexual T. pretiosum is induced by the endosymbiont Wolbachia, while T. cacoeciae presumably originates from interspecific hybridization. To test Muller’s ratchet hypothesis, we compared these two asexual mitogenomes with their sexual relatives and found no association between asexual reproduction and mutation accumulation. This study provides a basis for further investigation into mitochondrial evolution and asexual reproduction in Trichogramma.

Abstract

Despite its substantial costs, sexual reproduction dominates in animals. One popular explanation for the paradox of sex is that asexual reproduction is more likely to accumulate deleterious mutations than sexual reproduction. To test this hypothesis, we compared the mitogenomes of two asexual wasp strains, Trichogramma cacoeciae and T. pretiosum, to their sexual relatives. These two asexual strains represent two different transition mechanisms in Trichogramma from sexual to asexual reproduction. Asexual T. pretiosum is induced by Wolbachia, while T. cacoeciae presumably originated from interspecific hybridization. We sequenced and assembled complete mitochondrial genomes of asexual T. cacoeciae and T. pretiosum. Compared to four sexual relatives, we found no evidence of higher mutation accumulation in asexual Trichogramma mitogenomes than in their sexual relatives. We also did not detect any relaxed selection in asexual Trichogramma mitogenomes. In contrast, the intensified selection was detected in Nad1 and Nad4 of the asexual T. pretiosum mitogenome, suggesting more purifying selection. In summary, no higher mitochondrial mutation accumulation was detected in these two asexual Trichogramma strains. This study provides a basis for further investigating mitochondrial evolution and asexual reproduction in Trichogramma.

1. Introduction

Sex is one of the most important evolutionary innovations [1]. Compared to asexual reproduction, sexual reproduction has substantial costs, such as male production, inputs to courtship and mating, and increased risks of predator exposure and sexually transmitted diseases [2,3]. Despite these apparent costs, sex is the overwhelmingly dominant mode of reproduction in animals. Asexual animals are rare, although they are distributed among various evolutionary taxa, e.g., insects, mites, rotifers, reptiles, amphibians, and fishes [4]. Asexual lineages are also mostly of recent origins from sexual lineages, occupying the terminals on the tree of life. This suggests that asexual reproduction is an evolutionary dead-end that eventually leads to extinction [4]. Why does sexual reproduction dominate in animals? It remains a mystery and one of the greatest puzzles in biology [1].
Many hypotheses have been proposed to explain the paradox of sex [1]. One class of favored explanations is that sexual reproduction can remove deleterious mutations more effectively through recombination and selection [5]. On the other hand, as all loci are linked, asexual reproduction is more likely to accumulate deleterious mutations in a stochastic (Muller’s ratchet) or deterministic (Kondrashov’s hatchet) manner and leads to population decay and extinction [5]. The prediction of accelerated mutation accumulation in asexual lineages can also be extended to nonrecombining mitochondrial genes [6,7]. This is because mitogenomes cannot be segregated from nuclear loci in asexual organisms, similar to the inability to recombine between nuclear loci. The complete linkage with the entire nucleus leads to less efficient purifying selection and the accumulation of more deleterious mutations [6,7].
The validity of these theories can be tested by comparison between asexual lineages and their sexual relatives. Several studies have shown excess mutation accumulation in both mitochondrial and nuclear genomes of asexual lineages [8,9,10,11,12]. For example, in the microcrustacean Daphnia pulex, mitochondrial protein-coding genes accumulate deleterious mutations in asexual lineages at four times the rate of their sexual relatives [11]. Relaxed selection was detected in these asexual lineages [6]. However, a nonnegligible number of studies have indicated that there is no relationship between asexual reproduction and excess mutation accumulation [13,14,15,16,17,18]. Even a recent study showed that asexual lineages have more efficient purifying selection than their sexual relatives in oribatid mites [19].
In insects, asexual reproduction is rare but widely distributed among both Hemimetabola and Holometabola [20,21]. Trichogramma is a hymenopteran genus of egg parasitoid wasps and is widely used as a biological control agent for agricultural and forest pests [22]. As only female parasitoid wasps can parasitize pest hosts, asexual reproduction is particularly significant in biocontrol to increase the production of pest-killing female parasitoids [23]. In Trichogramma, several asexual strains have been reported [24,25]. In most of them, asexual reproduction is caused by the endosymbiont Wolbachia, and antibiotics or high temperatures can restore normal sexual reproduction [26,27]. There are also asexual Trichogramma strains, which cannot be cured by antibiotics or high temperatures [26]. For example, cytogenetic studies revealed that asexual T. cacoeciae is maintained through an apomictic mechanism, where meiotic cells divide only once followed by the expulsion of a single polar body [28]. It is entirely different from the mechanism of Wolbachia-induced asexual reproduction through gamete duplication [29]. Consistent with these mechanisms, Wolbachia-induced asexual Trichogramma females are completely homozygous [29], while asexual T. cacoeciae individuals are highly heterozygous, presumably resulting from interspecific hybridization [28]. Thus, Trichogramma provides an excellent model to investigate the causes and consequences of asexual reproduction with at least two different modes of transition from sexual to asexual reproduction.
In this study, we sequenced the mitochondrial genomes of two asexual Trichogramma strains. The asexual T. pretiosum is induced by Wolbachia [18], while the asexual T. cacoeciae presumably originates from interspecific hybridization [28]. We reported the full-length mitogenomes of these two asexual Trichogramma strains and compared their features with those of mitogenomes from four sexual Trichogramma. Specifically, we tested whether these Trichogramma asexual mitogenomes show more mutation accumulation than those from their sexual relatives.

2. Materials and Methods

2.1. Sample Preparation and DNA Extraction

Trichogramma cacoeciae was retrieved from the Beijing Academy of Agriculture and Forestry Sciences, and T. pretiosum was retrieved from Hainan University. As previously described [30], Trichogramma wasps were reared in the Insectary of Nanjing Agricultural University using UV-irradiated Corcyra cephalonica eggs as hosts. Trichogramma specimens were stored in 100% ethanol at −20 °C before DNA extraction. According to the manufacturer’s protocol, DNA from a single Trichogramma wasp was extracted using the Wizard SV Genomic DNA Purification System Kit (Promega Beijing Biotech, Beijing, China).

2.2. Mitochondrial Genome Sequencing

Initial PCRs were conducted using previously reported Cox1 universal primers [31] (FP1 and RP1; Table S1). PCR products were Sanger-sequenced (Tsingke Biotech, Nanjing, China). Based on the sequenced Cox1, taxon-specific primers (FP2 and RP2 for T. cacoeciae; FP3 and RP3 for T. pretiosum; Table S1) for long PCR were designed using Primer Premier 5 [32]. Long PCRs for the near full-length mitogenomes were conducted using Tks Gflex DNA Polymerase (Takara Bio Inc., Kusatsu City, Japan). The PCR cycling settings were as follows: activation at 98 °C for 2 min, followed by 35 cycles of denaturing at 98 °C for 10 s, annealing at 55 °C for 10 s, and extension at 68 for 10 min. For Illumina sequencing of long PCR products, libraries were prepared using the TruSeq Nano DNA LT Prep Kit (Illumina, San Diego, CA, USA) according to the manufacturer’s protocol. For T. cacoeciae, the library was sequenced using Illumina HiSeq X Ten with PE150 mode by Biozeron Co. Ltd., Shanghai, China. For T. pretiosum, the library was sequenced using an Illumina NovaSeq 6000 with PE150 mode by Annoroad Gene Technology Co., Ltd., Beijing, China.

2.3. Mitochondrial Genome Assembly

For T. cacoeciae, the full-length mitogenome was assembled by Geneious v9.1.4 [33] using Illumina reads and the Sanger-sequenced Cox1 sequence. For T. pretiosum, Illumina reads were first assembled using MitoZ v2.4 [34], and the Cox1 sequence was then merged into the assembly using Geneious v9.1.4. Since there was still a gap between Cox1 and Cox3, additional primers, FP4 and RP4, were designed using Primer Premier 5 to fill this gap (Figure 1; Table S1). We also noticed an erroneous insertion of 14 amino acids within Nad4l in the T. pretiosum mitogenome assembly. A pair of primers, FP5 and RP5, were designed for amplification and Sanger-sequencing of this insertion region (Figure 1; Table S1). This erroneous insertion was corrected by the Sanger-sequencing result. PCRs in this section were performed using Rapid Taq Master Mix (Vazyme, Nanjing, China). The PCR cycling settings were as follows: activation for 3 min at 95 °C, followed by 35 cycles of 30 s at 95 °C, 30 s at 54 °C, and 1 min at 68 °C. The final cycle was followed by an extension of 10 min at 68 °C.

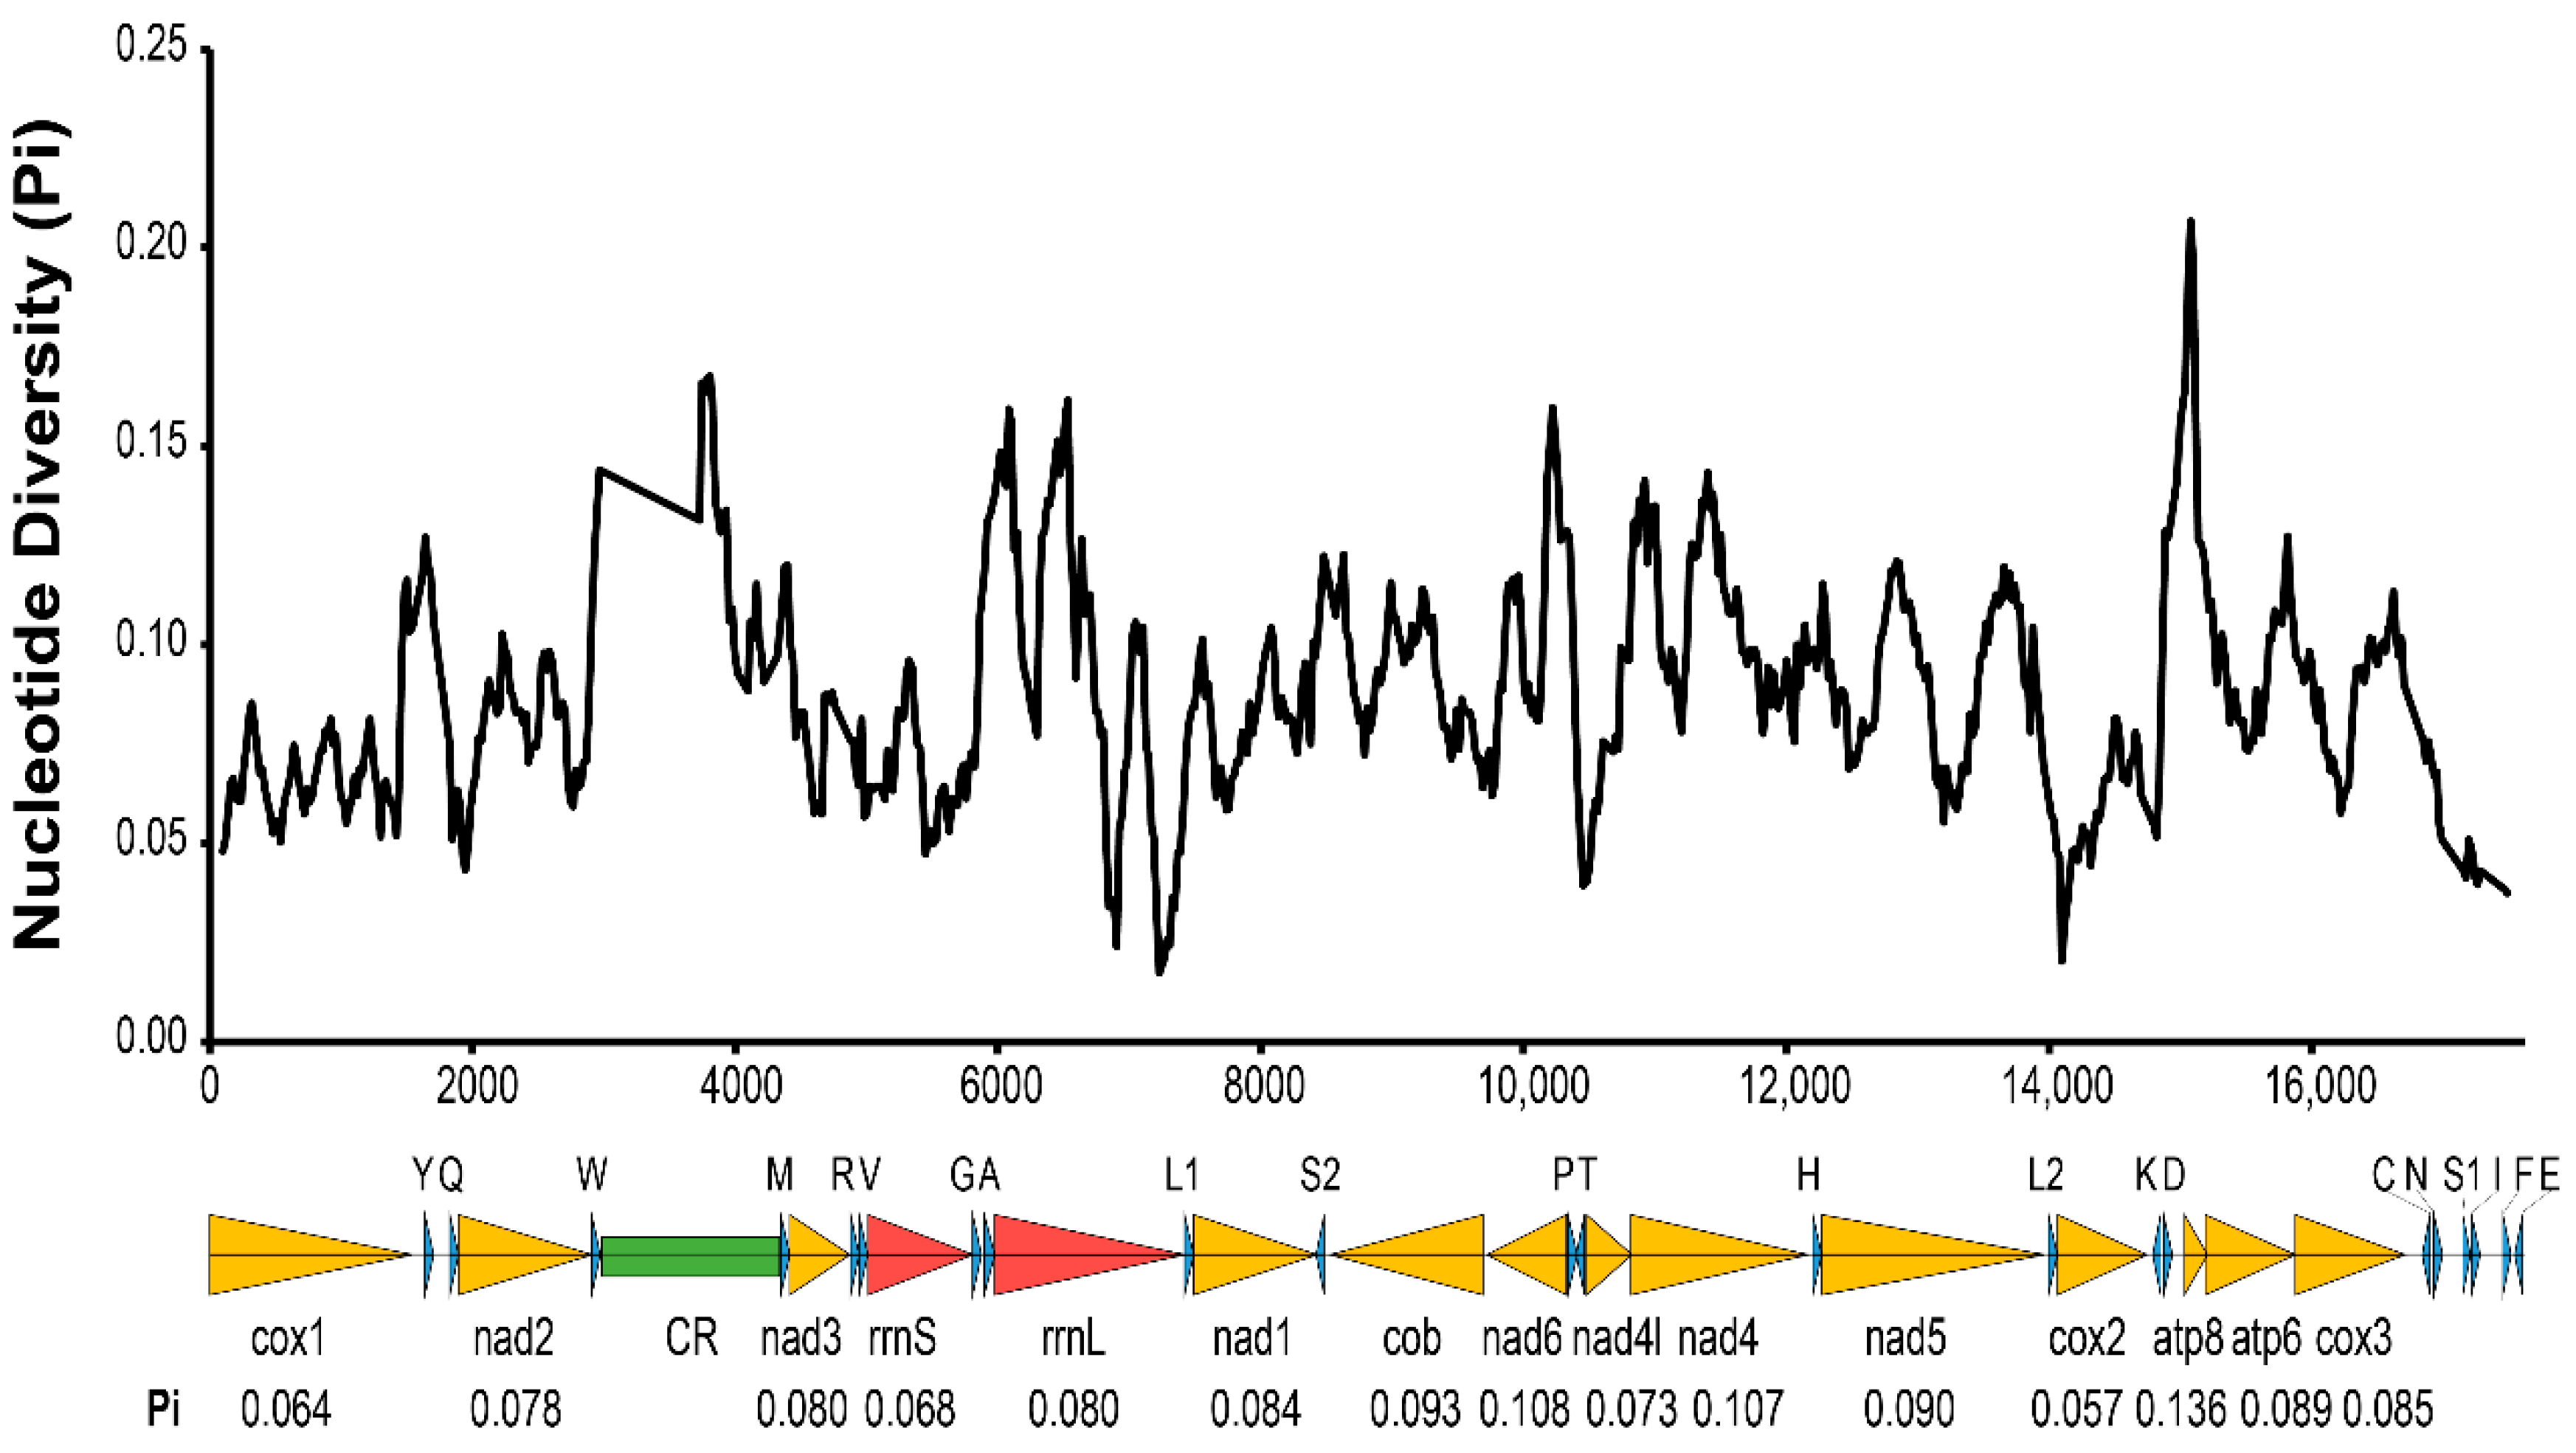
2.4. Gene Annotation and Nucleotide Diversity Analyses

Gene annotation was performed using the MITOS web service [35]. tRNAs were also predicted by the ARWEN web service [36]. All mitochondrial genes were manually checked based on mitogenome alignments. Nucleotide diversity (Pi) was calculated for 13 mitochondrial protein-coding genes (PCGs) and two mitochondrial ribosomal RNAs (rRNA) using DNASP v6 [37]. Window slide nucleotide diversity was also estimated for 7 aligned Trichogramma mitogenomes using DNASP v6. The window size was set as 200 bp, and the step was set as 20 bp. Sites with gaps were excluded as the default setting in DNASP.

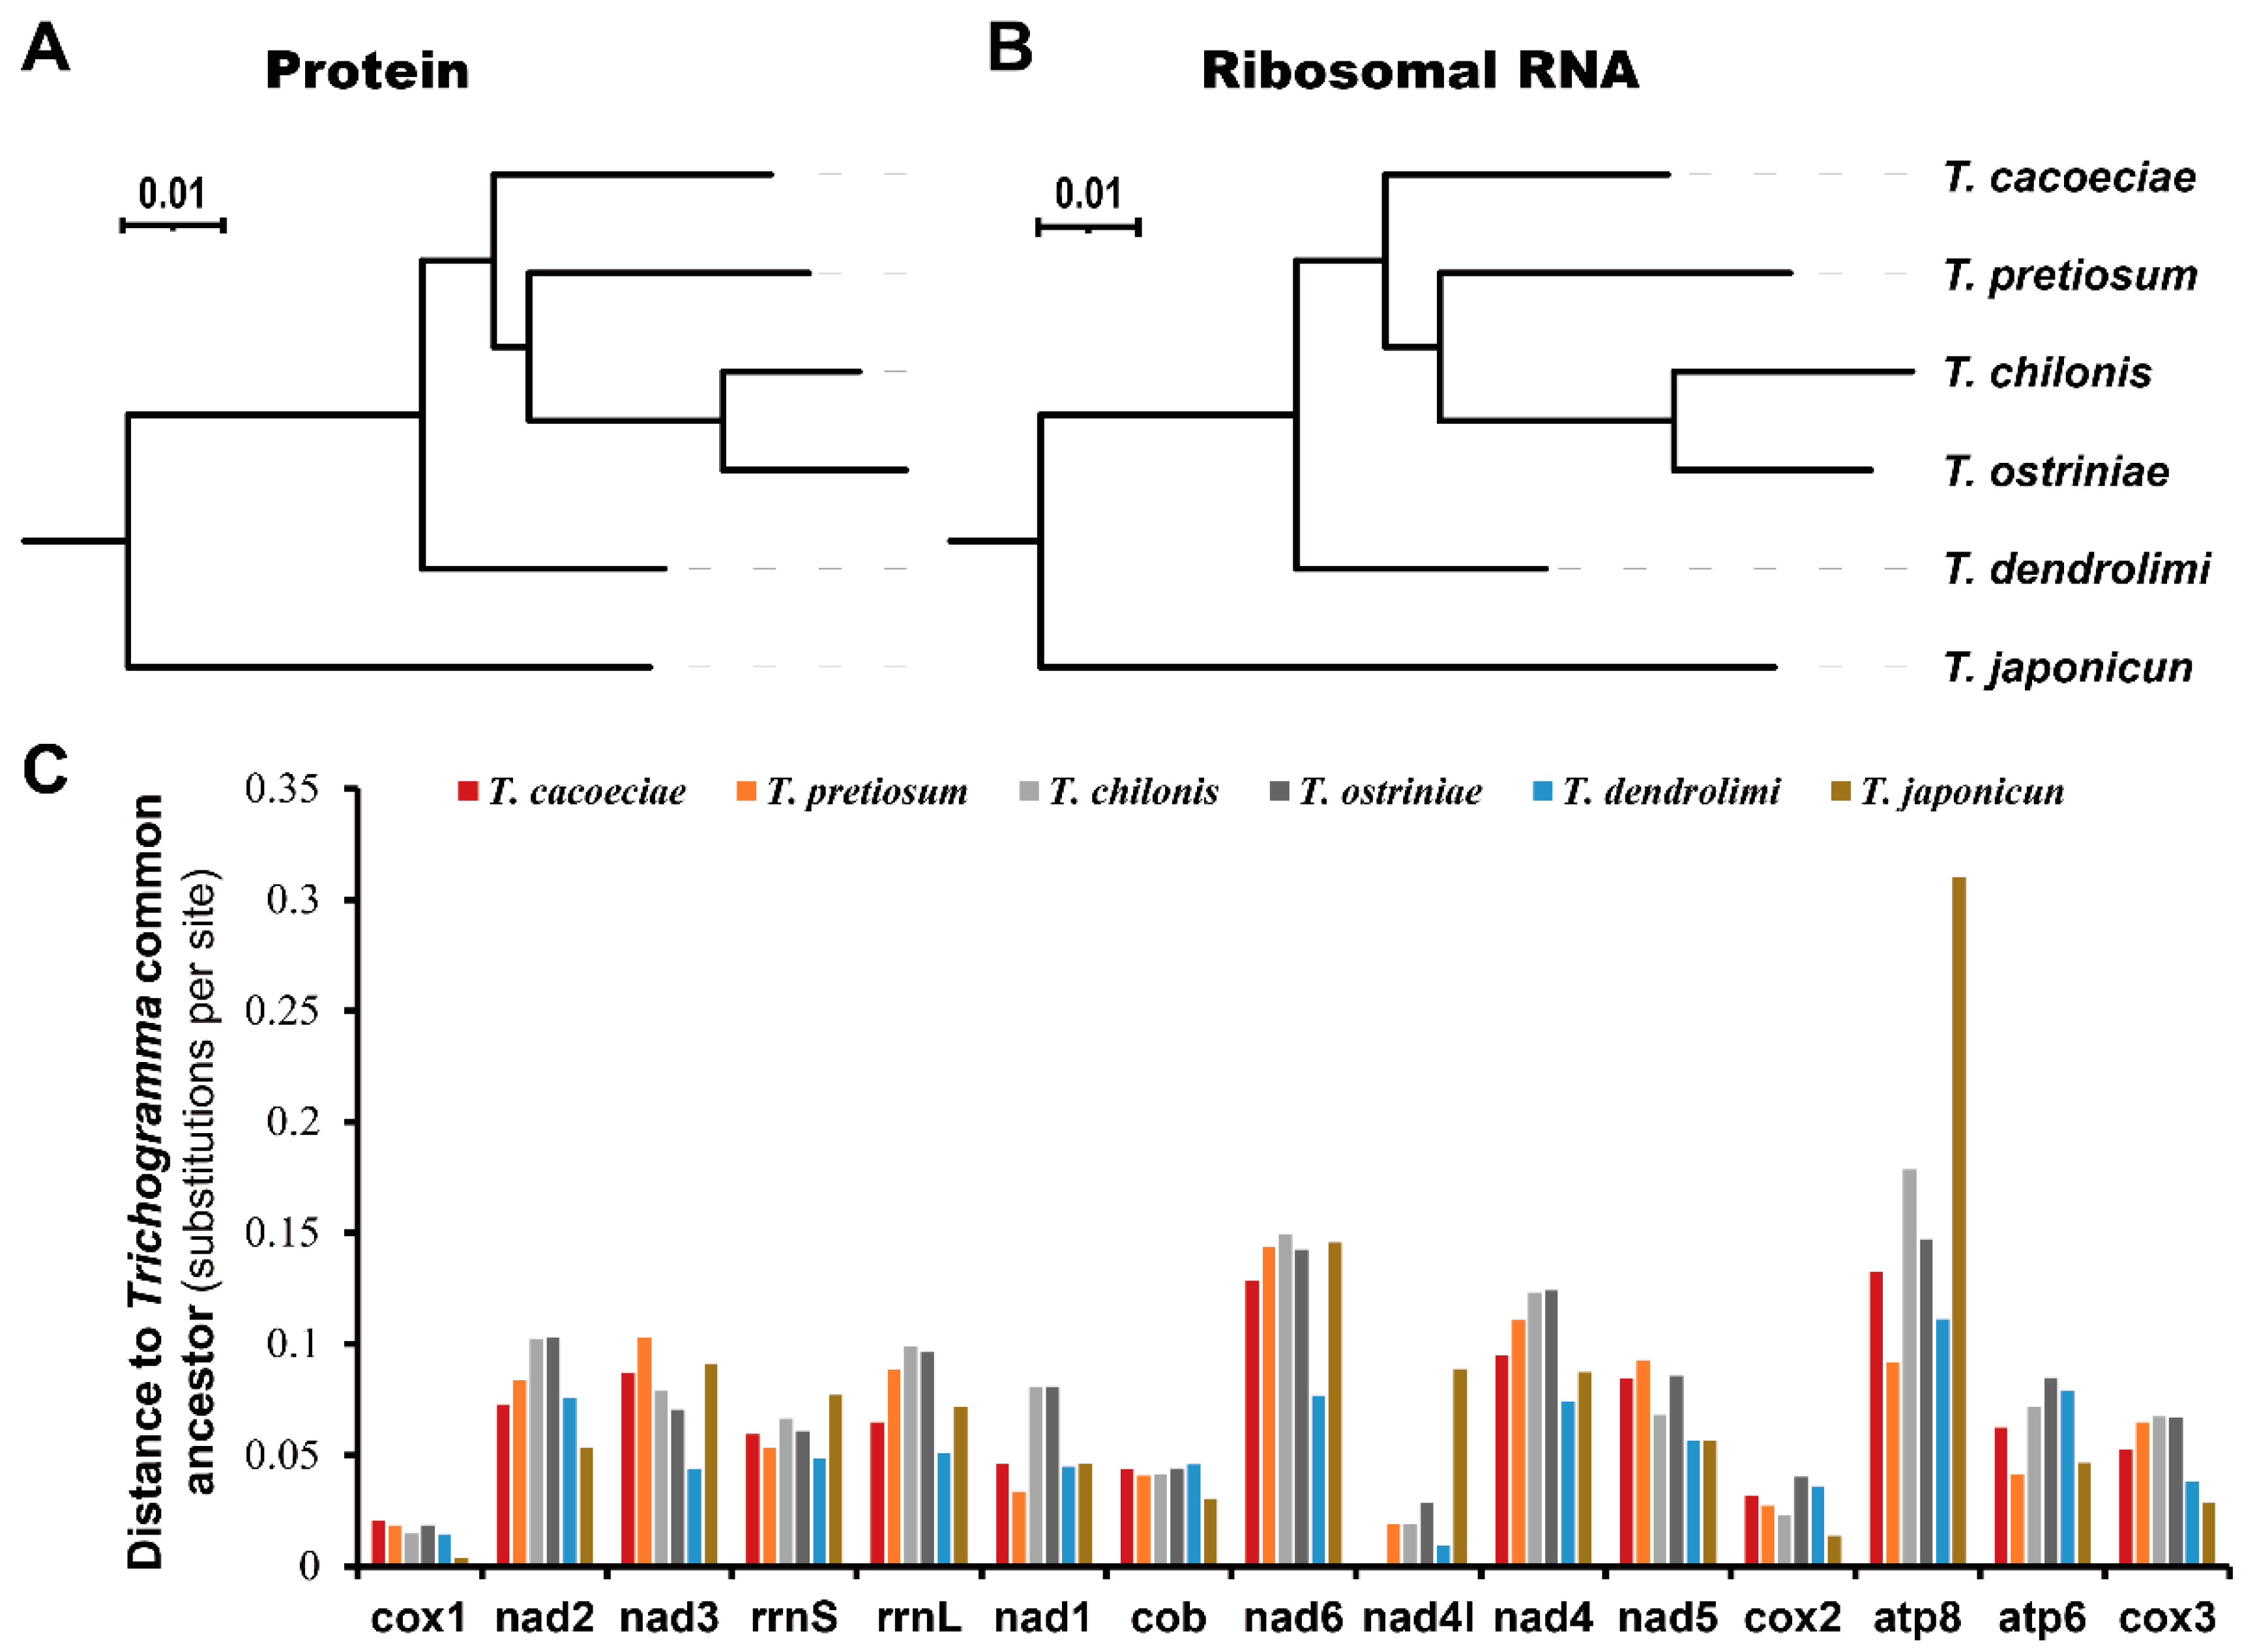
2.5. Phylogenetic Analyses

Mitochondrial proteins were aligned using Mafft v7.487 with LINSI mode [38]. Alignments were filtered and then translated back to codon sequences using trimAl v1.4.rev15 [39]. Ribosomal RNAs were aligned using the R-Coffee web service by considering secondary structure [40]. Alignments of rRNAs were also filtered using trimAl. The first and second codon positions of PCGs were extracted and concatenated with rRNAs. The phylogenetic tree was constructed using IQ-Tree v2.2.0 [41]. The best-fit model was automatically selected by MolderFinder [42], which was built in IQ-Tree. Megaphragma amalphitanum was set as the outgroup. The other two gene sets were also analyzed, resulting in the same phylogenetic topology. They are (1) all three codon positions of 13 PCGs and (2) 13 PCGs concatenated with two rRNAs. The solved phylogeny was used as a fixed topology for evolutionary rate estimation. Substitution models were set as mtART for mitochondrial proteins and GTR for mitochondrial rRNAs. Synonymous substitution rates (Ks) and nonsynonymous substitution rates (Ka) were estimated using PAML v4.9 [43].

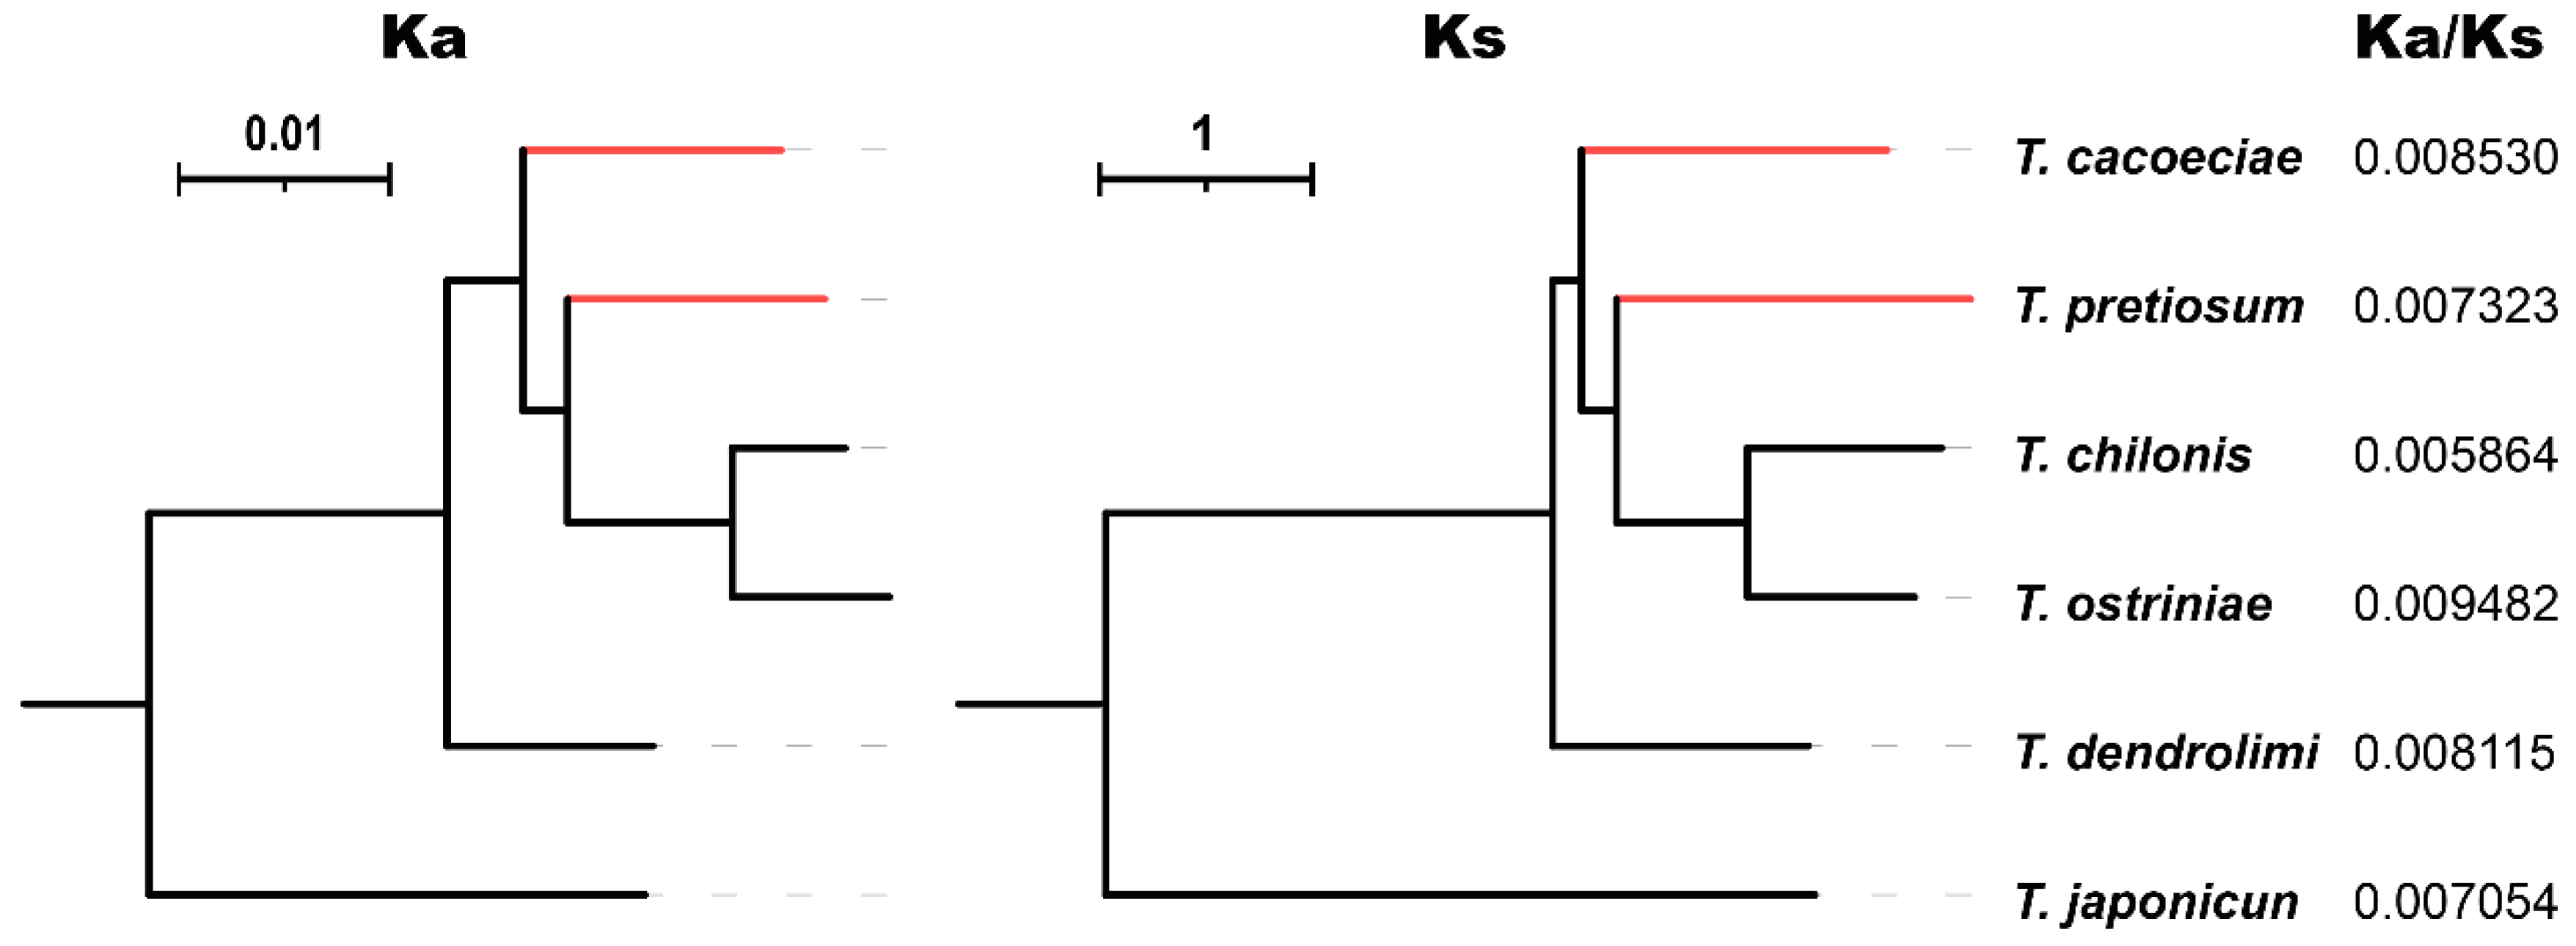
2.6. Relaxed Selection Test

Relaxed selections were tested using RELAX in Hyphy v2.5.36 [6]. Trichogramma cacoeciae and T. pretiosum terminal branches were used as the test. All the other terminal and internal branches within the Trichogramma genus were set as the reference. A relaxation or intensification parameter (K) significantly less than 1 indicates relaxed selection, while a K value significantly greater than 1 indicates intensified selection. p values were corrected for multiple tests using the Benjamini and Hochberg method.

3. Results

3.1. Features of Two Asexual Mitochondrial Genomes

Combining both Illumina and Sanger sequencing data, we assembled two complete mitochondrial genomes from asexual strains of T. cacoeciae and T. pretiosum, respectively (Figure 1). The complete mitochondrial genome of T. cacoeciae is 16,034 bp, with an AT% of 84.9%, and that of T. pretiosum is 16,227 bp, with an AT% of 85.2%. Both the length and AT% of asexual T. cacoeciae and T. pretiosum mitogenomes are within the range of four sexual Trichogramma mitogenomes. The control regions of T. cacoeciae and T. pretiosum are 756 bp and 669 bp, respectively. The AT% of the control region in T. cacoeciae is 87.6%, which is the lowest AT% among the six sequenced Trichogramma species. The AT% of the control region in T. pretiosum is 91.6%, which is the highest among these six.
All 37 typical mitochondrial genes were identified in both the T. cacoeciae and T. pretiosum mitogenomes (Figure 1; Table 1). Thirteen PCGs, 22 tRNAs, and two rRNAs were annotated on each mitogenome. All tRNAs have typical cloverleaf structures, except trnS2. Mitochondrial trnS1 lacks the dihydrouridine (DHU) arm in all six Trichogramma mitogenomes, which is common in metazoans [44]. Gene lengths are similar among the six Trichogramma mitogenomes, and there are no significant differences among the different Trichogramma mitogenomes (Table 1; Kruskal–Wallis test: χ2 = 0.168, df = 5, p = 1.00). Extensive gene order rearrangement was previously reported in Trichogramma mitogenomes, even when compared to M. amalphitanum, a close relative in the same family Trichogrammatidae [45]. However, within the Trichogramma genus, the gene orders of the six sequenced Trichogramma mitogenomes are all the same. Window slide nucleotide diversity (Pi) was also estimated, showing variance across the whole mitochondrial genome (Figure 2). The highest window slide Pi is 0.20667 in atp8, while the lowest is 0.01733 in rrnL. For the average Pi of mitochondrial PCGs, atp8 has the highest value of 0.136, while cox2 has the lowest value of 0.057. The average Pi of rrnL and rrnS is 0.080 and 0.068, respectively.

3.2. Comparison of Substitution Rates between Asexual and Sexual Mitogenomes

We first estimated substitution distances of all six Trichogramma to the Trichogramma common ancestor (TCA), which reflect the accumulated substitutions after divergence from their common ancestor (Figure 3). For the 13 concatenated mitochondrial proteins, the distance of T. ostriniae is the longest to the TCA, while that of T. japonicum is the shortest (Figure 3A). For the two concatenated mitochondrial rRNAs, the distance of T. chilonis is the longest, while that of T. dendrolimi is the shortest (Figure 3B). There is no difference between distances to the TCA when comparing asexual and sexual mitogenomes (Mann–Whitney test: for proteins, W = 4, p = 1; for rRNA, W = 3, p = 0.8). We then tested whether this tendency is the same among individual genes (Figure 3C). There are variations among different genes (Kruskal–Wallis test: χ2 = 68.11, df = 14, p = 4.2 × 10⁻⁹). Cox1 shows the shortest substitution distance to the TCA with an average of 0.0149, while atp8 shows the highest with an average of 0.1618. However, there was no difference among the different Trichogramma mitogenomes (Kruskal–Wallis test: χ2 = 4.12, df = 5, p = 0.53).
We further estimated synonymous (Ks) and nonsynonymous substitution rates (Ka) using concatenated PCGs (Figure 4). For six Trichogramma species, Ka/Ks values range from 0.005864 to 0.009482, suggesting that mitochondrial PCGs are under strong purifying selection. The Ka/Ks values are 0.008530 on the T. cacoeciae branch and 0.007323 on the T. pretiosum branch, showing no significant difference from the Ka/Ks values of their sexual relatives (Mann–Whitney test: W = 5, p = 0.8). We also tested relaxed selection on asexual branches. By setting T. cacoeciae and T. pretiosum terminal branches as the test and other branches as the reference, we did not obtain any parameter K significantly less than 1 (Table 2), suggesting no relaxed selection on asexual branches. In contrast, there was a K for asexual branches on Nad4, which was significantly greater than 1 (K = 5.9, LR = 186.52, q = 0), suggesting intensified selection. Similarly, by setting asexual T. cacoeciae or T. pretiosum as the test separately, no signals of relaxed selection were detected (Table S3), while intensified selection was detected on Nad1 and Nad4 for T. pretiosum (for Nad1: K = 2.65, LR = 11.57, q = 0.007; for Nad4: K = 5.67, LR = 132.56, q = 0).

4. Discussion

We assembled full-length mitochondrial genomes of two asexual Trichogramma strains and compared them with four reported mitogenomes of sexual Trichogramma. Crucially, we found no significant differences between asexual and sexual mitogenomes. Asexual and sexual Trichogramma mitogenomes show the same gene order and similar gene lengths. Compared to their sexual relatives, there was no excess mutation accumulation or relaxed selection detected in the asexual Trichogramma mitogenomes.
Comparisons of asexual lineages with their sexual relatives provide a promising avenue to answer the paradox of sex. However, such comparisons are difficult, as factors other than sex also affect mutation accumulation, such as mutation rate, recombination rate, generation time, population size, and the ecological environment [46]. These factors may mask the association between asexual reproduction and mutation accumulation. More than 200 species have been reported in the genus Trichogramma, and asexual reproduction has been found in at least 16 species [24]. One consideration of our study is that our sampling is very limited. Sparse sampling can result in asexual branches containing most of the sexual stages and a small proportion of the asexual stages, thereby underestimating the difference between asexual and sexual Trichogramma. Additionally, we have no information on the exact time of origin of these two asexual strains. Previously, Lindsey et al. (2018) reported no evidence of degradation in the asexual nuclear genome by comparing asexual and sexual T. pretiosum strains [18]. One possible explanation is that the transition to asexual reproduction is too recent for a detectable acceleration of mutation accumulation.
Another influencing factor is the selection of gene sets. Several studies have demonstrated excess accumulation of mitochondrial mutations in asexuals than their sexual relatives [6,9,11,12]. However, the mitochondrial genome may be less sensitive than the nuclear genome in detecting the association between asexual reproduction and mutation accumulation [7]. For example, compared to its sexual relatives, the asexual parasitoid wasp Diachasma muliebre has a higher mutation accumulation in the nuclear genome but not in the mitochondrial genome [47]. This may be because mitochondria are pivotal in energy production and are usually under strong purifying selection [48]. Additionally, the mitochondrial genome is maternally transmitted and lacks recombination in both sexual and asexual reproduction [48,49]. Moreover, some genes are more likely to decay than others, e.g., genes associated with sexual traits. For instance, Kraaijeveld et al. (2016) identified 16 putative degraded nuclear-encoded genes, the majority of which (15/16) are associated with male traits, and one is expressed in the female-specific tissue spermathecae [50].
In addition, different mechanisms of asexual reproduction may result in different evolutionary outcomes. Asexual reproduction in T. pretiosum is induced by Wolbachia through gamete duplication [29]. Even after removing Wolbachia by antibiotics, some Wolbachia-induced asexual strains cannot revert to normal sexual reproduction because of the loss of sexual functions in either male or female adults [24,51]. However, during early Wolbachia infection in a population, infected Trichogramma females can still be fertilized by uninfected males [29]. Gamete duplication is suppressed, and Wolbachia does not interfere with the normal sexual development of fertilized eggs [29]. This unique mechanism can reduce the rate of mutation accumulation. In contrast, asexual T. cacoeciae is presumed to originate from interspecific hybridization [28]. Trichogramma cacoeciae individuals are highly heterozygous and remain diploid by an apomictic mechanism [28]. It is still largely unknown how different mechanisms of asexual reproduction influence mutation accumulation.
It is also possible that asexual organisms have compensatory mechanisms to avoid deleterious mutation accumulation. For example, asexual oribatid mites show more effective purifying selection than their sexual relatives [19]. The method by which these ancient asexual mites escape mutation accumulation is still unknown. Some molecular mechanisms have been reported to slow down mutation accumulation, e.g., gene conversion in the human Y chromosome and DNA repair in mitochondria [52,53]. Asexual organisms can also recruit similar mechanisms to prevent mutation accumulation. In the asexual T. pretiosum mitogenome, we found intensified selection on the Nad1 and Nad4 genes, suggesting more purifying selection. Whether this is widely associated with Wolbachia-induced asexual reproduction needs further investigation.
In summary, we reported two mitochondrial genomes from asexual T. cacoeciae and T. pretiosum strains and found no evidence of excess mutation accumulation in these two asexual mitogenomes when compared to sexual Trichogramma mitogenomes. This study provides a basis for further investigating mitochondrial evolution and asexual reproduction in Trichogramma.

Supplementary Materials

The following supporting information can be downloaded at: https://0-www-mdpi-com.brum.beds.ac.uk/article/10.3390/insects13060549/s1. Table S1: Primers used in this study. Table S2: Statistics of Trichogramma mitochondrial genomes and their control regions. Table S3: Relaxed selection test of T. cacoeciae or T. pretiosum branched compared to sexual branches. Figure S1: Secondary structures of tRNAs in the T. cacoeciae mitochondrial genome. Figure S2: Secondary structures of tRNAs in the T. pretiosum mitochondrial genome.

Author Contributions

Conceptualization, Z.-C.Y. and Y.-X.L.; investigation, G.-Y.Q. and T.-Y.Y.; data analysis, T.-Y.Y., G.-Y.Q. and Z.-C.Y.; writing—review and editing, all authors; project administration and supervision, Y.-X.L. All authors have read and agreed to the published version of the manuscript.

Funding

This study was supported by the Jiangsu Agriculture Science and Technology Innovation Fund (Grant No. CX(21)3008), “Shuangchuang Doctor” Foundation of Jiangsu Province (Grant No. 202030472), and Nanjing Agricultural University startup fund (Grant No. 804018).

Institutional Review Board Statement

Not applicable.

Informed Consent Statement

Not applicable.

Data Availability Statement

The mitochondrial genomes of T. chilonis (MW789210.1), T. dendrolimi (KU836507.1), T. japonicum (NC_039534.1), T. ostriniae (NC_039535.1), and M. amalphitanum (NC_028196.1) were downloaded from NCBI. The mitochondrial genomes of T. pretiosum and T. cacoeciae have been deposited in GenBank (ON209198 and ON209199).

Acknowledgments

We thank Lei Yang at Hainan University for kindly providing the asexual T. pretiosum strain. Bioinformatic analyses were supported by the high-performance computing platform of Bioinformatics Center, Nanjing Agricultural University.

Conflicts of Interest

The authors declare no conflict of interest.

References

  1. Otto, S.P.; Lenormand, T. Resolving the paradox of sex and recombination. Nat. Rev. Genet. 2002, 3, 252–261. [Google Scholar] [CrossRef] [PubMed]
  2. Tvedte, E.S.; Logsdon, J.M., Jr.; Forbes, A.A. Sex loss in insects: Causes of asexuality and consequences for genomes. Curr. Opin. Insect Sci. 2019, 31, 77–83. [Google Scholar] [CrossRef] [PubMed]
  3. Meirmans, S.; Meirmans, P.G.; Kirkendall, L.R. The costs of sex: Facing real-world complexities. Q. Rev. Biol. 2012, 87, 19–40. [Google Scholar] [CrossRef] [PubMed]
  4. Schwander, T.; Crespi, B.J. Twigs on the tree of life? Neutral and selective models for integrating macroevolutionary patterns with microevolutionary processes in the analysis of asexuality. Mol. Ecol. 2009, 18, 28–42. [Google Scholar] [CrossRef] [PubMed]
  5. Kondrashov, A.S. Deleterious mutations and the evolution of sexual reproduction. Nature 1988, 336, 435–440. [Google Scholar] [CrossRef]
  6. Wertheim, J.O.; Murrell, B.; Smith, M.D.; Kosakovsky Pond, S.L.; Scheffler, K. RELAX: Detecting relaxed selection in a phylogenetic framework. Mol. Biol. Evol. 2015, 32, 820–832. [Google Scholar] [CrossRef] [Green Version]
  7. Normark, B.B.; Moran, N.A. Testing for the accumulation of deleterious mutations in asexual eukaryote genomes using molecular sequences. J. Nat. Hist. 2000, 34, 1719–1729. [Google Scholar] [CrossRef]
  8. Hollister, J.D.; Greiner, S.; Wang, W.; Wang, J.; Zhang, Y.; Wong, G.K.; Wright, S.I.; Johnson, M.T.J. Recurrent loss of sex is associated with accumulation of deleterious mutations in Oenothera. Mol. Biol. Evol. 2015, 32, 896–905. [Google Scholar] [CrossRef] [Green Version]
  9. Henry, L.; Schwander, T.; Crespi, B.J. Deleterious mutation accumulation in asexual Timema stick insects. Mol. Biol. Evol. 2012, 29, 401–408. [Google Scholar] [CrossRef] [Green Version]
  10. Sharbrough, J.; Luse, M.; Boore, J.L.; Logsdon, J.M., Jr.; Neiman, M. Radical amino acid mutations persist longer in the absence of sex. Evolution 2018, 72, 808–824. [Google Scholar] [CrossRef]
  11. Paland, S.; Lynch, M. Transitions to asexuality result in excess amino acid substitutions. Science 2006, 311, 990–992. [Google Scholar] [CrossRef] [PubMed] [Green Version]
  12. Neiman, M.; Hehman, G.; Miller, J.T.; Logsdon, J.M., Jr.; Taylor, D.R. Accelerated mutation accumulation in asexual lineages of a freshwater snail. Mol. Biol. Evol. 2010, 27, 954–963. [Google Scholar] [CrossRef] [PubMed] [Green Version]
  13. Warren, W.C.; García-Pérez, R.; Xu, S.; Lampert, K.P.; Chalopin, D.; Stöck, M.; Loewe, L.; Lu, Y.; Kuderna, L.; Minx, P.; et al. Clonal polymorphism and high heterozygosity in the celibate genome of the Amazon molly. Nat. Ecol. Evol. 2018, 2, 669–679. [Google Scholar] [CrossRef] [PubMed] [Green Version]
  14. Blanc-Mathieu, R.; Perfus-Barbeoch, L.; Aury, J.-M.; Rocha, M.D.; Gouzy, J.; Sallet, E.; Martin-Jimenez, C.; Bailly-Bechet, M.; Castagnone-Sereno, P.; Flot, J.-F.; et al. Hybridization and polyploidy enable genomic plasticity without sex in the most devastating plant-parasitic nematodes. PLoS Genet. 2017, 13, e1006777. [Google Scholar] [CrossRef] [Green Version]
  15. Ament-Velásquez, S.L.; Figuet, E.; Ballenghien, M.; Zattara, E.E.; Norenburg, J.L.; Fernández-Álvarez, F.A.; Bierne, J.; Bierne, N.; Galtier, N. Population genomics of sexual and asexual lineages in fissiparous ribbon worms (Lineus, Nemertea): Hybridization, polyploidy and the Meselson effect. Mol. Ecol. 2016, 25, 3356–3369. [Google Scholar] [CrossRef]
  16. Tucker, A.E.; Ackerman, M.S.; Eads, B.D.; Xu, S.; Lynch, M. Population-genomic insights into the evolutionary origin and fate of obligately asexual Daphnia pulex. Proc. Natl. Acad. Sci. USA 2013, 110, 15740–15745. [Google Scholar] [CrossRef] [Green Version]
  17. Kočí, J.; Röslein, J.; Pačes, J.; Kotusz, J.; Halačka, K.; Koščo, J.; Fedorčák, J.; Iakovenko, N.; Janko, K. No evidence for accumulation of deleterious mutations and fitness degradation in clonal fish hybrids: Abandoning sex without regrets. Mol. Ecol. 2020, 29, 3038–3055. [Google Scholar] [CrossRef]
  18. Lindsey, A.R.I.; Kelkar, Y.D.; Wu, X.; Sun, D.; Martinson, E.O.; Yan, Z.; Rugman-Jones, P.F.; Hughes, D.S.T.; Murali, S.C.; Qu, J.; et al. Comparative genomics of the miniature wasp and pest control agent Trichogramma pretiosum. BMC Biol. 2018, 16, 54. [Google Scholar] [CrossRef] [Green Version]
  19. Brandt, A.; Schaefer, I.; Glanz, J.; Schwander, T.; Maraun, M.; Scheu, S.; Bast, J. Effective purifying selection in ancient asexual oribatid mites. Nat. Commun. 2017, 8, 873. [Google Scholar] [CrossRef] [Green Version]
  20. Gokhman, V.E.; Kuznetsova, V.G. Parthenogenesis in Hexapoda: Holometabolous insects. J. Zool. Syst. Evol. Res. 2018, 56, 23–34. [Google Scholar] [CrossRef]
  21. Vershinina, A.O.; Kuznetsova, V.G. Parthenogenesis in Hexapoda: Entognatha and non-holometabolous insects. J. Zool. Syst. Evol. Res. 2016, 54, 257–268. [Google Scholar] [CrossRef]
  22. Zang, L.-S.; Wang, S.; Zhang, F.; Desneux, N. Biological control with Trichogramma in China: History, present status, and perspectives. Annu. Rev. Entomol. 2021, 66, 463–484. [Google Scholar] [CrossRef] [PubMed]
  23. Leung, K.; Ras, E.; Ferguson, K.B.; Ariëns, S.; Babendreier, D.; Bijma, P.; Bourtzis, K.; Brodeur, J.; Bruins, M.A.; Centurión, A.; et al. Next-generation biological control: The need for integrating genetics and genomics. Biol. Rev. Camb. Philos. Soc. 2020, 95, 1838–1854. [Google Scholar] [CrossRef] [PubMed]
  24. Russell, J.E.; Stouthamer, R. Sex ratio modulators of egg parasitoids. In Egg Parasitoids in Agroecosystems with Emphasis on Trichogramma; Consoli, F.L., Parra, J.R.P., Zucchi, R.A., Eds.; Springer: Berlin/Heidelberg, Germany, 2010; pp. 167–190. [Google Scholar]
  25. Stouthamer, R.; Pinto, J.D.; Platner, G.R.; Luck, R.F. Taxonomic status of thelytokous forms of Trichogramma (Hymenoptera: Trichogrammatidae). Ann. Entomol. Soc. Am. 1990, 83, 475–481. [Google Scholar] [CrossRef]
  26. Stouthamer, R.; Luck, R.F.; Hamilton, W.D. Antibiotics cause parthenogenetic Trichogramma (Hymenoptera, Trichogrammatidae) to revert to sex. Proc. Natl. Acad. Sci. USA 1990, 87, 2424–2427. [Google Scholar] [CrossRef] [Green Version]
  27. Stouthamer, R.; Breeuwer, J.A.J.; Luck, R.F.; Werren, J.H. Molecular-identification of microorganisms associated with parthenogenesis. Nature 1993, 361, 66–68. [Google Scholar] [CrossRef]
  28. Vavre, F.; de Jong, J.H.; Stouthamer, R. Cytogenetic mechanism and genetic consequences of thelytoky in the wasp Trichogramma cacoeciae. Heredity 2004, 93, 592–596. [Google Scholar] [CrossRef] [Green Version]
  29. Stouthamer, R.; Kazmer, D.J. Cytogenetics of microbe-associated parthenogenesis and its consequences for gene flow in Trichogramma wasps. Heredity 1994, 73, 317–327. [Google Scholar] [CrossRef] [Green Version]
  30. Hua, H.; Zhao, Z.; Zhang, Y.; Hu, J.; Zhang, F.; Li, Y. Inter- and intra-specific differentiation of Trichogramma (Hymenoptera: Trichogrammatidae) species using PCR–RFLP targeting COI. J. Econ. Entomol. 2018, 111, 1860–1867. [Google Scholar] [CrossRef]
  31. Simon, C.; Frati, F.; Beckenbach, A.; Crespi, B.; Liu, H.; Flook, P. Evolution, weighting, and phylogenetic utility of mitochondrial gene sequences and a compilation of conserved polymerase chain reaction primers. Ann. Entomol. Soc. Am. 1994, 87, 651–701. [Google Scholar] [CrossRef]
  32. Lalitha, S. Primer Premier 5. Biotech Softw. Internet Rep. 2000, 1, 270–272. [Google Scholar] [CrossRef]
  33. Kearse, M.; Moir, R.; Wilson, A.; Stones-Havas, S.; Cheung, M.; Sturrock, S.; Buxton, S.; Cooper, A.; Markowitz, S.; Duran, C.; et al. Geneious Basic: An integrated and extendable desktop software platform for the organization and analysis of sequence data. Bioinformatics 2012, 28, 1647–1649. [Google Scholar] [CrossRef] [PubMed]
  34. Meng, G.; Li, Y.; Yang, C.; Liu, S. MitoZ: A toolkit for animal mitochondrial genome assembly, annotation and visualization. Nucleic Acids Res. 2019, 47, e63. [Google Scholar] [CrossRef]
  35. Bernt, M.; Donath, A.; Jühling, F.; Externbrink, F.; Florentz, C.; Fritzsch, G.; Pütz, J.; Middendorf, M.; Stadler, P.F. MITOS: Improved de novo metazoan mitochondrial genome annotation. Mol. Phylogenetics Evol. 2013, 69, 313–319. [Google Scholar] [CrossRef] [PubMed]
  36. Laslett, D.; Canbäck, B. ARWEN: A program to detect tRNA genes in metazoan mitochondrial nucleotide sequences. Bioinformatics 2008, 24, 172–175. [Google Scholar] [CrossRef] [PubMed] [Green Version]
  37. Rozas, J.; Ferrer-Mata, A.; Sánchez-DelBarrio, J.C.; Guirao-Rico, S.; Librado, P.; Ramos-Onsins, S.E.; Sánchez-Gracia, A. DnaSP 6: DNA sequence polymorphism analysis of large data sets. Mol. Biol. Evol. 2017, 34, 3299–3302. [Google Scholar] [CrossRef] [PubMed]
  38. Katoh, K.; Standley, D.M. MAFFT multiple sequence alignment software version 7: Improvements in performance and usability. Mol. Biol. Evol. 2013, 30, 772–780. [Google Scholar] [CrossRef] [PubMed] [Green Version]
  39. Capella-Gutiérrez, S.; Silla-Martínez, J.M.; Gabaldón, T. trimAl: A tool for automated alignment trimming in large-scale phylogenetic analyses. Bioinformatics 2009, 25, 1972–1973. [Google Scholar] [CrossRef]
  40. Moretti, S.; Wilm, A.; Higgins, D.G.; Xenarios, I.; Notredame, C. R-Coffee: A web server for accurately aligning noncoding RNA sequences. Nucleic Acids Res. 2008, 36, W10–W13. [Google Scholar] [CrossRef] [Green Version]
  41. Minh, B.Q.; Schmidt, H.A.; Chernomor, O.; Schrempf, D.; Woodhams, M.D.; von Haeseler, A.; Lanfear, R. IQ-TREE 2: New models and efficient methods for phylogenetic inference in the genomic era. Mol. Biol. Evol. 2020, 37, 1530–1534. [Google Scholar] [CrossRef] [Green Version]
  42. Kalyaanamoorthy, S.; Minh, B.Q.; Wong, T.K.F.; von Haeseler, A.; Jermiin, L.S. ModelFinder: Fast model selection for accurate phylogenetic estimates. Nat. Methods 2017, 14, 587–589. [Google Scholar] [CrossRef] [PubMed] [Green Version]
  43. Yang, Z. PAML 4: Phylogenetic Analysis by Maximum Likelihood. Mol. Biol. Evol. 2007, 24, 1586–1591. [Google Scholar] [CrossRef] [PubMed] [Green Version]
  44. Cameron, S.L. Insect mitochondrial genomics: Implications for evolution and phylogeny. Annu. Rev. Entomol. 2014, 59, 95–117. [Google Scholar] [CrossRef] [PubMed] [Green Version]
  45. Chen, L.; Chen, P.; Xue, X.; Hua, H.; Li, Y.; Zhang, F.; Wei, S. Extensive gene rearrangements in the mitochondrial genomes of two egg parasitoids, Trichogramma japonicum and Trichogramma ostriniae (Hymenoptera: Chalcidoidea: Trichogrammatidae). Sci. Rep. 2018, 8, 7034. [Google Scholar] [CrossRef]
  46. Halligan, D.L.; Keightley, P.D. Spontaneous mutation accumulation studies in evolutionary genetics. Annu. Rev. Ecol. Evol. Syst. 2009, 40, 151–172. [Google Scholar] [CrossRef] [Green Version]
  47. Tvedte, E.S. Genome Evolution in Parasitic Wasps: Comparisons of Sexual and Asexual Species. Ph.D. Thesis, The University of Iowa, Iowa City, IA, USA, 2018. [Google Scholar]
  48. Meiklejohn, C.D.; Montooth, K.L.; Rand, D.M. Positive and negative selection on the mitochondrial genome. Trends Genet. 2007, 23, 259–263. [Google Scholar] [CrossRef] [PubMed]
  49. Yan, Z.; Ye, G.; Werren, J.H. Evolutionary rate correlation between mitochondrial-encoded and mitochondria-associated nuclear-encoded proteins in insects. Mol. Biol. Evol. 2019, 36, 1022–1036. [Google Scholar] [CrossRef]
  50. Kraaijeveld, K.; Anvar, S.Y.; Frank, J.; Schmitz, A.; Bast, J.; Wilbrandt, J.; Petersen, M.; Ziesmann, T.; Niehuis, O.; de Knijff, P.; et al. Decay of sexual trait genes in an asexual parasitoid wasp. Genome Biol. Evol. 2016, 8, 3685–3695. [Google Scholar] [CrossRef] [Green Version]
  51. Wang, X.; Qi, L.; Jiang, R.; Du, Y.; Li, Y. Incomplete removal of Wolbachia with tetracycline has two-edged reproductive effects in the thelytokous wasp Encarsia formosa (Hymenoptera: Aphelinidae). Sci. Rep. 2017, 7, 44014. [Google Scholar] [CrossRef] [Green Version]
  52. Hughes, J.F.; Skaletsky, H.; Brown, L.G.; Pyntikova, T.; Graves, T.; Fulton, R.S.; Dugan, S.; Ding, Y.; Buhay, C.J.; Kremitzki, C.; et al. Strict evolutionary conservation followed rapid gene loss on human and rhesus Y chromosomes. Nature 2012, 483, 82–86. [Google Scholar] [CrossRef] [Green Version]
  53. Kang, D.; Hamasaki, N. Maintenance of mitochondrial DNA integrity: Repair and degradation. Curr. Genet. 2002, 41, 311–322. [Google Scholar] [CrossRef] [PubMed]
Figure 1. Structures of Trichogramma cacoeciae and T. pretiosum mitochondrial genomes. Yellow indicates mitochondrial protein-coding genes. Red indicates mitochondrial ribosomal RNAs. Blue indicates mitochondrial tRNAs. Green indicates the control region, which is also known as the D-loop region, major noncoding region, or A + T-rich region. Genes on the inner loop are encoded on the major strand, while those on the outer loop are on the minor strand. Arrows indicate primers used for mitochondrial PCR amplification. FP: forward primer; RP: reverse primer.
Insects 13 00549 g001
Figure 2. Nucleotide diversity (Pi) of six Trichogramma mitochondrial genomes. The x-axis indicates the position in the alignment of six mitochondrial genomes. The black wave line indicates the average nucleotide diversity of sliding windows. The window size was 200 bp with a step size of 20 bp. The arrows below the graph indicate 37 mitochondrial genes. Yellow indicates mitochondrial protein-coding genes. Red indicates mitochondrial ribosomal RNAs. Blue indicates mitochondrial tRNA. Green indicates the control region. The average Pi of protein-coding genes and ribosomal RNAs are labeled under each gene name.
Insects 13 00549 g002
Figure 3. Comparison of substitution rates among Trichogramma species. Substitution rates were estimated using (A) concatenated 13 mitochondrial proteins or (B) concatenated two ribosomal RNAs. (C) Distances to Trichogramma common ancestor for individual mitochondrial proteins or ribosomal RNAs. Genes are ordered by their locations on mitochondrial genomes.
Insects 13 00549 g003
Figure 4. Comparison of Ka/Ks ratios among Trichogramma species. The nonsynonymous substitution rate Ka and synonymous substitution rate Ks were estimated using 13 concatenated mitochondrial protein-coding genes. Red indicates asexual branches, which were tested for relaxed selection.
Insects 13 00549 g004
Table 1. Summary of mitochondrial genes in Trichogramma cacoeciae and T. pretiosum.
GeneStrandT. cacoeciaeT. pretiosumTchiTdenTjapTost
Start/StopLength (bp)Start/StopLength
(bp)
Length
(bp)
Length
(bp)
Length
(bp)
Length
(bp)
cox1+ATG/TAA1536ATG/TAA15481536153615361536
trnY+ 68 6666676766
trnQ+ 68 7068686868
nad2+ATA/TAA1014ATA/TAA10141014101410141014
trnW+ 66 6667666667
trnM+ 65 6564656866
nad3+ATA/TAA360ATA/TAA360360363363360
trnR+ 64 6363636563
trnV+ 67 6768686668
rrnS+ 770 784777780749774
trnG+ 66 6766666567
trnA+ 63 6463656564
rrnL+ 1388 14171393139313671362
trnL1+ 68 7070666570
nad1+ATA/TAA939ATA/TAA939936936939936
trnS2 64 6464656564
cobATG/TAA1140ATG/TAA11431140114011401140
nad6ATG/TAA573ATG/TAA573579594573573
trnP+ 66 6566656665
trnT 64 6464646564
nad4l+ATT/TAG288ATT/TAG288288288288288
nad4+ATG/TAA1344ATG/TAA13441344134413441344
trnH+ 64 6763656763
nad5+ATT/TAA1689ATT/TAA16831683168916861692
trnL2+ 66 6668666666
cox2+ATT/TAG681ATT/TAA681681681681681
trnK 70 7270707070
trnD+ 66 6866676666
atp8+ATT/TAA168ATA/TAA159168168159159
atp6+ATA/TAA672ATA/TAA672681681675675
cox3+ATG/TAA792ATG/TAA792792831792792
trnC 69 6969696968
trnN+ 66 6766666662
trnS1+ 60 6060605960
trnI+ 67 6767676767
trnF+ 66 6565656465
trnE 66 6766666766
Tchi: T. chilonis; Tden: T. dendrolimi; Tjap: T. japonicum; Tost: T. ostriniae.
Table 2. Relaxed selection test of asexual branches, T. cacoeciae, and T. pretiosum, compared to sexual branches.
GeneKLRpq
atp61.130.150.7000.899
atp80.690.410.5200.899
cob1.000.001.0001.000
cox11.050.040.8350.899
cox21.992.440.1180.413
cox31.070.060.7990.899
nad11.725.830.0160.112
nad21.200.310.5760.899
nad31.550.640.4250.899
nad45.90186.5200
nad4l14.980.220.6390.899
nad50.773.740.0530.247
nad60.930.080.7710.899
13PCGs1.111.170.2800.784
Terminal branches of T. cacoeciae and T. pretiosum were used as the test. Other terminal and internal branches were set as the reference. A K value significantly less than 1 indicates relaxed selection, while a K value significantly greater than 1 indicates intensified selection. p values were corrected for multiple tests using the Benjamini and Hochberg method. K: relaxation or intensification parameter; LR: likelihood ratio; 13 PCGs: concatenated 13 mitochondrial protein-coding genes.
Publisher’s Note: MDPI stays neutral with regard to jurisdictional claims in published maps and institutional affiliations.

