Application of Tagged Neutron Method for Detecting Diamonds in Kimberlite

1
Diamant, LLC, Dubna 141980, Russian
2
Department of Physics and Astronomy, Botswana International University of Science and Technology, Palapye, Botswana
*
Author to whom correspondence should be addressed.
Instruments 2020, 4(4), 33; https://0-doi-org.brum.beds.ac.uk/10.3390/instruments4040033
Submission received: 8 September 2020
/
Revised: 14 October 2020
/
Accepted: 27 October 2020
/
Published: 2 November 2020
(This article belongs to the Special Issue Application of Fast Neutrons in Science, Industry and Border Monitoring)
Abstract
:The results of testing a prototype of a separator for detecting diamonds in kimberlite ore using tagged neutron method are discussed. Kimberlite ore was irradiated with fast tagged neutrons with an energy of 14.1 MeV. The elemental content of the tray with kimberlite ore was determined. The criterion for detecting diamond was the presence of excess carbon concentration in a certain region of a kimberlite sample.
1. Introduction
The present technology of finding diamonds in the kimberlite ore consists in exposing a diamond from the kimberlite. Open diamonds are detected either by X-rays irradiation or by floatation. To extract diamond from kimberlite, the ore is subjected to few iterative processes of crushing in grinding rolls or wet mills down to a size of 0.2 mm. This procedure of repetitive crushing destroys not only kimberlite ore but also damages diamonds and the most valuable large diamonds suffer the most. Its breaking drastically decreases the price of the diamond.
We have proposed [1] a new technology for detecting diamond inside the kimberlite stones without breaking the stone. It is based on tagged neutron method (also called Associated Particle Imaging (API) method) [2,3,4,5,6]. The scheme of the method is shown in Figure 1. The kimberlite ore is irradiated by fast 14.1 MeV neutron produced in a neutron generator where the following reaction takes place:
d + 3H → 4He + n.
In this binary reaction γ-particle and neutron are flying practically back-to-back. Detecting the α-particle gives possibility to know momentum of the neutron. In this regard, a neutron generator with built-in special matrix γ-detector is used. Tagging neutron by detecting the γ-particle gives possibility to analyse γ-rays from reactions of inelastic scattering
in coincidence with the signal from the α-particle. Each chemical element has its own characteristic γ-spectrum, making it possible to determine elemental content of the irradiated object.
n + A → n′ + A*, A* → γ +A.
An important feature of the technique is that granularity of the γ-detector allows to divide irradiated object on a certain regions and determine the elemental content of each region independently. It gives possibility to compare the elemental content in different regions and detecting diamond as regions with excess carbon concentration. Moreover, detection γ-particle provides the possibility to perform time-of-flight measurement between signals from γ-particle and the γ-quantum. Knowing the velocity of monoenergetic 14.1 MeV neutron of 5 cm/ns one could determine all 3D coordinates of the region from which the γ-quantum is radiated. Using time-of-flight information allows selecting events only from the inspection region. It drastically reduces the background, the signal-to-background ratio increases by factor of 200.
High penetrability of fast neutrons makes it possible to examine appreciably large samples of kimberlite. Thus, kimberlite stones containing diamonds can be identified before the crushing stage.
The results of proof-of-principle laboratory experiments are discussed in [1]. Now we have developed a prototype of a separator with 2 tons hopper for detecting diamonds in kimberlite using the tagged neutron method. The results of the testing the prototype are discussed.
2. Materials and Methods
The prototype of a separator consists of an ore supply system and a neutron module, which are located in a 20-foot transport container. The schematic setup is shown in Figure 2.
The kimberlite ore is loaded into a 2 tons feed hopper. The dispenser feeds the ore from the hopper to the tray conveyer. The tray conveyer transports the ore to the neutron module for analysis.
In the neutron module, ore is irradiated with beams of fast tagged neutrons. Using a system of gamma detectors located above the tray conveyer, the characteristic gamma radiation is recorded in coincidence with the signal from the γ-detector located inside the neutron generator. Information from α- and γ-detectors is analysed by decision-making software. According to the results of the analysis, the tray with the rock is separated either to the concentrate bunker, or to the tailings.
The neutron module consists of a portable neutron generator ING-27M produced by Dukhov Institute of Automatics (Moscow, Russia), block of γ detectors and a data acquisition system. For diamonds detection the granularity of α-detector should be as high as possible. It determines minimal size of diamonds which could be detected. For this task a special modification of the ING-27, which produced 256 tagged beams of neutrons, is developed.
2.1. Neutron Generator
The neutron generator is a sealed tube portable neutron generator with an inbuilt alpha-detector. The generator provides a continuous neutron flux with an intensity of 1 × 10⁸ s−1. It operates in DC mode and accelerates deuterium up to 100 KeV towards the tritium target. Power consumption of neutron generator is 40 W. The lifetime of the generator is 800 h.
The inbuilt alpha-detector consists of a gallium arsenide plate, which is a semiconductor position-sensitive detector having 16 vertical and 16 horizontal strips, which formed 256 square pixels of 4 mm size. The dead zone between the strips is 0.1 mm. In Table 1 the comparison of this alpha-detector with existing ones is given.
The spatial sizes of the tagged beams are important because they determined the size of diamonds which could be detected. To measure the spatial dimensions of the tagged beams a scintillation stripped profilometer is used. It consists of 16 strips of plastic scintillator each 7.5 mm wide. The profilometer is placed at the distance of 570 mm from the target of neutron generator. The spatial distribution of 16 tagged beams produced by the coincidences of the pulses from 16 vertical strips with a single horizontal strip of α-detector is measured. The measured values have been approximated by the gaussians which are shown in Figure 3.
The averaged width of each tagged beam is ΓX = (37.1 ± 0.9) mm and ΓY = (36.6 ± 1.1) mm. This is consistent with the value of 38 mm expected at the distance of 570 mm from the tritium target assuming a point-like deuteron beam. It is important for all further estimations to note that the deutron beam of this neutron generator could be indeed considered point-like.
2.2. Gamma Detectors
Characteristic γ-rays produced by irradiated ore are detected by 22 bismuth germanate oxide (BGO) detectors with a thickness of 65 mm and a diameter of 76 mm. These detectors have an energy resolution of 8 to 2.5% within the energy range of 1 to 12 MeV and have high efficiency of gamma rays energy detection within the specified energy range and low sensitivity for detection of background neutrons.
2.3. Data Acquisition System
The data acquisition system for α and γ detectors is designed as two boards of 32 inputs each. The board has the size of a standard peripheral component interconnect (PCI) card and can be installed in PCI- E slot of a personal computer (PC). The hardware data acquisition board utilizes high speed analog to digital converter (ADC) for sampling inputs signals. The system of registration processing signals from the alpha and gamma detectors is based on the principle of waveform digitalizing with subsequent calculation of their time and amplitude characteristics. It means that an average pulse waveform for each channel is measured, filtered and stored as a number of parameters. The detector signal timing is done using its filtered shape taken as Gaussian. As data is being taken signals from each detector are filtered with stored filter parameters, and signal timing is done via transformed signal shape analysis. Amplitude (i.e., energy) of the signal is calculated as an integral over predefined range of the original signal with subtraction of premeasured offset value.
Channels of digitalizing signals from the detectors are built on the same scheme which includes an amplifier of 0–20 MHz band pass filter and analog to digital converter measurements interval of 10ns (100 MHz). The digital code corresponding to each of measurements is fed to analog to digital converter logic circuit in which there is a definition of moments of α-γ coincidence in digital form.
2.4. Geometry of the Setup and Minimal Registered Diamond Size
Since diamonds entirely consist of carbon, the signal of diamond is local excess of carbon in some area of a tray with kimberlite. The tagged neutron technique allows dividing the tray with kimberlite into 256 regions (voxels), determining carbon concentration in each voxel and comparing it with average carbon concentration of the tray. The size of the voxel D in the direction perpendicular to the neutron momentum is determined by the size of the alpha detector pixel d, the distance between alpha detector and tritium target l and distance from the tritium target to the kimberlite tray L. These parameters are shown in Table 2. The size of the voxel is an important parameter which determines minimal size of diamonds which could be detected by the setup. In this prototype it is possible to detect large diamonds of 9 mm and larger.
3. Results
3.1. Time and Energy Resolutions
The characteristic energy spectrum of gamma rays from a carbon sample is given in Figure 4.
The spectrum is dominated by single line with energy 4.44 MeV and its first escape. That facilitates the search of local excess of carbon concentration. The energy resolution is ΓE = (4.51 ± 0.25)% at the 4.44 MeV line. The time resolution of (α-γ)–coincidences, averaged over all γ-detectors is Γt = 3.86 ± 0.39 ns.
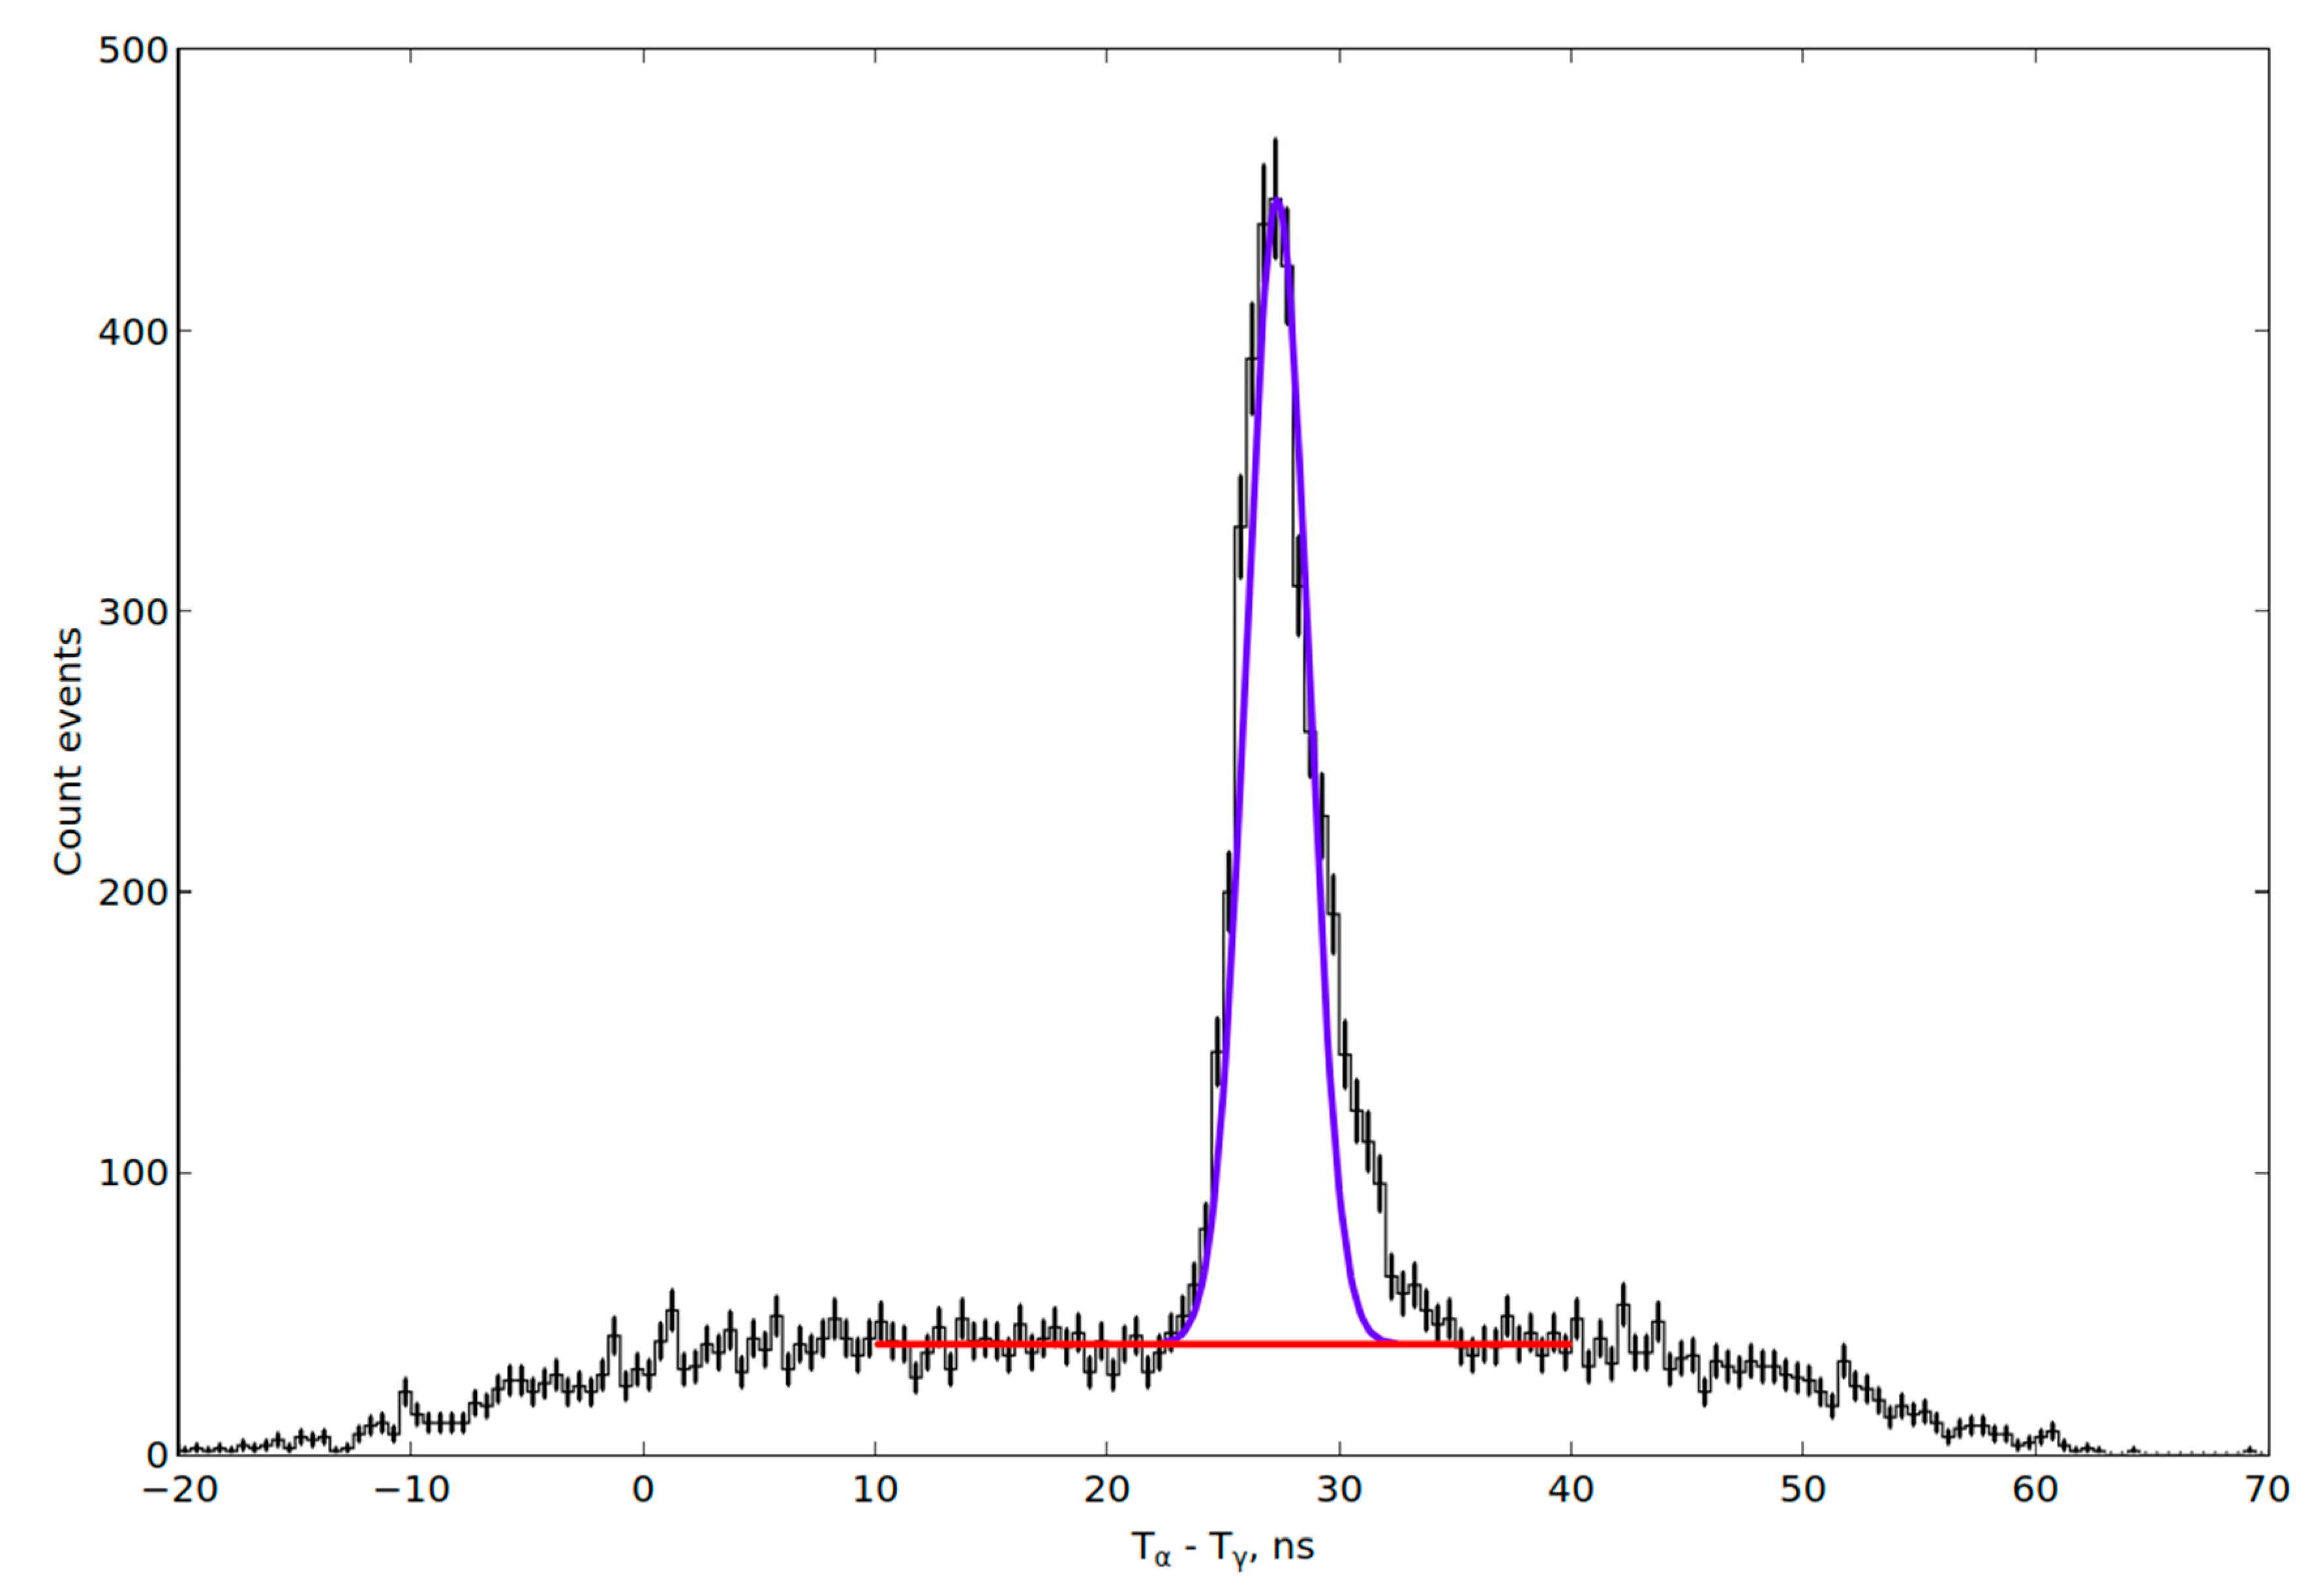
In Figure 5 the distribution of the time between signals from gamma-detector №3 and alpha-pixel №120 is shown for γ-quanta with energy around carbon line of 4.44 MeV. The blue line shows the approximation by Gaussian and the red line shows the linear background.
One could see the main peak from the γ-quanta of the kimberlite ore on the flat background of random coincidences. The ration peak/background is about 7:1, that is characteristic of the γ-detectors shielding. For the further analysis, events with time signals within ± 2 ns from the maximum of the peak were selected. In Figure 5 one can see that the main peak is not a perfect Gaussian. Some excess of the events with large times is seen on the right side of the Gaussian. These are signals from neutrons backscattered on the ore. The distance between γ-detectors and the tray is quite small and the time signals from the γ-quanta and from backscattered neutrons are not completely separated.
3.2. Energy Spectra of γ-Quanta from the Kimberlite Ore
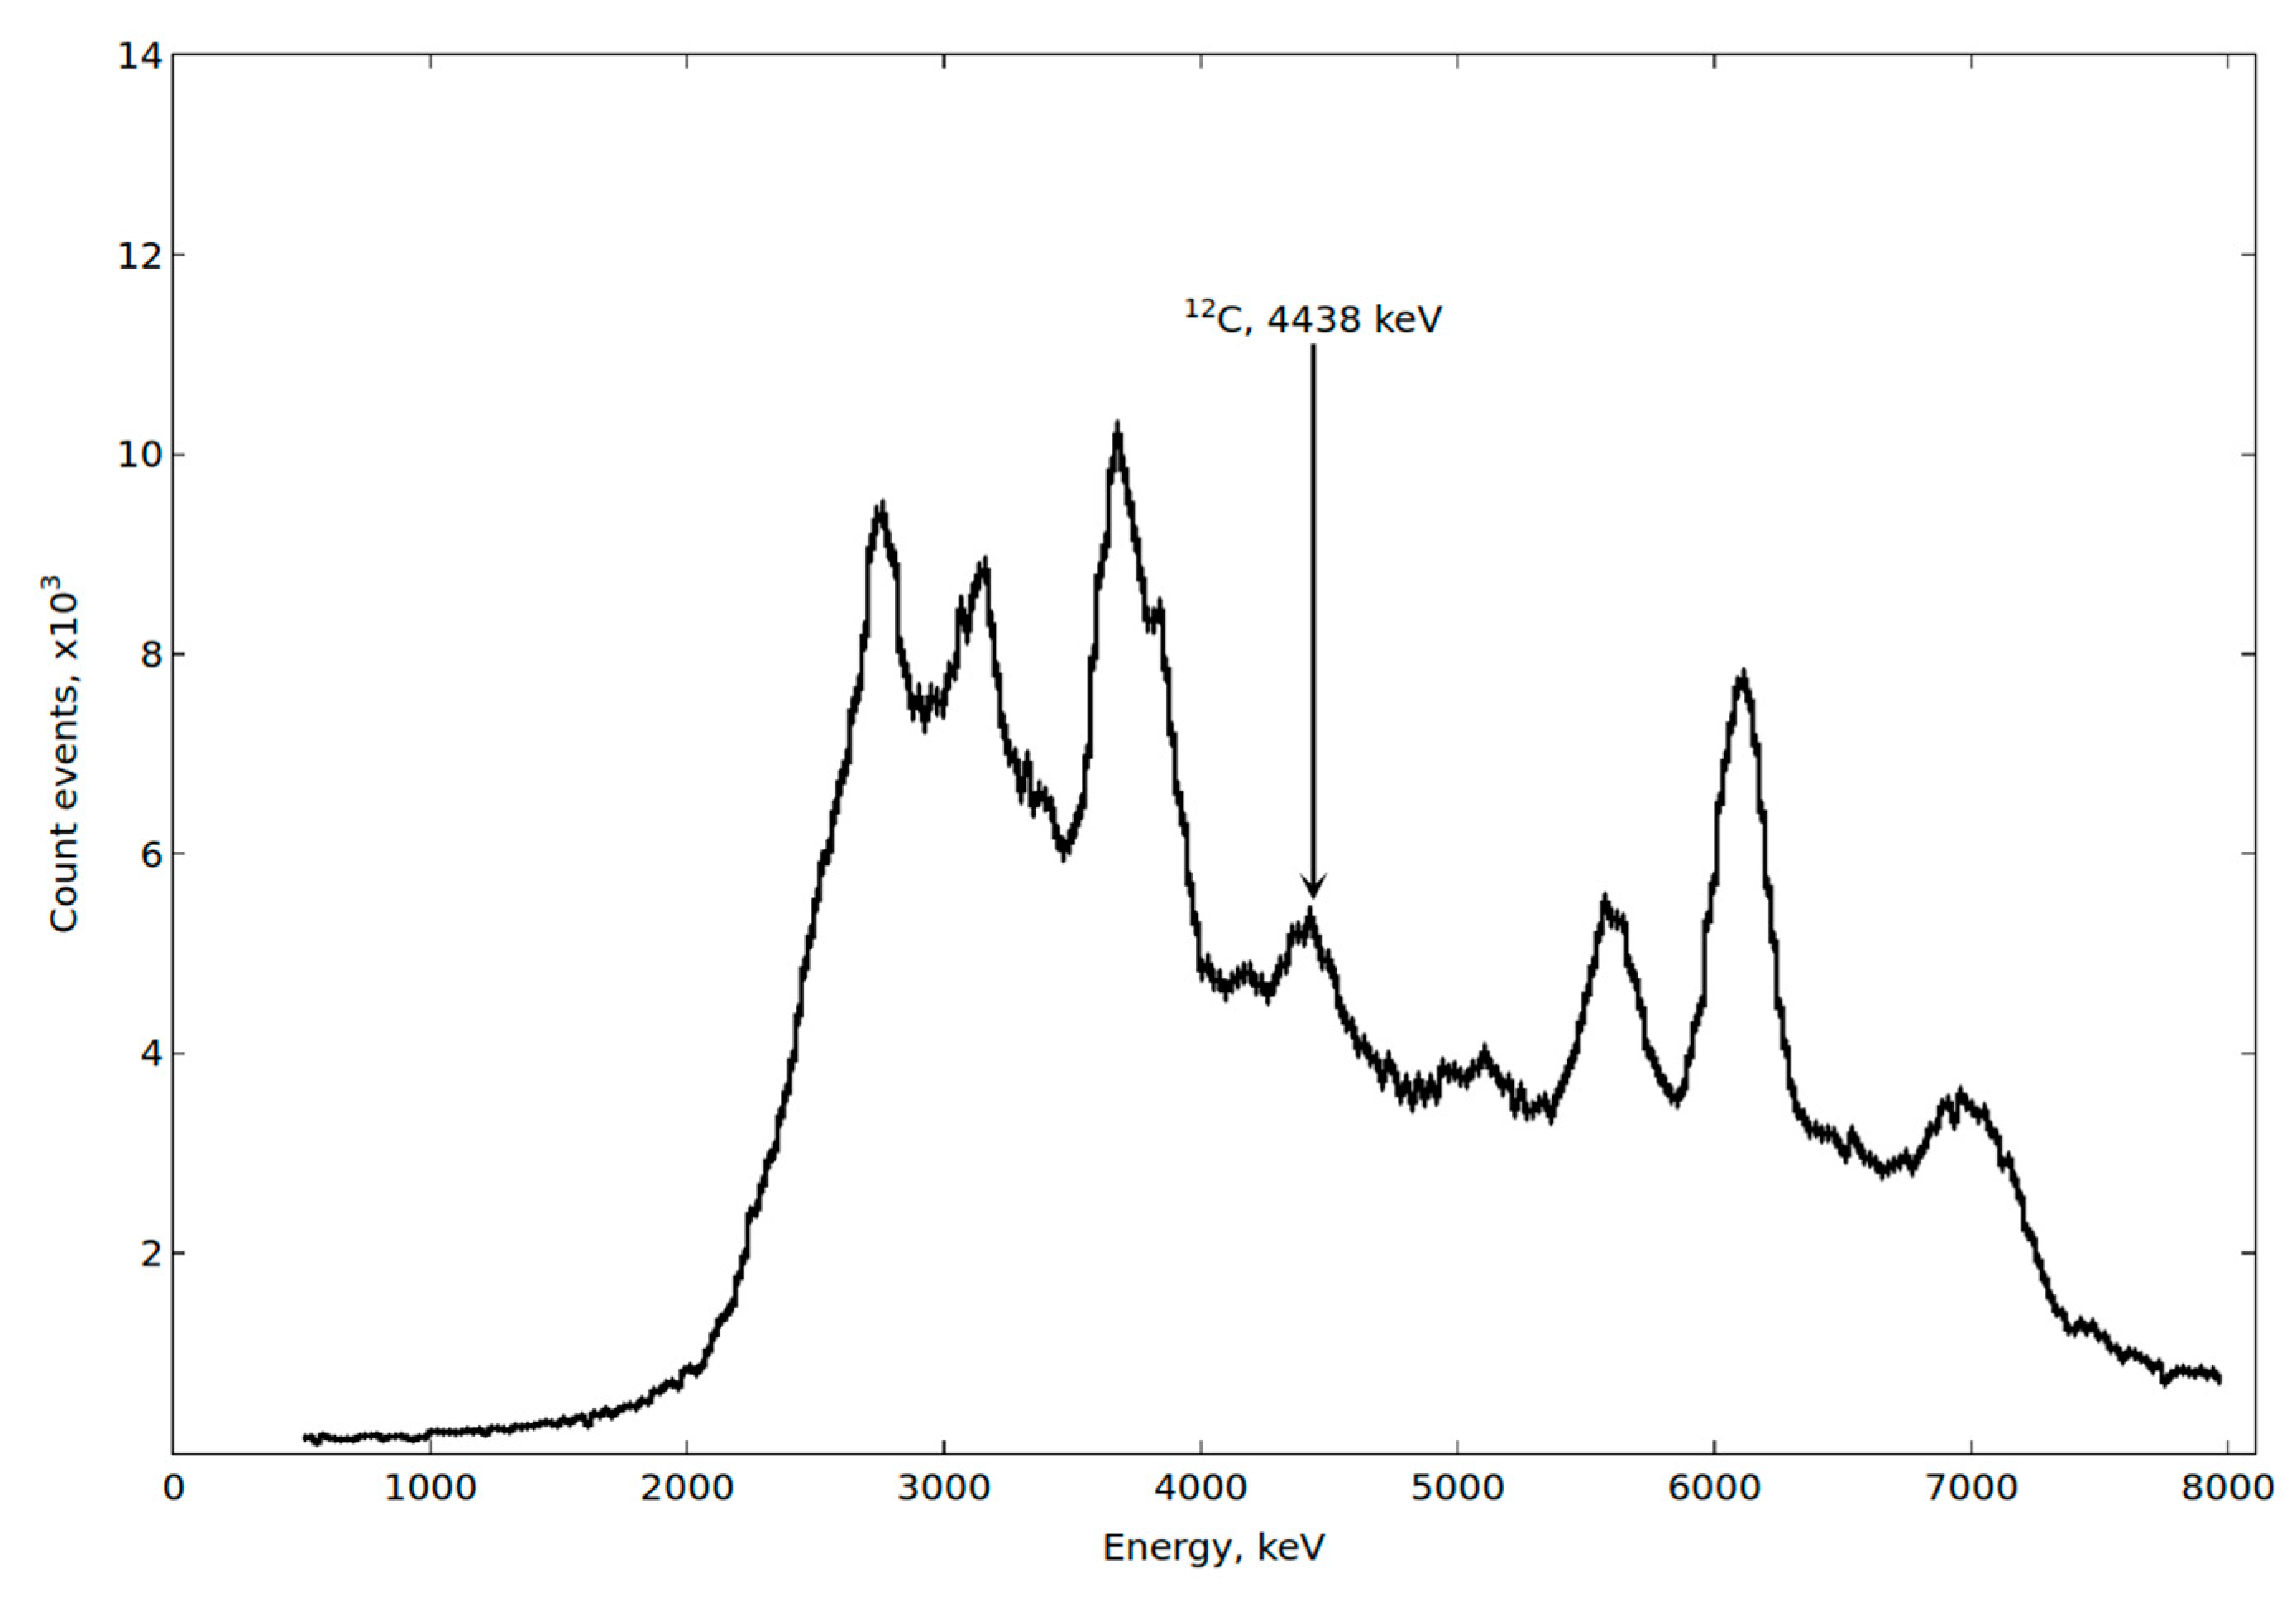
In Figure 6 the energy spectrum of γ-quanta from kimberlite ore of Karpinski mine (Archangelsk, Russia) is shown. The arrow shows the carbon 4.44 MeV line position. One could see that this peak is not large in the kimberlite due to small percentage of the carbon. To decrease the data flow, high energy threshold of 2.5 MeV was established. That is why there are no low energy lines of magnum, silicon and other elements. Actually, at this high energy threshold the spectrum is dominated by oxygen lines only. Around 3.8 MeV contamination of calcium line is also appeared.
3.3. Energy Spectra of γ-Quanta from the Kimberlite Ore with Diamond Imitators
To study the signal from a diamond inside the kimberlite stones we prepared a set of diamond imitators. They are made from synthetic diamond powder and are cylinders with diameter equal to its height. The size of imitator varied from 8 to 20 mm. In a stone a hole is made where the diamond imitator is placed.
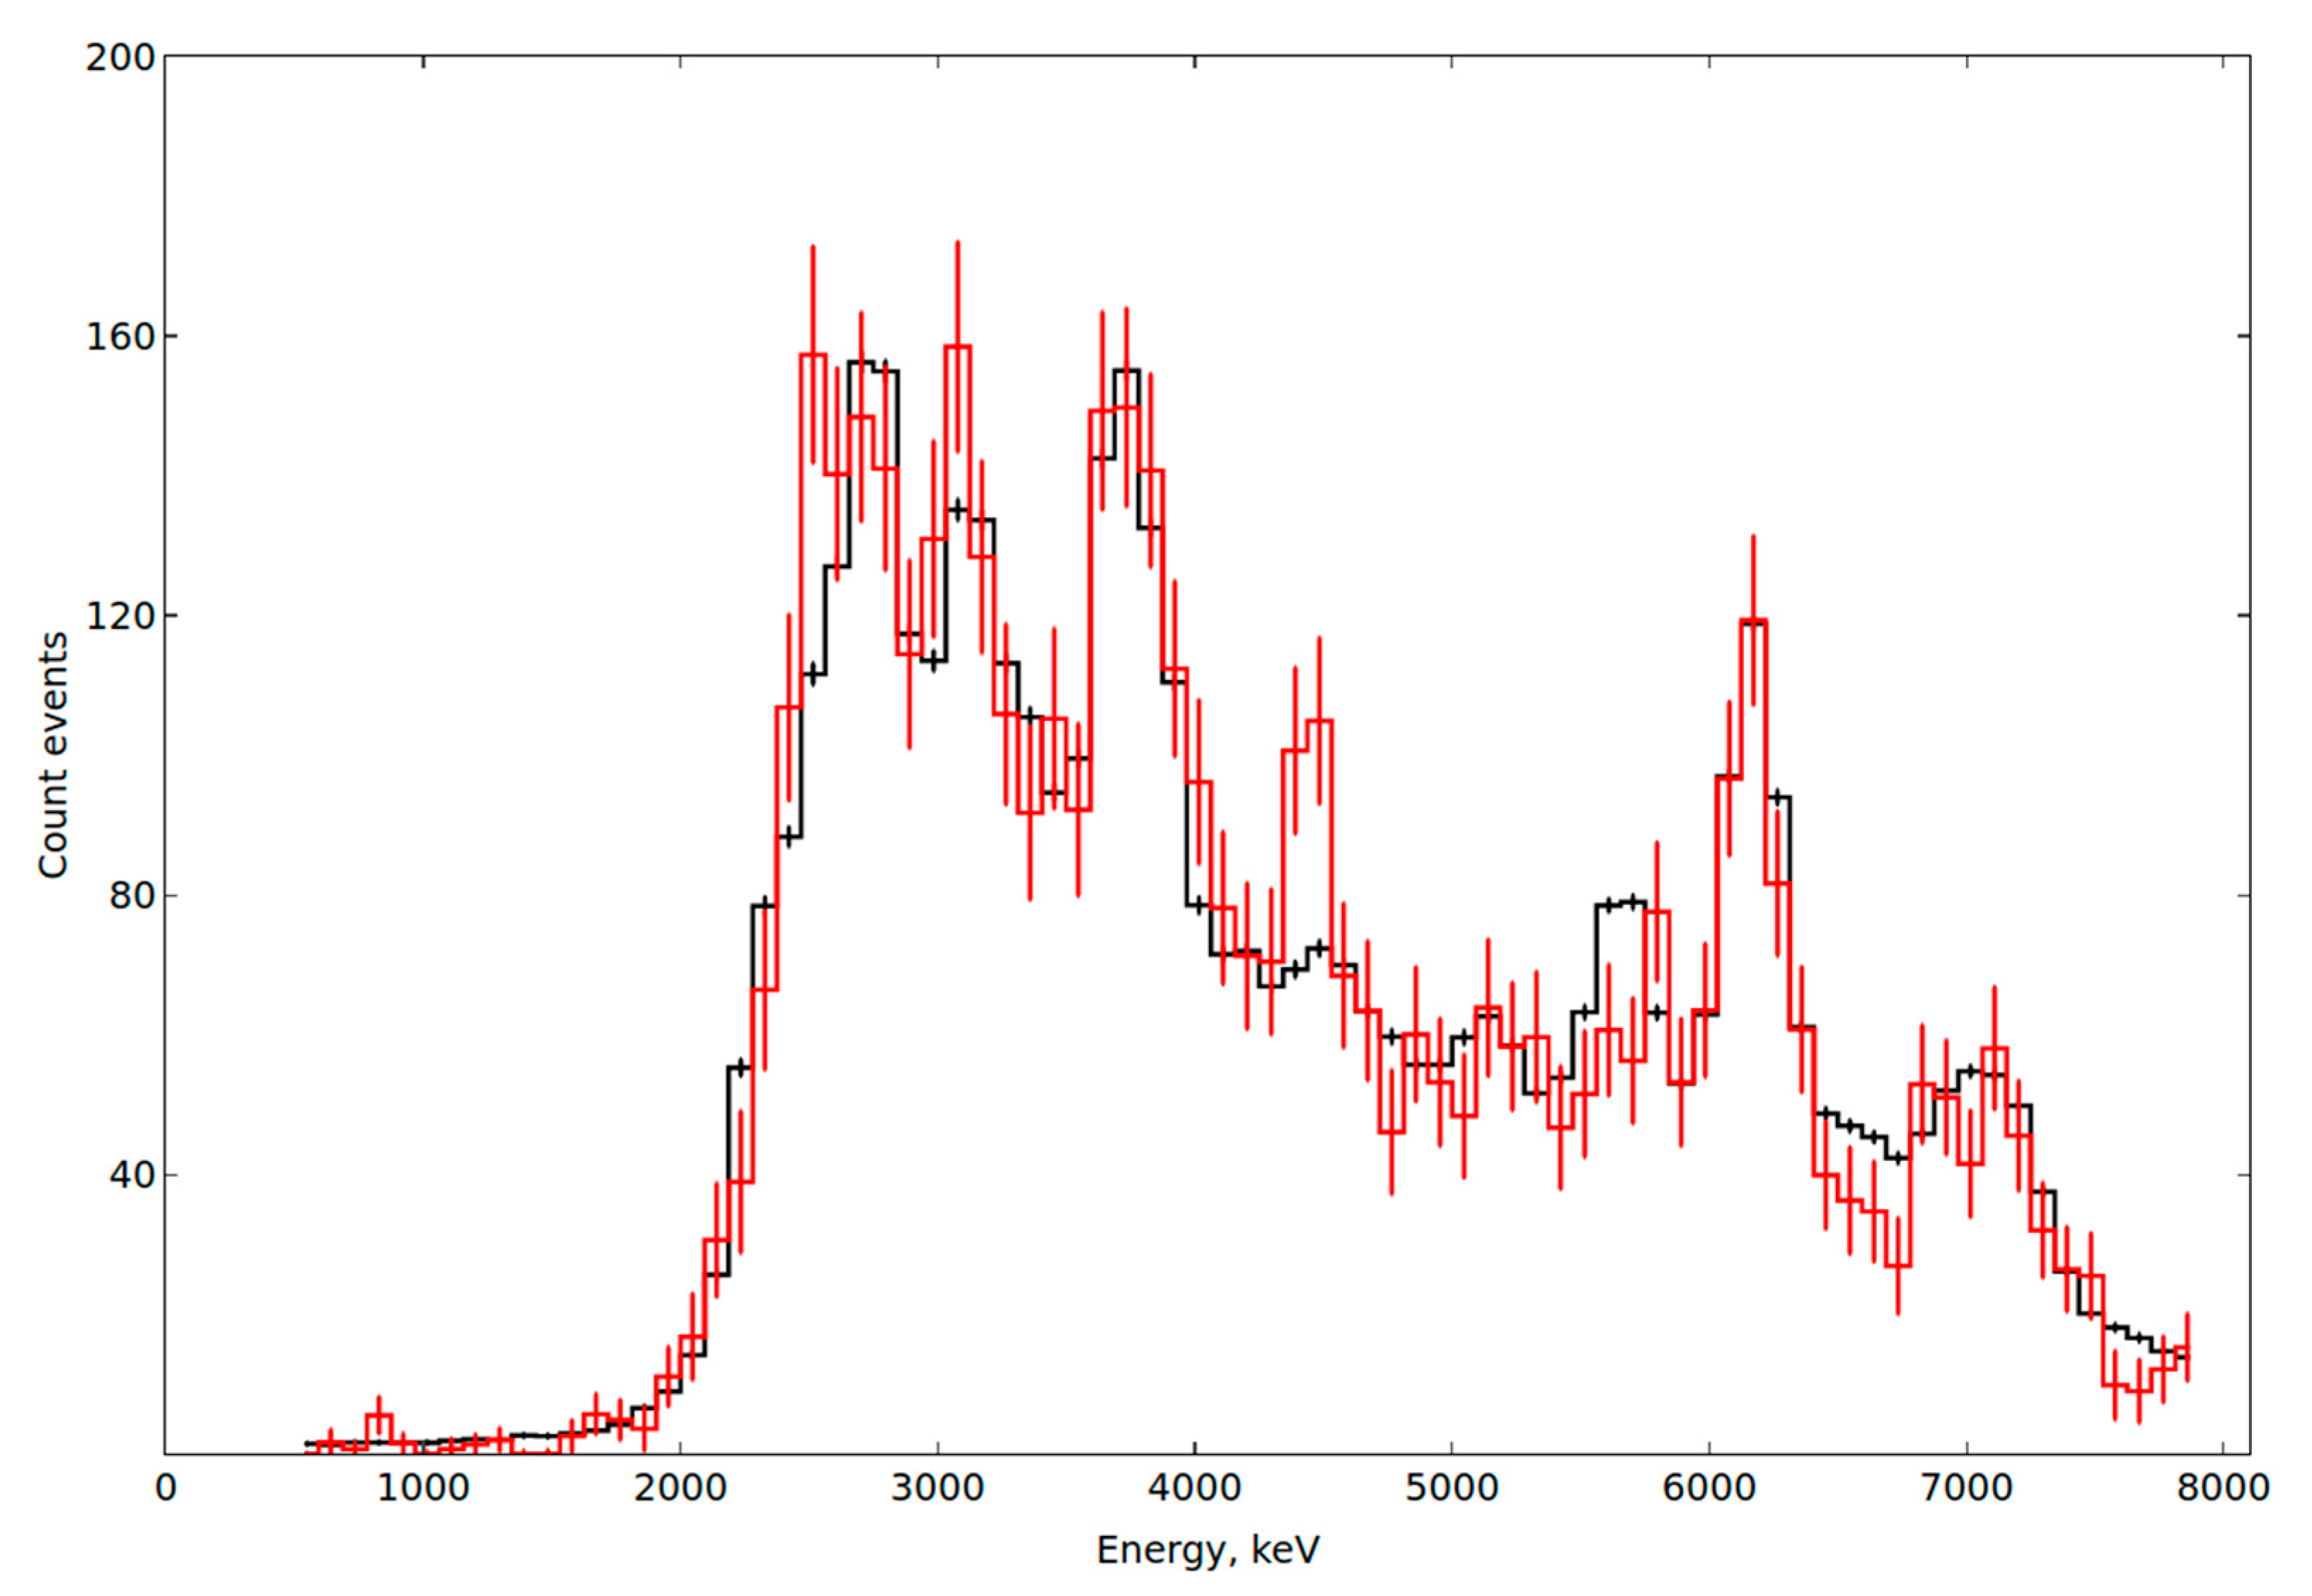
Typical spectrum of γ-quanta from kimberlite ore of 90 mm with 12 mm diamond imitator is shown in Figure 7. The histogram corresponds to the spectrum averaged on all voxels of the tray, whereas the points with errors are the spectrum from some voxel. In this voxel, one could see a clear excess of events in the region of carbon line of 4.44 MeV.
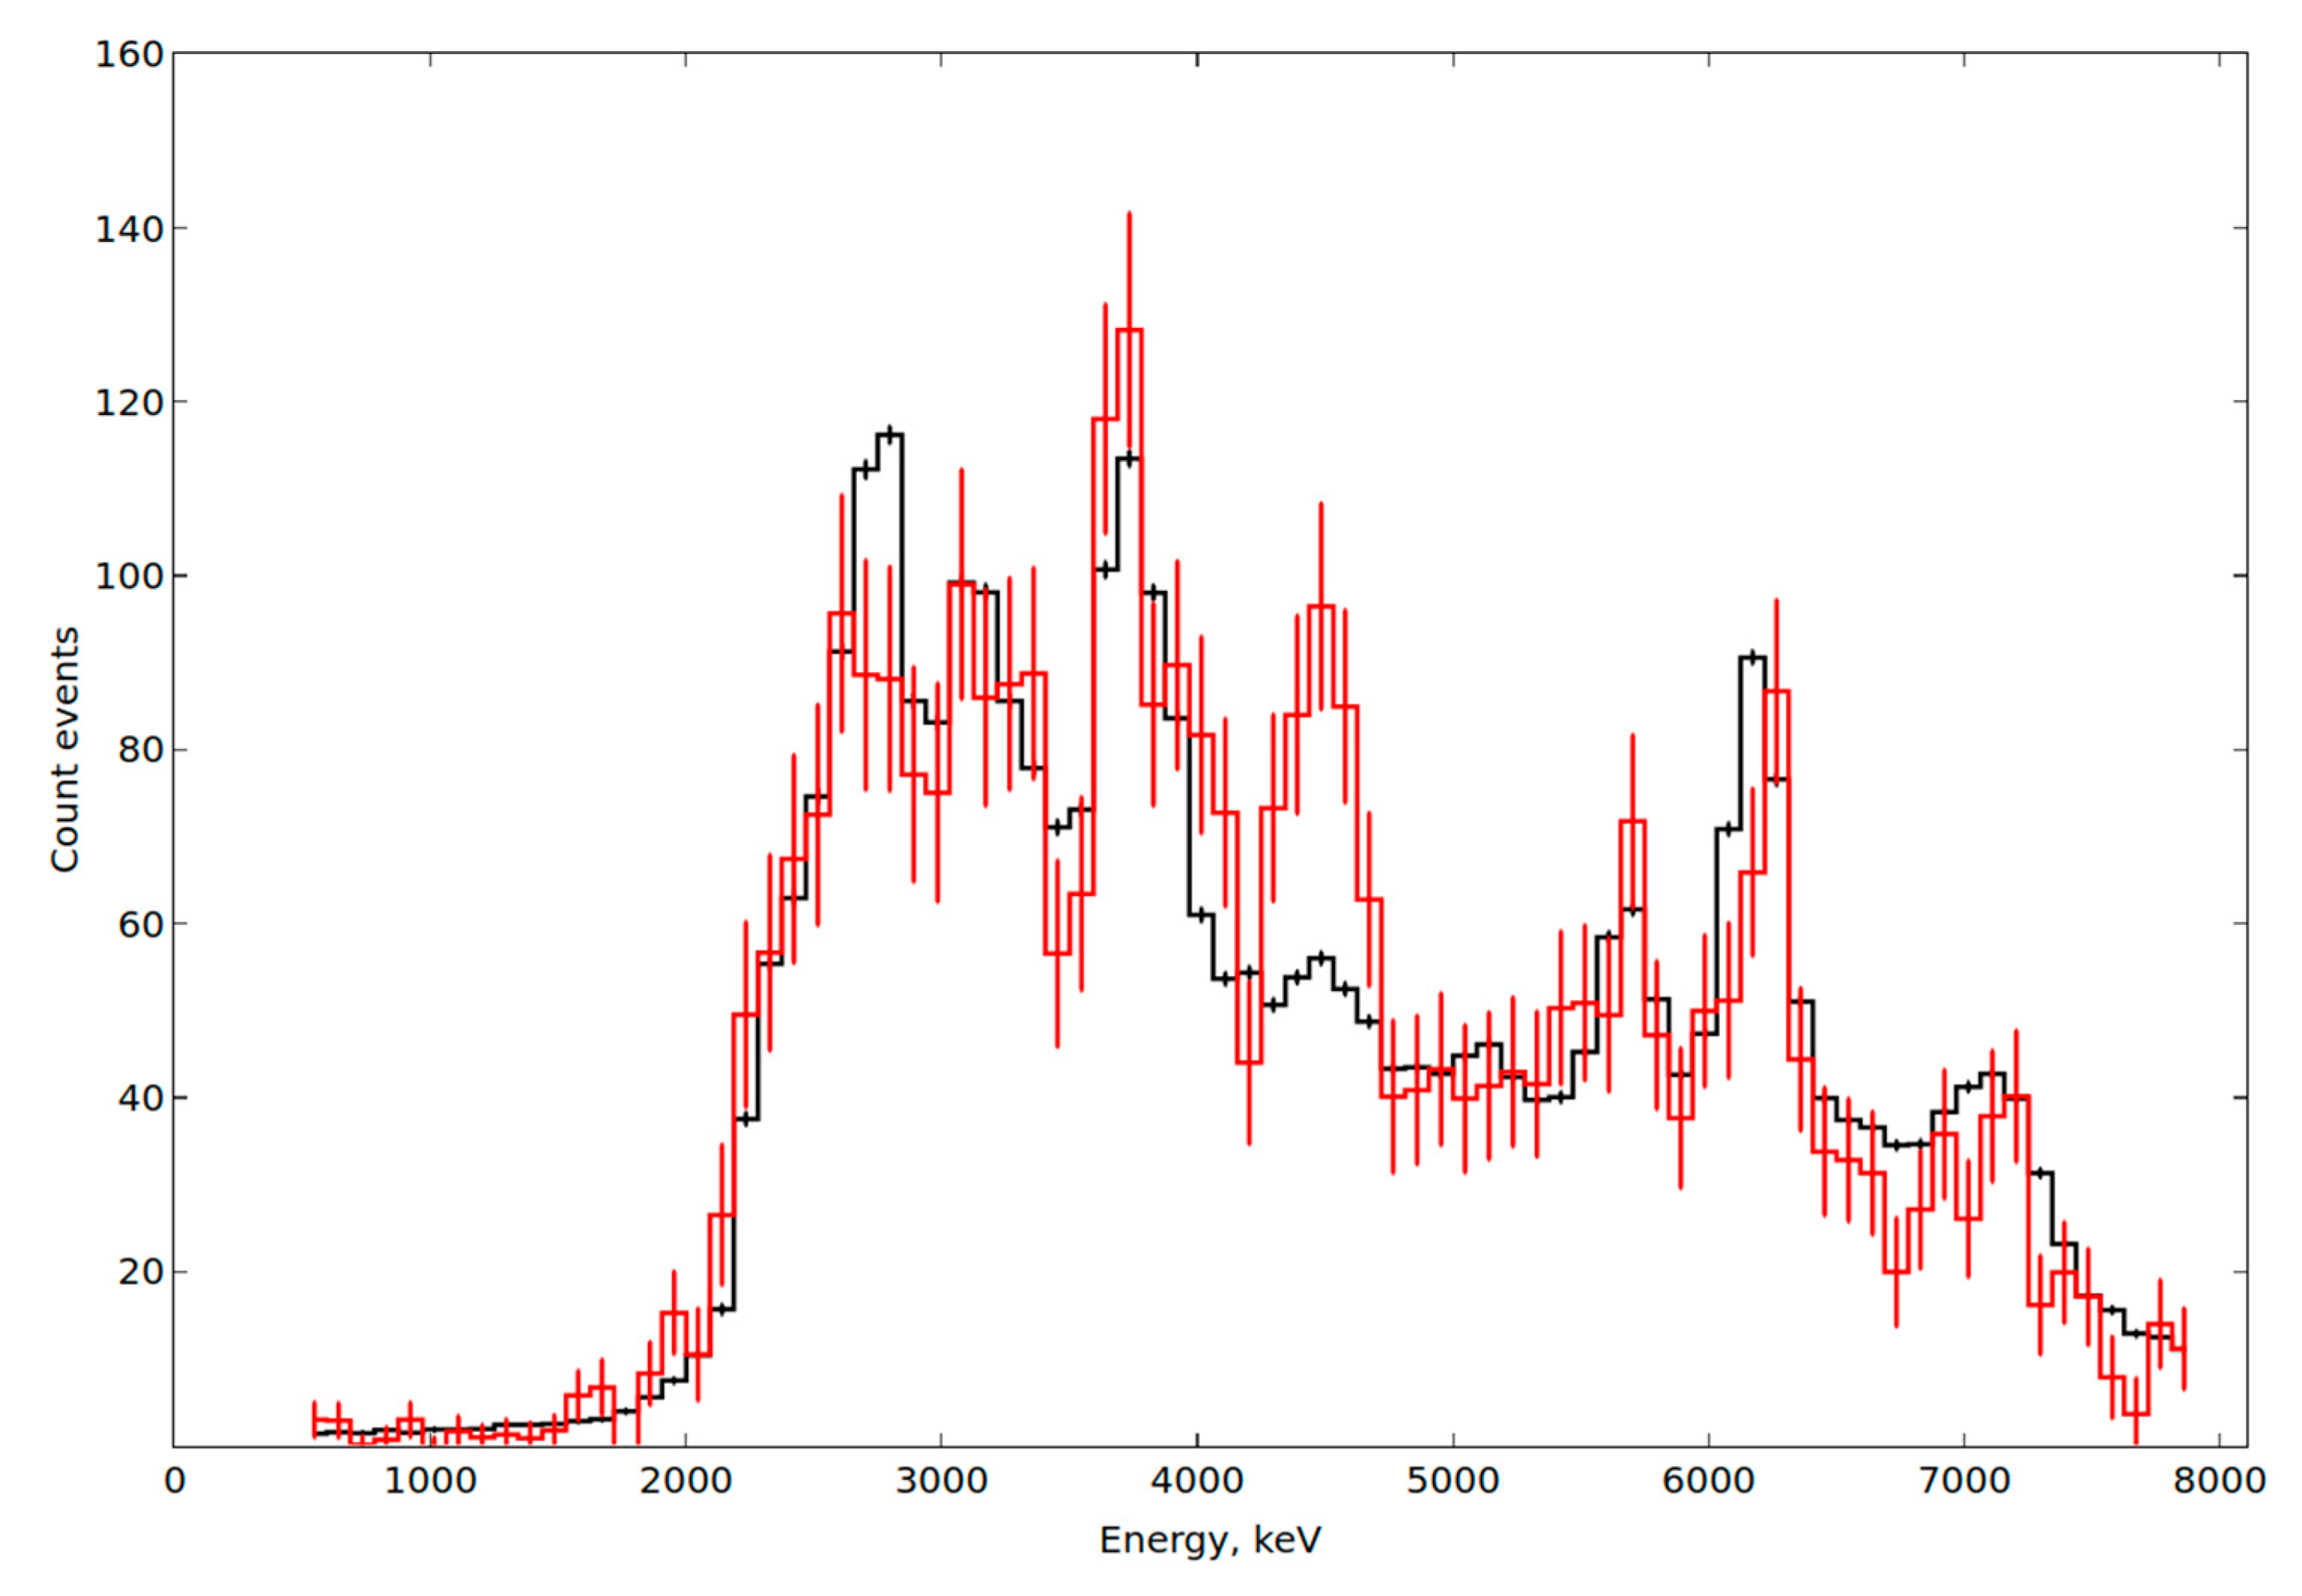
Another example is shown in Figure 8. It shows the spectrum of the voxel where diamond imitator of 20 mm is situated in the stone of 90 mm. The stones have irregular shapes so we assigned the size of a stone according to its largest dimension. One could see that the value of carbon signal is much larger.
3.4. Probability of False Alarms
The probability to find even open diamond in the kimberlite ore is quite small. The separator will mainly work with empty ore. Therefore, it is important to choose selection criteria in such a way that the probability of positive false alarms should be as low as possible. Positive false alarms mean appearance of the diamond signal from empty kimberlite ore.
Main selection criterium is excess of the local concentration of carbon in spectrum of certain voxel in comparison with carbon concentration averaged over whole sample. The value of the excess is expressed in terms of σ, where σ is calculated as follows:
Here is the number of events in carbon line region in a certain voxel, is the average number of events in carbon line region in measured sample, and are corresponding statistical errors.
The tests are carried out on kimberlite ore with size of 90 mm. This ore in a tray is irradiated for 10 s with average neutron intensity of 3.1 × 10⁷ s−1. In total, 100 different trays with the ore are tested. The results of tests for different values of σ are shown in Table 3.
Table 3 shows that probability of positive false alarms decreases with increasing σ detection parameter and is equal to 3% when σ = 3.13. The false alarms rate is expected to be the same for all grades provided the chemical composition of the ore is the same.
3.5. Probability to Detect Diamonds
The objective is to obtain probability of detecting diamond no less than 95%. The tests are carried out with the kimberlite ore of different size: −30, −75, −90 and −150 mm. The notation (−A + B) mm for ore size means that the largest dimension of the stone is smaller than A mm and the smallest dimension is larger than B mm. The kimberlite stones are arranged as a single layer in a tray. In one stone a hole was made where the diamond imitators of different sizes are placed. The intensity of neutron beam is 3.2 × 10⁷ s−1. The results of tests for decision making parameter σ = 3.0 are shown in Table 4.
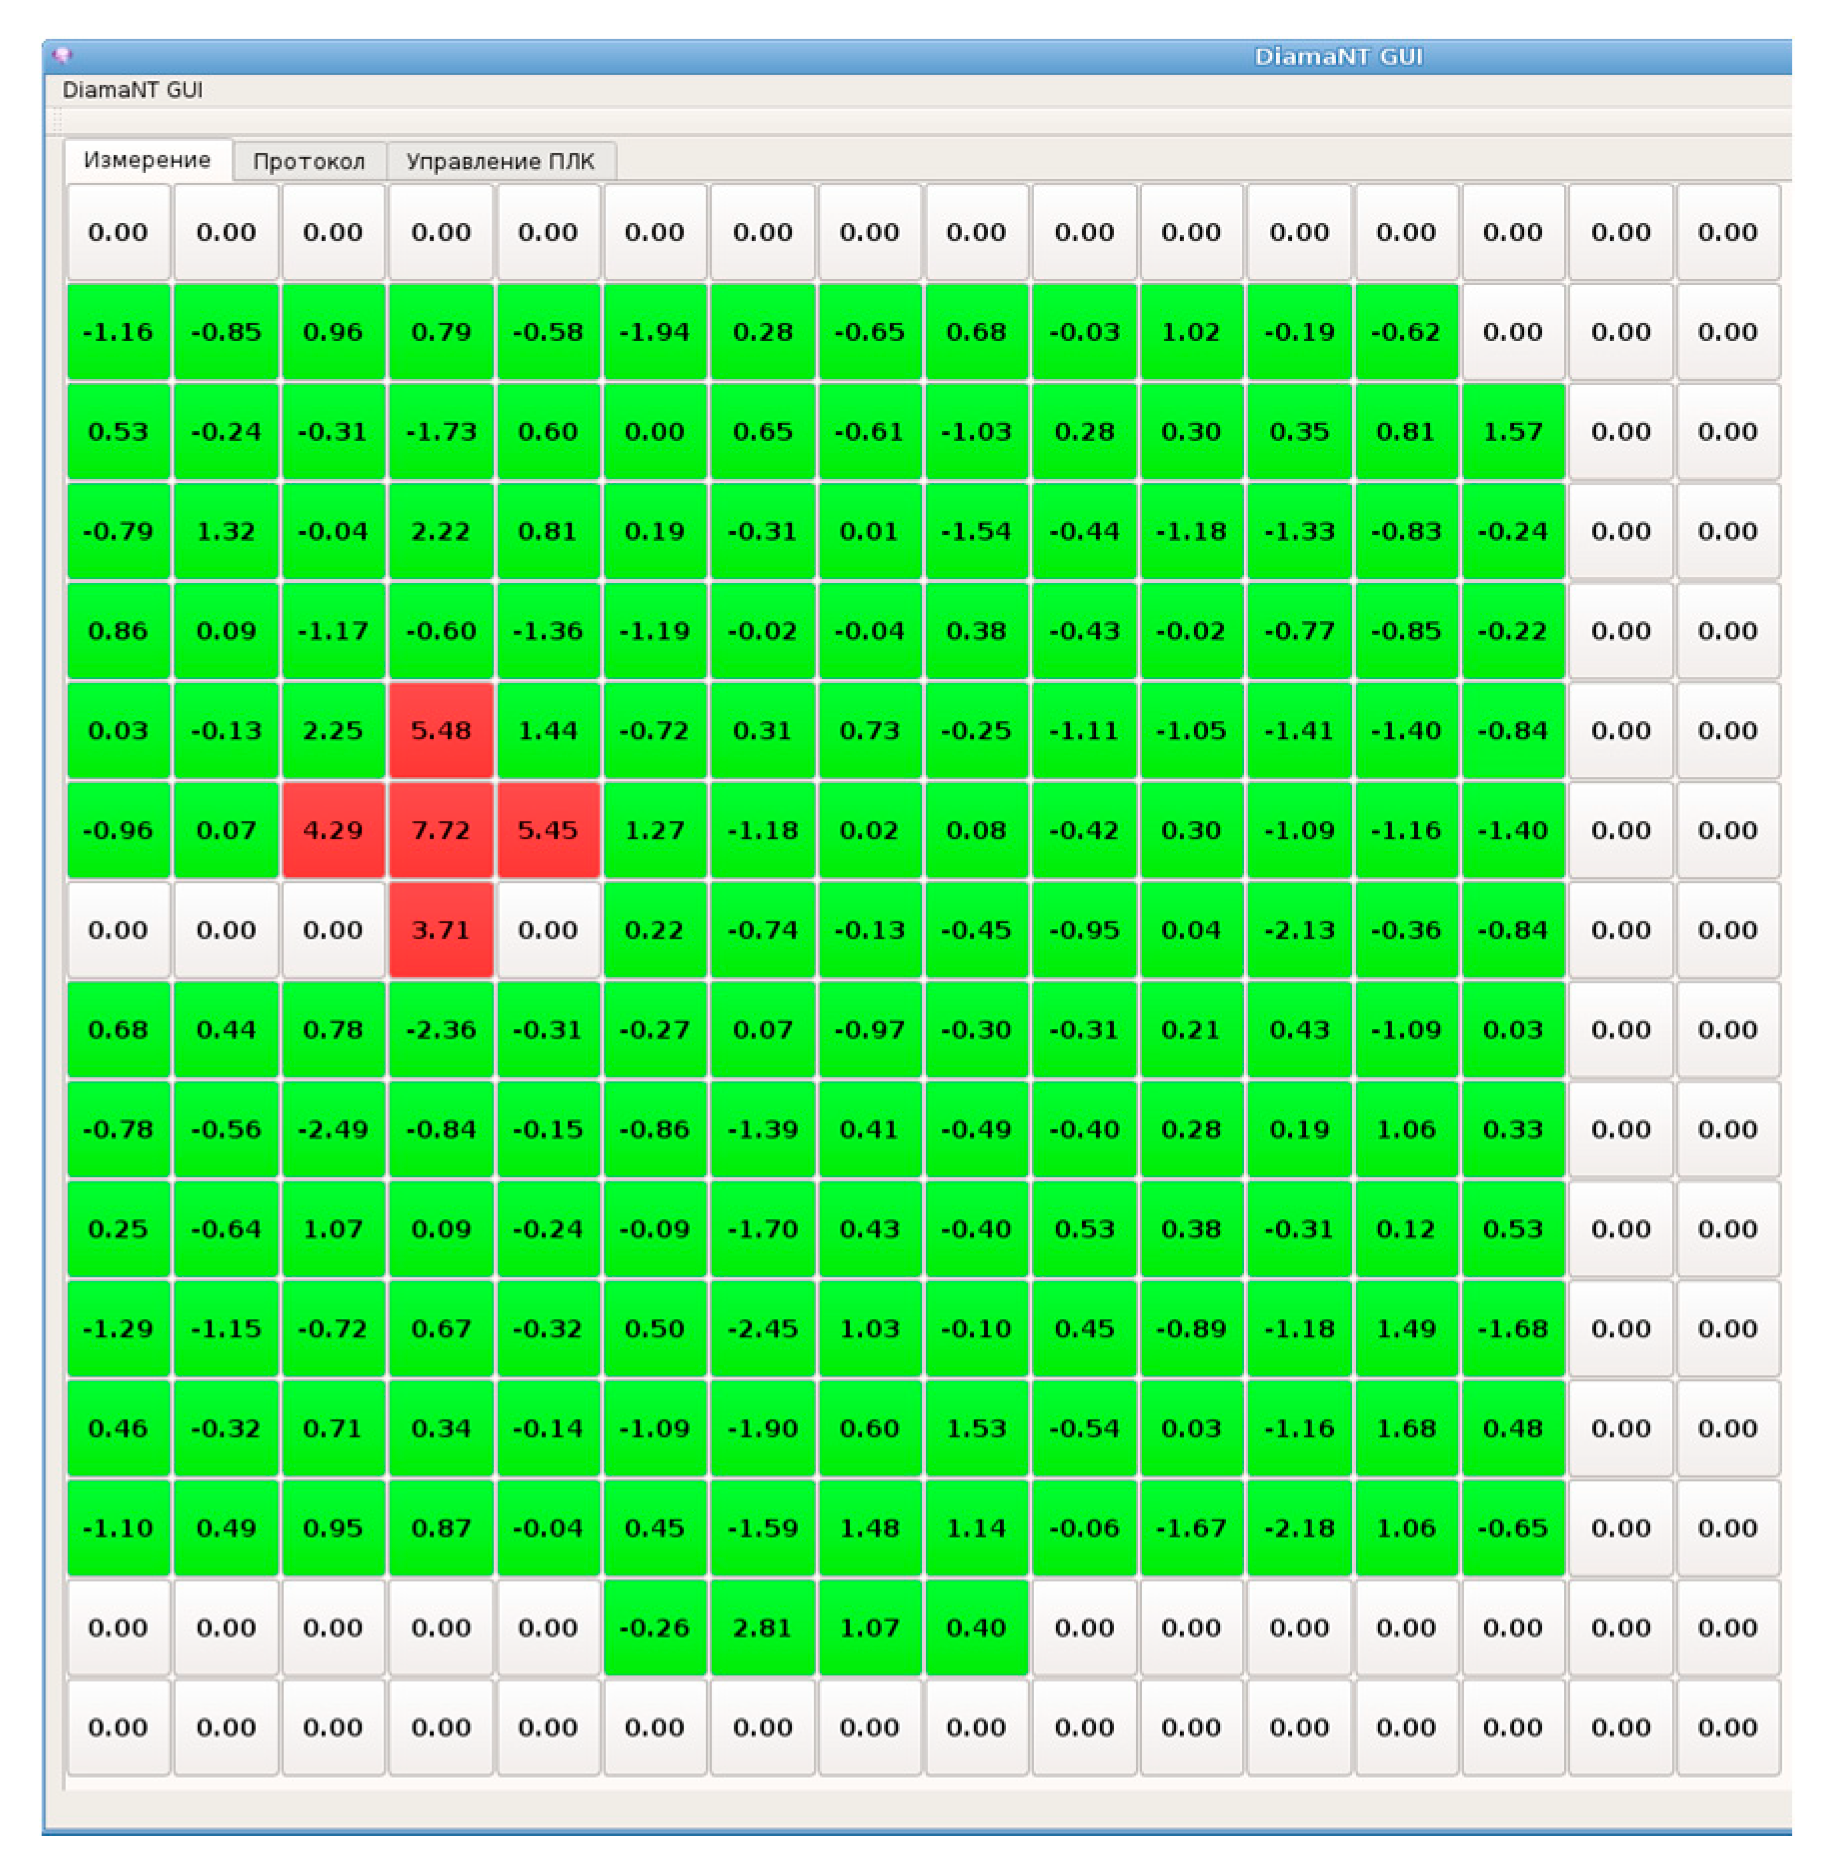
From the results in Table 4 one could conclude that the minimal detectable diamond size is 8 mm in ore of −30 + 6 mm. In Figure 9 the operator interface is shown for irradiation of 20 mm imitator inserted inside the kimberlite stone of −90 mm.
The interface shows color-coded excess of local concentration of carbon in each of 256 voxels. For large imitator its signal could be detected in several voxels and may appear in different configuration as it is shown in Figure 9. In that case the excess over background was as large as 7σ.
4. Conclusions
A prototype of neutron separator based on tagged neutron method is constructed. The neutron module of the separator consists from 22 γ-detectors and a neutron generator with 256 α-channels. The detection of diamonds is carried out by local carbon excess. Main advantage of the tagged neutron method is possibility to detect diamond inside the kimberlite stone without crushing. The tests of the prototype is carried out at Lomonosov mine of LLC “Severalmaz” (Archangelsk, Russia). It shows that:
- throughput of the prototype is 1060 kg/h
- minimal size of diamond imitator is 8 mm (5 carats)
- probability of false alarms is 3%
- probability to detect diamonds hidden in the stone is 95%
- in the stones −90 + 50 mm it is possible to find diamonds larger than 12 mm, in the stones −150 + 100 mm it is possible to find diamonds larger than 20 mm
- electricity consumption is 0.6 kW/ton of ore.
Therefore it is proved that the method works in the field conditions of a mine. However, the throughput is too small in comparison with 30–50 ton/hour needed for practical applications. To increase the throughput one needs large inspecting volume. As a first step in this direction the project of the separator on 5 ton/hour is prepared.
5. Patents
This work is resulted in the patent PCT/RU2017/000069 “Separator and method for the dry beneficiation of diamond ore”.
Author Contributions
Conceptualization, Y.R., M.S. (Mikhail Sapozhnikov); software, Y.R.; formal analysis, Y.R., V.K., and M.S. (Motswakae Sebele); writing—original draft preparation, M.S. (Mikhail Sapozhnikov); visualization, V.K.; funding acquisition, M.S. (Mikhail Sapozhnikov). All authors have read and agreed to the published version of the manuscript.
Funding
This research was funded by the Skolkovo Foundation, grant number №Γ37/16 and S.A. Zhurba.
Acknowledgments
We would like to thanks administration of PAO “Severalmaz” (Archangelsk, Russia) for support during the tests. It is a pleasure to thanks A.B. Sadovsky, O.G. Tarasov, E.I. Andreev and E.V. Zubarev for their help in construction and testing of the separator. The large contribution from V. Bystritsky who recently passed away is greatly acknowledged.
Conflicts of Interest
The authors declare no conflict of interest. The funders had no role in the design of the study; in the collection, analyses, or interpretation of data; in the writing of the manuscript, or in the decision to publish the results.
References
- Alexakhin, V.Y.; Bystritsky, V.M.; Zamyatin, N.I.; Zubarev, E.V.; Krasnoperov, A.V.; Rapatsky, V.L.; Rogov, Y.N.; Sadovsky, A.B.; Salamatin, A.V.; Salmin, R.A.; et al. Detection of Diamonds in Kimberlite by the Tagged Neutron Method. Nucl. Instrum. Methods 2015, 785, 9–13. [Google Scholar] [CrossRef]
- Valkovic, V. 14 MeV Neutrons: Physics and Applications; CRC Press: Boca Raton, FL, USA, 2015; ISBN 13: 978-1482238006. [Google Scholar]
- Hawkins, P.O.; Sutton, R.W. Compact pulsed generator of fast neutrons. Rev. Sci. Instrum. 1960, 31, 241–248. [Google Scholar] [CrossRef]
- Rhodes, E.A.; Dickerman, C.E.; Peters, C.W. Associated-particle sealed-tube neutron probe for characterization of materials. In Proceedings of the Substance Detection Systems, Innsbruck, Austria, 28 March 1994; Volume 2092, pp. 288–300. [Google Scholar]
- Rhodes, E.; Dickerman, C.E.; DeVolpi, A.; Peters, C.W. APSTNG: Radiation interrogation for verification of chemical and nuclear weapons. IEEE Trans. Nucl. Sci. 1992, 39, 1041–1045. [Google Scholar] [CrossRef]
- Beyerle, A.; Hurley, J.P.; Tunnell, L. Design of an associated particle imaging system. Nuclear Instruments and Methods in Physics Research Section A: Accelerators, Spectrometers, Detectors and Associated Equipment. Nucl. Instrum. Methods 1990, A299, 458. [Google Scholar] [CrossRef]
- Bystritsky, V.M.; Gerasimov, V.V.; Kadyshevsky, V.G.; Kobzev, A.P.; Nozdrin, A.A.; Rogov, Y.N.; Rapatsky, V.L.; Sadovsky, A.B.; Salamatin, A.V.; Sapozhnikov, M.G.; et al. DViN—Stationary setup for identification of explosives. Phys. Part. Nucl. Lett. 2008, 5, 441–446. [Google Scholar] [CrossRef] [Green Version]
- Pesente, S.; Nebbia, G.; Viesti, G.; Daniele, F.; Fabris, D.; Lunardon, M.; Moretto, S.; Nad, K.; Sudac, D.; Valkovic, V. Progress in tagged neutron beams for cargo inspections. Nuclear Instruments and Methods in Physics Research Section B: Beam Interactions with Materials and Atoms. Nucl. Instrum. Methods 2007, 261, 268–271. [Google Scholar] [CrossRef]
- Mihalczo, J.T.; Bingham, P.R.; Blackston, M.A.; Crye, J.M.; Grogan, B.R.; Hausladen, P.A.; McConchie, S.M.; Mullens, J.A. Fast Neutron Imaging with API DT Neutron Generators. In Proceedings of the International Technical and Scientific Conference-Portable Neutron Generators and Technologies on their Bases, The All Russian Institute of Automatics (VNIIA), Moscow, Russia, 28 September 2012; pp. 198–212. [Google Scholar]
Figure 1.
Scheme of tagged neutron method.

Figure 2.
Schematic setup.

Figure 3.
Approximation of the spatial distribution of the 16 tagged beams by Gaussians.

Figure 4.
Energy spectrum of carbon.

Figure 5.
Time distribution between signals from γ-detector №3 and α-pixel №120 (X-strip №8, Y-strip №8) for γ-quanta with energy around the 4.44 MeV carbon line.
Figure 5.
Time distribution between signals from γ-detector №3 and α-pixel №120 (X-strip №8, Y-strip №8) for γ-quanta with energy around the 4.44 MeV carbon line.

Figure 6.
Energy spectrum of γ-quanta from kimberlite ore of the Karpinski mine.

Figure 7.
The energy spectrum of γ-quanta from 90 mm kimberlite ore with 12 mm diamond imitator. The histogram shows the spectrum averaged over all voxels of the tray. The points with errors are the spectrum from the voxel where the excess over background is 3.03 σ.
Figure 7.
The energy spectrum of γ-quanta from 90 mm kimberlite ore with 12 mm diamond imitator. The histogram shows the spectrum averaged over all voxels of the tray. The points with errors are the spectrum from the voxel where the excess over background is 3.03 σ.

Figure 8.
The energy spectrum of γ-quanta from 90 mm kimberlite ore with 20 mm diamond imitator. The histogram shows the spectrum averaged over all voxels of the tray. The points with errors are the spectrum from the voxel where the diamond imitator was situated.
Figure 8.
The energy spectrum of γ-quanta from 90 mm kimberlite ore with 20 mm diamond imitator. The histogram shows the spectrum averaged over all voxels of the tray. The points with errors are the spectrum from the voxel where the diamond imitator was situated.

Figure 9.
The operator interface for irradiation of 20 mm imitator inserted inside the −90 mm kimberlite stone. In grey colored cells there is no enough statistics to calculate the carbon concentration, the green colored cells depict carbon excess less than 3σ, the red ones show carbon excess larger than 3σ.


Table 1.
Characteristics of different alpha detectors.
| Type Of Neutron Generator | Number Of Tagged Beams | Size of the Pixel, mm | Spacing between Pixels, mm |
|---|---|---|---|
| ING-27 [7] | 9 | 10 | 1 |
| Sodern, Euritrack [8] | 64 | 5.8 | 0.2 |
| API-120 [9] | 256 | 3 | - |
| ING-27-256 | 256 | 4 | 0.1 |
Table 2.
General parameters of the prototype.
| L, distance to the tray, mm | 134 |
| l, distance to the -detector, mm | 60 |
| d, size of -detector pixel, mm | 4 |
| Matrix of -detector | 16 × 16 |
| Dimension of -detector, mm | 64 × 64 |
| Dimension of the inspected area, mm | 143 × 143 |
| Dimension of voxel, D, mm | 8.93 |
| Mass of the ore in tray, kg | 2.5 |
| Inspection time, s | 6 |
| Throughput, t/h | 1.5 |
Table 3.
Probability of false positive alarms.
| Criterium of Diamond Signal in Terms of σ | Probability of Positive False Alarms |
|---|---|
| 2.38 | 0.59 |
| 2.50 | 0.47 |
| 2.63 | 0.36 |
| 2.75 | 0.21 |
| 2.88 | 0.14 |
| 3.00 | 0.07 |
| 3.13 | 0.03 |
Table 4.
Probability to detect diamond in kimberlite stones of different size.
| Size of Diamond Imitator, mm | Size of Kimberlite Stones, mm | Detection Probability, % | Number of Measurements |
|---|---|---|---|
| 8 | −30 + 6 | 0.95 | 23 |
| 12 | −75 + 40 | 0.96 | 18 |
| 16 | −75 + 40 | 0.99 | 20 |
| 16 | −90 + 50 | 0.97 | 19 |
| 20 | −150 + 100 | 0.95 | 20 |
Publisher’s Note: MDPI stays neutral with regard to jurisdictional claims in published maps and institutional affiliations. |
© 2020 by the authors. Licensee MDPI, Basel, Switzerland. This article is an open access article distributed under the terms and conditions of the Creative Commons Attribution (CC BY) license (http://creativecommons.org/licenses/by/4.0/).
Share and Cite
MDPI and ACS Style
Rogov, Y.; Kremenets, V.; Sapozhnikov, M.; Sebele, M. Application of Tagged Neutron Method for Detecting Diamonds in Kimberlite. Instruments 2020, 4, 33. https://0-doi-org.brum.beds.ac.uk/10.3390/instruments4040033
AMA Style
Rogov Y, Kremenets V, Sapozhnikov M, Sebele M. Application of Tagged Neutron Method for Detecting Diamonds in Kimberlite. Instruments. 2020; 4(4):33. https://0-doi-org.brum.beds.ac.uk/10.3390/instruments4040033
Chicago/Turabian StyleRogov, Yury, Vladislav Kremenets, Mikhail Sapozhnikov, and Motswakae Sebele. 2020. "Application of Tagged Neutron Method for Detecting Diamonds in Kimberlite" Instruments 4, no. 4: 33. https://0-doi-org.brum.beds.ac.uk/10.3390/instruments4040033