
Detection and Imaging with Leak Microstructures
by
 ,
,
Mariano Lombardi
1, 
Gianfranco Prete
1,*,
Giovanni Balbinot
1,
Alice Ferretti
2,
Giuseppe Galeazzi
1,3 and
Andrea Battistella
1 1
INFN, Laboratori Nazionali di Legnaro, Viale dell’Università 2, 35020 Legnaro, Italy
2
Azienda ULSS 5 Polesana, 45100 Rovigo, Italy
3
Dipartimento di Fisica Galileo Galilei, Università degli Studi di Padova, 35121 Padova, Italy
*
Author to whom correspondence should be addressed.
Instruments 2021, 5(2), 15; https://0-doi-org.brum.beds.ac.uk/10.3390/instruments5020015
Submission received: 8 December 2020
/
Revised: 6 March 2021
/
Accepted: 1 April 2021
/
Published: 11 April 2021
Abstract
:Results obtained with a new, very compact detector for imaging with a matrix of leak microstructures (LM) are reported. Spatial linearity and spatial resolution obtained by scanning and the detection of alpha particles with 100% efficiency, when compared with a silicon detector, are stressed. Preliminary results obtained in detecting single electrons emitted by the heated filament (Ec < 1 eV) at 1–3 mbar of propane are reported.
1. Introduction
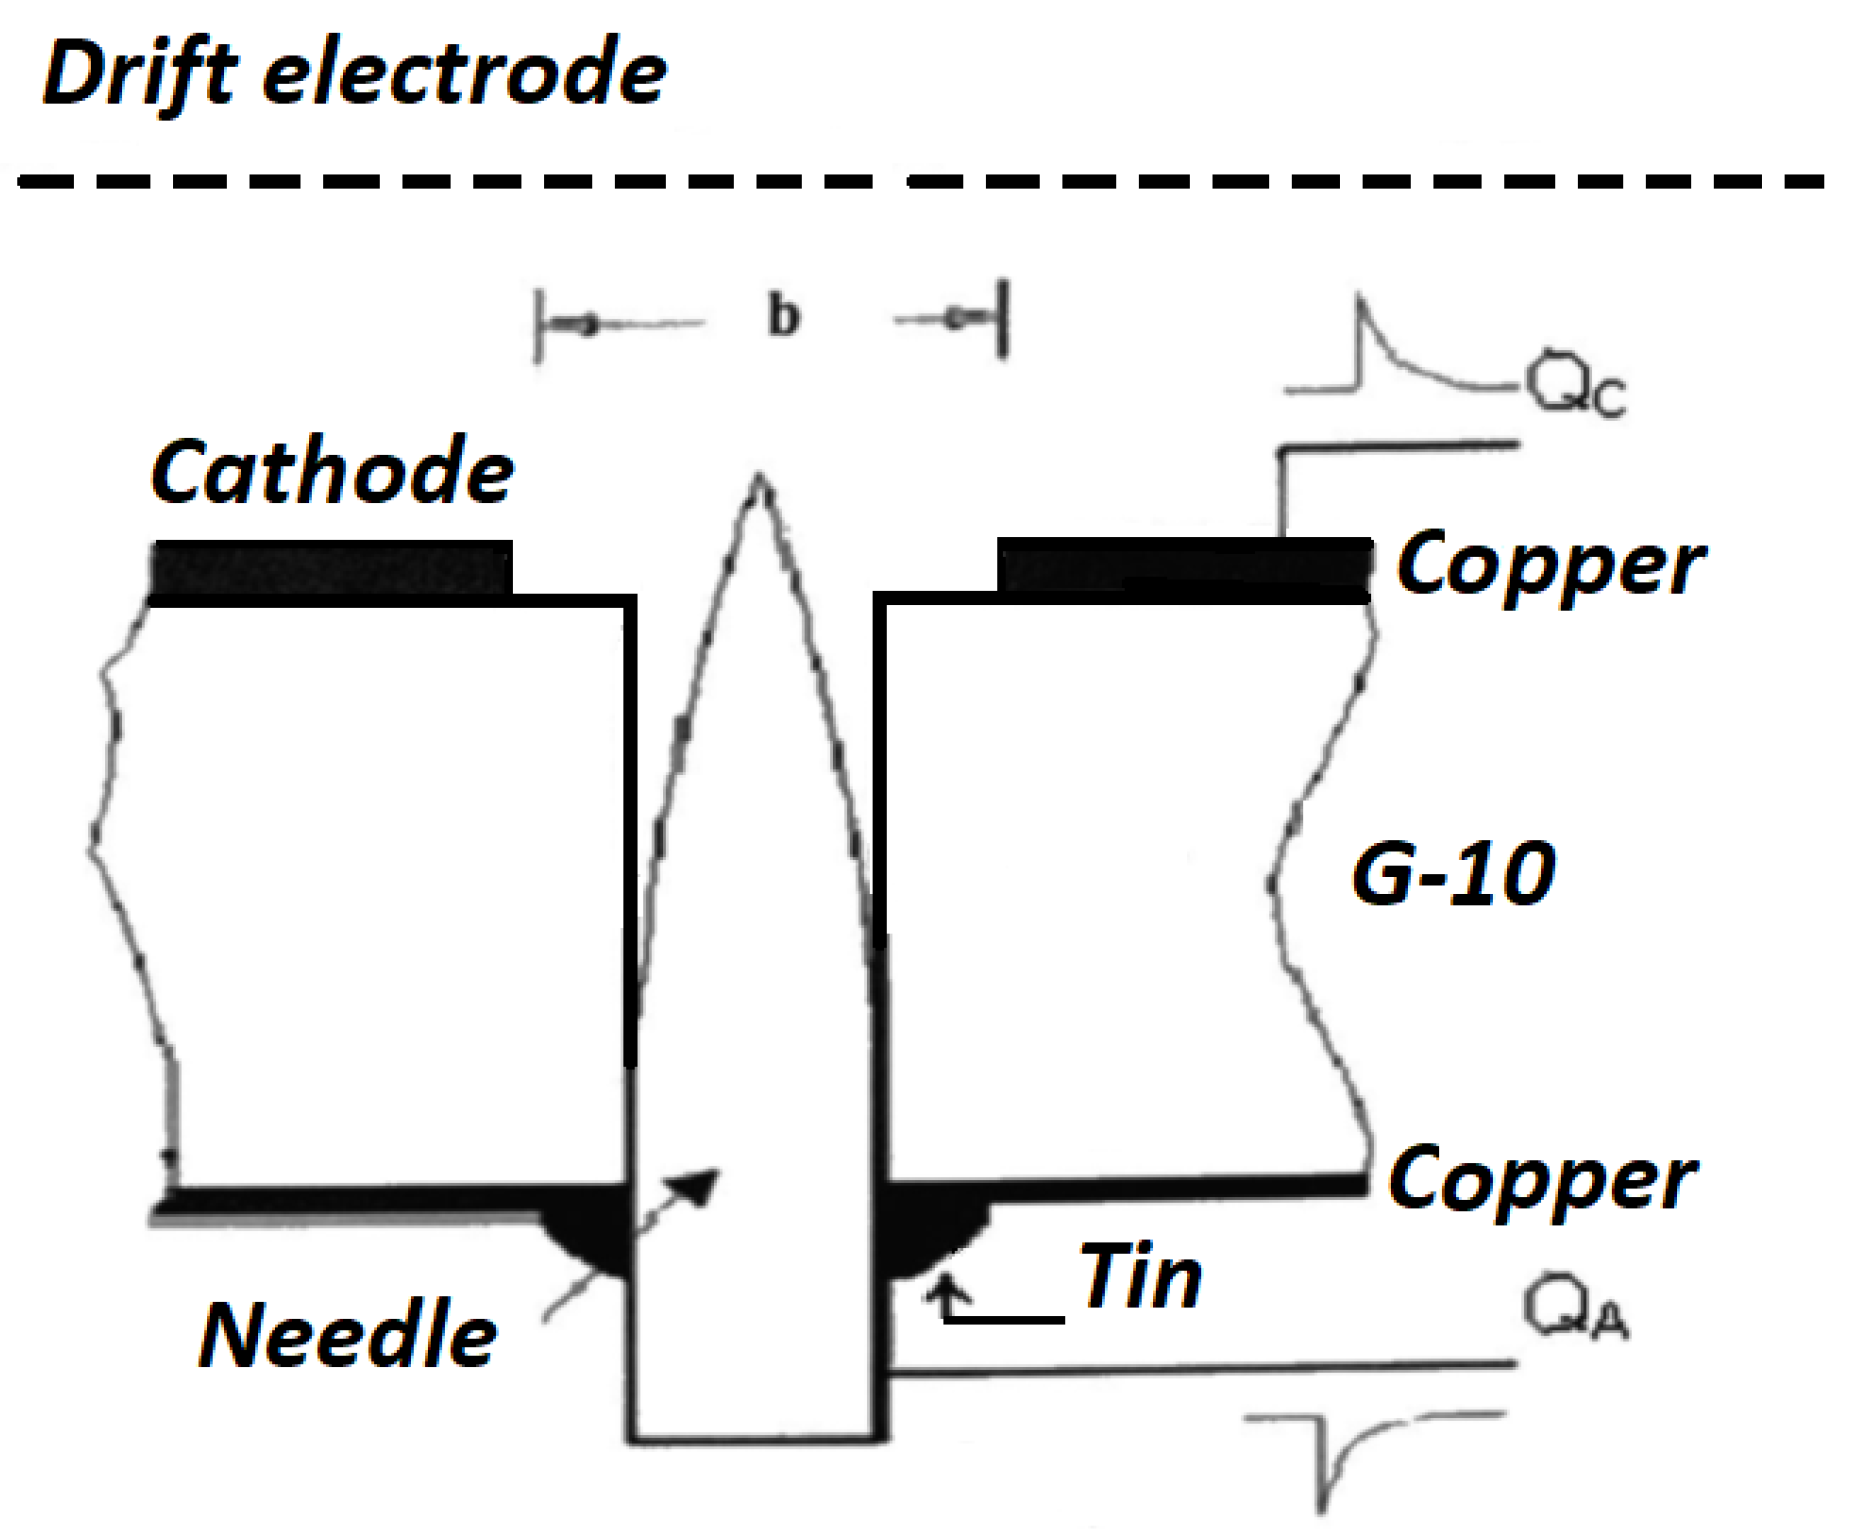
Some years ago, we introduced a new kind of gaseous detector based on tips of wires or needles used as anodes, that is, the leak microstructures (LM) [1,2,3,4,5,6,7,8]. It belongs to the family of gaseous detectors based on needles as anodes, such as the “multi-points detector with cathodic focalization” [9,10,11] and the “pin detector” [12,13]. The LM detector is different from the above detectors for its geometry and properties. The geometry of an LM is really simple (Figure 1): a needle, 315 µm diameter, whose tip (in the order of 20 µm diameter) acts as an anode, is inserted in a hole (0.35 mm diameter) drilled on a fiberglass supporting structure (G-10, commonly used for printed circuits), which is copper-clad on both sides: one side is the cathode of the detector, on the other one the needle is welded. Stable operating conditions were obtained at atmospheric pressure (760 Torr of isobutane) and at low pressure (1–3 mbar of propane) with slightly different detector geometry. The needle’s tip protrudes 0.1–0.2 mm to operate at atmospheric pressure and about 1 mm at low pressure [14]. The copper of the cathode surrounding the needle is removed to create an insulating space (b in Figure 1) about 550–600 µm in diameter to work at atmospheric pressure, 750–800 µm to work at low pressures. The thickness—4.5 mm of the supporting structure (G-10 in Figure 1)—is enough to easily allow a very good centering of the needle with respect to the insulating space of the cathode. At distances ranging from 3 to 10 mm from the cathode, a drift electrode is fixed, which marks the boundary of the active volume of the detector: this space is filled with gas. The electric field, generated between the tip of the needle and the cathode, is high enough to induce the multiplication of the ionization electrons. Induced charges (signals) are generated for each ionizing event detected, one anodic and the other cathodic, with the same amplitude and time duration, opposite sign and time coincidence, both proportional to the primary ionization. Typical of gaseous counters, these features are used in a matrix of LMs to obtain the needle address by the anode signals and a fine position determination by analyzing the cathode signals.
Let us briefly recall some properties of these microstructures:
- The lack of insulating material between the cathode and the needle tip, which represent the sensitive part of the anode where the avalanche develops, avoids the charging-up phenomena that can alter the electric field and thus the response of the detector: the LM detector shows a very stable and repetitive behavior;
- The high gas gain [4]: higher than 106 in detecting single electrons emitted by the heated filament and more than 6 × 10⁵ in detecting X photons from a 5.9 keV 55Fe source working in a proportional region at 760 Torr.
2. Imaging
The image capability of these structures was investigated starting from a single LM [8]. The cathode of LM was divided into four square pads so that the microstructure was built with the tip of a needle surrounded by four pads: two related to the X coordinate and two to Y. This structure is particularly suitable for imaging purposes because the cathodic charge spreads out to the four pads according to the position of the striking radiation, as described in. [13] and sketched in Figure 2.
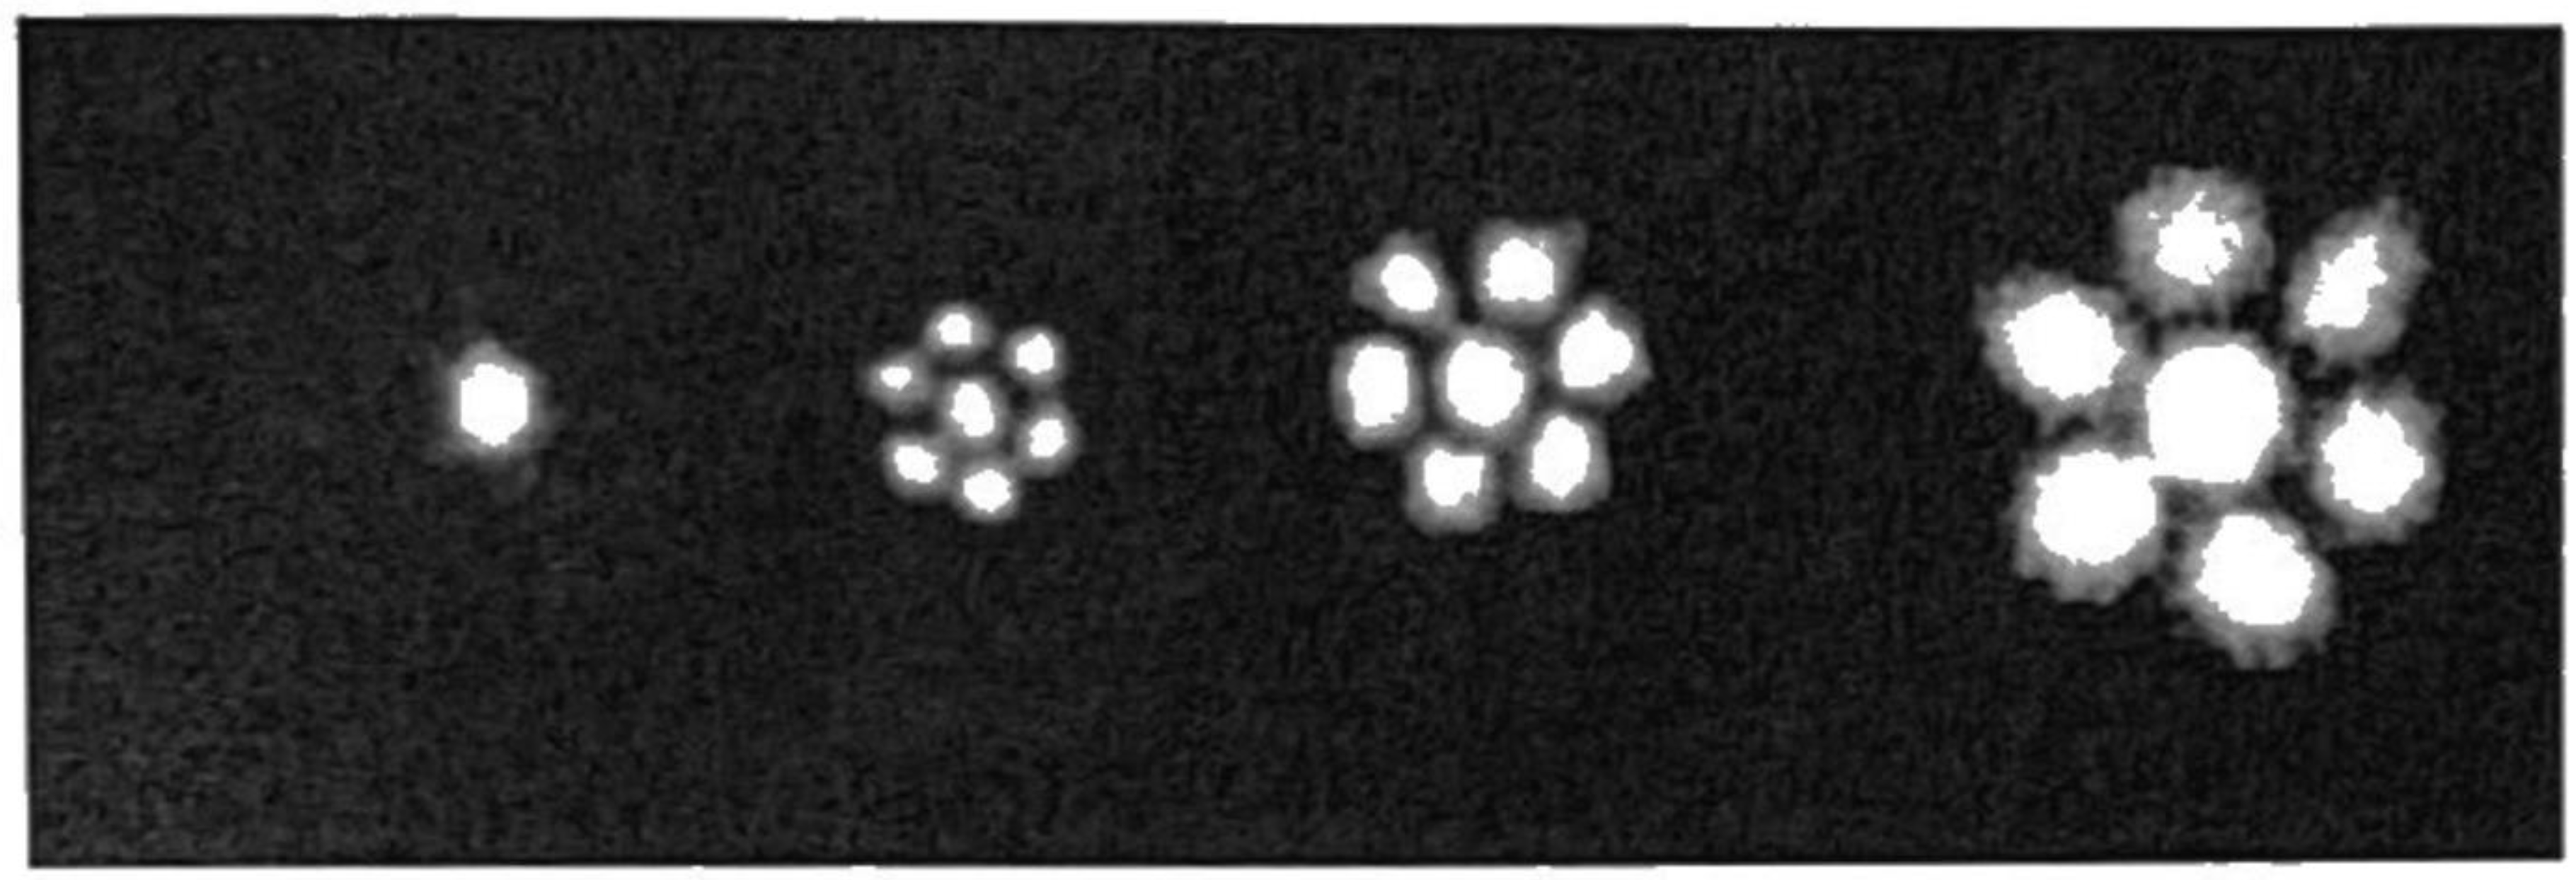
Using a 5.9 keV 55Fe source and a mask of 7 holes, 300 µm in diameter, separated by 100 µm, well centered on the anode, Figure 3 was obtained. A “zoom” effect was evidenced by changing the potential of the drift electrode.
To study the spatial linearity, an X-ray tube with a copper anti-cathode at 20 kV as the source was used together with a multi LM detector with a 2.4 mm pitch operated at 1 bar of isobutane. A 0.1 mm slit was put onto the drift electrode and shifted along the x-axis of constant 0.4 mm pitches. In Figure 4, we report the spatial linearity. The x-axis represents the slit positions in 400 µm steps, whereas the y-axis shows the position in channels measured by the detector. The errors reported in the plot are the FWHM of the acquired data. This measurement also allowed the evaluation of the spatial detector resolution, as a function of the slit position concerning the anode (tip of the needles), up to the boundary between two anodes: the best spatial resolution was above an anode (A in Figure 4 evaluated 279 µm FWHM) and worse on the boundary between two anodes (B in Figure 4 evaluated 643 µm FWHM).
The electric field characteristic of LM was studied starting from a simplified geometry of a single element. In Figure 5, the electric field of a single LM, constituted by a 20 µm needle, is presented. An electric field in the order of some MV/m was achieved.
After these preliminary results, a more extended detector consisting of several needles surrounded by pads was developed.
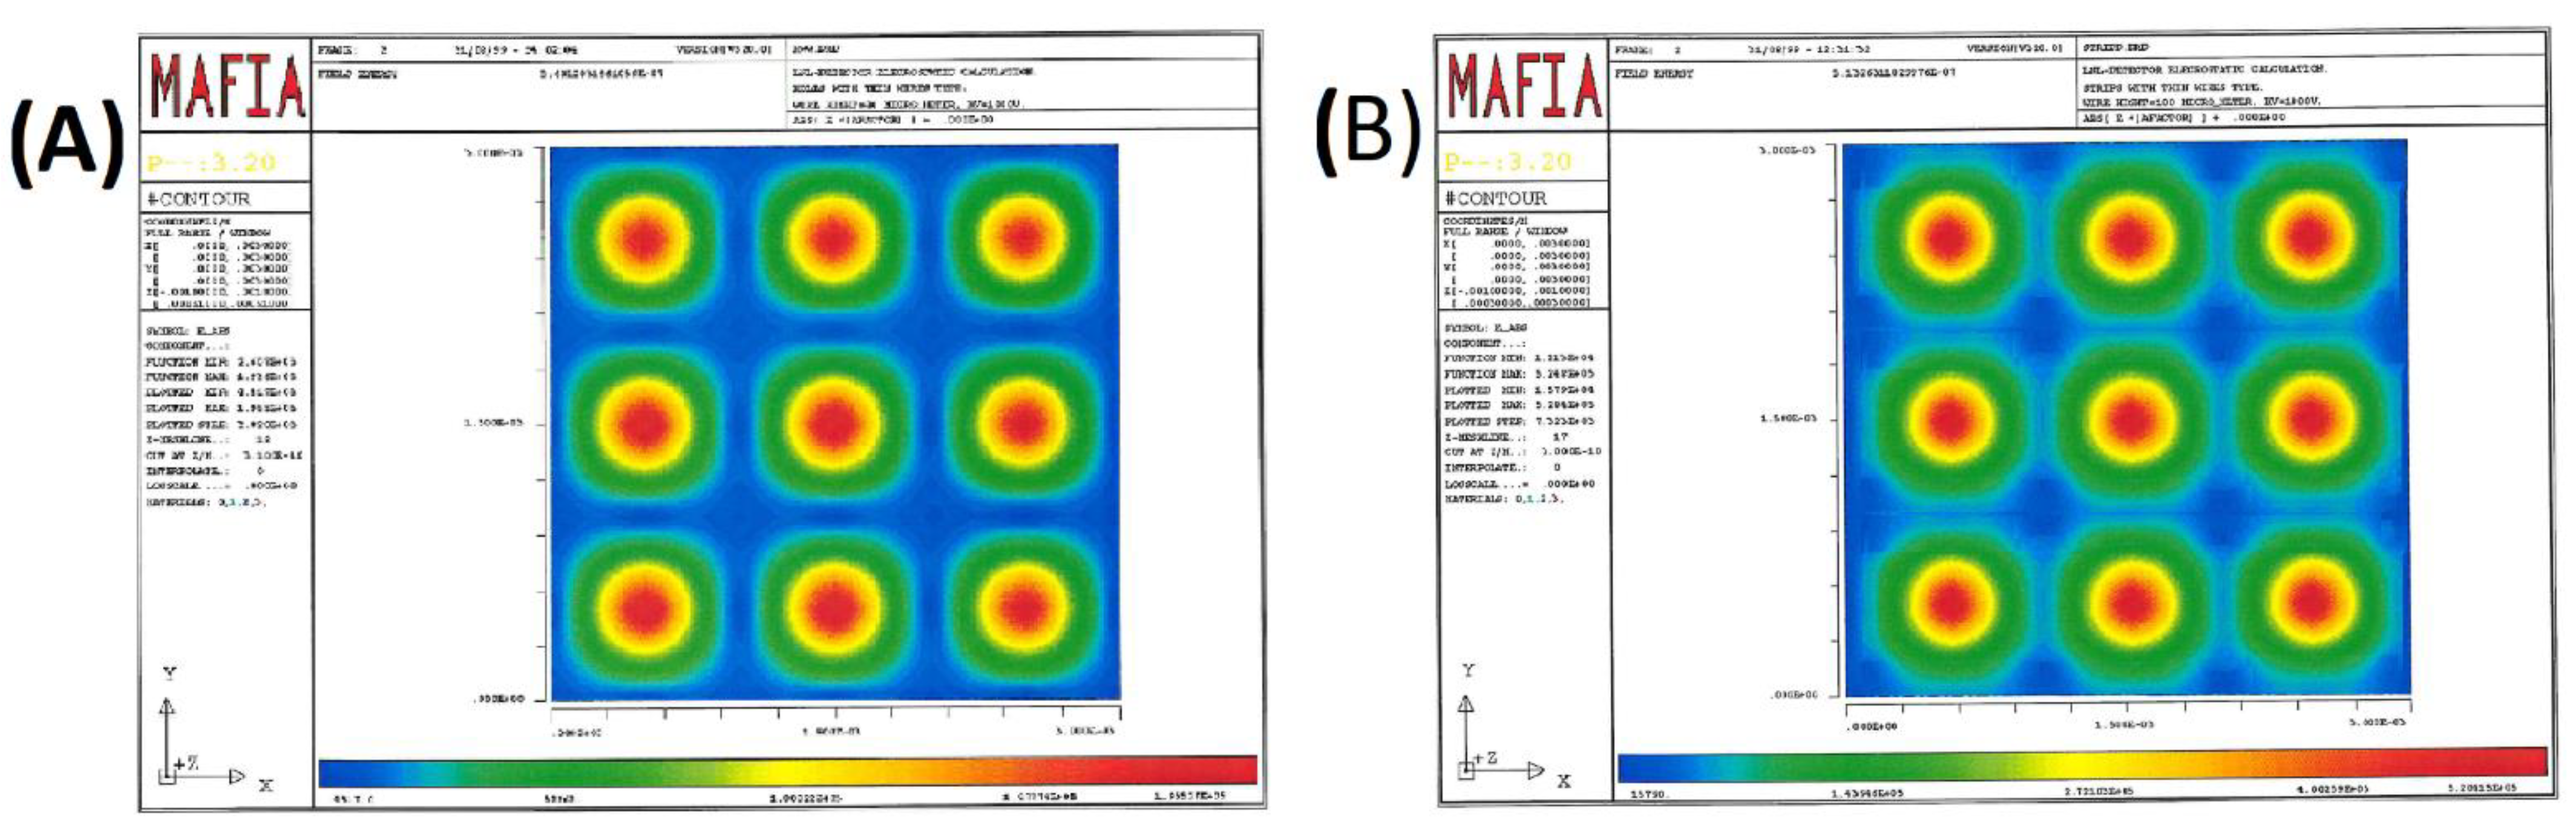
A general-purpose electromagnetic simulation software [16] was used to study a matrix of LMs. The aim was to define the geometrical parameters in such a way as to have a position sensitivity on the whole surface. At the fixed pitch, the height of the needle’s tip played an essential role in defining the sensitive area, together with the applied voltage. Figure 6 shows the simulation for two different configurations and the role of the needle height.
As a result of these simulations, a detector with an LM matrix made by 21 × 21 LMs, pitch 3 mm, distributed on a 60 × 60 mm2 surface, as shown in Figure 7, was developed.
This last version of the LMs matrix follows the one described in [7,8]. Experimental measures and simulations have shown that to avoid the imaging dead zones, the needles’ pitch must be 3 mm or less with a needle height of 100 µm. To achieve better operation stability at high voltage, the thickness of the copper-clad cathode (originally of 70 µm) was increased up to 100 µm by galvanic deposition and nickel-plated to avoid oxidation.
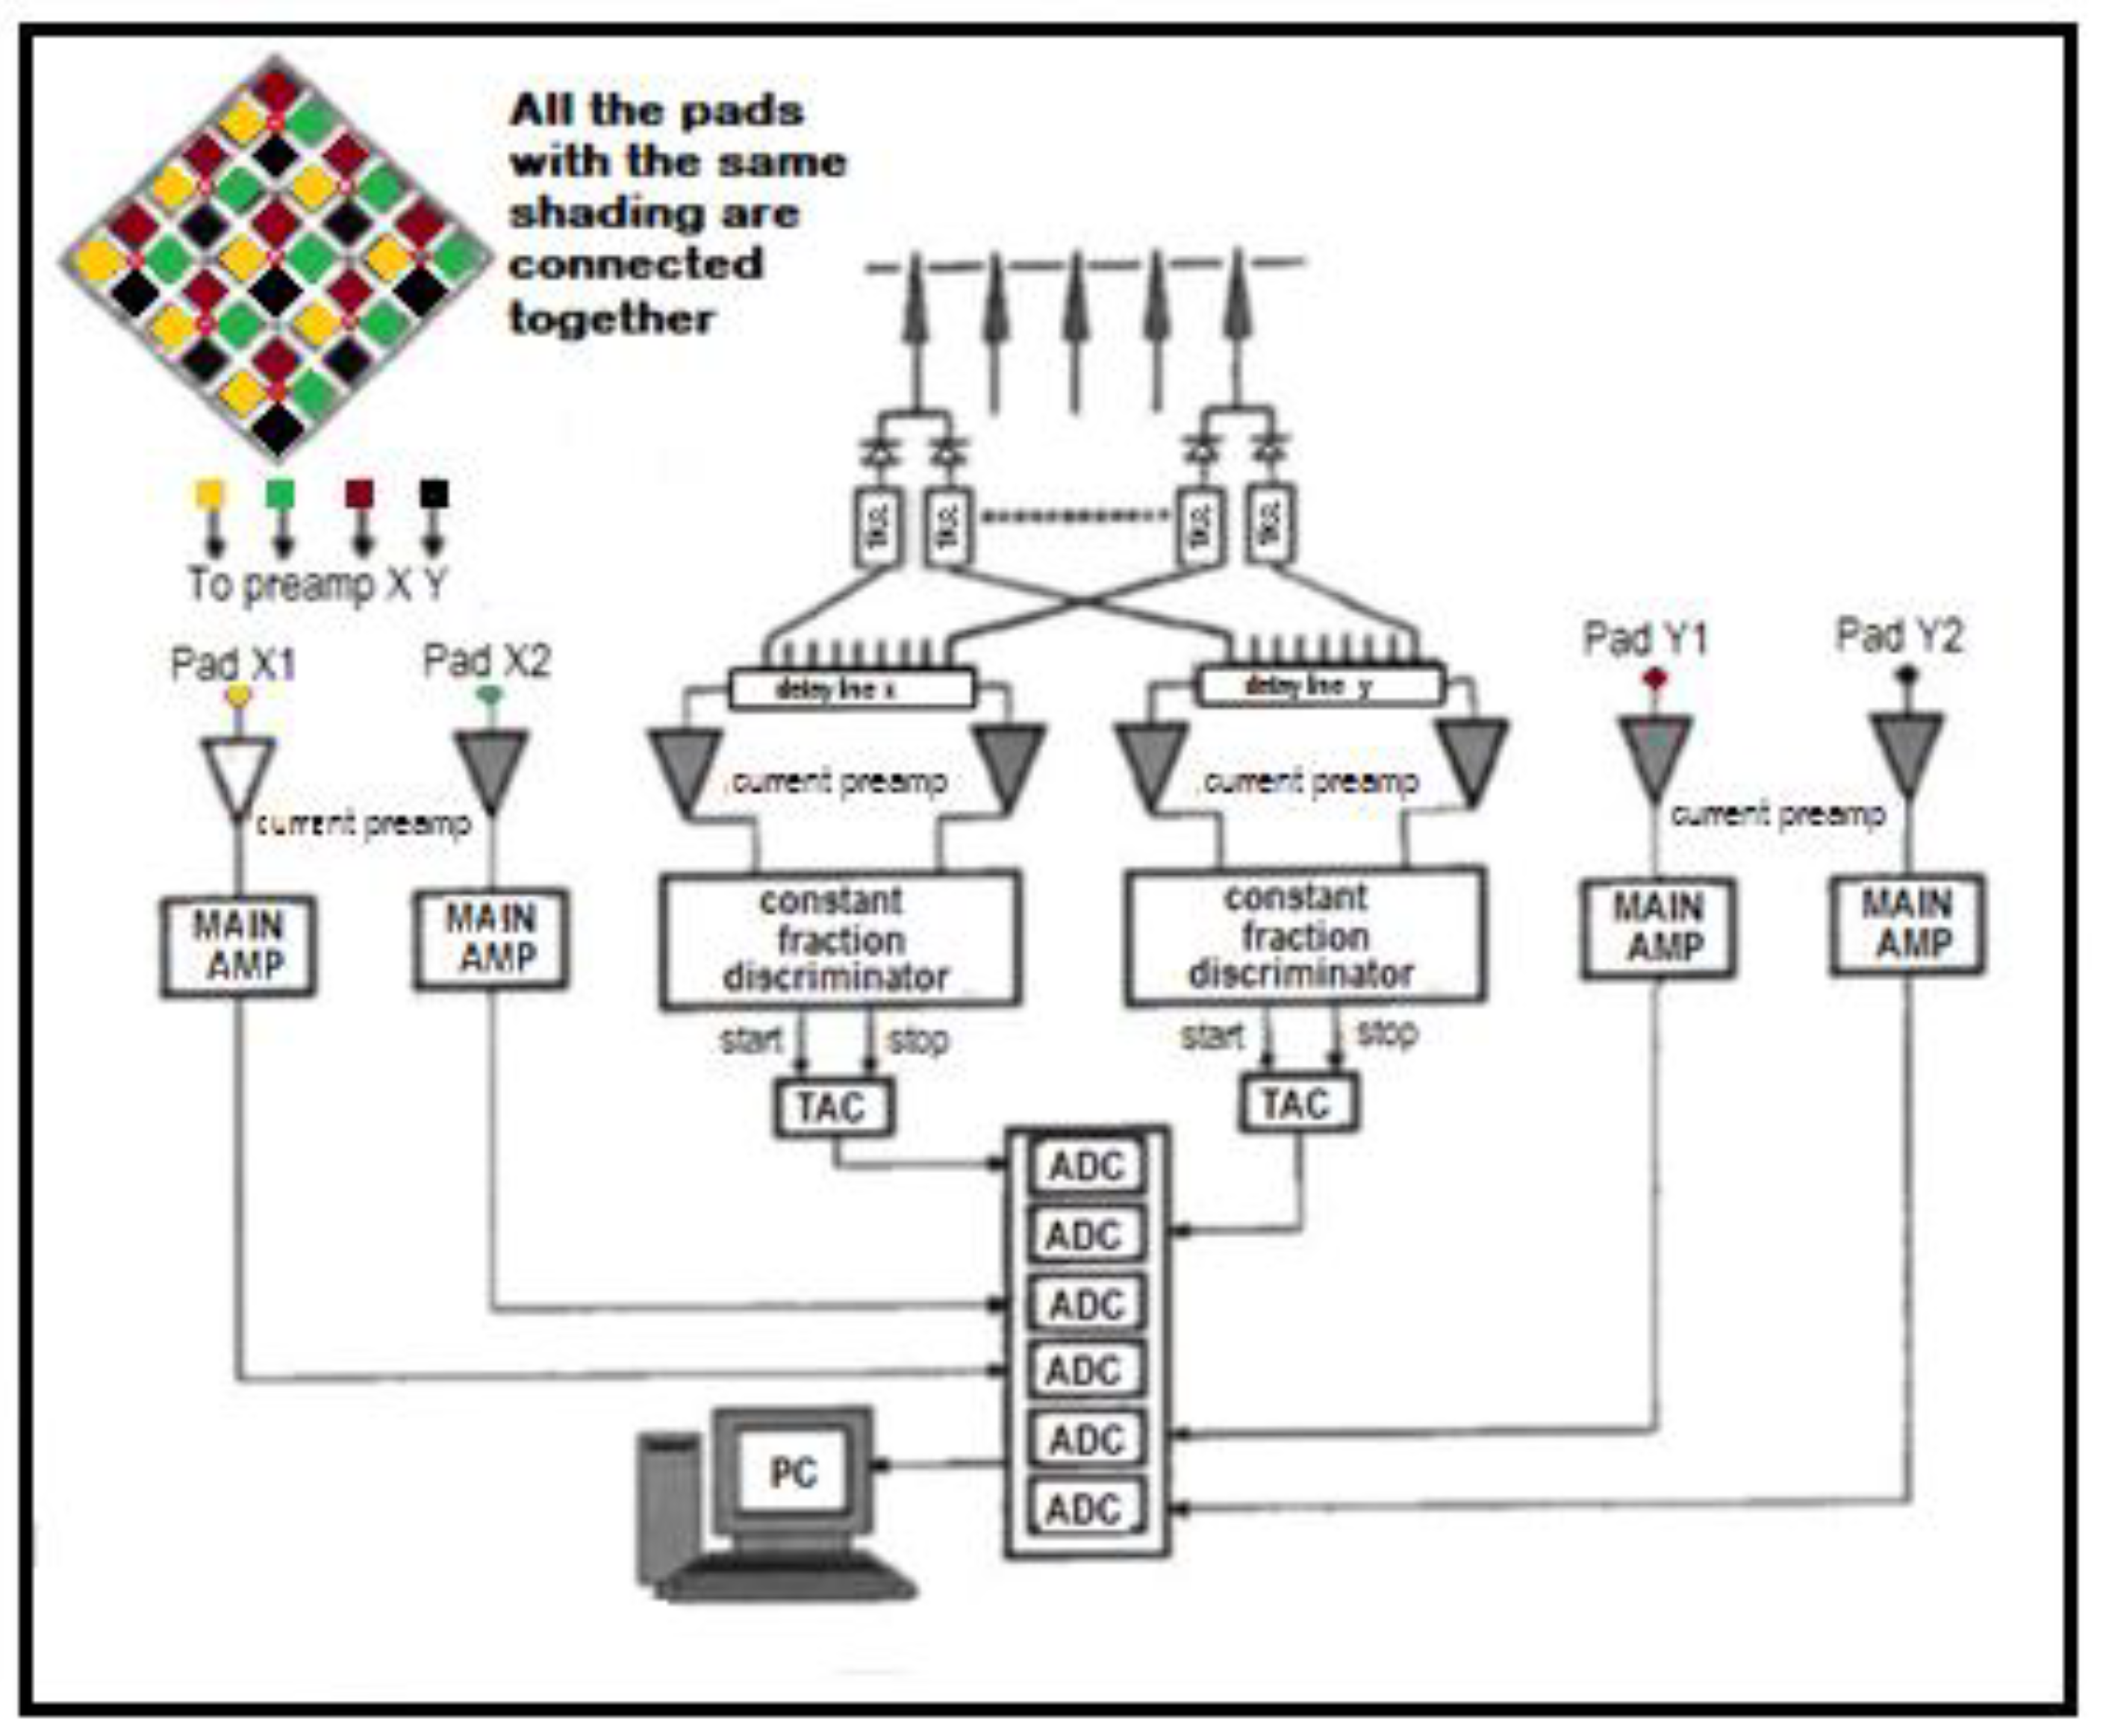
The signal processing chain was very simple (Figure 8): as mentioned above, each LM had four cathode pads, two related to the X position (left and right) and two related to the Y (up and down).
All the 441 left pads were shorted together as well as all the 441 right, up, and down pads (Figure 8) so that they could all be read with only four channels (4 preamplifiers, 4 main amplifiers and 4 digital to analog converters (ADCs)). The next step was to address the matrix points to get an extended image.
The charge collected by a needle (anode) is able to turn on a Shottky diode and reach a preamp through it. Housed in a sot23 case (less than 3 × 3 mm2), two Shottky diodes were connected on the rear face of the detector to each needle to split the signal towards two delay lines for the addressing. With this tricky solution, only six analog-to-digital converters were required: four for the pad-channels and two to read the time to amplitude converter (TAC), which provided the X, Y address of the needles.
To check the imaging capability on the whole detector surface, half a razor blade was used as a mask on the drift electrode, fixed at a 3 mm distance from the cathode and working in isobutane at atmospheric pressure. Through an extended X-ray generator, we obtain the image of Figure 9. It is important to underline that this image did not undergo any further software elaboration: it is just the presentation of the raw data. With this new detector, we could obtain well-defined images without any imaging dead zone.
3. Alpha Particles Detection
To evaluate the detection efficiency of alpha particles, we used a single LM with a 241 Am source; its efficiency was compared with that of a silicon detector, which is known to have very high detection efficiency.
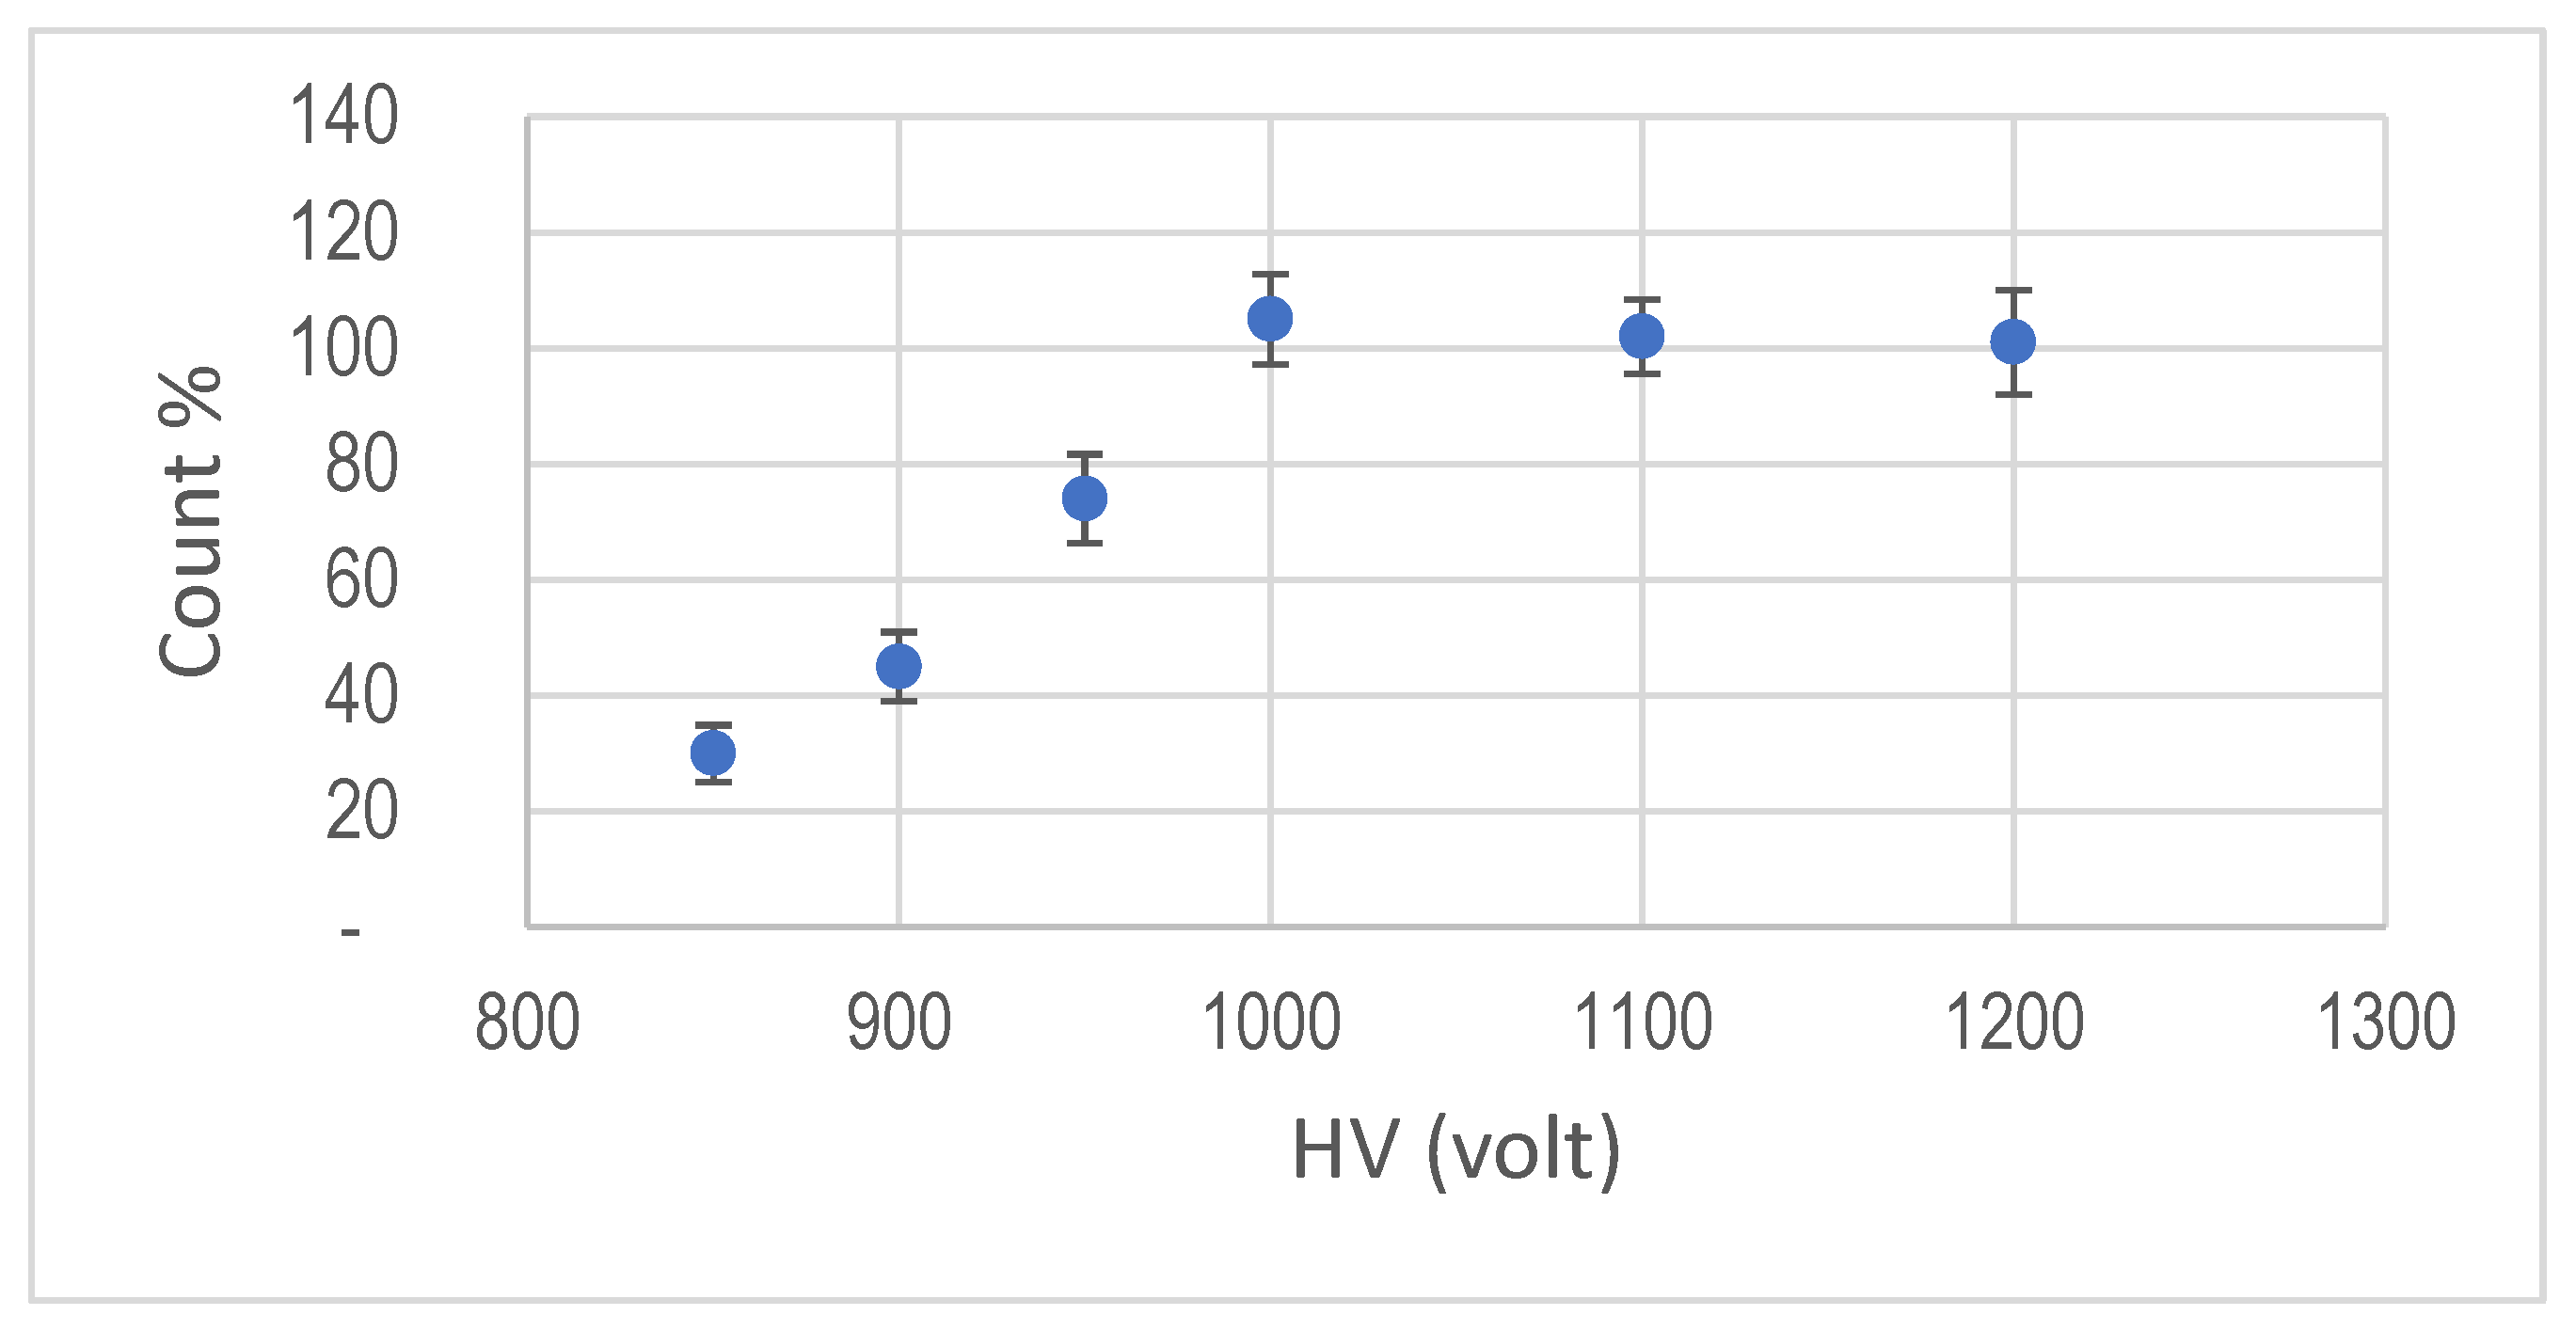
The measurements were performed in isobutane at a fixed threshold of the electronic chain. Operating at a pressure of 400 Torr, the counting plateau was achieved; at 760 Torr, we were not able to reach any plateau. This behavior could be explained by the increased efficiency in detecting the X-rays emitted by the source together with the alpha particles at this pressure.
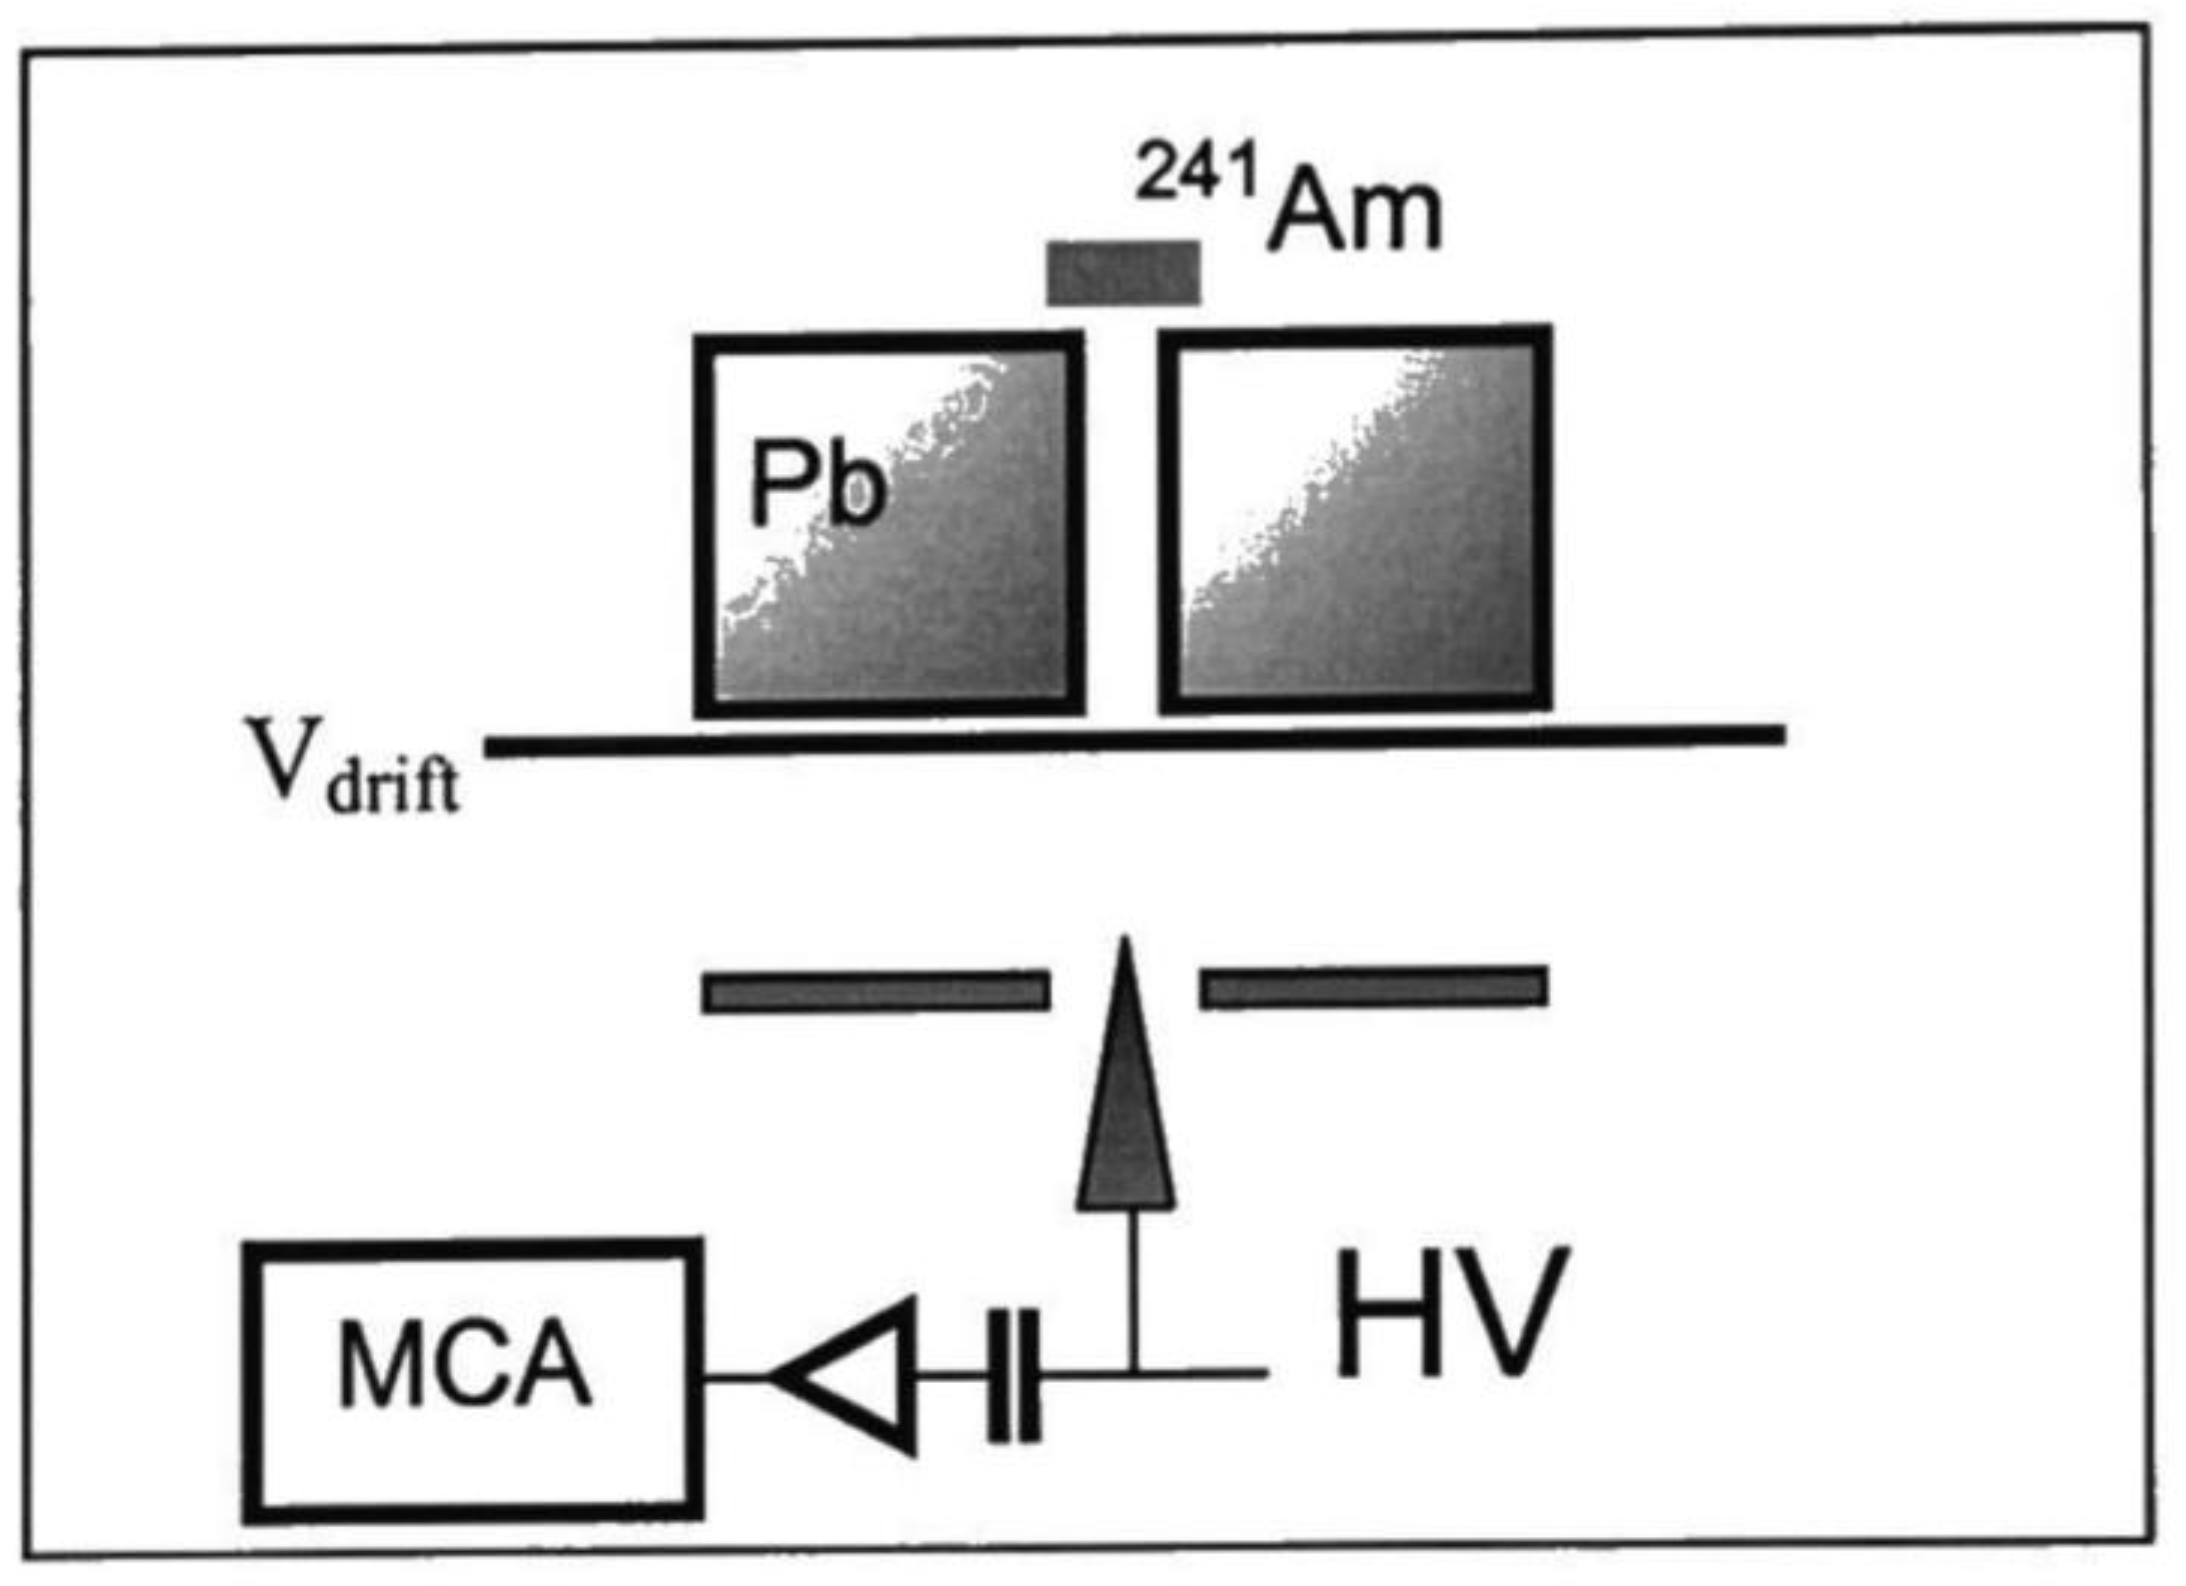
The experimental setup used in this study is shown in Figure 10. A lead collimator, 15 mm thick with a 3 mm diameter hole, was placed at 3 mm from the cathode of an LM well centered on the tip.
The alpha range, under these conditions, was enough to pass through the collimator and enter the active volume of the detector. In a 300 V/cm drift electric field, we obtained the curve in Figure 11. The relative counting efficiency of the silicon detector is shown along the Y-axis. When replacing the LM, this was put in the collimator’s output to count how many alpha particles pass through it in the same lapse of measuring time. A 100% efficiency concerning the silicon detector was achieved, as well as the counting plateau.
4. Preliminary Results on Single-Electron Detection at Low-Pressure
The capability to detect single-electron was tested with LMs operated in propane gas at 3 mbar [15]. In these measurements, the LM detector consisted of a matrix of 4 × 4 LMs with nickel-plated needles of conical shape with rounded tips of about 20 µm radius. A stable operation was obtained in the following conditions: needles of 1 mm height (distance between the tip of the needles and the cathode plane), around each needle, an insulated pad of ϕ 0.8 mm (b in Figure 1) was used to separate anodes from the common grounded cathode layer. The structure had a pitch of 2.4 mm. At a distance of 7 mm from the cathode, a negatively biased copper wire drift grid defined the boundary of the detector’s active volume.
As calculated in [14] at 3 mbar of propane, with needles of 1 mm height, the Townsend ionization coefficient a was bigger than 1 everywhere in the active volume of the detector starting from the grid. This means that avalanches may occur everywhere and not only near the needle tip. The avalanche spreading depended on the voltage applied to the grid (Vd), which, therefore, influenced the drift and the multiplication process.
Single electrons were obtained by heated filament, as well as extracted from the grid by a mercury-vapors lamp (ORIEL 6035, main wavelength of 253.7 nm). The low quantum efficiency of Cu (of the order of 10−4 in the lamp wavelength bandwidth), together with an opportune attenuation of the UV light from the lamp, allowed limiting the counting rate to about 100 Hz. In this way, the probability that the observed signals were due to more than one electron was very low.
The signals from the current amplifier were collected, and the pulse–height spectra were fitted with Polya distribution. It is well-established that the avalanche size and consequently the single-electron charge pulse–height spectra follow the negative binomial, or Polya, distribution [17,18]. With the aim to evaluate the single-electron detection efficiency, the same distribution was applied to the current signals. The recorded spectrum is shown in Figure 12 together with the Polya fit, allowing calculating the single-electron detection efficiency according to the noise threshold level and the Polya integral [15]. A value of 96% was achieved, quite similar to that obtained with a multistep avalanche chamber detector [19,20].
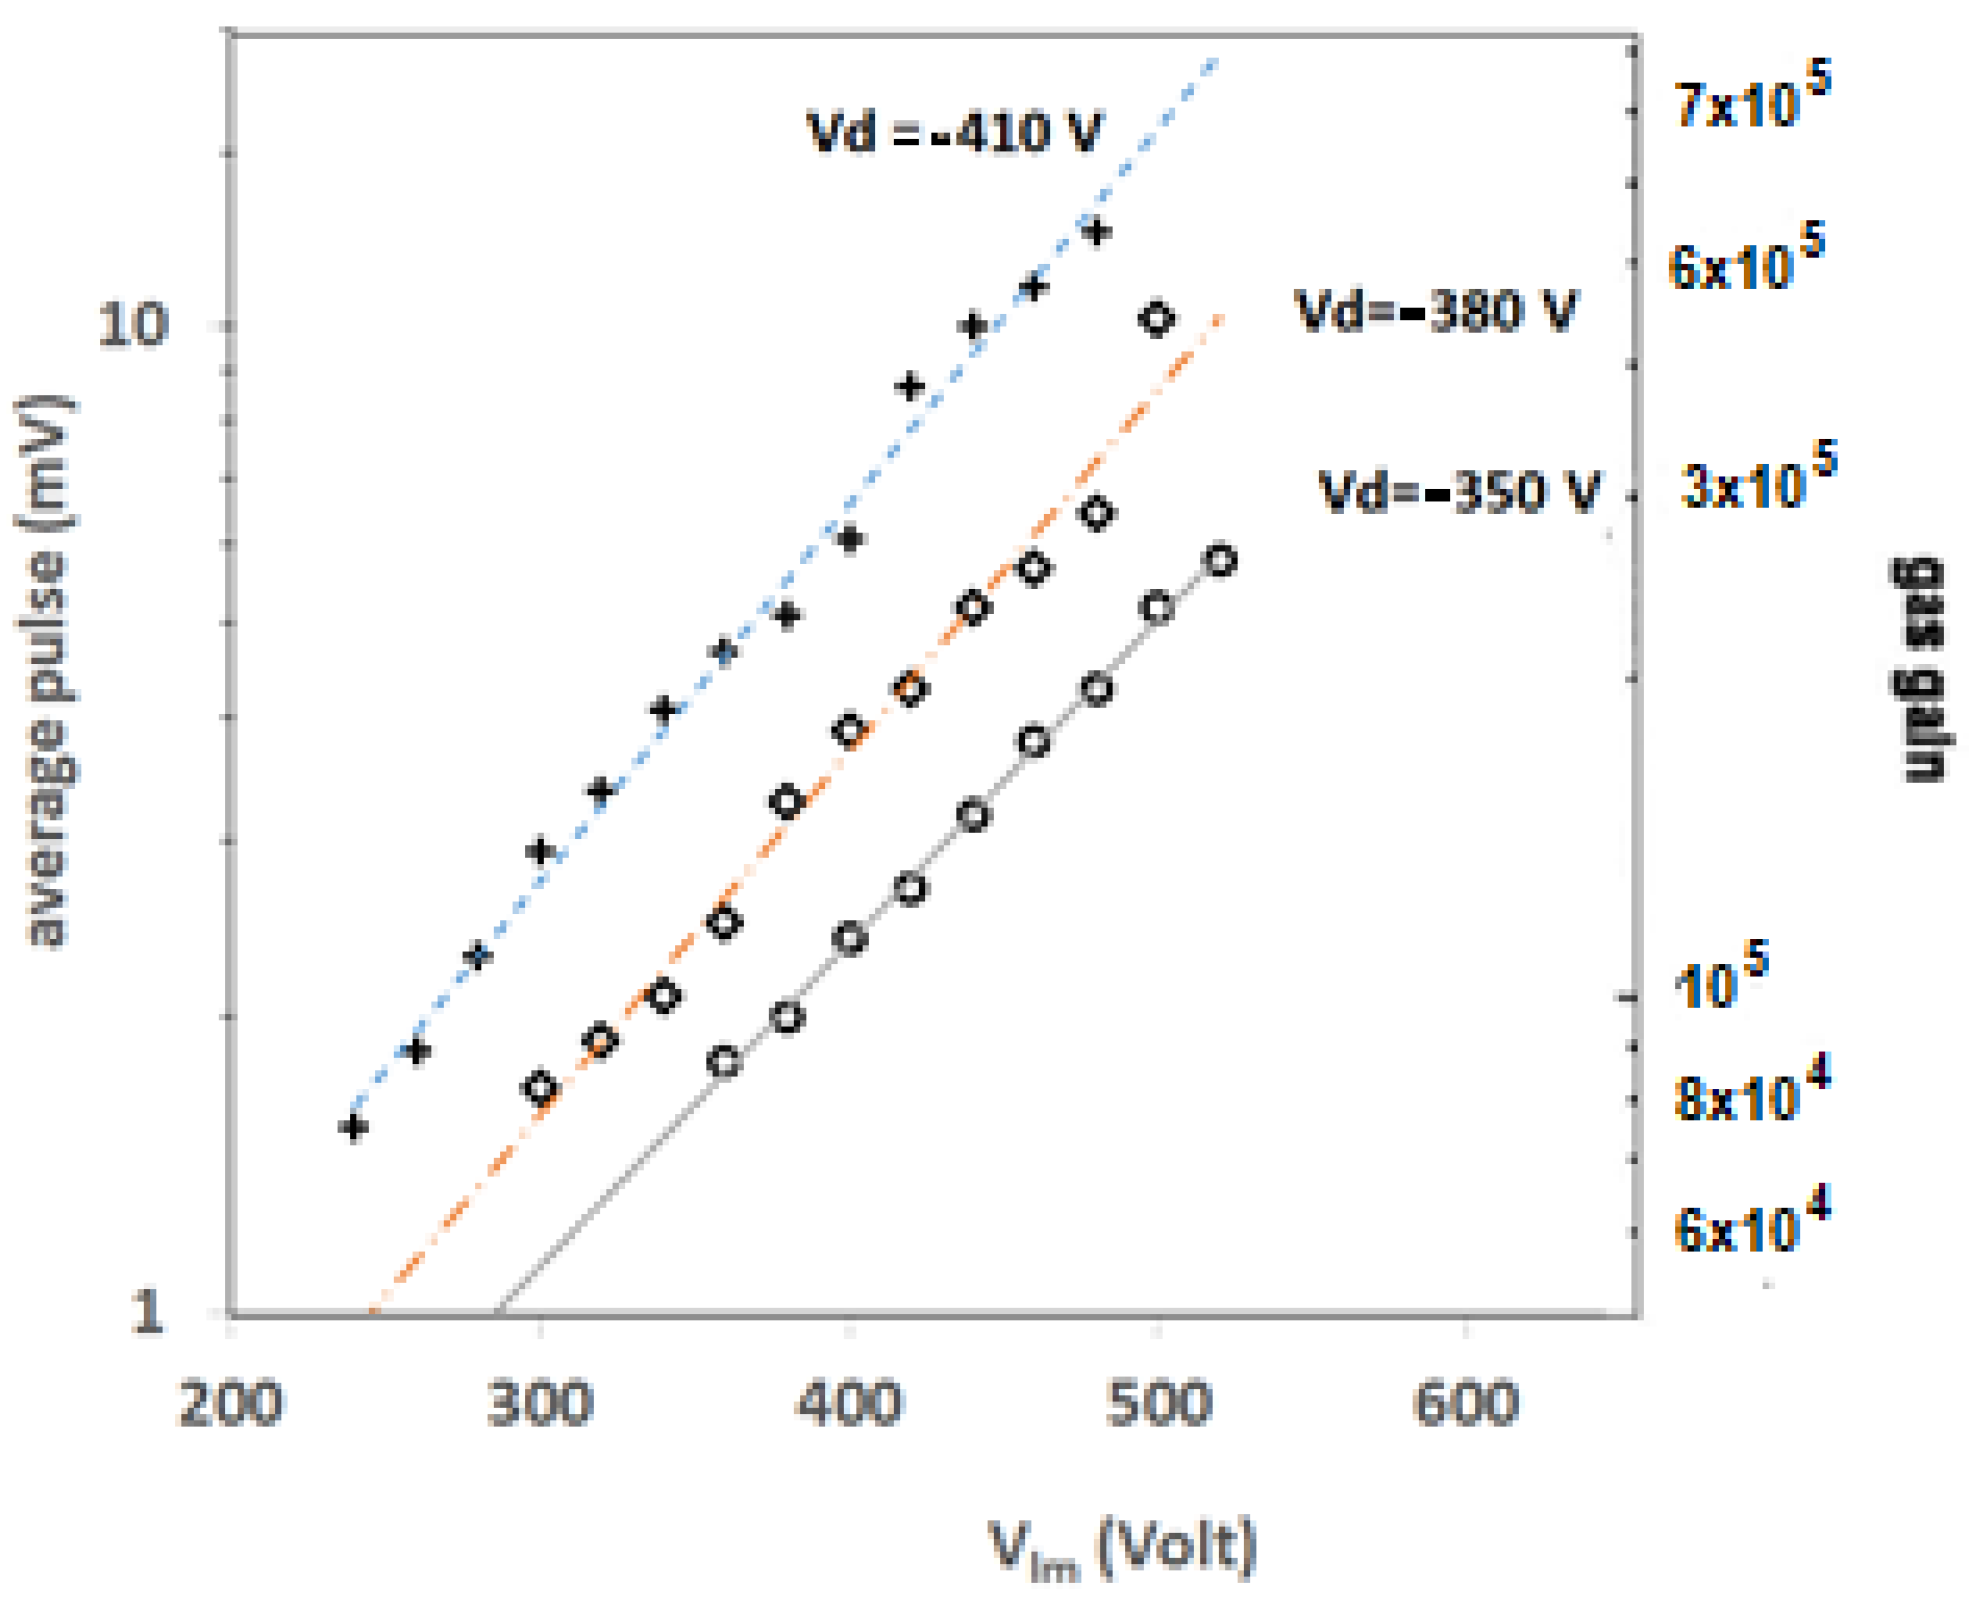
The gas gain was empirically evaluated from the collected charge, taking into account: pulse shape, electronic amplification, input impedance and considering the detection of single-electron. Measurements were performed for three different voltages applied to the grid (Vd) as a function of the high voltage applied to the needles (Vlm). Results, presented in Figure 13, show an exponential gain increase with voltage and gas gains in the order of 105.
5. Conclusions
The LM detector has shown imaging capability by multiplicating primary electrons and the rough handling of the signals obtained in a very simple, compact and reliable way. Images of extended samples were produced with an X-ray source, obtaining quite good spatial resolution but with low X-ray conversion efficiency. In fact, the conversion efficiency of soft X-rays in the detector’s active volume at 760 Torr of isobutane was less than 1% [21,22]. Further development of this work is to enhance the detection efficiency obtained using a suitable photocathode, like secondary electron emission (SEE) type [20,23]. The system showed a detection capability of single electrons at very low gas pressure (3 mbar) working in a proportional region and with gas gain in the order of 105. The measurements presented extend the fields of application of the LM detector.
Recently, this technique was used for the design and instrumentation of an active target time projection chamber for the detection of heavy-ion tracking in experiments with rare isotope beams [24].
Author Contributions
Conceptualization, M.L.; methodology, M.L. and G.P.; software, A.B. and A.F.; validation, M.L., G.P., G.B., A.F. and G.G.; formal analysis, G.B. and A.F.; investigation, G.B., A.F. and G.G.; resources, M.L., G.P.; data curation, G.B, A.F. and G.P.; writing—original draft preparation, G.B. and A.F.; writing—review and editing, G.P.; visualization, G.P.; supervision, M.L.; project administration, M.L.; funding acquisition, M.L. All authors have read and agreed to the published version of the manuscript.
Funding
This research received no external funding.
Data Availability Statement
Experiment was performed at INFN-Laboratori Nazionali di Legnaro. (LNL); Partial results are on LNL Annual Reports since 1996; Some data are stored at LNL repository. https://docs.infn.it/share/page/site/spes/folder-details?nodeRef=workspace://SpacesStore/f9ec97ff-4cd3-4a0c-b768-8f9b34cd11f9 (accessed on 30 March 2021).
Conflicts of Interest
The authors declare no conflict of interest.
References
- Lombardi, M.; Prete, G.; Lombardi, A. Large-Scale Collective Motion of Atomic Nuclei. In Proceedings of the International Symposium, Brolo, Messina, 15–19 October 1996; World Scientific: Singapore, 1996; pp. 459–465. [Google Scholar]
- Lombardi, M.; Lombardi, F.S. The leak microstructure, preliminary results. Nucl. Instrum. Methods Phys. Res. Sect. A Accel. Spectrometers Detect. Assoc. Equip. 1997, 392, 23–27. [Google Scholar] [CrossRef]
- Lombardi, M.; Lombardi, F. Preliminary results from a new microstructure for gaseous detectors. Nucl. Instrum. Methods Phys. Res. Sect. A Accel. Spectrometers Detect. Assoc. Equip. 1997, 388, 186–192. [Google Scholar] [CrossRef]
- Lombardi, M.; Lombardi, F. The leak microstructure: A novel element for sensitive position two-dimensional readout gaseous detectors. Preliminary results. Nucl. Instrum. Methods Phys. Res. Sect. A Accel. Spectrometers Detect. Assoc. Equip. 1998, 409, 65–69. [Google Scholar] [CrossRef]
- Lombardi, M.; Guoxiang, H.H.-J.; Lombardi, F. About the leak microstructures. Nucl. Instrum. Methods Phys. Res. Sect. A Accel. Spectrometers Detect. Assoc. Equip. 2001, 461, 91–95. [Google Scholar] [CrossRef]
- Lombardi, M.; Baiocchi, C.; Battistella, A.; Balbinot, G.; Guoxiang, H.H.-J.; Lombardi, F. The leak microstructure. Pramana 2001, 57, 115–124. [Google Scholar] [CrossRef]
- Lombardi, M.; Huo, H.; Lombardi, F. Performances of the leak microstructures. Nucl. Instrum. Methods Phys. Res. Sect. A Accel. Spectrometers Detect. Assoc. Equip. 2002, 477, 64–71. [Google Scholar] [CrossRef]
- Baiocchi, C.; Balbinot, G.; Battistella, A.; Galeazzi, G.; Lombardi, F.; Lombardi, M.; Prete, G.; Simon, A. Imaging with the leak microstructures: Preliminary results. Nucl. Instrum. Methods Phys. Res. Sect. A Accel. Spectrometers Detect. Assoc. Equip. 2004, 518, 448–451. [Google Scholar] [CrossRef]
- Comby, G.; Mangeot, P.; Tichit, J.; Lignieres, H.d.; Chalot, J.; Monfray, P. A multi-needle detector with cathodic focusing. Nucl. Instrum. Methods Phys. Res. Sect. A Accel. Spectrometers Detect. Assoc. Equip. 1980, 174, 77–92. [Google Scholar]
- Comby, G.; Mangeot, P.; Augueres, J.; Claudet, S.; Chalot, J.; Tichit, J.; Lignieres, H.d.; Zadra, A. The detection of Cherenkov radiation using needle chambers with cathodic focusing. Nucl. Instrum. Methods 1980, 174, 93–107. [Google Scholar] [CrossRef]
- Comby, G.; Mangeot, P.; Prugne, P.; Chalot, J.; Coulareau, E.; Quidort, J.; Beauval, J.; Tichit, J. Multi-needle detector with cathode focusing. Nucl. Instrum. Methods 1980, 176, 313–321. [Google Scholar] [CrossRef]
- Bateman, J.E. The pin detector—A simple, robust, cheap and effective nuclear radiation detector. Nucl. Instrum. Methods Phys. Res. Sect. A Accel. Spectrometers Detect. Assoc. Equip. 1985, 238, 524–532. [Google Scholar] [CrossRef]
- Bateman, J.E. The imaging pin detector: A simple and effective new imaging device for soft X-rays and soft beta emissions. Nucl. Instrum. Methods Phys. Res. Sect. A Accel. Spectrometers Detect. Assoc. Equip. 1985, 240, 177–187. [Google Scholar] [CrossRef]
- De Nardo, L.; Balbinot, G.; Colautti, P.; Simon, A.; Conte, V.; Lombardi, M. The leak microstructure detector as trigger and particle rejector of the STARTRACK experiment. Nucl. Instrum. Methods Phys. Res. Sect. A Accel. Spectrometers Detect. Assoc. Equip. 2006, 562, 127–135. [Google Scholar] [CrossRef]
- Ferretti, A.; De Nardo, L.; Lombardi, M. Preliminary study of a leak microstructure detector as a new single-electron counter for STARTRACK experiment. Nucl. Instrum. Methods Phys. Res. Sect. A Accel. Spectrometers Detect. Assoc. Equip. 2009, 599, 215–220. [Google Scholar] [CrossRef]
- Clemens, M.; Drobny, S.; Kruger, H.; Pinder, P.; Podebrad, O.; Schillinger, B.; Trapp, B.; Weiland, T.; Wilke, M.; Bartsch, M.; et al. The electromagnetic simulation software package MAFIA. In Proceedings of the 1999 International Conference on Computational Electromagnetics and Its Applications, Beijing, China, 4 November 1999. [Google Scholar]
- Cookson, A.; Lewis, T. Variations in the Townsend first ionization coefficient for gases. Brit. J. Appl. Phys. 1966, 17, 1473. [Google Scholar] [CrossRef]
- Bellazzini, R.; Spezziga, M.A. Electric field, avalanche growth and signal development in micro-strip gas chambers and micro-gap chambers. Riv. Nuovo Cim. 1994, 17, 12. [Google Scholar] [CrossRef]
- Seguinot, J.; Ypsilantis, T. A historical survey of ring imaging Cherenkov counters. Nucl. Instrum. Methods Phys. Res. Sect. A Accel. Spectrometers Detect. Assoc. Equip. 1994, 343, 1–29. [Google Scholar] [CrossRef]
- Breskin, A.; Chechik, R.; Akkerman, A.; Gibrekhterman, A.; Elkind, V.; Frumkin, I.; Notea, A. Recent developments in secondary emission gaseous X-ray imaging detectors. Nucl. Instrum. Methods Phys. Res. Sect. A Accel. Spectrometers Detect. Assoc. Equip. 1994, 348, 207–215. [Google Scholar] [CrossRef]
- Sauli, F. Principles of Operation of Multiwire Proportional and Drift Chambers; Principles of operation MWPC (1977), CERN 77-09; CERN: Geneva, Switzerland, 1977. [Google Scholar]
- Sauli, F. Micro-Pattern Gaseous Detectors: Principles of Operation and Applications; World Scientific: Singapore, 2020. [Google Scholar]
- Frumkin, I.; Breskin, A.; Chechik, R.; Elkind, V.; Notea, A. Properties of CsI-based gaseous secondary emission X-ray imaging detectors. Nucl. Instrum. Methods Phys. Res. Sect. A Accel. Spectrometers Detect. Assoc. Equip. 1993, 329, 337–347. [Google Scholar] [CrossRef]
- Randhawa, J.S.; Cortesi, M.; Mittig, W.; Wierzbicki, T.; Gomez, A. Development of the TIP-HOLE gas avalanche structure for nuclear physics/astrophysics applications with radioactive isotope beams: Preliminary results. J. Phys. Conf. Ser. 2020, 1498, 012004. [Google Scholar] [CrossRef]
Figure 1.
Cross-section (not to scale) of a leak microstructure (LM).

Figure 2.
3D scheme of an LM physical process: the cathodic charge is distributed on four pads according to the avalanche position. (A) avalanche centered on the needle; (B) avalanche generated on the left side.
Figure 2.
3D scheme of an LM physical process: the cathodic charge is distributed on four pads according to the avalanche position. (A) avalanche centered on the needle; (B) avalanche generated on the left side.

Figure 3.
Zoom effect due to different drift electric fields; starting from left, the drift electrode was at 50, 100, 200, 500 V, respectively. VLM = 1150 V, gas: isobutane, drift gap: 3 mm.
Figure 3.
Zoom effect due to different drift electric fields; starting from left, the drift electrode was at 50, 100, 200, 500 V, respectively. VLM = 1150 V, gas: isobutane, drift gap: 3 mm.

Figure 4.
Detector position linearity.

Figure 5.
Equipotential surfaces of a single LM. The anode is a 20 µm needle emerging 100 µm out of the cathode layer. HV = 1000 V.
Figure 5.
Equipotential surfaces of a single LM. The anode is a 20 µm needle emerging 100 µm out of the cathode layer. HV = 1000 V.

Figure 6.
Simulation of two different configurations and the role of the needle height, (A) needle height 40 µm out of the cathode plane, (B) needle height 100 µm out of the cathode plane.
Figure 6.
Simulation of two different configurations and the role of the needle height, (A) needle height 40 µm out of the cathode plane, (B) needle height 100 µm out of the cathode plane.

Figure 7.
Detector with a matrix of 441 LMs and electronic setup.

Figure 8.
Electronic chains for imaging with a matrix of 21 × 21 LMs.

Figure 9.
Shadow gram of a half razor blade obtained with a matrix of LMs in 1 bar of isobutane.

Figure 10.
Experimental setup.

Figure 11.
Relative efficiency in alpha particles detection. Gas: isobutane, 760 Torr, drift gap: 3 mm.
Figure 11.
Relative efficiency in alpha particles detection. Gas: isobutane, 760 Torr, drift gap: 3 mm.

Figure 12.
Single-electron pulse–height spectrum measured with voltage applied to the grid (Vd) = 490 V and voltage applied to the needle (Vlm) = 200 V (symbols), and the curves obtained by Polya fits with ordinary (dashed line) and weighted (continuous line) least-squares method. The upper part of the spectrum is zoomed in the upper-right part of the figure. The continuous vertical line represents the noise level.

Figure 13.
Average pulse (mV). Gas gain in 3 mbar of propane.

Publisher’s Note: MDPI stays neutral with regard to jurisdictional claims in published maps and institutional affiliations. |
© 2021 by the authors. Licensee MDPI, Basel, Switzerland. This article is an open access article distributed under the terms and conditions of the Creative Commons Attribution (CC BY) license (https://creativecommons.org/licenses/by/4.0/).
Share and Cite
MDPI and ACS Style
Lombardi, M.; Prete, G.; Balbinot, G.; Ferretti, A.; Galeazzi, G.; Battistella, A. Detection and Imaging with Leak Microstructures. Instruments 2021, 5, 15. https://0-doi-org.brum.beds.ac.uk/10.3390/instruments5020015
AMA Style
Lombardi M, Prete G, Balbinot G, Ferretti A, Galeazzi G, Battistella A. Detection and Imaging with Leak Microstructures. Instruments. 2021; 5(2):15. https://0-doi-org.brum.beds.ac.uk/10.3390/instruments5020015
Chicago/Turabian StyleLombardi, Mariano, Gianfranco Prete, Giovanni Balbinot, Alice Ferretti, Giuseppe Galeazzi, and Andrea Battistella. 2021. "Detection and Imaging with Leak Microstructures" Instruments 5, no. 2: 15. https://0-doi-org.brum.beds.ac.uk/10.3390/instruments5020015