Article

Gamma—Ray Counters to Monitor Radioactive Waste Packages in the MICADO Project

1
INFN Laboratori Nazionali del Sud, 95123 Catania, Italy
2
Centro Siciliano di Fisica Nucleare e Struttura della Materia, 95123 Catania, Italy
3
ENEA Centro Ricerche, 40129 Bologna, Italy
*
Author to whom correspondence should be addressed.
now at ELI-NP, 077125 Magurele, Romania, Italy.
Submission received: 5 May 2021 / Revised: 22 May 2021 / Accepted: 24 May 2021 / Published: 25 May 2021

Abstract

:
One of the goals of the MICADO Euratom project is to monitor the gamma-rays emitted by radioactive waste drums in storage sites on a medium to long term basis. For this purpose, 36 low-cost gamma-ray counters were designed and built to act as a demonstrator. These counters, named SciFi, are based on a scintillating fiber readout at each end by a silicon photomultiplier, assembled in a robust arrangement in the form of 80 cm long pipes. Several counters will be placed around radwaste packages in order to monitor the gamma dose-rate by collecting a continuous data stream. The 36 sensors were thoroughly tested with a 22Na and a 137Cs gamma-ray sources, and with an AmBe neutron and gamma-ray source, the results are quite satisfactory, and the next step will be the test in a real environment.

1. Introduction

The MICADO (Measurement and Instrumentation for Cleaning and Decommissioning Operations) Euratom (EU) project is aimed at the full digitization of low-level and intermediate-level radioactive waste management [1,2]. Following a complete active and passive characterization of the radwaste drums with neutrons and gamma-rays, the project contemplates a longer-term monitoring phase in the Work Package 7 by means of low-cost dedicated detectors for neutrons (named SiLiF [3]) and for gamma-rays (named SciFi). A continuous automatic monitoring of the radwaste drums after their characterization represents an added value in terms of safety and security, and the availability of continuous streams of counting-rate data around each drum would be a comfortable tool toward the transparency, which now more than ever is a relevant topic of the nuclear industry [1,3,4,5,6,7]. As an evolution of the proof-of-principle systems discussed in [4,5,6,7], the detectors described here will be part of a prototype system which will be installed in a few real radwaste storage sites to prove its effectiveness. Therefore, the original detectors were improved, both from the detection and from the mechanical points of view, and fully characterized even with a high intensity AmBe neutron source, which also emits a wide spectrum of gamma-rays thus somehow resembling a radwaste drum.
The radiological monitoring of radwaste must be based on the measurement of gamma-rays and neutrons because these are penetrating and thus more easily detectable out of the drums. Due to the foreseen mass deployment, the sensors must be reasonably low-cost and configurable in a modular and scalable fashion, so that one can tailor the system to small, medium, and large-scale storage configurations. The proposed monitoring system is based on detectors which can be easily installed and/or reassembled in different geometrical configurations, as they are mechanically very simple and are based on commercial electronics.
The neutron monitoring detectors have already been described in [3]. In this paper we describe the SciFi monitoring detectors devoted to the gamma radiation, following a description of their operational principles and mechanical setup, some simulation results are described followed by the results of the characterization and a few tests of 36 SciFi detector units. Finally, an example is provided with the evaluation of the expected performance and sensitivity in a realistic case.

2. Materials and Methods

The low and intermediate level radwaste storage sites can have many different configurations, ranging from a rather haphazard drum storage to a very regular geometrical placement onto piles of dedicated platforms. One of the main issues is also the high cost of the storage space, and this is why a solution for the radioactivity monitoring has to be as modular as possible and based on simple, compact, scalable, and robust detectors. A typical arrangement scheme we proposed in [4,5,6,7], responding to these requirements, is sketched in Figure 1.
When facing the development of gamma-ray monitoring detectors for a possible mass deployment around radwaste drums, we made the following assumptions:
  • the sensors should be simple and robust;
  • they do not need to have spectroscopic features but can be simple counters;
  • they can have low intrinsic efficiency, as they can measure for long time spans and be sensitive enough;
  • low efficiency also implies the capability to stand in high radiation fluxes without being saturated;
  • they should possibly be spatially extended to cover a wide region of a drum;
  • they should likely be based on commercially available technology;
  • their cabling connection should be as simple as possible;
  • they should be reasonably inexpensive.
In light of all this we opted for a solution based on a length of plastic scintillating fibers read out at both ends by Silicon PhotoMultipliers (SiPM), which represents a low-cost solution based on commercial products. Moreover, such a solution has a high degree of modularity in terms of length, shape, and number of detectors.

2.1. The Scintillating Fiber

The chosen scintillating fiber, whose main characteristics are listed in Table 1, is the BCF-20 produced by Saint Gobain (Nemours, France) [8]. We preliminarily tested both 1 mm and 3 mm diameter fibers and chose the latter, which has a higher detection efficiency as the average energy deposited by the detected gamma-rays is larger. Moreover, even though the 3 mm fiber is stiffer than the 1 mm one, it is still flexible enough for a possible future solution in a curved or round shape.
The operating principle is the following: whenever a gamma-ray interacts with the fiber it deposits a variable amount of kinetic energy which gives rise to a short flash of scintillation light. Apart from very low energy cases where the photoelectric effect could take place, the interaction occurs mainly through Compton effect and the energy is deposited by the scattered electron through a complex pattern of many electron–electron collisions. A fraction of the scintillation photons is trapped into the fiber and propagates toward both ends. If the number of these photons is large enough to produce a signal above a predefined threshold simultaneously on both fiber ends, such a coincidence event is considered as the detection of a gamma-ray and can be counted. By using the GEANT4 code [9] we simulated the interaction of gamma-rays of a few selected energies with a fiber of 3 mm diameter, recording the energy deposited on the fiber event by event whenever the deposition was at least 50 keV. Indeed, below 50 keV the average number of photons detected on the SiPM would be <4, as will be explained in Section 2.2 and Section 2.3. Then, for each impinging gamma-energy we calculated the average deposited energy and the results are plotted in Figure 2. The plateau in the curve is due to scattered electrons escaping the fiber. The same simulation allowed us to calculate the expected intrinsic detection efficiency as the ratio between the reported counts and the number of impinging gamma-rays. The results are shown in Figure 3.

2.2. The SiPM Photodetector

The SiPM photodetector, capable of counting single photons, is an intrinsically noisy device whose dark count rate can be dramatically reduced by enforcing a suitable threshold on its output signals [10,11,12,13]. The chosen SiPM is the MicroFC-30035-SMT, produced by ON Semiconductor (Milan, Italy) [14], whose main characteristics are listed in Table 2. For all the tests described in this work we made use of a homemade voltage amplifier, which features a 200× gain and a 4 GHz bandwidth. The SiPM bias, according to the manufacturer’s specifications, was set at a 2.5 V overvoltage, i.e., 27 V bias.
In order to choose an appropriate threshold level for the SiPM we studied the noise counting rate as a function of the threshold, and the resulting typical staircase plot is reported in Figure 4. Each step corresponds to one detected photon, and we decided to use a threshold at 175 mV that corresponds to ≈3.5 photons and reduces the noise rate by three orders of magnitude down to about 350 counts per second. As the signals have a duration of about 30 ns, a duration of 100 ns for the coincidence window between the two SiPMs makes the probability of spurious coincidences negligible.

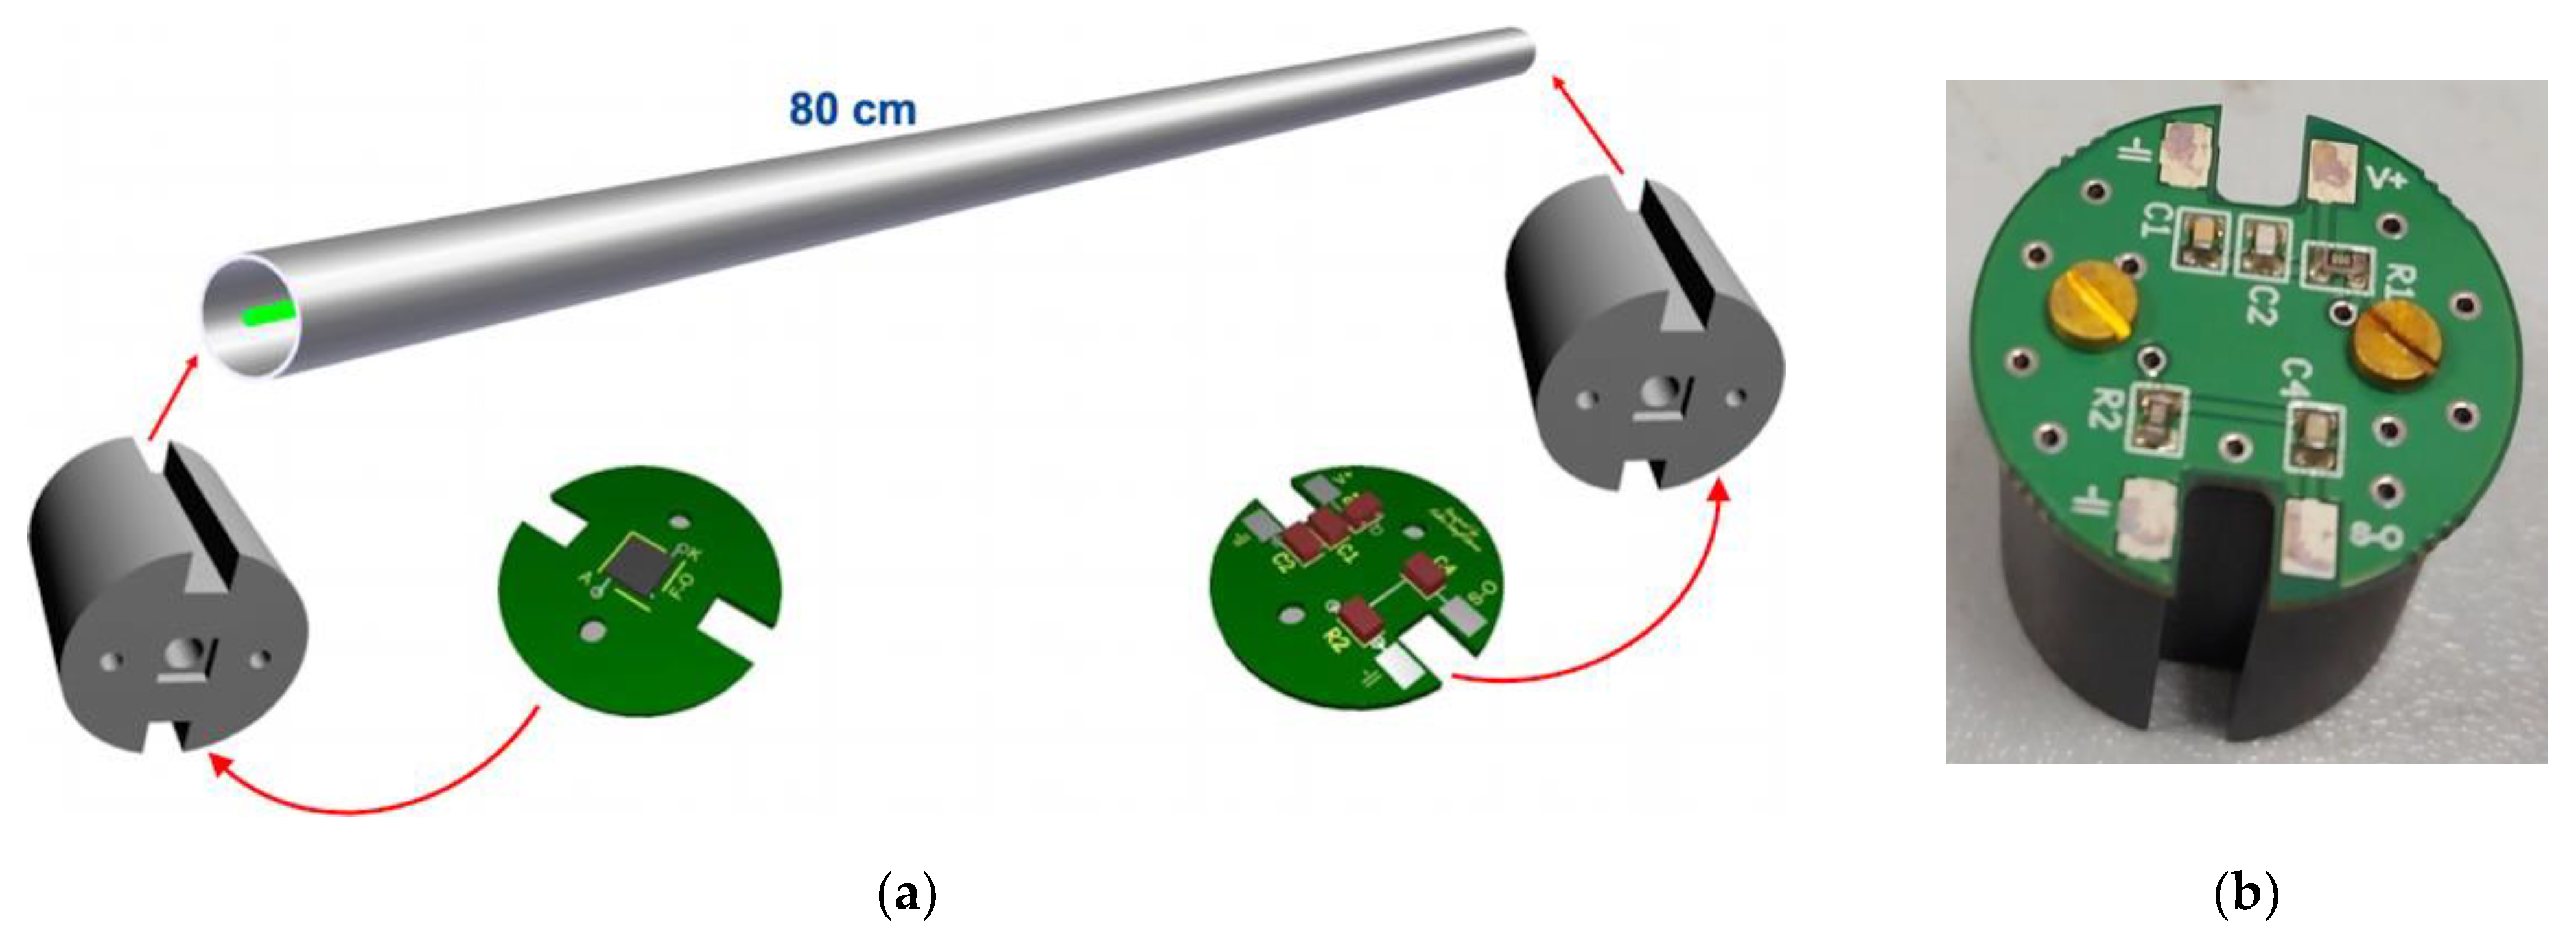
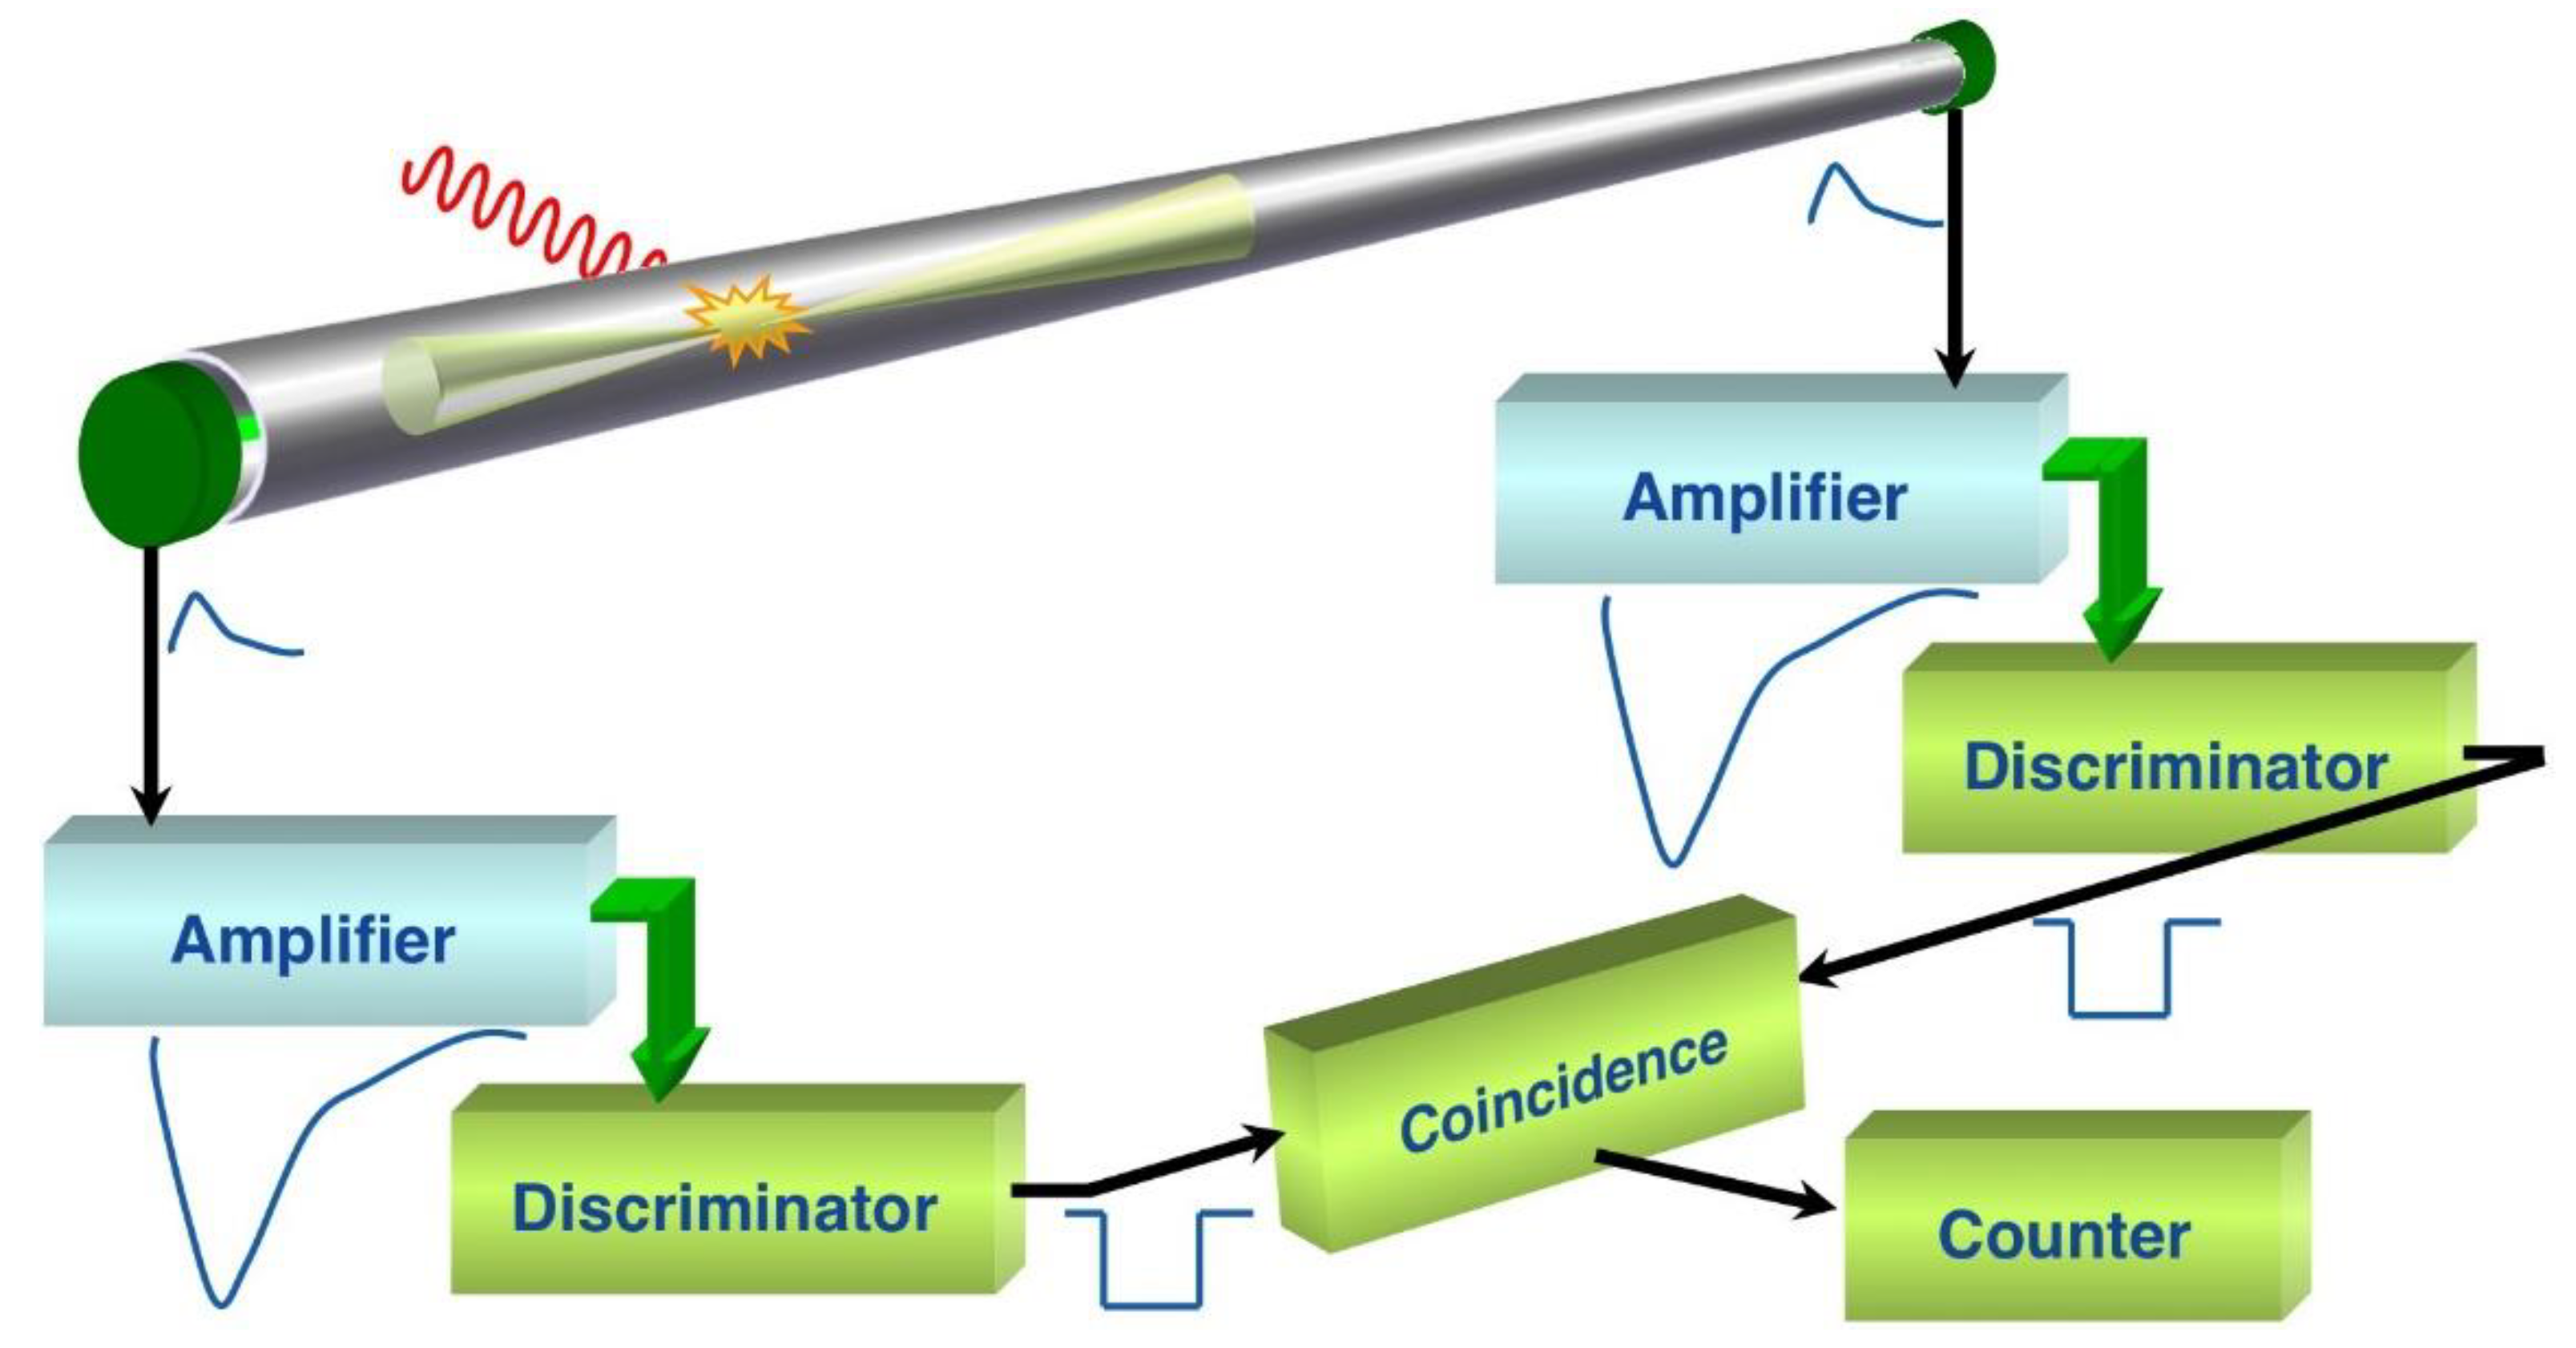
2.3. The SciFi Detector Assembly

In order to decide the fiber length we calculated the detection efficiency as a function of the impact position, using input values taken from Table 1 and Table 2, and assuming the threshold at ≥4 photons on the SiPMs. For each position at distance d1 and d2 = Ld1 from the SiPMs, given the average deposited energy E, by using the light yield Y we calculated the average number of scintillation photons nph produced, multiplied it by the trapping efficiency t, scaled the result exponentially for the attenuation length λ and multiplied by the photon detection efficiency (PDE) εPDE of the SiPM obtaining the final average number of expected photoelectrons n1 and n2 for the left and right fiber ends. Finally, we calculated the Poisson probability to have ≥4 photons while expecting n1 and n2. By multiplying these two probabilities we obtained the detection probability Pdet.
n 1 = E · Y · t · e d 1 / λ · ε P D E  
n 2 = E · Y · t · e d 2 / λ · ε P D E
P 1 = P o i s s o n ( 4 , n 1 ) = 1 k = 1 4 n 1 k k ! e n 1
P 2 = P o i s s o n ( 4 , n 2 ) = 1 k = 1 4 n 2 k k ! e n 2
P d e t = P 1 · P 2
We produced the corresponding plots for fiber length of 80, 120 and 300 cm, in two cases of 100 and 200 keV energy deposited in the fiber.
The plots are reported in Figure 5, Figure 6 and Figure 7, respectively. One can immediately see that with 200 keV deposited energy the response is uniform for the 80 and 120 cm fibers, whereas it ranges from 90% to 100% (side to center) for the 300 cm one. Conversely, with 100 keV deposited energy the 80 and 120 cm fibers respond almost uniformly, even though losing 15–20% efficiency; the 300 cm fiber response in such a case is below 50%, non-uniform and thus, barely acceptable.
We opted for the 80 cm length, even in light of the height of the standard 120 and 210 L radwaste drums (76 and 88 cm). The scintillating fiber was allocated inside a 2 cm diameter and 1 mm thick aluminum pipe, and held in place by two cylindrical holders designed to host a circular PCB with the SiPM and its support circuitry. The holder has a central hole to allow for fiber-to-SiPM alignment and optical coupling by means of a tiny grease drop, and two side grooves to allow for the passage of cables (for this phase we chose the grease for reversibility, an optical glue will be the final solution). Two light-tight rubber caps complete the setup, with three cables coming out of one single side for the common voltage bias and the two output signals. A sketch and three pictures of the SciFi detector components are shown in Figure 8. We remark that the attenuation of gamma-rays when crossing the aluminum pipe is a few percent at very low energy and goes down to about 1–2% at higher energy (Figure 9) [15].

3. Results

Thirty-six SciFi detectors were assembled as shown in the previous section, and in order to characterize them we made several tests with standard laboratory gamma sources and a high activity gamma and neutron source. The electronic setup, sketched in Figure 10, was quite simple: the outputs of the SiPM amplifiers were connected to two discriminators, with threshold equal to 175 mV. The two logic outputs were used as inputs to a coincidence unit with a 100 ns window, and the final output was sent to a counter.

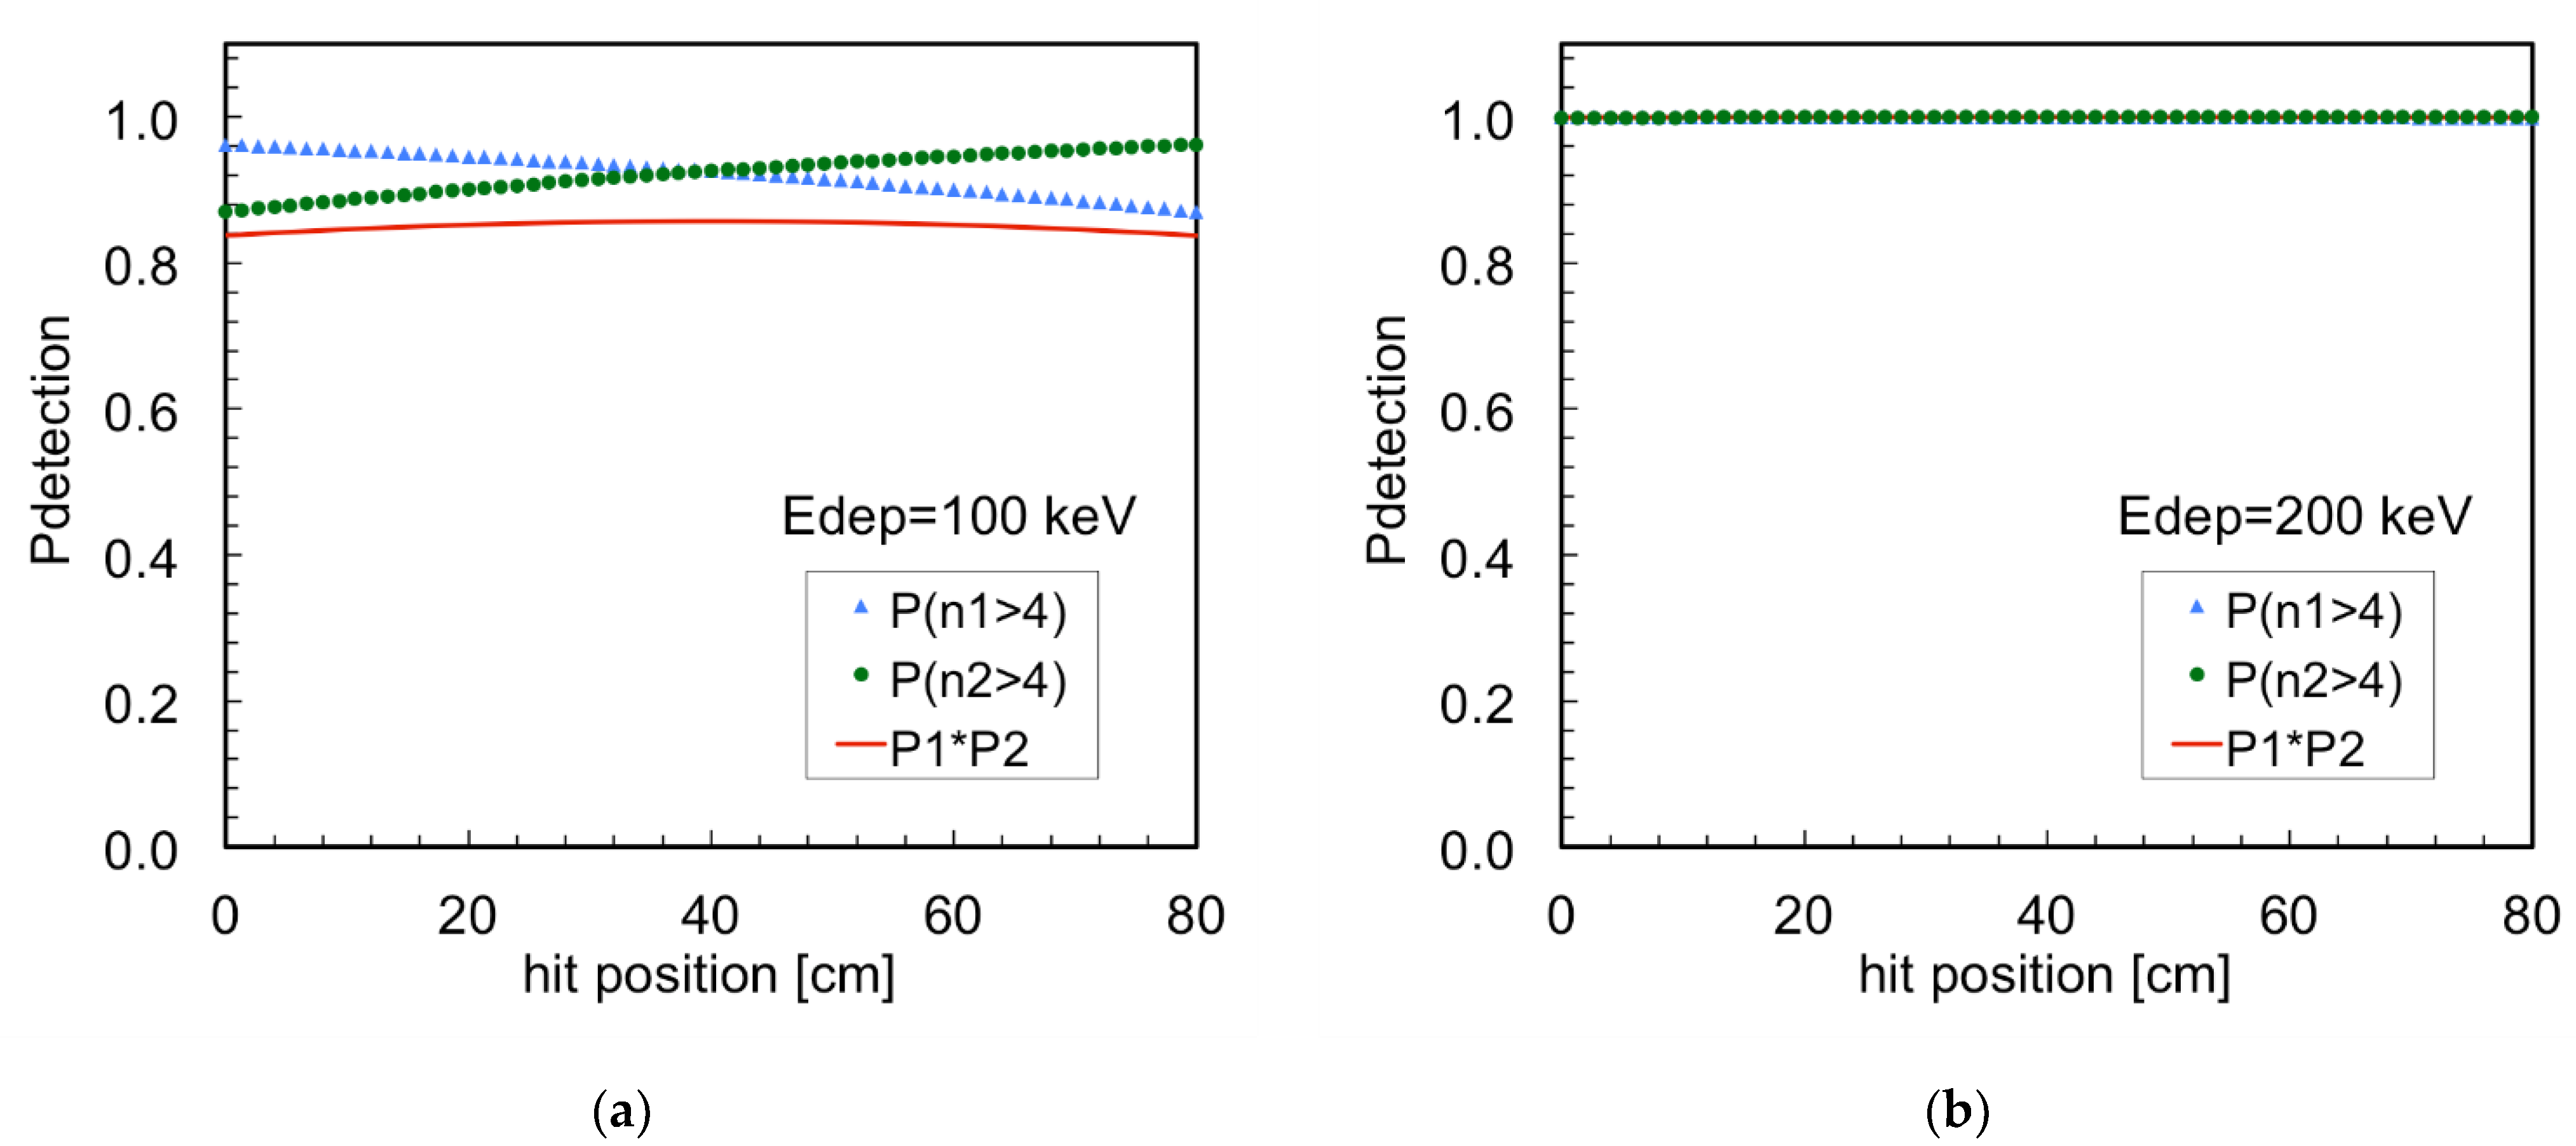
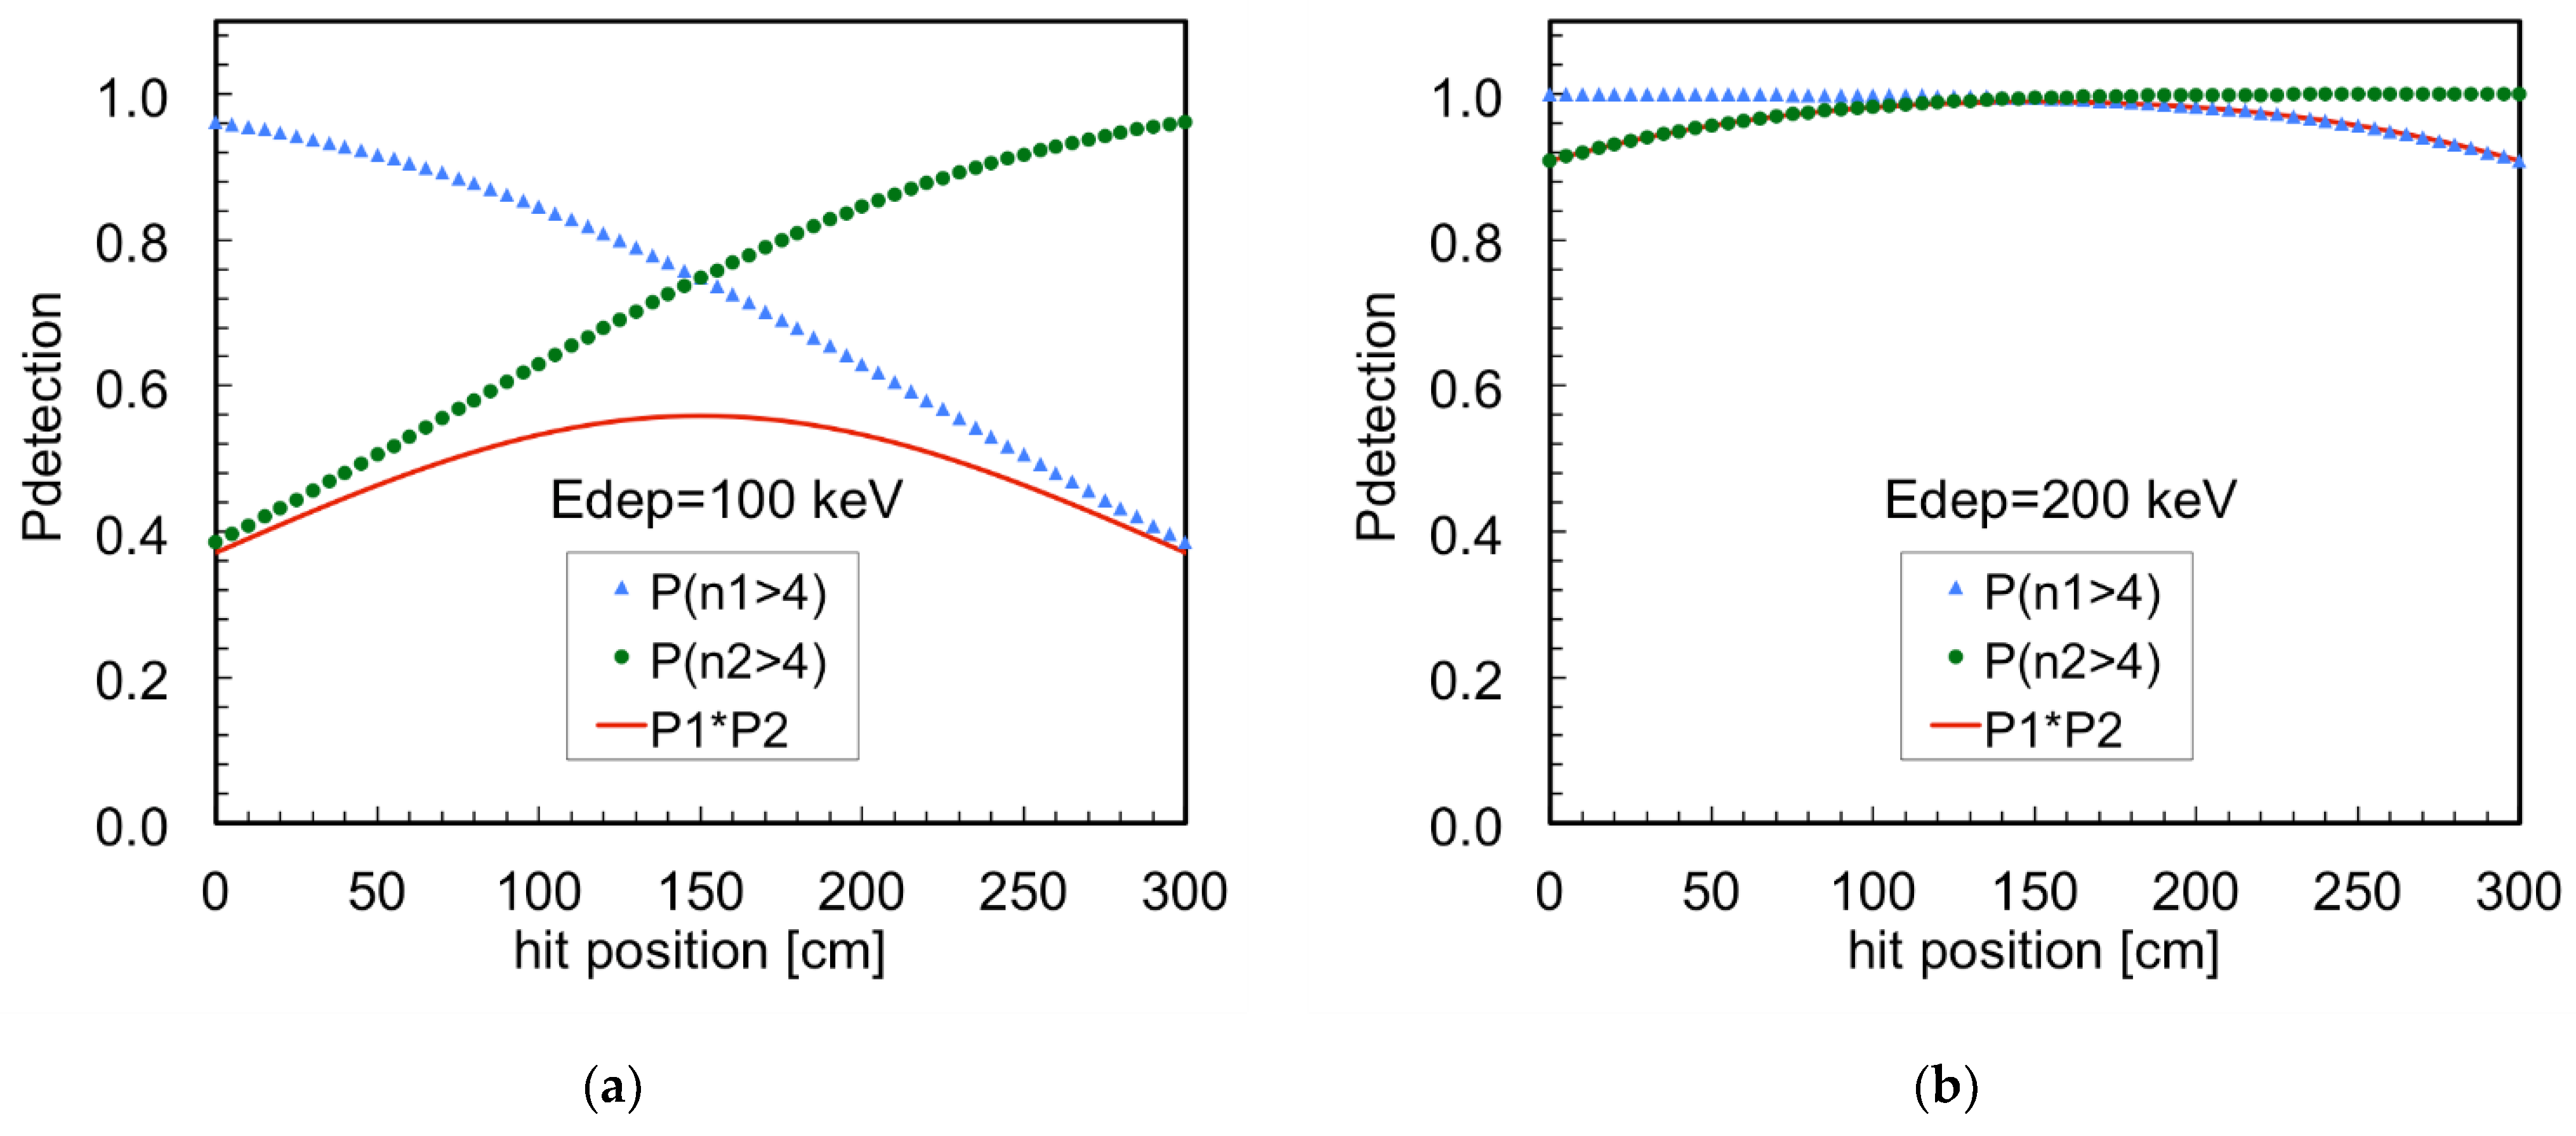
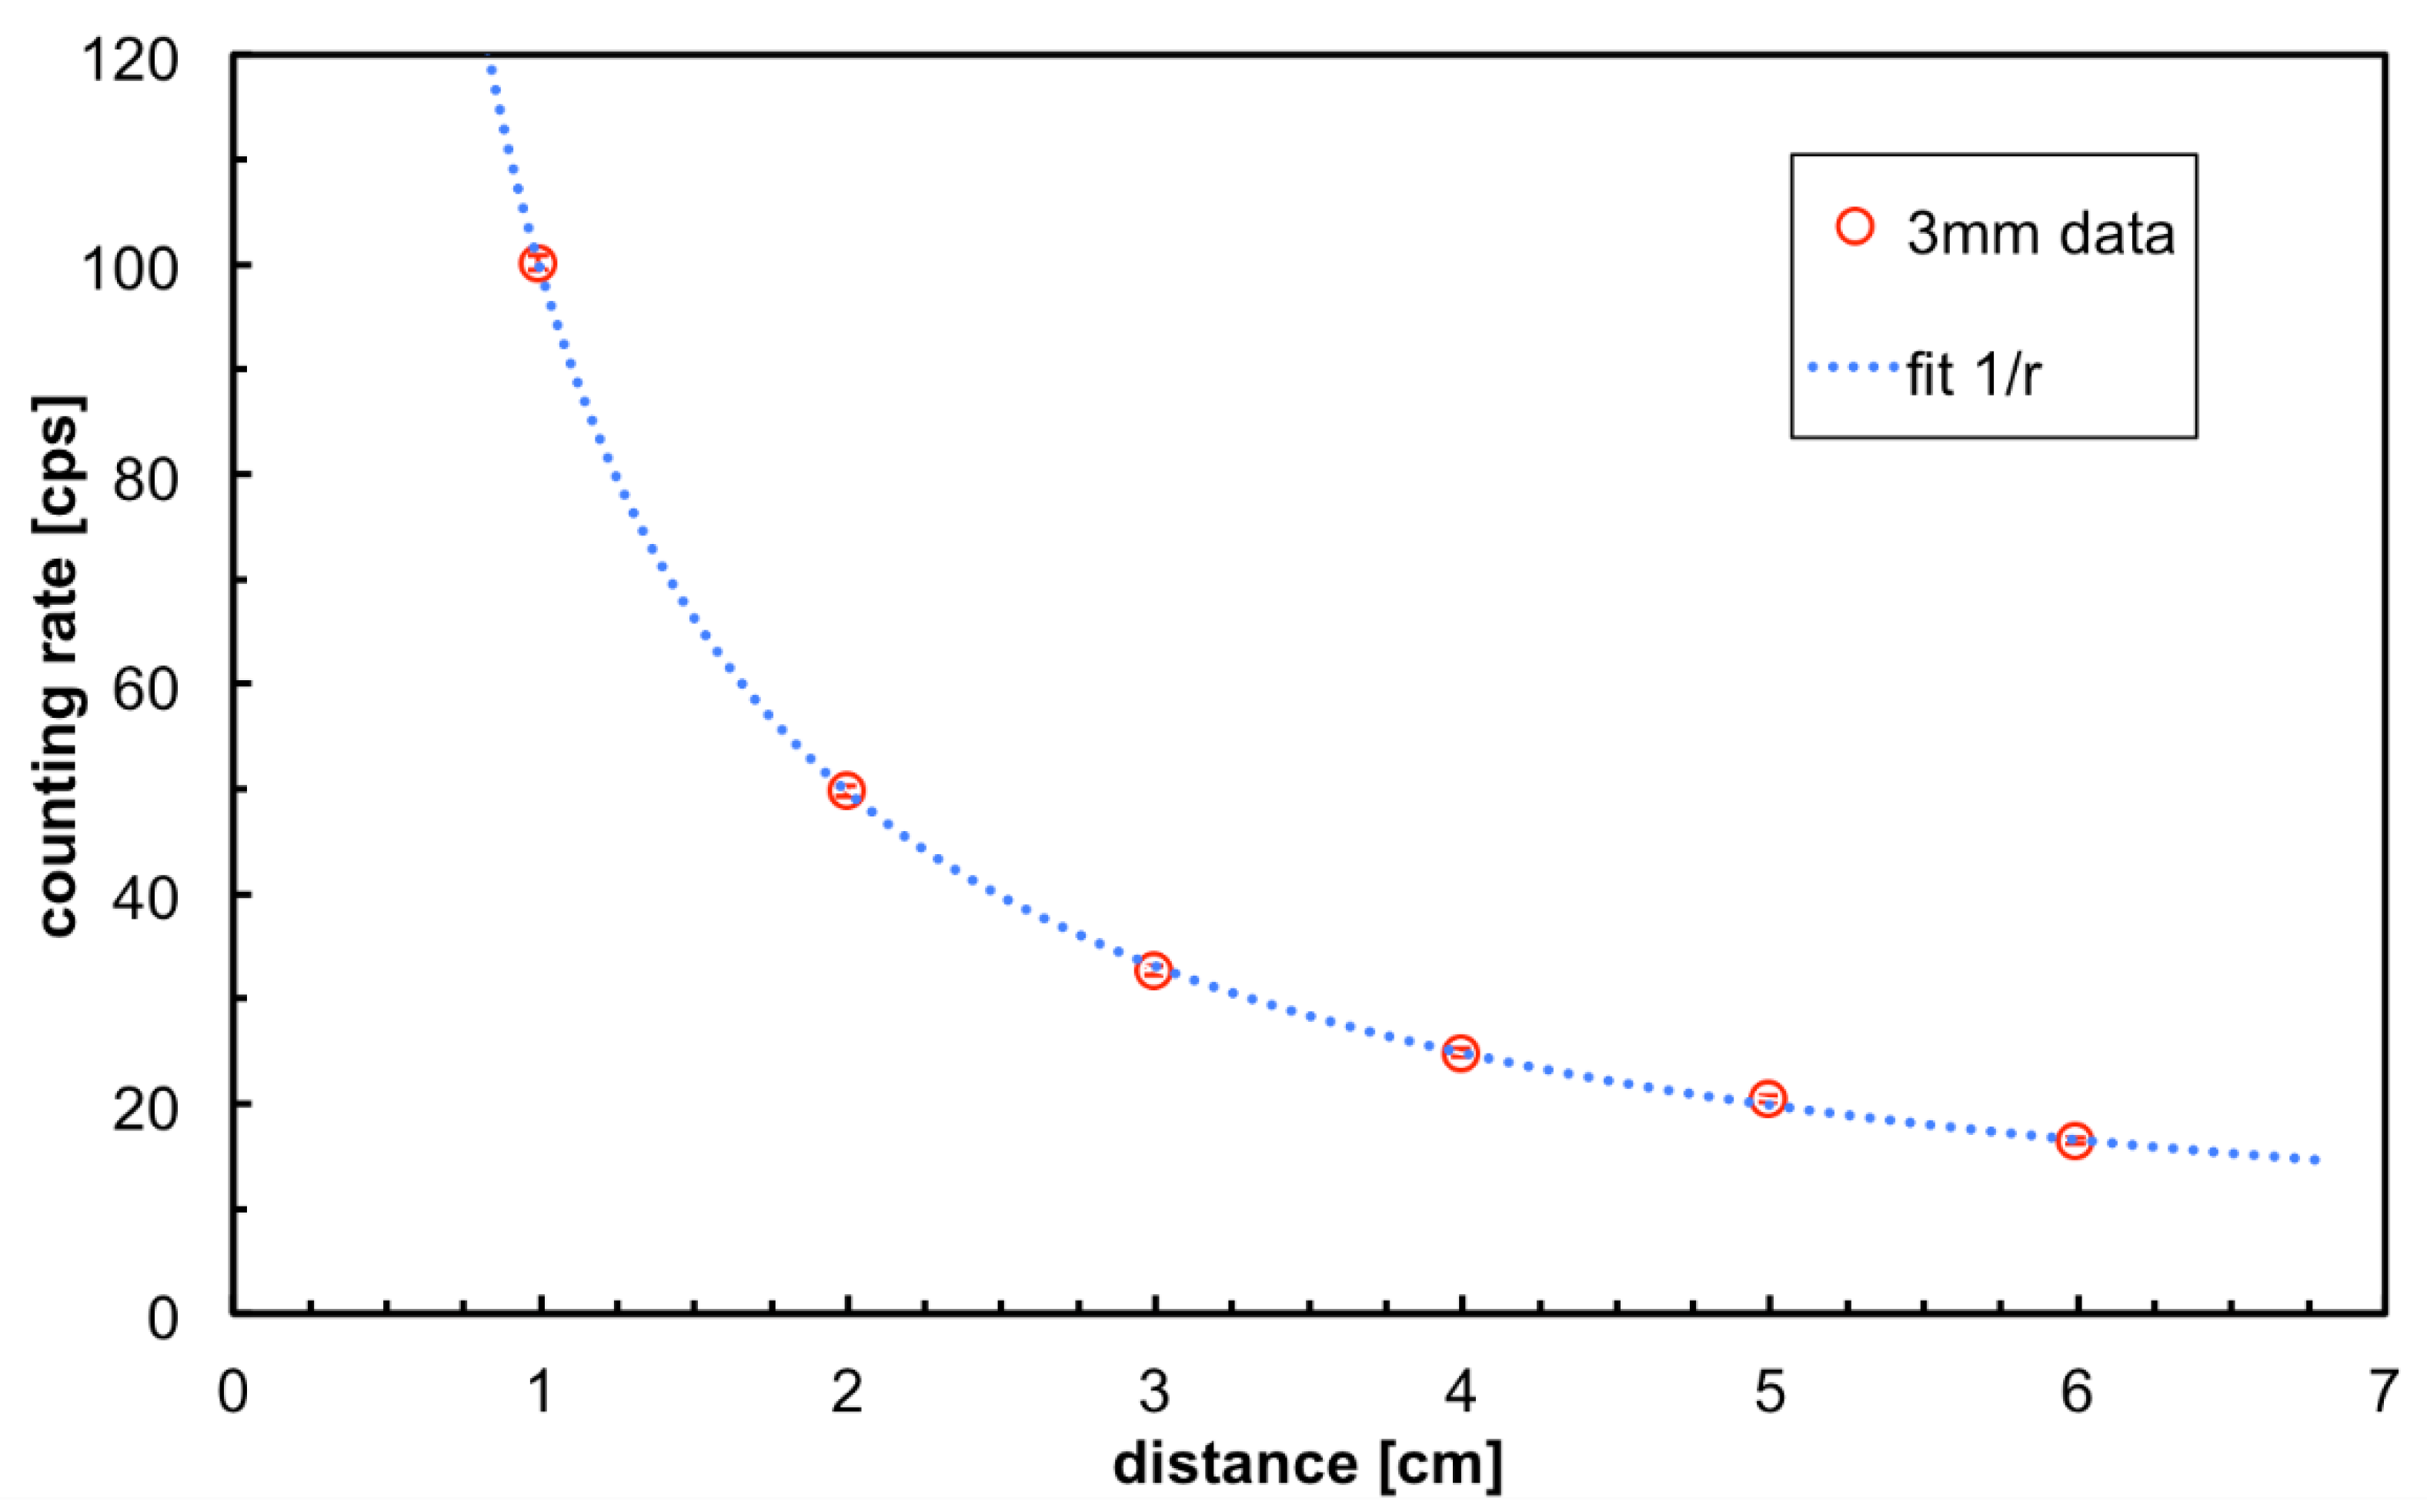
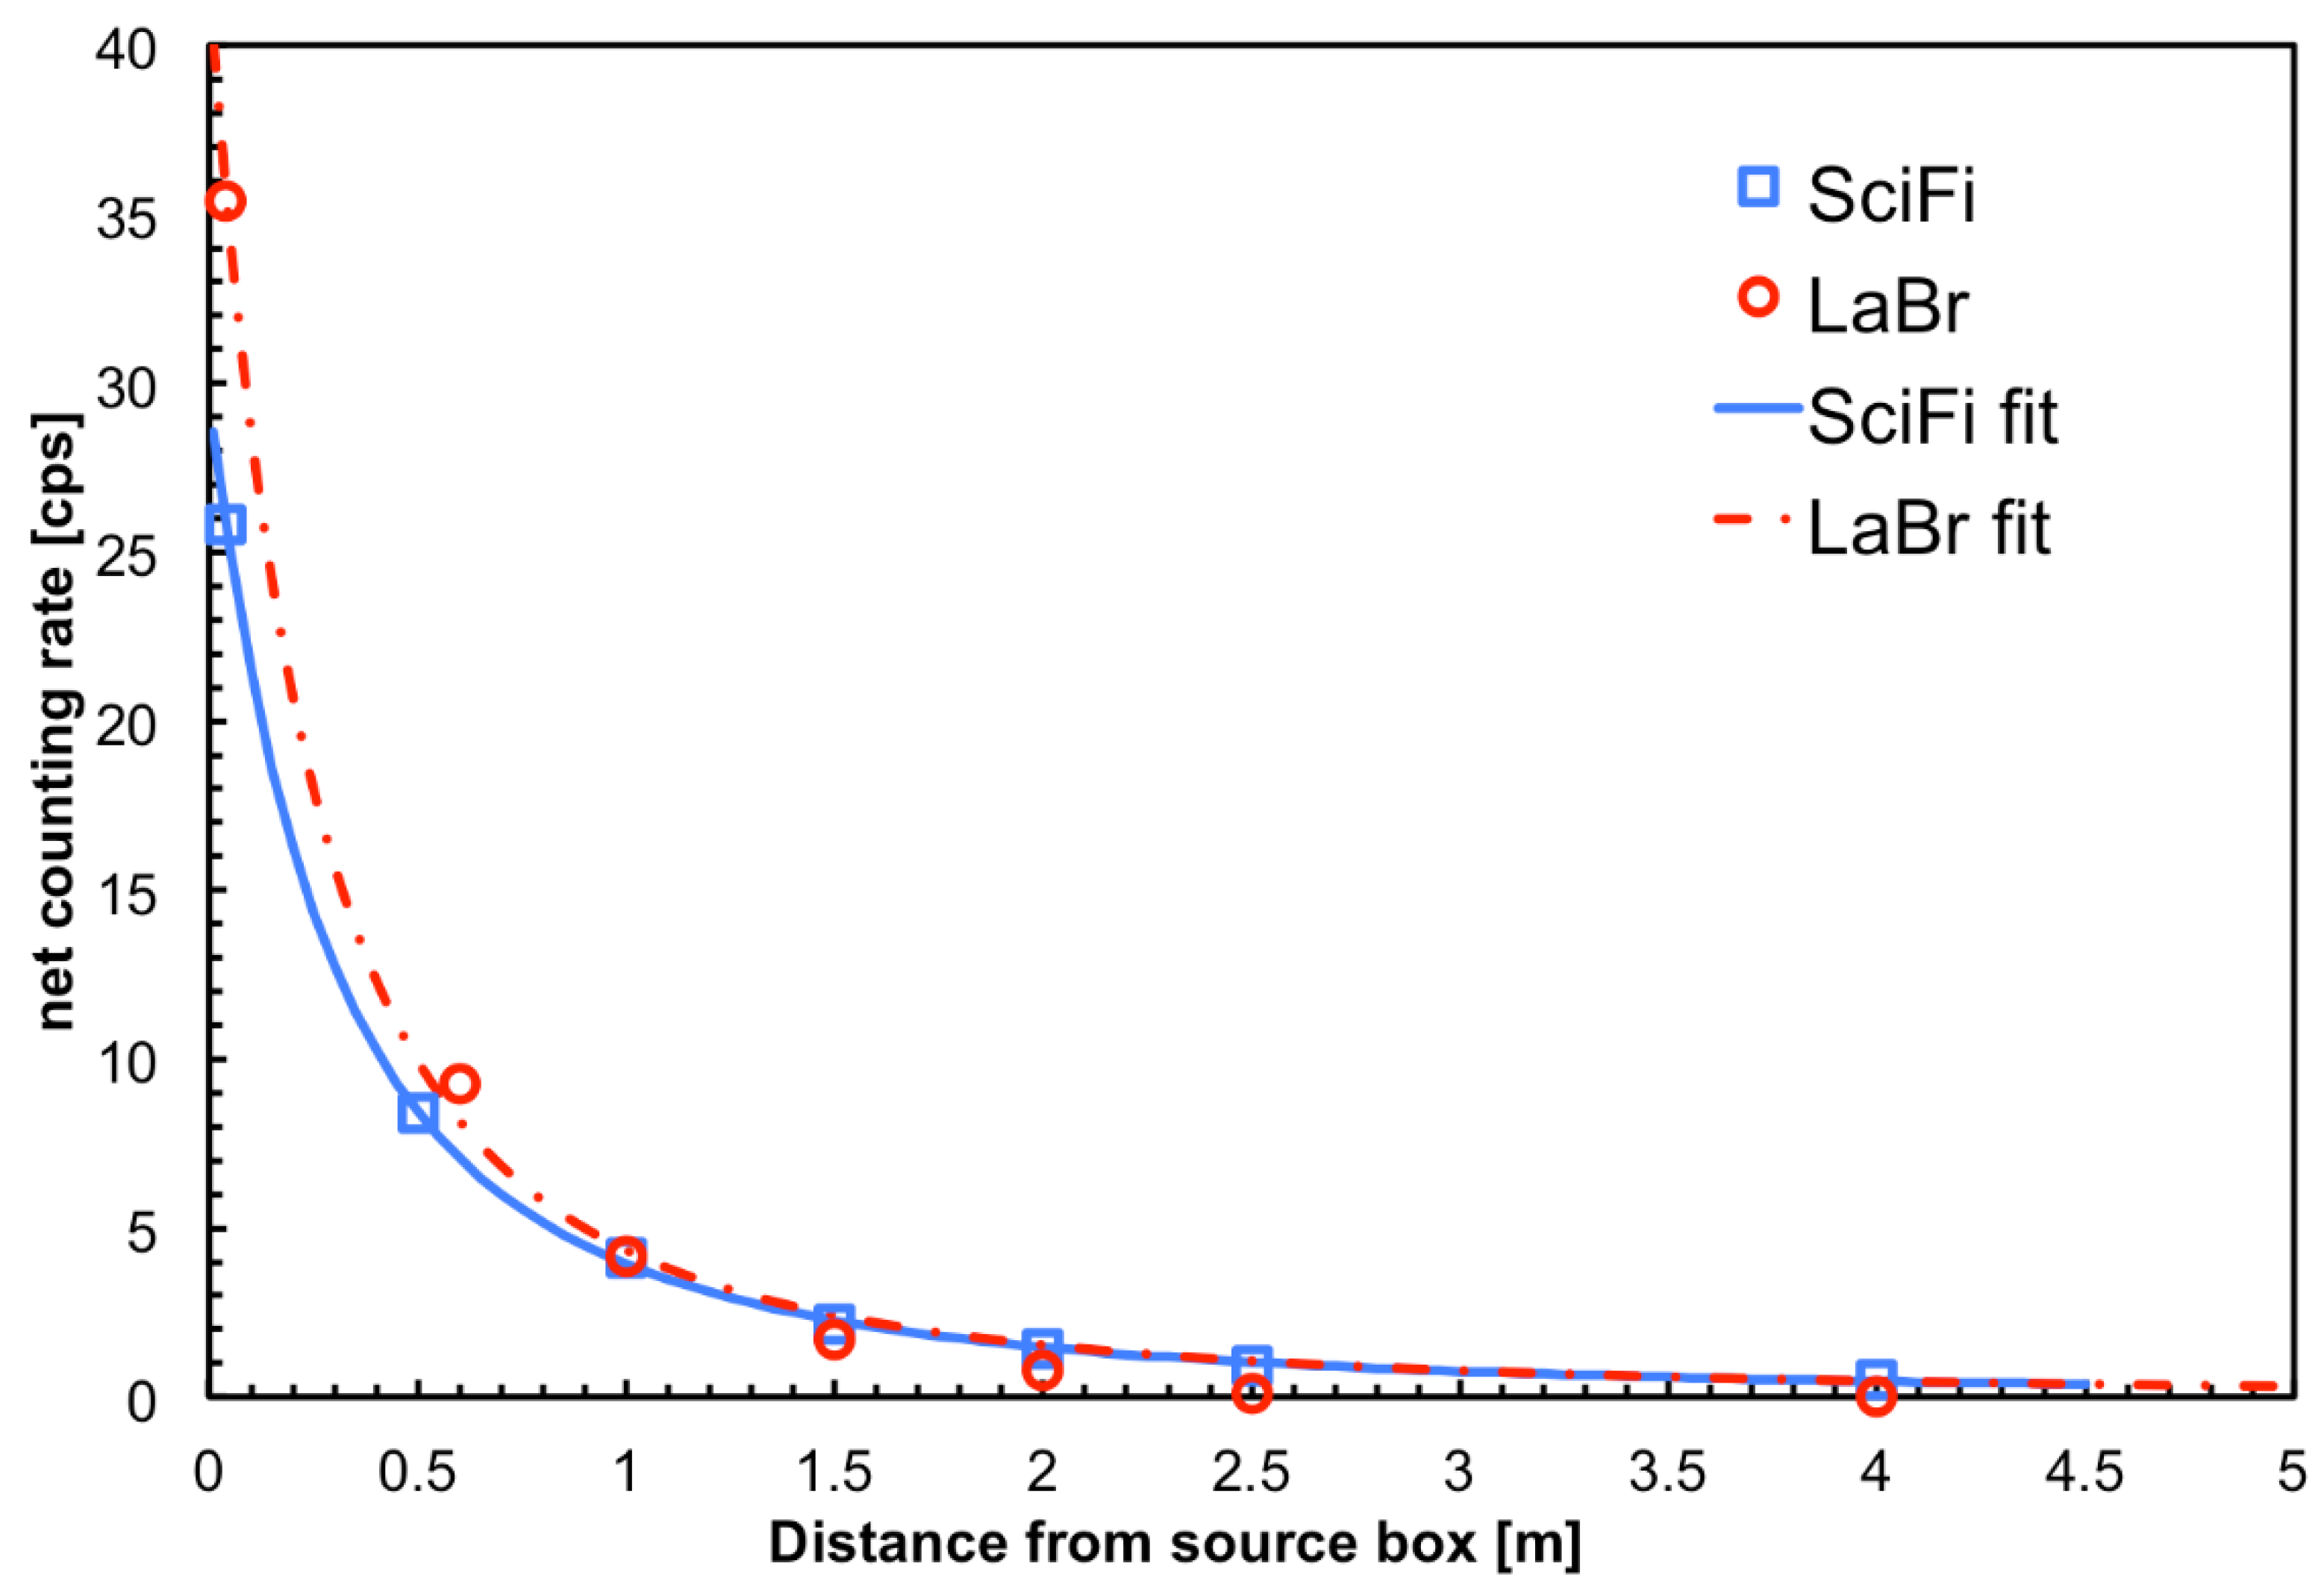
3.1. Point-Like Source at Short Distance

A first test to validate the detector behavior was performed by means of a point-like 22Na source of activity A = 42 ± 2 kBq which emits gamma-rays of 1274 keV (99.9% branching ratio) and also β+ particles (90.3% branching ratio) that immediately annihilate giving rise to a pair of 511 keV gamma-rays. The source was placed at several distances from the fiber, in the range of few centimeters, and the number of detected gamma-rays was recorded. When the distance r between source and fiber is much smaller than the fiber length, this one can be assumed as infinite and the geometrical efficiency ε can be calculated as:
ε ≈ w/2πr
where w is the fiber diameter. The expected count rate C can be calculated, for instance at 1 cm, by means of the activity A and the simulated detection efficiency εdet at 511 and 1274 keV:
C(1 cm) ≈ A × ε × [2 × 0.903 × εdet(511 keV) + 0.999 × εdet(1274 keV)] ≈ 100 cps
which is what we obtained and corresponds to an equivalent dose of about 118 µSv/h [16]. A 1/r fit perfectly reproduces the measured count rates, as shown in Figure 11.

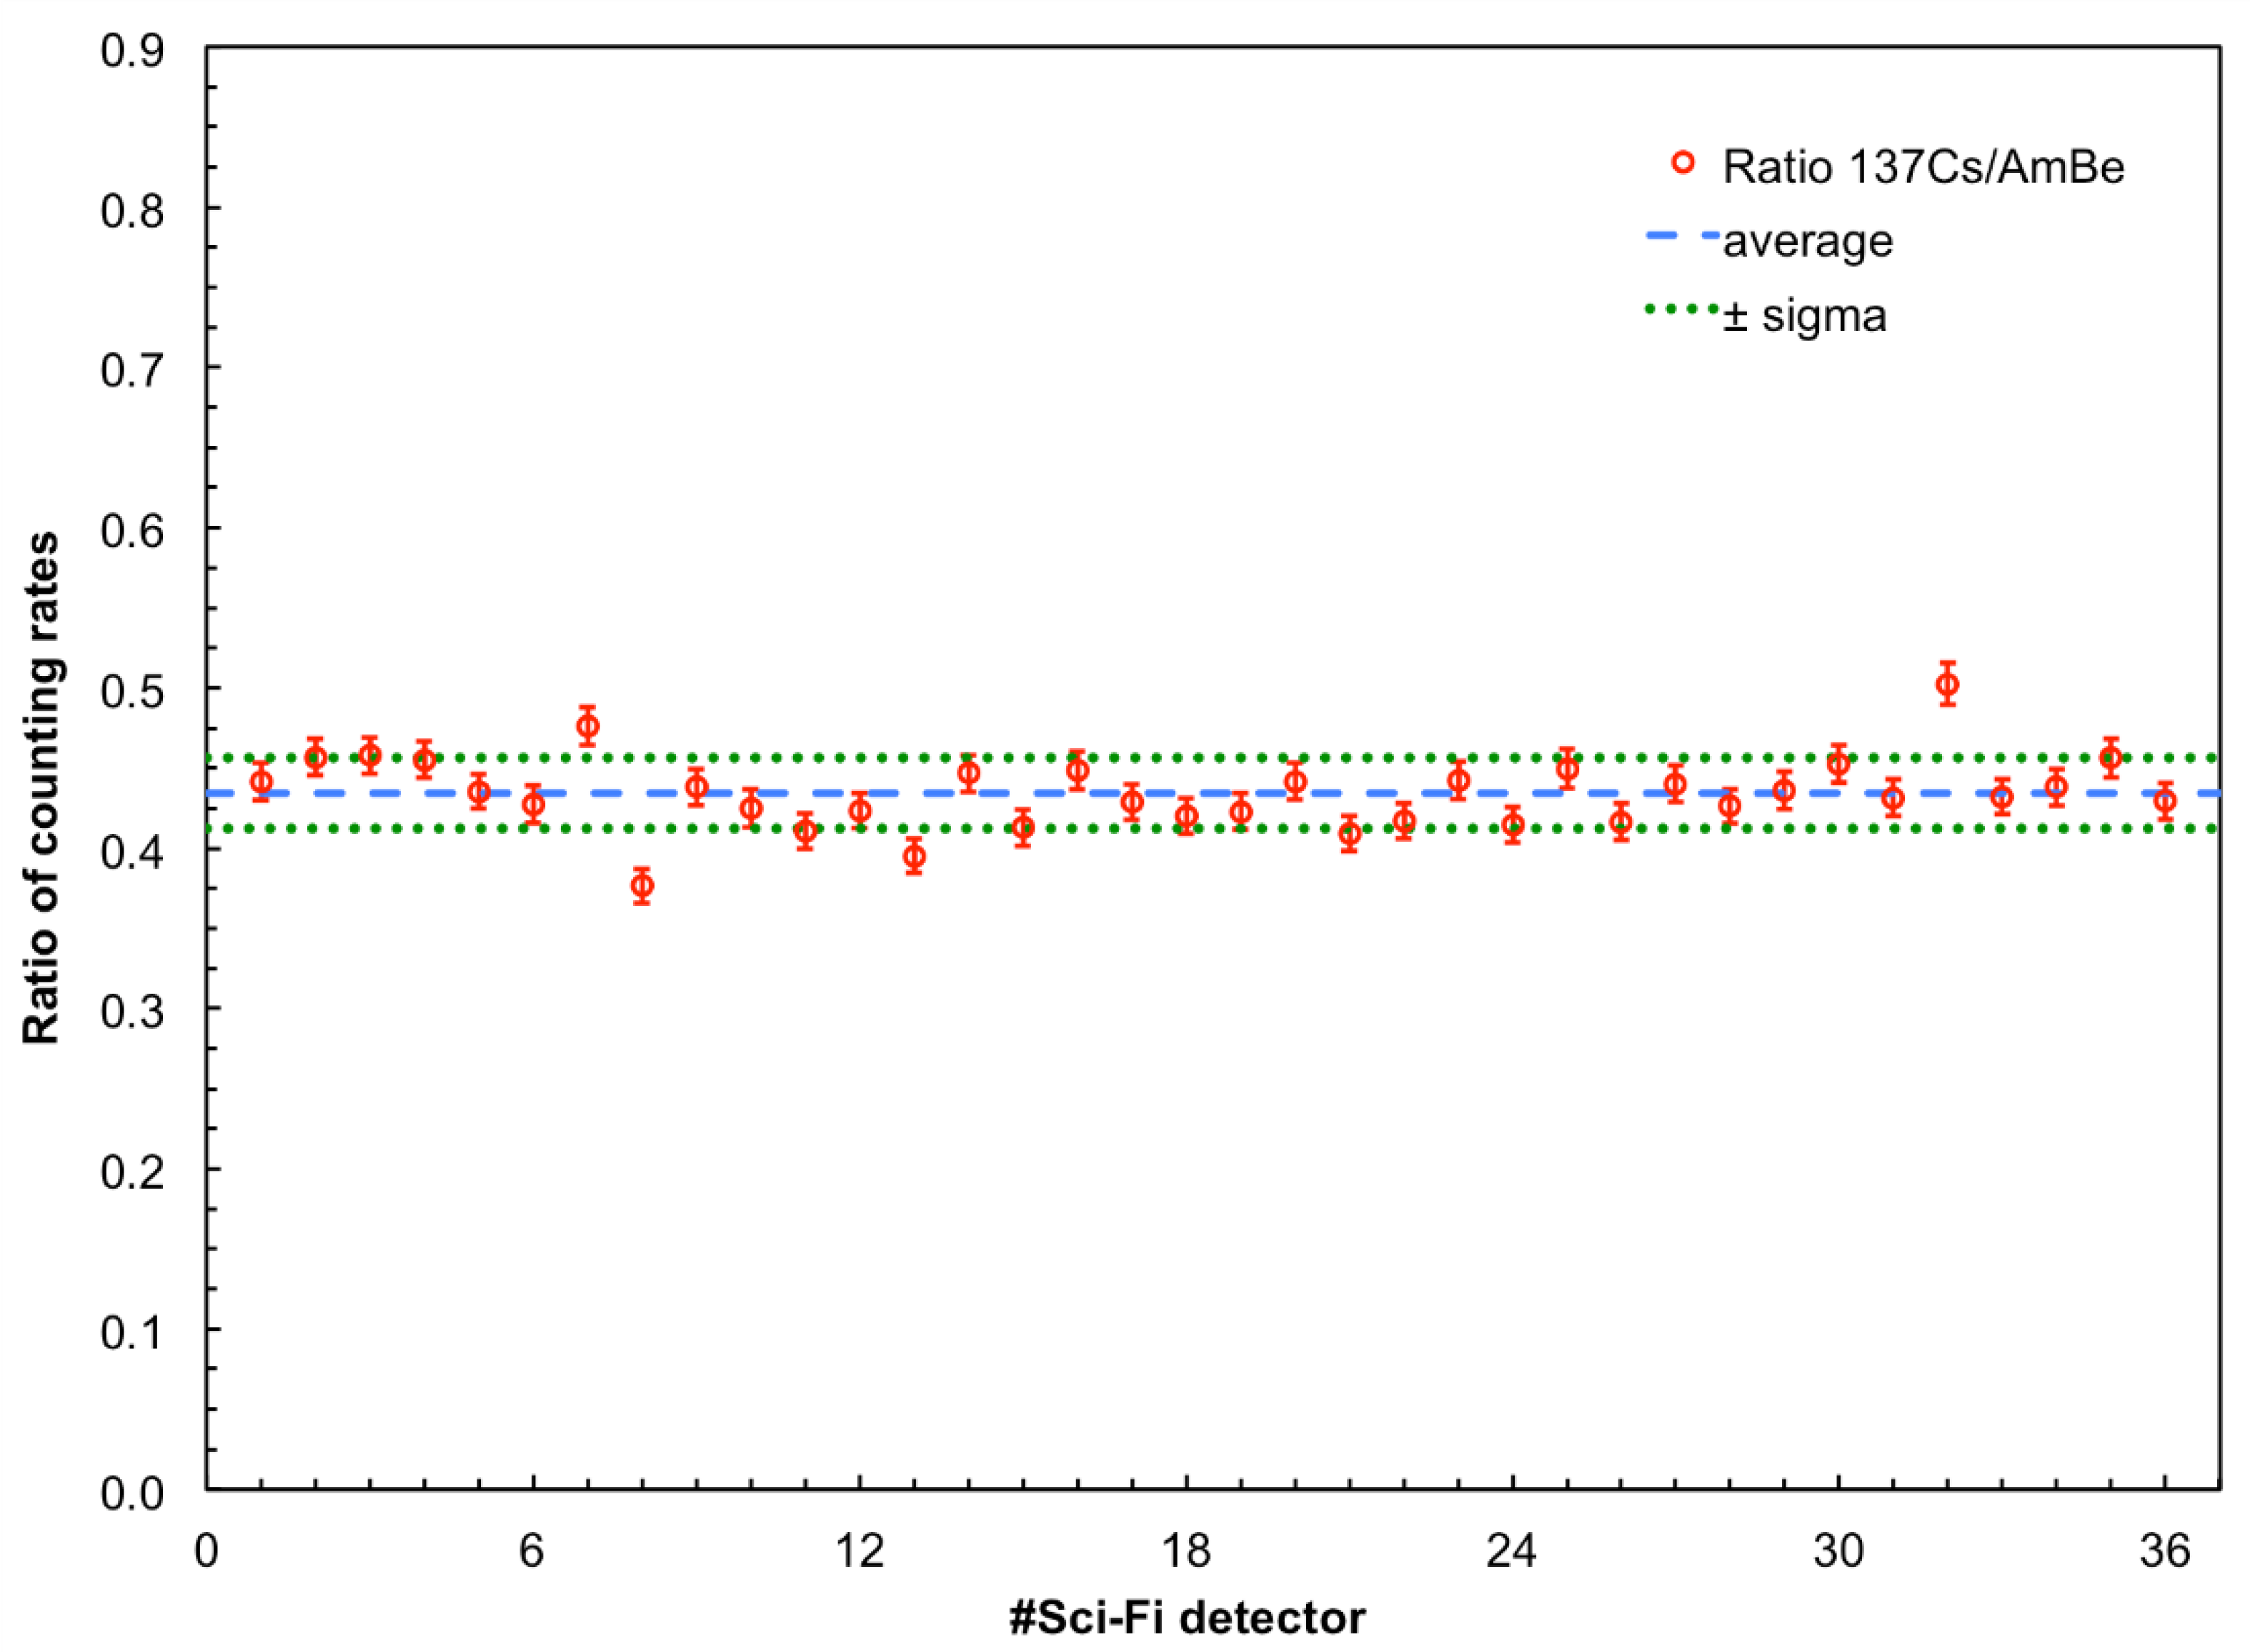
3.2. Detection Efficiency Measurement

For a better check of the simulation results, and in order to verify the uniformity of the response within the set of SciFi detectors, we assembled a simple setup with a point-like 137Cs gamma source, with activity A = 1.49 ± 0.07 Mbq, and a detector holder that kept the mid-point of the fiber at a distance d = 52 cm from the source (Figure 12). The counting rate of each detector was measured in 200 s, as well as the background rate and the signal-to-background ratio, and the results are plotted in Figure 13. The non-uniformity of the response is due to tiny differences between the individual SiPMs, which are amplified by their exponential multiplication mechanism, and slight imperfections of the optical coupling. However, the non-uniformity is quite limited and reasonable. Notice that the background count level is the same as shown by the blue line in Figure 4, as it represents the physical background due to cosmic rays and natural radioactivity.
The net measured counting rates, i.e., after subtracting the background, were used to calculate the detection efficiency with gamma-rays of 662 keV energy. The geometrical efficiency ε in this configuration can be calculated starting from a barrel-like solid angle covering (Figure 14), subtracting the fraction covered by the two spherical caps, and then dividing by the number of fibers that would cover the entire cylinder. The relevant quantities are r = 52 ± 0.5 cm, fiber length f = 80 ± 0.05 cm, fiber diameter c = 0.3 ± 0.003 cm, R = 65.6 ± 0.4 cm, h = 25.6 ± 0.4.
Ω/Ω total = 2πRh/4πR2 = h/2R = 0.195 ± 0.002
Ω cylindertotal ≈ 1 − 2 × Ω/Ω total ≈ 0.610 ± 0.006
Nfibers ≈ 2πR/c ≈ 1089 ± 15
ε = (Ω cylindertotal)/Nfibers ≈ 0.00056 ± 1 × 10⁻⁵
The decay branching ratio of 137Cs into 662 keV gamma-rays is 85%, and the attenuation in the aluminum pipe is 2.0%, therefore the expected number of impinging gamma-rays on the fiber per second was:
Ngamma- = A × 0.85 × (1 − 0.02) × ε= 694 ± 35
The average net counting rate from the 36 fibers was 11.43 ± 1.1 counts per second (cps), therefore the average detection efficiency resulted
εdet (662 keV) ≈ 11.43/694 ≈ 1.65% ± 0.18%
in reasonable agreement with the 1.82% value estimated from the simulation (Figure 3). The detection efficiency for all the fibers is reported in Figure 15.

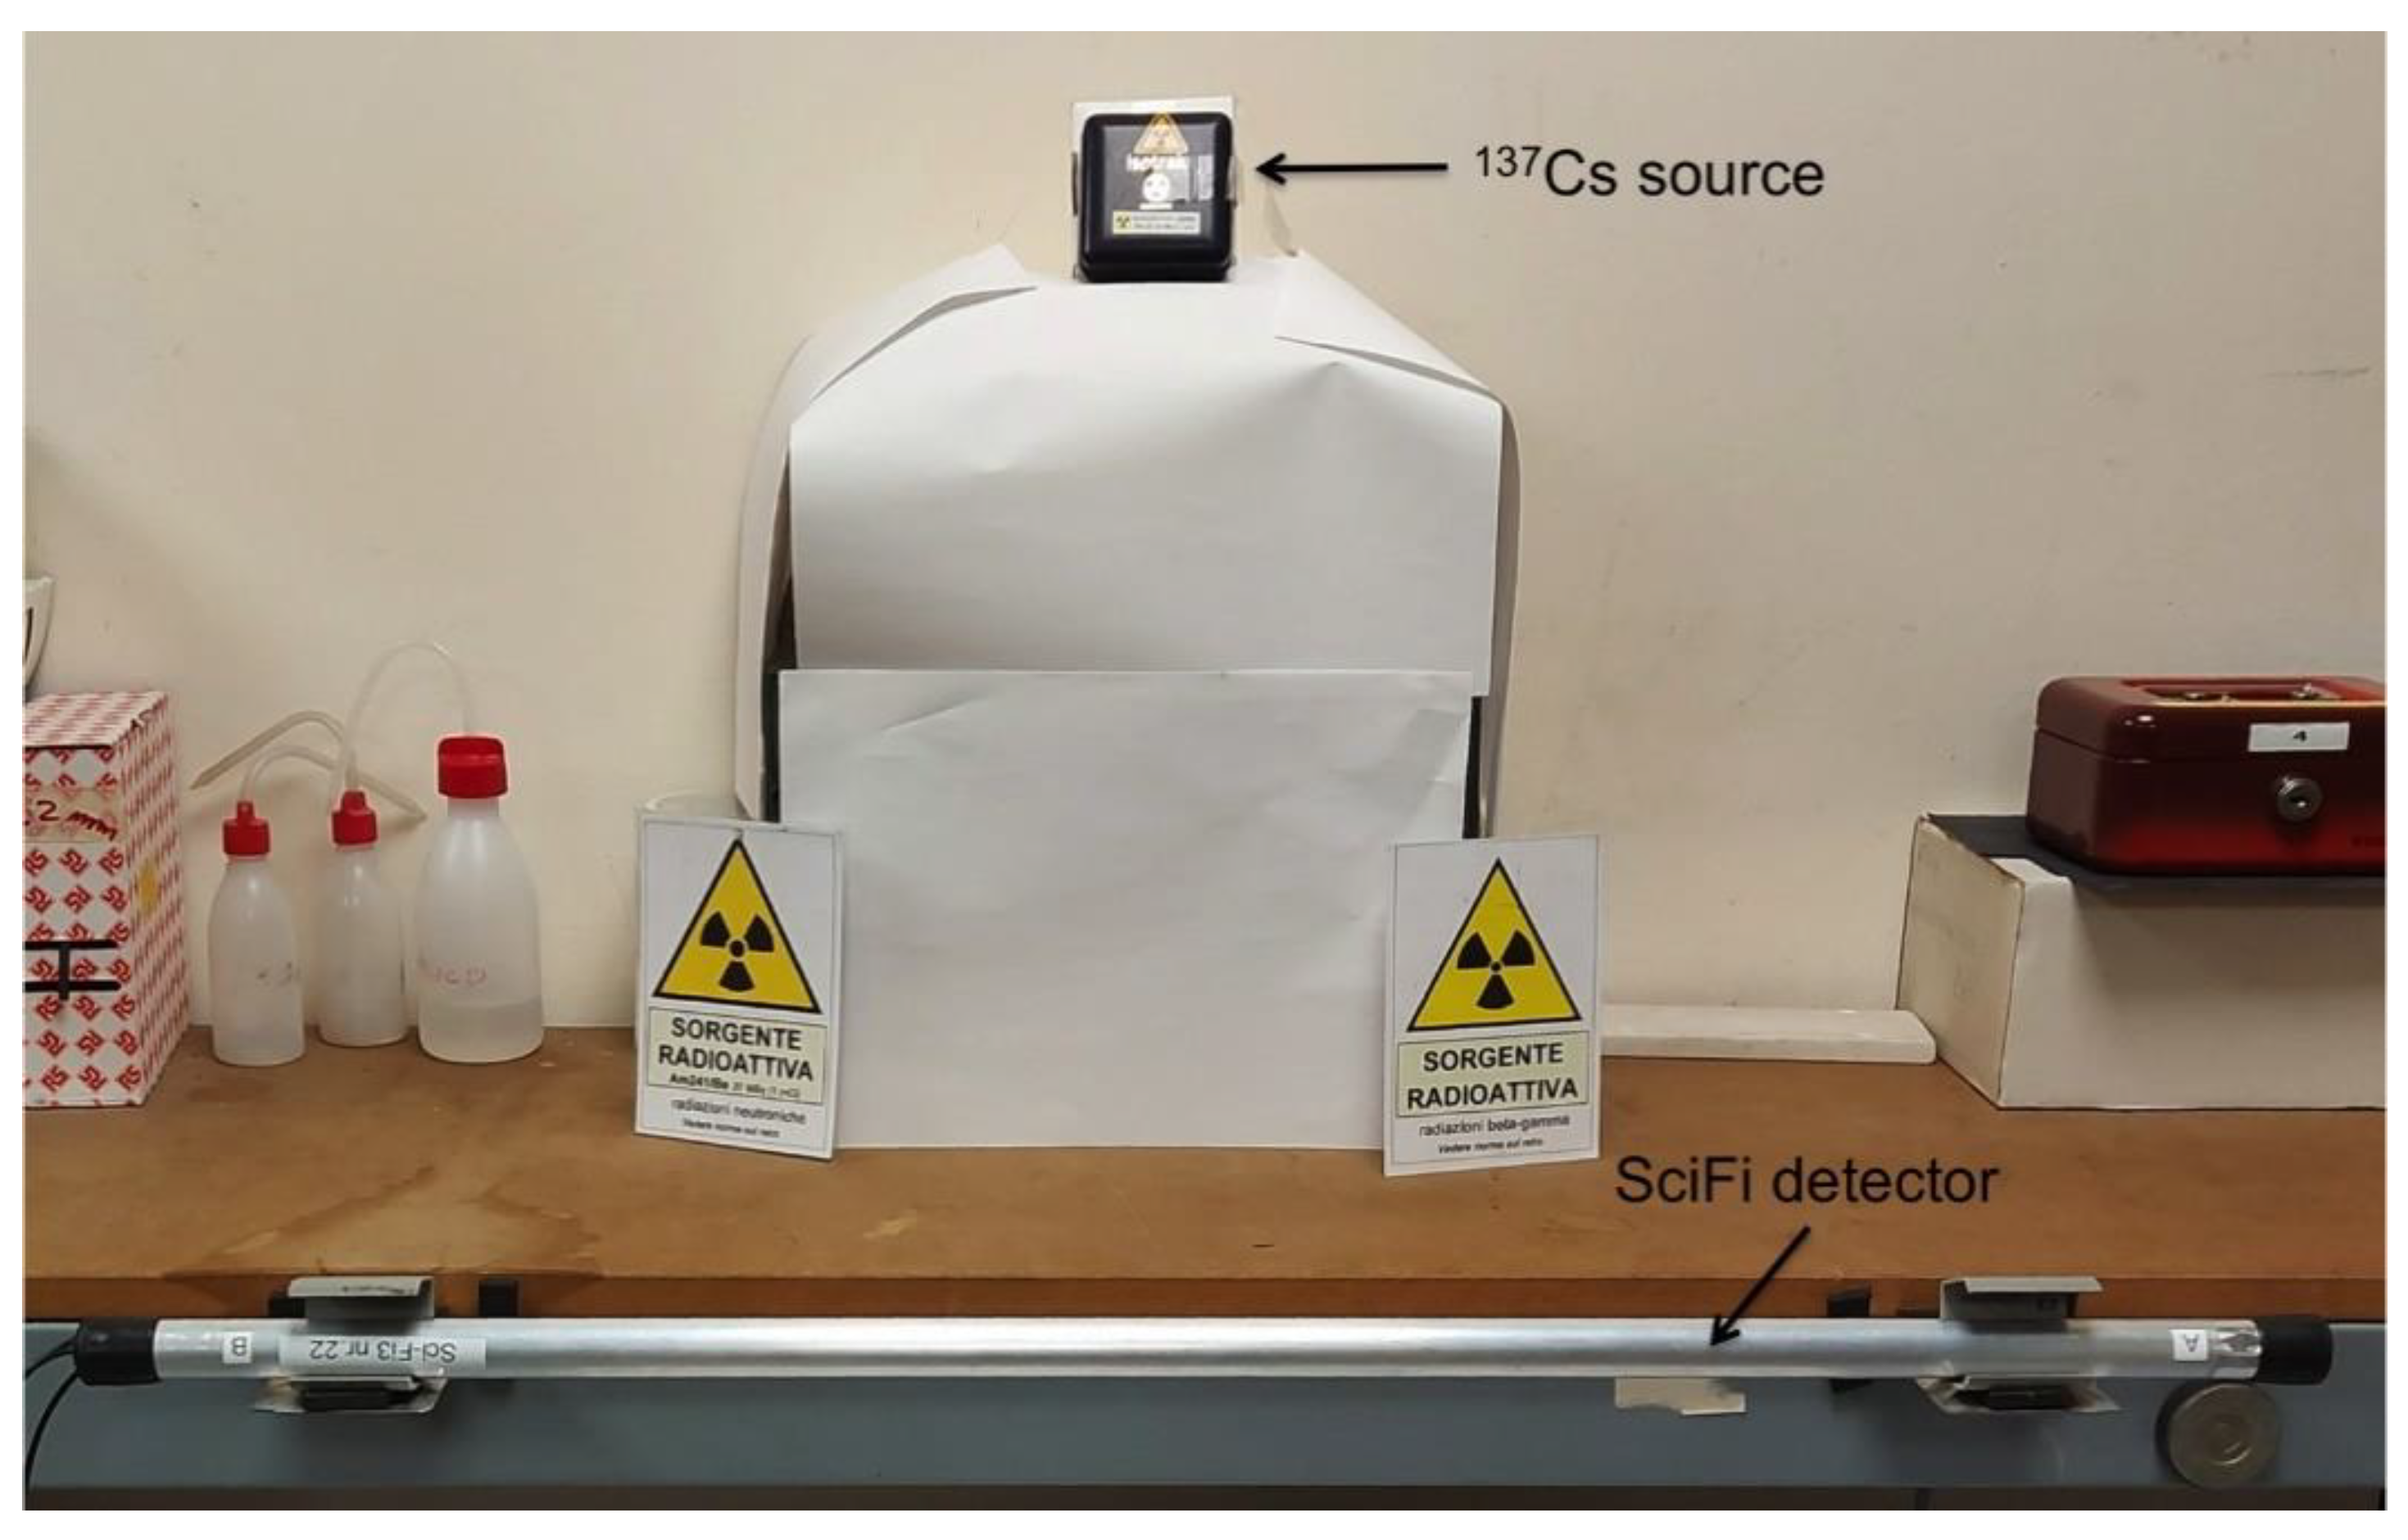
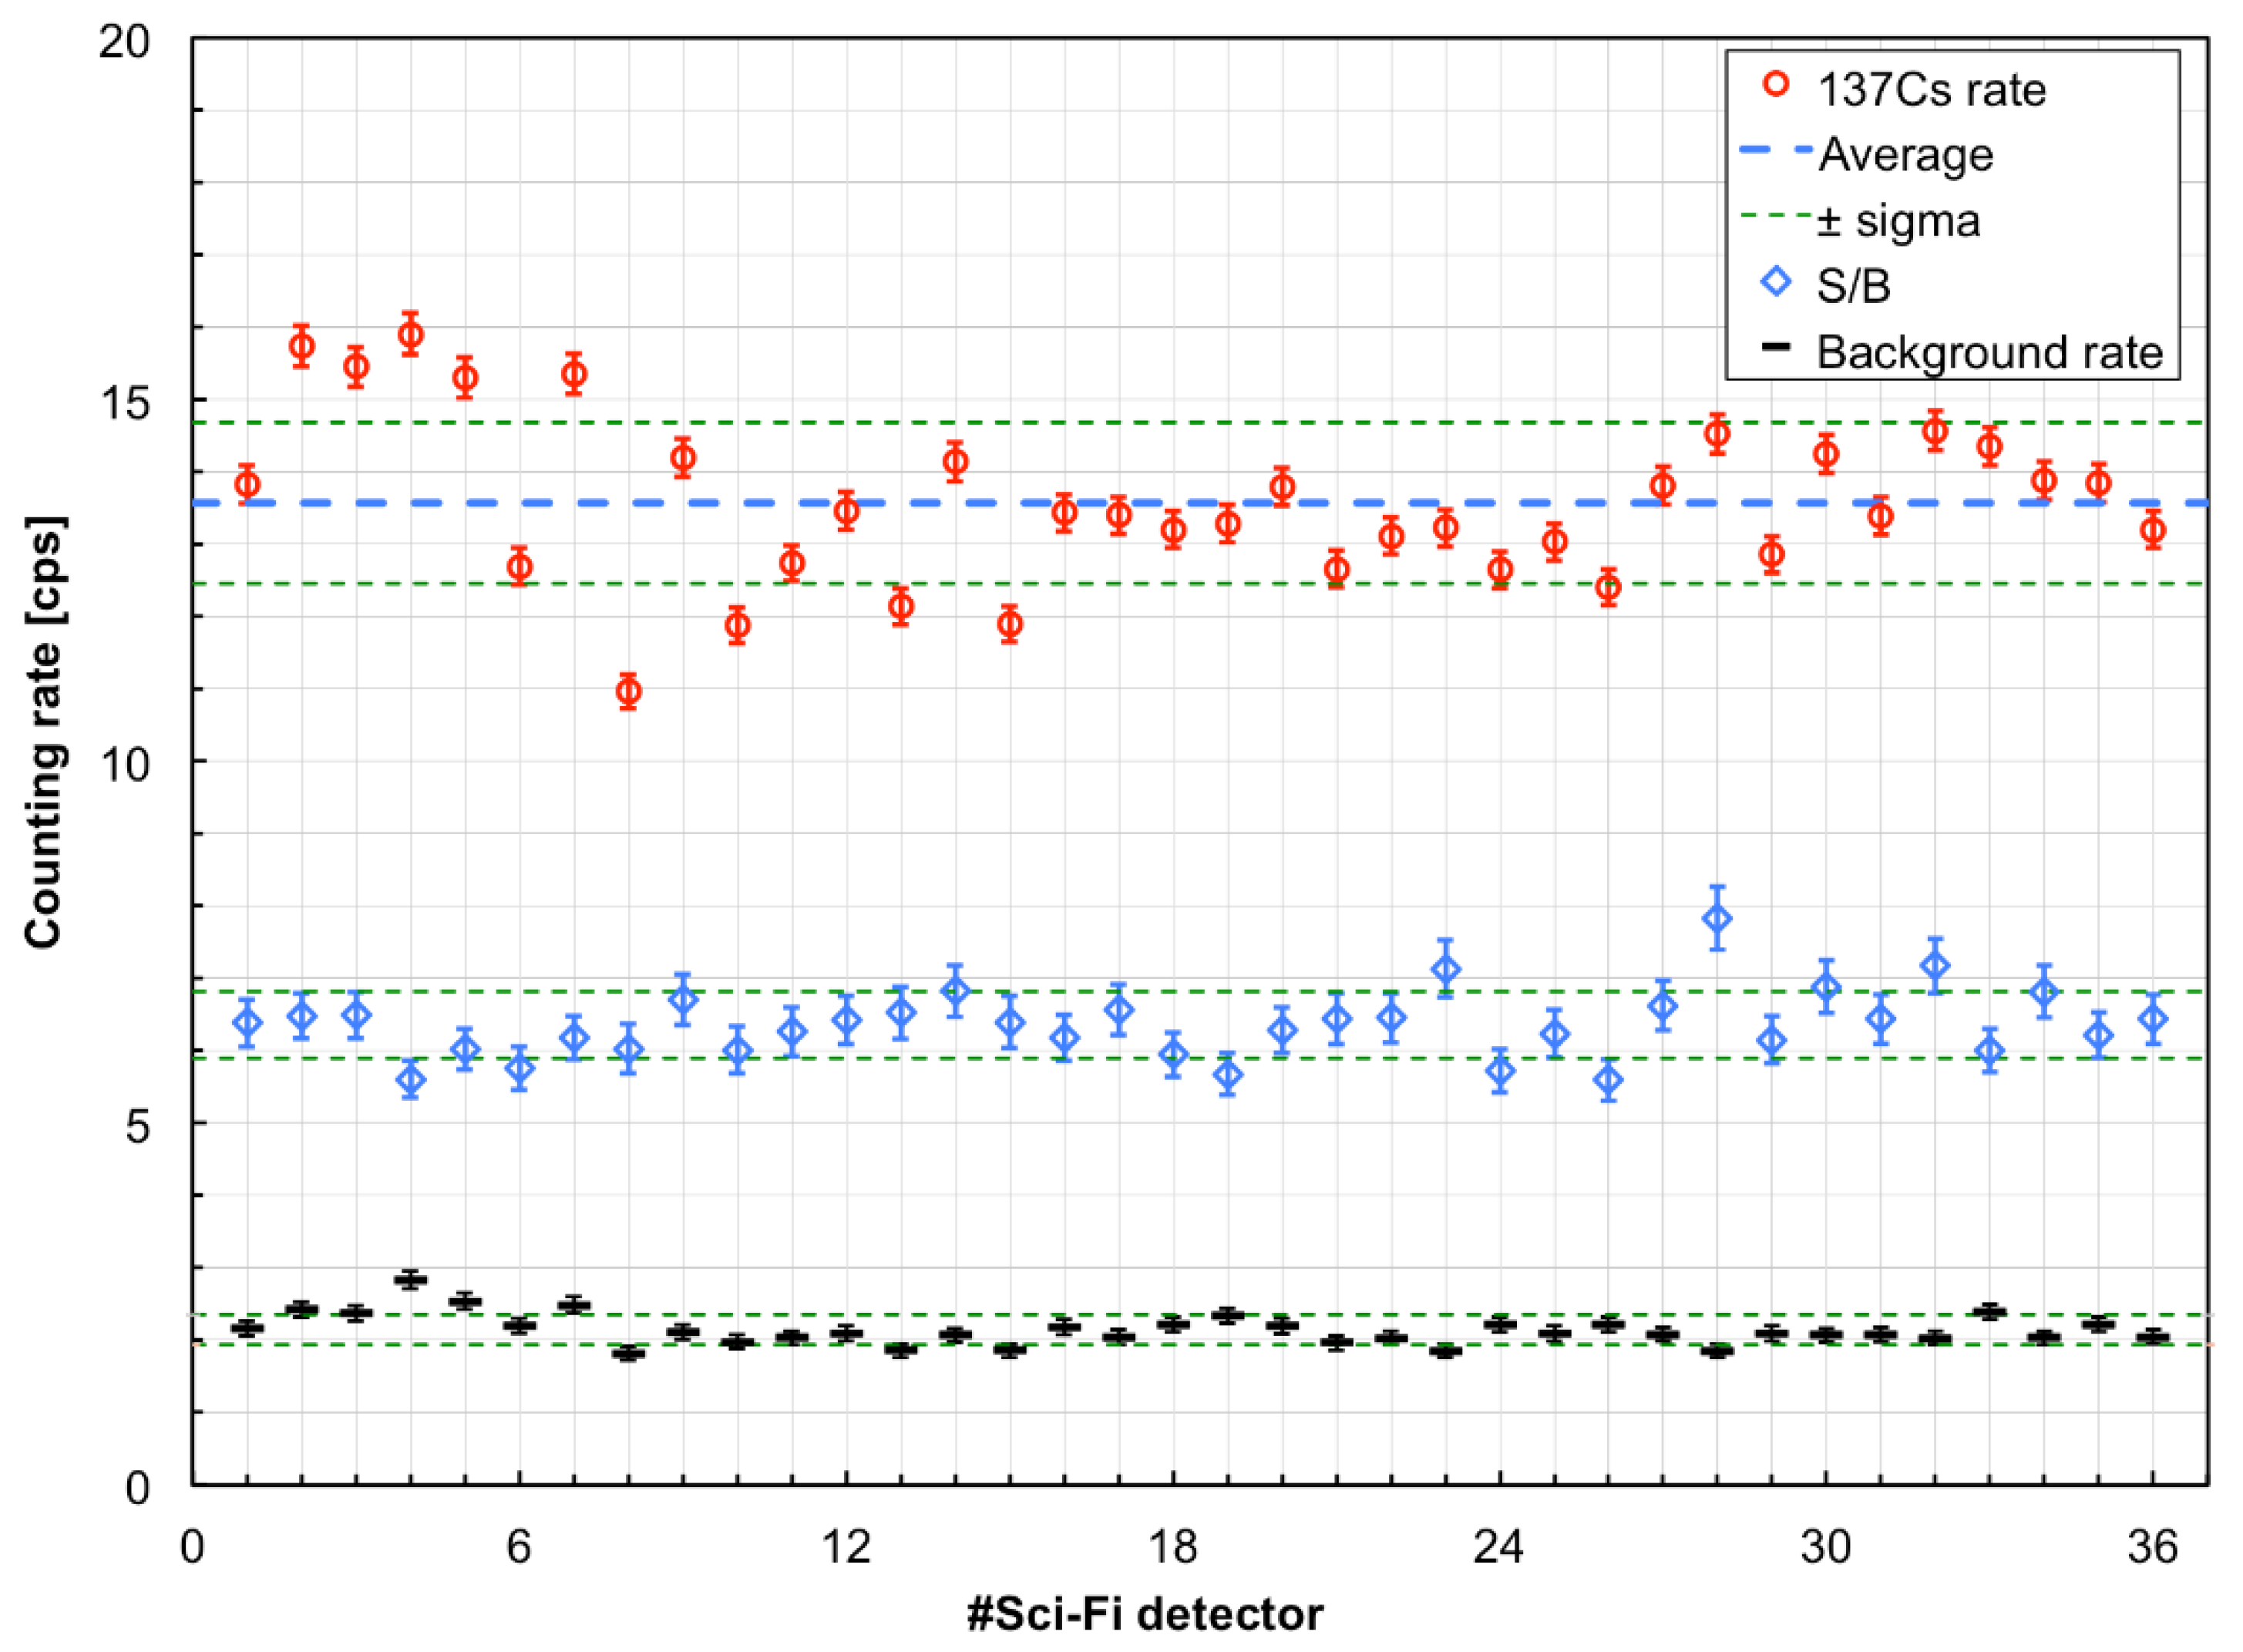
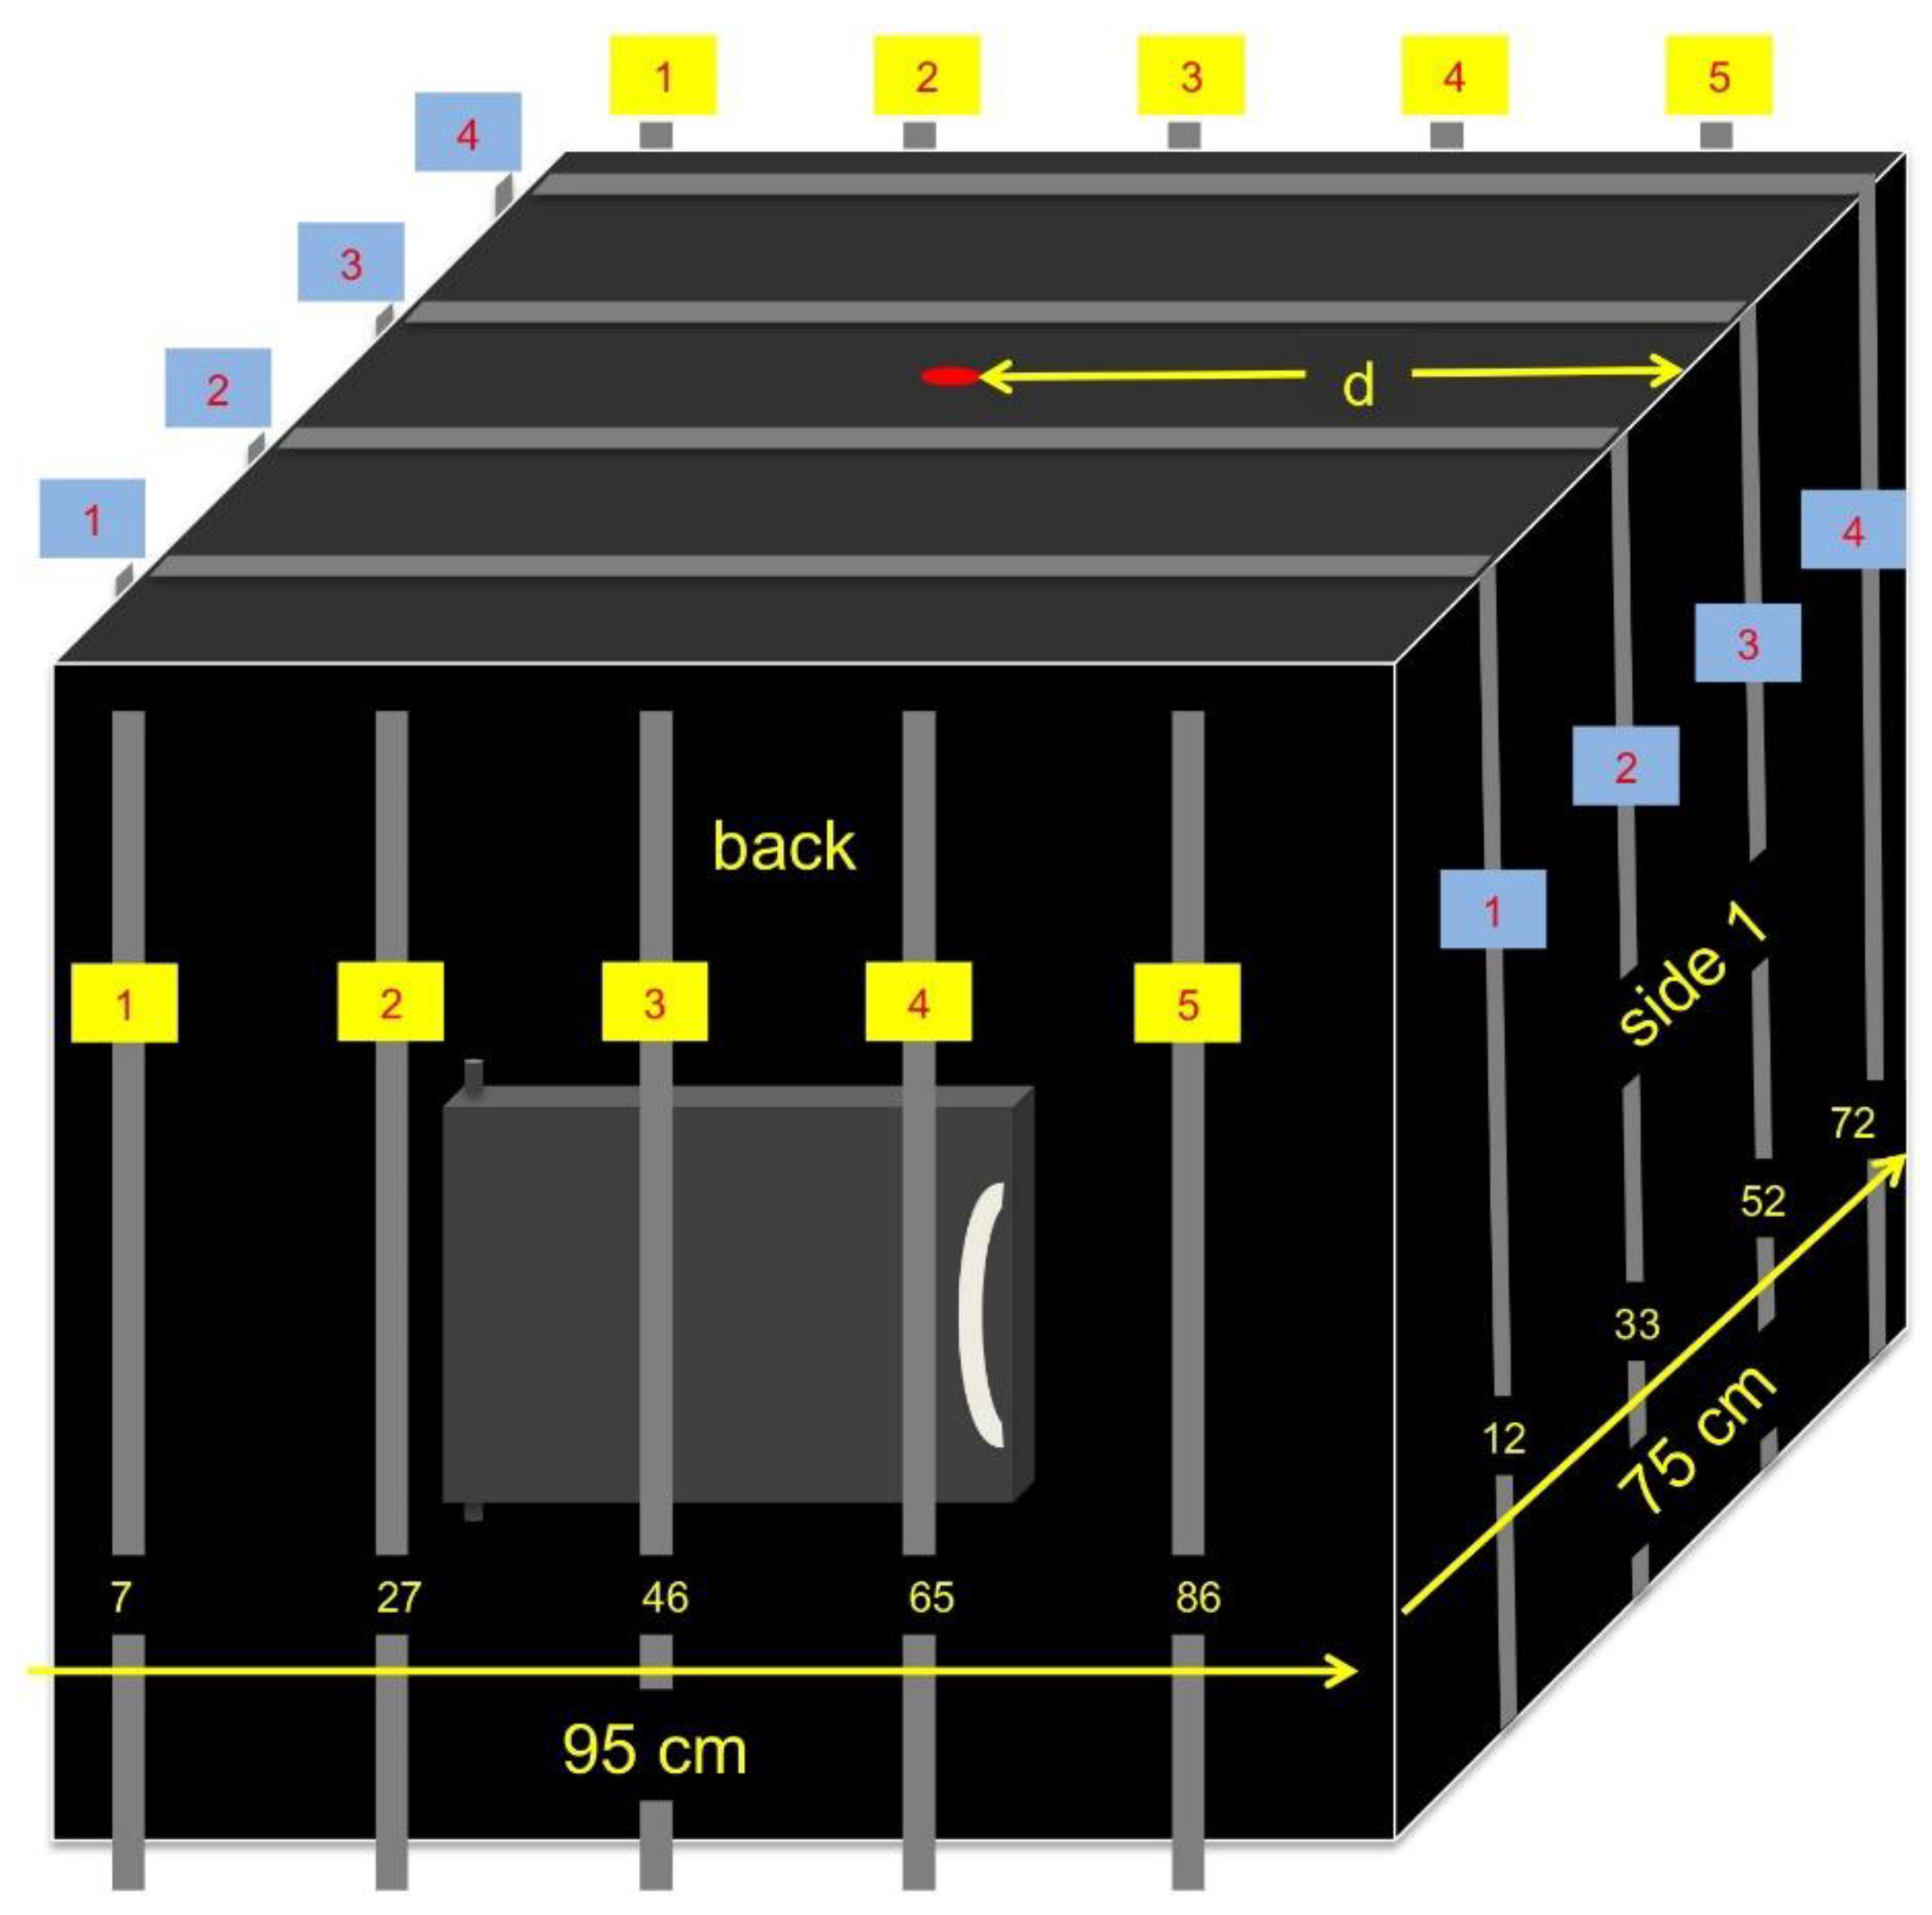
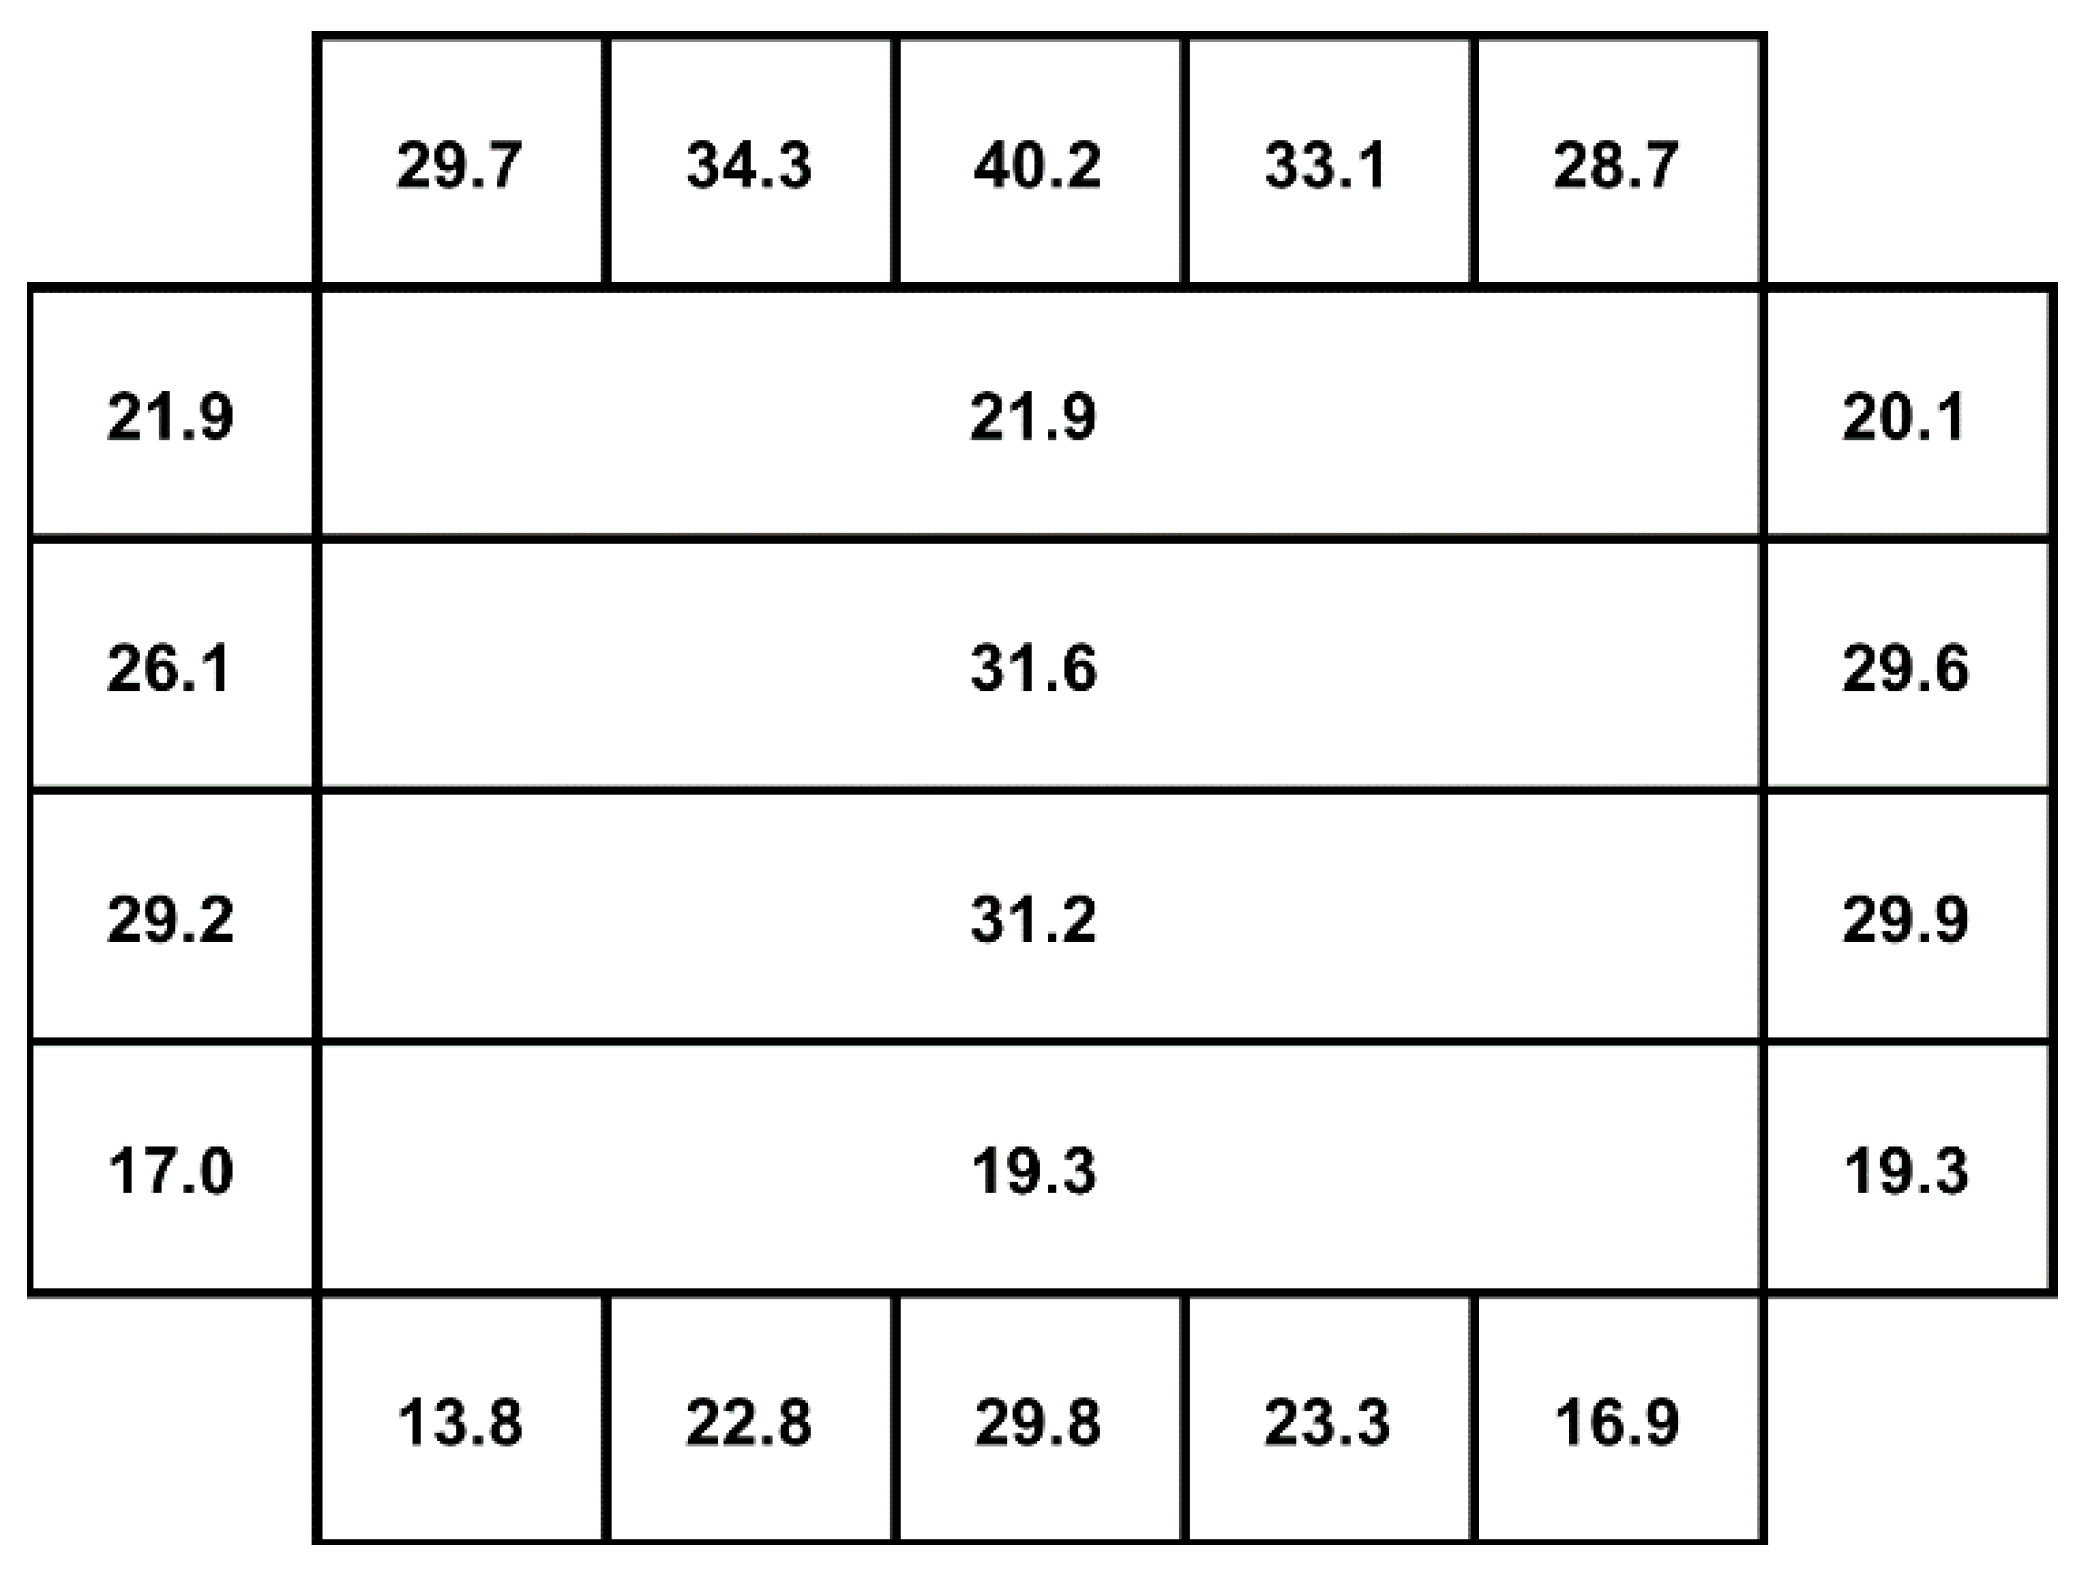
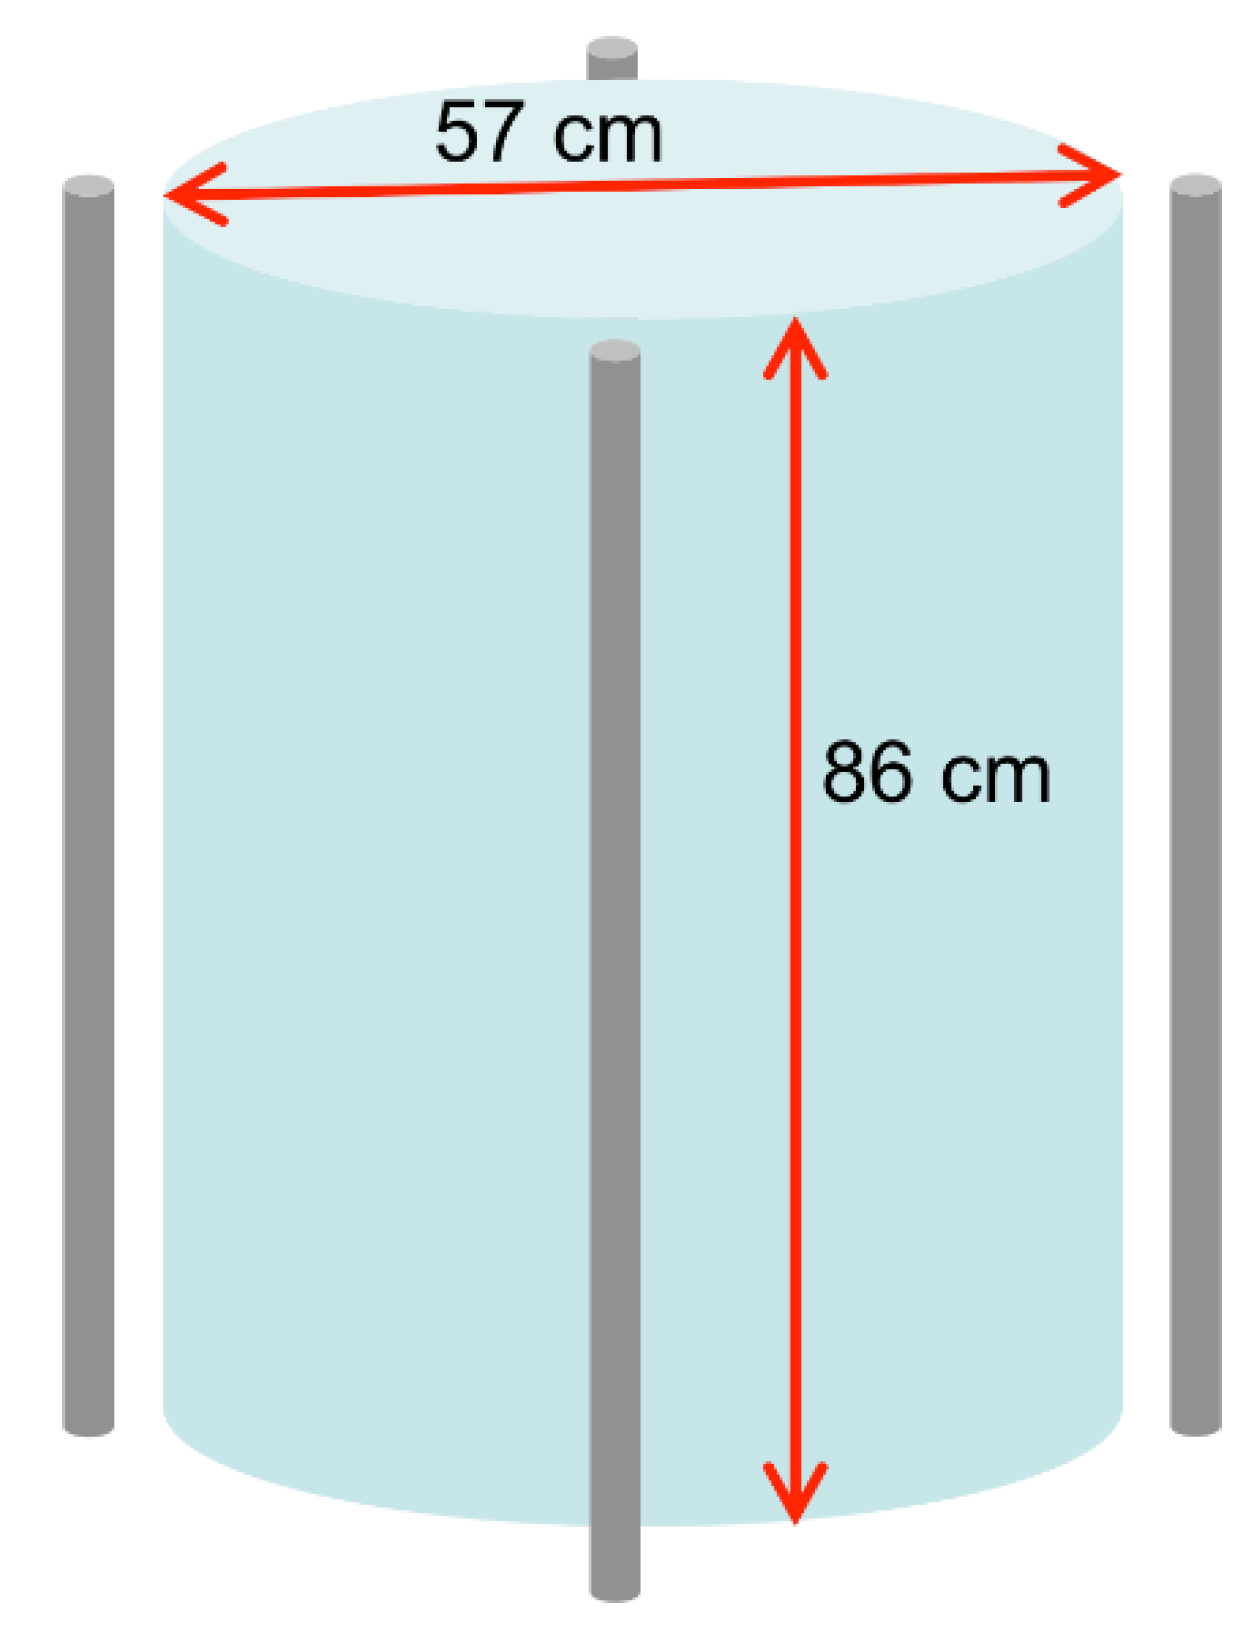
3.3. Tests in a More Realistic Setup

A realistic setup resembling the emission from a radwaste drum was employed for a series of tests of the SciFi detectors. We made use of an intense AmBe neutron source, installed in an experimental hall at INFN Laboratori Nazionali del Sud (LNS), which emits 2.2 × 10⁶ neutrons/s by exploiting alpha particles from the 241Am decay to induce the 9Be(α,n) reaction. In order to produce such an amount of neutrons one needs a considerable quantity of 241Am, which is highly radioactive as it emits 59 keV gamma-rays. Indeed, the activity of our source is 34 GBq, and it is enclosed in a 95 × 75 × 85 cm3 iron box along with its moderator (Figure 16). The source is surrounded by a first polyethylene case followed by 30 cm thick paraffin which slow down the high energy neutrons whose initial kinetic energy extends up to 10 MeV. The outer 5 cm of the shielding are made from borated paraffin that absorbs the vast majority of the outgoing thermalized neutrons. The energy spectrum of the gamma-rays coming out of the box has several main components:
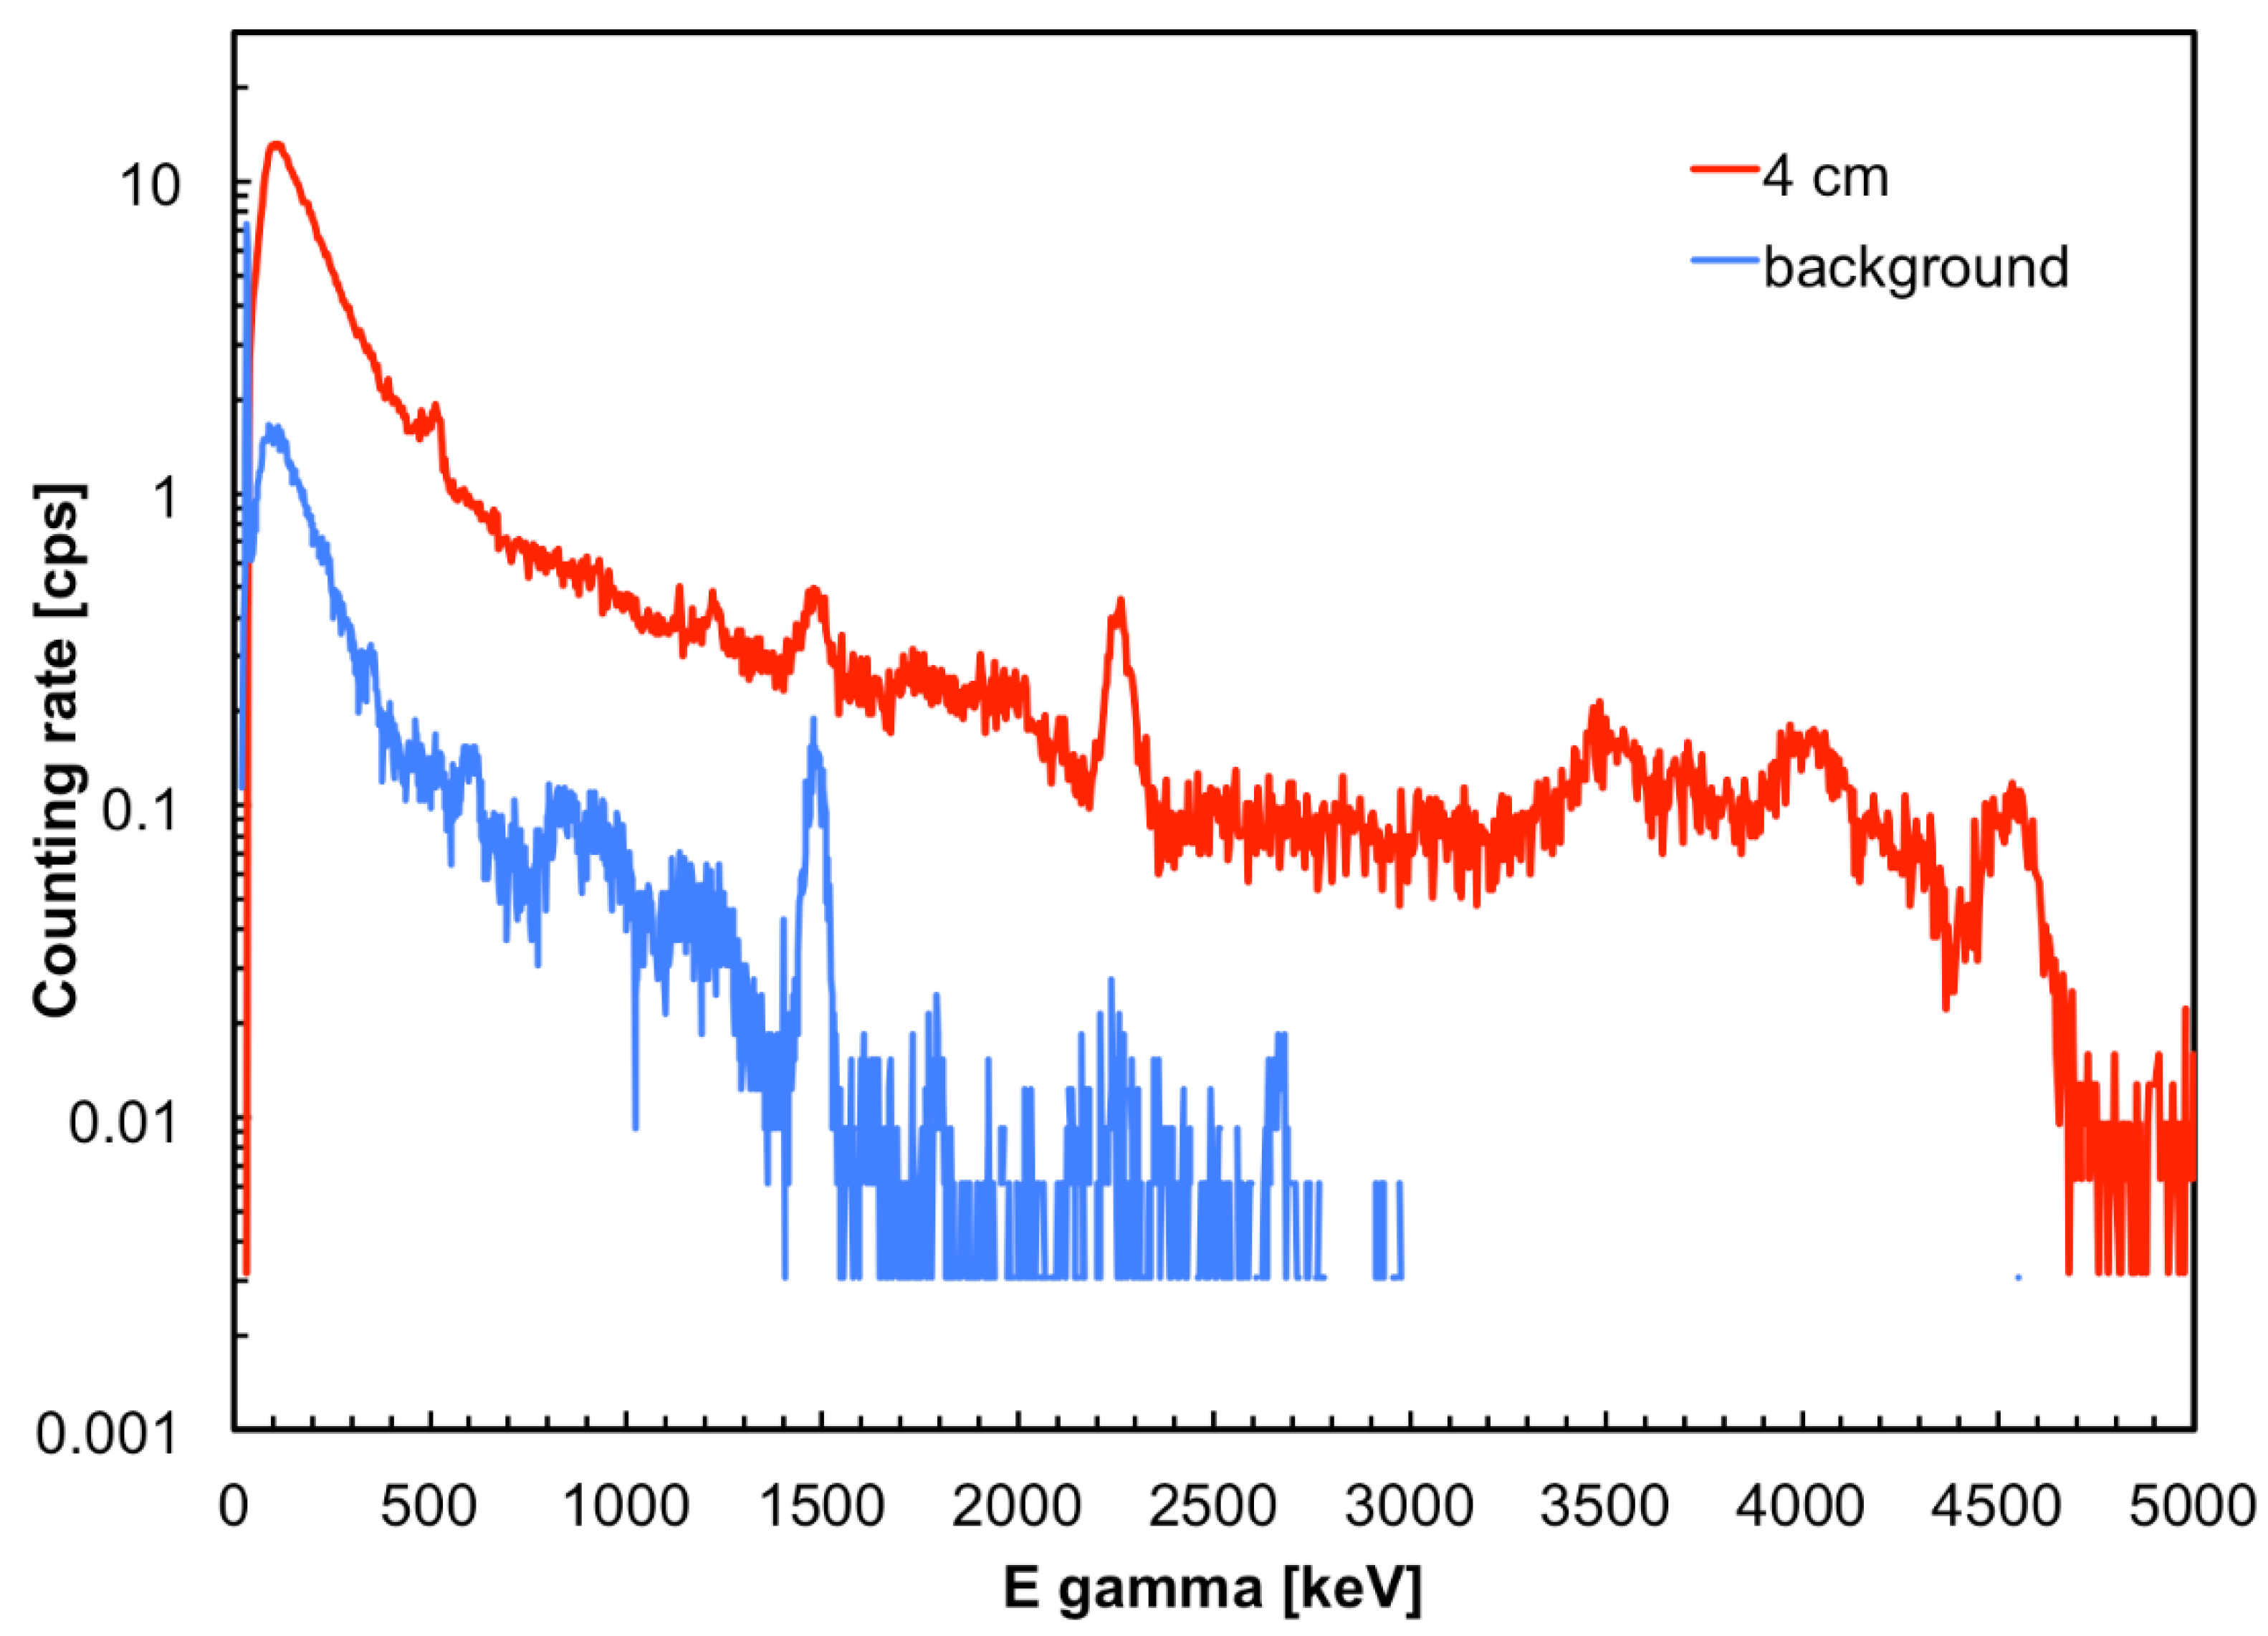
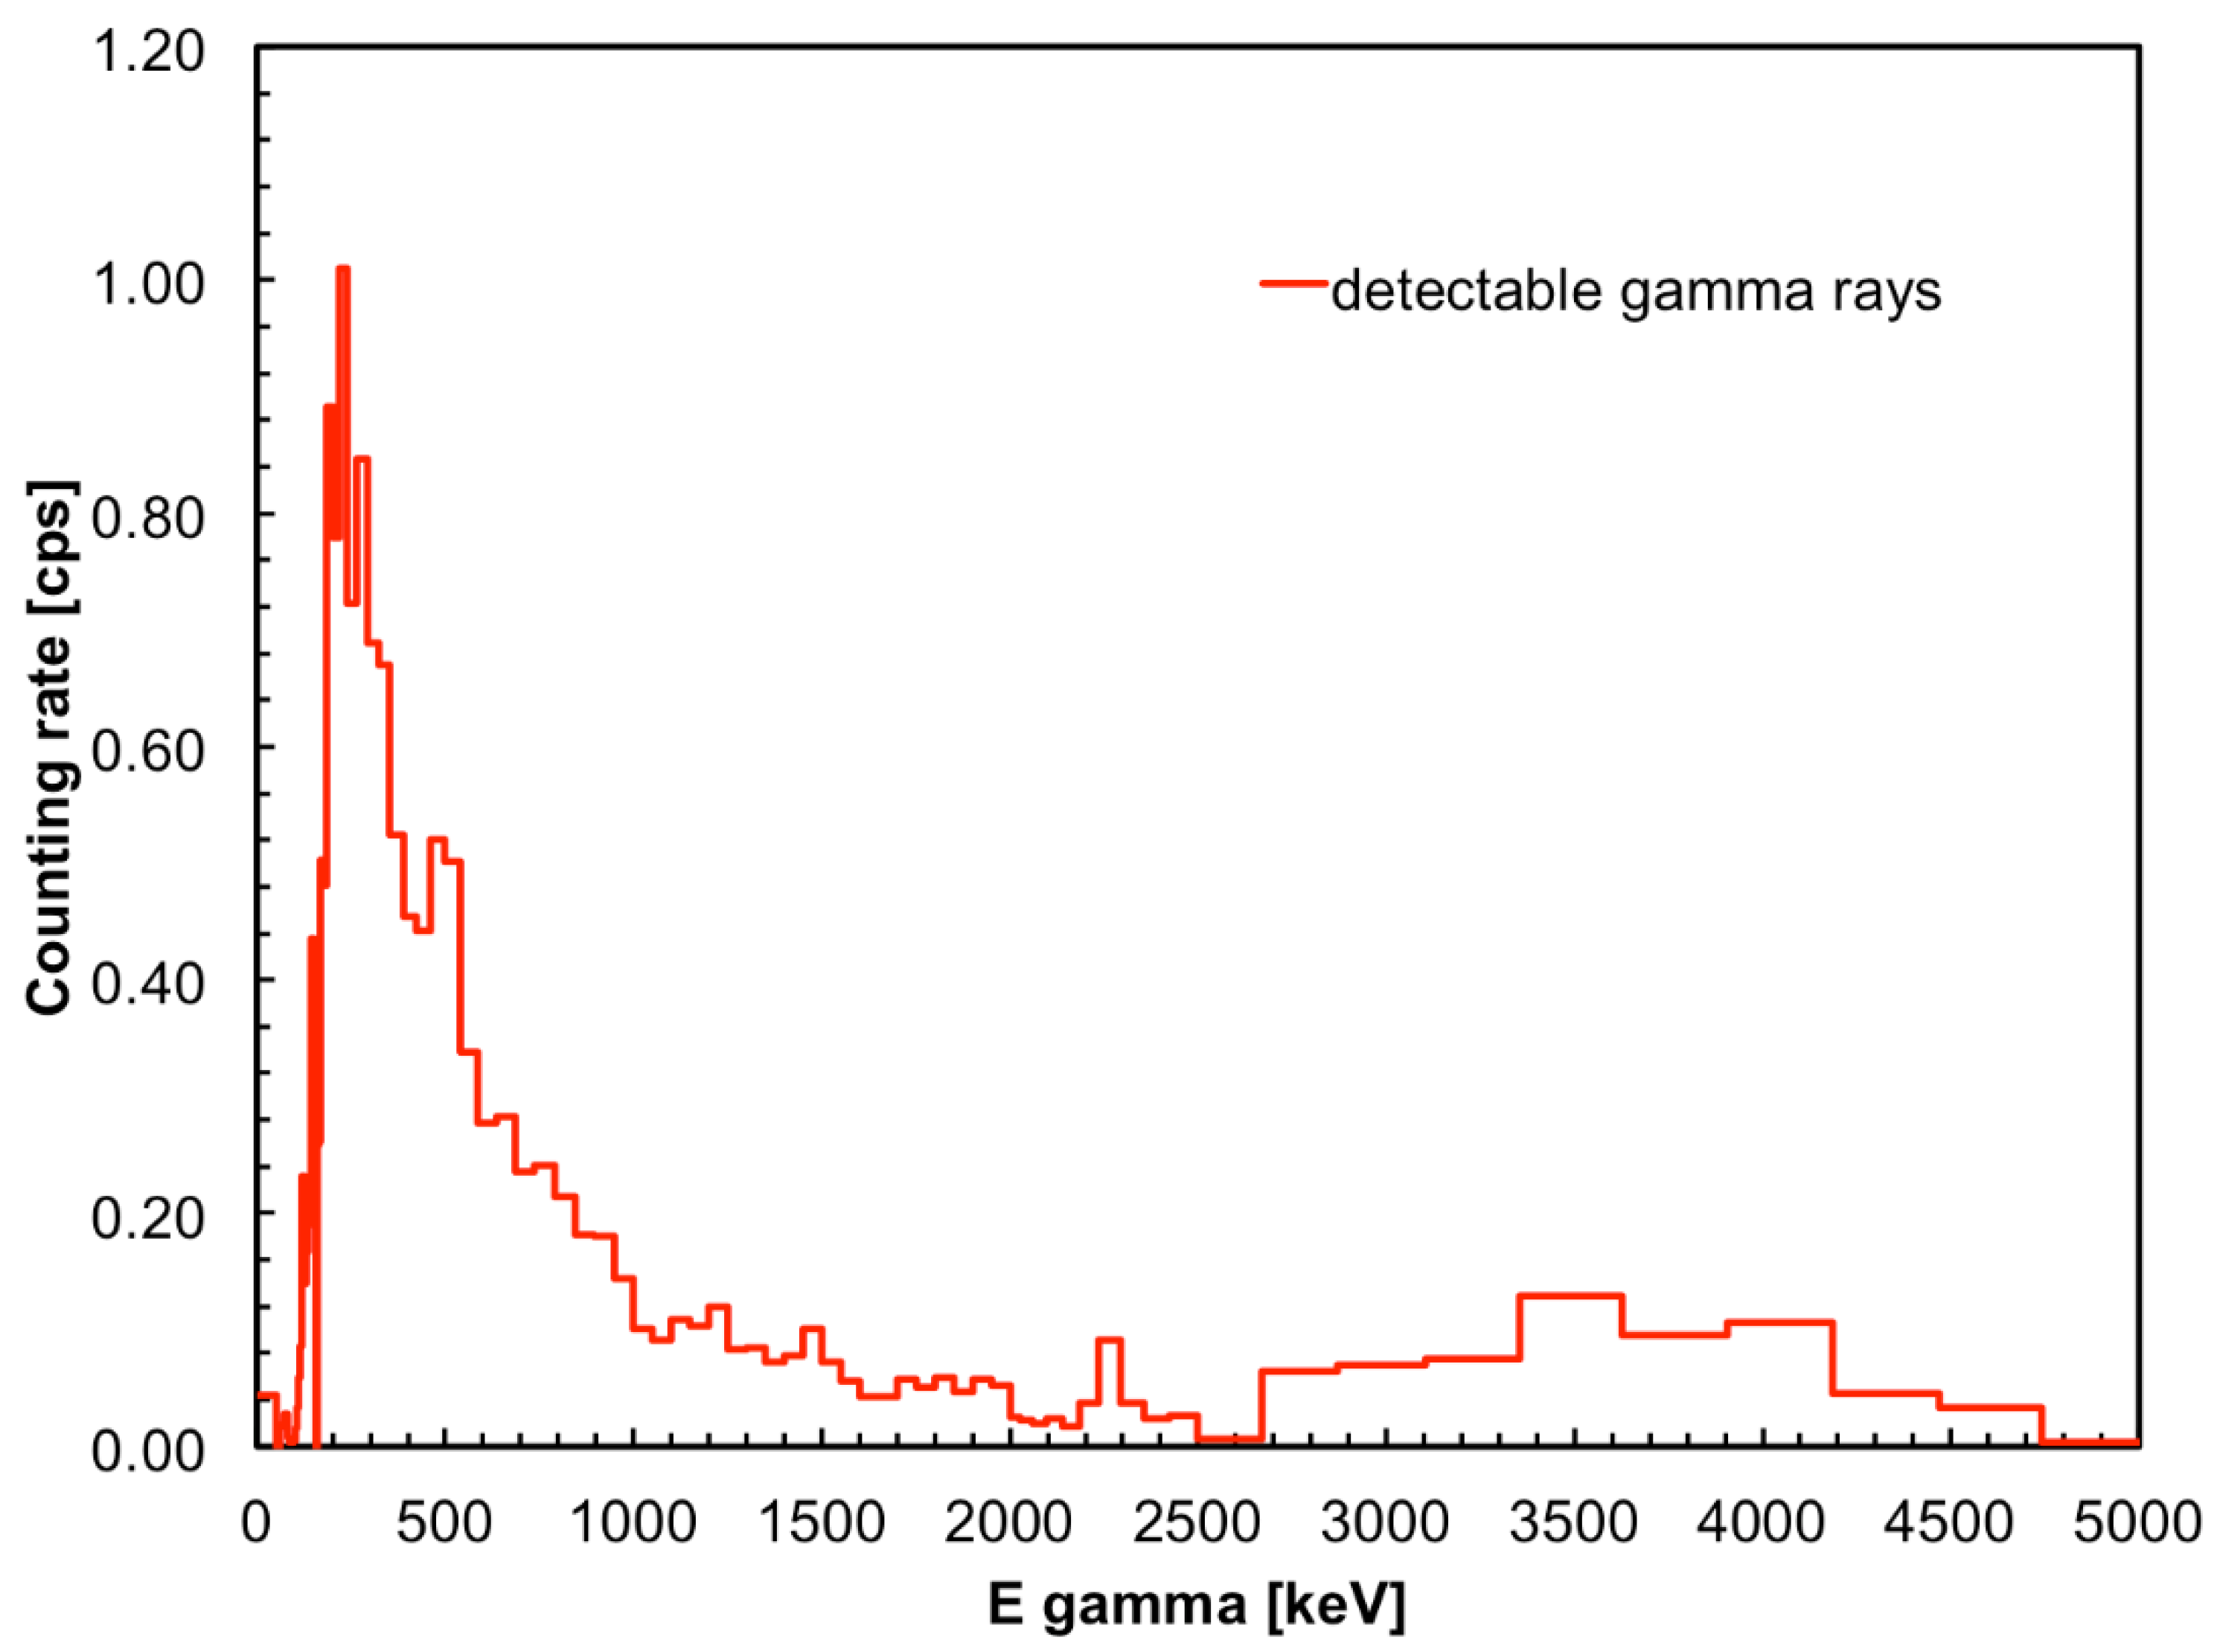
  • 59 keV from the decay of 241Am;
  • 478 keV from neutron capture in boron (component of the borated paraffin);
  • 511 keV from e+e− pair production followed by positron annihilation;
  • 2200 keV from neutron capture in hydrogen (component of paraffin and polyethylene);
  • 4438 keV from the 9Be(α,n)12C*;
  • a continuum due to the Compton scattering in the source assembly materials.
All the SciFi detectors were tested on top of the source box, and the measured counting rate, the background and the signal-to-background ratio are reported in Figure 17. For each detector we calculated the ratio between the observed counting rates respectively with the 137Cs and the AmBe sources. The results, plotted in Figure 18, indicate a quite reasonably constant behavior of this ratio.
The spectrum of the gamma-rays exiting the source box was measured at several distances by means of a cylindrical lanthanum bromide scintillator (LaBr3, in short LaBr), 3.8 cm diameter and 5 cm length, placed at mid-height with respect to the box. LaBr naturally contains about 0.09% of the 138La isotope, which is unstable and emits gamma-rays at 1435 keV, and also impurities of alpha emitters which produce counts around 2–3 MeV equivalent energy. The spectrum measured at 4 cm distance from the box wall is plotted in Figure 19, along with the environment background measured far from the source. For all the following evaluations the background spectrum was subtracted from the measurements.
The LaBr spectra were numerically convoluted with the simulated detection efficiency of the SciFi (Figure 3) and rescaled for the different active area, in order to estimate the counting rate on the SciFi detectors at several distances. In Figure 20 we reported as an example the spectrum of Figure 19 after background subtraction and folding with the SciFi efficiency. The integral of such a spectrum is the expected count rate on a SciFi at the same distance. The same measurements were performed using SciFi number 12, which has an average behavior (Figure 13, Figure 15 and Figure 17), and the net count rates, (i.e., background subtracted) were reported as a function of the distance in Figure 21, along with the corresponding equivalent data inferred from the LaBr measurements.
The data were fitted with the inverse squared distance function
f(x) = a/(x + d)2 + b,
where a is a scale constant, b is the background and the offset d is the distance between the box wall and the source inside. The fitting curves are also shown in Figure 21. Not surprisingly, the results, listed in Table 3, are mutually consistent as they exhibit a very close scale factor and a null background. As for the offset, we observe that the effective position of the source inside the box is not well known (the source cannot be easily handled due to safety restrictions because of its huge activity), and both values are realistic. However, such a difference arises from the different response at close distance from the box, due to the relevant shape difference between the two detectors.
A final test was performed by measuring the counting rate in 100 s for the SciFi detector n.12 in twenty-two positions, on top and around the AmBe source box as sketched in Figure 22. The measured count rates in the twenty-two positions are shown in Figure 23.

4. Discussion

In the previous sections we have shown that the SciFi detectors can fruitfully be employed to detect and count gamma-rays in a rather wide energy range. Indeed, by folding the spectra measured by a LaBr detector with the simulated SciFi detection efficiency, one obtains count rates in quite a reasonable agreement with the data measured by the SciFi detectors. Apart from very low energy, where the detection efficiency drops below 1%, in the energy range between 150 and 5000 keV it is between 1% and 2%. On the one hand this means that the total number of counts one obtains if assuming an intermediate efficiency value of ≈ 1.3% is reasonably correct. On the other hand, such a low detection efficiency ensures that the detector will not be saturated up to a high gamma flux. The equivalent dose rate in the configuration of Figure 12 is of the order of 0.6 µSv/h, with the count rate below 15 cps. A SciFi detector can easily withstand 105–106 cps, that would roughly correspond to an equivalent dose rate of the order of 4–40 mSv/h. These results prove that SciFi detectors can successfully be employed in the MICADO project in order to monitor radwaste drums in a storage site in the medium to long term.
An interesting exercise has been performed in such a framework, to investigate the possibility of monitoring a reference case of radwaste drum. Such a case consists of a Radioactive Waste Package assembly, enclosed in a standard 220-L drum (86 cm height, 57 cm diameter) with a PVC (poly(vynyl-chloride)) matrix. The drum, sketched in Figure 24. along with four SciFi detectors around it, is supposed to contain 60Co (55 kBq), 133Ba (5 kBq), 134Cs (2 kBq), 137Cs (2 kBq), 152Eu (132 kBq), 154Eu (10 kBq), 241Am (25 kBq). All of these isotopes are assumed to be dispersed in the matrix, and to give rise to an equivalent dose rate of 2.4 µSv/h at 1 cm [16].
We observed that the majority of the dose rate is due to 60Co and 152Eu, which have much higher activity and emit gamma-rays from 344 to 1330 keV. Assuming the same detection efficiency as in the case of 22Na (Equation (7) and Figure 11), the cps to equivalent dose rate coefficient is ≈1.18 (µSv/h) / cps, and vice versa the equivalent dose rate to cps coefficient is ≈0.85 cps/(µSv/h) [17]. This implies that the expected net count rate in a SciFi is of the order of 2.4 × 0.85 ≈ 2 cps, which has to be summed to the background count rate which should be of the same order of magnitude.
In one minute the statistical uncertainty of the measured counting rate would be better than 10%, and in ten minutes better than 3%. This means that any initial counting asymmetry between the four fibers is quickly appreciable, as well as any change that might occur due to internal displacement of the waste and/or deterioration of the drum. As for the radiation damage, we assume it is negligible for the scintillating fibers as, according to the test results reported in [18], they would not be affected even after a hundred years of exposure at their highest dose rate counting. Possible failures in the long term could likely be due to the SiPMs which, similarly to the fibers, withstand up to 100 Gy of 60Co gamma-rays, but are sensitive to high energy neutrons; an increase of about a factor 15 of the dark noise has been reported after 109 1 MeV neutrons/cm2 [19]. This means that, should the SciFi detectors be used in an environment with relevant high energy neutron fluxes, one could think of installing polyethylene shielding caps around the two detector ends.

5. Conclusions

The simulations, tests, and measurements that we have performed demonstrate that the SciFi technology is a good candidate for gamma radiation monitoring of radioactive waste. The 36 detectors that we built have a reasonably uniform behavior, in light of their robustness, low cost, and simple construction based on commercial components. We are now planning to test them soon in a real radwaste storage site in the framework of the MICADO project.

Author Contributions

conceptualization and supervision P.F.; detector design P.F., F.L., A.P., L.C.; detector construction F.L., A.P. and G.P.; test and measurements F.L., A.P., M.G., L.C. and P.F.; simulations S.L.M.; manuscript preparation P.F. All authors have read and agreed to the published version of the manuscript.

Funding

This work was funded within the framework of the European Union’s Horizon 2020 research and innovation program under grant agreement No 847641, project MICADO (Measurement and Instrumentation for Cleaning and Decommissioning Operations). This work was also supported by the Centro Siciliano di Fisica Nucleare e di Struttura della Materia [Grant 02/2019].

Data Availability Statement

The data presented in this study are available on request from the corresponding author.

Acknowledgments

We are grateful to Marco Ripani for the constant encouragement and for the initial support within the INFN-Energy program that allowed us to start the MICADO project.

Conflicts of Interest

The authors declare no conflict of interest.

References

  1. MICADO Project. Available online: https://www.micado-project.eu/ (accessed on 16 March 2021).
  2. Italy in MICADO WP7. (and Video at Minute 1:10). Available online: https://www.micado-project.eu/news/particles-of-italian-innovation-project/ (accessed on 30 March 2021).
  3. Cosentino, L.; Ducasse, Q.; Giuffrida, M.; Lo Meo, S.; Longhitano, F.; Marchetta, C.; Massara, A.; Pappalardo, P.; Passaro, G.; Russo, S.; et al. SiLiF Neutron Counters to Monitor Nuclear Materials in the MICADO Project. Sensors 2021, 21, 2630. [Google Scholar] [CrossRef]
  4. Finocchiaro, P. DMNR: A new concept for real-time online monitoring of short and medium term radioactive waste. In Radioactive Waste: Sources, Types and Management; Nova Science Publishers: New York, NY, USA, 2011; pp. 1–40. [Google Scholar]
  5. Finocchiaro, P. Radioactive Waste: A System for Online Monitoring and Data Availability. Nucl. Phys. News 2014, 24, 34. [Google Scholar]
  6. Cosentino, L.; Calì, C.; De Luca, G.; Guardo, G.; Litrico, P.; Pappalardo, A.; Piscopo, M.; Scirè, C.; Scirè, C.; Scirè, S.; et al. Real-Time Online Monitoring of Radwaste Storage: A Proof-of-Principle Test Prototype. IEEE Trans. Nucl. Sci. 2012, 59, 1426–1431. [Google Scholar] [CrossRef]
  7. Finocchiaro, P.; Ripani, M. Radioactive Waste Monitoring: Opportunities from New Technologies. In Proceedings of the IAEA International Conference on Physical Protection of Nuclear Material and Nuclear Facilities, IAEA-CN-254/117, Vienna, Austria, 13–17 November 2017. [Google Scholar]
  8. Saint Gobain Scintillating Fibers. Available online: https://www.crystals.saint-gobain.com/products/scintillating-fiber (accessed on 22 April 2021).
  9. Agostinelli, S.; Allison, J.; Amako, K.; Apostolakis, J.; Araujo, H.; Arce, P.; Asai, M.; Axen, D.; Banerjee, S.; Barrand, G.; et al. Geant4—A simulation toolkit. Nucl. Instrum. Methods Phys. Res. Sect. A 2003, 506, 250–303. [Google Scholar] [CrossRef] [Green Version]
  10. Finocchiaro, P.; Pappalardo, A.; Cosentino, L.; Belluso, M.; Billotta, S.; Bonanno, G.; Carbone, B.; Condorelli, G.; Di Mauro, S.; Fallica, G.; et al. Characterization of a Novel 100-Channel Silicon Photomultiplier—Part I: Noise. IEEE Trans. Electron Devices 2008, 55, 2757. [Google Scholar] [CrossRef]
  11. Finocchiaro, P.; Pappalardo, A.; Cosentino, L.; Belluso, M.; Billotta, S.; Bonanno, G.; Carbone, B.; Condorelli, G.; Di Mauro, S.; Fallica, G.; et al. Characterization of a Novel 100-Channel Silicon Photomultiplier—Part II: Charge and Time. IEEE Trans. Electron Devices 2008, 55, 2765. [Google Scholar] [CrossRef]
  12. Dolgoshein, B.; Balagura, V.; Buzhan, P.; Danilov, M.; Filatov, L.; Garutti, E.; Groll, M.; Ilyin, A.; Kantserova, V.; Kaplin, V.; et al. Status report on silicon photomultiplier development and its applications. Nucl. Instrum. Meth. A 2006, 563, 368. [Google Scholar] [CrossRef] [Green Version]
  13. Zappa, F.; Tisa, S.; Tosi, A.; Cova, S. Principles and features of single-photon avalanche diode arrays. Sens. Actuators A 2007, 140, 103. [Google Scholar] [CrossRef]
  14. ON Semiconductor. Available online: https://www.onsemi.com/products/sensors/silicon-photomultipliers-sipm (accessed on 22 April 2021).
  15. The NIST Data Base. Available online: https://physics.nist.gov/ (accessed on 26 April 2021).
  16. Mekhalfa, Z.; Orano, France. MICADO Project. Internal Communication, 2020. [Google Scholar]
  17. RadPro Calculator. Available online: http://www.radprocalculator.com/Gamma.aspx (accessed on 28 April 2021).
  18. Acosta, D.; DeSalvo, R.; Hartjes, F.G.; Henriques, A.; Linssen, L.; Maio, A.; Ong, B.; Paar, H.P.; Pereira, M.; Scheel, C.V.; et al. Effects of radiation damage on scintillating fibre calorimetry. Nucl. Instrum. Meth. B 1991, 62, 116. [Google Scholar] [CrossRef] [Green Version]
  19. Garutti, E.; Musienko, Y. Radiation damage of SiPMs. Nucl. Instrum. Methods Phys. Res. Sect. A 2019, 926, 69. [Google Scholar] [CrossRef] [Green Version]
Figure 1. A possible arrangement of radwaste packages where monitor sensors are installed.
Instruments 05 00019 g001
Figure 2. Simulation of the average energy deposited in a 3 mm diameter fiber as a function of the impinging gamma-ray energy (threshold at 50 keV). The lines are spline interpolations.
Instruments 05 00019 g002
Figure 3. Simulation of the intrinsic detection efficiency of a 3 mm diameter fiber for several values of the impinging gamma-ray energy (threshold at 50 keV). The lines are spline interpolations.
Instruments 05 00019 g003
Figure 4. Red line: Typical SiPM staircase plot, obtained by reporting the noise counting rate as a function of the threshold. The final chosen threshold was 175 mV, i.e., 3.5 photons. Blue line: same plot with the SiPMs coincidence signal from a SciFi detector. The constant background above the threshold is physical from cosmic rays and environmental radiation. The error bars are within the symbols.
Instruments 05 00019 g004
Figure 5. Detection efficiency of a gamma-ray as a function of the impact position on an 80 cm long fiber, calculated as the product of the probabilities of getting at least four photons detected on each SiPM. (a) When the gamma-ray deposits 100 keV. (b) When the gamma-ray deposits 200 keV.
Instruments 05 00019 g005
Figure 6. Detection efficiency of a gamma-ray as a function of the impact position on a 120 cm long fiber, calculated as the product of the probabilities of getting at least four photons detected on each SiPM. (a) When the gamma-ray deposits 100 keV. (b) When the gamma-ray deposits 200 keV.
Instruments 05 00019 g006
Figure 7. Detection efficiency of a gamma-ray as a function of the impact position on a 300 cm long fiber, calculated as the product of the probabilities of getting at least four photons detected on each SiPM. (a) When the gamma-ray deposits 100 keV. (b) When the gamma-ray deposits 200 keV.
Instruments 05 00019 g007
Figure 8. (a) Sketch of the components of the SciFi detector assembly. (b) A fiber holder with the SiPM PCB in place. (c) A detector fully assembled. (d) A 3 mm diameter fiber.
Instruments 05 00019 g008aInstruments 05 00019 g008b
Figure 9. Attenuation of gamma-rays in 1 mm aluminum as a function of the energy [15].
Instruments 05 00019 g009
Figure 10. Sketch of the electronic setup for the SciFi detector.
Instruments 05 00019 g010
Figure 11. The observed count rate as function of the distance between the point-like 22Na source and the 3 mm diameter fiber. Additionally shown is a 1/r fit.
Instruments 05 00019 g011
Figure 12. Measurement setup with a point-like 1.49 Mbq 137Cs gamma source and a detector holder. The distance between the source and the mid-point of the fiber was d = 52 cm.
Instruments 05 00019 g012
Figure 13. The counting rate of the 36 SciFi detectors, measured with the 137Cs source in 200 s in the setup of Figure 12, along with the background rate and the signal-to-background ratio. The error bars represent the statistical uncertainty, the green dashed lines indicate ±1 standard deviations from the average.
Instruments 05 00019 g013
Figure 14. Sketch for the calculation of the geometrical efficiency of the SciFi detector in the setup of Figure 12.
Instruments 05 00019 g014
Figure 15. Measured detection efficiency with 662 keV gamma-rays from the 137Cs source. The error bars represent the statistical uncertainty; the blue dashed line is the average efficiency; the green dotted lines indicate ±1 standard deviations from the average.
Instruments 05 00019 g015
Figure 16. The AmBe neutron and gamma source enclosed in a 95 × 75 × 85 cm3 iron box along with its moderator. A SciFi detector in one of the measurement positions is also shown.
Instruments 05 00019 g016
Figure 17. The counting rate of the 36 SciFi detectors, measured on top of the AmBe source in 100 s, along with the background rate and the signal-to-background ratio. The error bars represent the statistical uncertainty, the green dashed lines indicate ±1 standard deviations from the average.
Instruments 05 00019 g017
Figure 18. Ratio between the observed counting rates respectively with the 137Cs and the AmBe sources. The results indicate a reasonably constant behavior. The error bars represent the statistical uncertainty; the blue dashed line is the average ratio; the green dotted lines indicate ±1 standard deviations from the average.
Instruments 05 00019 g018
Figure 19. Energy spectrum of the gamma-rays emerging from the source box at 4 cm distance, and of the environment background.
Instruments 05 00019 g019
Figure 20. The LaBr spectrum at 4 cm of Figure 19 after background subtraction and folding with the SciFi efficiency. The integral of this spectrum represents the expected SciFi count rate.
Instruments 05 00019 g020
Figure 21. Net count rate as a function of the distance from the source wall, for the SciFi n.12 and the LaBr detectors. A data fit is also shown and the fit coefficients are listed in Table 3.
Instruments 05 00019 g021
Figure 22. Sketch of the twenty-two positions on top and around the AmBe source box where the measurements with the SciFi detector were performed. The projection of the source position on the top plane is shown and the exact value of d is not known.
Instruments 05 00019 g022
Figure 23. Count rates (cps) of the SciFi n.12 in the twenty-two positions on top and around the AmBe source box sketched in Figure 22.
Instruments 05 00019 g023
Figure 24. Sketch of the simulated radwaste package with four SciFi detectors around it.
Instruments 05 00019 g024
Table 1. Characteristics of the chosen scintillating fiber as reported by the manufacturer.
Fiber Type Emission Peak, nmDecay Time, nsLight Yield (# Photons per MeV)Trapping EfficiencyAttenuation Length m
BCF-204922.7~8000≈6% on each side3.3
Table 2. Main characteristics of the MicroFC-30035-SMT SiPM.
Sensor SizeMicrocell SizeNumber of MicrocellsBreakdown VoltageOvervoltagePDE at 420 nmPDE at 500 nm
3 × 3 mm235 µm477424.5 V2.5 V30%20%
Table 3. Results of an inverse squared distance fit to the SciFi and LaBr count rates as a function of the distance from the source wall.
a (Scale Constant)b (Background)d (Source Position Offset)
SciFi9.73 cps·m20.00 cps0.57 m
LaBr9.44 cps·m20.00 cps0.47 m
Publisher’s Note: MDPI stays neutral with regard to jurisdictional claims in published maps and institutional affiliations.

