A UAV-Based Thermal-Imaging Approach for the Monitoring of Urban Landfills


1
Dipartimento di Ingegneria Meccanica, Energetica, Gestionale e dei Trasporti (DIME), Università degli Studi di Genova, 16145 Genoa, Italy
2
Dipartimento di Ingegneria Dell’informazione, Elettronica e Telecomunicazioni (DIET), Università di Roma La Sapienza, 00184 Rome, Italy
3
OBEN srl, 07100 Sassari, Italy
4
KIM-RemoteSensing GmbH, 9020 Klagenfurt am Wörthersee, Austria
*
Author to whom correspondence should be addressed.
Inventions 2020, 5(4), 55; https://0-doi-org.brum.beds.ac.uk/10.3390/inventions5040055
Submission received: 18 September 2020
/
Revised: 5 November 2020
/
Accepted: 6 November 2020
/
Published: 9 November 2020
(This article belongs to the Special Issue Biofuels and Bioplastics in Sustainable Development)
Abstract
:The monitoring of waste disposal sites is important in order to minimize leakages of biogas, produced by anaerobic digestion and potentially explosive and detrimental to the environment. In this research, thermal imaging from unmanned aerial vehicles (UAVs) has been proposed as a diagnostic tool to monitor urban landfills. Since the anaerobic decomposition produces heat along with biogas, thermal anomalies recorded over the soil are likely to be associated with local biogas escaping from the landfill terrain and leaving a local thermal print. A simple and novel approach, based only on the processing of thermal maps gathered by the remote sensing surveys, has been proposed for the estimation of the fugitive methane emissions from landfills. Two case studies, concerning two Italian landfills, have been presented. For one of them (Mount Scarpino, Genoa), significant thermal anomalies were identified during several UAV flights and the relevant thermal images processed to obtain a rough estimation of the associated methane leakages. For the second landfill (Scala Erre, Sassari), the thermal map did not reveal any anomaly attributable to local biogas emission. Despite some limitations outlined in the paper, the present approach is proposed as an innovative method to identify significant biogas leakages from an urban landfill and to provide a preliminary evaluation of the methane production potential.
1. Introduction
The recent urbanization and industrialization of towns have led to a progressive increase in the number of municipal solid waste (MSW) disposals. That is why the problem of effective projecting, managing, and monitoring of MSW landfills is very important today. The degradation of landfilled organic waste inevitably generates biogas, mainly methane and carbon dioxide. Landfill biogas continues to form until the majority of the organic material has been degraded, which can take several decades. Few landfills are thought to recover more than 60% of the available gas [1]; even when collecting systems are properly installed, the rest escapes to the atmosphere. Leakage of landfill gas has adverse consequences both at global and local scales. Since methane is a potent greenhouse gas, its emission from landfills contributes to climate change; on the other hand, biogas leakages also impact on the surrounding environment (risks of fire or explosions, detrimental effects on human health and vegetation). For these reasons, uncontrolled biogas emissions have to be detected and controlled.
Since the landfill biogas is a product of an exothermic process, the biogas is warmer than the surrounding soil and its migration to the surface is expected to leave a thermal print on the landfill surface. As a consequence, biogas emissions can potentially be seen as thermal anomalies whose detection may lead to the identification of spots suspected of biogas leakages.
The common screening tools in use today to detect biogas leaks are ground-based and employ different kinds of gas sensors; this practice is very time-consuming and labour-intensive, as landfills are often several hectares in area and not always easily accessible. Alternative techniques such as the mobile tracer dispersion method can be used to quantify total methane emissions from landfills [2,3], but no information about specific emission spots is provided. In recent years, infrared (IR) thermography has been employed as a screening tool of hotspots potentially associated with biogas emission; some examples of applications in landfills through handheld IR images are provided in [1,4,5].
The development of remote sensing technology has increased the capability of thermal infrared imagery to detect landfill gas leakages, as large areas can be surveyed in a relatively short time and with low associated costs. Remote sensing methods are often based on satellite or airborne data, which often have the disadvantage that the resolution in the image is too low to cover the high spatial resolution necessary to detect landfill gas emissions [6,7,8]. A flexible screening tool that conjugates acceptable levels of spatial resolution, biogas emission localization, and eventually a rough estimate of biogas leakages is based on the use of IR cameras mounted on unmanned aerial vehicles (UAVs). This technique has been recently employed for inspection of thermal anomalies related to biogas emissions in landfills [9,10]. As outlined in the review paper by Mønster et al. [11], the UAV-based infrared survey of waste disposal sites has the great advantage to be rapid and simple to deploy in the field, and relatively inexpensive (depending on the scale and complexity of the field measurement program). The temperature contrast between the soil surface and the ambient air has to be maximized to obtain the best results from thermal imaging: for this reason, thermal images should be captured during the night-time or in the early morning, before sunrise, and possibly in the winter season [1,11]. Soil-to-ambient air temperature differences are also attenuated in windy conditions (due to the increased convective heat transfer from the soil to the atmosphere), which may also constitute an impediment to UAV flight. Moreover, detected thermal anomalies may be due to processes other than the emission of warm landfill gas, e.g., microbial processes (respiration or methane oxidation), or variability in the emissivity of different surfaces (presence of vegetation and different types of soil), potentially causing sampling bias [11].
Once suitable conditions for UAV thermal imaging have been established and thermal anomalies not clearly associated with emission hotspots have been discarded, in principle the methane flow rate migrating from the soil to the surrounding environment can be calculated from a steady-state energy balance, provided that the thermal map of the surface is properly acquired by the IR camera. In this work, a simple and innovative procedure for the calculation of methane emission flow rate, based on remote sensing thermal imaging, is presented and applied to measurements performed in urban landfills.
2. Materials and Methods
One important issue in the management of a landfill is the detection of gas leakages and their effective rectification. The approach described in this study is based on the following steps: (i) UAV-based thermal camera inspections to identify hot spots at the soil surface, (ii) post-processing of thermal data in order to reconstruct the surface temperature map, with the calculation of the average temperature over selected areas of specific interest, (iii) identification of spots that could falsely be identified as landfill gas leaks, (iv) application of a heat balance for selected areas where the recorded average surface temperature exceeds, by a given amount, the undisturbed soil temperature in order to estimate the associated methane flow rate leaving the surface, (v) repetition of the whole activity (i−iv) under different weather and seasonal conditions to validate the observed biogas emissions and to assess their changes over time and for different atmospheric conditions.
The first step (i) is usually preceded by the identification of the landfill areas to inspect: the whole landfill if its surface can be investigated by a single UAV flight plan or, in case of very large landfills, the parts where suspected gas leaks were reported. Step (iii) is accomplished by the aerial observation of the suspected area, through a visible camera synchronized with the IR camera (to identify ground objects appearing as anomalies but with no connections with gas leakages) or by an in-situ inspection (to verify the presence of odor and/or definitely confirm or exclude the occurrence of gas leakage using a portable gas analyzer). Since the exclusion of areas classified as falsely related to biogas emissions is delegated to the operator on the basis of his/her experience, this step is particularly delicate and can be regarded as a limitation of the procedure. What distinguishes the present approach from a qualitative observational method is the correlation between the landfill surface temperature and the produced biogas flow rate (step iv), outlined by a heat balance at the emission surface, as described in detail in Section 2.1. The heat-balance-derived quantitative biogas estimation is supposed to be reliable over areas reporting an average surface temperature exceeding by at least 3 K the undisturbed soil temperature. This temperature difference threshold has been estimated as significant since it typically corresponds to an estimated gas flow rate larger than the minimum value that can be associated with thermal anomalies [10].
The proposed methodology has been applied to two distinct landfills, termed test site No.1 and No. 2, located in northern Italy (Genoa) and in Sardinia island, respectively. The description of the landfill sites is provided in Section 2.2 and Section 2.3.
2.1. Estimation of Methane Emissions from Thermal Anomalies
The biogas generation is accompanied by a release of heat, which is expected to be transferred to the environment mainly by radiation and convection. According to a steady-state energy balance applied to the soil surface, the heat transfer rate Q [W] from the soil surface to the surroundings includes the radiative and convective components, as follows
where Tw [K], Tsurr [K], and Tair [K] are the temperatures of the soil surface, the surroundings, and the ambient air, respectively, σ (=5.67 ×10⁻⁸ W/m2·K4) is the Stefan-Boltzmann constant, ε is the total hemispherical emissivity of the soil, h [W/ m2 ·K] is the convective heat transfer coefficient, and A [m2] is the soil surface area.
Q = σ ε A (Tw4 − Tsurr4) + h A (Tw − Tair)
Without any significant biogas leakage, Equation (1) can be rewritten by considering, for the surface temperature, the undisturbed soil temperature Tw,ref [K]
where Qref is the heat transfer rate solely due to the natural (i.e., unaffected by the biogas presence) temperature difference between the soil surface and the environment.
Qref = σ ε A (Tw,ref4 − Tsurr4) + h A (Tw,ref − Tair)
The thermal power Qnet associated with the biogas production can be obtained by combining Equations (1) and (2)
Qnet = Q – Qref = σ ε A (Tw4 − Tw,ref4) + h A (Tw − Tw,ref)
An empirical equation [12], which takes into account the effect of wind, can be used for the convective heat transfer coefficient h [W/ m2 ·K]
where V is the wind velocity [m/s].
h = 5.7 + 3.8 V
With the soil emissivity ε assumed to be constant and equal to 0.95, Qnet results to be a function of the heat transfer surface area A and the soil surface temperatures Tw and Tw,ref, which are measured by the IR camera. The estimation of the methane flow rate leaving the soil surface can be obtained by dividing the thermal power Qnet by the heat released during the methane generation (7325 kJ/m3, [13]).
The methane flow rate obtained from the above procedure is just a rough or preliminary estimation due to the limiting assumptions done in Equations (1)−(3); one advantage of this calculation method is that no direct measurements of biogas flowrate are involved unless more accurate measurements are required. It is worth noting that many ground-based sensors (e.g., surface flux chambers) have to be employed for data accuracy, with markedly larger costs and execution times. Limitations include the possible unsteadiness of surface temperature induced by weather conditions, the effects of uneven material properties that change surface emissivity and thermal conductivity, the difficulty to recognize small gas leakages flowing through long pathways to reach the surface.
2.2. Test Site No. 1: Mount Scarpino, Genoa, Italy
The first investigated site is the landfill of Mount Scarpino, located in Genoa, northern Italy, which covers an area of about 58 hectares. This site, one of the widest European mountain landfills, received the solid waste of the municipality of Genoa and its province for over forty years; since October 2014 the site has ceased the waste collection due to the unavailability of new authorized spaces.
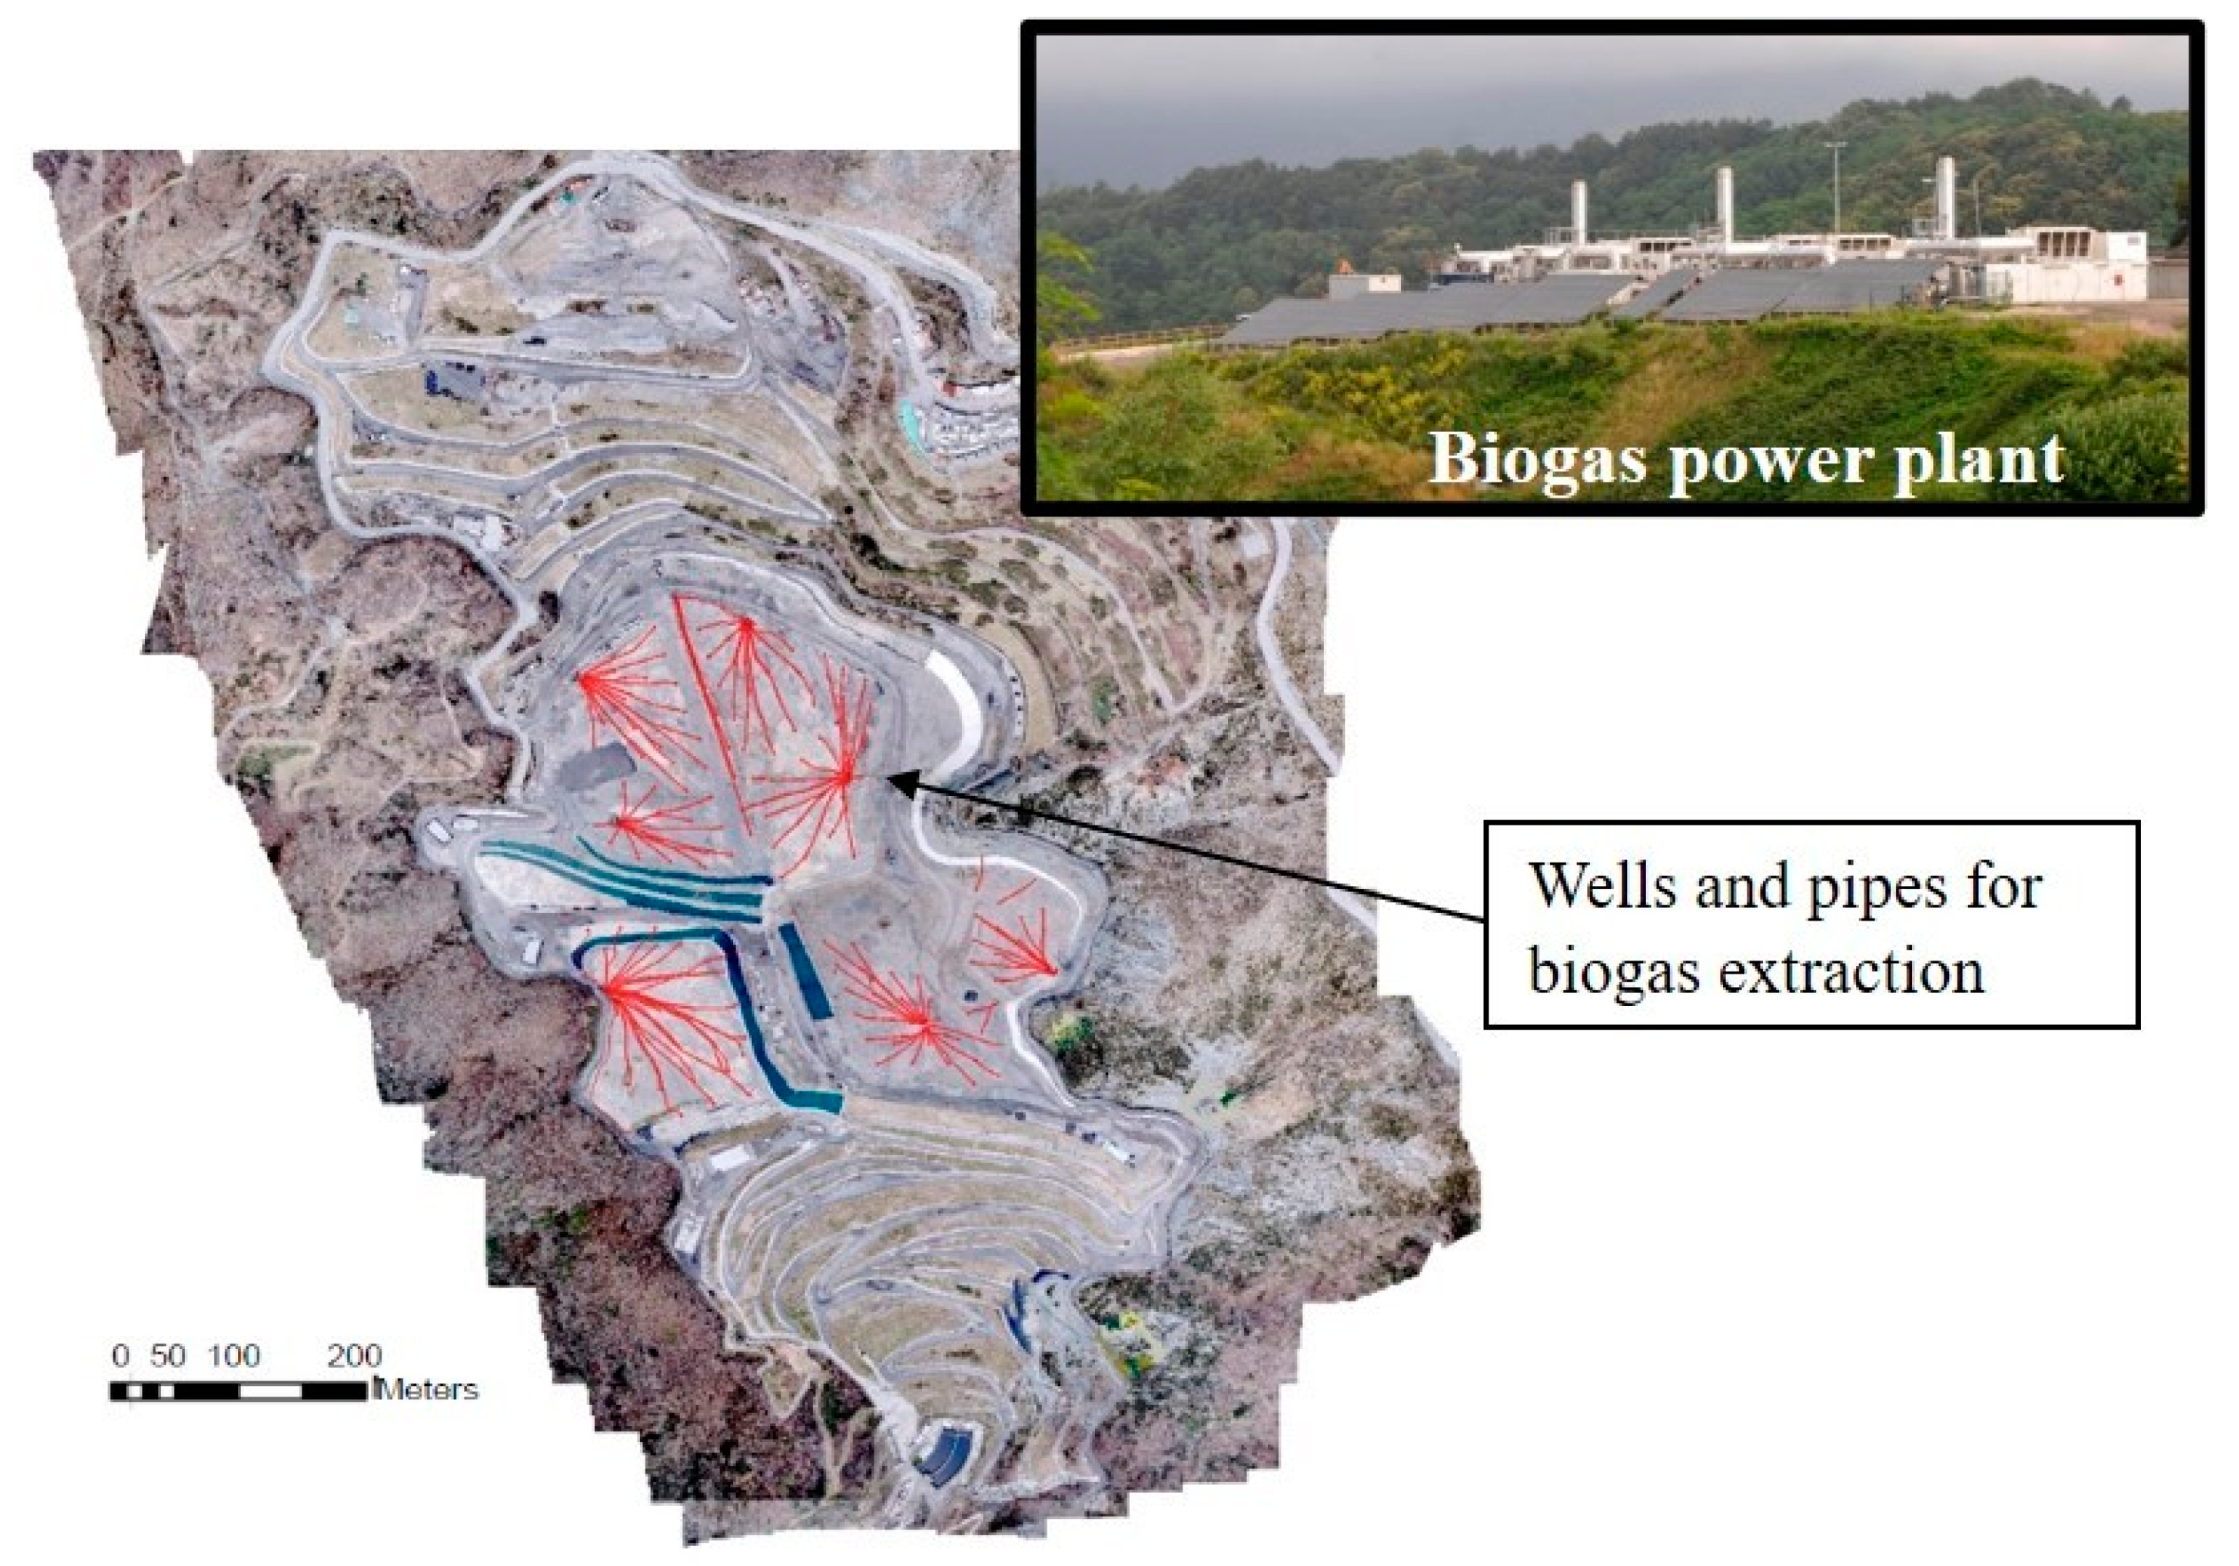
Figure 1 shows an aerial image of the investigated landfill and the distribution network of wells and pipes (highlighted with red lines) for the extraction of biogas which feeds an onsite power plant (pictured in the inset of the figure) still operating after the closure of the site. The biogas (with methane concentration at 50% by volume) extracted from this site is about 50 × 106 m3 per year, giving rise to an electrical energy production of about 65 × 106 kWh per year. The investigation was conducted using two different IR cameras, namely FLIR T460, Flir Systems, Inc., Wilsonville, OR, USA (320 × 240 pixels, temperature sensitivity: 30 mK) and FLUKE Ti 300, Fluke Corporation, Everett, WA, USA (240 × 180 pixels, temperature sensitivity: 50 mK). Dedicated software programs (Flir Reporter Professional©, Flir Systems, Inc. and SmartView©, Fluke Corporation, depending on the type of IR camera employed) were used to process the experimental data. For this activity, a multirotor UAV has been specifically built in order to fit the size and weight of sensors and kind of mission (flight plan, batteries endurance, reliability). The flights were performed at 70 m above ground level, over the peripheral areas of the landfill, not interested in biogas extraction and more suspected, according to the site manager, of biogas leakages. For a given survey, about 1500 visible (RGB) and IR images were acquired and processed, with a spatial resolution of thermal images of about 10 cm/pixel.
Several UAV-based surveys were conducted over a period from February 2015 to March 2016 to cover different atmospheric conditions and to appraise possible seasonal variability of the emissions. In particular, two early-morning flights were performed on one day of February 2015 and one day of August 2015 (both with clear sky), while two late-evening flights (without solar radiation) took place on different days of March 2016. The air temperature recorded during each survey campaign was 10°C (February 2015), 23°C (August 2015), and in the 2−6 °C range (3 and 7 March 2016); for all cases, the wind was moderate (typically 5 m/s or less) and the terrain was dry, except for one of the flights performed in March 2016, when the site was wet and muddy in some spots.
2.3. Test Site No. 2: Scala Erre, Sassari, Italy
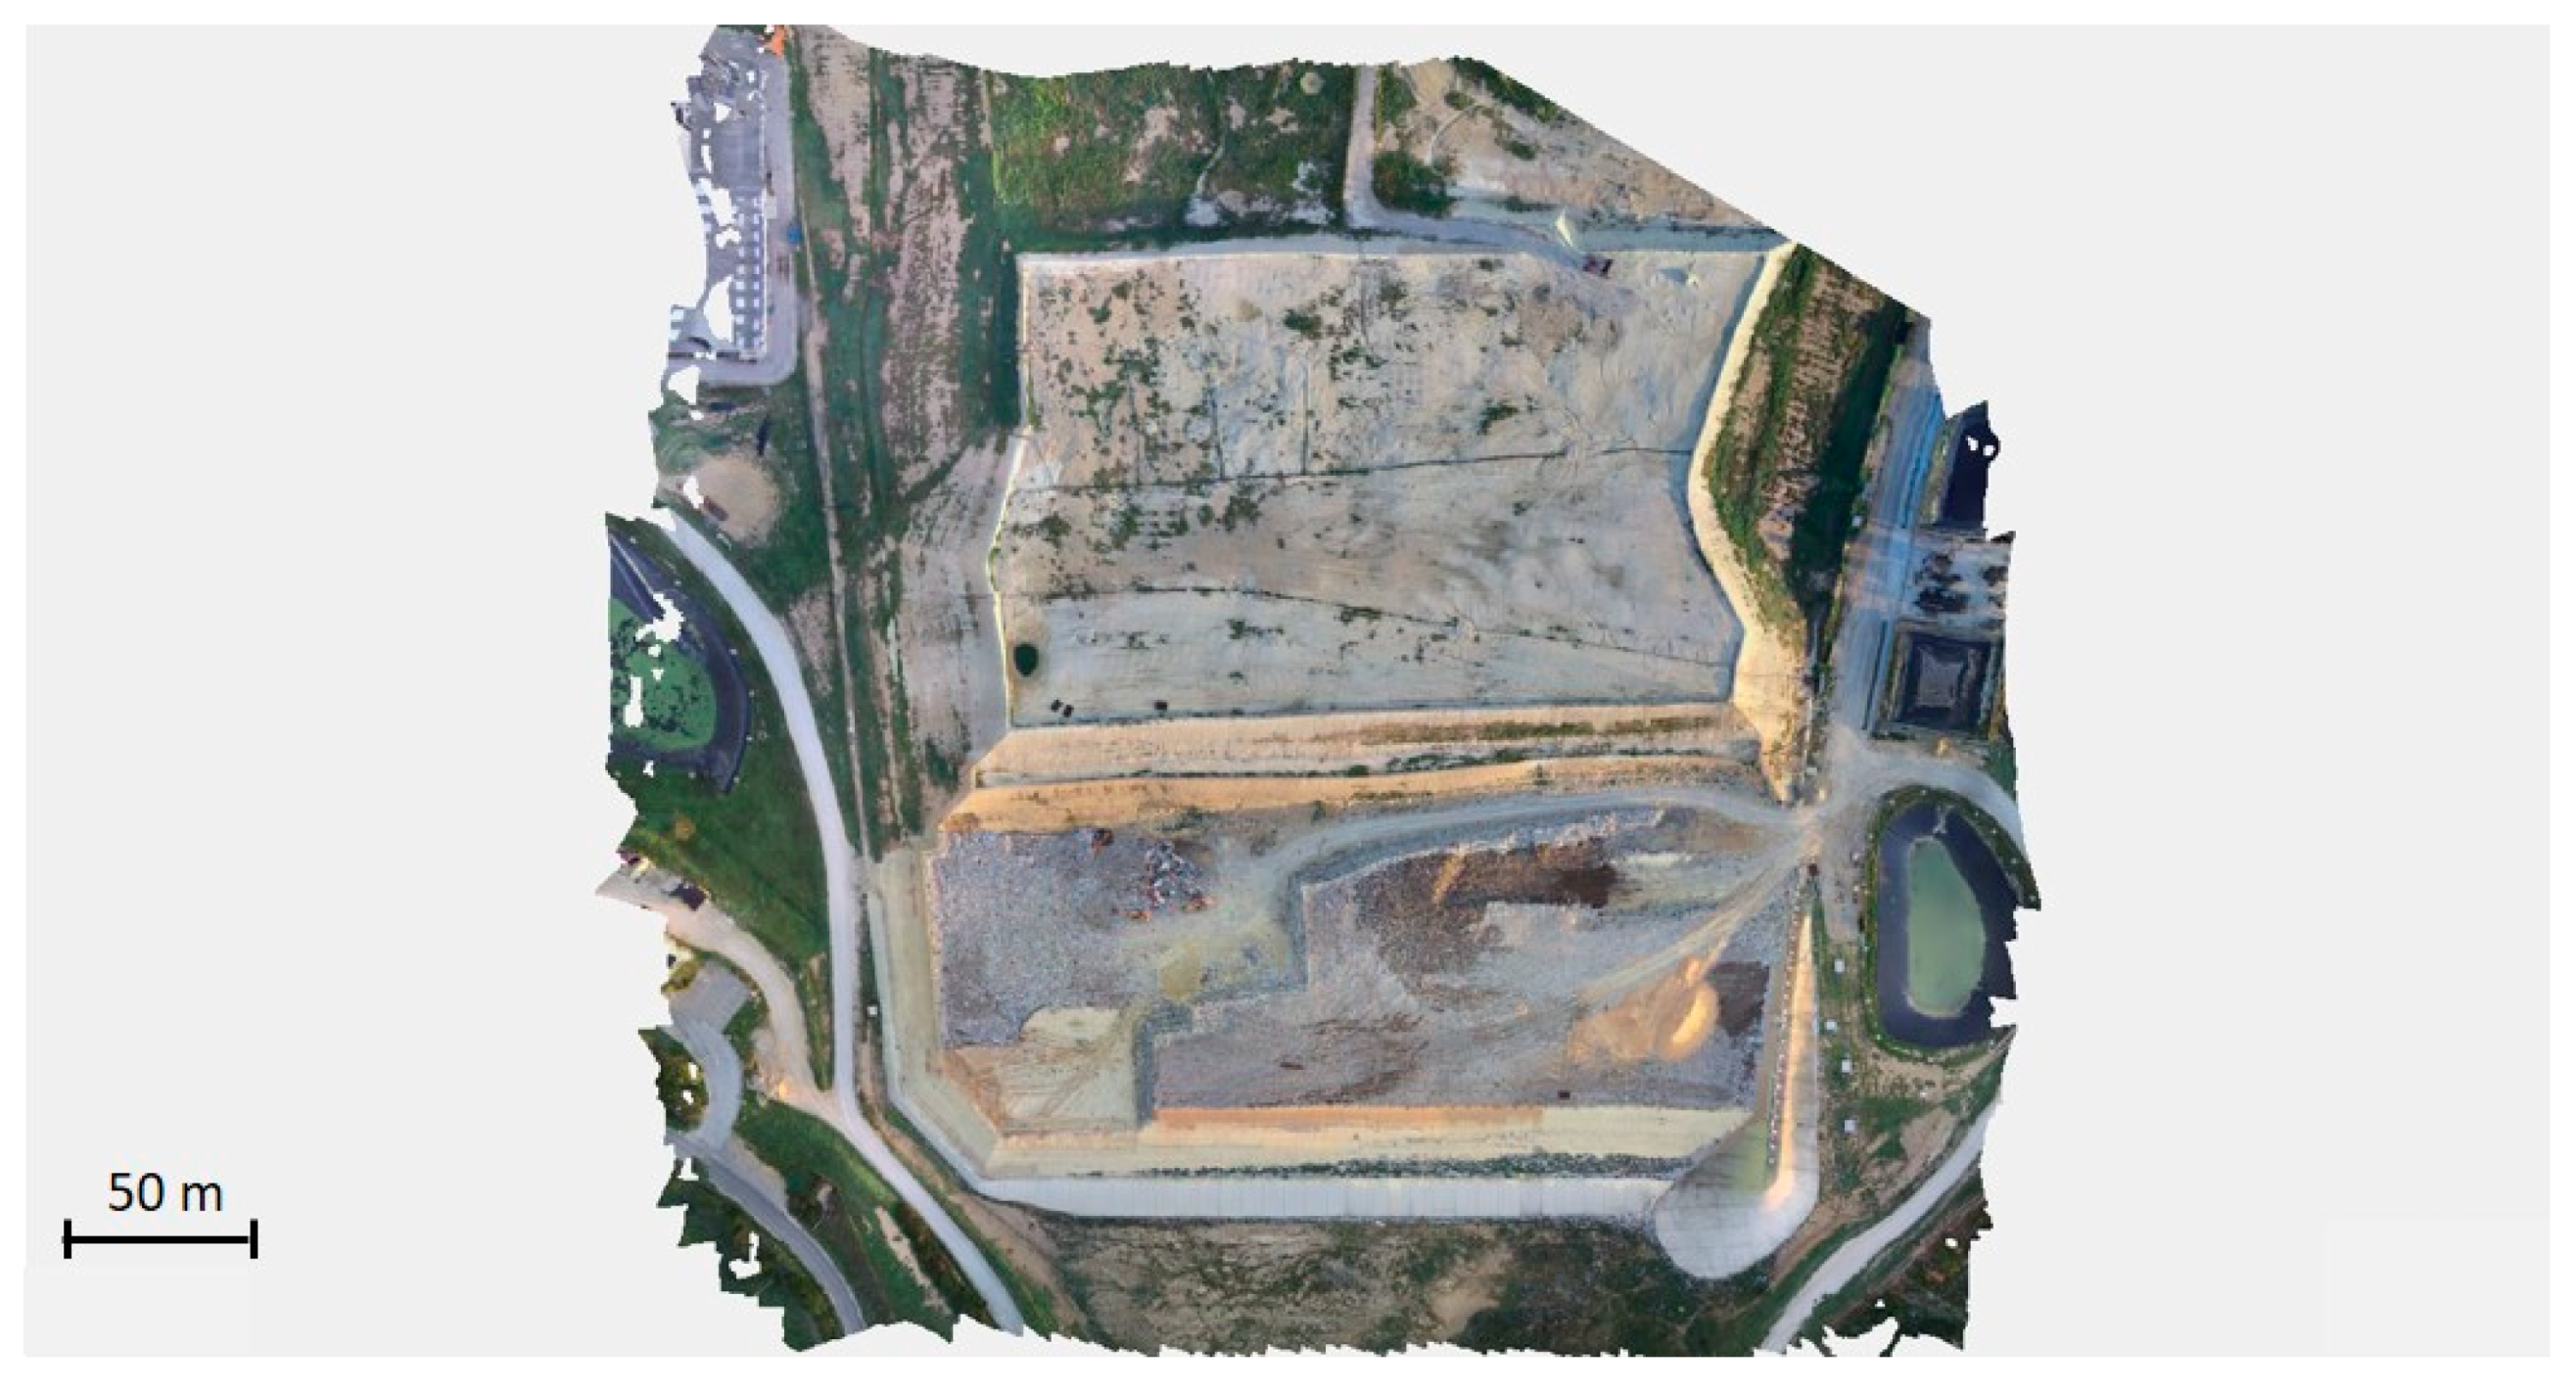
The second inspected site is Scala Erre, located in northern Sardinia, Italy, one of the largest active landfills on the island, with more than 60,000 tons of waste deposited in 2019 over about 9 hectares. The extracted biogas (methane concentration 20−40%, average flow rate 80 m3/h; i.e., 0.7 × 10⁶ m3/ year) is not used for energy production but burned in-situ.
An aerial view of Scala Erre landfill is shown in Figure 2. The inspection of the site was performed using a FLIR Duo Pro R (FLIR Systems, Inc., Wilsonville, OR, USA) camera mounted on a DJI Inspire 2 (SZ DJI Technology Co., Ltd., Shenzhen, China) drone. The sensor contains two cameras (a 640 × 512 pixels IR camera, temperature sensitivity: 50 mK, and a 4000 × 3000 pixels RGB camera), synchronized between them and connected to GNSS (Global Navigation Satellite System) positioning. The flights were performed at 70 m above ground level, following an automatic planned path of 18 parallel flight lines. During a typical survey, about 1500 RGB/IR images were acquired and processed; the superposition of nearby images, both along and across flight lines, was above 70%; the ground resolution of IR images was about 6 cm/pixel.
Two UAV-based surveys were performed in the early morning of one summer day of July 2019 and one winter day of February 2020, both before the sunrise, with clear sky and absence of wind, for the identification of thermal anomalies on the site and possible seasonal effects associated with (the landfill was active during the investigation period). Even though better results were expected for the winter survey due to the relatively low ambient air temperature (only 2−3 °C, against about 25 °C for the summer flight), both datasets were processed and analysed.
3. Results and Discussion
The reconstructed thermal maps of both sites No. 1 and No. 2 were analyzed in order to gain information about the landfill management, including the occurrence of methane leakages from the inspected surfaces.
3.1. Test Site No. 1: Mount Scarpino, Genoa, Italy
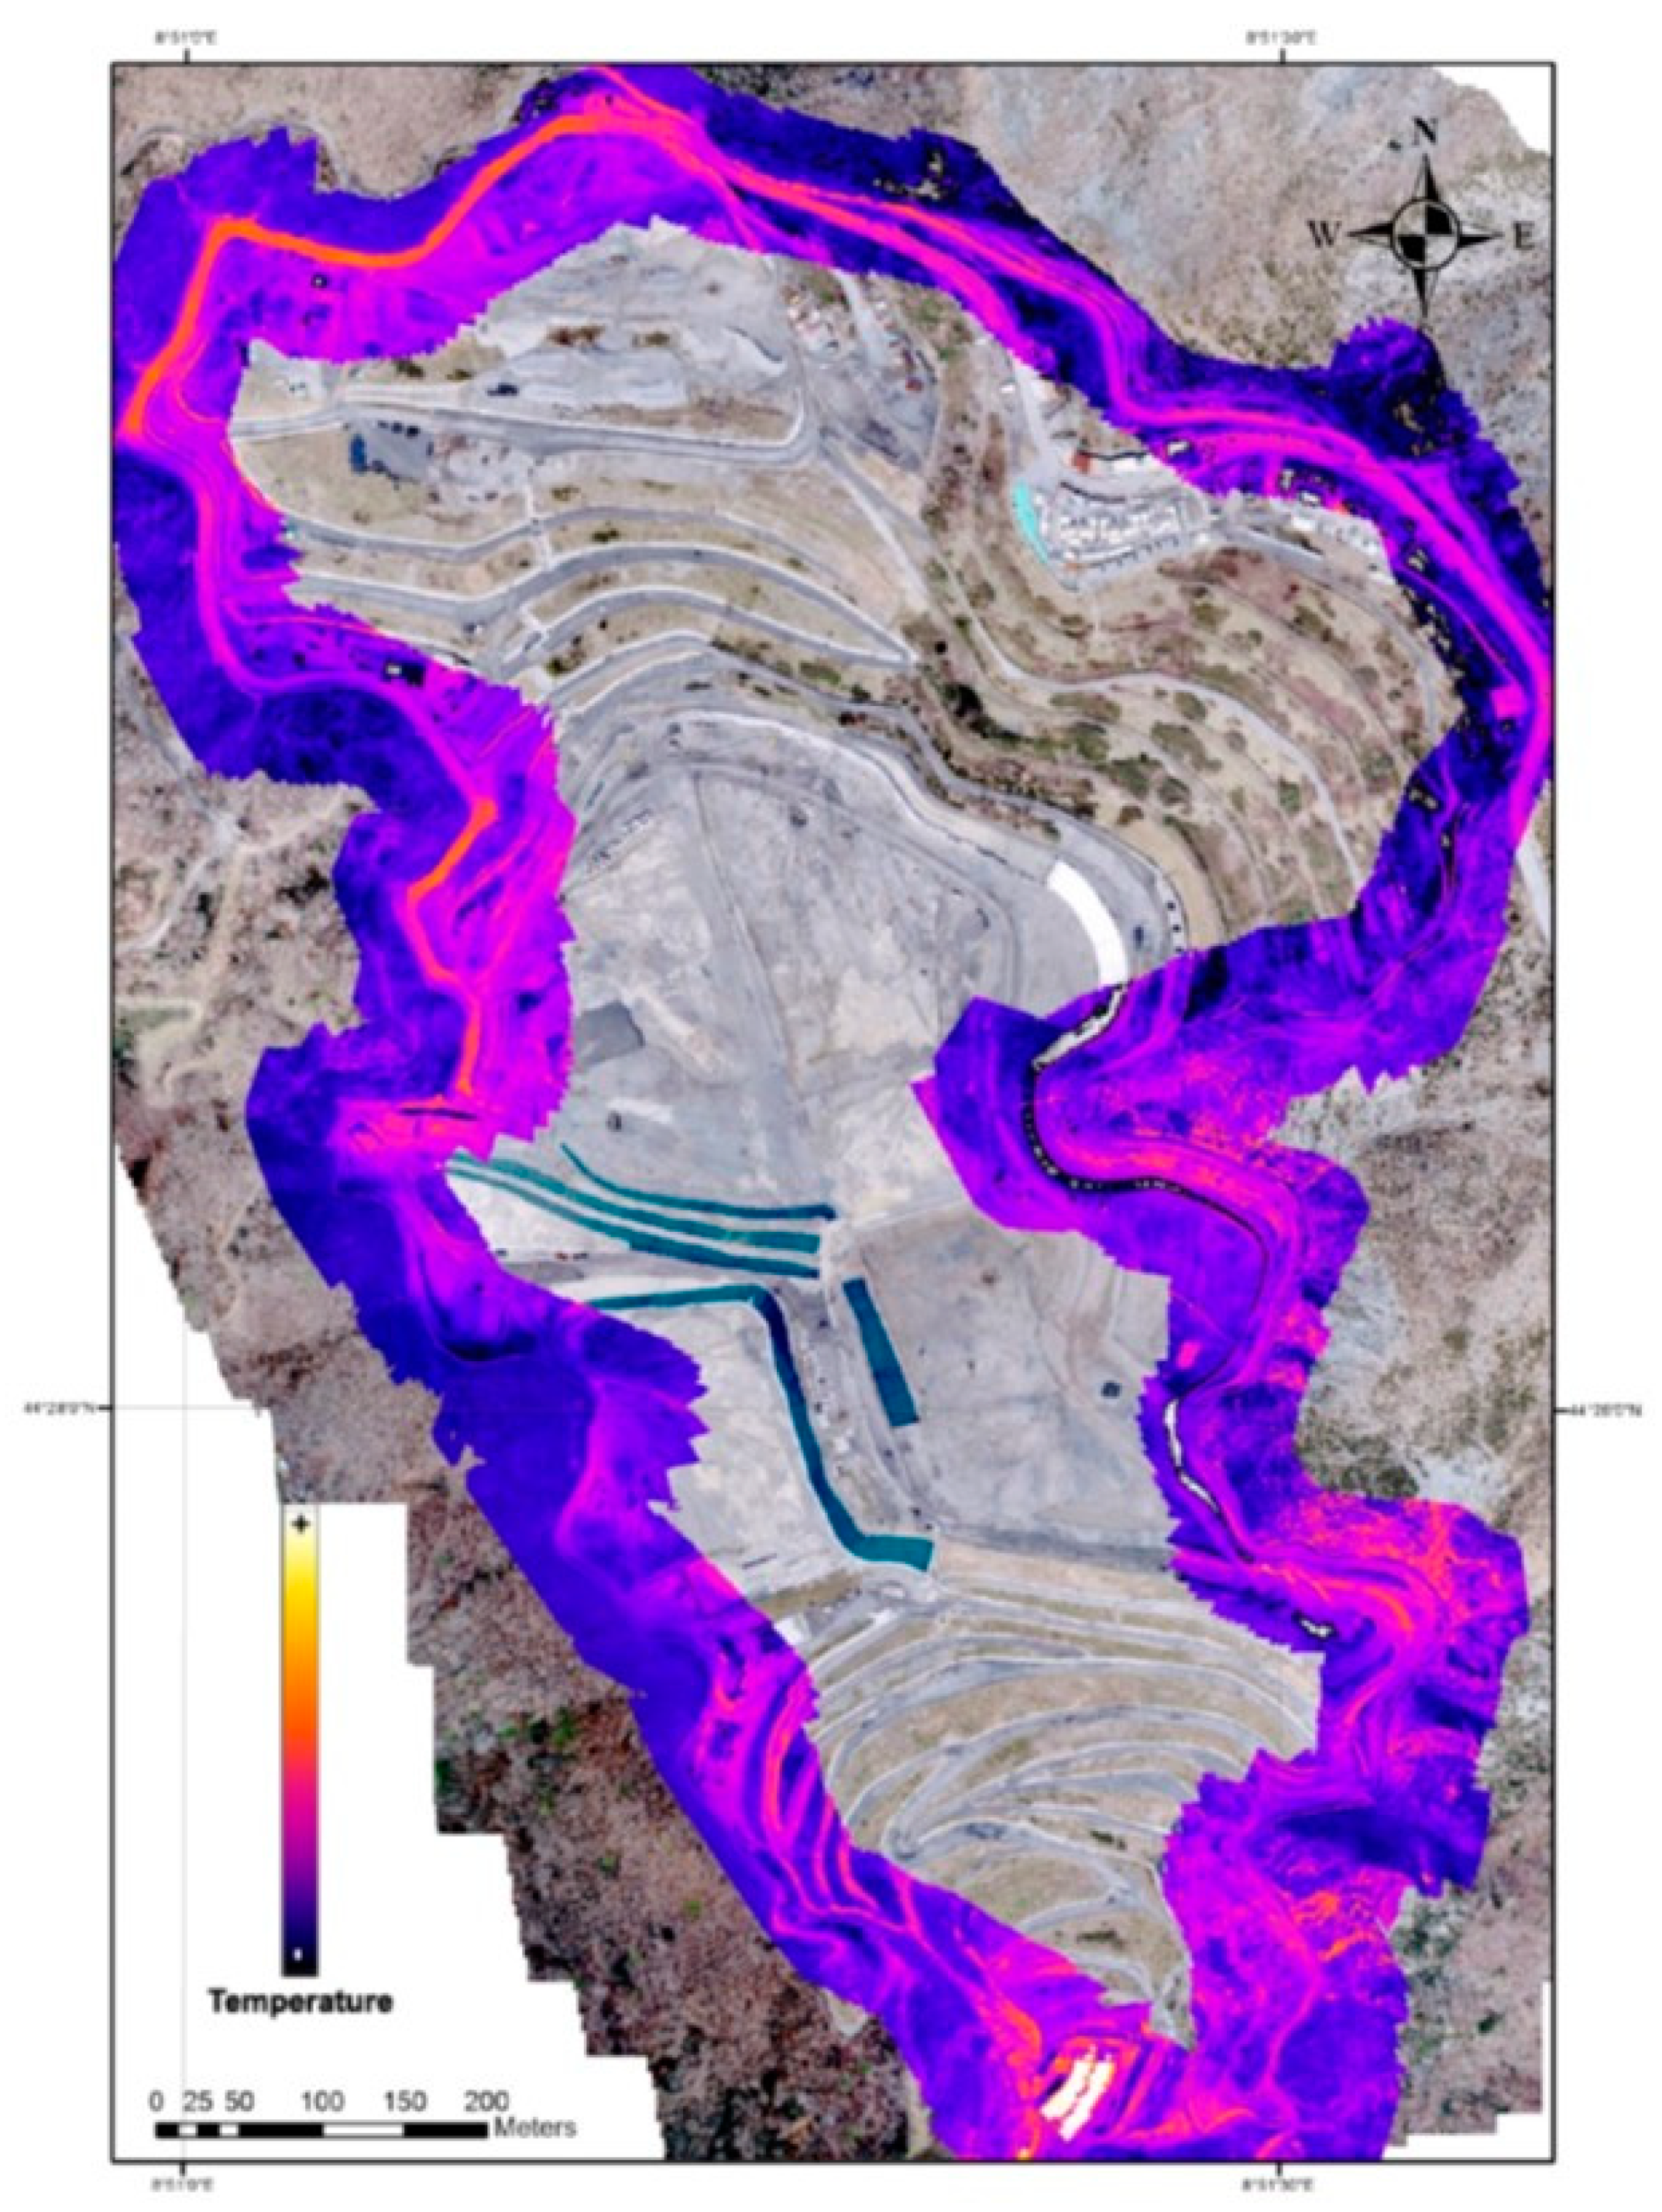
Infrared and visible images taken during the flights were matched to produce a mosaic image giving at the same time the topographic view of the landfill and the thermal map of the inspected peripheral region, as shown in Figure 3.
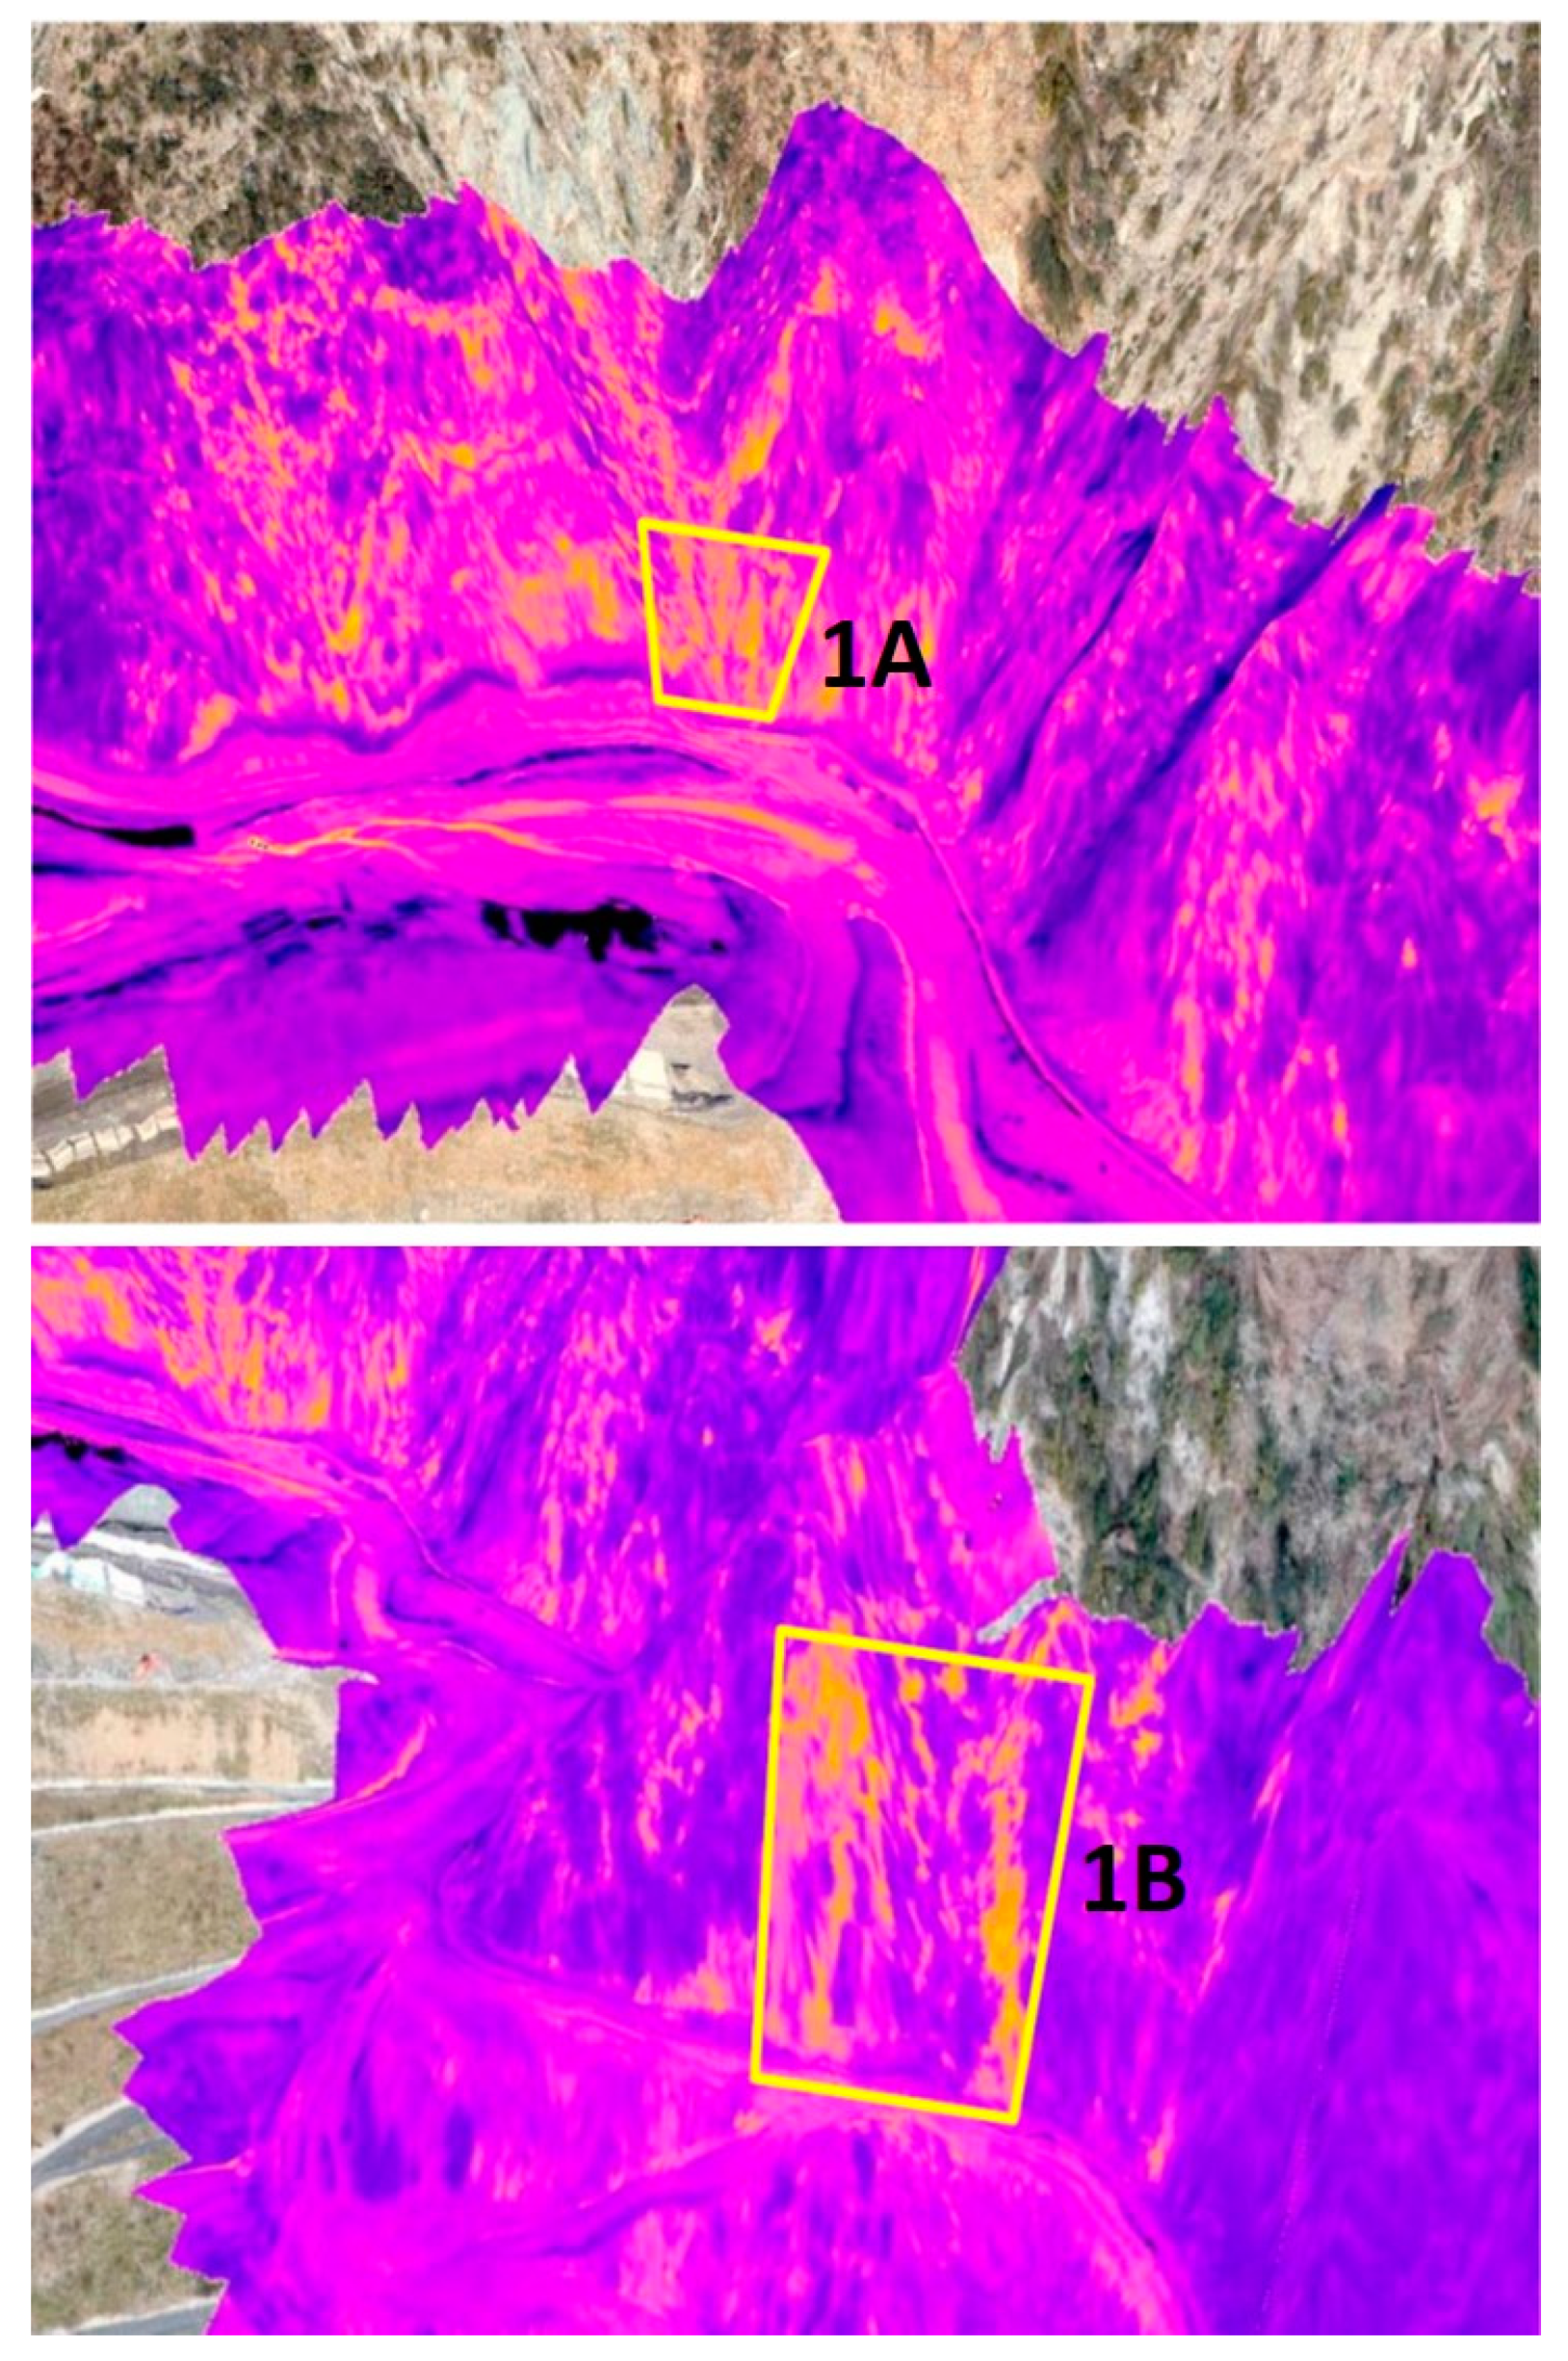
Repeated flights over the landfill revealed significant thermal anomalies over some surface areas, as shown in the 3D mosaic images reported in Figure 4. These areas were covered by uniform bush vegetation (and fairly uniform emissivity), with only a limited risk of false identification of gas leakages. Even though these hotspots were detected during all the survey campaigns, the estimation of biogas production was based on data acquired during the flights performed in March 2016, featured by the most suitable conditions for aerial thermographic investigation (low ambient air temperature, no direct solar radiation).
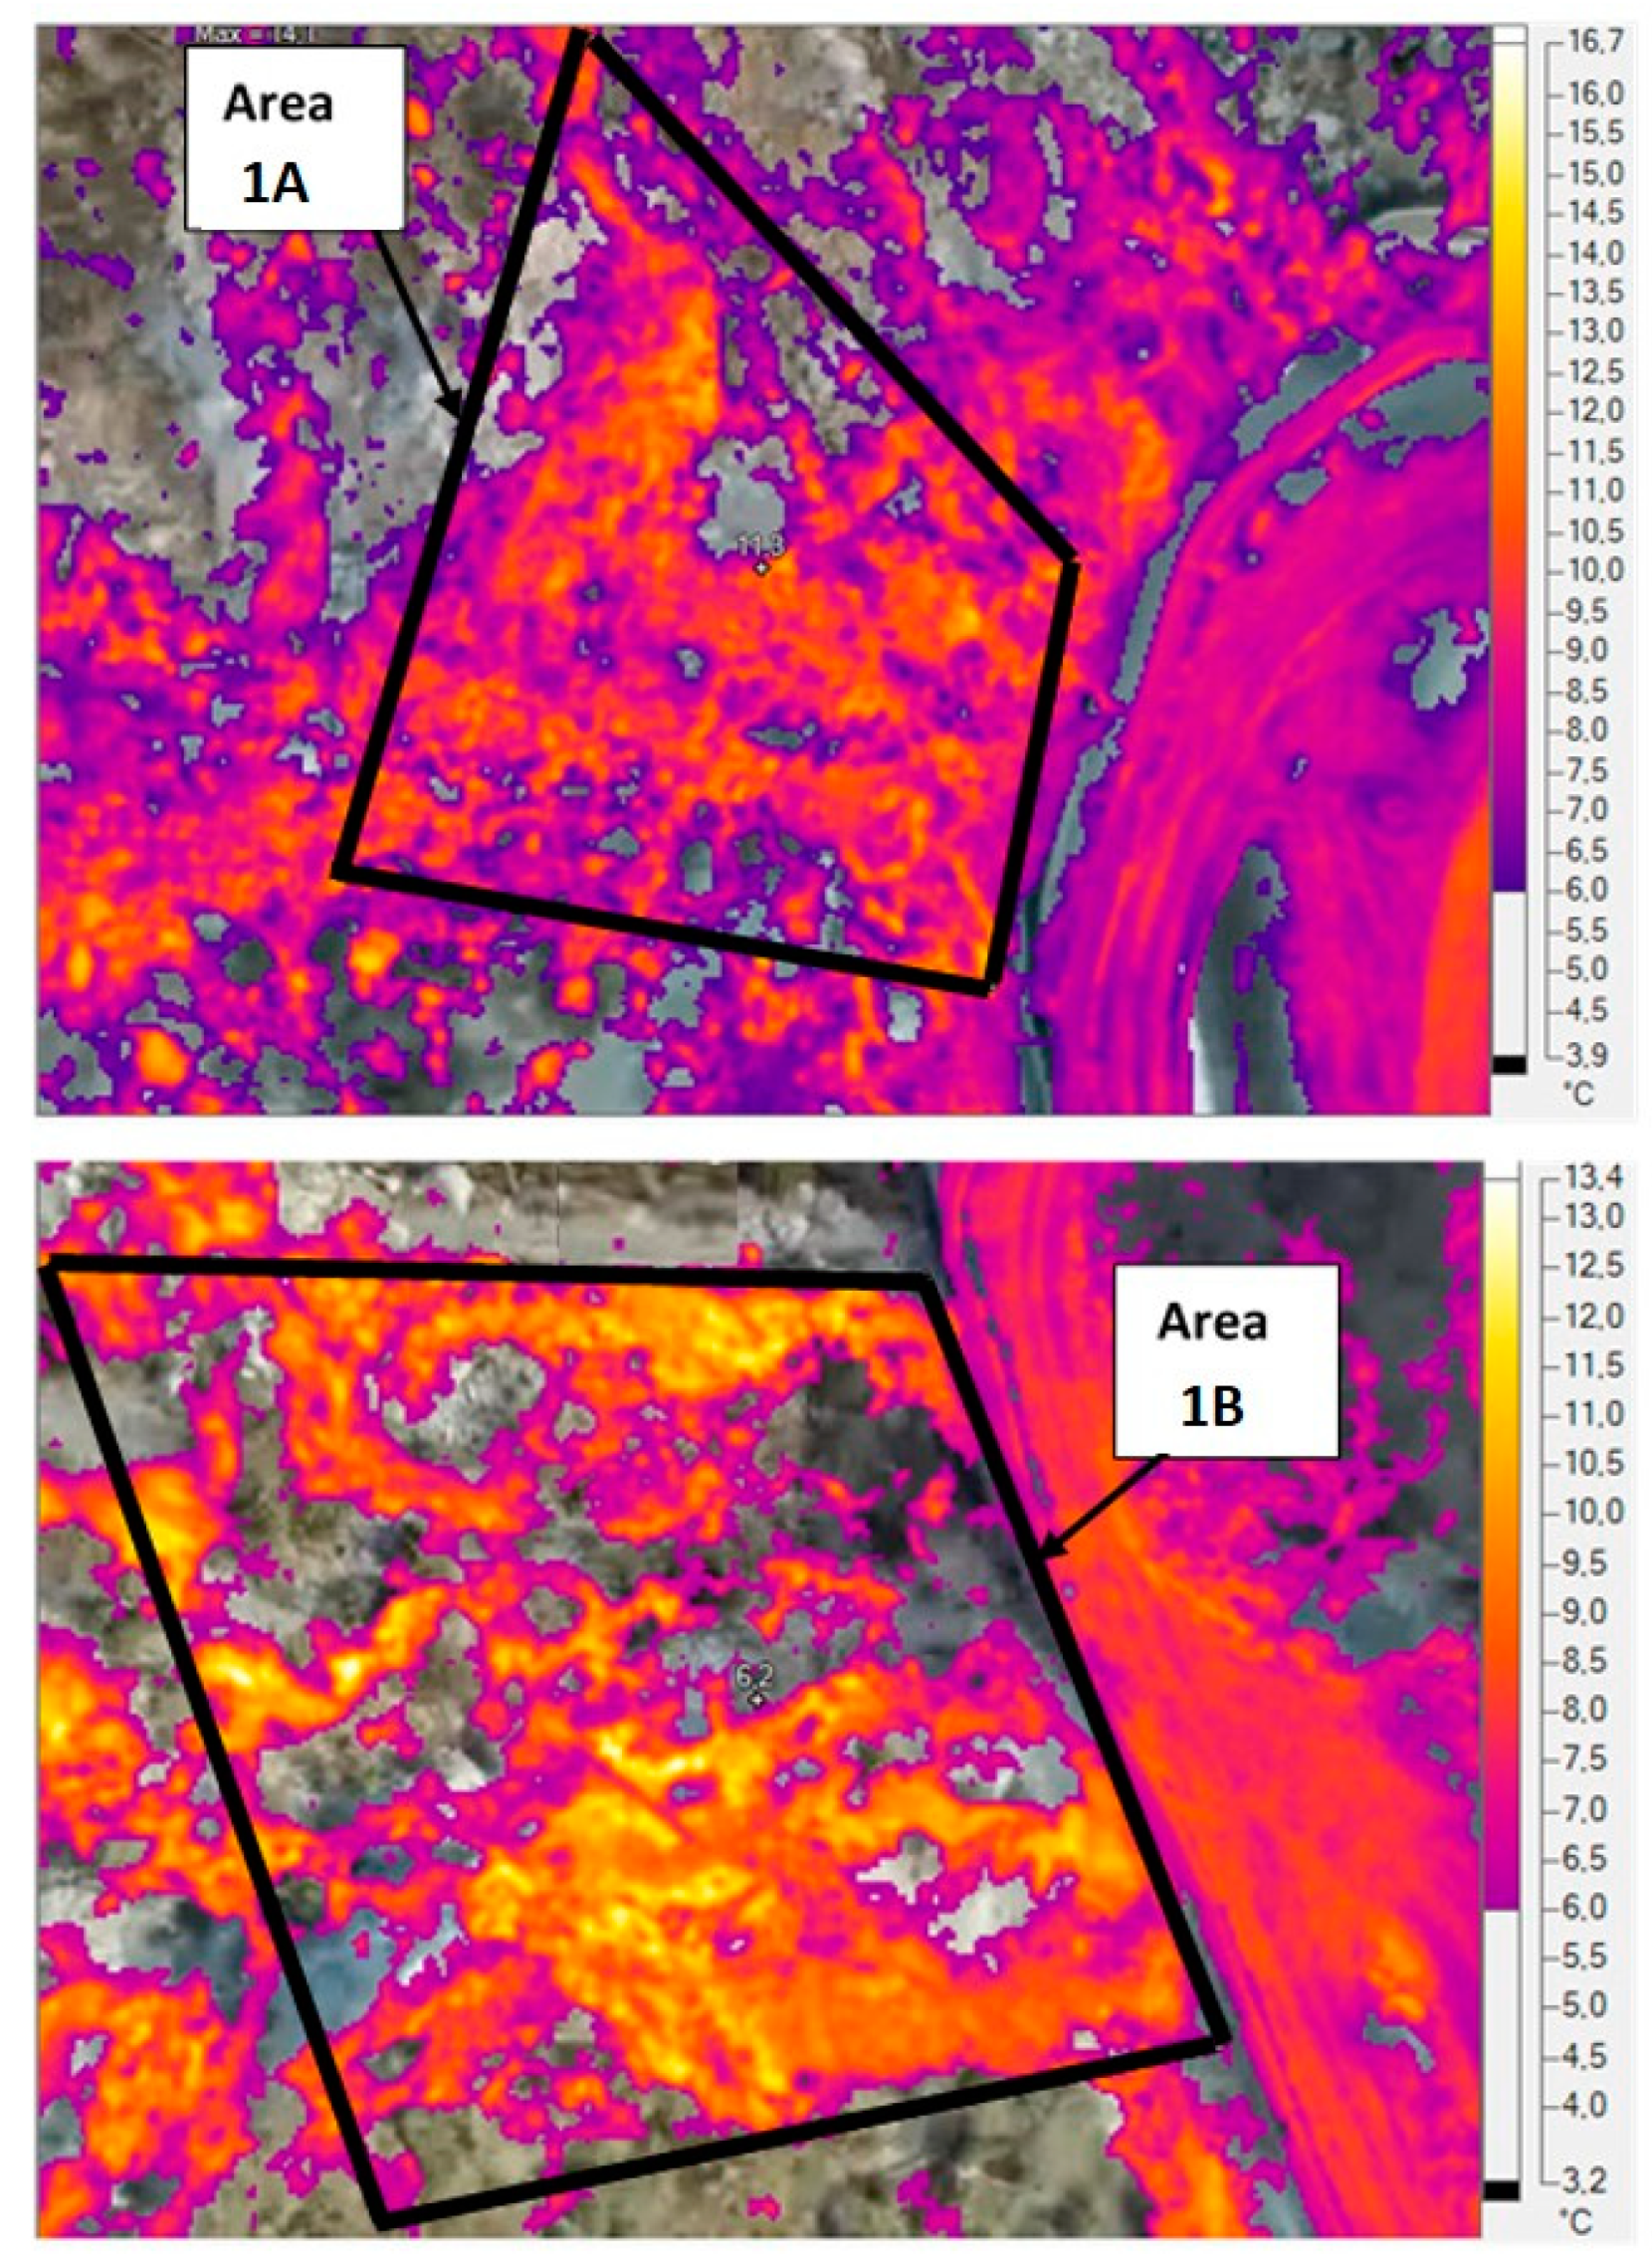
Figure 5 shows the detailed thermal maps of the areas of interest (1A and 1B) with the relevant temperature scales. For the sake of clarity, only spots having a surface temperature exceeding 2 K, the minimum value, are highlighted. This minimum value, corresponding to the undisturbed soil temperature, was equal to 4.2°C (277.3 K) for both areas. The processing of thermal data inside the framed areas of Figure 5 revealed a local soil temperature excess (relative to the undisturbed value) by up to 10 K. The mean soil temperature evaluated over areas 1A and 1B is reported in Table 1, together with the estimated heat flux associated with the biogas digestion from each site and the relevant methane flow rate dispersed into the atmosphere. On average, soil temperature Tw was found to exceed the undisturbed soil temperature Tw,ref by more than 4 K for area 1A and 3 K for area 1B.
Post-processing of images taken over the same areas (1A and 1B) during different survey campaigns revealed differences in the estimated methane flow rate within ±30%. This amount can realistically be assumed as the uncertainty of this method (which accounts for the simplifying assumptions done in Equations (1)−(3) and the uncertainty in the surface temperature measurements). The calculated methane flow rate has the same order of magnitude of biogas measurements obtained, for other landfills, by means of alternative techniques, such as the tracer gas method or the static chamber method [2,3,10]. Moreover, the calculated amount of methane escaping from the investigated areas of Mount Scarpino was found to be higher than the minimum observable emission from thermal analysis (0.15 kg /m2∙day) according to Fjelsted et al. [10], and comparable to that collected by the existing wells and pipes conveying the extracted biogas to the local thermal power station for energy conversion. The conducted analysis allowed the site manager to improve the suction performance of the biogas system so that uncollected flows could be reduced.
3.2. Test Site No. 2: Scala Erre, Sassari, Italy
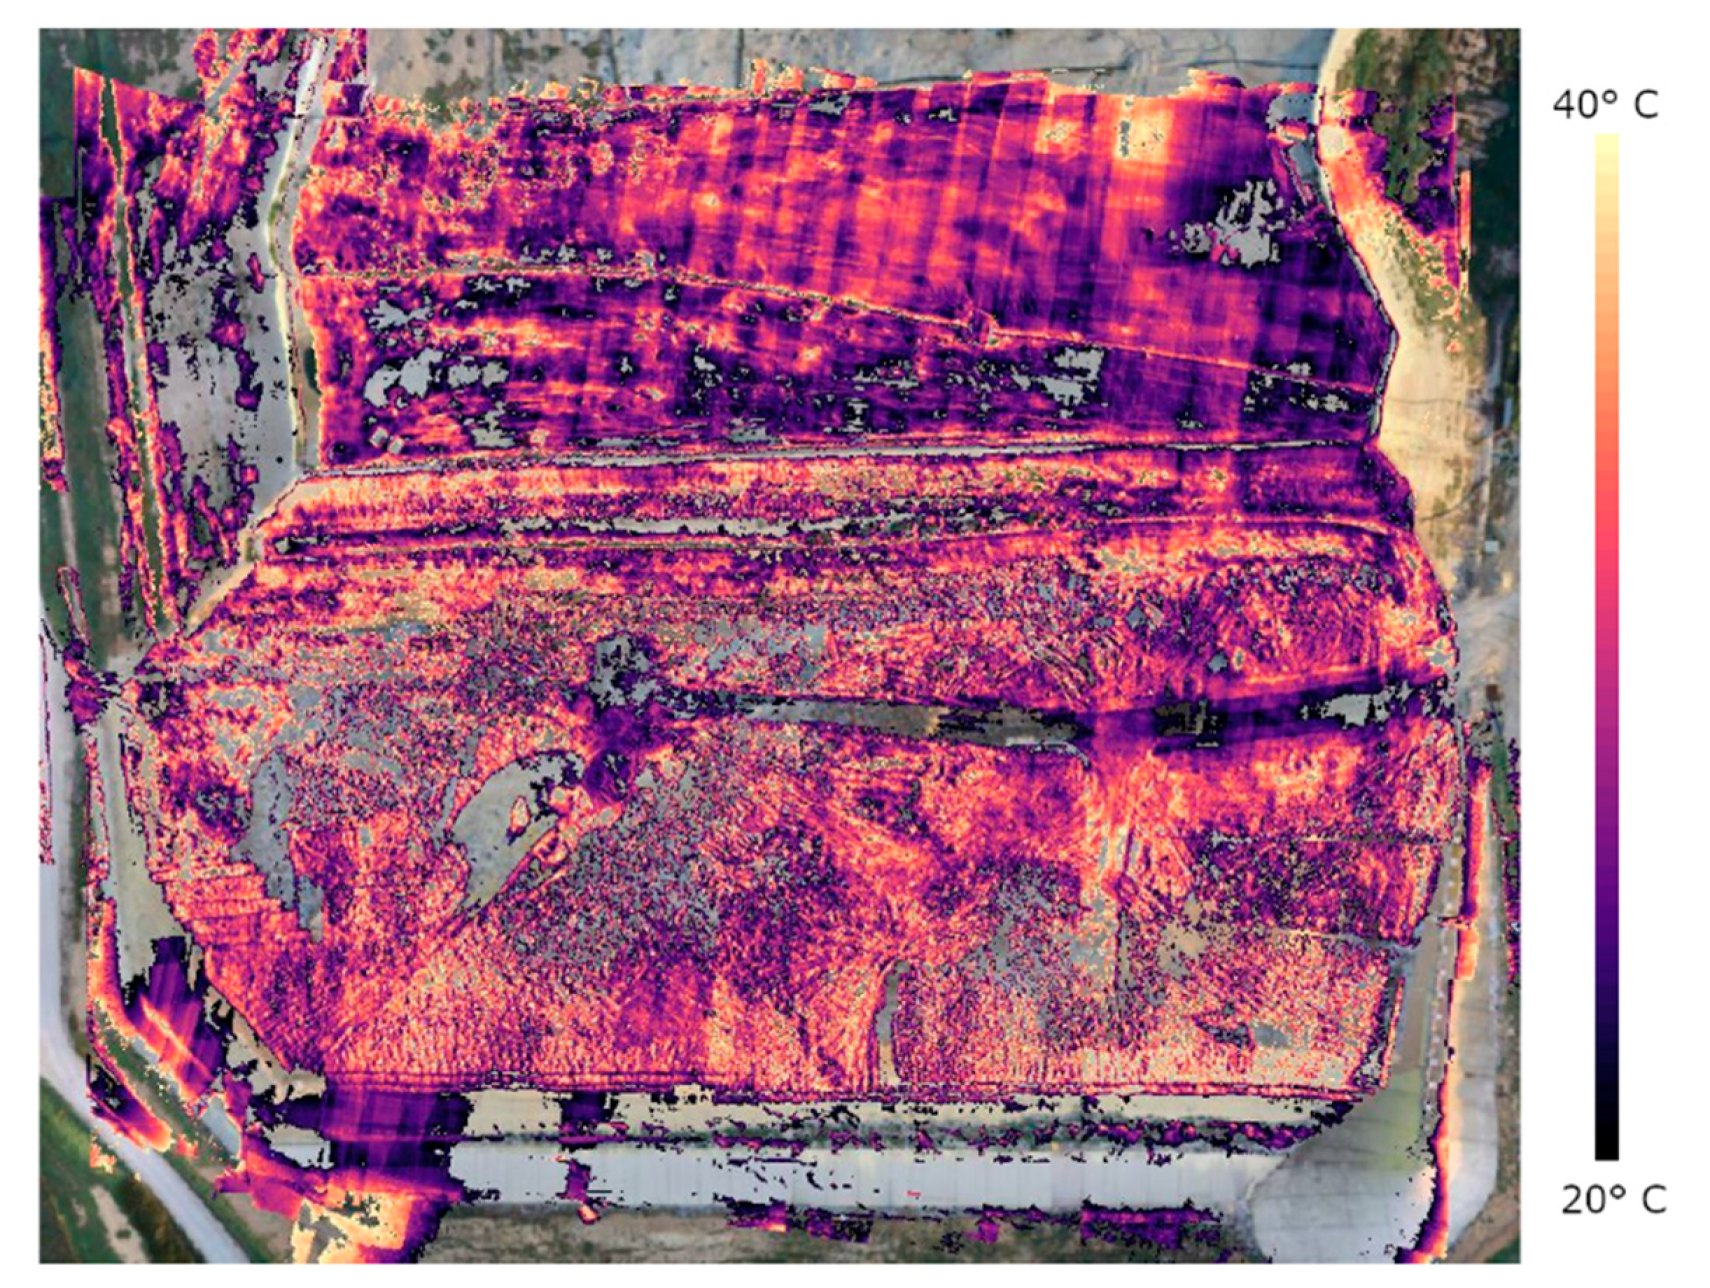
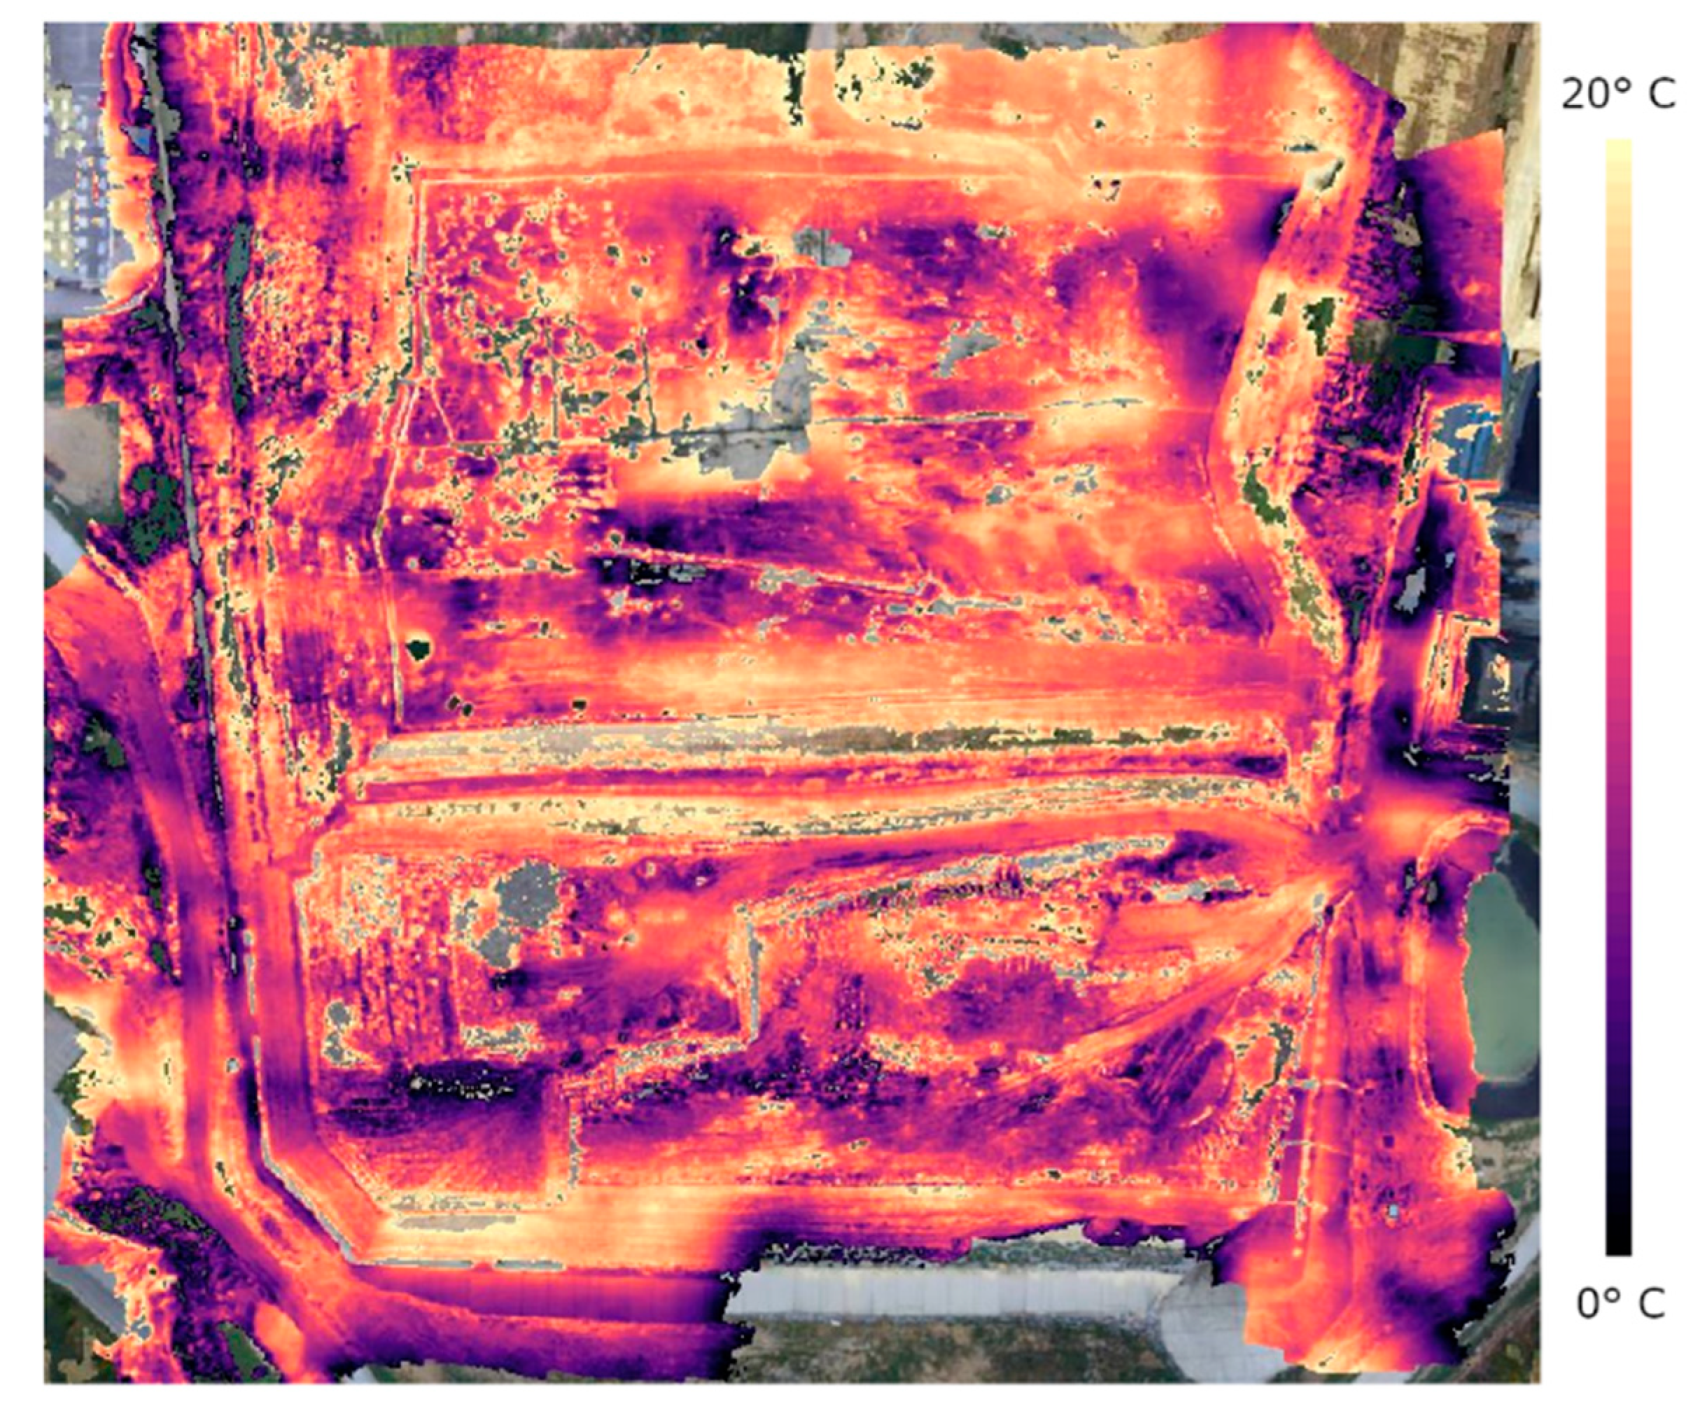
The thermal ortho-mosaic images of Scala Erre landfill area are shown in Figure 6 for the summer survey (July 2019) and Figure 7 for the winter survey (February 2020). A visual inspection of images at a glance shows more evident soil temperature gradients during the winter survey, when the soil-to-ambient temperature difference is higher. However, since the landfill terrain was not homogeneous, different types of ground material may appear as anomalies in thermal images without a clear connection to landfill gas leakage. In fact, the site encompasses areas with bare soil, vegetation, plastic liners, pipes, etc. that are expected to have different emissivity and, therefore, to produce false temperature anomalies in thermal infrared images. For this reason, attention has been focused on smaller areas of the landfill where the potential occurrence of a thermal anomaly associated with a biogas emission could be more likely, i.e., areas with homogeneous soil or uniform vegetation, or far from pipes carrying hot biogas.
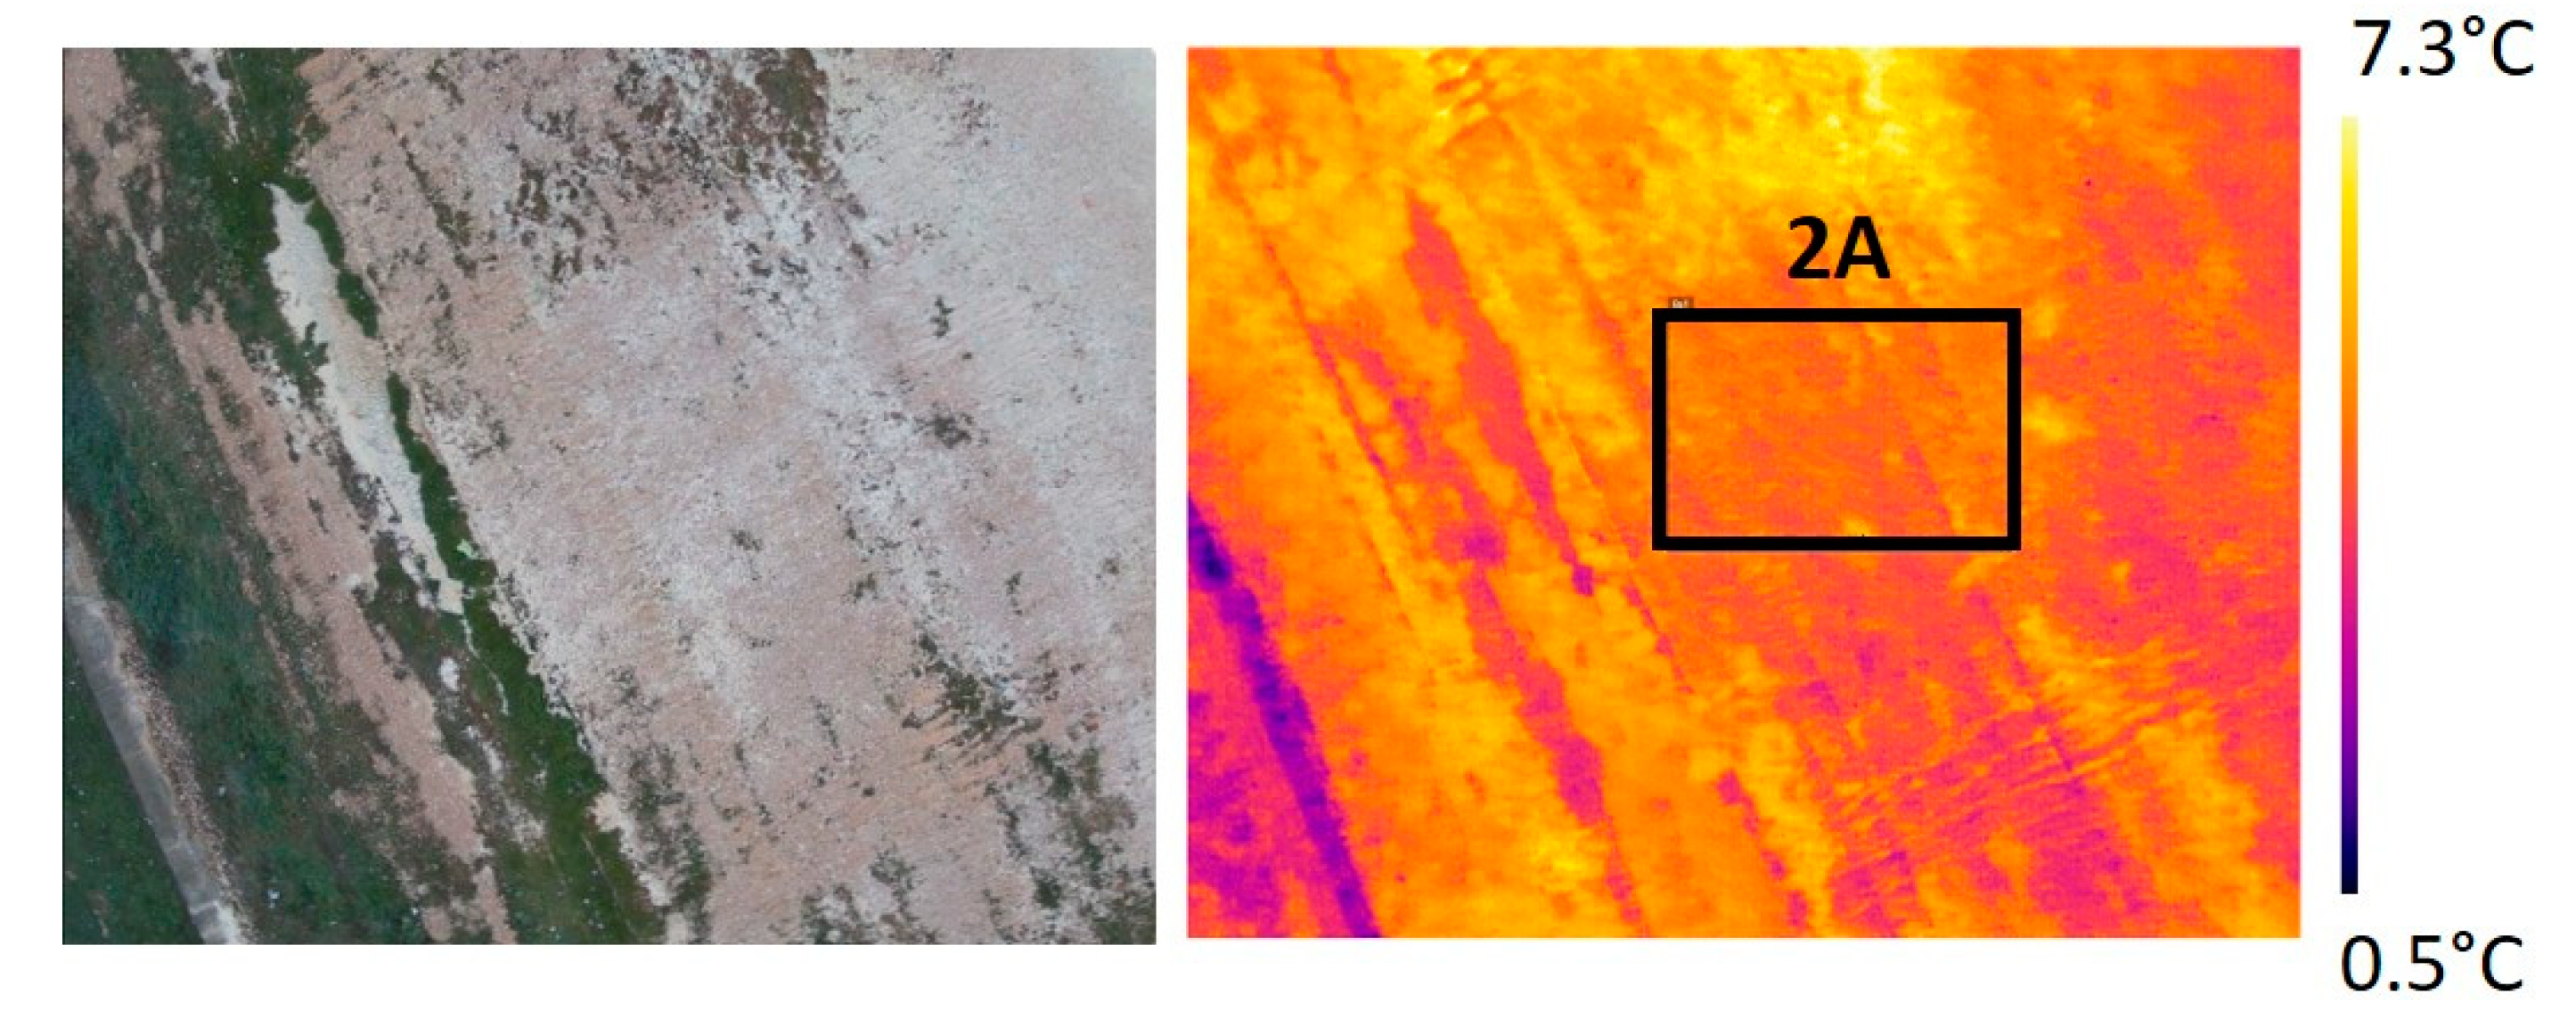
Individual visible and thermal images acquired by the UAV over specific areas during the winter season are shown in Figure 8 and Figure 9. Figure 8 refers to a central area of the landfill, already buried, in which only flat bare soil and low vegetation were present. The left-hand side of the figure shows the visible (RGB) image of the inspected site, while on the right-hand side the corresponding thermal (IR) image is reported. Processing thermal data over portions of soil surface having a homogenous structure (as inferred by the visible image) gave a mean value and excursion of surface temperature not significantly far from those recorded for the “undisturbed” soil. For instance, the area framed inside the rectangle (termed 2A) of Figure 8 (right-hand) is characterised by calculated minimum, maximum, and average temperatures of 3.1 °C, 6 °C, and 4.4 °C, respectively. It is conjectured that in homogeneous zones of the inspected landfill the soil temperature does not vary significantly with respect to the background value.
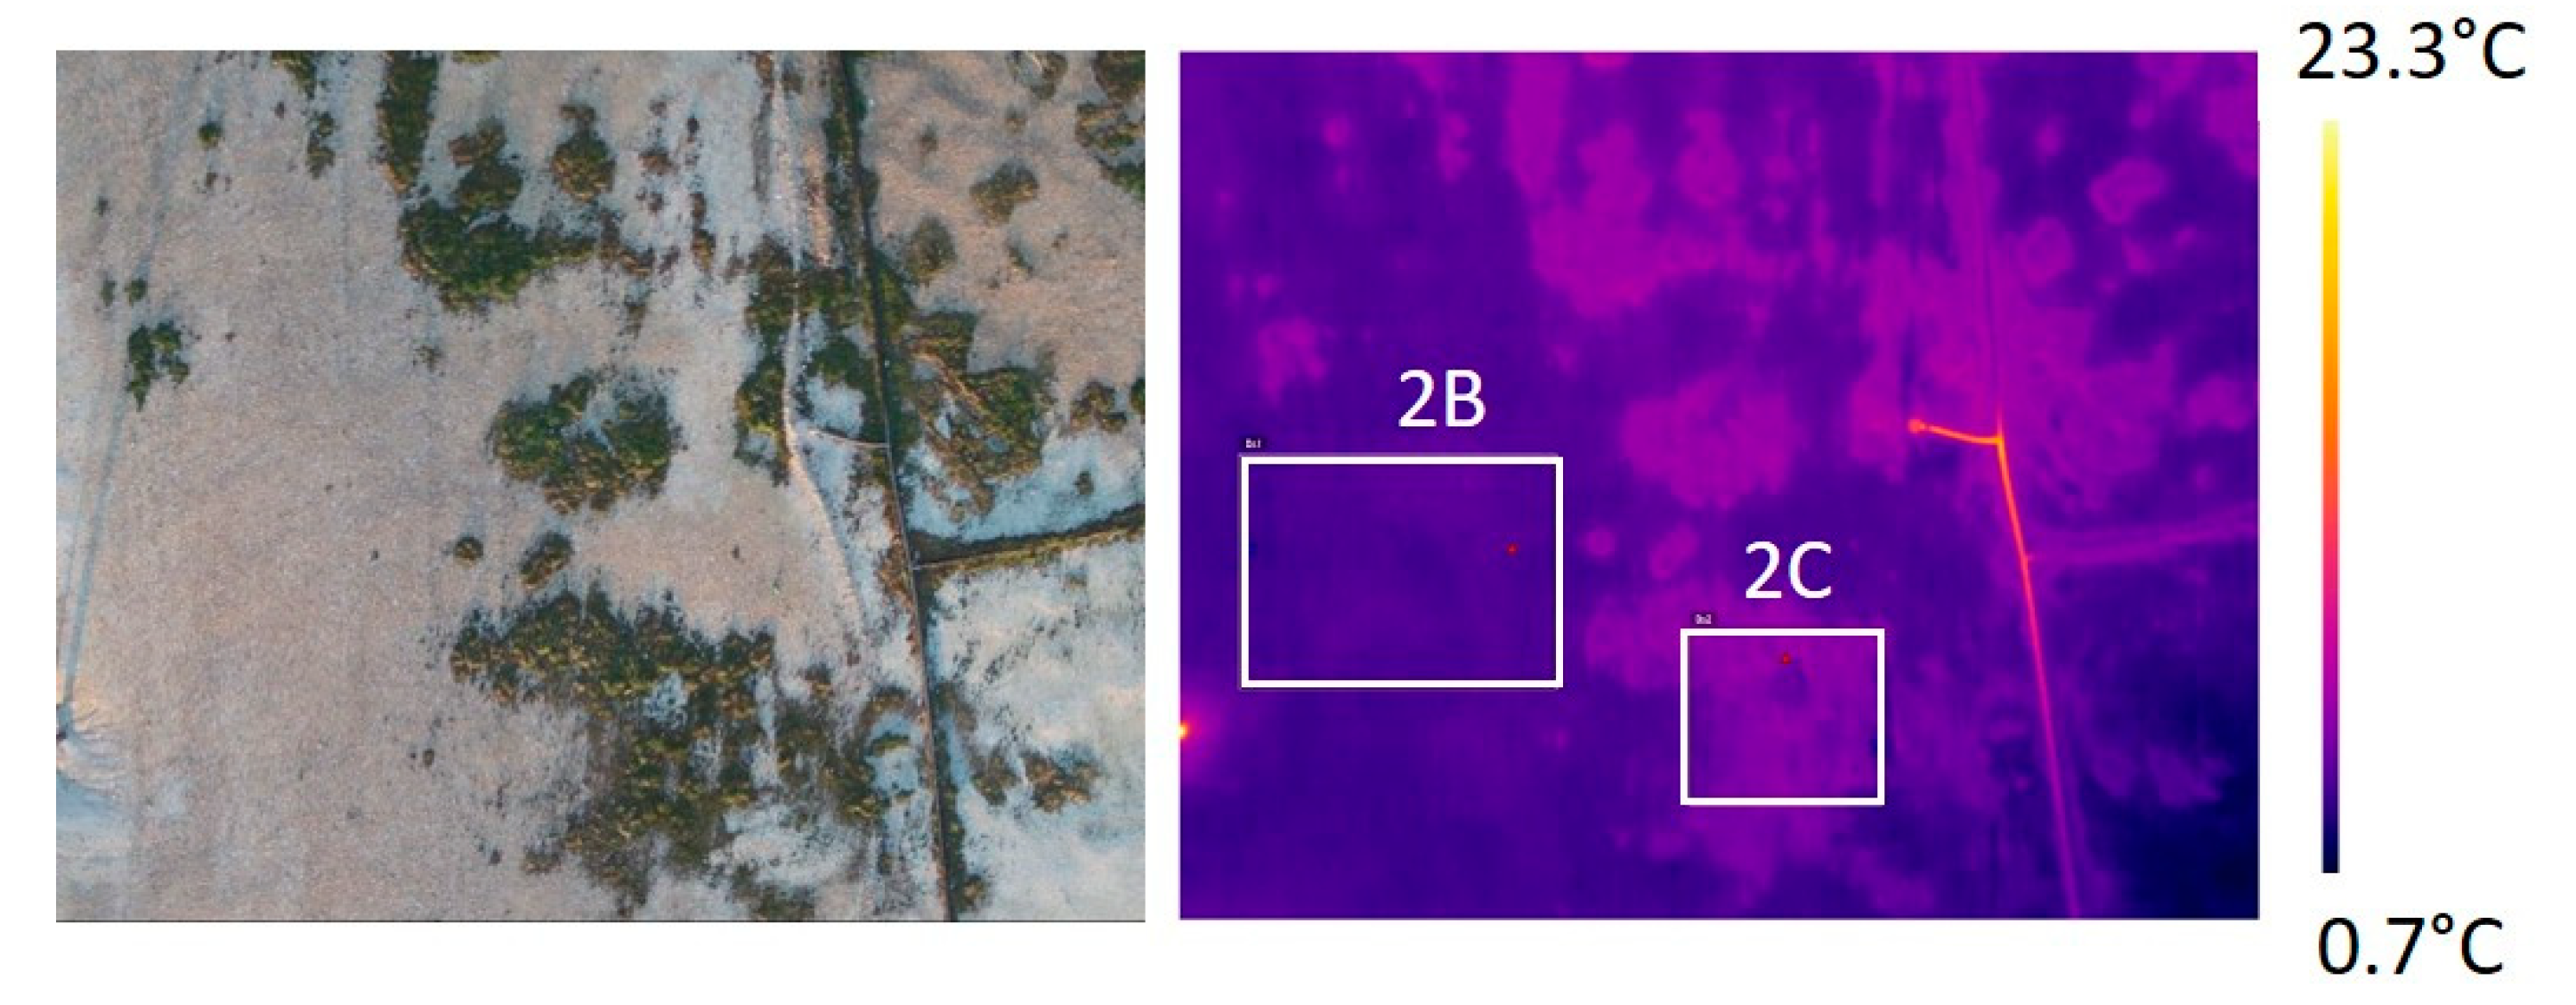
Figure 9 shows the RGB (left-hand) and the IR (right-hand) images taken from a second area, characterised again by bare soil and low vegetation but crossed by pipes and wells for the collection and transportation of the produced biogas. Two rectangular areas (termed 2B and 2C) were chosen for the processing of thermal data: the first (2B) includes homogeneous bare soil, whereas the second (2C) comprises a mix of soil and vegetation. The calculated minimum, maximum, and mean temperatures were 3.1 °C, 5.7 °C, and 4.2 °C for area 2B and 3.3 °C, 7.2 °C, and 5.5 °C for area 2C. The more homogeneous area (2B) exhibits temperature values in line with those recorded for area 2A, while the area including portions of vegetation (2C) has temperature values slightly higher than the background soil temperature: this difference, probably ascribed to the different emissivity of the target surface, is too little to justify the presence of a thermal anomaly associated with a local biogas leakage. Finally, the path of the pipes carrying the collected biogas is clearly outlined by the thermal image (Figure 9, right-hand), inducing consistent thermal anomalies, up to 23 ° C, not associated with biogas leakages.
In conclusion, the inspection of site No. 2 indicates that, as the analysis is circumscribed inside homogeneous zones, the soil temperature does not show significant variability; the only non-uniformities are attributable to patches of vegetation and/or pipes channelling the biogas. Therefore, unlike the previous analysis of site No. 1, the biogas leakages, if any, are not enough to be detected by the thermographic inspection and the landfill is likely not critical from this point of view.
4. Conclusions
Thermal infrared inspection assisted by UAV aerial survey has been proposed as a diagnostic tool for the monitoring of urban landfills. The observed thermal anomalies, if present, can be related to the emission of warm landfill gas that can be identified and roughly quantified (through an energy balance based on the recorded thermal footprint of the soil) with the purpose of recover and use it as fuel in a thermal power plant. The technique, relatively inexpensive and simple to deploy in the field, has been applied to the monitoring of two Italian landfills. For one of them (No. 1, Mount Scarpino, Genoa, Italy), significant surface temperature anomalies (soil temperature on average about 3−4 K higher than the undisturbed soil temperature), probably associated with the presence of biogas, were found and the calculated methane flow rate was comparable to that extracted, in the surrounding areas, and delivered to the thermal power station for energy conversion. The second inspected site (No. 2, Scala Erre, Sassari, Italy) did not reveal any significant thermal anomaly; no severe methane leakages are supposed to be present in this site.
In conclusion, the proposed inspection technique, despite some limitations (e.g., thermal anomalies poorly visible in warm climates, soil emissivity variations biasing the thermal map), offers an interesting opportunity for the monitoring of urban landfills and the detection in an indirect way of biogas emission from the soil.
Author Contributions
Conceptualization, methodology, and writing: all authors; on-site remote-sensing inspections and data processing: G.T. and V.C. (site No. 1), M.B. and P.F. (site No. 2). All authors have read and agreed to the published version of the manuscript.
Funding
This research has been partially funded by the Region of Sardinia (Italy) under the project TEMPUS POR/FESR Sardegna 2014–2020 Asse 1 Azione 1.1.3.
Conflicts of Interest
The authors declare no conflict of interest.
References
- Lewis, A.W.; Yuen, S.T.S.; Smith, A.J.R. Detection of gas leakage from landfills using infrared thermography—Applicability and limitations. Waste Manag. Res. 2003, 21, 436–447. [Google Scholar] [CrossRef] [PubMed]
- Monster, J.G.; Samuelsson, J.; Kjeldsen, P.; Rella, C.W.; Scheutz, C. Quantifying methane emission from fugitive sources by combining tracer release and downwind measurements—A sensitivity analysis based on multiple field surveys. Waste Manag. 2014, 34, 1416–1428. [Google Scholar] [CrossRef] [PubMed]
- Mønster, J.; Samuelsson, J.; Kjeldsen, P.; Scheutz, C. Quantification of methane emissions from 15 Danish landfills using the mobile tracer dispersion method. Waste Manag. 2015, 35, 177–186. [Google Scholar] [CrossRef] [PubMed] [Green Version]
- Madruga, F.J.; Munoz, J.M.; Gonzalez, D.A.; Tejero, J.I.; Cobo, A.; Gil, J.L.; Conde, O.M.; Lopez-Higuera, J.M. Field test of infrared thermography applied to biogas controlling in landfill sites. In Proceedings of the SPIE—The International Society for Optical Engineering, Orlando, FL, USA, 9–11 April 2007. [Google Scholar]
- Battaglini, R.; Raco, B.; Scozzari, A. Effective monitoring of landfills: Flux measurements and thermography enhance efficiency and reduce environmental impact. J. Geophys. Eng. 2013, 10, 064002. [Google Scholar] [CrossRef]
- Iacoboaea, C.; Petrescu, F. Landfill monitoring using remote sensing: A case study of Glina, Romania. Waste Manag. Res. 2013, 31, 1075–1080. [Google Scholar] [CrossRef]
- Yan, W.Y.; Mahendrarajah, P.; Shaker, A.; Faisal, K.; Luong, R.; Al-Ahmad, M. Analysis of multi-temporal landsat satellite images for monitoring land surface temperature of municipal solid waste disposal sites. Environ. Monit. Assess. 2014, 186, 8161–8173. [Google Scholar] [CrossRef]
- Beaumont, B.; Radoux, J.; Defourny, P. Assessment of airborne and spaceborne thermal infrared remote sensing for detecting and characterizing landfills. Waste Manag. Environ. VII 2014, 180, 237–248. [Google Scholar]
- Tanda, G.; Migliazzi, M.; Chiarabini, V.; Cinquetti, P. Monitoring of biogas emissions from an urban landfill by means of close-range aerial infrared thermography. In Proceedings of the 10th Mediterranean Conference on Power Generation, Transmission, Distribution and Energy Conversion (MedPower 2016), Belgrade, Serbia, 6–9 November 2016. [Google Scholar]
- Fjelsted, L.; Christensen, A.G.; Larsen, J.E.; Kjeldsen, P.; Scheutz, C. Assessment of a landfill methane emission screening method using an unmanned aerial vehicle mounted thermal infrared camera—A field study. Waste Manag. 2019, 87, 893–904. [Google Scholar] [CrossRef] [PubMed]
- Mønster, J.; Kjeldsen, P.; Scheutz, C. Methodologies for measuring fugitive methane emissions from landfills—A review. Waste Manag. 2019, 87, 835–859. [Google Scholar] [CrossRef] [PubMed]
- Sartori, E. Convection coefficient equations for forced air flow over flat surfaces. Sol. Energy 2006, 80, 1063–1071. [Google Scholar] [CrossRef]
- Tonelli, A. Some operative applications of remote sensing. Annali di Geofisica 2000, 43, 1177–1196. [Google Scholar]
Figure 1.
Topographic view of the landfill of Mount Scarpino (Genoa, Italy). Wells and pipes for the biogas extraction are highlighted.
Figure 1.
Topographic view of the landfill of Mount Scarpino (Genoa, Italy). Wells and pipes for the biogas extraction are highlighted.

Figure 2.
Topographic view of the landfill of Scala Erre, Sassari, Italy.

Figure 3.
Mosaic image of the landfill (Mount Scarpino) containing the topographic view of the entire site and the infrared (IR) imaging of the peripheral region.
Figure 3.
Mosaic image of the landfill (Mount Scarpino) containing the topographic view of the entire site and the infrared (IR) imaging of the peripheral region.

Figure 4.
Three-dimensional mosaic images of some areas of the landfill (Mount Scarpino); zones with marked thermal anomalies (1A and 1B) are highlighted.
Figure 4.
Three-dimensional mosaic images of some areas of the landfill (Mount Scarpino); zones with marked thermal anomalies (1A and 1B) are highlighted.

Figure 5.
Thermographic data gathered for site No. 1 over areas 1A and 1B, Mount Scarpino.

Figure 6.
Mosaic thermal image of the landfill (Scala Erre) during the summer survey (July 2019).

Figure 7.
Mosaic thermal image of the landfill (Scala Erre) during the winter survey (February 2020).
Figure 7.
Mosaic thermal image of the landfill (Scala Erre) during the winter survey (February 2020).

Figure 8.
Visible (RGB) and infrared (IR) images of a central landfill area (with bare soil and low vegetation), acquired during the winter survey (February 2020) of Scala Erre.
Figure 8.
Visible (RGB) and infrared (IR) images of a central landfill area (with bare soil and low vegetation), acquired during the winter survey (February 2020) of Scala Erre.

Figure 9.
Visible (RGB) and infrared (IR) images of a landfill area with bare soil, low vegetation, and pipes and wells, acquired during the winter survey (February 2020) of Scala Erre.
Figure 9.
Visible (RGB) and infrared (IR) images of a landfill area with bare soil, low vegetation, and pipes and wells, acquired during the winter survey (February 2020) of Scala Erre.


Table 1.
Estimated methane flow rates and main parameters included in the calculation procedure.
| Region No. | Surface Area [m2] | Mean Tw [K] | Undisturbed Soil Temperature Tw,ref [K] | Heat Transfer Rate [kW] by Equation (3) | Estimated Methane Flow Rate per m2 [m3/ h·m2] | Estimated Methane Mass Flow Rate [kg/h] |
|---|---|---|---|---|---|---|
| 1A | 960 | 281.5 | 277.3 | 118.5 | 0.0607 | 38.28 |
| 1B | 1500 | 280.5 | 277.3 | 141.0 | 0.0462 | 45.53 |
Publisher’s Note: MDPI stays neutral with regard to jurisdictional claims in published maps and institutional affiliations. |
© 2020 by the authors. Licensee MDPI, Basel, Switzerland. This article is an open access article distributed under the terms and conditions of the Creative Commons Attribution (CC BY) license (http://creativecommons.org/licenses/by/4.0/).
Share and Cite
MDPI and ACS Style
Tanda, G.; Balsi, M.; Fallavollita, P.; Chiarabini, V. A UAV-Based Thermal-Imaging Approach for the Monitoring of Urban Landfills. Inventions 2020, 5, 55. https://0-doi-org.brum.beds.ac.uk/10.3390/inventions5040055
AMA Style
Tanda G, Balsi M, Fallavollita P, Chiarabini V. A UAV-Based Thermal-Imaging Approach for the Monitoring of Urban Landfills. Inventions. 2020; 5(4):55. https://0-doi-org.brum.beds.ac.uk/10.3390/inventions5040055
Chicago/Turabian StyleTanda, Giovanni, Marco Balsi, Paolo Fallavollita, and Valter Chiarabini. 2020. "A UAV-Based Thermal-Imaging Approach for the Monitoring of Urban Landfills" Inventions 5, no. 4: 55. https://0-doi-org.brum.beds.ac.uk/10.3390/inventions5040055