Optimization of Power and Levelized Cost for Shrouded Small Wind Turbine


Faculty of New Sciences and Technologies, University of Tehran, Tehran 143995713, Iran
*
Author to whom correspondence should be addressed.
Inventions 2020, 5(4), 59; https://0-doi-org.brum.beds.ac.uk/10.3390/inventions5040059
Submission received: 22 October 2020
/
Revised: 25 November 2020
/
Accepted: 4 December 2020
/
Published: 9 December 2020
(This article belongs to the Special Issue New Advances and Challenges in Wind Energy Extraction II)
Abstract
:Nowadays, by increasing energy demand and considering the importance of environmental issues in recent decades, the use of renewable energies is expanding. Among renewable energies, wind power and its technology are growing and evolving more rapidly. Resource assessment in Iran has revealed the significant potential of wind energy around the country. To further develop wind energy in the country and create large-scale wind power plants, the consideration of distributed power generation using small wind turbines for applications in agricultural and residential use is needed. Conventional small wind turbines and small wind lens turbines have been developed in recent years. In this research project, a small wind lens turbine is designed. The advantages of this turbine are an increased production capacity and reduced cut-in speed and noise pollution. In this study, a lens (or shroud) is added to a small turbine, and the maximized annual energy production (AEP) and minimization of the levelized cost of energy (LCOE) are modeled. We applied the NSGA-II algorithm for optimization to find the best answer. The input parameters in the objective function of the AEP are cut-in, cut-out, rated speeds, scale factor, and shape factor. Additionally, the input parameters in the objective function of the LCOE are the power production, initial capital cost, annual operating expenses, and balance of energy. The results indicate that installing a wind lens turbine in Kish Island led to an LCOE decrease of 56% on average, and we can see an 83% increase in the AEP. In the Firoozkooh area, an average reduction of 59% in the LCOE and 74% increase in the AEP for a wind lens turbine is observed.
1. Introduction
In recent decades, regarding the Kyoto Protocol and the Paris Agreement, it is clear that the world is ready for a change in terms of energy consumption and greenhouse gas (GHG) emission. Regardless of international laws, most countries are taking their first steps toward a new energy era [1]. In addition to the development and achievement of new technologies, humans gradually trend toward new energy sources. The introduction of new energy sources and their market share enhancements has been a slow process for several decades. New technology must allocate at least 20% of the market and be reliable for other new technologies to play a crucial role in the world’s energy supply. According to International Energy Agency (IEA) reports, almost half of the world’s newly installed power generation capacity has been contributed by renewable energies since 2014 [2,3]. The future transition of energy may not lead to a specific source of energy. It seems that several energy sources are simultaneously competing with each other to increase their market shares. Therefore, wind energy, like other renewable energy sources that are geographically distributed and decentralized, is growing its share in current global energy markets [4,5,6].
In 1956 [7], investigations on the windmill, which were equipped as ducted land types, reported a 30% increment in power output. It was reported that the windmill’s power was proportional to the expansion of a cross-section of the duct. It was also noted that the impact of sudden fluctuations on the wings of the windmill was decreased. In the 1970s, significant experiments on wind tunnels were conducted by Oman Foreman, K.M., Gilbert, B.L. [8], Igra [9], and Kogan and Seginer [10], and their results were more critical than in preliminary investigations. The first study of the modern wind turbine, equipped with shrouds, was presented by Igra [9]. Igra pointed to the positive impact of the lens on the output power’s efficiency and noted that the cross-sectional area’s excess increment toward the output stream led to flow separation within the shroud and reduced turbine efficiency.
Moreover, in the supplementary report in 1980, Igra presented the effect of lens channels tested in a wind tunnel, in which an 80% increment of efficiency was observed. In the 1980s, Gilbert, Oman, and Foreman [11], Gilbert and Foreman [12], and Igra [13] studied turbines with a similar mechanism, known as a diffuser-augmented wind turbine, which was based on employing a diffuser around the wind turbine for wind energy concentration. A slot on the diffuser, the boundary layer control, and increasing the pressure drop simultaneously prevented flow separation and increased the wind turbine’s inlet flow [14,15,16].
Phillips, Flay, and Nash [17] tested a wind lens turbine named Vortec 7. The original idea of the wind lens turbine was given by Vortec 7. Another improvement of this area came from Abe and Ohya [18], who test small-type wind turbines by adding a flanged diffuser. Their results showed an incremental increase in production capacity and power coefficient. Ohya et al. [19] performed experimental studies and simulations with the diffuser shroud and succeeded in presenting the next generation of turbines, called wind lens turbines. Their turbine’s most crucial feature was an expanding loop design at the end of the diffuser shroud.
Al-Sulaiman and Yilbas [20] carried out a thermoeconomic analysis of wind lens turbines. Using exergy analysis and mathematical modeling, they investigated the impact of the external and internal cross-sectional area ratio and free flow velocity on the turbines’ performance. Their investigations resulted in a decreasing total energy cost as a function of wind velocity [21] using MATLAB’s Simulink and a fuzzy neural network algorithm, improving a model to determine some main parameters’ effects on wind lens turbine performance. They used the simulation data as input for their model to calculate the effects of adding a flow diffuser on the power factor, coefficient of torque, and rotation velocity.
Kosasih and Tondelli [22] performed an optimization study on the shrouded micro-wind turbine’s geometrical characteristics. They studied the three types of wind turbines: straight diffuser, nozzle diffuser, and diffuser brim. A micro-turbine executed their experiments with a 190 mm diameter rotor. Setting up a straight diffuser and a nozzle diffuser led to a 60% increase in output power performance, and a diffuser brim led to a 63% increase. Although no effect was observed by increasing the diffuser’s length, using the brim to increase the turbine’s efficiency was observed, decreasing the cut-in speed and improving optimal values.
In recent years, numerous optimization studies were performed to investigate the various aspects of wind turbine sites. Marmidis, Lazarou, and Pyrgioti [23] minimized wind farm costs by using Monte Carlo simulations. Emami and Noghreh [24] used genetic algorithms to solve such optimization problems. In both optimizations, only the minimization of the total energy cost was considered; the turbine’s design was not considered. Wang [25] minimized the rotor cost as a function of the variation in wing shape; he was using NSGA-II. Kamjoo et al. [26] studied the optimized hybrid system of photovoltaic panels, wind turbines, and battery storage. Their objective function was minimizing total costs and maximizing system reliability.
Part of the competition between renewable energy sources depends on the level of technology. The efficiency of technologies or high-density energy resources plays a deterministic role in the current market [27]. By reducing the volume of necessary energy, high-efficiency energy technologies perform this role [28]. During the past decade, wind turbine technology has been prominently developed and progressed; the wind lens turbine and the Invelox turbine [29] are two high energy efficiency examples. Researchers have shown that increasing wind power utilization is possible via a lens around the rotor [30].
According to the mentioned investigations, increasing the efficiency and utilization of renewable energies should be considered a strategic policy for Iran, especially in the electricity generation industry. Regarding this important issue, the distributed generation of renewable energy projects has been established to elevate the country’s distributed generation and increase electricity generation from renewable energies. To reduce the wind lens turbine’s levelized cost and improve its technology, Iran requires a strict policy for assessment and the creation of distributed generation power plants. Considering the two different Iran regions when regarding wind patterns, the optimization algorithm (NSGAII) is used to investigate the annual energy production and the levelized cost in this paper. In addition, the importance of distributed generation via this technology is represented. It is the first time a lensed wind turbine is modeled, analyzed, and tested for different wind patterns in Iran. We plan to develop and generate an optimized version of this small-lensed turbine to use in the agricultural sector for water pumping systems in low-wind areas. The annual energy cost and the levelized cost are compared for wind turbines with and without the lens in two regions with different wind patterns. If lensed turbines are approved in the levelized cost of energy (LCOE), it can be useful for other readers in different areas, particularly in the Middle East region.
2. Optimization
The multi-objective optimization can be defined as follows:
Maximize y = f(x) = (f1(x), f2(x), …, fk(x));
Subject to e(x) = (e1(x), e2(x) ,…, em(x));
x = (x1, x2,…,xn) ∈ X
y = (y1, y2,…,yk) ∈ Y
where X is a decision vector X is a decision space, and Y is an objective space.
Once the optimization includes more than one function, finding one or more optimal solutions can be called optimization. In optimization problems, a solution that optimizes all objective functions simultaneously does not necessarily exist; therefore, the Pareto front is introduced. Pareto analysis is a technique used for decision-making based on the 80/20 rule. This means the Pareto analysis is based on the idea that 80% of a project’s benefit can be achieved by doing 20% of the work or, conversely, 80% of its problems can be traced to 20% of the causes. The Pareto analysis is a decision-making technique that statistically separates a limited number of input factors as having the most significant impact on an outcome, either desirable or undesirable [31]. In this technique, by applying the 80/20 rule, problems can be sorted based on whether they affect profits or technical issues, maximize the power, and so on. Each of these issues is given a rating based on revenue or energy and time lost.
Two essential principles for optimization can be named [32]: guiding the search path to achieve a Pareto front and creating the optimal solution for the final population. Several Pareto front solutions are usually considered as the definitive answer to decision-making. In this study, to solve the (bi-level) problems, evolutionary algorithms were used, which were selected among the nondominated sorting genetic algorithm’s available techniques.
3. Non-Dominated Sorting Genetic Algorithm
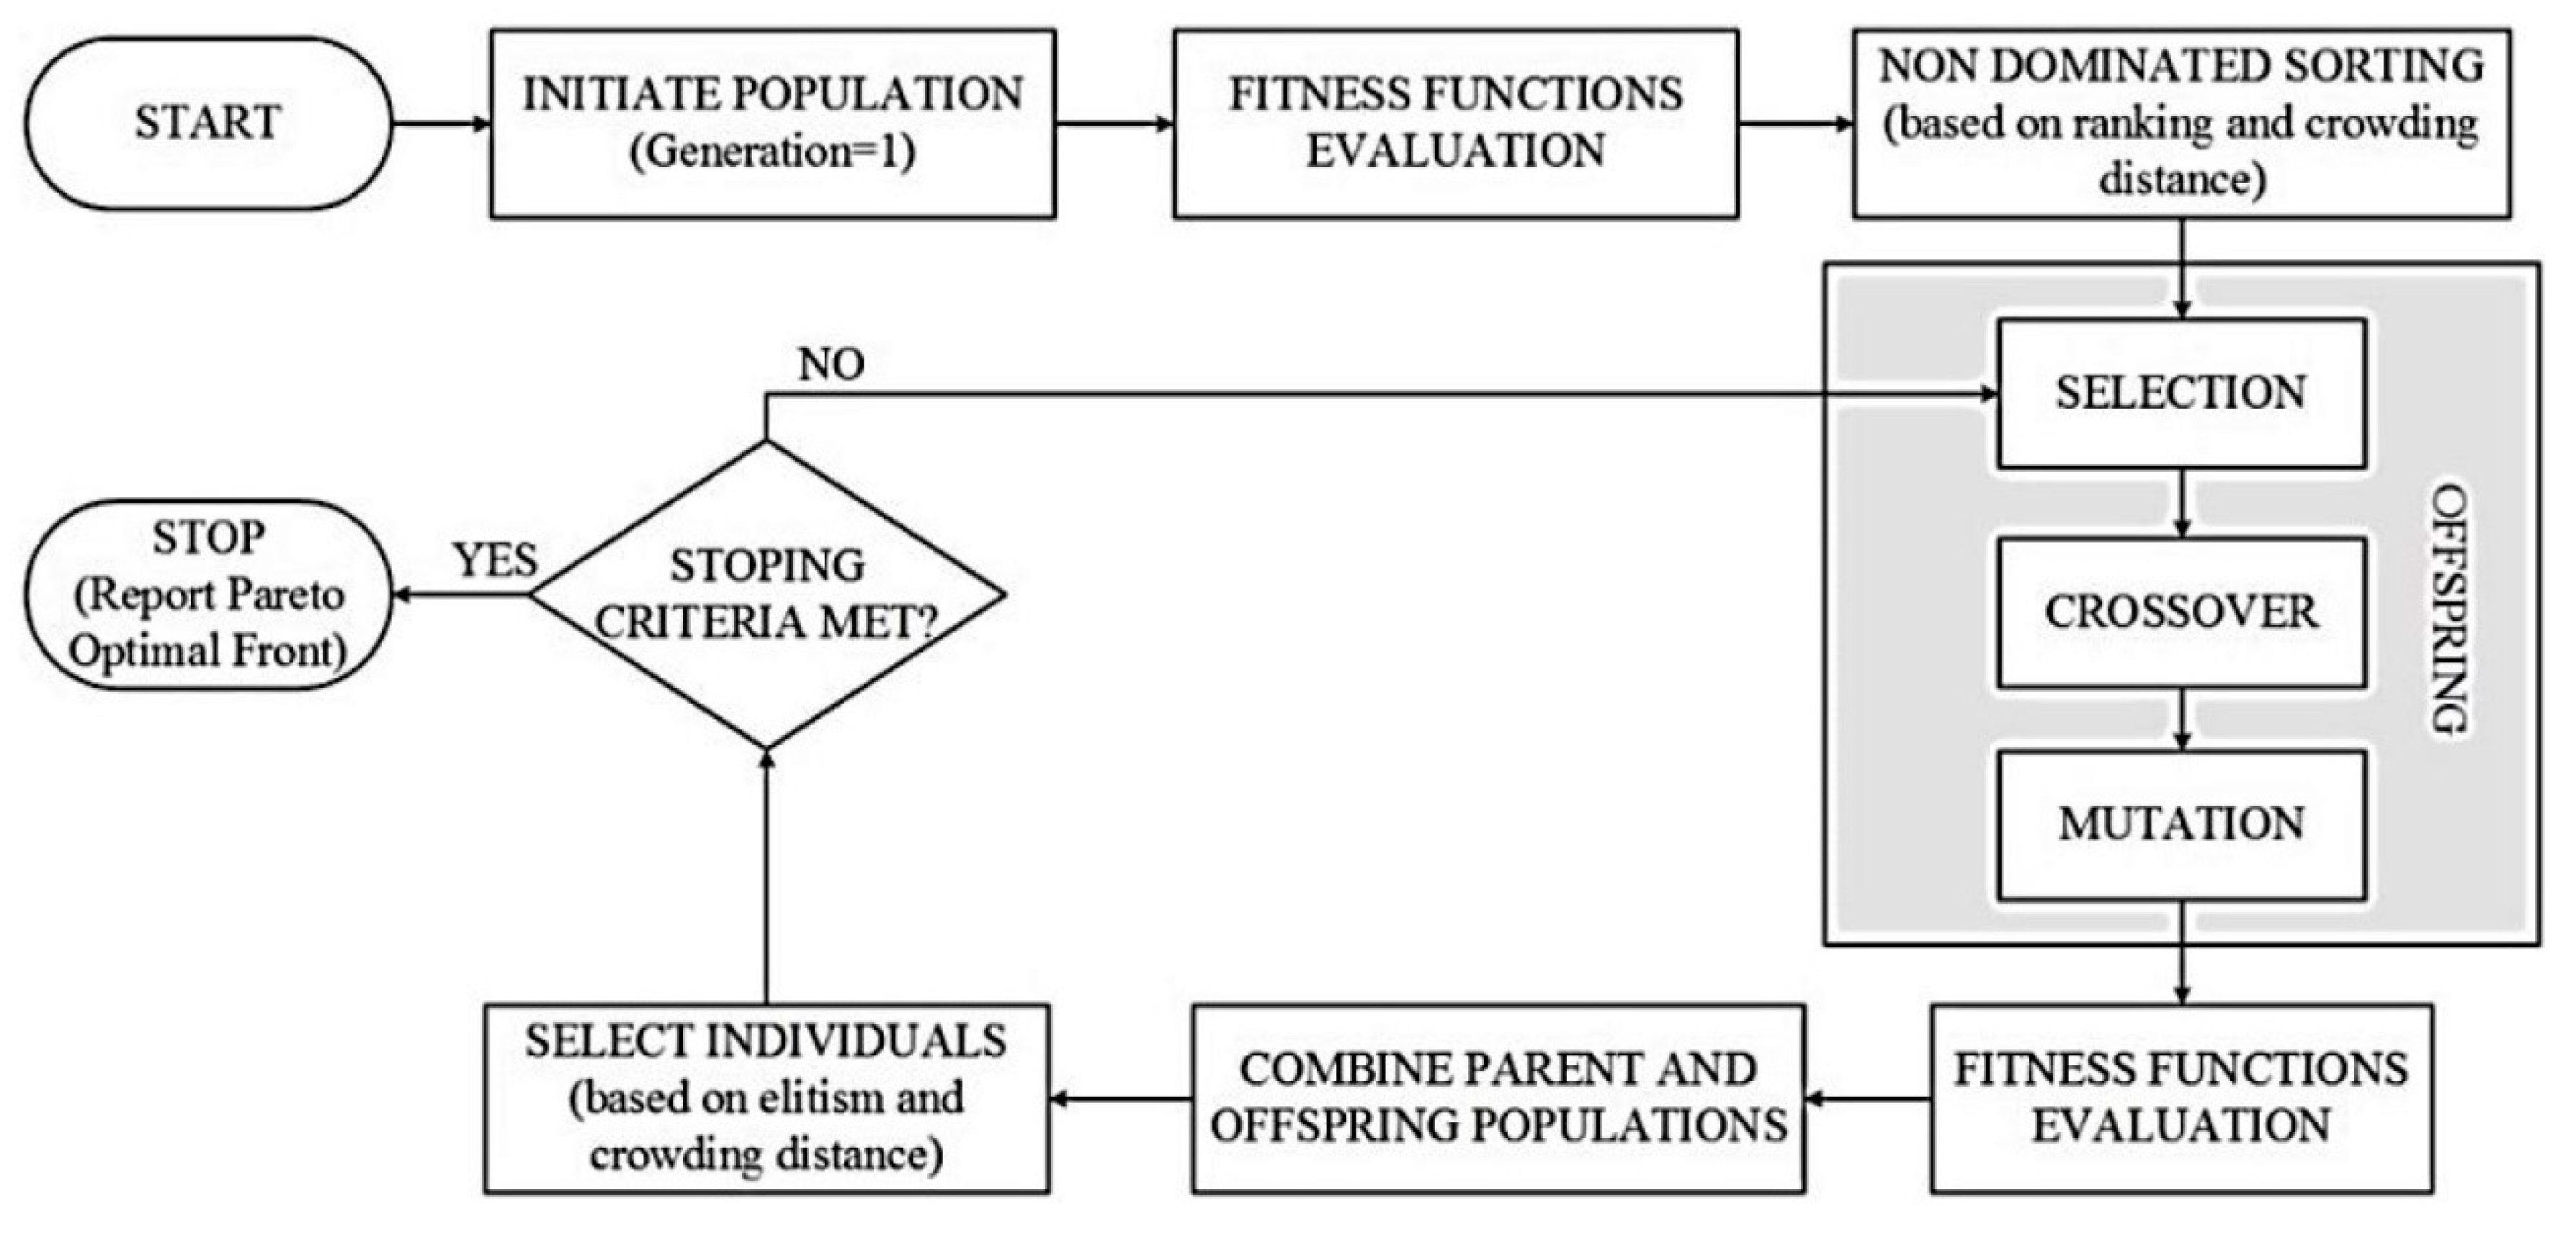
After presenting the first version of the algorithm in 1995, Deb proposed another variation of Goldberg’s approach in 2002 [32] with the abbreviated name of NSGA-II [33]. The algorithm has become multi-objective by adding two essential functions to the common single-objective genetic algorithm. Instead of finding the best answer, the algorithm provides a series of best solutions, known as the Pareto front. These two functions are nondominated and crowding distance functions. These functions help the algorithm explore the fitness landscape. Algorithms have been made in MATLAB software, as have the obtained objective functions. The following steps are summarized in the flowchart of the NSGA-II algorithm to find a set of small wind turbines based on this work (Figure 1) [34].
The variables are as follows: Pr = power wind turbine, = annual operating expenses (AOE), = turbine capital cost (TCC), and = balance of station cost (BOS). The BOS includes foundations, control or electrical hardware, site preparation, the electric collection system and transmission lines, the substation, windfarm control and monitoring equipment, Operations and Maintenance (O and M) facilities and equipment, initial spare parts, shipping, resource assessment, surveying, legal counsel, project management, administration, permits, construction insurance, and engineering services.
The optimization problem can be defined as
The NSGA- II parameters for optimization are shown in Table 1, and the parameters of the objective function for annual energy production (AEP) are shown in Table 2.
In Table 2, Vc is the cut-in speed (m/s), Vr is the rated speed (m/s), Vf is the cut-out speed (m/s), α is the shape parameter (Weibull slope), β is the scale parameter, ρ is the air density (kg/m3), and ρ0 is the air density in standard conditions (kg/m3).
4. The Study Areas
Two areas in Iran with different wind conditions were analyzed for selected diffused small wind turbines for economic feasibility. Kish Island has a 90 km2 area located 18 km from the southern coast of Iran, with the geographical coordinates of 53 degrees east longitude and 26 degrees north latitude. The dominant winds of Kish Island are mostly from the west and southwest. Firoozkooh is a city located 115 km from the capital city of Tehran. Its geographical coordinates are 52 degrees east longitude and 35 degrees north latitude, and it has an altitude of 1450–4076 m above sea level. Firoozkooh is located in the foothills of the Tehran province and has a semi-humid and cold climate. In the Kish and Firoozkooh wind stations, several sensors were installed to measure the wind speed and direction at three heights: 10, 30, and 40 m and 10, 20, and 40 m, respectively. The desired size for data extraction was 10 m, typically equivalent to the small wind turbine’s hubs’ height. This information was collected and published by the Renewable Energy Organization of Iran (SUNA). The data used for Kish Island and Firoozkooh city were from 2006 to 2008 and from 2002 to 2004. The wind data’s time resolution was 10 min, collected in the wind stations installed by SUNA. The Weibull function values and average annual speed are provided in Table 3, which were obtained by analyzing the Kish Island and Firoozkooh city stations’ wind data.
5. Small Wind Turbine Selection
According to the definition in 2-61400-IEC, wind turbines with a rotor swept area less than 200 m2 and a production capacity of about 50 kW are defined as small wind turbines [36]. According to the definition, the wind lens turbine is a kind of turbine surrounded by a brim or lens, making it more efficient [37]. A wind lens turbine is shown in Figure 2.
Small turbines must be designed to have the functionality of working in adverse building conditions. For the promotion of turbines in urban areas, their safety must be assured; they should not cause any inconvenience to the public. How well a building can withstand the turbine rotor’s vibrations should be examined, and the turbine should be matched with the surrounding environment in terms of appearance. Among the mentioned problems, the small wind lens turbine can provide a few solutions for these problems [38].
The turbine studied in this research was a commercial small wind turbine whose specifications are shown in [39]. The lensed turbine, in some cases, responded to the questions raised in the previous paragraph. Table 4 shows the full details, along with the data necessary to calculate the levelized cost of energy for the selected wind turbines.
6. Objective Functions
6.1. Minimize the Levelized Cost of Energy
In the levelized cost of energy (LCOE) method, an approach that is the same as the present value method is used. In this method, the costs become uniform to the annual payment. In other words, the LCOE is defined as a fixed amount of income for selling a single product that can cover all the costs of the project during its lifetime [41].
This paper’s main objective is to select a set of small wind turbines with a new configuration that can produce energy at a minimum cost. To estimate the LCOE, we applied the model suggested by Tegen [42]. The LCOE can be calculated according to Equation (2):
where LCOE is the levelized cost of energy ($/kWh); FCR is the fixed charge rate (1/year); ICC is the initial capital cost ($); AEP is the annual energy production (kWh/year); and AOE is the annual operating expenses ($/year).
The AEP was calculated by combining the wind turbine power curve’s polynomial modeling with the assumed Weibull probability distribution of the wind. The fixed charge rate was the percentage of the total cost required over the life cycle for one year to cover the minimum annual income requirements:
where is the discount rate (%); is the operational life (years); is the effective tax rate (%); and is the present value of depreciation (%). For this study, the discount rate for Iran was 0.18, the operational life was equal to 25 years, and the effective tax rate was 0.15.
In a general case, the fixed charge rate includes income taxes, insurance, property tax, and return on investment. For this paper, the FCR included financing fees, income tax, property tax, depreciation, return on debt and equity, and insurance. The amount of 0.1158 per year was suggested by Fingersh and Laxson [43]. The initial capital cost is the summation of the turbine capital cost and the balance of station cost:
The turbine capital cost included the rotor, lens, control system, condition monitoring, drive train, nacelle, and the tower. To estimate the lens’s cost, we employed the empirical formula based on material, dimension, production cost, and assembly. It should be noted that the dimension lens was calculated by experimental data from Kosasih and Tondelli [22]. The balance of station was calculated for items similar to the foundation, transportation, assembly, engineering services, and required permits.
Annual operating expenses (AOE) include the land lease cost, levelized O and M cost (LRC), and levelized replacement and overhaul cost:
where LRC ($/kWh) is a long-term replacement and overhaul of major components considered a sinking fund factor, LLC ($/kWh) is the rental fees charged for the turbine installation, and O and M ($/kWh) covers the daily planned and random O and M costs of running a wind site.
6.2. Maximize Annual Energy Production (AEP)
The AEP is defined as the energy output for one year for a wind turbine [44]. The AEP can be calculated by applying the averaged power from the power curve to the reference wind speed frequency. In the current work, the turbine power curve was approximated by a polynomial similar to [45,46]:
where vc is the cut-in speed (m/s), vr is the rated speed (m/s); vf is the cut-out speed (m/s), and m is considered to be equal to 2. The AEP in this method can be suggested to be
f(v) can be expressed as follows:
where f(v) is Weibull distribution, α is the shape parameter (Weibull slope), β is the scale parameter, Pr the rated power of the wind turbine (kW), ρ is the air density (kg/m3); and ρ0 is the air density in standard conditions (kg/m3).
The main advantage of this model was its adequate accuracy, though only for pitch-controlled wind turbines. In the present work, to estimate the small wind lens turbine’s cut-in speed, we used experimental data.
7. Results and Discussion
8. Optimization Results
The results indicated that by increasing the turbine size, the levelized cost of energy decreased. However, the TCC, BOS, and AOE simultaneously increased. Thus, there was an agreement between the two objective functions.
8.1. Results of the Study Model Wind Turbine without a Lens for the Kish and Firoozkooh Stations
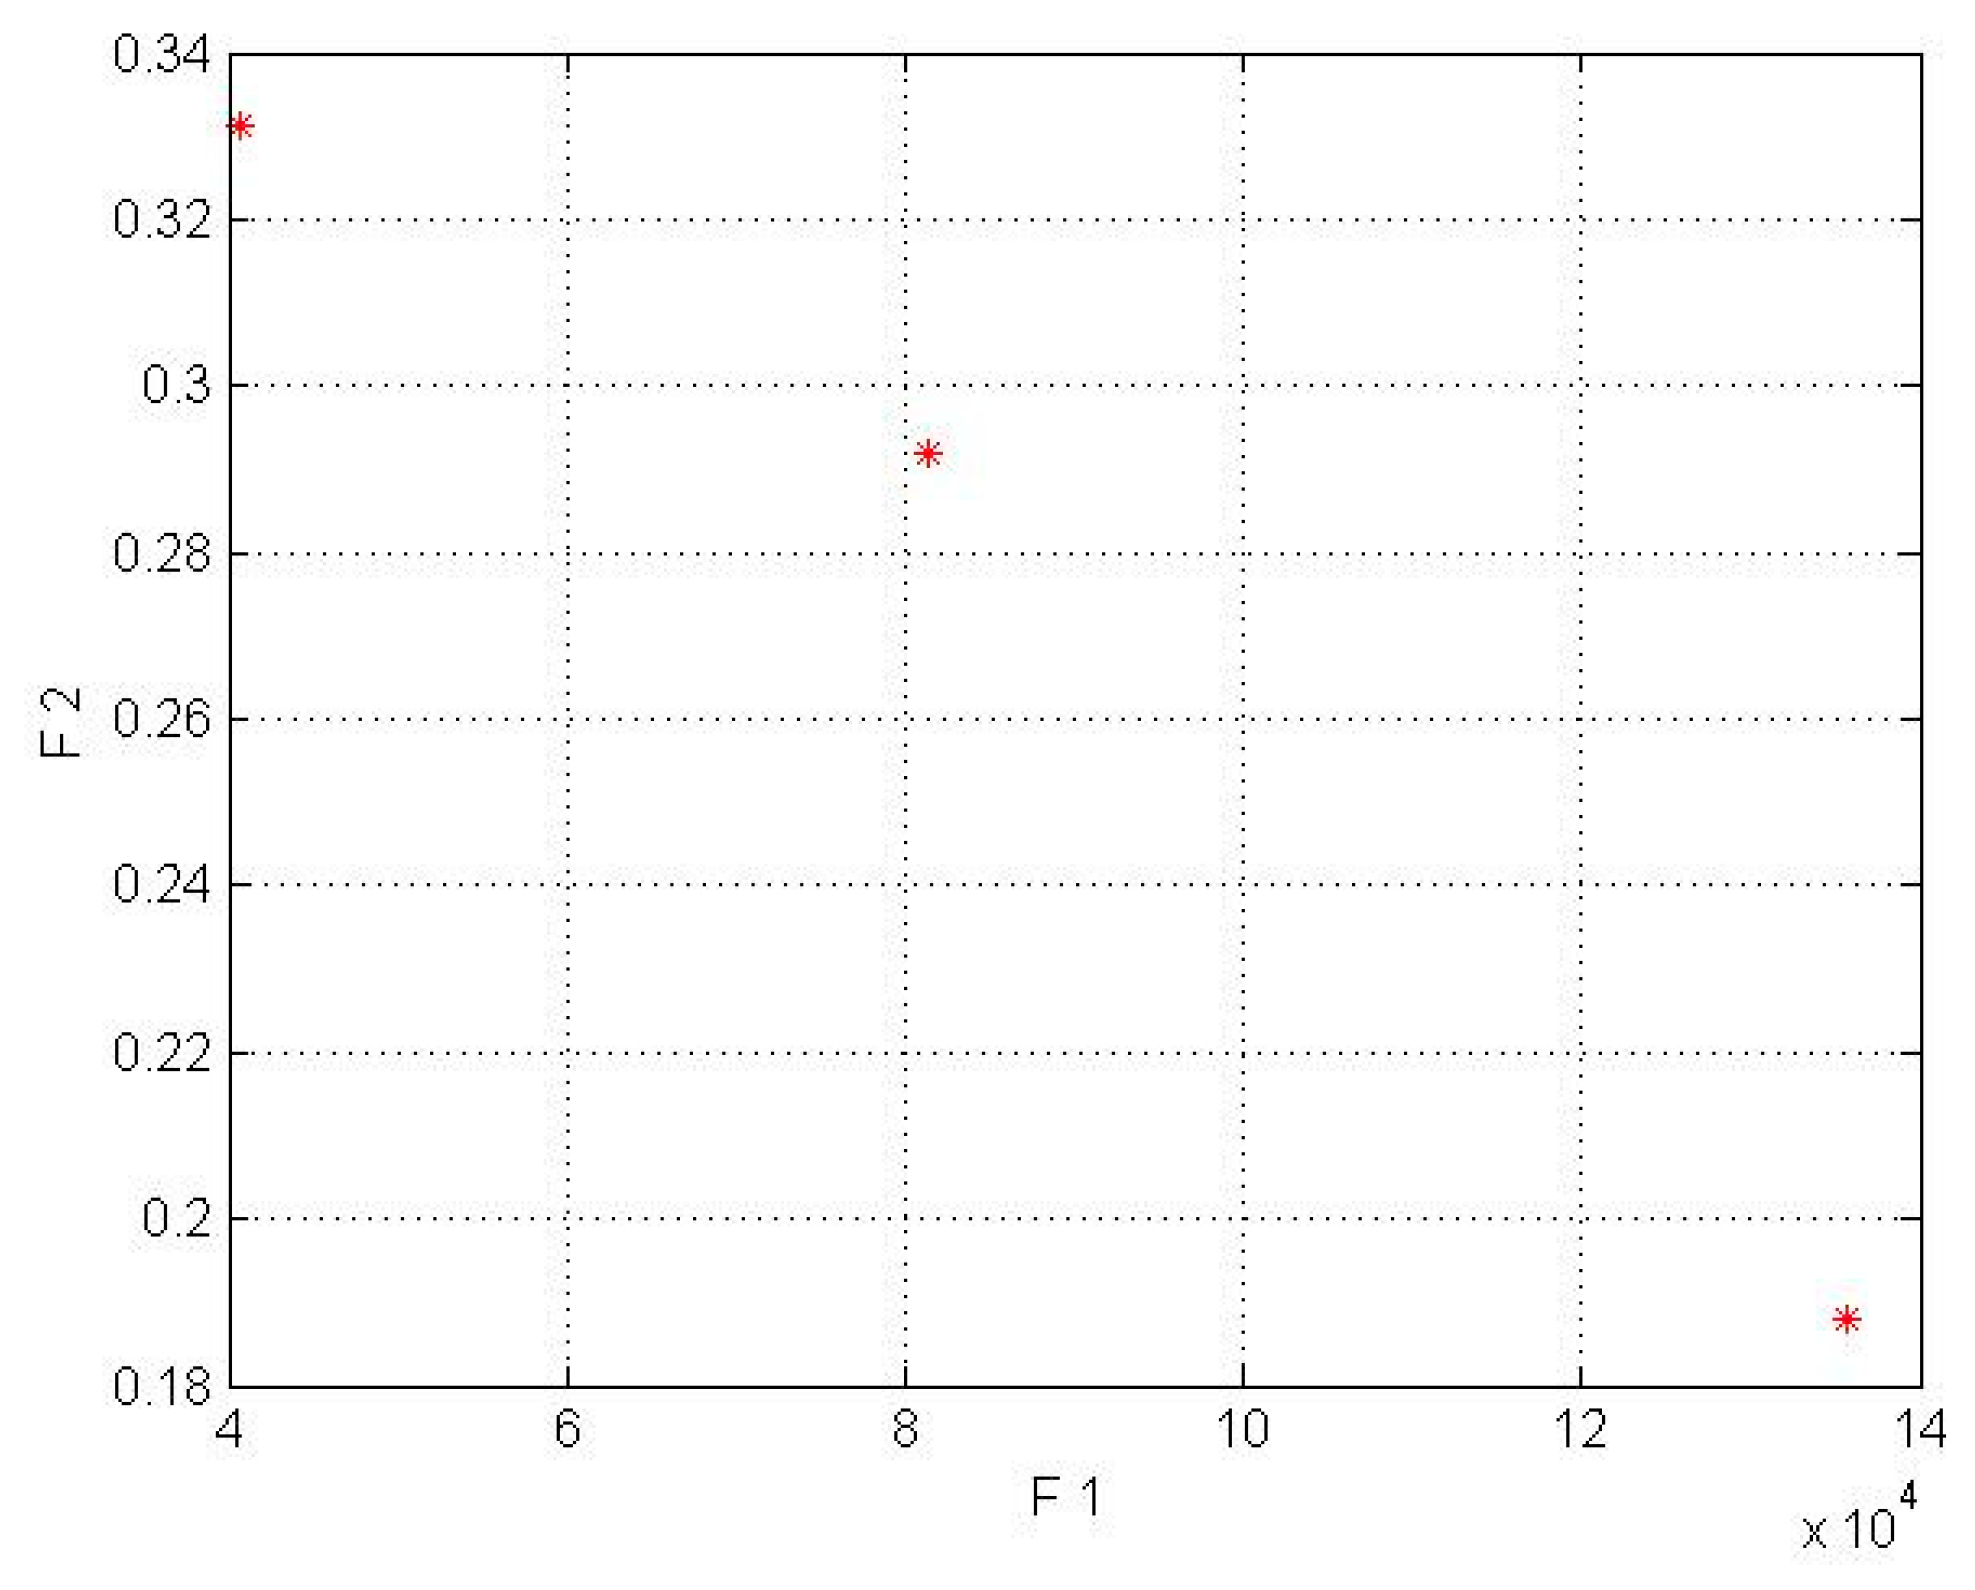
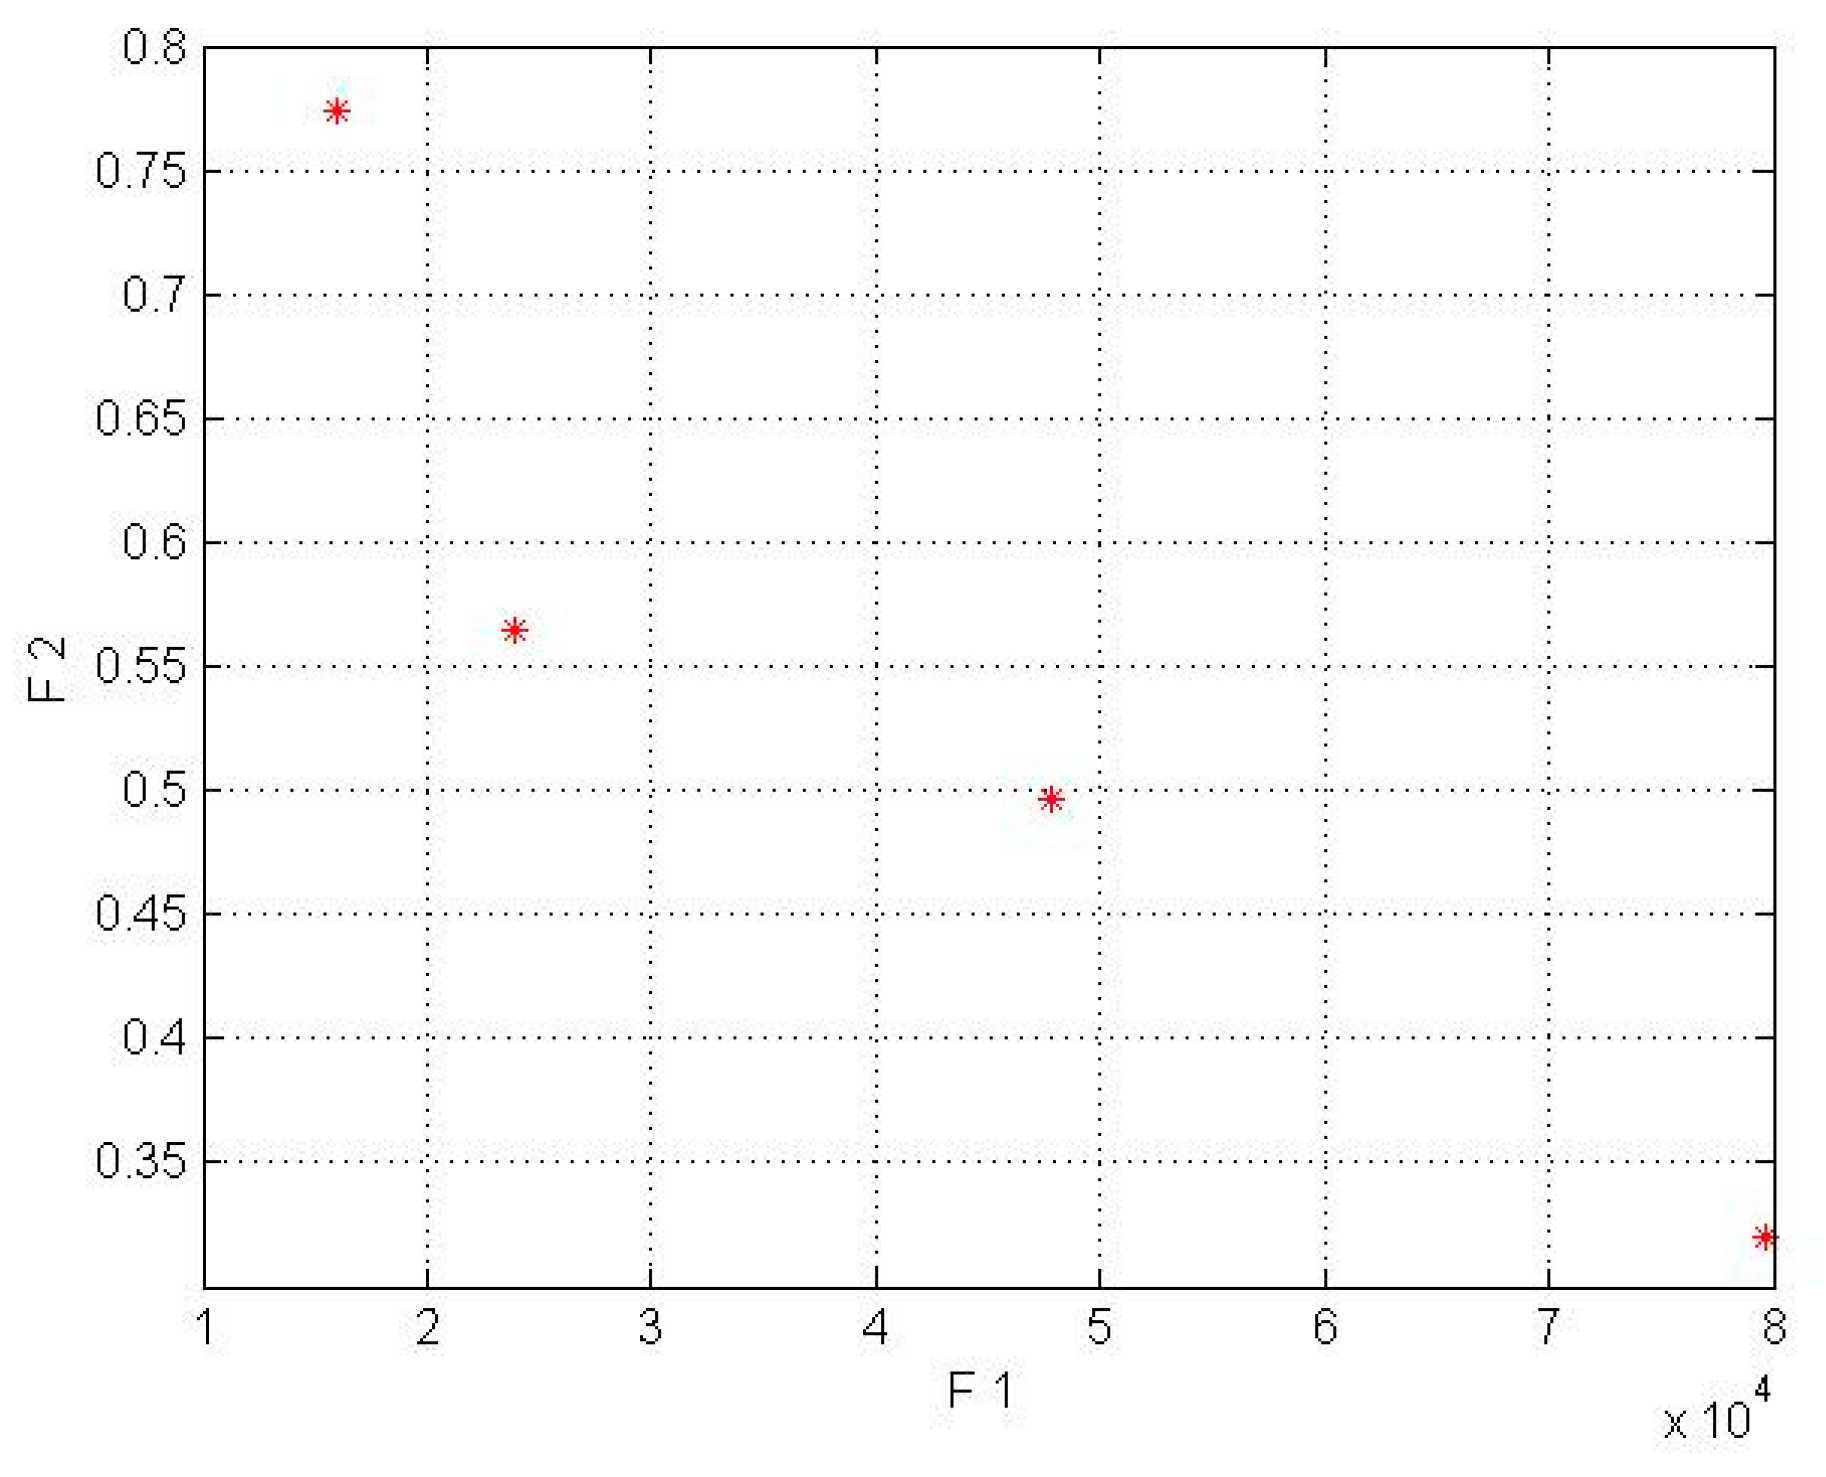
In the model for a wind turbine without a lens, the first objective function’s input parameters are shown in Table 2. The second objective function’s input parameters were obtained from the mathematical equations based on Fingersh’s work [43]. Moreover, it should be mentioned that the population size parameter (in the NSGA-II code) was implemented in 4 different sizes (npop = 5, 7, 8, 10). In the wind turbines without lenses, npop = 6 for the Kish Island station and npop = 8 for the Firoozkooh station had optimum performance. The NSGA-II was run on MATLAB, and the runtime processes for Kish Island and Firoozkooh were 5 and 8.5 s, respectively. The output of the algorithm is shown in Table 6 and in Figure 3 and Figure 4.
The obtained answers complied with our goal to maximize the AEP and to minimize the LCOE. To choose the best solution, the current tariff for purchasing electricity by the government for the distributed generation was used, whose amount for wind power plants with a capacity of less than 1 MW is $0.23 per kilowatt-hour. Due to the mentioned amount, none of the Kish Island turbines that did not have the lens were appropriate for investment, but a turbine without a lens with a capacity of 50 kW in Firoozkooh had the capability of investment.
8.2. Results of the Study Model Wind Lens Turbine for the Kish and Firoozkooh Stations
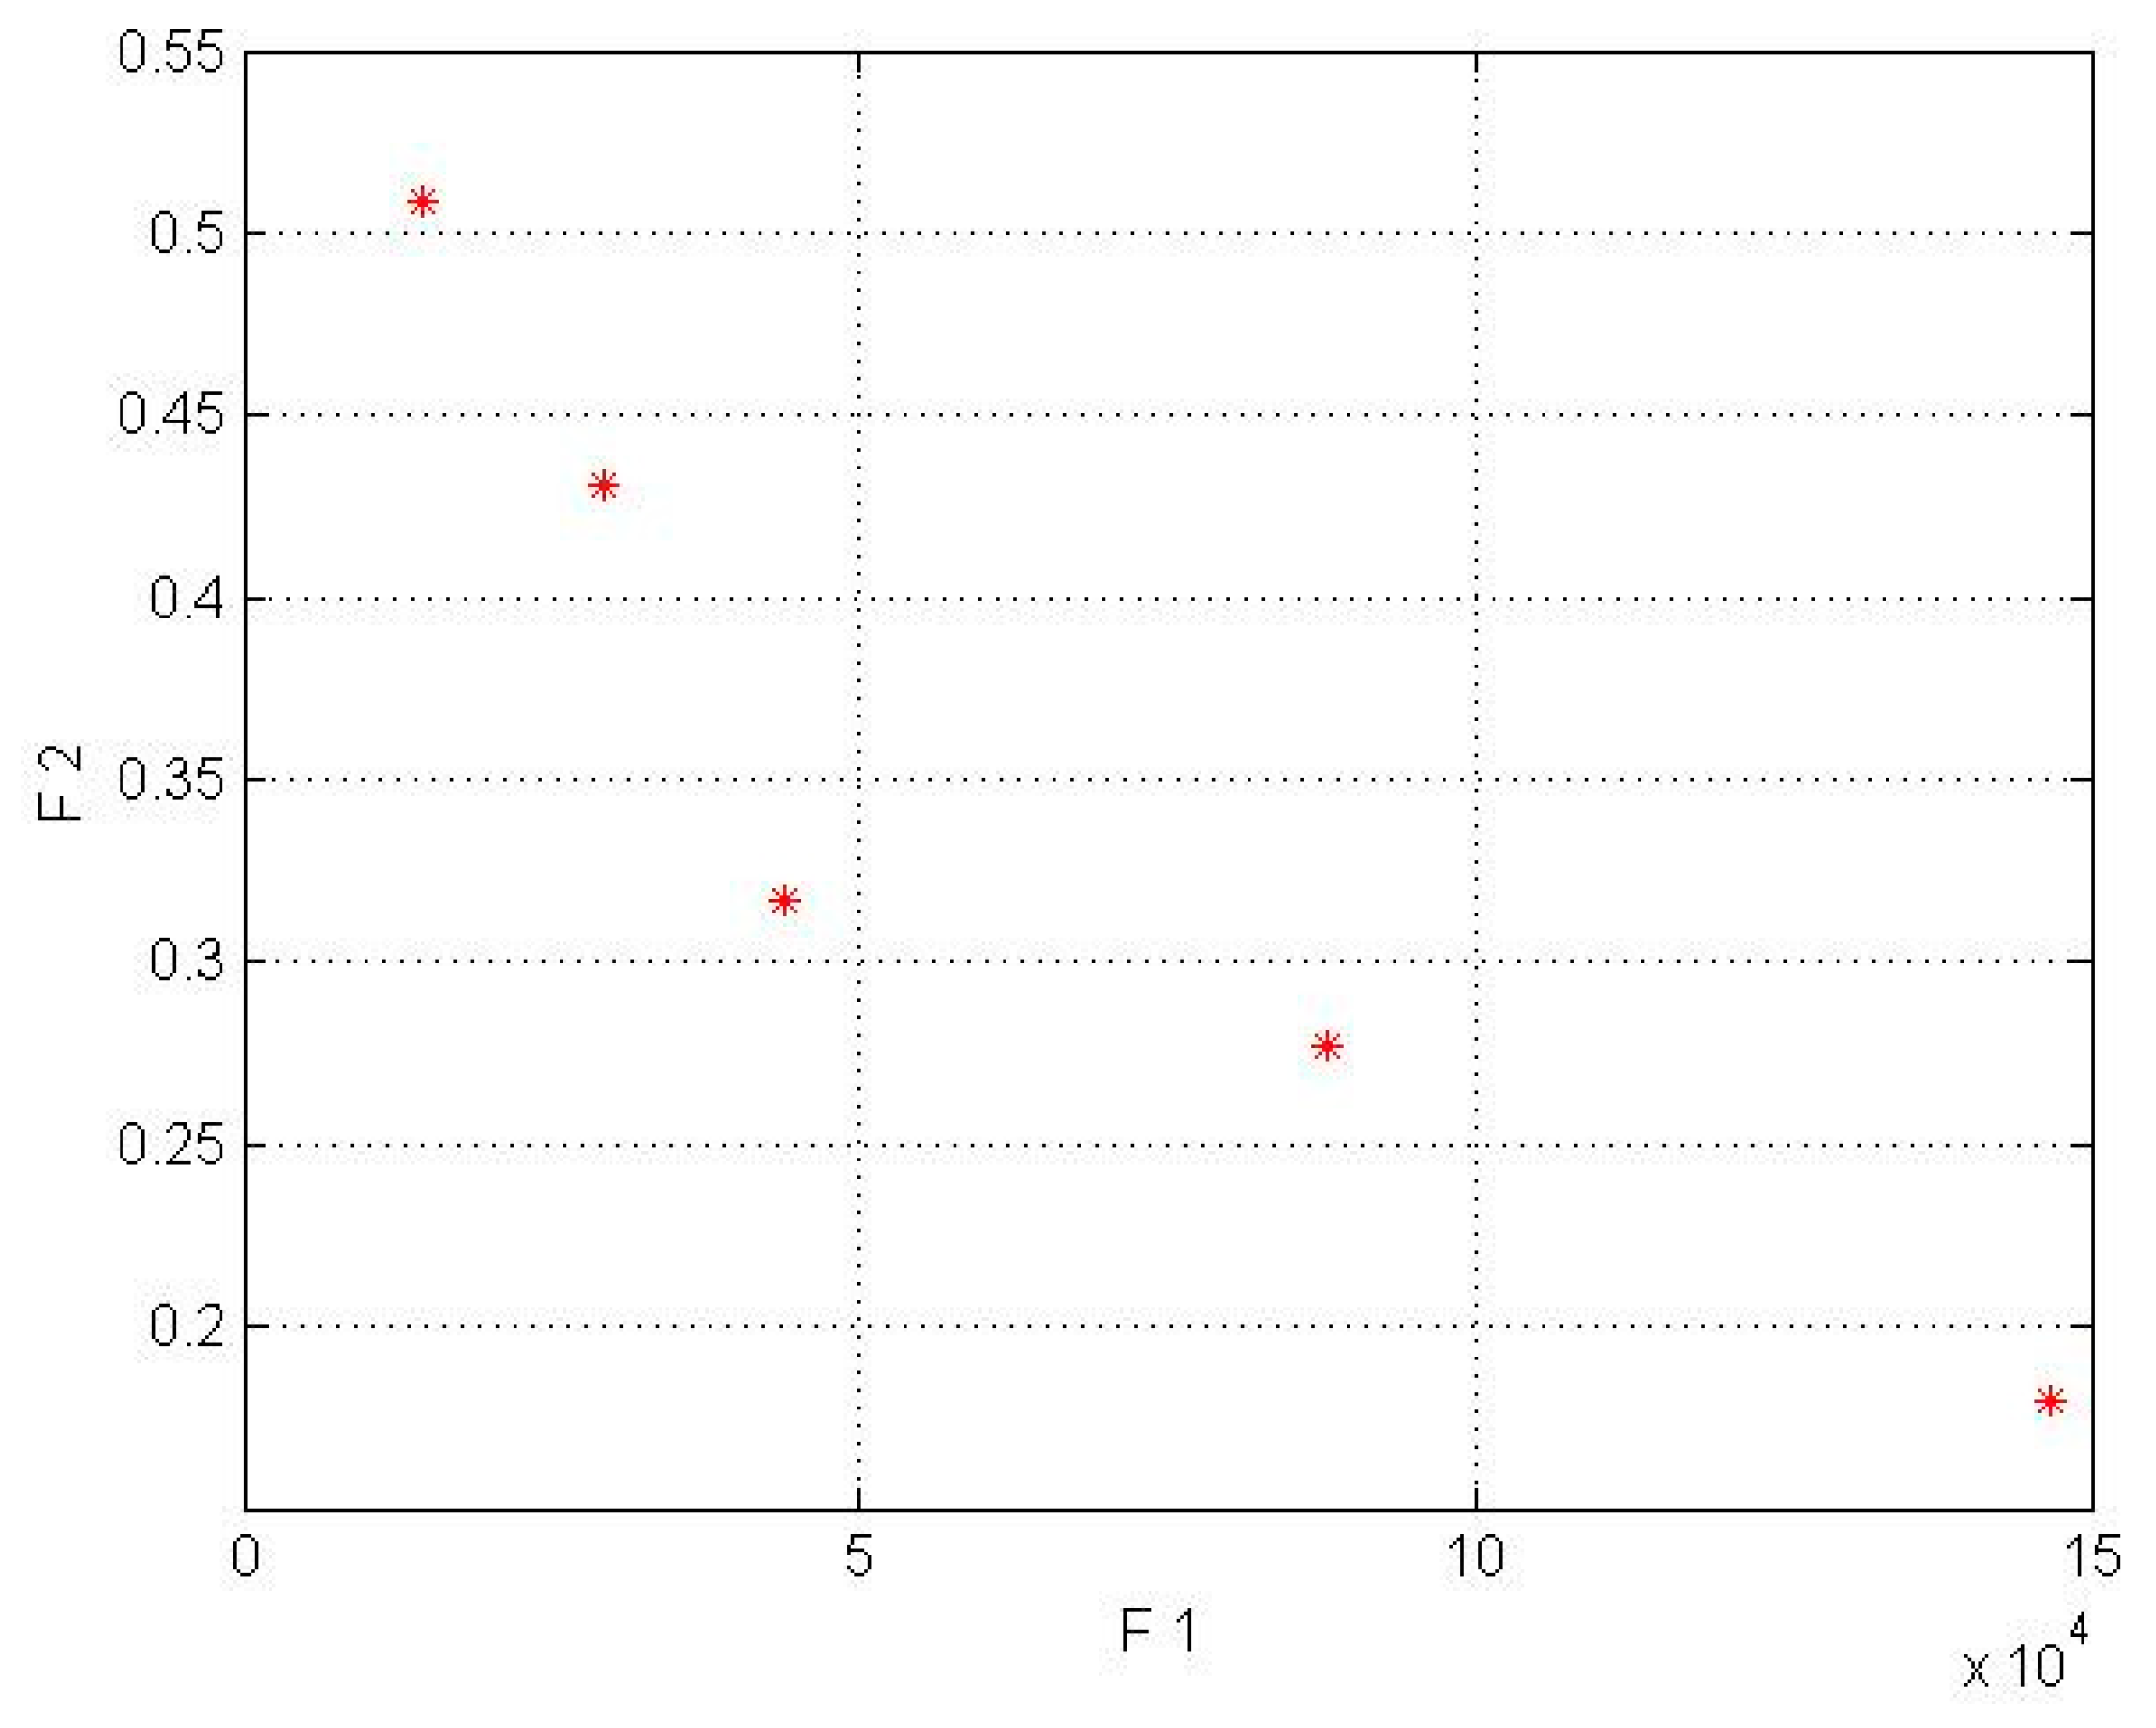
In this model for a wind lens turbine, the input parameters for the first objective function are shown in Table 2, and the input parameters for the second objective function were obtained from the mathematical equations based on Fingersh’s work [43]. Additionally, it should be mentioned that the population size parameter (in NSGA-II code) was implemented in 4 different sizes (npop = 5, 7, 8, 10). In the wind lens turbine, npop = 7 for the Kish Island station and npop = 8 for the Firoozkooh station had optimum performance. NSGA-II was run on MATLAB software, and the runtime processes for Kish Island and Firoozkooh were 3.92 and 6.23 s, respectively. The output of the algorithm is shown in Table 6 and Table 7and in Figure 5 and Figure 6.
By comparing Table 6 and Table 7 for the Kish Island station in the two different setups, an average decrease of 56% in cost energy and an increase of 83% in AEP for the wind lens turbine model can be seen. In addition, the Firoozkooh area in two different models showed an average reduction of 59% in energy cost and an increase of 74% in AEP for the wind lens turbine.
In the wind lens model, the obtained answers were compliant with our goal to maximize the AEP and minimize the LCOE. To choose the best solution, the current tariff for purchasing electricity by the government for the distributed generation was used, whose amount for wind power plants with a capacity of less than one megawatt is $0.23 per kilowatt-hour. Due to the mentioned amount, only the 50 kW turbines for Kish Island and the 50, 30, and 15 kW wind lens turbines for Firoozkooh were appropriate for investment.
In Figure 3, Figure 4, Figure 5 and Figure 6, the F1, F2, AEP, and LCOE are shown. The red points show turbines with optimum performance. It should be noted that the dispersion of the answer points in the NSGA-II is a result of the crowding distance, and it can be ensured that the answer in the proximity (neighborhood) of the optimal solution would be obtained if the standard and allowed values in the range of small wind turbines were determined for the two objective functions.
9. Conclusions
Nowadays, regarding the global climate change concerns based on the Paris agreement, it is clear that the world’s energy supply is subject to change toward cleaner energy technologies. Regardless of international laws, most countries can take their first steps toward a new energy conversion era and the management thereof. Wind energy can be one of the most attractive energy resources.
In this study, adding a lens (or shroud) to maximize the annual energy production (AEP) and minimize the levelized cost of energy was discussed. The NSGA-II algorithm for optimization was applied to find the best answer. The input parameters in the objective function of the AEP were the cut-in speed, cut-out speed, rated speed, scale, and shape factor. Additionally, the input parameters in the objective function of the LCOE were production power, initial capital cost, annual operating expenses, and balance of station.
The results indicated that using distributed generation could be a useful solution for reducing the levelized cost of energy and part of peak demand. High investment in the transmission system will be removed from the national grid by using distributed generation. Regarding these facts, an initial investment in wind energy has shown great promise. Still, with nearly 20 years of the life cycle and LCOE considered suitable, it makes sense to focus on government policy toward this technology.
This study proposed a distributed generation by using a small wind lens turbine for two different regions and analyzed the energy product and economic aspects. A genetic algorithm (NSGA-II) was developed in which the annual energy production (AEP) and levelized cost of energy (LCOE) were determined as the objective functions.
The case study results revealed that installing a wind lens turbine in Kish Island yielded an average decrease of 56% in LCOE and an 83% increase in AEP. The Firoozkooh area in two different models showed an average reduction of 59% in LCOE and a rise of 74% in AEP for the wind lens turbine model.
Author Contributions
Supervision, conceptualization, methodology, and validation reviewing and editing, Y.N.; data curation, software, visualization, and writing—original draft preparation, H.K.; investigation, software, supervision, and validation reviewing and editing M.T.; software, supervision, and validation, M.M. All authors have read and agreed to the published version of the manuscript.
Funding
This research received no external funding.
Acknowledgments
The authors would like to thank the METSAP laboratory for support.
Conflicts of Interest
The authors declare no conflict of interest.
References
- Østergaard, P.A.; Duic, N.; Noorollahi, Y.; Kalogirou, S. Latest Progress in Sustainable Development Using Renewable Energy Technology. Renew. Energy 2020, 162, 1554–1562. [Google Scholar] [CrossRef]
- IEA. World Energy Outlook; International Energy Agency: Paris, France, 2015. [Google Scholar]
- Pishgar-Komleh, S.H.; Akram, A. Evaluation of wind energy potential for different turbine models based on the wind speed data of Zabol region, Iran. Sustain. Energy Technol. Assess. 2017, 22, 34–40. [Google Scholar] [CrossRef]
- Noorollahi, Y.; Yousefi, H.; Mohammadi, M. Multi-criteria decision support system for wind farm site selection using GIS. Sustain. Energy Technol. Assess. 2016, 13, 38–50. [Google Scholar] [CrossRef]
- Noorollahi, Y.; Jokar, M.A.; Kalhor, A. Using artificial neural networks for temporal and spatial wind speed forecasting in Iran. Energy Convers. Manag. 2016, 115, 17–25. [Google Scholar] [CrossRef]
- Noorollahi, Y.; Itoi, R.; Yousefi, H.; Mohammadi, M.; Farhadi, A. Modeling for diversifying electricity supply by maximizing renewable energy use in Ebino city southern Japan. Sustain. Cities Soc. 2017, 34, 371–384. [Google Scholar] [CrossRef]
- Lilley, G.M.; Rainbird, W.J.; Association, E.R. A Preliminary Report on the Design and Performance of Ducted Windmills; College of Aeronautics: New York, NY, USA, 1956. [Google Scholar]
- Oman Foreman, K.M.; Gilbert, B.L. A Progress Report on the Diffuser Augmented Wind Turbine. In Proceedings of the 3rd Biennial Wind energy Conversion Systems Conference, Washington, DC, USA, 1 May 1975; pp. 826–829. [Google Scholar]
- Igra, O. Cost-effectiveness of the vortex-augmented wind turbine. Energy 1979, 4, 119–130. [Google Scholar] [CrossRef]
- Kogan, A.; Seginer, A. Shrouded Aerogenerator Design Study II, Axisymmetrical Shroud Performance; Technion-Israel Institute of Technology, Department of Aeronautical Engineering: Tel-Aviv, Israel, 1963; p. 86. [Google Scholar]
- Gilbert, B.L.; Oman, R.A.; Foreman, K.M. Fluid dynamics of diffuser-augmented wind turbines. J. Energy 1978, 2, 368–374. [Google Scholar] [CrossRef]
- Gilbert, B.L.; Foreman, K.M. Experiments with a Diffuser-Augmented Model Wind Turbine. J. Energy Resour. Technol. 1983, 105, 46–53. [Google Scholar] [CrossRef]
- Igra, O. Research and development for shrouded wind turbines. Energy Convers. Manag. 1981, 21, 13–48. [Google Scholar] [CrossRef]
- Vasel-Be-Hagh, A. Wind farms with counter-rotating wind turbines. Sustain. Energy Technol. Assess. 2016. [Google Scholar] [CrossRef]
- Said, M.; EL-Shimy, M.; Abdelraheem, M.A. Improved framework for techno-economical optimization of wind energy production. Sustain. Energy Technol. Assess. 2017, 23, 57–72. [Google Scholar] [CrossRef]
- Waewsak, J.; Kongruang Chuleerat, G.Y. Assessment of wind power plants with limited wind resources in developing countries: Application to Ko Yai in southern Thailand. Sustain. Energy Technol. Assess. 2017, 19, 79–93. [Google Scholar] [CrossRef]
- Phillips, D.G.; Flay, R.G.J.; Nash, T.A. Aerodynamic analysis and monitoring of the Vortec 7 diffuser-augmented wind turbine. Trans. Inst. Prof. Eng. New Zealand. Electr. Mech. Chem. Eng. Sect. 1999, 26, 13–19. [Google Scholar]
- Abe, K.; Ohya, Y. An investigation of flow fields around flanged diffusers using CFD. J. Wind Eng. Ind. Aerodyn. 2004, 92, 315–330. [Google Scholar] [CrossRef]
- Ohya, Y.; Karasudani, T.; Sakurai, A.; Abe, K.; Inoue, M. Development of a shrouded wind turbine with a flanged diffuser. J. Wind Eng. Ind. Aerodyn. 2008, 96, 524–539. [Google Scholar] [CrossRef]
- Al-Sulaiman, F.A.; Yilbas, B.S. Thermoeconomic analysis of shrouded wind turbines. Energy Convers. Manag. 2015, 96, 599–604. [Google Scholar] [CrossRef]
- Nikolić, V.; Petković, D.; Shamshirband, S.; Ćojbašić, Ž. Adaptive neuro-fuzzy estimation of diffuser effects on wind turbine performance. Energy 2015, 89, 324–333. [Google Scholar] [CrossRef]
- Kosasih, B.; Tondelli, A. Experimental Study of Shrouded Micro-Wind Turbine. Procedia Eng. 2012, 49, 92–98. [Google Scholar] [CrossRef] [Green Version]
- Marmidis, G.; Lazarou, S.; Pyrgioti, E. Optimal placement of wind turbines in a wind park using Monte Carlo simulation. Renew. Energy 2008, 33, 1455–1460. [Google Scholar] [CrossRef]
- Emami, A.; Noghreh, P. New approach on optimization in placement of wind turbines within wind farm by genetic algorithms. Renew. Energy 2010, 35, 1559–1564. [Google Scholar] [CrossRef]
- Wang, X.; Wen Zhong, S.; Wei Jun, Z.; Jens Nørkær, S.; Chen, J. Shape optimization of wind turbine blades. Wind Energy 2009, 12, 781–803. [Google Scholar] [CrossRef]
- Kamjoo, A.; Maheri, A.; Dizqah, A.M.; Putrus, G.A. Multi-objective design under uncertainties of hybrid renewable energy system using NSGA-II and chance constrained programming. Int. J. Electr. Power Energy Syst. 2016, 74, 187–194. [Google Scholar] [CrossRef]
- Østergaard, P.A.; Duic, N.; Noorollahi, Y.; Mikulcic, H.; Kalogirou, S. Sustainable development using renewable energy technology. Renew. Energy 2020, 146, 2430–2437. [Google Scholar] [CrossRef]
- Ahmadi-Baloutaki, M.; Carriveau Rupp, T.D.S.-K. Performance of a vertical axis wind turbine in grid generated turbulence. Sustain. Energy Technol. Assess. 2015, 11, 178–185. [Google Scholar] [CrossRef]
- Allaei, D.; Andreopoulos, Y. INVELOX: Description of a new concept in wind power and its performance evaluation. Energy 2014, 69, 336–344. [Google Scholar] [CrossRef] [Green Version]
- Shirgholami, Z.; Namdar Zangeneh Soudabeh, B.M. Decision system to support the practitioners in the wind farm design: A case study for Iran mainland. Sustain. Energy Technol. Assess. 2016, 16, 1–10. [Google Scholar] [CrossRef]
- Elsevier Pareto Principle-an Overview ScienceDirect Topics. Available online: https://0-www-sciencedirect-com.brum.beds.ac.uk/topics/computer-science/pareto-principle (accessed on 24 November 2020).
- Deb, K.; Pratap, A.; Agarwal, S.; Meyarivan, T. A fast and elitist multiobjective genetic algorithm: NSGA-II. Evol. Comput. IEEE Trans. 2002, 6, 182–197. [Google Scholar] [CrossRef] [Green Version]
- Coello, C.C.; Lamont, G.B.; van Veldhuizen, D.A. Evolutionary Algorithms for Solving Multi-Objective Problems; Springer: New York, NY, USA, 2007; ISBN 9780387367972. [Google Scholar]
- Deb, K.; Sinha, A. An efficient and accurate solution methodology for bilevel multi-objective programming problems using a hybrid evolutionary-local-search algorithm. Evol. Comput. 2010, 18, 403–449. [Google Scholar] [CrossRef]
- Lukic, N.L.; Bozin-Dakic, M.; Grahovac, J.A.; Dodic, J.M.; Jokic, A.I. Multi-objective optimization of microfiltration of baker’s yeast using genetic algorithm. Acta Period. Technol. 2017, 48, 211–220. [Google Scholar] [CrossRef] [Green Version]
- Wood, D. Small Wind Turbines: Analysis, Design, and Application; Springer: New York, NY, USA, 2011; ISBN 9781849961752. [Google Scholar]
- Ohya, Y.; Karasudani, T. A Shrouded Wind Turbine Generating High Output Power with Wind-lens Technology. Energies 2010, 3, 634. [Google Scholar] [CrossRef] [Green Version]
- Stankovic, S.; Campbell, N.; Harries, A. Urban Wind Energy; Earthscan: London, UK; ISBN 9781849770262.
- Gao, A. EQ Series Small Wind Turbine Generators Manual. Available online: http://www.callaglory.com/download.html (accessed on 20 June 2016).
- Minaeva, L.P.; Creative Commons Attribution-Share Alike 3.0 Unported, Department of Engineering Kyushu University, Kyushu, Japan. Personal communication, 2014.
- Cassedy, E.S. Prospects for Sustainable Energy: A Critical Assessment; Cambridge University Press: Cambridge, UK, 2000; ISBN 9780521631204. [Google Scholar]
- Tegen, S.; Lantz, E.; Hand, M.; Maples, B.; Smith, A.; Schwabe, P. 2011 Cost of Wind Energy Review; Prepared under Task No. WE11.1201; National Renewable Energy Laboratory: Golden, CO, USA, 2013; p. 50. [Google Scholar]
- Fingersh, L.; Laxson, A.H.M. Wind Turbine Design Cost and Scaling Model; Technical Report NREL/TP-500-40566; National Renewable Energy Laboratory: Golden, CO, USA.
- Hau, E. Wind Turbines: Fundamentals, Technologies, Application, Economics; Springer: New York, NY, USA, 2006; ISBN 9783540242406. [Google Scholar]
- Powell, W.R. An analytical expression for the average output power of a wind machine. Sol. Energy 1981, 26, 77–80. [Google Scholar] [CrossRef]
- Torres, J.L.; Prieto, E.; Garcia, A.; De Blas, M.; Ramirez, F.; De Francisco, A. Effects of the model selected for the power curve on the site effectiveness and the capacity factor of a pitch regulated wind turbine. Sol. Energy 2003, 74, 93–102. [Google Scholar] [CrossRef]
Figure 1.
Flowchart of the NSGA-II optimization algorithm [35].
Figure 1.
Flowchart of the NSGA-II optimization algorithm [35].

Figure 2.
Wind lens turbine [40].
Figure 2.
Wind lens turbine [40].

Figure 3.
Pareto front results for a wind turbine without a lens in Firoozkooh (* shows COE by AEP).
Figure 3.
Pareto front results for a wind turbine without a lens in Firoozkooh (* shows COE by AEP).

Figure 4.
Pareto front results for a wind turbine without a lens in Kish Island (* shows COE by AEP).
Figure 4.
Pareto front results for a wind turbine without a lens in Kish Island (* shows COE by AEP).

Figure 5.
Pareto front for Kish Island in the wind lens turbine model (* shows COE by AEP).

Figure 6.
Pareto front for Firoozkooh in the wind lens turbine model (* shows COE by AEP).


Table 1.
NSGA-II parameters for optimization.
| Parameters | Values |
|---|---|
| Number of population | 5, 6, 7, 8 |
| Number of iterations | 100 |
| Percent of crossover | 0.9 |
| Percent of mutation | 0.1 |
Table 2.
Objective function parameters for the annual energy production (AEP).
| Parameters | Values |
|---|---|
| Vc | 2.73, 3.5 |
| Vr | 10 |
| Vf | 25 |
| m | 2 |
| αkish | 1.71 |
| αfiruzkuh | 1.7 |
| βkish | 4.94 |
| βfiruzkuh | 6.36 |
| ρ/ρ0 | 1 |
Table 3.
Weibull function parameters and average annual wind speed.
| Kish Island Station | Height (m) | 40 | 30 | 10 | |||
| Weibull function parameters | |||||||
| Fitting average annual speed (m/s) | 1.65 | 5.87 5.37 | 1.41 | 5.55 4.96 | 1.71 | 4.94 4.43 | |
| Firoozkooh Station | Height (m) | 40 | 20 | 10 | |||
| Weibull function parameters | |||||||
| Fitting average annual speed (m/s) | 1.81 5.22 | 6.65 | 1.78 4.71 | 6.6 | 1.7 | 6.36 4.98 | |
Table 4.
Specifications of selected small wind turbines.
| Rated Power (kW) | 1 | 2 | 3 | 5 | 6 | 10 | 15 | 20 | 30 | 50 |
|---|---|---|---|---|---|---|---|---|---|---|
| Rated Rotation Speed (rpm) | 450 | 360 | 280 | 220 | 200 | 180 | 155 | 90 | 75 | 60 |
| Rotor Diameter (m) | 2.8 | 3.2 | 4.2 | 5.2 | 5.6 | 8 | 9.8 | 10 | 12 | 13.8 |
| Hub Height | 8 | 8 | 8 | 10 | 11 | 12 | 15 | 18 | 18 | 18 |
| Cut-in Speed (m/s) | 3.5 | 3.5 | 3.5 | 3.5 | 3.5 | 3.5 | 3.5 | 3.5 | 3.5 | 3.5 |
| Cut-out Speed (m/s) | 25 | 25 | 25 | 25 | 25 | 25 | 25 | 25 | 25 | 25 |
| Rated Wind Speed (m/s) | 10 | 10 | 10 | 10 | 10 | 10 | 10 | 10 | 10 | 10 |
Table 5.
Range of variation for the decision variable.
| Reason | Constraints |
|---|---|
| Typical range for the small wind turbine | 1 ≤≤ 50 |
| Calculation based on the relation | 6358 ≤≤ 25033 |
| Calculation based on the relation | 1202 ≤≤ 4153 |
| Calculation based on the relation | 2 ≤ ≤ 97 |
| Calculation based on the relation | 3 ≤ ≤ 157 |
Table 6.
The Pareto front result for a wind turbine without a lens.
| Area | AEP (kWh/year) | COE ($/KWh) | P (kW) |
|---|---|---|---|
| Kish Island | 79,692 | 0.319 | 50 |
| 47,815 | 0.497 | 30 | |
| 23,907 | 0.564 | 15 | |
| 15,938 | 0.773 | 10 | |
| Firoozkooh | 135,700 | 0.187 | 50 |
| 81,420 | 0.291 | 30 | |
| 40,710 | 0.331 | 15 |
Table 7.
The Pareto front results for wind lens turbines.
| AEP (kWh/year) | COE ($/KWh) | P (kW) | |
|---|---|---|---|
| Kish Island | 146,564 | 0.179 | 50 |
| 87,939 | 0.277 | 30 | |
| 43,969 | 0.316 | 15 | |
| 29,313 | 0.431 | 10 | |
| 14,656 | 0.508 | 5 | |
| Firoozkooh | 237,140 | 0.111 | 50 |
| 142,284 | 0.171 | 30 | |
| 71,141 | 0.195 | 15 | |
| 28,456 | 0.268 | 6 | |
| 14,228 | 0.495 | 3 | |
| 9485 | 0.709 | 2 |
Publisher’s Note: MDPI stays neutral with regard to jurisdictional claims in published maps and institutional affiliations. |
© 2020 by the authors. Licensee MDPI, Basel, Switzerland. This article is an open access article distributed under the terms and conditions of the Creative Commons Attribution (CC BY) license (http://creativecommons.org/licenses/by/4.0/).
Share and Cite
MDPI and ACS Style
Khojasteh, H.; Noorollahi, Y.; Tahani, M.; Masdari, M. Optimization of Power and Levelized Cost for Shrouded Small Wind Turbine. Inventions 2020, 5, 59. https://0-doi-org.brum.beds.ac.uk/10.3390/inventions5040059
AMA Style
Khojasteh H, Noorollahi Y, Tahani M, Masdari M. Optimization of Power and Levelized Cost for Shrouded Small Wind Turbine. Inventions. 2020; 5(4):59. https://0-doi-org.brum.beds.ac.uk/10.3390/inventions5040059
Chicago/Turabian StyleKhojasteh, Hasanali, Younes Noorollahi, Mojtaba Tahani, and Mehran Masdari. 2020. "Optimization of Power and Levelized Cost for Shrouded Small Wind Turbine" Inventions 5, no. 4: 59. https://0-doi-org.brum.beds.ac.uk/10.3390/inventions5040059