Article

Voltage Differential Protection for Series Arc Fault Detection in Low-Voltage DC Systems

by
Sundaravaradan Navalpakkam Ananthan
1,*,
Xianyong Feng
2,
Charles Penney
2,
Angelo Gattozzi
2,
Robert Hebner
2 and
Surya Santoso
1
1
Department of Electrical and Computer Engineering, The University of Texas at Austin, Austin, TX 78712, USA
2
Center for Electromechanics, The University of Texas at Austin, Austin, TX 78712, USA
*
Author to whom correspondence should be addressed.
Submission received: 26 November 2020 / Revised: 22 December 2020 / Accepted: 23 December 2020 / Published: 31 December 2020

Abstract

:
Series arc faults are challenging to detect in low-voltage dc (LVDC) distribution systems because, unlike other fault types, series arc faults result in only small changes in the current and voltage waveforms. Though there have been several approaches proposed to detect series arc faults, each approach has its requirements and limitations. A step change in the current and voltage waveforms at the arc inception is one of the characteristic signatures of these faults that can be extracted without requiring one to sample the waveforms at a very high frequency. This characteristic feature is utilized to present a novel approach based on voltage differential protection to detect series arc faults in LVDC systems. The proposed method is demonstrated using an embedded controller and experimental data that emulate a hardware-in-the-loop (HIL) test environment. The successful detection of series arc faults on two sets of series arc fault experimental data validated the approach. The results presented also illustrate the computational feasibility in implementing the approach in a real-time environment using an embedded controller. In addition, the paper discusses the robustness of the approach to load changes and loss of time synchronization between measurements at the two terminals of the line.

1. Introduction

The use of power-electronic converter based sources and dc loads has led to increased interest in the application of low-voltage dc (LVDC) distribution systems [1]. Renewable energy systems, such as solar PV farms, aircraft and electric ships, are a few examples of systems that implement dc distribution systems. Similarly to any power line in an ac distribution system, lines in LVDC distribution system are susceptible to faults.
Unlike ac systems, arc faults in dc systems are less likely to self-extinguish due to the absence of a periodic current zero-crossing. Hence, the arc faults are typically sustained in dc systems [2]. Arc faults are generally classified into two types: parallel and series [3,4]. The parallel arc faults are usually caused by line-to-ground or line-to-line short-circuiting [5]. Such a short circuit fault causes a sudden large current to flow through the circuit that can be detected by conventional protection methods. A series arc forms a continuous path for the current to flow despite a break or discontinuity in the conductor. Compared to parallel arc faults, series arc faults cause small changes in the dc current measured at the terminals of the line [6]. As a result, they can remain undetected for long periods and cause serious fire hazards, especially in confined spaces and in the presence of flammable substances. Hence, it is critical to detect series arc faults in LVDC systems.
Typical protection strategies for distribution systems, such as overcurrent protection, are incapable of detecting series arc faults due to the lack of a sufficiently large fault current. As a result, several approaches have been developed for detecting series arc faults in dc systems [7]. Series arc faults are characterized by features that are detectable in both time and frequency domains. Some approaches use a combination of both time and frequency domain characteristics [8,9], while many others are only frequency-based approaches. Frequency domain approaches typically measure high-frequency components in the current and/or voltage waveforms as features using methods such as Fourier transform and wavelet transform to detect series arc faults. However, these methods require waveforms to be measured with high sampling frequency. This increases the computational requirement and the cost of implementation.
A useful tool to understand the characteristics of series arc faults is an electrical equivalent circuit representation. Though the physics behind the arcing phenomenon is complex, and the system environment is hard to define and determine in real-world arc fault scenarios, many arc models have been developed based on the observation and analysis of measurements made during arc faults [9,10]. Some of the popular electrical equivalent models of series arc faults are presented in [7,11,12].
A characteristic signature of series arc faults in dc systems is a step change in the voltage and current at the receiving (load) end of the line following the arc initiation. The cause for the step change in the current and voltage waveforms at arc inception can be understood using the arc model presented in [13]. This model presents approximations of the gap voltage and gap current using a hyperbolic-tangent function. It is a well adopted model because many research studies such as [8,14] have used this electrical model of the arc to develop methods for dc arc fault detection. Figure 1 shows a simplified circuit representation of a typical dc line under normal operating conditions (before a series arc fault is present) and Figure 2 presents a line experiencing a series arc fault. The series arc fault is shown based on the model described in [13]. The arc voltage ( V a r c ) rises from a minimum value at the arc initiation [15]. Hence, it can be inferred from Figure 2 that the incipience of a series arc fault in the system causes step decreases in the voltage and current at the receiving or load end of the line. Such step changes at arc initiations are also visible in waveforms presented in [8,9,15]. Therefore, a step change in the voltage and/or current signals is a feature that can be used to aid series arc fault detection. The authors of [16] presented an approach to extracting this feature without requiring one to sample the signals at high-frequency. However, a protection method to implement this feature to detect the fault was not presented. Furthermore, the approach to detect a step change in waveforms was demonstrated using a computer simulation. Hence, the feasibility of the approach in practical applications, such as by using hardware, has not been demonstrated.
The objective was to develop an approach to detect series arc faults with minimal requirements, such as low sampling frequency, to supplement existing protection methods. The major contribution is presenting a novel voltage differential protection method that utilizes a characteristic series arc fault signature for this purpose. A highlight of this work is validating the approach using series arc fault experimental data, instead of using simulated data to illustrate the proof of concept. Furthermore, an implementation of the proposed method using an embedded controller is used to demonstrate the approach and highlight its practical applicability.
This paper is organized as follows. The approach and the underlying concept are explained in Section 2. The demonstration and successful implementation of the approach using an embedded controller and series arc fault experimental data are shown in Section 3. Section 4 presents additional discussions on the proposed method and Section 5 presents the conclusion.

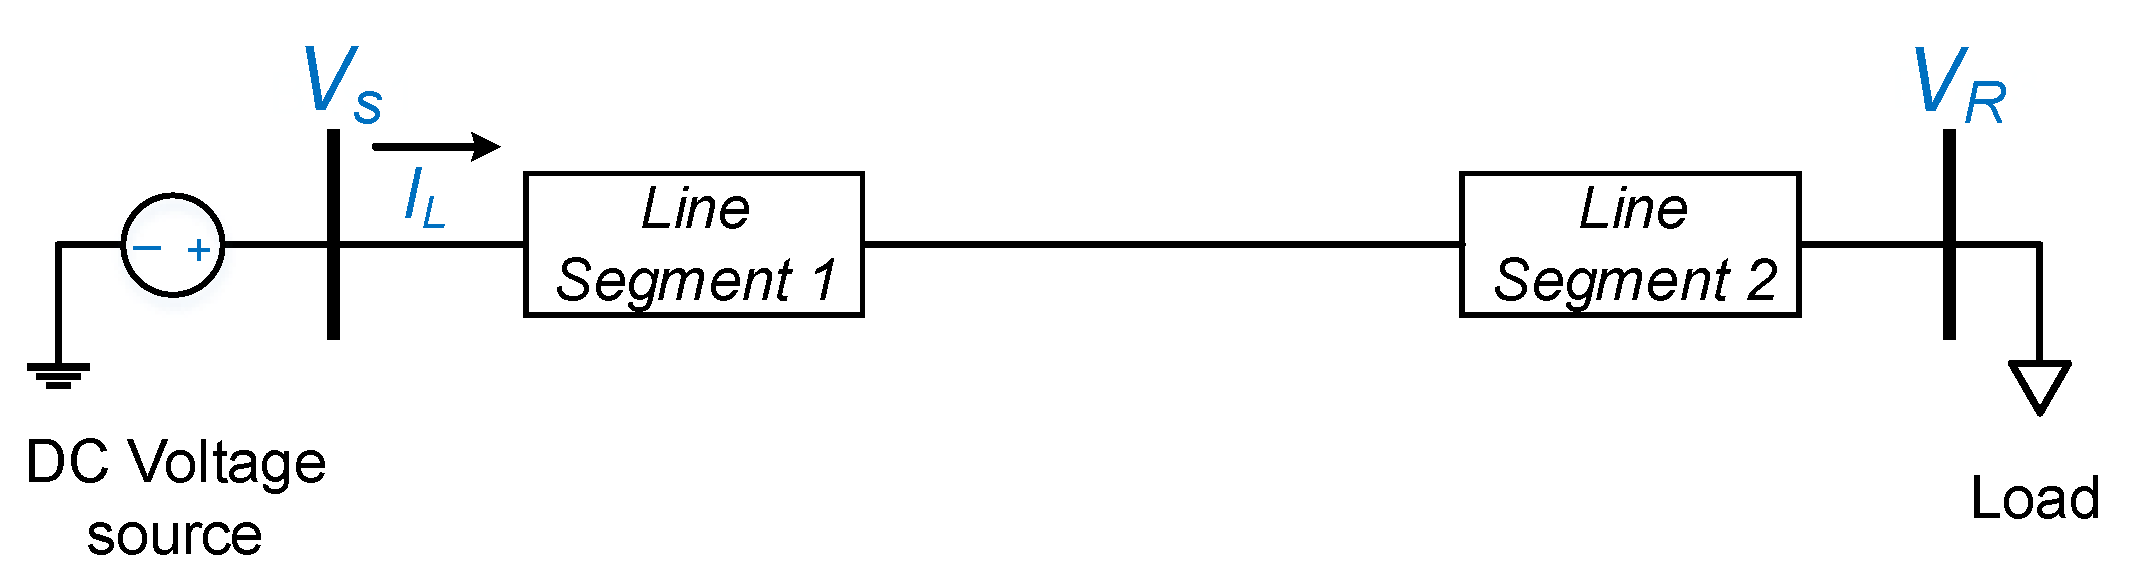
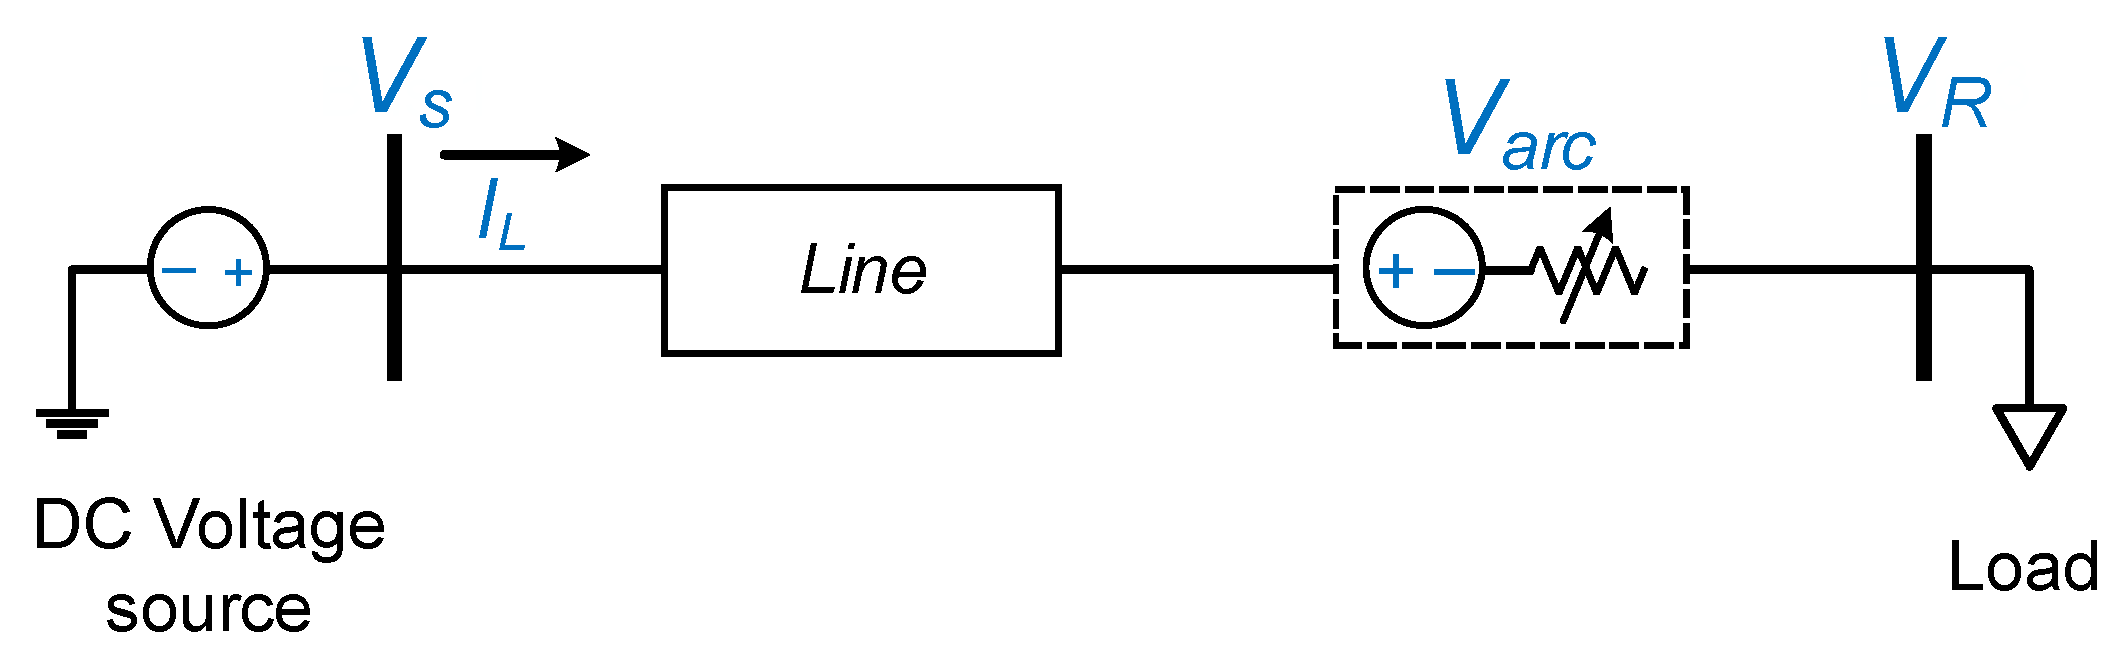
2. Concept and Approach

Differential protection is based on the principle that the current entering the equipment should be equal to the current exiting it [17]. On a dc line suffering from a series arc fault, the arc forms a continuous path for the current to flow across the discontinuity in the line. Unlike a parallel arc fault, there is no alternate path for the current to flow into or out of the line that can be detected using conventional current differential protection. Hence, the proposed method uses voltage instead of current to implement differential protection.
A typical dc line under normal operating conditions is shown in Figure 1. The line has a resistance of R L i n e and is fed by a constant dc voltage source. The voltages at the source and load ends are V S and V R respectively. The current flowing through the line is I L .
Under normal operating conditions:
V R = V S ( I L . R L i n e )
V D i f f = V S V R = ( I L . R L i n e )
V D e t e c t = V D i f f ( I L . R L i n e ) 0 V
A circuit representation of a dc line experiencing a series arc fault based on the model described in [13] is shown in Figure 2. The series arc fault causes a step-like decrease in the voltage and current at the receiving or load end of the line as discussed in Section 1 and this is reflected in the figure as well. The arc voltage is V A r c and is the voltage drop across the arc needed to sustain the arc. This voltage is a function of the materials and geometry of the gap and other factors [5]. But the variation is sufficiently small that it is still useful for detection.
During a series arc fault:
V R = V S ( I L . R L i n e ) V A r c
V D i f f = V S V R = ( I L . R L i n e ) + V A r c
V D e t e c t = V D i f f ( I L . R L i n e ) = V A r c
Equation (2) presents the voltage difference between the sending and receiving end of the line and is called differential voltage ( V D i f f ) in this paper. A new parameter called detection voltage ( V D e t e c t ) is defined in (3). It is the difference between the differential voltage and the voltage drop across the line.
Under normal operating conditions, V D e t e c t will be approximately zero volts, as derived in (3). In the presence of a series arc fault, V D e t e c t will be equal to V A r c , as calculated in (6). Hence, when the step change in V R is approximately equal to V D e t e c t , it can be detected as a series arc fault. In lines with significant inductance, the expected transient voltage (such as V T = L L i n e d i d t ) can be included in the V D i f f and V D e t e c t computations.
A step change in V R can be caused due to a variety of factors—sharp load changes, pulse loads, parallel arc faults, etc. In cases of load variation, a sudden rise or fall in the current can cause a step change in V R . This step change in V R will not be equal to V D e t e c t because V D e t e c t will be zero. For other types of faults such as shunt faults, high fault currents can cause large values of V D i f f . However, the V D e t e c t calculation takes the large voltage drop caused by these currents into account. Though V D e t e c t may not be approximately zero, the step change in voltage in V R will not be equal to V D e t e c t . Furthermore, standard protection principles such as overcurrent can also be used to classify the fault as a shunt fault and not as a series arc fault.

3. Demonstration

The objective of this section is to demonstrate the concept of the proposed voltage differential protection method presented in Section 2 to detect a series arc fault. For this purpose, an embedded controller and series arc fault experimental data were used to perform a hardware-in-the-loop (HIL) test.

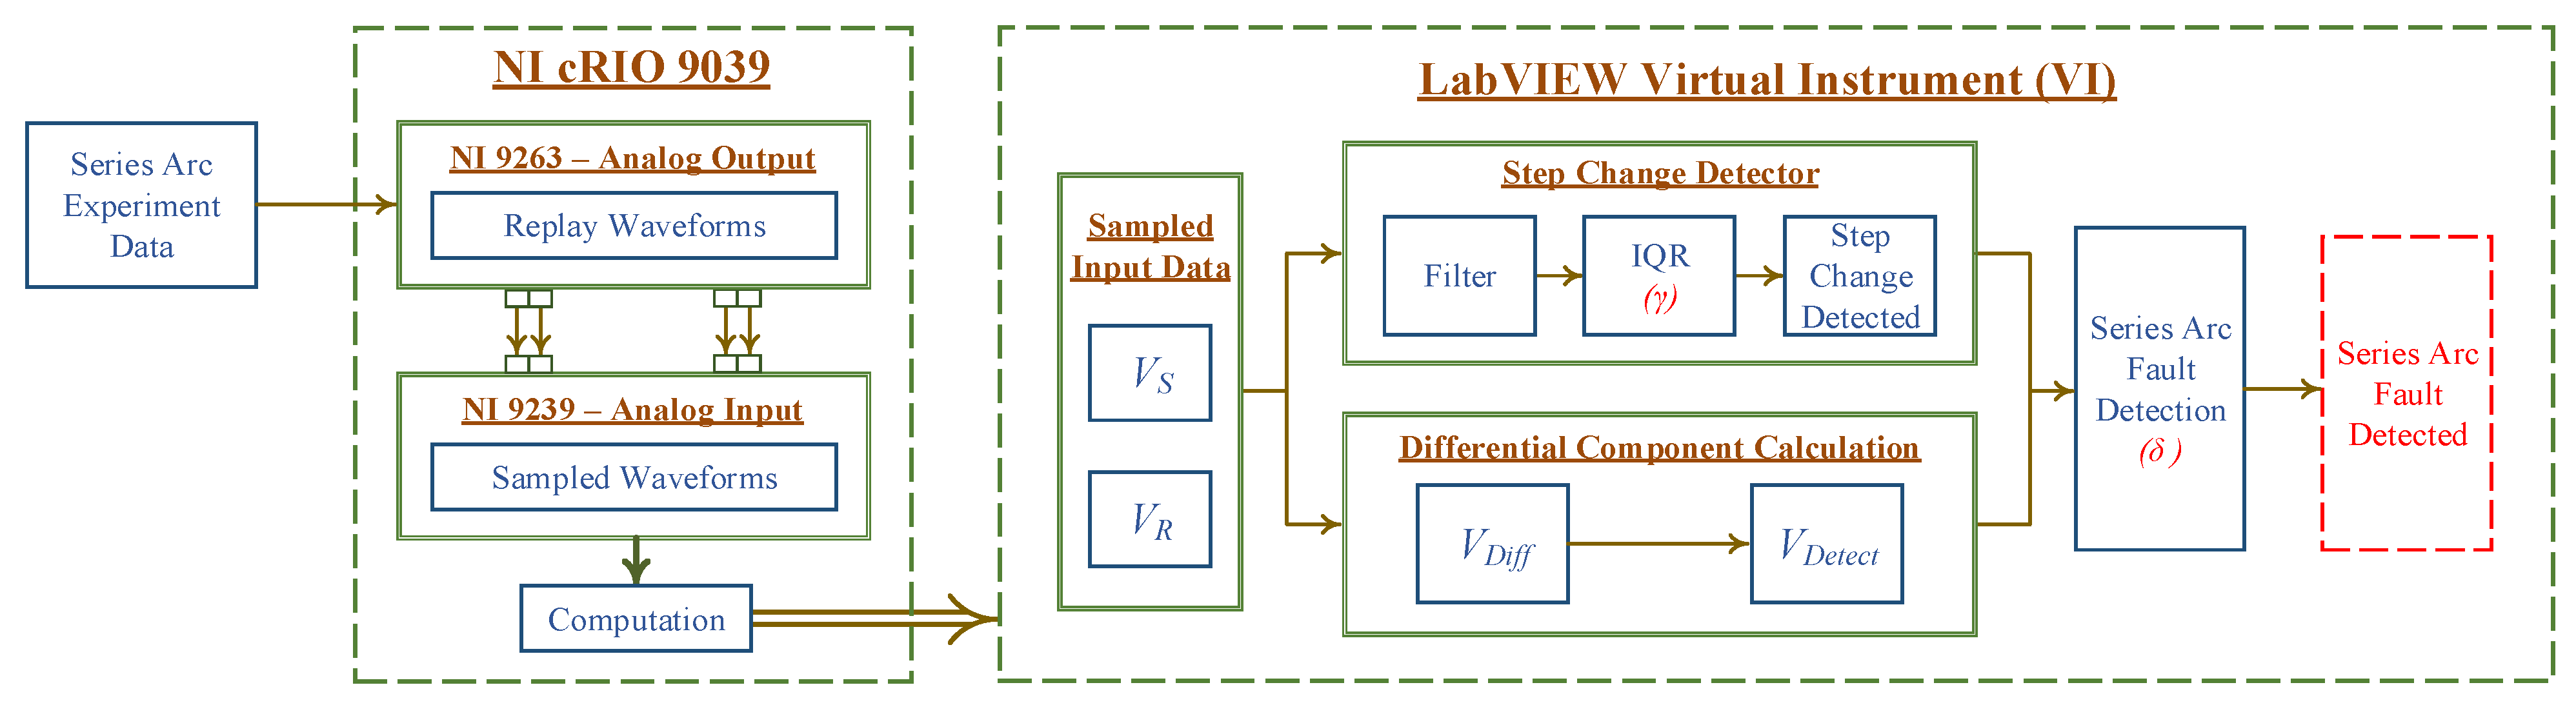
3.1. Test Setup and Data

Figure 3 presents the hardware setup for this demonstration using NI cRIO 9039. The latter is an embedded controller produced by National Instruments (NI). It features a real-time processor for signal processing, computation and communication. The technical specifications of NI cRIO 9039 are as follows. It has a 1.91 GHz Quad-Core CPU, 2 GB DRAM and 16 GB storage. The cRIO-9039 is an embedded controller ideal for monitoring and control applications. Waveforms of voltages at source and load ends recorded in a series arc fault experiment were pre-loaded into cRIO’s memory. An analog output module (NI 9263) was used to replay the voltage data from the experiment. To emulate a relay operation, an analog input module (NI 9239) measured these replayed voltage waveforms, and the measured data were analyzed by the real-time processor to detect the fault. All the plots and waveforms presented in this paper are those recorded by the analog input module and processed by the real-time controller.
Testing a newly developed algorithm using prior recorded data is a commonly used and effective method for validation, as discussed in [18]. This paper, however, does not delve into the communication requirements to implement the voltage differential protection. These requirements for the proposed method would be similar to those required for typical current differential protection for ac systems.
Communication channels allow the transfer of measurement data between local and remote relays. Digital communication links are used nowadays instead of pilot wires to effectively and efficiently transfer data for differential protection [19]. There are different methods to overcome the challenge of obtaining time-synchronized data at the desired location [20]. One method is to measure the time difference between the data samples at the two ends of the line and compensate for this time difference accordingly. Another method is to synchronize the line measurements at both ends of the line to a common reference signal. Relays commonly have the ability to receive and interpret time-stamped data [21]. The relays time-align the local and remote measurements based on the time information embedded in these measurements and then proceed with the protection application analysis. Making time-synchronized data available for protection applications is a well-researched and developed topic. As the purpose of this section is to demonstrate the ability of the algorithm to accurately detect series arc fault using an embedded controller, time-synchronized voltage data are directly made available to the real-time controller.
The experimental data used in this demonstration are similar to those presented in [16]. The series arc experiment setup consists of two electrodes—one is fixed and the other moves away at a constant speed. A series arc is formed when the two electrodes are separated. Figure 4 presents the equivalent circuit diagram of the series arc fault test system. A dc cable (approximately 100 m long) connects the source (a rectifier) and the series arc generator. As the resistance of the line was very small (around 0.004 Ω ), R L i n e is taken as zero ohms in this demonstration. The voltage waveforms measured at the source and load ends are V S and V R respectively. The series arc experiment was performed at 500 V and the data were recorded at 250 kSamples/second. However, the analog input and output module (NI 9239 and NI 9263) were rated only up to 10 V. Hence, the series arc experimental data were digitally scaled down by a factor of 500 to 5 V. The analog input module (NI 9239) was configured to sample the signals at 1440 Hz. A higher or lower sampling frequency can be chosen based on the computational capability of the embedded controller. Figure 5 presents the source and load end voltages measured by the input module.

3.2. Proposed Approach

The measured input signal is in the form of samples obtained using the data acquisition device. If the signal has noise or disturbances, such as ripple from a converter, digital filters can be used to eliminate them. A moving window (W) of size n w is used for processing the data. Every new sample obtained is appended to the window and the oldest sample is discarded. The window size used for this example was 40 samples. It corresponds to a time equivalent of 27.7 ms as the sampling frequency of the analog input module was 1440 Hz. In this case, the median filter presented in [16] with a window size of 4 samples was used to remove the 360 Hz harmonics in the signal caused by ripple from the converter. After the application of the median filter, there was one data point for every four samples in the original data. Hence, the output of the median filter was a window ( W f ) with 10 data points.
The step change in V R is estimated using the interquartile range ( I Q R ) shown in (7). The I Q R is the difference between the third quartile or 75 percentile ( Q 3 ) and the first quartile or 25 percentile ( Q 1 ), i.e., I Q R = Q 3 Q 1 , of the samples in the window.
F I Q R = I Q R W f
The IQR filter reflects the range of the step change detected. A significant step change, which could indicate the possibility of a series arc fault, is detected when F I Q R is greater than a threshold value ( γ ). This threshold value is set based on the expected series arc fault characteristics. The rationale behind checking for this step change in V R is that the change could be due to a voltage drop across a series arc, i.e., the arc voltage ( V a r c ) into the circuit (as shown in Figure 2). In that case, V D e t e c t would be equivalent to V A r c as seen in (6). This is investigated in the next step to confirm the presence of a series arc fault.
The differential voltage V D i f f is calculated as
V D i f f [ k ] = V S [ k ] V R [ k ]
for every sample k in their respective window of W f .
As we assumed R L i n e 0 Ω for this case because of having only a short line in the experimental setup, V D e t e c t [ k ] = V D i f f [ k ] . To implement the proposed approach, a threshold value ( δ ) is defined to detect whether the step change in V R is approximately equal to V D e t e c t . When any sample k derived from the data in window (W) satisfies the following criterion— | V D e t e c t [ k ] F I Q R | < δ —a series arc fault is detected.
Figure 6 presents the analysis corresponding to the data window where the series arc fault was detected by the proposed method. The orange and blue lines present the source end and load end voltages after the application of the median filter, respectively, on the left y-axis. The purple line shows the IQR value calculated for this window of V R data on the right y-axis. For this moving window ( W f ), the calculated IQR value was 0.13 V. The threshold value ( γ ) was determined by observational analysis and was set at 0.05 V for our system. As the calculated IQR value was greater than γ , there is a possibility of a series arc fault on the system based on the step change in the voltage at the load end.
The calculated detection voltage ( V D e t e c t ), which is equal to the differential voltage ( V D i f f ) in this case, is presented by the green line on the right y-axis of Figure 6. As a result of the median filter discussed earlier, there is only one data point for every four samples of voltage data. These data points are shown using green square markers. The dotted red lines show the region around the detected IQR value ( F I Q R ) that satisfies the criterion to detect series arc fault, i.e., | V D e t e c t [ k ] F I Q R | < δ . Similar to γ , the δ threshold value was set based on observational analysis. A value of 0.03 V for δ was used and it worked well for all the demonstration cases presented in this paper. A data point in V D e t e c t falling within this region confirms the presence of a series arc fault in the system as expected and is shown using a red marker.
The above-described analysis process is performed by the real-time controller every time it samples a new input measurement. In this case, as the sampling frequency was 1440 Hz, the above computation was performed within 694.4 μ s by the controller. This shows that the proposed approach is not computationally intensive, which serves as an advantage for this method. It can be observed in Figure 5 that the series arc inception was at sample number 271. The series arc fault was detected in the process iteration when sample number 290 was measured. Hence, the fault was detected within 13.2 ms of its inception by this approach.
Figure 7 and Figure 8 present one more example to validate the proposed approach. Figure 7 presents the source end and load end voltages from another set of series arc fault experimental data. The series arc fault detection analysis corresponding to the data window where the fault was detected is shown in Figure 8. The γ and δ threshold values were the same as in the previous case. The calculated IQR value for this moving window was 0.067 V. As it is greater than γ , there exists the possibility of a series arc fault. Next, the detection voltage ( V D e t e c t ) is examined. In this case as well, V D e t e c t [ k ] = V D i f f [ k ] as R L i n e 0 Ω . A data point in V D e t e c t satisfying the criterion to detect series arc fault ( | V D e t e c t [ k ] F I Q R | < δ ) confirms the presence of a series arc fault. The fault was detected within 10.4 ms of its inception in this instance.
Reference [22] presents a local measurement-based approach to detect series arc fault. This method too utilizes the concept of detecting the change in the load voltage waveform at arc initiation. Though this approach is not based on differential protection or IQR filter, it provides valuable insights on setting the threshold value of a step change detector for detecting series arc faults. The approach uses a band pass filter to remove the low frequency grid voltage fluctuations due to load variations and high frequency switching noise. The authors performed extensive analysis for determining the threshold value to be set for the step change detector, while including the impacts of system parameters such gird inductance, resistance and load capacitance.

4. Discussion

Traditional protection schemes such as overcurrent or current differential protection may not be able to detect series arc faults. It has to be remembered that the purpose of the proposed approach is to supplement the existing protection scheme with series arc fault detection with minimal additional requirements, such as low-sampling frequency and computation.
The reliability of the approach depends on its ability to not only detect series arc faults accurately, but also prevent false indications. Some of the critical scenarios that can typically cause a protection system misoperation are sudden large load variations and delay in the communication when time synchronization between measurements is not available. This section discusses the robustness of the approach in these scenarios.

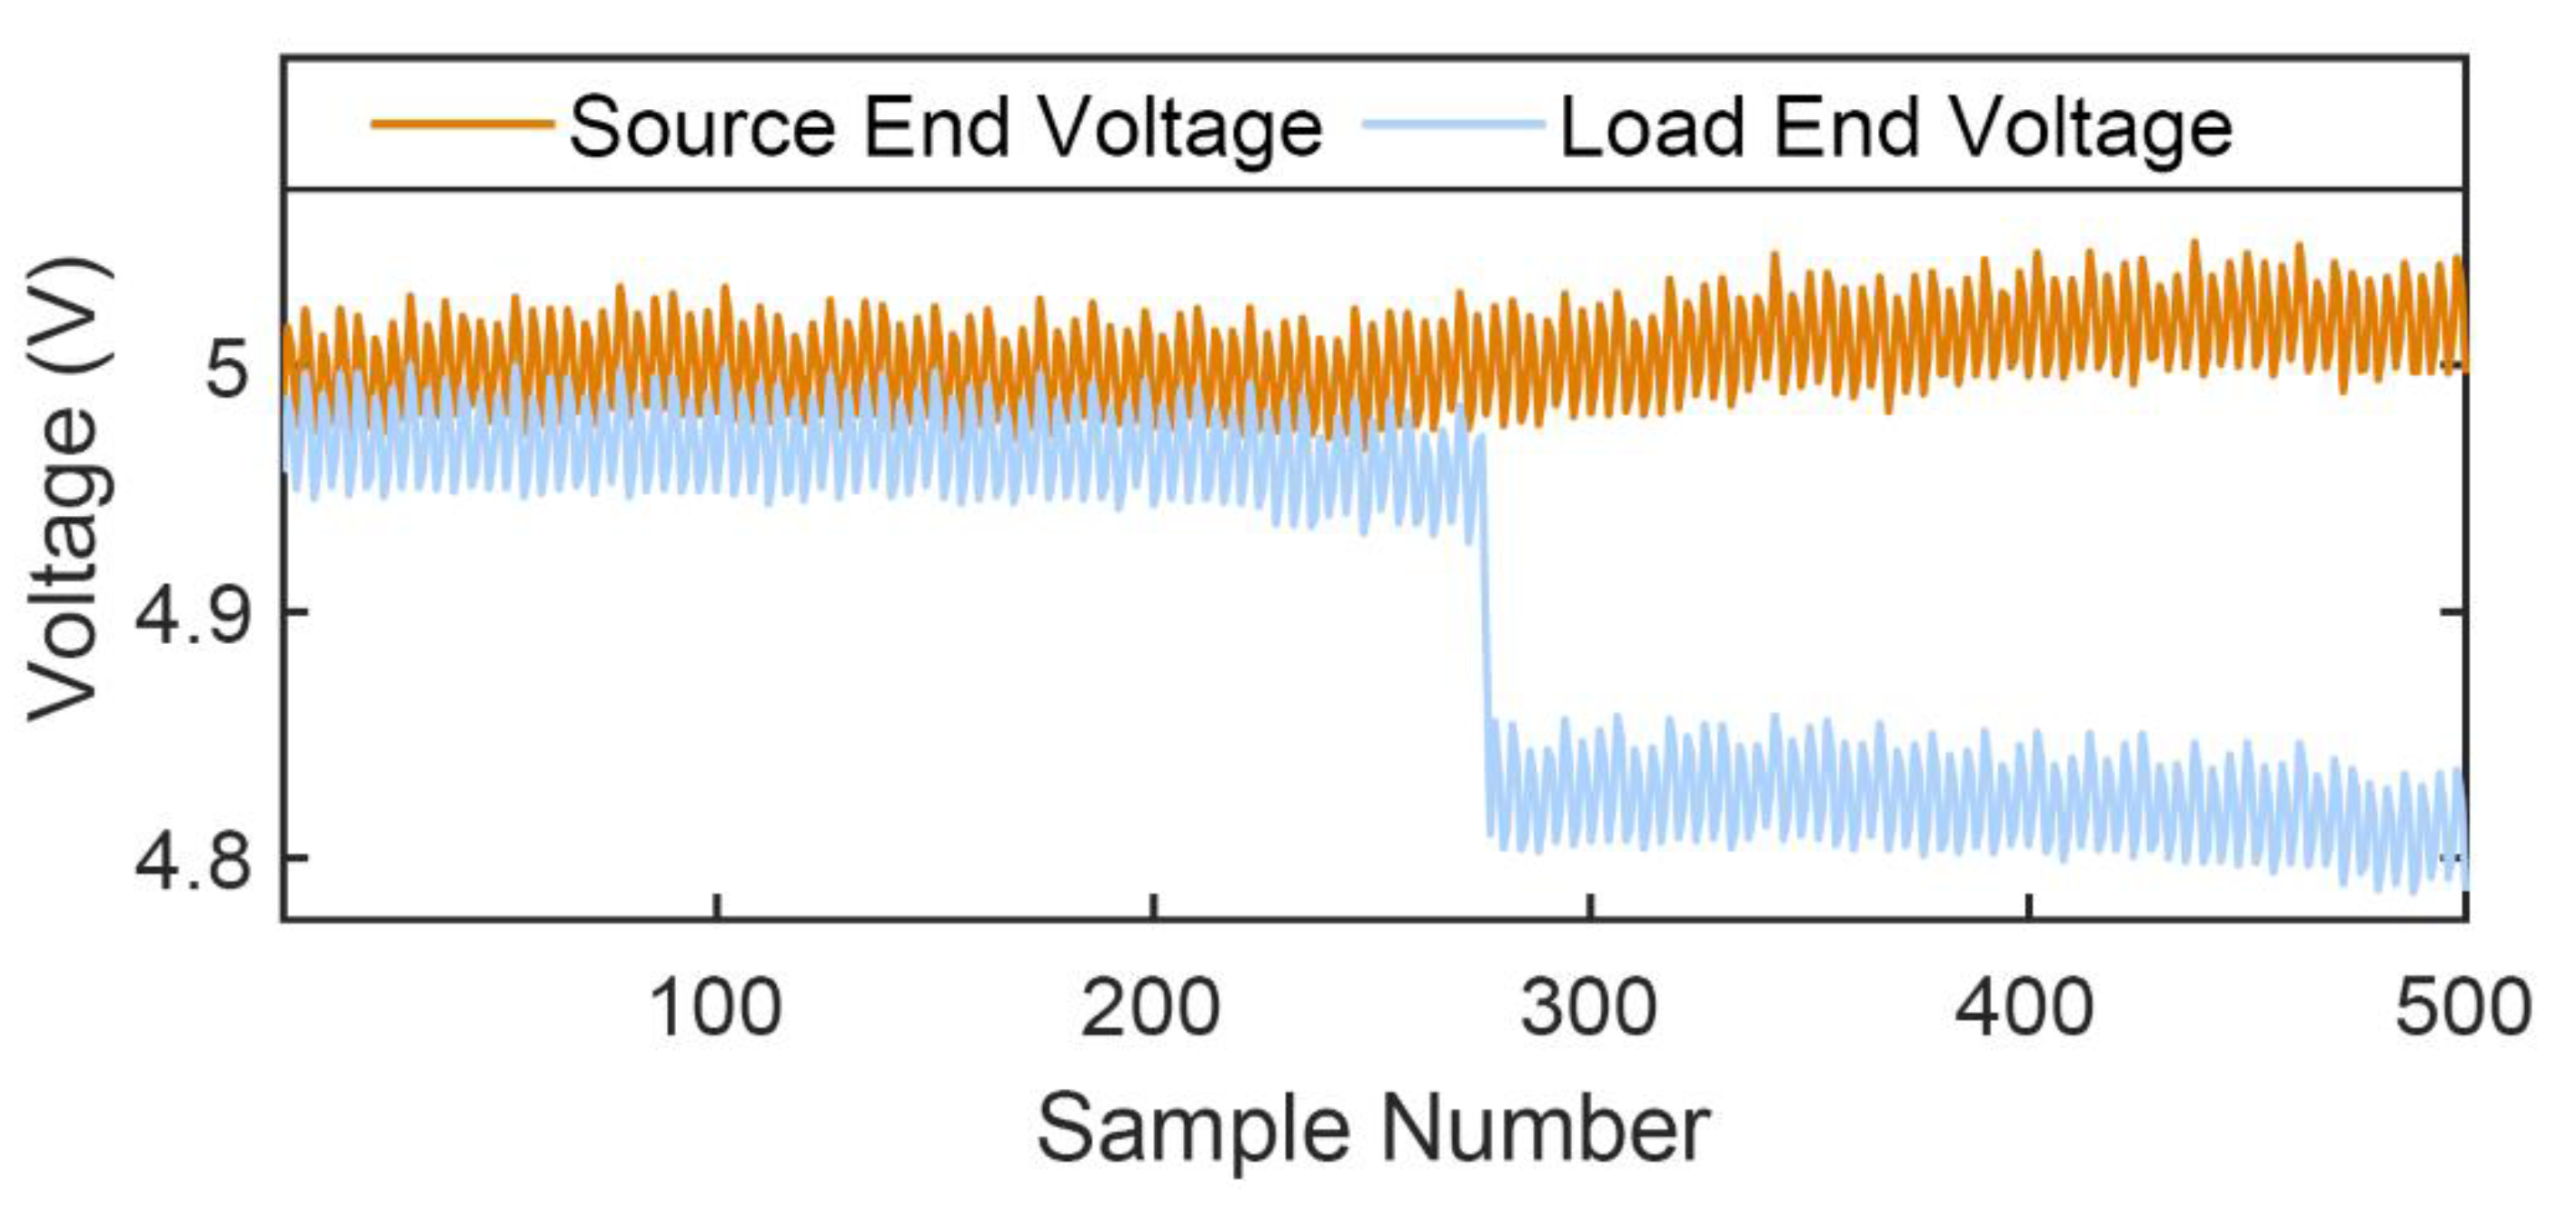
4.1. Sharp Load Change

This subsection demonstrates the function of the approach for a load change event that may cause the voltage waveform to exhibit a step change that resembles one resulting from a series arc fault. Similarly to the series arc experiment discussed in Section 3, a load change case was studied using the same experimental setup. The data from the experiment were used to test the proposed approach using the embedded controller. In this case, there were 3 Ω and 18 Ω loads connected in parallel at the load end of the line. The 18 Ω load was quickly removed by the action of a mechanical switch. Figure 9 presents the source and load end voltages. The sudden loss in load caused the voltages to rise sharply, thereby resembling a step change.
The fault detection analysis corresponding to the data window where the voltages were sharply rising is shown in Figure 10. The γ and δ threshold values were the same as the previous cases. A step change was detected by the algorithm because of the sudden large load change. The calculated IQR value for this moving window was 0.09 V. As it is greater than γ , there exists the possibility of a series arc fault. The detection voltage ( V D e t e c t ) is examined next. As seen in Figure 10, the detection voltage was negligible and close to zero, as expected. Hence, the criterion to detect a series arc fault ( | V D e t e c t [ k ] F I Q R | < δ ) was not satisfied. This indicates the absence of a series arc fault even though a step change was detected.

4.2. Loss of Time Synchronization

The proposed voltage differential protection relies on the communication of voltage measurements from the source end to the remote end to perform the series arc detection analysis described in Section 2 and Section 3. Communication latency typically ranges between 3 to 10 ms [23,24]. This section discusses the impact of delay in communication in scenarios where time synchronization between measurements is not available and discusses a possible solution to counter it.
In real-world scenarios, sources are typically stable and are maintained at a relatively constant voltage level. Hence, delays in the communication of the source end voltage measurements may not significantly impact the approach. To demonstrate the above, consider the same event 1 experiment data from Section 3. An intentional delay to the source end voltage data was introduced to emulate the latency in communication where time synchronization between measurements is not available. The source end voltage data were replayed by the analog output module (NI 9263) with a 7 ms (10 samples at 1440 Hz sampling frequency) delay compared to the load voltage data. Figure 11 presents the series arc fault detection analysis plot for this case. It was able to successfully detect the presence of a series arc fault. As the source voltage was stable at approximately 5 V for long periods before the inception of the series arc fault, the computation of the series arc fault detection was not affected, despite the introduction of the time delay.
Time synchronization of the sending and receiving end voltages is recommended to achieve the most accurate implementation of the proposed approach. In the absence of time synchronization between measurements, to increase security for a small trade-off in detection time, it can be checked if the criterion of | V D e t e c t [ k ] F I Q R | < δ is satisfied continuously for a longer time rather than just one time instant. In such scenarios, the approach will not accidentally detect load changes as series arc faults for the reasons described below. The step change detector using IQR is immune to typical load changes as discussed in [16]. The detector based on IQR is implemented such that the minimum IQR threshold value ( γ ) to detect a series arc fault is set higher than those for typical load change values. Furthermore, the V D e t e c t value will eventually become zero for a load change once the delay has passed. Hence, in situations where time synchronization between measurements is not available, a typical delay of 3 to 10 ms does not significantly affect the approach.
Consider the sharp load change event (Event 3) data shown in Section 4.1. A similar 7 ms intentional delay to the source end voltage data is introduced and the proposed series arc fault detection approach is tested. Figure 12 presents the fault detection analysis plot for this case. In Figure 12, it can be observed that the source end voltage measurement lags the load end voltage measurement due to the delay introduced. The source end voltage in this case is seen to be less than the load end voltage. This behavior plays to our advantage because it causes the detection voltage ( V D e t e c t ) to be below the region that finally detects the series arc fault (shown using dotted red lines). Hence, though a step change of 0.055 V (greater than γ ) was detected by the IQR calculations, the approach did not produce a false detection of a series arc fault.
On the other hand, it is also possible for a large load to be added to the system that can cause the source and load end voltages to fall. Though both voltages fall simultaneously, the fall in the source end voltage will be recognized later due to the delay introduced by the communication and lack of time synchronization. In this case, the detection voltage will increase during this critical period and may seem like a series arc fault. Here, making use of checking whether the criteria of | V D e t e c t [ k ] F I Q R | < δ is satisfied continuously for a longer period will eliminate incorrect detection because the fall in the source end voltage would be communicated by the end of this time. Another layer of protection can also be included to prevent misoperation in such rare occurrences of a sharp load increase along with the loss of time synchronization. The current measurement can be utilized to differentiate between load change and series arc fault as explained in [16]. Though the load end voltage may fall during a sharp load increase, the current will increase, unlike a series arc fault where both the current and voltage are likely to suffer a step fall in value.

5. Conclusions

This paper presents an approach to detect series arc faults in low-voltage dc (LVDC) distribution systems. The current and voltage waveforms experience a step change during arc formation, and this feature can be extracted even when the waveforms are measured at a low sampling frequency. The proposed approach is based on voltage differential protection and utilizes this characteristic signature of a series arc fault to detect the fault. The proposed approach was demonstrated using an embedded controller and series arc fault experimental data that emulate a hardware-in-the-loop (HIL) test environment. The successful detection of a series arc fault using the approach on two sets of experimental data was presented. The fault was detected within 15 ms in both these cases. The paper also discussed the robustness of the approach to sharp load variations and loss of time synchronization between measurements at the source and load ends of the line.

Author Contributions

S.N.A. developed the algorithms, performed the analysis and drafted the manuscript. X.F. provided the experimental data. S.S. and X.F. supervised the analysis presented in this manuscript. C.P., A.G. and R.H. were the technical advisors and provided resources for this research work. All authors have read and agreed to the published version of the manuscript.

Funding

This work was based upon research supported in part by the U.S. Office of Naval Research (ONR) under grant N00014-16-1-2956. This paper is approved for public release under DCN#43-6680-20.

Institutional Review Board Statement

Not Applicable.

Informed Consent Statement

Not Applicable.

Data Availability Statement

The data presented in this study is contained within the article.

Conflicts of Interest

The authors declare no conflict of interest.

References

  1. Qi, L.; Antoniazzi, A.; Raciti, L. DC Distribution Fault Analysis, Protection Solutions, and Example Implementations. IEEE Trans. Ind. Appl. 2018, 54, 3179–3186. [Google Scholar] [CrossRef]
  2. Alam, M.K.; Khan, F.; Johnson, J.; Flicker, J. A Comprehensive Review of Catastrophic Faults in PV Arrays: Types, Detection, and Mitigation Techniques. IEEE J. Photovolt. 2015, 5, 982–997. [Google Scholar] [CrossRef]
  3. Mellit, A.; Tina, G.; Kalogirou, S. Fault detection and diagnosis methods for photovoltaic systems: A review. Renew. Sustain. Energy Rev. 2018, 91, 1–17. [Google Scholar] [CrossRef]
  4. Naidu, M.; Schoepf, T.J.; Gopalakrishnan, S. Arc fault detection scheme for 42-V automotive DC networks using current shunt. IEEE Trans. Power Electron. 2006, 21, 633–639. [Google Scholar] [CrossRef]
  5. Xiong, Q.; Feng, X.; Gattozzi, A.L.; Liu, X.; Zheng, L.; Zhu, L.; Ji, S.; Hebner, R.E. Series Arc Fault Detection and Localization in DC Distribution System. IEEE Trans. Instrum. Meas. 2020, 69, 122–134. [Google Scholar] [CrossRef]
  6. Xiong, Q.; Liu, X.; Feng, X.; Gattozzi, A.L.; Shi, Y.; Zhu, L.; Ji, S.; Hebner, R.E. Arc Fault Detection and Localization in Photovoltaic Systems Using Feature Distribution Maps of Parallel Capacitor Currents. IEEE J. Photovolt. 2018, 8, 1090–1097. [Google Scholar] [CrossRef]
  7. Lu, S.; Phung, B.; Zhang, D. A comprehensive review on DC arc faults and their diagnosis methods in photovoltaic systems. Renew. Sustain. Energy Rev. 2018, 89, 88–98. [Google Scholar] [CrossRef]
  8. Telford, R.D.; Galloway, S.; Stephen, B.; Elders, I. Diagnosis of Series DC Arc Faults—A Machine Learning Approach. IEEE Trans. Ind. Inform. 2017, 13, 1598–1609. [Google Scholar] [CrossRef] [Green Version]
  9. Yao, X.; Herrera, L.; Ji, S.; Zou, K.; Wang, J. Characteristic Study and Time-Domain Discrete-Wavelet-Transform Based Hybrid Detection of Series DC Arc Faults. IEEE Trans. Power Electron. 2014, 29, 3103–3115. [Google Scholar] [CrossRef]
  10. Weerasekara, M.; Vilathgamuwa, M.; Mishra, Y. Modelling of DC arcs for photovoltaic system faults. In Proceedings of the IEEE 2nd Annual Southern Power Electronics Conference (SPEC), Auckland, New Zealand, 5–8 December 2016; pp. 1–4. [Google Scholar] [CrossRef]
  11. Ammerman, R.F.; Gammon, T.; Sen, P.K.; Nelson, J.P. DC-Arc Models and Incident-Energy Calculations. IEEE Trans. Ind. Appl. 2010, 46, 1810–1819. [Google Scholar] [CrossRef]
  12. Gammon, T.; Lee, W.; Zhang, Z.; Johnson, B.C. A Review of Commonly Used DC Arc Models. IEEE Trans. Ind. Appl. 2015, 51, 1398–1407. [Google Scholar] [CrossRef]
  13. Uriarte, F.M.; Gattozzi, A.L.; Herbst, J.D.; Estes, H.B.; Hotz, T.J.; Kwasinski, A.; Hebner, R.E. A DC Arc Model for Series Faults in Low Voltage Microgrids. IEEE Trans. Smart Grid 2012, 3, 2063–2070. [Google Scholar] [CrossRef] [Green Version]
  14. Seo, G.; Kim, K.A.; Lee, K.; Lee, K.; Cho, B. A new DC arc fault detection method using DC system component modeling and analysis in low frequency range. In Proceedings of the IEEE Applied Power Electronics Conference and Exposition (APEC), Charlotte, NC, USA, 15–19 March 2015; pp. 2438–2444. [Google Scholar] [CrossRef]
  15. Li, J.; Thomas, D.W.P.; Sumner, M.; Christopher, E.; Cao, Y. Series Arc fault studies and modeling for a DC distribution system. In Proceedings of the IEEE PES Asia-Pacific Power and Energy Engineering Conference (APPEEC), Kowloon, China, 8–11 December 2013; pp. 1–6. [Google Scholar] [CrossRef]
  16. Ananthan, S.N.; Bastos, A.F.; Santoso, S.; Feng, X.; Penney, C.; Gattozzi, A.; Hebner, R. Signatures of series arc faults to aid arc detection in low-voltage DC systems. In Proceedings of the IEEE Power and Energy Society General Meeting (PESGM), Montreal, QC, Canada, 2–6 August 2020; pp. 1–5. [Google Scholar]
  17. Paithankar, Y.; Bhide, S. Fundamentals of Power System Protection; Prentice-Hall of India Pvt. Ltd.: New Delhi, India, 2003. [Google Scholar]
  18. Johnson, J.; Kang, J. Arc-fault detector algorithm evaluation method utilizing prerecorded arcing signatures. In Proceedings of the 38th IEEE Photovoltaic Specialists Conference, Austin, TX, USA, 3–8 June 2012; pp. 001378–001382. [Google Scholar]
  19. Brunello, G.; Voloh, I.; Hall, I.; Fitch, J. Current differential relaying—coping with communications channel asymmetry. In Proceedings of the Eighth IEE International Conference on Developments in Power System Protection, Amsterdam, The Netherlands, 13 December 2004; Volume 2, pp. 821–824. [Google Scholar]
  20. Southern, E.P.; Li, H.Y.; Crossley, P.A.; Potts, S.; Weller, G.C. GPS synchronised current differential protection. In Proceedings of the Sixth International Conference on Developments in Power System Protection, Nottingham, UK, 25–27 March 1997; pp. 342–345. [Google Scholar]
  21. Ferrer, H.J.A.; Schweitzer, E.O. Modern Solutions for Protection, Control, and Monitoring of Electric Power Systems; Schweitzer Engineering Laboratories: Pullman, WA, USA, 2010. [Google Scholar]
  22. Shekhar, A.; Ramírez-Elizondo, L.; Bandyopadhyay, S.; Mackay, L.; Bauera, P. Detection of Series Arcs Using Load Side Voltage Drop for Protection of Low Voltage DC Systems. IEEE Trans. Smart Grid 2018, 9, 6288–6297. [Google Scholar] [CrossRef] [Green Version]
  23. Wong, T.J.; Das, N. Modelling and analysis of IEC 61850 for end-to-end delay characteristics with various packet sizes in modern power substation systems. In Proceedings of the 5th Brunei International Conference on Engineering and Technology, Bandar Seri Begawan, Brunei, 1–3 November 2014; pp. 1–6. [Google Scholar]
  24. Falahati, B.; Mousavi, M.J.; Vakilian, M. Latency consi derations in IEC 61850-enabled Substation Automation Systems. In Proceedings of the IEEE Power and Energy Society General Meeting, Detroit, MI, USA, 24–28 July 2011; pp. 1–8. [Google Scholar]
Figure 1. Simplified circuit representation of a dc line under normal operating conditions.
Inventions 06 00005 g001
Figure 2. Simplified circuit representation of a dc line in the presence of a series arc fault.
Inventions 06 00005 g002
Figure 3. Setup using an embedded controller to demonstrate the proposed method.
Inventions 06 00005 g003
Figure 4. Equivalent circuit diagram of the series arc fault experiment setup.
Inventions 06 00005 g004
Figure 5. Event 1: data used for series arc fault analysis—voltages at the source and load ends.
Inventions 06 00005 g005
Figure 6. Event 1: detecting a series arc fault using the proposed method.
Inventions 06 00005 g006
Figure 7. Event 2: data used for series arc fault analysis—voltages at the source and load ends.
Inventions 06 00005 g007
Figure 8. Event 2: detecting a series arc fault using the proposed method.
Inventions 06 00005 g008
Figure 9. Event 3: data used for analysis of load change event—voltages at the source and load ends.
Inventions 06 00005 g009
Figure 10. Event 3: detecting a series arc fault using the proposed method in the case of a sudden load change.
Inventions 06 00005 g010
Figure 11. Event 1: detecting a series arc fault using the proposed method when the voltage at the source end is delayed.
Inventions 06 00005 g011
Figure 12. Event 3: detection analysis using the proposed method for a sharp load change event when the voltage at the source end is delayed.
Inventions 06 00005 g012
Publisher’s Note: MDPI stays neutral with regard to jurisdictional claims in published maps and institutional affiliations.

