Article

Measurement of Multiple Cardiac Performance Endpoints in Daphnia and Zebrafish by Kymograph

by
Kevin Adi Kurnia
1,†,
Ferry Saputra
1,†,
Marri Jmelou M. Roldan
2,
Agnes L. Castillo
3,
Jong-Chin Huang
4,
Kelvin H.-C. Chen
4,*,
Hong-Thih Lai
5,* and
Chung-Der Hsiao
1,6,7,*
1
Department of Bioscience Technology, Chung Yuan Christian University, Chung-Li 320314, Taiwan
2
Faculty of Pharmacy and The Graduate School, University of Santo Tomas, Manila 1008, Philippines
3
Faculty of Pharmacy, The Graduate School and Research Center for the Natural and Applied Sciences, University of Santo Tomas, Manila 1008, Philippines
4
Department of Applied Chemistry, National Pingtung University, Pingtung 900391, Taiwan
5
Department of Aquatic Biosciences, National Chiayi University, 300 University Rd., Chiayi 60004, Taiwan
6
Center for Nanotechnology, Chung Yuan Christian University, Chung-Li 320314, Taiwan
7
Department of Chemistry, Chung Yuan Christian University, Chung-Li 320314, Taiwan
*
Authors to whom correspondence should be addressed.
These authors have equal contribution.
Submission received: 16 November 2020 / Revised: 4 January 2021 / Accepted: 14 January 2021 / Published: 17 January 2021
(This article belongs to the Section Inventions and Innovation in Biotechnology and Materials)

Abstract

:
Cardiovascular disease (CVD) is the number one cause of death worldwide. This condition resulted in huge research on CVD increasing the need for animal models suitable for in vivo research. Daphnia and zebrafish are good animal models for cardiovascular research due to their relative body transparency and easy culture property. Several methods have been developed to conduct cardiac performance measurement in Daphnia and zebrafish. However, most of the methods are only able to obtain heartbeat rate. The other important cardiac endpoints like stroke volume, ejection fraction, fraction shortening, cardiac output, and heartbeat regularity must use other programs for measurement. To overcome this limitation, in this study, we successfully developed a one-stop ImageJ-based method using kymograph macros language that is able to obtain multiple cardiac performance endpoints simultaneously for the first time. To validate its utility, we incubated Daphnia magna at different ambient temperatures and exposed zebrafish with astemizole to detect the corresponding cardiac performance alterations. In summary, the kymograph method reported in this study provides a new, easy to use, and inexpensive one-stop method obtaining multiple cardiac performance endpoints with high accuracy and convenience.

1. Introduction

Cardiovascular diseases (CVD) are the number one cause of death worldwide, accounting for 17.9 million or 31% of total annual worldwide deaths. This number is predicted to increase to 22.2 million annual deaths by 2030. CVD deaths are mainly caused by heart attacks and strokes, which are avoidable outcomes, mainly in developed countries. However, in low- and middle-income countries, more than three-quarters of deaths occurred due to these conditions [1]. As a result of these conditions, biomedical research on causes, prevention, and treatment of CVD remained active, producing hundreds of publications weekly. The sheer amount of research on CVDs increased the need for animal models.
Zebrafish was proven to be a good vertebrate model for cardiovascular research because of several advantages it holds over the mammalian model. Physically, the human heart rate of 60–100 beats per minute (bpm) is closer to the zebrafish embryonic heart rate of 120–180 bpm than the mouse heart rate of 300–600 bpm. Cardiovascular screening is mostly done in small zebrafish within the 1st week of birth due to the transparent body of larval zebrafish, allowing non-invasive detection on the organ [2]. Zebrafish also produce a high offspring number, have a fast-embryonic development process, and have a short reproductive cycle. Due to its small size, zebrafish are easier to maintain and require little laboratory space. Furthermore, the zebrafish genome is fully sequenced and showed more than 70% similarity with human genes at protein level reflected in drug response, as the protein comprising drug binding targets is similar [3]. Due to this similarity, genes expressed in human disease are also expressed by zebrafish, providing a platform to model existing mutations in patients. These properties make zebrafish a fitting animal model for cardiovascular research [4]. In addition, zebrafish use for research also has fewer ethical restrictions compared to mammalian models [2].
Another animal fitting as an excellent cardiovascular research model is Daphnia magna. D. magna (also known as water flea) is a well-known invertebrate animal model because of its high sensitivity to environmental change, and is usually used as prescreening for toxicity assay [5]. Furthermore, a transparent body and large heart-to-body ratio is an advantage, allowing easier observation under a microscope [6]. D. magna has a myogenic heart, which is the intrinsic property of the mammalian heart and also known to have a similarity in cardiac response to components affecting heart rate in the mammalian animal model and even humans [7,8,9]. All these advantages make D. magna an excellent animal model to investigate the effect of some compounds on the cardiovascular system.
Previously, Hoage et al. [10] developed a method for quantifying cardiac functions such as heart rate and shortening fraction in embryonic zebrafish. While providing a new and inexpensive way of obtaining cardiac function endpoints, this method might result in varied data due to manual heartbeat counting. In order to reduce data variation, the current method for heartbeat measurement in zebrafish and Daphnia involved a recording of the region of interest (ROI) and observation of dynamic pixel changes using a computer which was previously published by Sampurna et al. [11] using changes of pixel intensity due to blood cell movement during heart contraction. To further improve cardiac measurement endpoint, there are some other parameters such as stroke volume and cardiac output [12] which were not mentioned in previous studies. Currently, there are also several methods using manual counting [10,13,14], MATLAB [15,16,17,18], commercialized software [19,20,21], deep learning [22], and free software [11,23,24] already published for cardiac performance detection; however, these methods might be expensive, require some coding skills, or have limited measurement endpoints (summarized in Table 1).
A kymograph is a two-dimensional plot containing time and space information created from time-lapse images of moving or pulsing objects of interest. It is able to quantify the movement velocity and trajectory of these objects. Kymographs are mainly used for axonal transport in nervous system research [25], microtubules dynamics, and particle movement [26] in previous studies. This study aimed to develop a kymograph-based method built in ImageJ platform [27], encompassing all cardiac performance endpoints obtainable and providing an easy-to-use and inexpensive one-stop method to obtain multiple cardiac performance endpoints with high accuracy for both D. magna neonates and zebrafish embryos. To validate our method’s accuracy, we compared the overall performance with a previously established method [11]. Furthermore, we also validated the result by recording at a different ambient temperature on D. magna which has an ectothermic property [28,29]. We also used astemizole to induce arrhythmia in zebrafish [11] and tested whether our kymograph method was able to detect the corresponding cardiac performance changes.

2. Materials and Methods

2.1. Zebrafish and Daphnia Maintenance and Sample Preparation

In this study, wild type AB strain zebrafish were used and maintained in a continuously filtered and aerated water system. According to previously reported protocol, the temperature was maintained at 26 °C with a 10/14 h of dark/light cycle [30]. After harvesting, the eggs were kept in an incubator and maintained at 28 °C until 72 h post-fertilization. Daphnia magna used in this study were cultured in an aquarium tank at 26 °C dark/light cycle, like the zebrafish. The D. magna used in this study has a body size of around 3–6 mm2 (xy projection area size).

2.2. Instrument Setting for Temperature Control

To test the effect of temperature in D. magna, we used a temperature chamber (U 140A, BLAST, Tokyo, Japan) mounted on the inverted microscope (Sunny Optical Technology, Ningbo, Zhejiang, China). The temperature chamber was connected to the heater. Ice cubes were used to lower the chamber’s temperature while the heater increased and maintained the temperature. The temperature was set to 15 °C, 20 °C, 25 °C, 30 °C, and 35 °C with one-minute acclimatization each time it reaches the desired temperature. The recording was done using a digital charge-coupled device (CCD) camera to capture the heartbeat of D. magna.

2.3. Astemizole Treatment

Astemizole stock solution was purchased from Enzo Life Science (Enzo Life Science, Inc., New York, NY, USA). The stock solution was diluted to 40 µM working solution at the time of recording. A mixture of 3% methylcellulose and 40 µM astemizole in a 1:1 ratio was applied to zebrafish, resulting in a final astemizole concentration of 20 µM, while the control group was immobilized using 3% methylcellulose only. Heartbeat was recorded for 10 s after methylcellulose-astemizole treatment starting from minute 0 to minute 30 with 5 min interval for each recording. To record the zebrafish in astemizole treatment, we used the same camera setup with the temperature treatment with the exception of the temperature chamber.

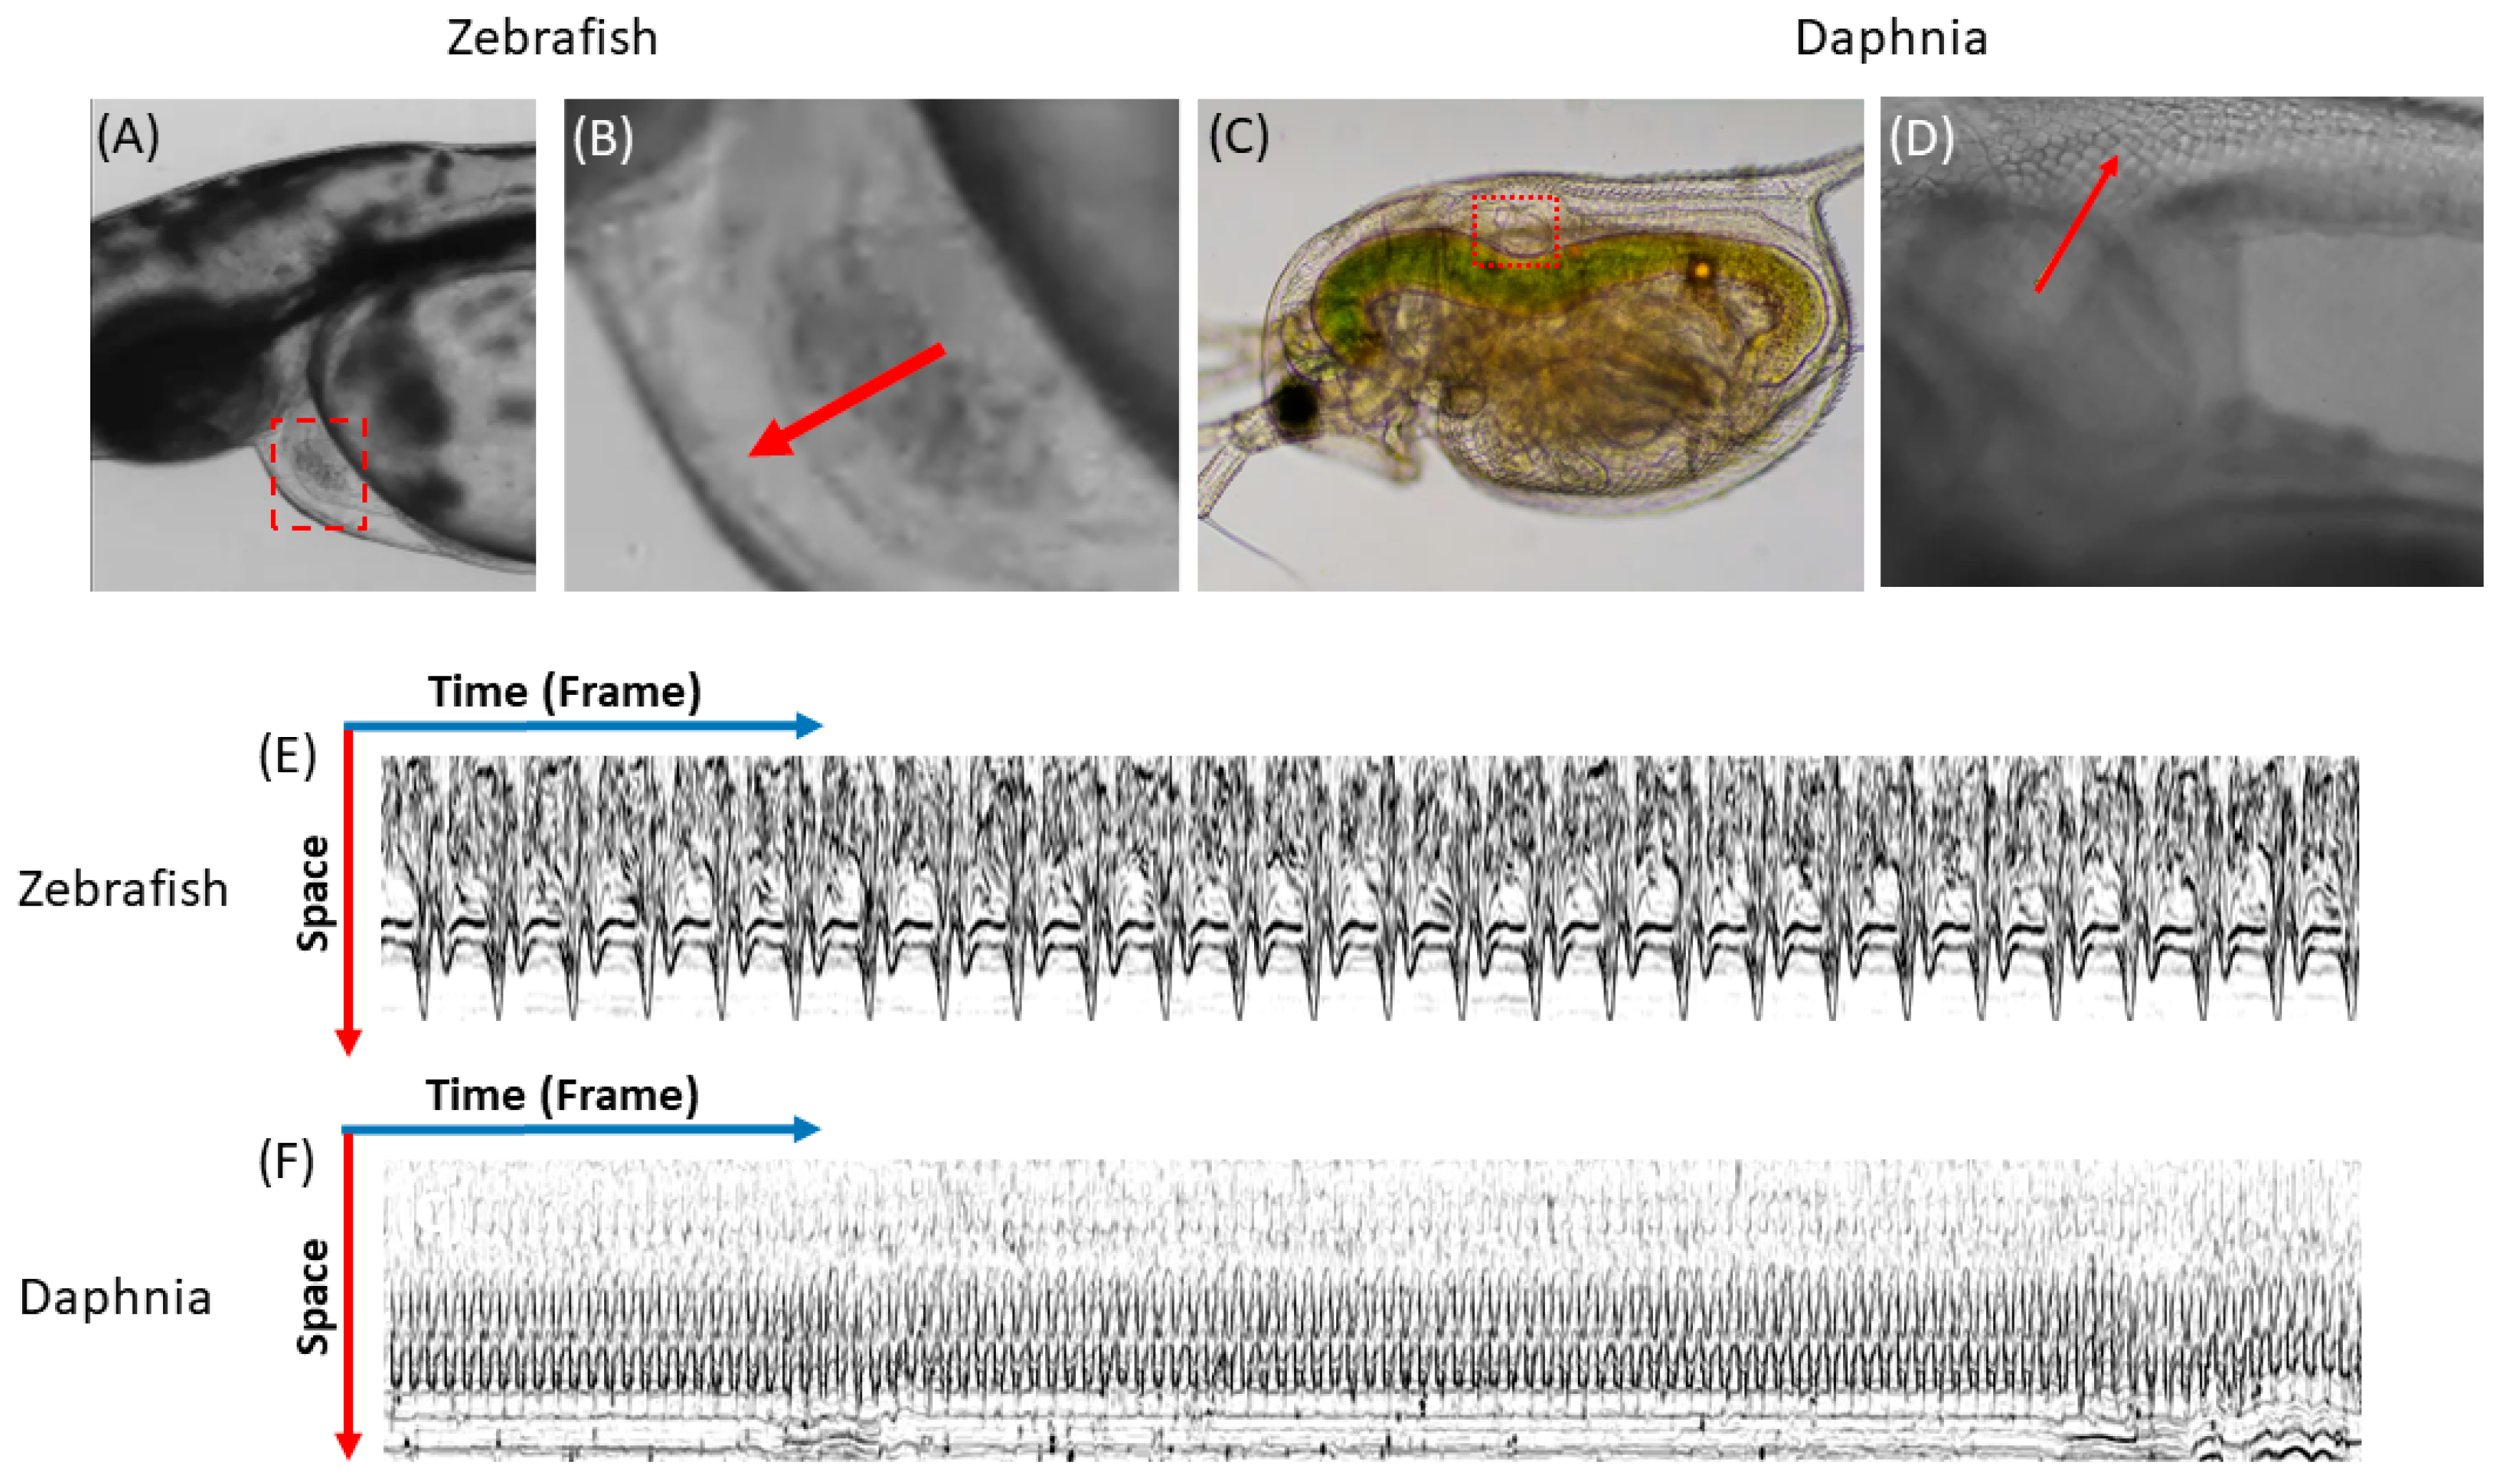
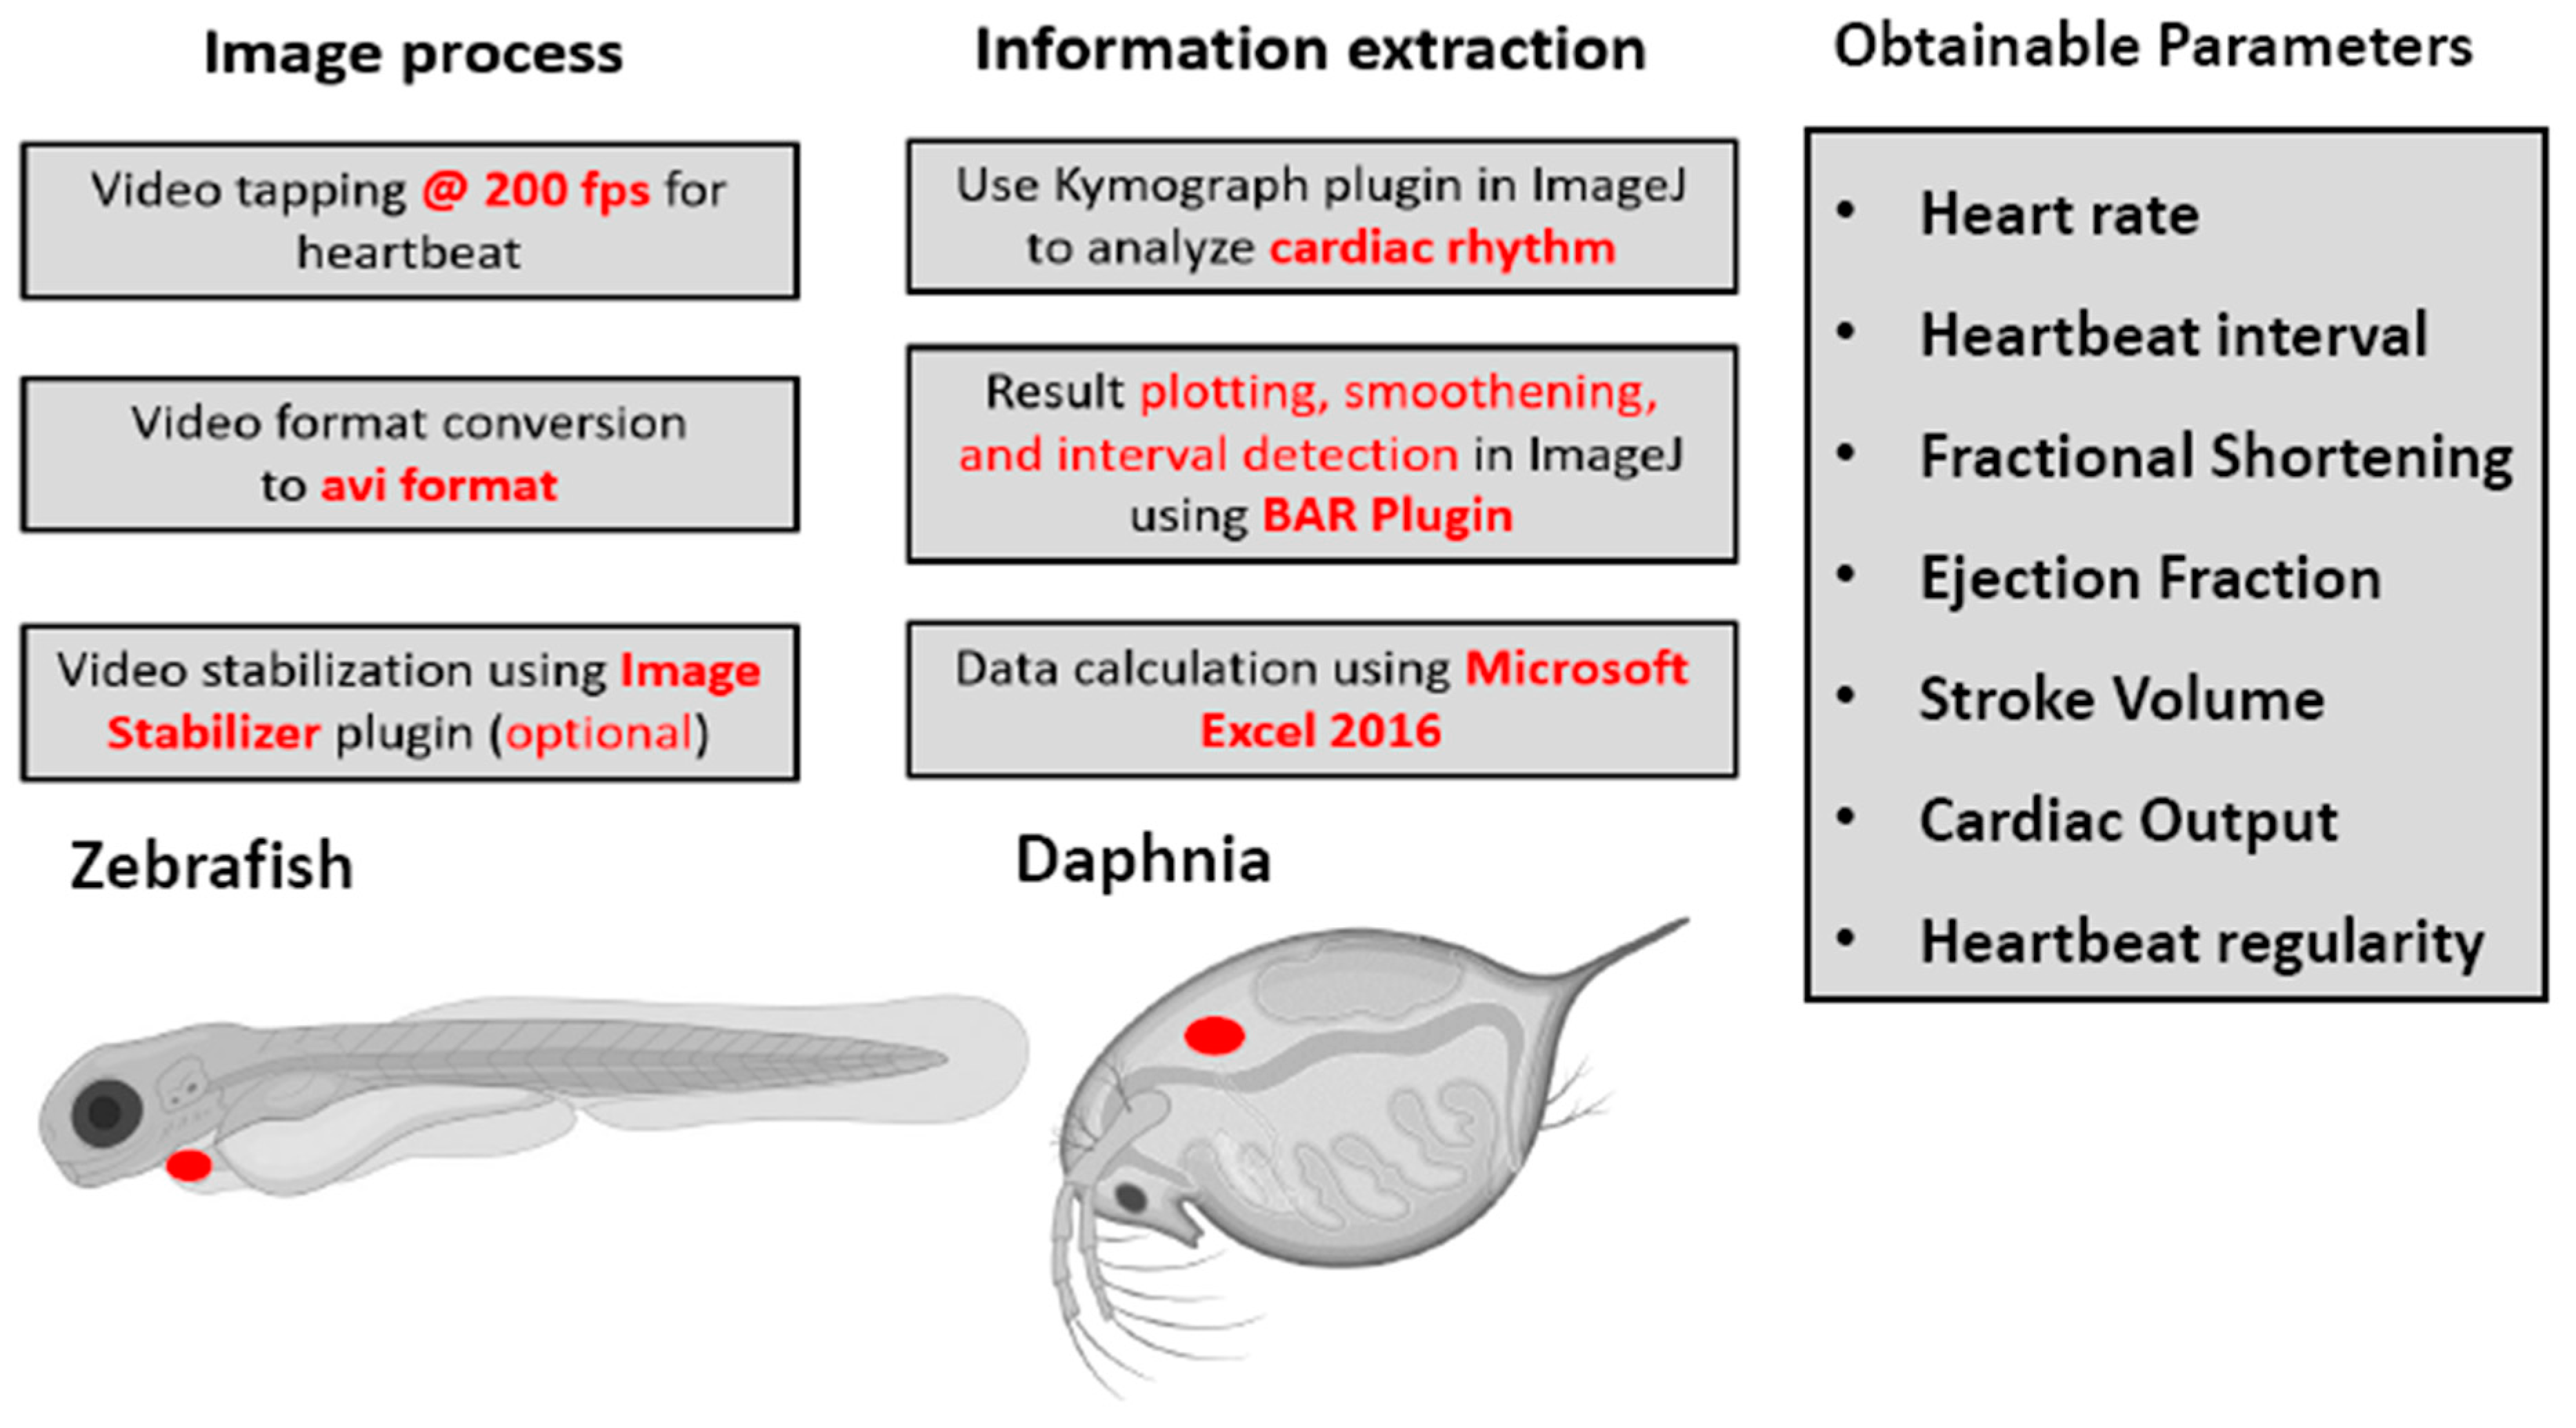
2.4. Video Capturing and Kymograph Generation

Initially, both zebrafish larvae and D. magna were positioned left-side facing upwards under the inverted microscope (Figure 1A,C) to facilitate heartbeat recording. The videography was done using a high-speed CCD camera (Zgenebio, Taipei, Taiwan) capable of recording up to 200 fps (frame per second) mounted to an inverted microscope (ICX41, Sunny Optical Technology, Ningbo, Zhejiang, China). HiBestViewer (AZ Instrument, Taichung, Taiwan) software was used to conduct high-speed video recording. An objective lens with 20x magnification was used to record D. magna heart rate while 10x magnification was used for zebrafish larvae. The kymograph was generated from the video using the Dynamic Reslice tool on Fiji distribution of ImageJ Software [27] (available online: https://imagej.net/Fiji/Downloads). Peak detection was done using the Find Peaks function on broadly applicable routines (BAR) plugin in ImageJ (available online: https://imagej.net/BAR).

2.5. Heart Rate and Heart Rate Variability Measurement

Heart rate (beat per minute) was measured by dividing 60 s with the average of time interval between peaks detected by BAR plugin. Heart rate variability was measured by using the Poincare plot plugin from OriginPro 2019 software (OriginLab Corporation, Northampton, MA, USA). The standard deviation 1 (SD1) and standard deviation 2 (SD2), which represent beat-beat interval regularity and long-term regularity respectively, were recorded and calculated statistically to determine the heart rate variability [31].

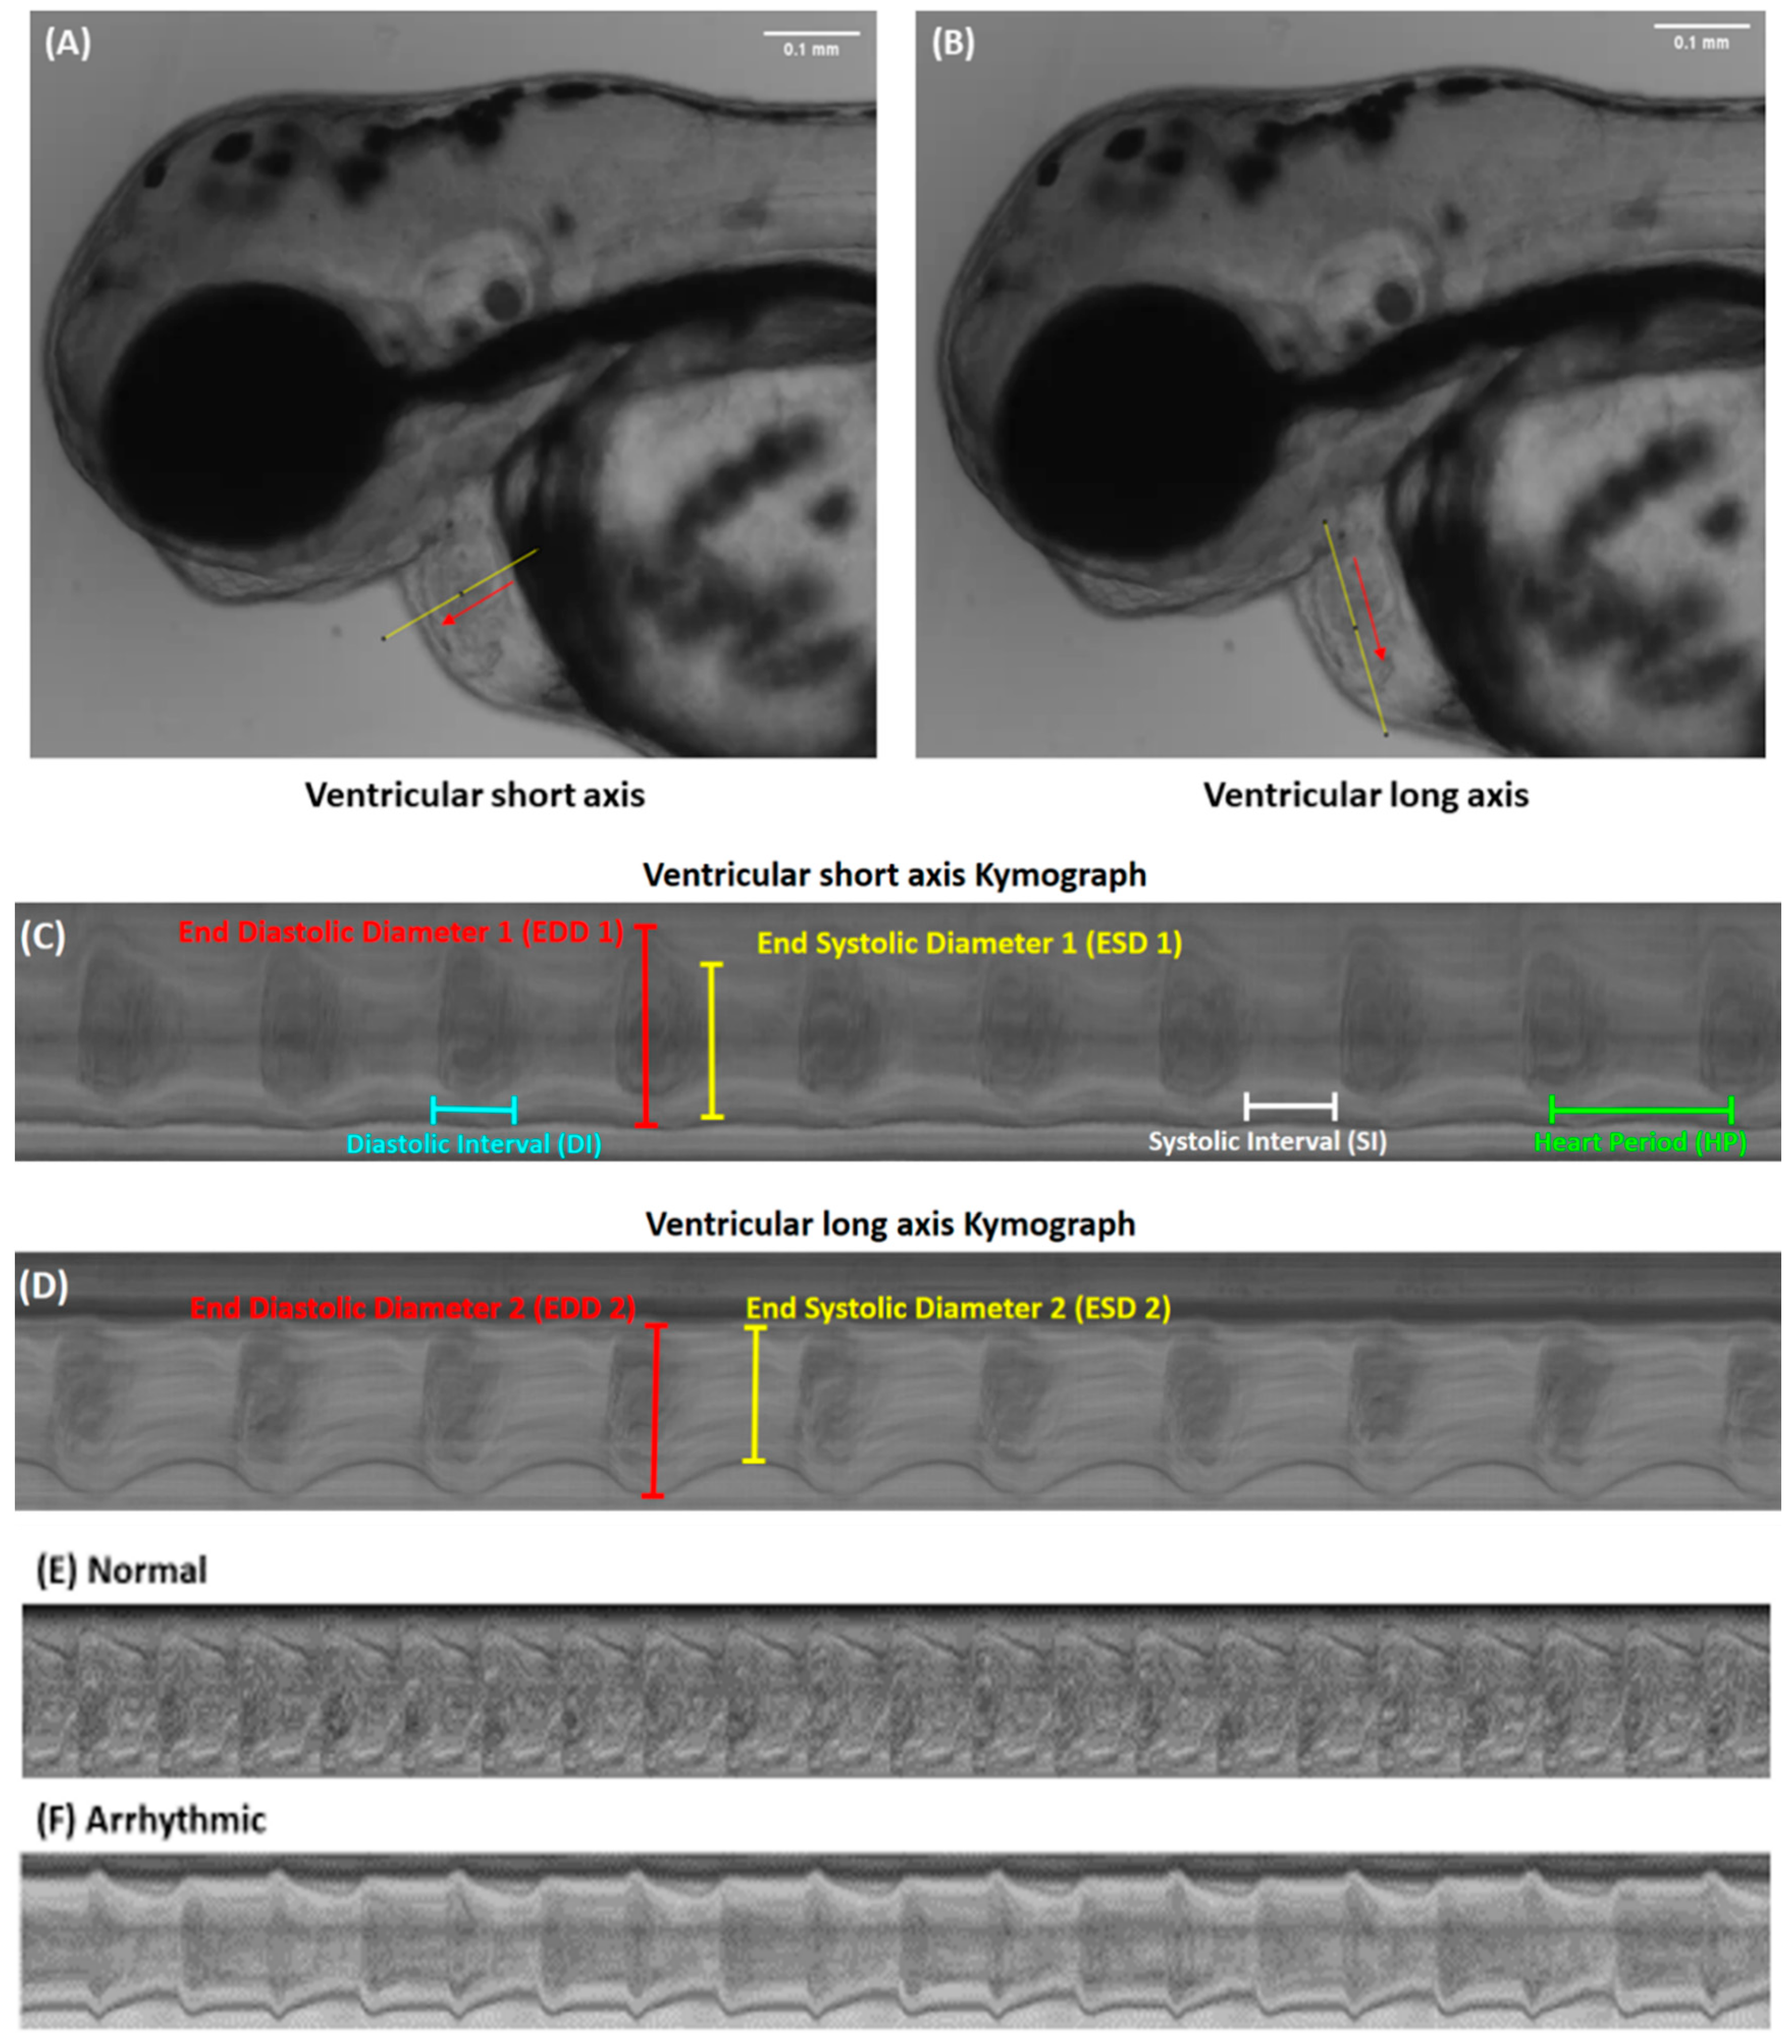
2.6. Cardiac Parameter Endpoint Calculation

End diastolic diameter (EDD) 1 for short axis, EDD 2 for long axis, end systolic diameter (ESD) 1 from short axis, and ESD 2 for long axis can be manually measured using the produced kymograph and adaptation from the method used by Hsiao et al. [12] as can be seen on Figure 2. The fractional shortening (FS) which is a measurement of ventricular contractility, can be calculated using the following formula [32]:
F S =   E D D 1 E S D 1 E D D 1   × 100 %
By assuming the ventricle is spheroid and the length of unknown diameter is the same as the shorter diameter, end diastolic volume (EDV) can be calculated using the following equation:
E D V   =   4 3   ×   π   ×   1 2   E D D 2   × 1 4   E D D 1 2   o r   1 6   ×   π   ×   E D D 2   ×   E D D 1 2
End systolic volume (ESV) can also be calculated using the same equation. After obtained EDV and ESV, ejection fraction (EF), which represents volumetric fraction blood pumped from the heart, a sensitive indicator to detect changes in contractility [33], can be calculated using the equation:
E F = E D V E S V E D V   ×   100 %
Stroke volume (SV), which represents the volume of blood being pumped within 1 pumping cycle, can also be calculated from known data by subtracting EDV with ESV [34].
S V = E D V E S V
Finally, with the obtained heart rate and stroke volume data, cardiac output (CO), which represents the volume of blood pumped within a time frame, can be calculated by the following formula [34]:
C O = S V   ×   h e a r t   r a t e

2.7. Statistics

Data were compiled and analyzed statistically using GraphPad Prism 8 software (Graphpad Holdings, LCC, San Diego, CA, USA). Significance level was set at 5% (p < 0.05). Pearson correlation was used on normalized D. magna heart rate data, while Wilcoxon test was used for D. magna heart rate regularity as the data did not follow normal distribution assumption. The data were presented as mean ± SEM. Effect of selected ROI positioning data on both atrium and ventricle (A-V) and ventricle-atrium (V-A) interval measurement were calculated using kymograph and time series analyzer (TSA) method were calculated using two-way ANOVA and presented as mean ± SEM. Different letters (a,b) were used to denote significant differences. Effect of astemizole treatment on zebrafish heartbeat were calculated using two-way ANOVA and presented as mean ± SEM. The data for multiple endpoints achievable using kymograph between control and astemizole-treated zebrafish were presented as mean ± SD and compared using Mann–Whitney test as the data did not follow normal distribution assumption (* p < 0.5, ** p < 0.1, *** p < 0.001, **** p < 0.0001).

3. Results

3.1. Overview of Experimental Workflow

Although several cardiac rhythm measurement methods have been reported in zebrafish and D. magna, most of them were able to extract few cardiac physiology endpoints. In this study, we aimed to establish a one-stop, kymograph-based method to measure multiple cardiac physiology endpoints such as heart rate, ejection fraction, fractional shortening, stroke volume, cardiac output, and heartbeat variability. Two animal models of zebrafish and D. magna were adopted since they are popular aquatic vertebrate and invertebrate models often used for cardiac physiology and toxicology studies. Initially, to obtain the unbiased data for fast heart beat rate nature, videography was performed using a high-speed CCD mounted on an inverted microscope. The recording video (around 10 sec) was obtained in mp4 format and needs to be converted to avi format using VirtualDub (available online: virtualdub.org/download.html) software for downstream ImageJ processing. Kymographs were made from the region of interest (ROI), which is the heart on both species for heartbeat quantification. Due to the anesthesia-free procedure used in this study, the specimen might move or struggle during recording, disrupting the quantification process. To overcome this limitation, we used ImageJ Stabilizer plugin [35] to stabilize the image and reduce minor-medium movement. The kymographs can be plotted, smoothened, and quantified using the Smoothed Plot Profile and Find Peaks tools in the BAR plugin in ImageJ [36]. Some macro languages were conducted in order to simplify the entire data collection process (see Supplementary Files 1 and 2). Finally, multiple cardiac physiology endpoints such as heart rate, ejection fraction, fractional shortening, stroke volume, and cardiac output can be obtained using mathematical calculation while heart rate variability can be analyzed using Poincare plot in OriginPro Software. The workflow of data processing for this research is schematically illustrated in Figure 3.

3.2. Measurement of Heart Rate by Kymograph in Zebrafish and Daphnia Magna

The kymograph for zebrafish larvae and D. magna heart chamber was made by drawing a line from the heart’s inner part to the outermost area during diastole. The resulting kymograph can be adjusted using the Brightness/Contrast tool provided by ImageJ software to make a better visualization of heart movement during the beat for zebrafish larvae (Figure 1B, original video can be found in Supplementary File 3) and D. magna neonates (Figure 1D, original video can be found in Supplementary File 4), respectively. The resulting kymograph shows the space and time relationship for heartbeat, and the time interval between two kymograph peaks can be defined as heartbeat interval. Quantification of zebrafish and D. magna heartbeat started by drawing a straight line from the leftmost side of the short-axis kymograph to the rightmost side (see supplementary protocol). The line must go through the ROI where heart movement or blood is present. Then, the heartbeat plot was made in ImageJ using the Plot Profile tool or by using the Smoothed Plot Profile tool included in the broadly applicable routine (BAR) plugin. Finally, a plot of time (x-axis) and gray value (y-axis) was made (Figure 1E for zebrafish and 1F for Daphnia) and the Find Peaks tool in the BAR plugin automatically detected the timing of the peaks.

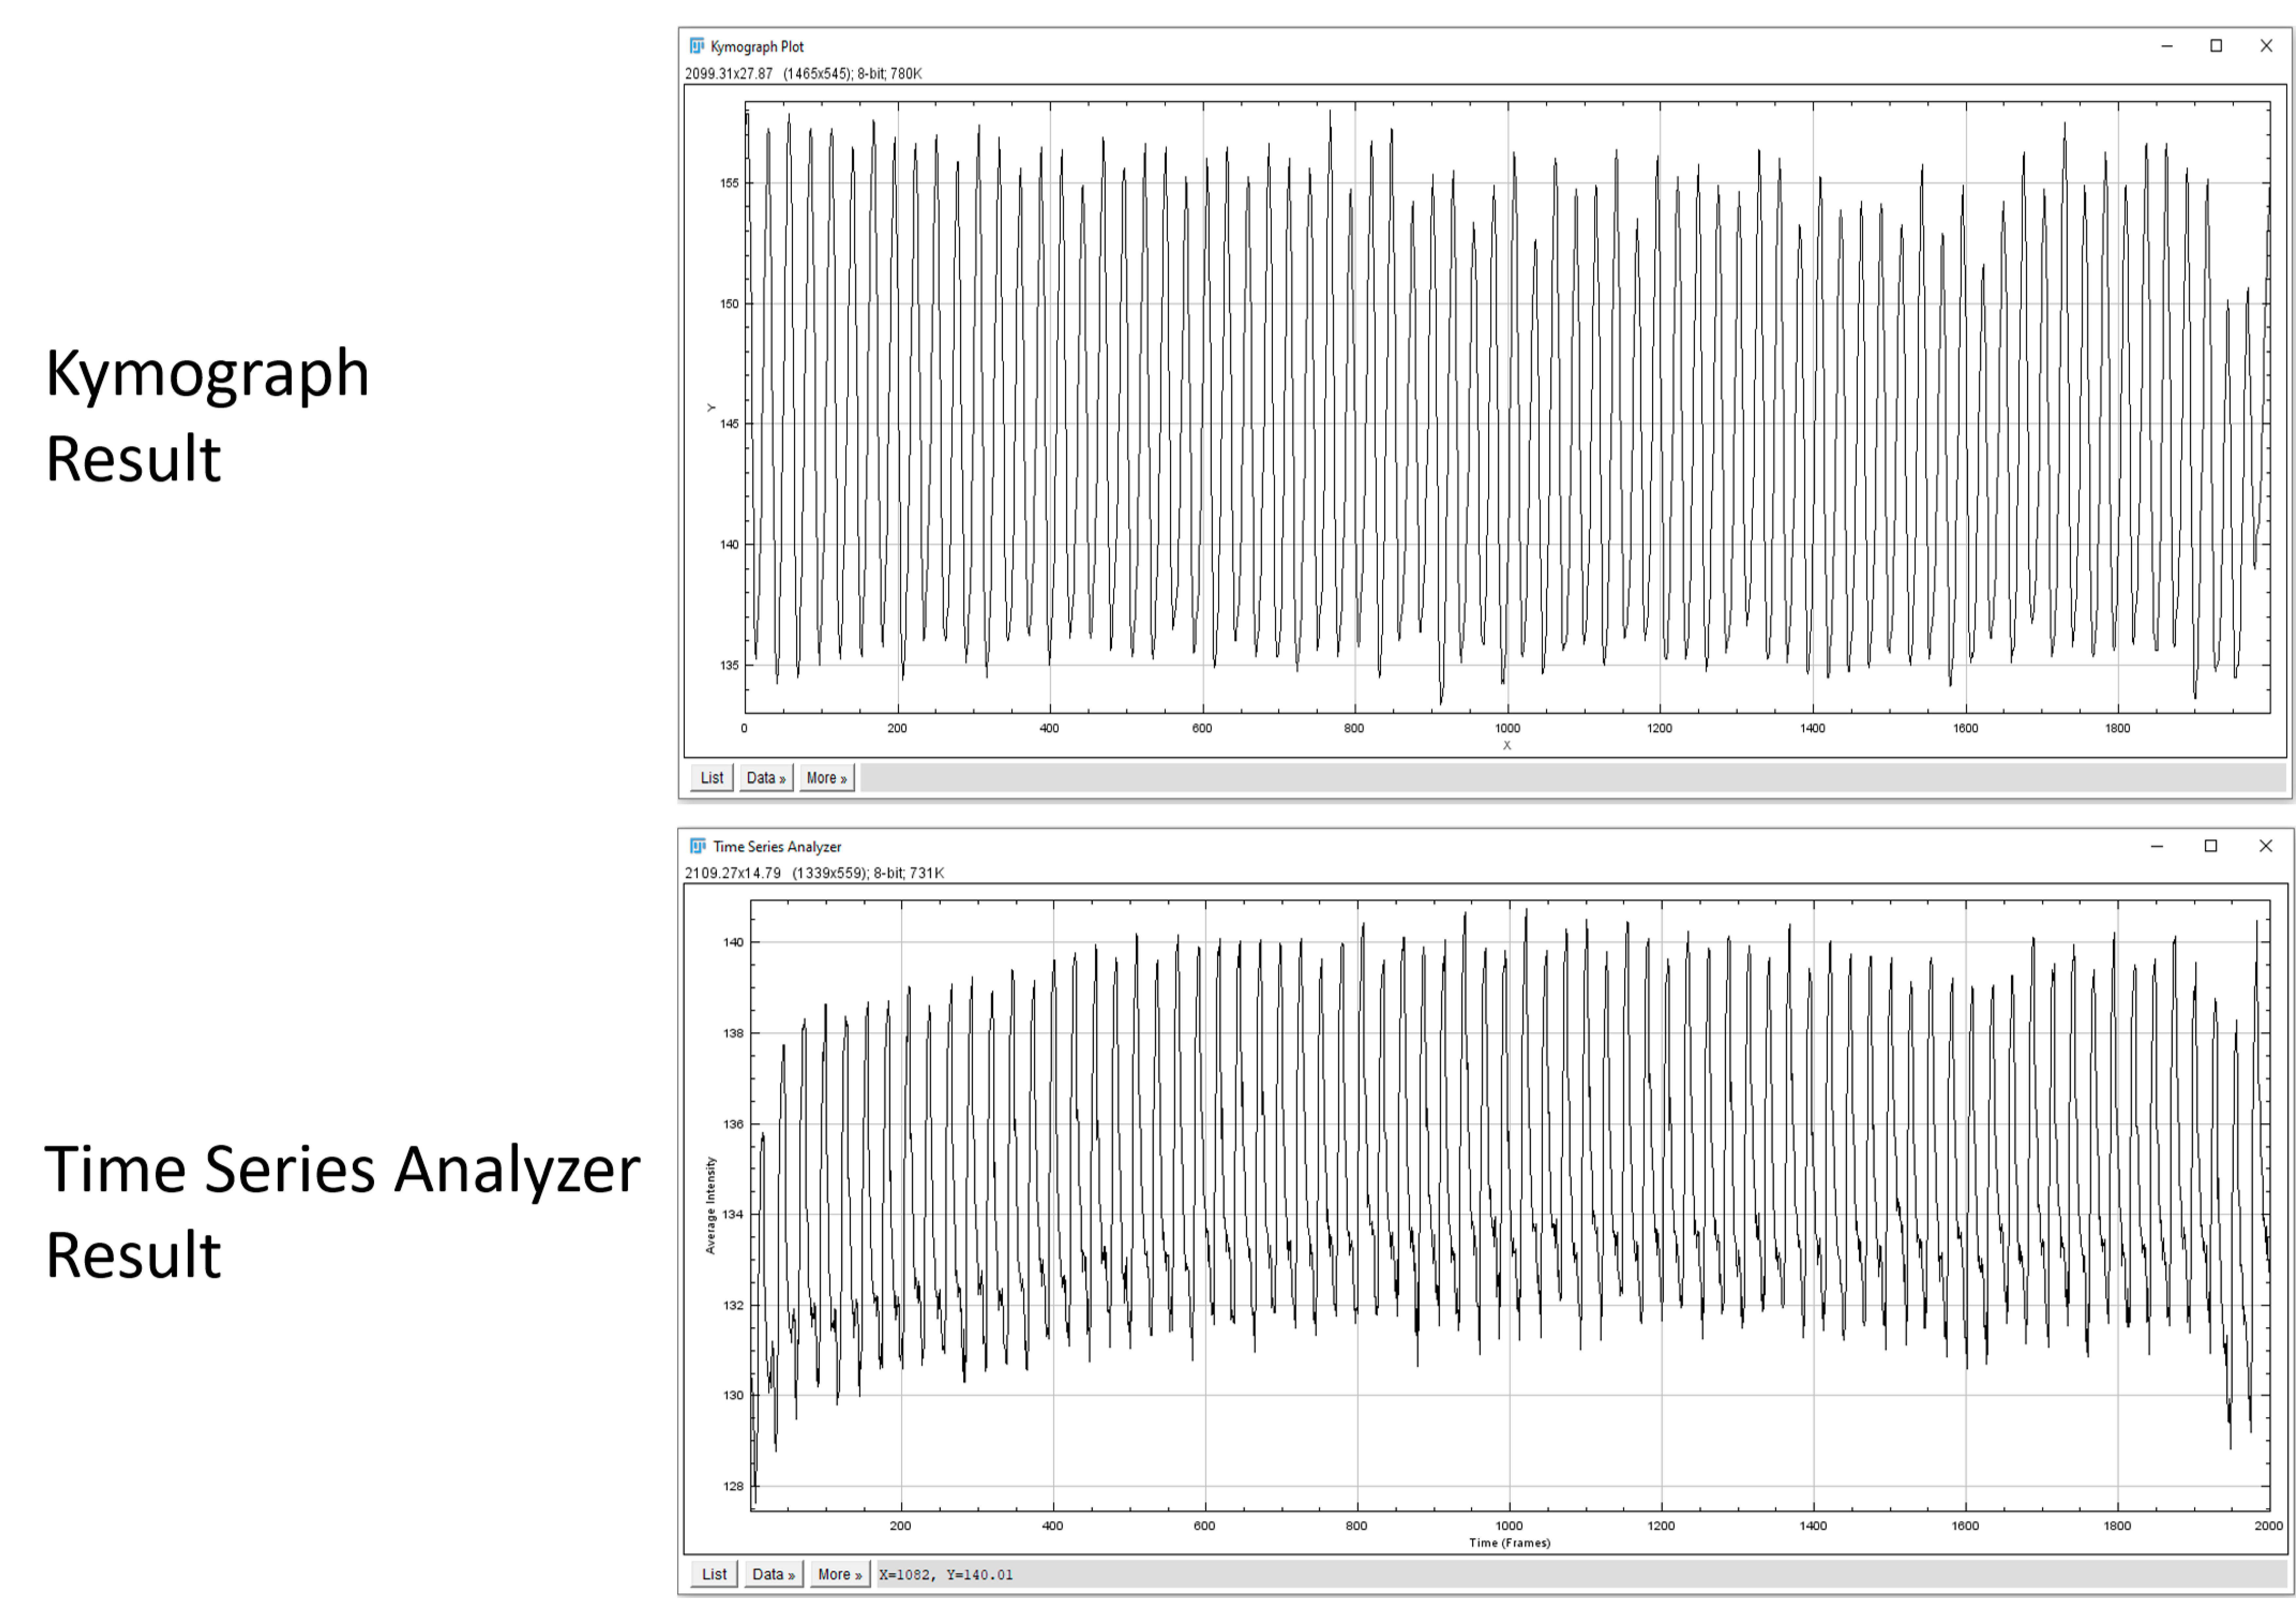
3.3. Comparison of Different Measuring Methods on Heart Rate Variability in Daphnia Magna

Our previously reported time series analyzer (TSA) method for cardiac rhythm measurement in zebrafish is based on the dynamic pixel change of blood within the heart chamber [11]. Once the selected ROI did not contain blood cell movement, this TSA-based ImageJ method might have some bias. On the other hand, the kymograph method reported here can measure either the blood cells within the heart chamber or heart chamber movement (contraction and relaxation), providing a more flexible option choice for the users. To compare the utility and performance between TSA and kymograph methods, we raised D. magna neonates in different temperature and their corresponding heartbeat rate and regularity were compared. Results show the heartbeat rate obtained from both methods display similar and consistent values at different testing temperatures. This high consistency between TSA and kymography for heart rate measurement in D. magna neonates was further justified through Pearson correlation statistical calculation (Figure 4A). This result shows the kymograph’s ability to accurately detect high-speed heartbeat movement and distinguish the interval clearly within the plot.
Poincare plot is a good method to measure heart rate regularity by measuring the time interval between two consecutive beats in two dimensions. As previously mentioned, the standard deviation is defined as SD1 for beat-beat interval regularity and SD2 for the long-term regularity [31]. The heart rate regularity obtained from TSA and kymograph methods for D. magna recorded in different temperature was compared. Interestingly, both SD1 and SD2 showed higher variation in low temperature than high temperature groups for both analysis methods. Significantly higher SD1 and SD2 values were observed in kymography than TSA methods at different testing temperatures for Daphnia heartbeats (Figure 4B). The most significant difference can be observed at the ambient temperature of 25 °C, showing higher SD1 of 0.02383 ± 0.007 for kymograph vs. 0.0069 ± 0.0019 SD1 of TSA; and SD2 of 0.2083 ± 0.0072 vs. 0.0046 ± 0.0023 SD2 for TSA. High variation of SD1 and SD2 demonstrated that the kymograph method is more sensitive than the TSA method as it can detect the slightest change in the heart variability of D. magna’s heartbeat. An example of the peak acquired from both methods can be seen on Figure A1 in Appendix A.

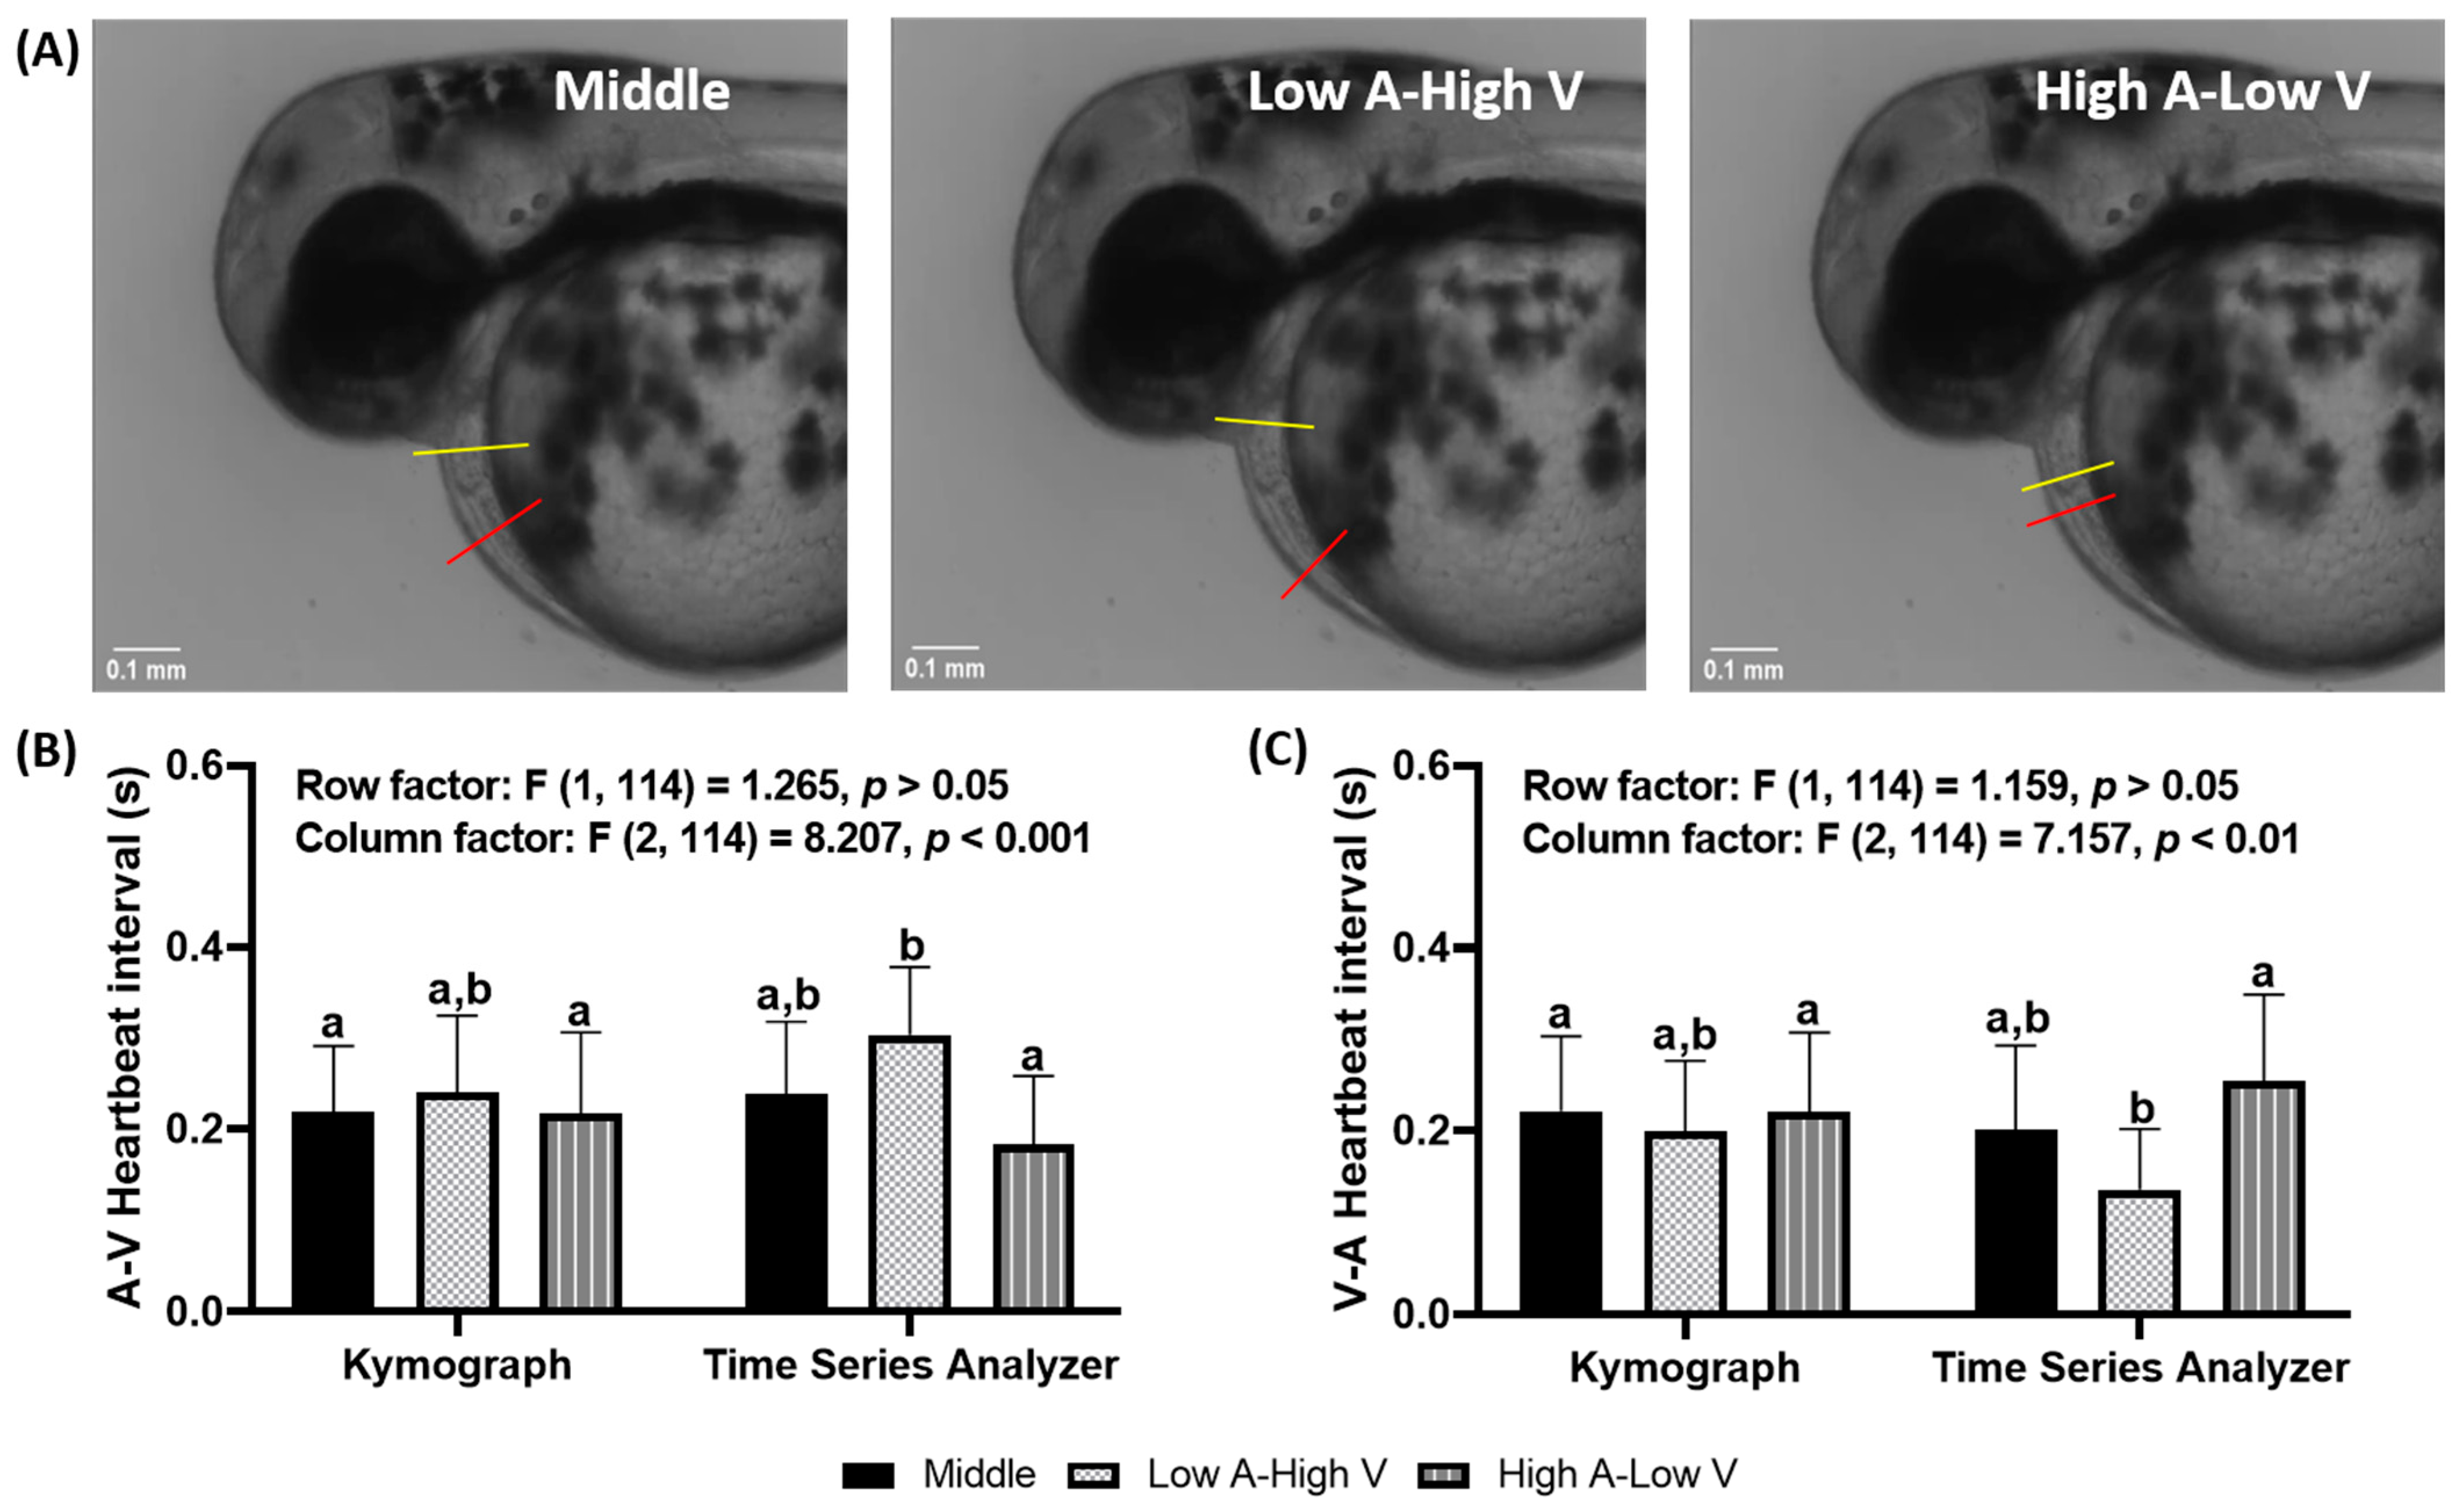
3.4. Effects of Region of Interest (ROI) Position on Heartbeat Regularity in Zebrafish

Based on the experience obtained from our previous TSA-based ImageJ method [11], we learned the selected ROI position play an essential role for cardiac rhythm detection. In this study, we wanted to compare the performance between TSA and kymograph methods in different ROI positions. Zebrafish embryos were used for this validation, and three different ROI positions were tested as (1) middle position at both cardiac chambers, (2) low position for atrium and high position for ventricle, and (3) high position for atrium and low position for ventricle (Figure 5A).
Since zebrafish have two cardiac chambers as atrium and ventricle, we measured the atrium-ventricle (A-V) and ventricle-atrium (V-A) intervals at three different positions based on either TSA or kymograph methods in zebrafish for cardiac rhythm comparison. The result showed that the different ROI positions indeed affect the analysis results. When using the TSA method, significant differences were evident at low atrium and high ventricle measuring position (Low A-High V) for in A-V (Figure 5B) and or high atrium and low ventricle (High A-Low V) measuring position for V-A interval (Figure 5C). The kymograph-based method, on the contrary, showed more stable results with similar time intervals between all three testing positions (Figure 5B,C). This result shows that the kymograph method is superior to the time series analyzer as it shows position-independent manner.

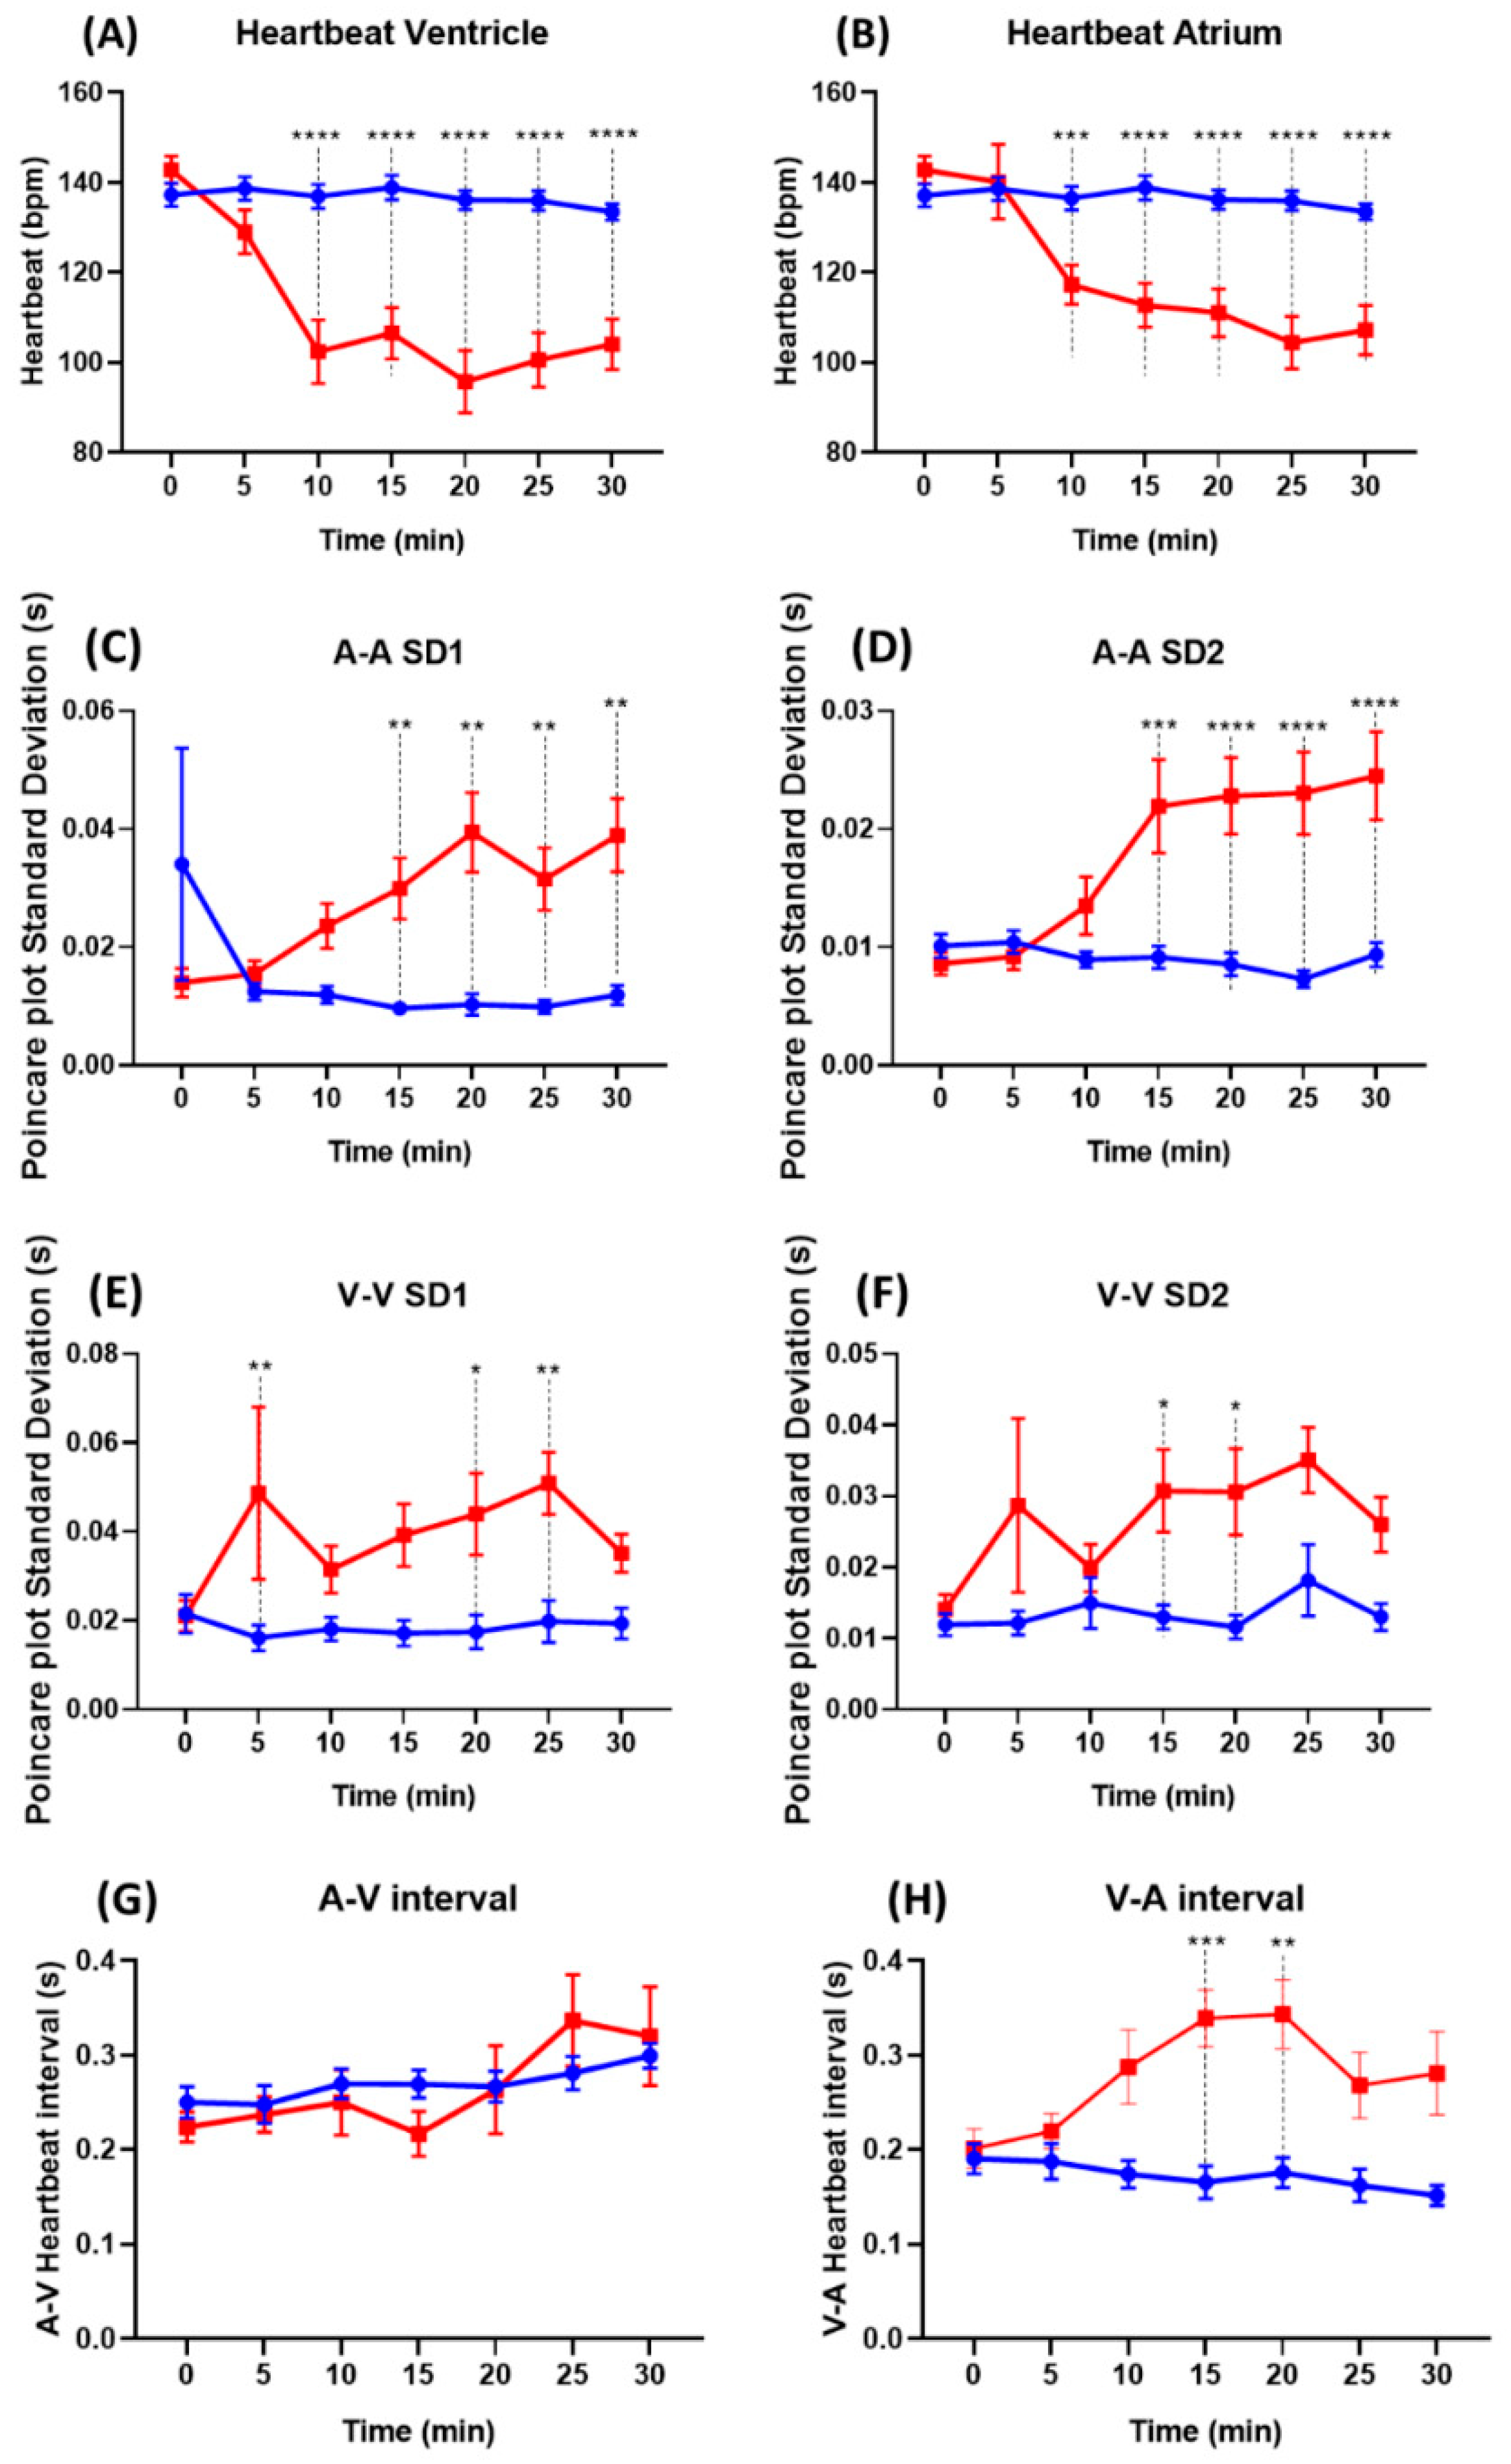
3.5. Comparison of the Heartbeat Regularity after Astemizole Treatment in Zebrafish

Based on the optimized ROI position (middle position for both cardiac chambers), we wanted to validate whether our developed kymograph method is able to evaluate potential cardiac arrhythmia. To achieve this goal, astemizole (a second-generation antihistamine) was selected to induce arrhythmia in a time-dependent manner according to our previous publication [11]. Compared to the control group, astemizole treatment (at 20 µM) induced a fast heart rate drop in both atrium and ventricle chambers from 10 min onwards until the end of the experiment (Figure 6A,B). The lowest heart rate was observed in ventricle (96 ± 30 bpm) and in atrium (104 ± 25 bpm) at 20 min and 25 min after astemizole treatment, respectively (Figure 6A,B).
In addition to heart rate decline, astemizole treatment also induced heartbeat irregularity in zebrafish, which increased mostly in a time-dependent manner in both cardiac chambers (Figure 6C–F). In the atrium, a significant difference was observed starting from 15 min after astemizole exposure (SD1 value of 0.0299 ± 0.0226 and SD2 value of 0.0219 ± 0.0172) compared to control group (SD1 value of 0.0096 ± 0.0040 and SD2 value of 0.0091 ± 0.0041). Both SD values kept showing significant differences until the end of the experiment on 30 min. However, in the ventricle, the result seems to vary between SD1 and SD2. SD1 shows a significant difference at 5, 20, and 25 min after astemizole treatment (0.0487 ± 0.0845) compared to control (0.0161 ± 0.0125).
For more detailed evaluation of cardiac rhythm after astemizole treatment, we measured the A-V and V-A interval and found there are no significant change for A-V interval (Figure 6G) after astemizole treatment over time. However, a significant increment was observed in the V-A interval (Figure 6H) from 0.166 ± 0.075 s to 0.339 ± 0.124 s at 15 min after astemizole treatment and 0.176 ± 0.069 s to 0.343 ± 0.142 s at 20 min after treatment, which give some insight that reduction of heart rate after incubation in astemizole mainly comes from the increase of V-A interval. This result showed that the kymograph method can detect the change in cardiac rhythm after astemizole treatment in zebrafish.

3.6. Measurement of Multiple Cardiac Performance Endpoints by Using Kymograph

In addition to heart rate measurement, we next explored the possibility to use this kymograph-based method to obtain other important heart parameters in a one-stop manner. These parameters include end-diastolic diameter (EDD), end-systolic diameter (ESD), heart period (HP), diastolic interval (DI), and systolic interval (SI) (Figure 2). For EDD and ESD measurement, a line can be drawn across the heart chamber at short- and long-axis (Figure 2A,B). EDD and ESD obtained from both the short- and long-axis of the heart is used for calculating stroke volume (SV), fractional shortening (FS), and ejection fraction (EF). Heart period can be used to calculate the heart rate. However, the kymograph method is able to accurately obtain heart rate data rather than using heart period as manual observation. Any significant changes within systolic interval and diastolic interval can be considered as heartbeat irregularity. Finally, by combining heart rate data with stroke volume (SV), cardiac output (CO) can be calculated, as previously mentioned by Hsiao et al. [12].
To validate this tool’s utility, we used parameters obtained from kymograph method to compare the cardiac physiology endpoints between control and astemizole-treated zebrafish embryos. Astemizole treatment increased the heart short-axis length and volume in both EDV and ESV while reducing heart rate, shortening fraction, ejection fraction, and cardiac output of zebrafish larvae. Furthermore, astemizole treatment also increased the ESV in zebrafish larvae. An increase in end-systolic volume means that the blood volume ejected from the heart chamber is low, showing the heart’s lower contraction power (Table 2).

4. Discussion

Although several methods have been established for heart rate analysis in aquatic animals, they suffer from some drawbacks like limited usage, expensive instrument setting, or complicated operational procedures [11,19,37] (summarized in Table 1). The most updated review on analyzing the pros and cons of current cardiac rhythm detection methods in zebrafish can be found in our recent review article [38]. Sampurna et al. [11] developed a simple and cost-effective ImageJ-based method to calculate cardiac rhythm in zebrafish. However, this stand-alone method is limited as it is only capable of calculating heart rate. Other important cardiac parameters, on the contrary, still need to perform manual measurement. This limitation led us to develop kymograph-based method in order to provide a more comprehensive way for data collection and processing. By utilizing several macro languages (see supplementary data) to facilitate image processing and semi-automated data calculation, we presented a more versatile kymograph-based method for cardiac performance evaluation in zebrafish larvae and D. magna neonates for the first time.
Kymograph is a method to dissect the time and space relationship and has been utilized to analyze cilia beating [39,40] or vesicle transportation [41,42]. This method has also been used to measure heartbeat in insects [43], crabs [44], and freshwater mussel [45]. In Drosophila, Chakraborty et al. [46] used the kymograph method for visualization of heart movement within a period, allowing them to obtain heart-related data such as EDD, ESD, HP, SI, and DI. The current kymograph-based method can be considered a semi-automated tool for multiple heart parameter measurement by combining several tools like image stabilizer, BAR plugin, and several macros to facilitate its overall performance. A similar approach has been reported by Collins et al. [47] to measure the cardiac arrhythmia in zebrafish pitx2c mutant by using MATLAB scripts. In this study, we provided a user-friendly ImageJ(Fiji)-based kymography tool and clearly demonstrated this new invented tool displays more endpoints and showed higher accuracy than previously ImageJ-based method reported by Sampurna et al. [11] on measuring cardiac physiology.
Detection of heart chamber parameters using kymograph is based on the dynamic pixel changes, shown by the gray value on the time and space of the ROI. The presence of heart chamber wall or blood cell will increase the gray value on the time dimension. Thus, it is preferable to select an ROI with higher contrast to the background to reduce detected noise. By using our optimized instrument and software parameter settings presented in this study, we can detect the gray value over time of the heart wall with good contrast. In this study, we used a high speed CCD camera to record the heart chamber at frame rate of 200 fps and check the heart rate regularity. High frame rate is preferred in the kymograph method as this method relies on the gray value caused by pixel color changes from frame to frame. High frame number will result in an increase of information and accuracy of the pixel changes. Higher frame rate is also more preferred during heart rate variability calculation as it will enable us to obtain the exact timing of the beat, especially with animals with a high heart rate like D. magna. However, a very high frame rate could result in more noise, resulting in a new problem; therefore, depending on the heart rate, camera settings should be adjusted in order to record at suitable frame rate and obtain the optimal result [48].
Changes in heart rate can be caused by physiological and pathological factors, lifestyle factors, environmental factors, and neurophysiological factors [49]. Within these factors, the environmental factor, especially temperature, is capable of inducing fast bradycardia or tachycardia [50]. Due to being ectothermic organism, changes in water temperature can significantly alter D. magna heart rate [51]. An increase in temperature will increase metabolic activity resulting in high cellular oxygen demand, which increases heart activity to fulfill the demand, while the opposite happens during low temperatures [52]. In this assay, we provide good evidence to show that the combination of high-speed videography and the kymograph method can detect superfast heartbeat in D. magna when they are acclimated to high water temperature conditions (up to 600 bpm). In addition, more information regarding heart rate variability can be extracted by using the kymograph method compared to TSA-based counterpart as kymograph method could sensitively detected more variability in heart rate compared to TSA method.
In this study, we further validated the potential utility of our developed kymograph method that is able to evaluate cardiac physiology alterations after waterborne astemizole exposure. Astemizole is a compound able to block outward repolarizing potassium channels to induce long QT syndrome, which is a condition affecting heart repolarization after beat. Overdosage of astemizole makes cytochrome-P450, a primary enzymatic system for detoxification, unable to metabolize the drugs resulting in prolonging the drug duration and causing adverse reactions. Long QT syndrome increases the possibility of an individual contracting a fatal ventricular arrhythmia called torsades de pointes (TDP) that might lead to sudden cardiac arrest [53]. In this study, we observed a faster decline of zebrafish heart rate starting from 10 min after astemizole treatment. However, a significant difference was observed starting from 15 min after treatment until the end of observation. According to high-speed videography, ventricular pumping was not observed 15 min after astemizole exposure; however, blood backflow from the ventricle to the atrium was observed. Furthermore, by using this kymograph, we also observed significant changes in several cardiac parameters (decline of EDV, SF, EF, HR, and CO) after 30 min of astemizole treatment due to potassium channel blockage within the heart muscle, disturbing heart muscle contractility and affecting the cardiac parameter and cardiac rhythm.

5. Conclusions

In conclusion, we provided a one-stop method for easy and inexpensive cardiac physiology assessment in two important aquatic models of zebrafish larvae and D. magna neonates. By using this kymograph-based ImageJ tool, we provided a simple method for scientists without experience in coding. The kymograph data are also comparable to the previous TSA-based method and competitive to other established methods. By using the image stabilizer, BAR plugin, and developed macro, most of the work can be done semi-automatically in the ImageJ platform. We believe this kymograph-based tool can provide the research community with a simple toolkit with multiple function for cardiac physiology and toxicology assessments. However, development of a fully automated method is also considered necessary to reduce the workload and hasten the process in the future.

Supplementary Materials

The following are available online at https://0-www-mdpi-com.brum.beds.ac.uk/2411-5134/6/1/8/s1, File 1. Standard operation protocol, File 2. ImageJ macro used in this study, File 3. Zebrafish sample video, File 4. Daphnia magna sample video. Both videos were originally recorded at 200 fps. It is automatically converted to 30 fps by the recording software. Therefore, 200 fps is used for the heartbeat calculation, not 30 fps.

Author Contributions

Conceptualization, K.A.K., K.H.-C.C., H.-T.L., and C.-D.H.; methodology, K.A.K. and F.S.; software, F.S.; validation, M.J.M.R. and A.L.C.; formal analysis, J.-C.H.; investigation, K.A.K. and F.S.; resources, K.H.-C.C. and H.-T.L.; writing—original draft preparation, K.A.K., F.S., K.H.-C.C., H.-T.L., and C.-D.H.; visualization, C.-D.H.; supervision and funding acquisition, K.H.-C.C., H.-T.L., and C.-D.H. All authors have read and agreed to the published version of the manuscript.

Funding

This research was funded by the Ministry of Science Technology, Taiwan, grant numbers MOST107-2622-B-033-001-CC2 and MOST108-2622-B-033-001-CC2 to C.-D.H., and MOST107-2321-B415-001 to H.-T.L.

Institutional Review Board Statement

All protocols and procedure involving zebrafish and D. magna were approved by the Committee for Animal Experimentation of the Chung Yuan Christian University (Approval No. 109001, issue date 15 January 2020).

Informed Consent Statement

Not applicable.

Data Availability Statement

The data presented in this study are available on request from the corresponding author.

Conflicts of Interest

The authors declare no conflict of interest. The funders had no role in the design of the study; in the collection, analyses, or interpretation of data; in the writing of the manuscript, or in the decision to publish the results.

Appendix A

Figure A1. Comparison of peak acquired from either kymograph (upper panel) or time series analyzer (lower panel) methods.
Inventions 06 00008 g0a1

References

  1. World Health Organization. Hearts: Technical Package for Cardiovascular Disease Management in Primary Health Care; World Health Organization: Geneva, Switzerland, 2016. [Google Scholar]
  2. Gut, P.; Reischauer, S.; Stainier, D.Y.R.; Arnaout, R. Little fish, big data: Zebrafish as a model for cardiovascular and metabolic disease. Physiol. Rev. 2017, 97, 889–938. [Google Scholar] [CrossRef] [PubMed]
  3. Howe, K.; Clark, M.D.; Torroja, C.F.; Torrance, J.; Berthelot, C.; Muffato, M.; Collins, J.E.; Humphray, S.; McLaren, K.; Matthews, L. The zebrafish reference genome sequence and its relationship to the human genome. Nature 2013, 496, 498–503. [Google Scholar] [CrossRef] [PubMed] [Green Version]
  4. Bournele, D.; Beis, D. Zebrafish models of cardiovascular disease. Heart Fail. Rev. 2016, 21, 803–813. [Google Scholar] [CrossRef] [PubMed]
  5. Guilhermino, L.; Diamantino, T.; Silva, M.C.; Soares, A. Acute toxicity test with daphnia magna: An alternative to mammals in the prescreening of chemical toxicity? Ecotoxicol. Environ. Saf. 2000, 46, 357–362. [Google Scholar] [CrossRef] [Green Version]
  6. Greene, M.; Pitts, W.; Dewprashad, B. Using videography to study the effects of stimulants on daphnia magna. Am. Biol. Teach. 2017, 79, 35–40. [Google Scholar] [CrossRef]
  7. Campbell, A.K.; Wann, K.T.; Matthews, S.B. Lactose causes heart arrhythmia in the water flea daphnia pulex. Comp. Biochem. Physiol. B Biochem. Mol. Biol. 2004, 139, 225–234. [Google Scholar] [CrossRef]
  8. Villegas-Navarro, A.; Rosas-L, E.; Reyes, J.L. The heart of daphnia magna: Effects of four cardioactive drugs. Comp. Biochem. Physiol. C Toxicol. Pharmacol. 2003, 136, 127–134. [Google Scholar] [CrossRef]
  9. Gaikwad, N.; Panat, A.; Deshpande, M.; Ramya, K.; Khalid, P.; Augustine, P. Effect of shilajit on the heart of daphnia: A preliminary study. J. Ayurveda Integr. Med. 2012, 3, 3. [Google Scholar]
  10. Hoage, T.; Ding, Y.; Xu, X. Quantifying cardiac functions in embryonic and adult zebrafish. In Cardiovascular Development; Peng, X., Antonyak, M., Eds.; Humana Press: Totowa, NJ, USA, 2012; pp. 11–20. [Google Scholar]
  11. Sampurna, B.P.; Audira, G.; Juniardi, S.; Lai, Y.-H.; Hsiao, C.-D. A simple imagej-based method to measure cardiac rhythm in zebrafish embryos. Inventions 2018, 3, 21. [Google Scholar] [CrossRef] [Green Version]
  12. Hsiao, C.-D.; Wu, H.-H.; Malhotra, N.; Liu, Y.-C.; Wu, Y.-H.; Lin, Y.-N.; Saputra, F.; Santoso, F.; Chen, K.H.-C. Expression and purification of recombinant ghk tripeptides are able to protect against acute cardiotoxicity from exposure to waterborne-copper in zebrafish. Biomolecules 2020, 10, 1202. [Google Scholar] [CrossRef]
  13. Jeong, T.-Y.; Yoon, D.; Kim, S.; Kim, H.Y.; Kim, S.D. Mode of action characterization for adverse effect of propranolol in daphnia magna based on behavior and physiology monitoring and metabolite profiling. Environ. Pollut. 2018, 233, 99–108. [Google Scholar] [CrossRef] [PubMed]
  14. Ho, Y.-L.; Lin, Y.-H.; Tsai, I.-J.; Hsieh, F.-J.; Tsai, H.-J. In vivo assessment of cardiac morphology and function in heart-specific green fluorescent zebrafish. J. Formos. Med. Assoc. 2007, 106, 181–186. [Google Scholar] [CrossRef] [Green Version]
  15. Xing, Q.; Huynh, V.; Parolari, T.G.; Maurer-Morelli, C.V.; Peixoto, N.; Wei, Q. Zebrafish larvae heartbeat detection from body deformation in low resolution and low frequency video. Med. Biol. Eng. Comput. 2018, 56, 2353–2365. [Google Scholar] [CrossRef]
  16. Gierten, J.; Pylatiuk, C.; Hammouda, O.T.; Schock, C.; Stegmaier, J.; Wittbrodt, J.; Gehrig, J.; Loosli, F. Automated high-throughput heartbeat quantification in medaka and zebrafish embryos under physiological conditions. Sci. Rep. 2020, 10, 1–12. [Google Scholar] [CrossRef] [PubMed]
  17. Akerberg, A.A.; Burns, C.E.; Burns, C.G.; Nguyen, C. Deep learning enables automated volumetric assessments of cardiac function in zebrafish. Dis. Models Mech. 2019, 12, 40188. [Google Scholar] [CrossRef] [PubMed] [Green Version]
  18. Pylatiuk, C.; Sanchez, D.; Mikut, R.; Alshut, R.; Reischl, M.; Hirth, S.; Rottbauer, W.; Just, S. Automatic zebrafish heartbeat detection and analysis for zebrafish embryos. Zebrafish 2014, 11, 379–383. [Google Scholar] [CrossRef] [Green Version]
  19. Lenning, M.; Fortunato, J.; Le, T.; Clark, I.; Sherpa, A.; Yi, S.; Hofsteen, P.; Thamilarasu, G.; Yang, J.; Xu, X. Real-time monitoring and analysis of zebrafish electrocardiogram with anomaly detection. Sensors 2018, 18, 61. [Google Scholar] [CrossRef] [Green Version]
  20. Zhu, X.Y.; Wu, S.Q.; Guo, S.Y.; Yang, H.; Xia, B.; Li, P.; Li, C.Q. A zebrafish heart failure model for assessing therapeutic agents. Zebrafish 2018, 15, 243–253. [Google Scholar] [CrossRef]
  21. Martin, W.K.; Tennant, A.H.; Conolly, R.B.; Prince, K.; Stevens, J.S.; DeMarini, D.M.; Martin, B.L.; Thompson, L.C.; Gilmour, M.I.; Cascio, W.E. High-throughput video processing of heart rate responses in multiple wild-type embryonic zebrafish per imaging field. Sci. Rep. 2019, 9, 1–14. [Google Scholar] [CrossRef]
  22. Schutera, M.; Just, S.; Gierten, J.; Mikut, R.; Reischl, M.; Pylatiuk, C. Machine learning methods for automated quantification of ventricular dimensions. Zebrafish 2019, 16, 542–545. [Google Scholar] [CrossRef]
  23. Nasrat, S.; Marcato, D.; Hirth, S.; Reischl, M.; Pylatiuk, C. Semi-automated detection of fractional shortening in zebrafish embryo heart videos. Curr. Dir. Biomed. Eng. 2016, 2, 233–236. [Google Scholar] [CrossRef]
  24. Gaur, H.; Pullaguri, N.; Nema, S.; Purushothaman, S.; Bhargava, Y.; Bhargava, A. Zebrapace: An open-source method for cardiac-rhythm estimation in untethered zebrafish larvae. Zebrafish 2018, 15, 254–262. [Google Scholar] [CrossRef] [PubMed]
  25. Welzel, O.; Knörr, J.; Stroebel, A.M.; Kornhuber, J.; Groemer, T.W. A fast and robust method for automated analysis of axonal transport. Eur. Biophys. J. 2011, 40, 1061–1069. [Google Scholar] [CrossRef] [PubMed]
  26. Smal, I.; Grigoriev, I.; Akhmanova, A.; Niessen, W.J.; Meijering, E. Microtubule dynamics analysis using kymographs and variable-rate particle filters. IEEE Trans. Image Process. 2010, 19, 1861–1876. [Google Scholar] [CrossRef] [Green Version]
  27. Rueden, C.T.; Schindelin, J.; Hiner, M.C.; DeZonia, B.E.; Walter, A.E.; Arena, E.T.; Eliceiri, K.W. Imagej2: Imagej for the next generation of scientific image data. BMC Bioinform. 2017, 18, 529. [Google Scholar] [CrossRef]
  28. Lee, L.; Genge, C.E.; Cua, M.; Sheng, X.; Rayani, K.; Beg, M.F.; Sarunic, M.V.; Tibbits, G.F. Functional assessment of cardiac responses of adult zebrafish (danio rerio) to acute and chronic temperature change using high-resolution echocardiography. PLoS ONE 2016, 11, e0145163. [Google Scholar] [CrossRef] [Green Version]
  29. Müller, M.F.; Colomer, J.; Serra, T. Temperature-driven response reversibility and short-term quasi-acclimation of daphnia magna. PLoS ONE 2018, 13, e0209705. [Google Scholar] [CrossRef]
  30. Avdesh, A.; Chen, M.; Martin-Iverson, M.T.; Mondal, A.; Ong, D.; Rainey-Smith, S.; Taddei, K.; Lardelli, M.; Groth, D.M.; Verdile, G. Regular care and maintenance of a zebrafish (danio rerio) laboratory: An introduction. J. Vis. Exp. 2012, 69, e4196. [Google Scholar] [CrossRef] [Green Version]
  31. Hoshi, R.A.; Pastre, C.M.; Vanderlei, L.C.M.; Godoy, M.F. Poincaré plot indexes of heart rate variability: Relationships with other nonlinear variables. Auton. Neurosci. 2013, 177, 271–274. [Google Scholar] [CrossRef]
  32. Shin, J.T.; Pomerantsev, E.V.; Mably, J.D.; MacRae, C.A. High-resolution cardiovascular function confirms functional orthology of myocardial contractility pathways in zebrafish. Physiol. Genom. 2010, 42, 300–309. [Google Scholar] [CrossRef] [Green Version]
  33. Li, Y.X.; Zdanowicz, M.; Young, L.; Kumiski, D.; Leatherbury, L.; Kirby, M.L. Cardiac neural crest in zebrafish embryos contributes to myocardial cell lineage and early heart function. Dev. Dyn. 2003, 226, 540–550. [Google Scholar] [CrossRef]
  34. Bagatto, B.; Burggren, W. A three-dimensional functional assessment of heart and vessel development in the larva of the zebrafish (danio rerio). Physiol. Biochem. Zool. 2006, 79, 194–201. [Google Scholar] [CrossRef] [PubMed] [Green Version]
  35. Li, K. The Image Stabilizer Plugin for Imagej. Available online: https://www.cs.cmu.edu/~kangli/code/Image_Stabilizer.html (accessed on 15 January 2021).
  36. Ferreira, T.; Hiner, M.; Rueden, C.; Miura, K.; Eglinger, J.; Chef, B. Bar Plugin for Imagej. Available online: https://0-doi-org.brum.beds.ac.uk/10.5281/zenodo.495245 (accessed on 15 January 2021).
  37. Jeong, T.-Y.; Kim, H.Y.; Kim, S.D. Multi-generational effects of propranolol on daphnia magna at different environmental concentrations. Environ. Pollut. 2015, 206, 188–194. [Google Scholar] [CrossRef] [PubMed]
  38. Santoso, F.; Farhan, A.; Castillo, A.L.; Malhotra, N.; Saputra, F.; Kurnia, K.A.; Chen, K.H.-C.; Huang, J.-C.; Chen, J.-R.; Hsiao, C.-D. An overview of methods for cardiac rhythm detection in zebrafish. Biomedicines 2020, 8, 329. [Google Scholar] [CrossRef] [PubMed]
  39. Ott, C.; Lippincott-Schwartz, J. Visualization of live primary cilia dynamics using fluorescence microscopy. Curr. Protoc. Cell Biol. 2012, 57, 4.26.1–4.26.22. [Google Scholar] [CrossRef] [PubMed] [Green Version]
  40. Sanchez, T.; Welch, D.; Nicastro, D.; Dogic, Z. Cilia-like beating of active microtubule bundles. Science 2011, 333, 456–459. [Google Scholar] [CrossRef] [Green Version]
  41. O’Hagan, R.; Barr, M.M. Kymographic analysis of transport in an individual neuronal sensory cilium in caenorhabditis elegans. In Cilia; Satir, P., Christensen, S., Eds.; Humana Press: New York, NY, USA, 2016; pp. 107–122. [Google Scholar]
  42. Mukherjee, A.; Jenkins, B.; Fang, C.; Radke, R.J.; Banker, G.; Roysam, B. Automated kymograph analysis for profiling axonal transport of secretory granules. Med. Image Anal. 2011, 15, 354–367. [Google Scholar] [CrossRef] [Green Version]
  43. Lagerspetz, K.; Perttunen, V. Effect of temperature on the periodic heart beat reversal and heart rate in corethra plumicornis (diptera). J. Insect Physiol. 1962, 8, 621–625. [Google Scholar] [CrossRef]
  44. Florey, E. Studies on the nervous regulation of the heart beat in decapod crustacea. J. Gen. Physiol. 1960, 43, 1061–1081. [Google Scholar] [CrossRef] [Green Version]
  45. Motley, H.L. Physiological studies concerning the regulation of heartbeat in freshwater mussels. Physiol. Zool. 1934, 7, 62–84. [Google Scholar] [CrossRef]
  46. Chakraborty, M.; Llamusi, B.; Artero, R. Modeling of myotonic dystrophy cardiac phenotypes in drosophila. Front. Neurol. 2018, 9, 473. [Google Scholar] [CrossRef] [PubMed] [Green Version]
  47. Collins, M.M.; Ahlberg, G.; Hansen, C.V.; Guenther, S.; Marin-Juez, R.; Sokol, A.M.; El-Sammak, H.; Piesker, J.; Hellsten, Y.; Olesen, M.S.; et al. Early sarcomere and metabolic defects in a zebrafish pitx2c cardiac arrhythmia model. Proc. Natl. Acad. Sci. USA 2019, 116, 24115–24121. [Google Scholar] [CrossRef] [PubMed]
  48. Luo, J.; Lee, W.-N.; Wang, S.; Konofagou, E.E. P4a-2 an in-vivo study of frame rate optimization for myocardial elastography. In Proceedings of the 2007 IEEE Ultrasonics Symposium, New York, NY, USA, 31 October 2007; IEEE: New York, NY, USA, 2007; pp. 1933–1936. [Google Scholar]
  49. Gubin, D.G.; Weinert, D.; Rybina, S.V.; Danilova, L.A.; Solovieva, S.V.; Durov, A.M.; Prokopiev, N.Y.; Ushakov, P.A. Activity, sleep and ambient light have a different impact on circadian blood pressure, heart rate and body temperature rhythms. Chronobiol. Int. 2017, 34, 632–649. [Google Scholar] [CrossRef] [PubMed]
  50. Stauss, H.M. Heart rate variability. Am. J. Physiol. Regul. Integr. Comp. Physiol. 2003, 285, R927–R931. [Google Scholar] [CrossRef] [PubMed] [Green Version]
  51. Santoso, F.; Krylov, V.V.; Castillo, A.L.; Saputra, F.; Chen, H.-M.; Lai, H.-T.; Hsiao, C.-D. Cardiovascular performance measurement in water fleas by utilizing high-speed videography and imagej software and its application for pesticide toxicity assessment. Animals 2020, 10, 1587. [Google Scholar] [CrossRef]
  52. Pirow, R.; Wollinger, F.; Paul, R.J. The sites of respiratory gas exchange in the planktonic crustacean daphnia magna: An in vivo study employing blood haemoglobin as an internal oxygen probe. J. Exp. Biol. 1999, 202, 3089–3099. [Google Scholar]
  53. Smith, S.J. Cardiovascular toxicity of antihistamines. Otolaryngol. Head Neck Surg. 1994, 111, 348–354. [Google Scholar] [CrossRef]
Figure 1. Principle for heartbeat measurement in zebrafish embryo and Daphnia magna neonates using kymograph. (A) The position used to calculate heartbeat in zebrafish embryo aged at 72 h post-fertilization, (B) direction of the line made before dynamic resliced in zebrafish, (C) the outlook of Daphnia magna showing the relative positions of heart, (D) direction of the line made before dynamic resliced in D. magna (area inside the red dashed line (A,B) show the location of heart chamber in zebrafish and Daphnia, while red arrow (B,D) represents the location and direction of ROI selection), (E) the kymograph pattern of zebrafish heartbeat, and (F) the kymograph pattern of D. magna heartbeat.
Inventions 06 00008 g001
Figure 2. Cardiac physiology parameter endpoints in zebrafish aged at 72 h post-fertilization measured by kymograph method. The position for kymograph measurement as (A) short-axis of the ventricle and (B) long-axis of the ventricle (yellow line: line drawn in ImageJ, red arrow: direction of yellow line when drawn). The typical kymograph pattern obtained from the (C) short-axis and (D) long-axis of ventricle. Some important parameters like end diastolic diameter (EDD, red color) and end systolic diameter (ESD, yellow color), heart period (HP, green color), diastolic interval (DI, blue color), and systolic interval (SI, white color) from either short axis or long axis were presented with solid lines in different colors. The typical kymograph collected from ventricle (V) chambers of normal (E) and astemizole-induced arrhythmic (F) heart.
Inventions 06 00008 g002
Figure 3. Overview of experimental workflow for zebrafish and Daphnia magna heartbeat measurement using the kymograph method; left panel showing image process pipeline, middle panel showing information extraction pipeline, and right panel showing the cardiac parameters that can be obtained by using this one-step kymograph method. The heart positions in zebrafish and Daphnia were highlighted by red dots in the bottom panel.
Inventions 06 00008 g003
Figure 4. Comparison of kymograph (kymo) and time serial analyzer (TSA) methods on analyzing heart rate variability in Daphnia magna neonates cultured at different ambient temperatures. Two important indexes of standard deviation 1 (SD1) and standard deviation 2 (SD2) in the Poincare plot are used to measure heart rate regularity. Data were normalized for Pearson correlation calculation (A) and Wilcoxon test (B), and presented as mean ± SEM (n = 20). (* p < 0.5, ** p < 0.1, **** p < 0.0001, n = 20).
Inventions 06 00008 g004
Figure 5. Effect of the selected region of interest (ROI) positioning on atrium-ventricle (A-V) and ventricle-atrium (V-A) interval measurement. (A) Three photos were showing the different positions of ROI when measuring heart rate in zebrafish embryos aged at 72 h post-fertilization. There are middle ventricle-middle atrium, high ventricle-low atrium, and high atrium-low ventricle positions (yellow lines represent the ROI location for ventricle, while red lines represent the ROI location for atrium). Comparison of kymograph (kymo) and time series analyzer (TSA) methods to measure zebrafish (B) atrium-ventricle interval and (C) ventricle-atrium interval. Data were calculated using a two-way analysis of variance (ANOVA), presented as mean ± SEM (* p < 0.5, n = 20). Different letters (a, b) on the error bars represent the significant differences (p < 0.05).
Inventions 06 00008 g005
Figure 6. Effect of astemizole treatment on zebrafish cardiac parameters. (A) ventricle and (B) atrium heart rate, (CF) atrium-atrium (A-A), and ventricle-ventricle (V-V) SD1 and SD2 calculated using a Poincare plot to present heart rate variability. (G,H) Atrium-ventricle (A-V) and ventricle-atrium (V-A) interval of zebrafish heartbeat. Blue line = control, red line = astemizole treatment. Zebrafish embryos were exposed to astemizole at 72 h post-fertilization, and the corresponding heart rate changes were monitoring over time for 30 min. Data were calculated using two-way ANOVA and presented as mean ± SEM. (* p < 0.5, ** p < 0.1, *** p < 0.001, **** p < 0.0001, n = 20).
Inventions 06 00008 g006
Table 1. Comparison of heartbeat measurement methods in zebrafish larvae.
Published MethodsMain Region of Interest Recording InstrumentTracking SoftwareAnimal ModelObtainable Result
Our studyInverted Microscope (ICX41, Sunny Optical Technology, Ningbo, Zhejiang, China) + High- Speed CCD (Zgenebio, Taipei, Taiwan)ImageJ (Fiji)Zebrafish, AB strain and Daphnia magnaHeart rate, fractional shortening, ejection fraction, stroke volume, cardiac output, heartbeat interval, and chamber-to-chamber interval
Sampurna et al., 2018 [11]CCD mounted onto dissecting microscopeImageJZebrafish, AB strainHeart rate
Jeong et al., 2018 [13]Olympus-CKX41SF Microscope (Olympus corporation, Shinjuku, Tokyo, Japan)Manual counting (Toupview 3.7)Daphnia magnaHeart rate
Ho et al., 2007 [14]Axioplan microscope (Zeiss, Jeny Germany) with Normaski optics and fluorescence, captured using Sony digital cameraViewed frame by frame (manual)Transgenic zebrafish with Green fluorescence protein (GFP) expressionHeart rate, stroke volume, cardiac output
Xing et al., 2018 [15]C3313/RHD2216 + C3100/RHD2000 (Intan Technologies LLC, Los Angeles, CA, USA) and Opticam + Stereo MicroscopeMATLABZebrafish, strain not mentionedHeart rate
Gierten et al., 2020 [16]Brightfield microscopeHeartBeat software (MATLAB)Unhatched medaka and zebrafish embryosHeart rate (single and multiple ROI)
Akerberg et al., 2019 [17]Nikon Eclipse 80i compound microscope and Zeiss Lightsheet Z.1 microscopeDeep learning (MATLAB)Zebrafish strain Tg(myl7:GFP)Heart rate, fractional shortening, ejection fraction, and cardiac output
Pylatiuk et al., 2014 [18]Automated microscope and Inverted microscope Leica DMIL LED (Leica Camera, Wetzlar, Germany)MATLABZebrafish AB, Shox2-MO and Isl1l-MO strainsHeart rate (automatic detection)
Lenning et al., 2018 [19]Electrocardiogram recording using MEA membranesLabVIEWZebrafish, strain not mentionedHeart rate, p waves, QRS complexes, and T waves
Zhu et al., 2018 [20]Dissecting stereomicroscope (Olympus corporation, Shinjuku, Tokyo Japan)Zebralab Blood Flow SystemZebrafish, AB strainHeart rate
Martin et al., 2019 [21]Andor Zyla 4.2 sCMOS (Andor Technologies, Belfast, NI) camera mounted to a Nikon Ti microscope (Nikon Corporation, Minato, Tokyo, Japan)FishRateZ (LabVIEW)ZebrafishHeart rate (automatic detection)
Schutera et al., 2019 [22]Not mentionedDeep learning (PyCharm)Zebrafish and MedakaHeart rate, systolic/diastolic volume, ejection fraction, fractional shortening, and stroke volume
Nasrat et al., 2016 [23]Not mentionedMicrosoft Visual Studio Community 2015ZebrafishFractional shortening
Gaur et al., 2018 [24]Inverted microscope Olympus IX73 Series (Olympus corporation, Shinjuku, Tokyo, Japan) and 10-megapixel camera ProCAM HS-10 MP (Radical Scientific Equipments Private Limited, Ambala, Haryana, India)ZebraPace (ImageJ based)ZebrafishHeart rate
Table 2. Comparison of multiple cardiac performance endpoints between control and astemizole-treated zebrafish aged at 72 h post-fertilization.
ParametersControlAstemizole (20 µM)p
End diastolic volume (µm3) a,b490,153.6 ± 182,235.3773,517.1 ± 324,727.3≤0.01
Long axis (µm) a140.81 ± 20.18147.1 ± 18.75NS
Short axis (µm) b80.96 ± 16.6798.42 ± 17.85≤0.01
End systolic volume (µm3) a,b180,197.1 ± 76,735.82524,531.6 ± 338,855.3≤0.0001
Long axis (µm) a106.77 ± 17.16122.34 ± 30.64≤0.01
Short axis (µm) b56.38 ± 14.8585.31 ± 22.18≤0.0001
Shortening fraction (%) b30.72 ± 13.8713.87 ± 12.10≤0.0001
Ejection fraction (%) b62.93 ± 9.9735.70 ± 22.65≤0.001
Stroke volume (pL/beat) a,b309.96 ± 134.42248.99 ± 151.00NS
Heart rate (bpm) b133.42 ± 7.84104.00 ± 24.61≤0.0001
Cardiac output (pL/min) a,b40,359.96 ± 18,286.3525,351 ± 16,238.36≤0.01
p-value calculated statistically using Mann–Whitney test. n = 20. a the parameter obtained from long-axis kymograph. b the parameter obtained from short-axis kymograph. NS, no significance.
Publisher’s Note: MDPI stays neutral with regard to jurisdictional claims in published maps and institutional affiliations.

