
Assessment of the Wind Energy Potential along the Romanian Coastal Zone


Department of Mechanical Engineering, Faculty of Engineering, “Dunarea de Jos” University of Galati, 47 Domneasca Street, 800008 Galati, Romania
*
Author to whom correspondence should be addressed.
Inventions 2021, 6(2), 41; https://0-doi-org.brum.beds.ac.uk/10.3390/inventions6020041
Submission received: 21 May 2021
/
Revised: 2 June 2021
/
Accepted: 3 June 2021
/
Published: 4 June 2021
(This article belongs to the Special Issue Perspectives and Challenges in Doctoral Research—Selected Papers from the 9th Edition of the Scientific Conference of the Doctoral Schools from the “Dunărea de Jos” University of Galaţi)
Abstract
:The present work aims to provide a comprehensive picture of the wind energy potential that characterizes the Romanian coastal environment using in situ measurements and reanalysis of wind data (ERA5) that cover a 42–year time interval (1979–2020). A total of 16 reference points (both land and offshore) equally distributed along the Romanian sector are used to evaluate the local wind energy potential, targeting in this way several sites where a renewable wind project could be established. Compared to the in situ measurements (land points), the ERA5 dataset underestimates the wind speed by at least 11.57%, this value increasing as we approach the coastline. From the analysis of the spatial maps, it is likely that the wind speed steadily increases from onshore to offshore, with a sharp variation near the coastline being reported. Furthermore, the assessment of some state-of-the-art offshore wind turbines was conducted using 12 systems defined by rated capacity ranging from 2 to 10 MW. Some scenarios were proposed to identify sustainable offshore wind projects to be implemented in the Romanian coastal zone based on these results.
1. Introduction
At the core of the energy transition towards renewables and planning for a post–COVID–19 economic rehabilitation, offshore wind resource is considered a possible pillar in reaching net–zero emissions of greenhouse gases by the end of 2050, a policy required by the European Green Deal. At the European level, offshore wind projects are already considered a competitive sector. According to [1], the European Union (EU) complete decarbonisation will require 450 GW of offshore wind capacity by 2050, representing 18 times more than the currently installed offshore wind capacity—25 GW and 5402 grid-connected wind turbines across 12 countries. The reason why offshore wind is more desirable than solar and even onshore wind power is its higher full-load and operating hours, its stability and its greater predictability. Moreover, offshore wind represents nowadays a very cost-effective alternative for power generation, taking into consideration the fact that the Levelized Cost of Electricity (LCOE) decreased from an average of 0.13 USD/kWh in 2018 to an average between 0.05–0.09 USD/kWh by 2030 and 0.03–0.07 USD/kWh by 2050 [2], falling in the low range of costs for fossil fuels and becoming more affordable than nuclear power. The increased economies of scale, together with the competitiveness of supply chains and further technological advances, will reduce the cost of harvesting wind energy. Nevertheless, for the time being, investing in onshore wind projects seems to be more economically viable, even though offshore designs generate more electricity [3].
There is a growing interest in developing wind projects in different coastal areas defined by resourceful wind energy [4,5,6]. Given the recent enhancements intended to reach the decarbonisation process, Romania must tap into its existing offshore wind power potential in the Black Sea. Currently, even though Romania is one of the leading countries in the south-eastern part of Europe in terms of onshore wind development, having an installed capacity of 3 GW, according to the National Energy and Climate Plan (NECP) 2021–2030 [7], there is inadequate support for the advancement of offshore capacities in the Black Sea. For example, almost 80% of the existing wind turbines in Romania are concentrated in the Dobrogea region, located near the sea. The most significant operational onshore wind farm in Europe is also established in Dobrogea, namely the Fantanele–Cogealac wind project, having an installed capacity of 600 MW [8].
Most of the latest published research regarding the Black Sea describes the wind conditions only from a meteorological point of view [9,10,11], probably due to the fact that the Black Sea coastal zone is considered less attractive than other enclosed or semi-enclosed seas, such as the Mediterranean or Baltic Sea [4,5,6]. Moreover, the performances of some commercial, state-of-the-art wind turbines were assessed by Onea and Rusu [12,13,14], considering several reference sites distributed along the Black Sea shoreline, at a water depth that, however, does not exceed 50 m. Additionally, several offshore sites that appear to be suitable for implementing a wind project in the Turkish coastal region were proposed in [15], while Raileanu et al. [16] assessed the performances of two wind turbines that operate offshore—Siemens SWT-3.6-120 and Senvion-6.2M-126.
Even though the topic of research appears similar to the one discussed in Onea and Rusu [3], the present study is characterized by significant differences. Firstly, the wind dataset and the number of values per day differ since ERA5 replaced the ERA–Interim database used in [3] with 24 values per day. Moreover, in [3], the assessment of the turbines’ performances was carried out by adjusting the wind data values from 10 m to an operational hub height of 80 m, while in this case 12 turbines were evaluated by considering the ERA5 values directly reported at the height of 100 m above sea level. The selected wind turbines’ rated capacity varies from 2 to 10 MW, including the existing operational systems and the brand-new generation of turbines expected to be implemented shortly. At the same time, it is essential to mention that in [17] the maximum rated power was 5 MW. Since the literature review concentrating on the Black Sea coastal area is considerably restrained, the purpose of this work is to identify the best performances of various wind turbines that might become operational in the Romanian coastal environment. From this perspective, this study will focus on the differences between the onshore and offshore wind power potential, which site is the most suitable for developing a renewable wind project and what type of wind turbine will be most appropriate to operate within the target area. This study can be considered an opportunity since there is a significantly growing interest both from investors and the Romanian authorities for developing offshore wind projects in this specific environment. In this context, the present work is defined by some elements of novelty, as follows: (a) The differences between the Romanian onshore and offshore wind resources are assessed by also including in-situ measurements for two sites located near the shoreline; (b) a long-term overview of the wind resources is provided (42 years), compared to only 20 years that were previously considered for this target area; (c) an extensive portfolio of turbines (12 different systems) is considered for evaluation to identify their expected performances.
2. Materials and Methods
2.1. Target Area
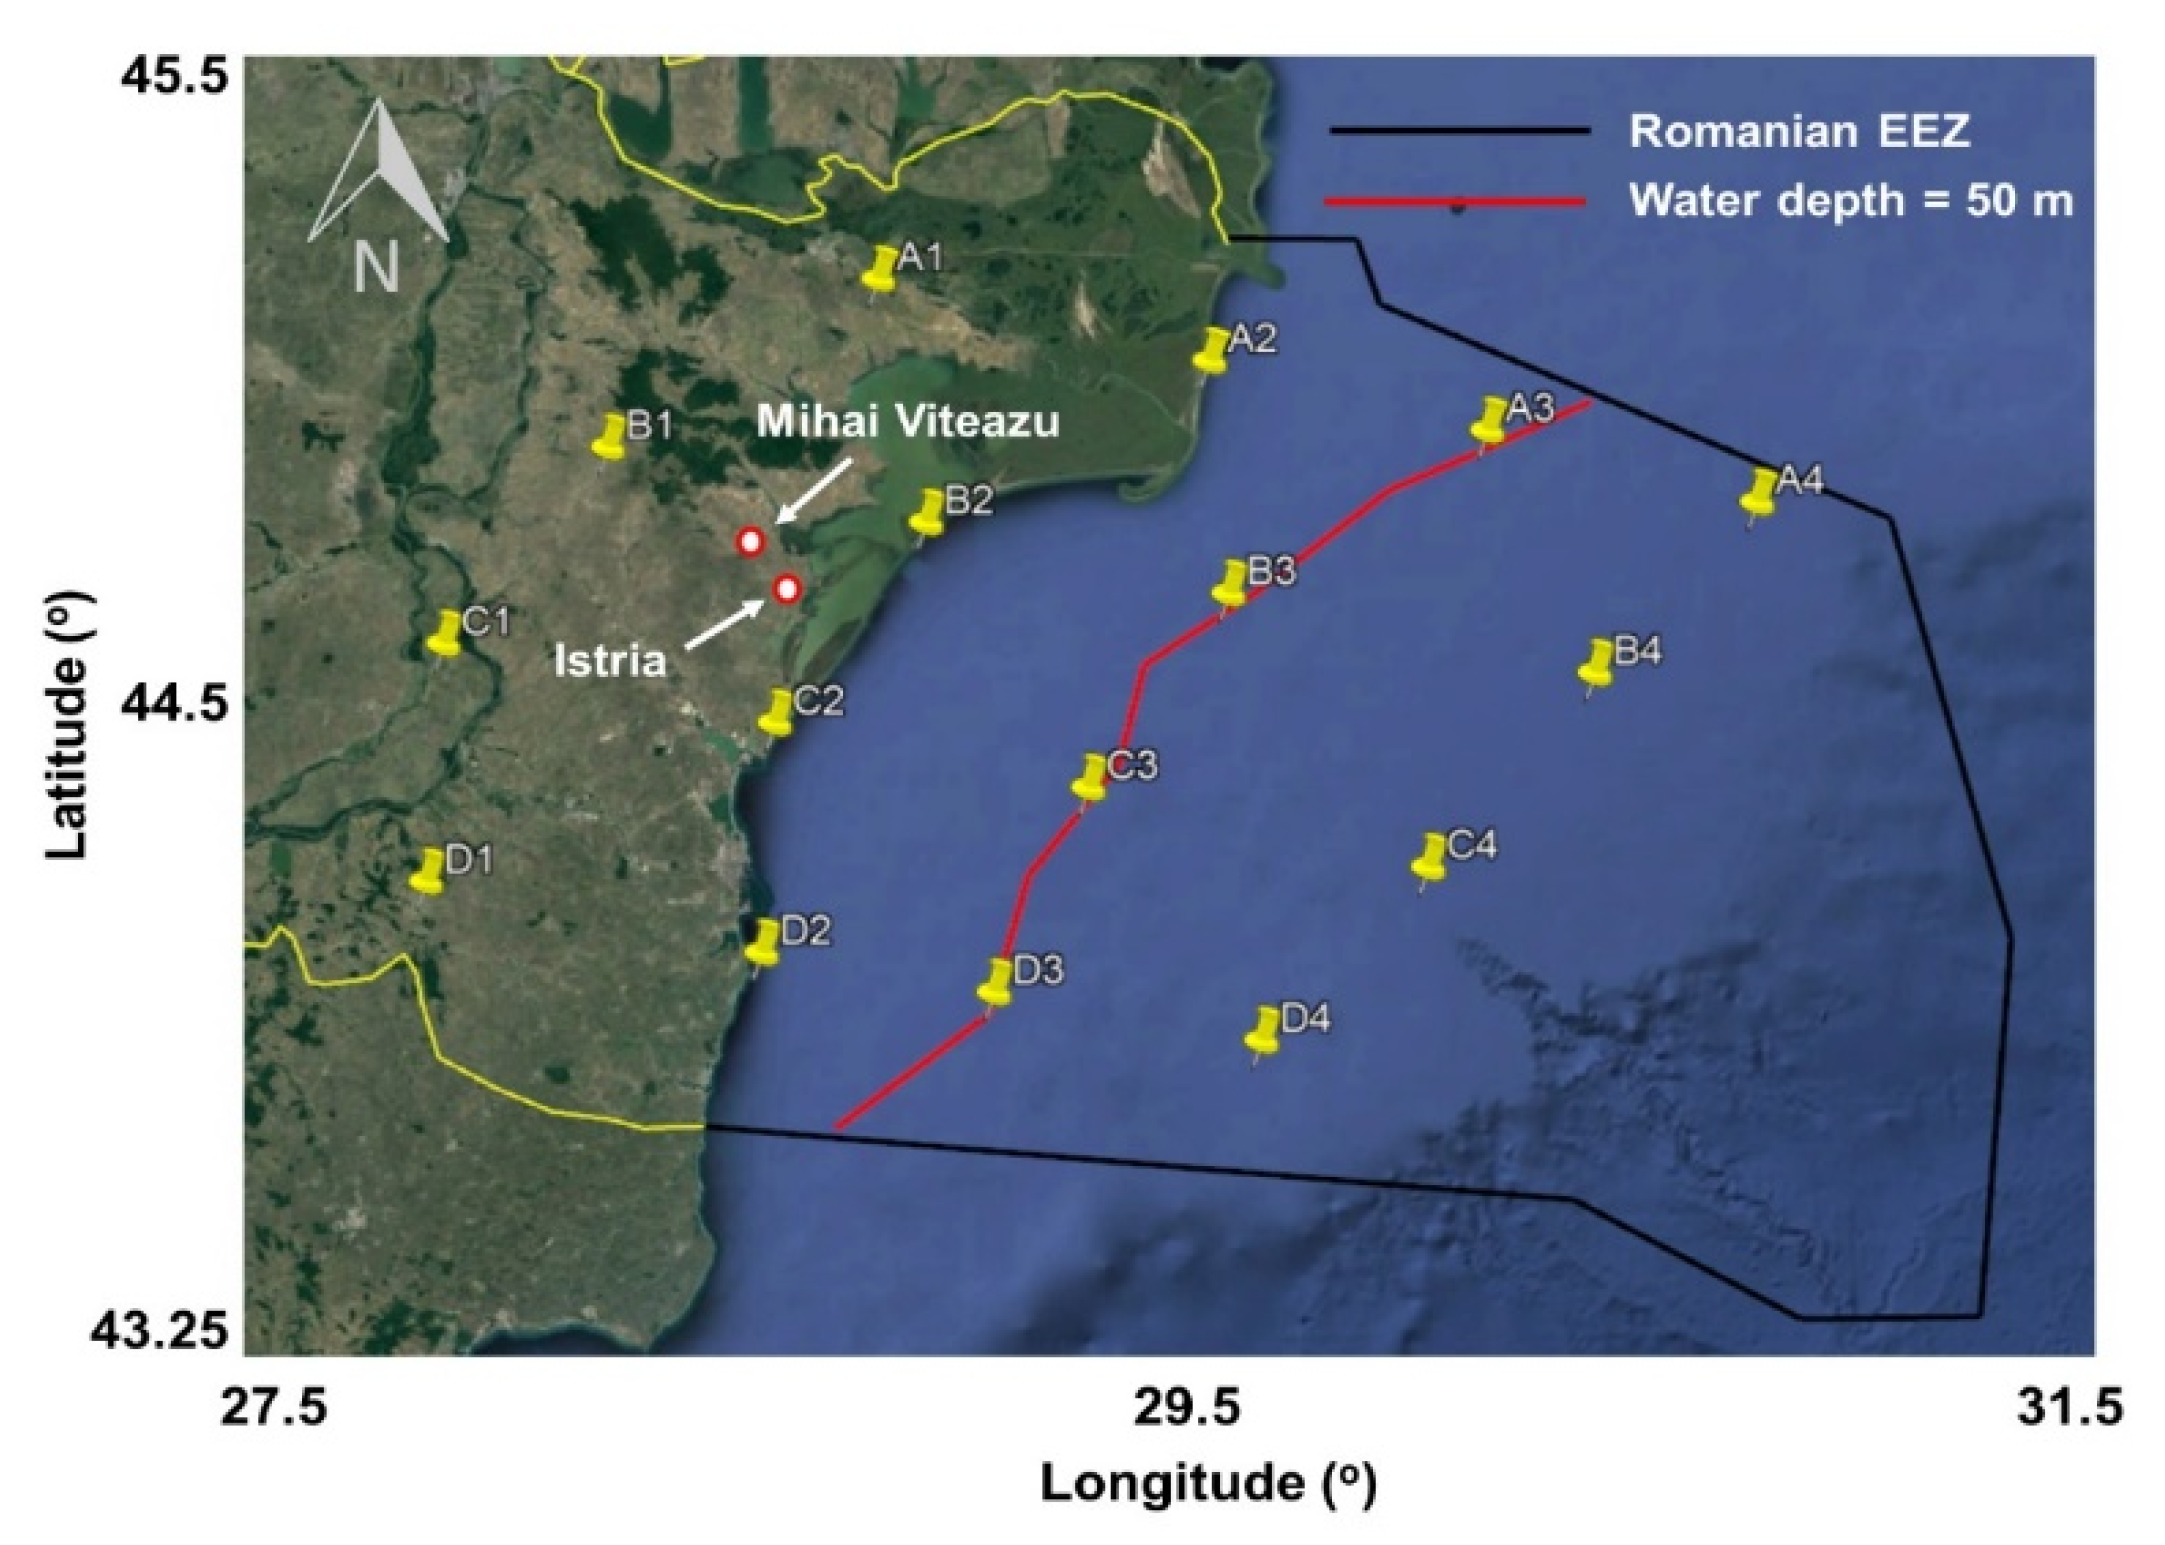
The Black Sea wind climate is mainly influenced by the action of polar, continental and marine-tropical air masses, from which the most noticeable impact is that of the polar air masses, especially during the wintertime, when shallow temperatures and extreme storms might occur. Notably, it is considered that the western side of the Black Sea is defined by more abundant wind resources, with 8 m/s representing the mean wind speed value recorded during the winter season [13]. Figure 1 reveals the differences in water depth across Romania’s Exclusive Economic Zone (EEZ). The EEZ is characterized by an area of more than 22 thousand km2 and the territorial surface of the water of 4084 km2, associated with 5.30% of the entire Black Sea shoreline [3]. The thick black line indicates the boundaries of the Romanian EEZ. As shown in Figure 1, a meaningful part of Romania’s EEZ is a deep-water area >50 m, which is more suitable for floating platforms than fixed systems. A closer look at the European offshore market [18] points out that, in 2019, the average distance to shore for developing projects was close to 60 km, which is just within the Romanian transition area from shallow to deep water [19]. Nevertheless, wind farms located more than 50 km from shore ought to be connected to the grid through high voltage direct current connections to reduce electrical losses significantly; such connections, though, demand more significant upfront investment costs [20]. Further details regarding the target area are presented in Figure 1, where 16 reference sites were defined for assessment. The sites considered for the study are equally distributed along the Romanian coastline and are located both onshore and offshore. Furthermore, the points located offshore were defined in water depths of 50–89 m, and the maximum distance from the shore of 118 km corresponds to Site B4. A more comprehensive picture of the selected points is outlined in Table 1. Considering these points, we are likely to achieve a general view of the wind power potential and the expected performances of a particular wind turbine that can be further extended to a more thorough investigation.
2.2. Wind Dataset
Several previous publications [21,22] have focused on assessing Romania’s wind offshore resources. Against this background, the current study highlights several elements of novelty, including an analysis of a new wind database—ERA5—which is the latest product of the European Centre for Medium-Range Weather Forecasts (ECMWF) [23]. ERA5 is a replacement for the ERA–Interim database reanalysis that stopped being displayed in 2019 [24] and comprises vast amounts of historical observations into global estimates using state-of-the-art modelling and data assimilation systems. Moreover, wind speed values are reported at a hub height of 100 m (U100), obtained directly from the ERA5 data system. It is essential to underline that since the wind speed values at 100 m were directly provided, no further data processing was needed, such as the use of a logarithmic law to adjust the wind speed from a 10 m height above the sea level, where the velocity is much lower due to boundary layer mean velocity distribution. Additionally, in situ measurements were considered for two existing wind projects located onshore near the Dobrogea region (Mihai–Viteazu and Istria sites), considering the time interval from October 2006 and April 2009, which was used for comparison against ERA5 data.
2.3. Wind Turbines
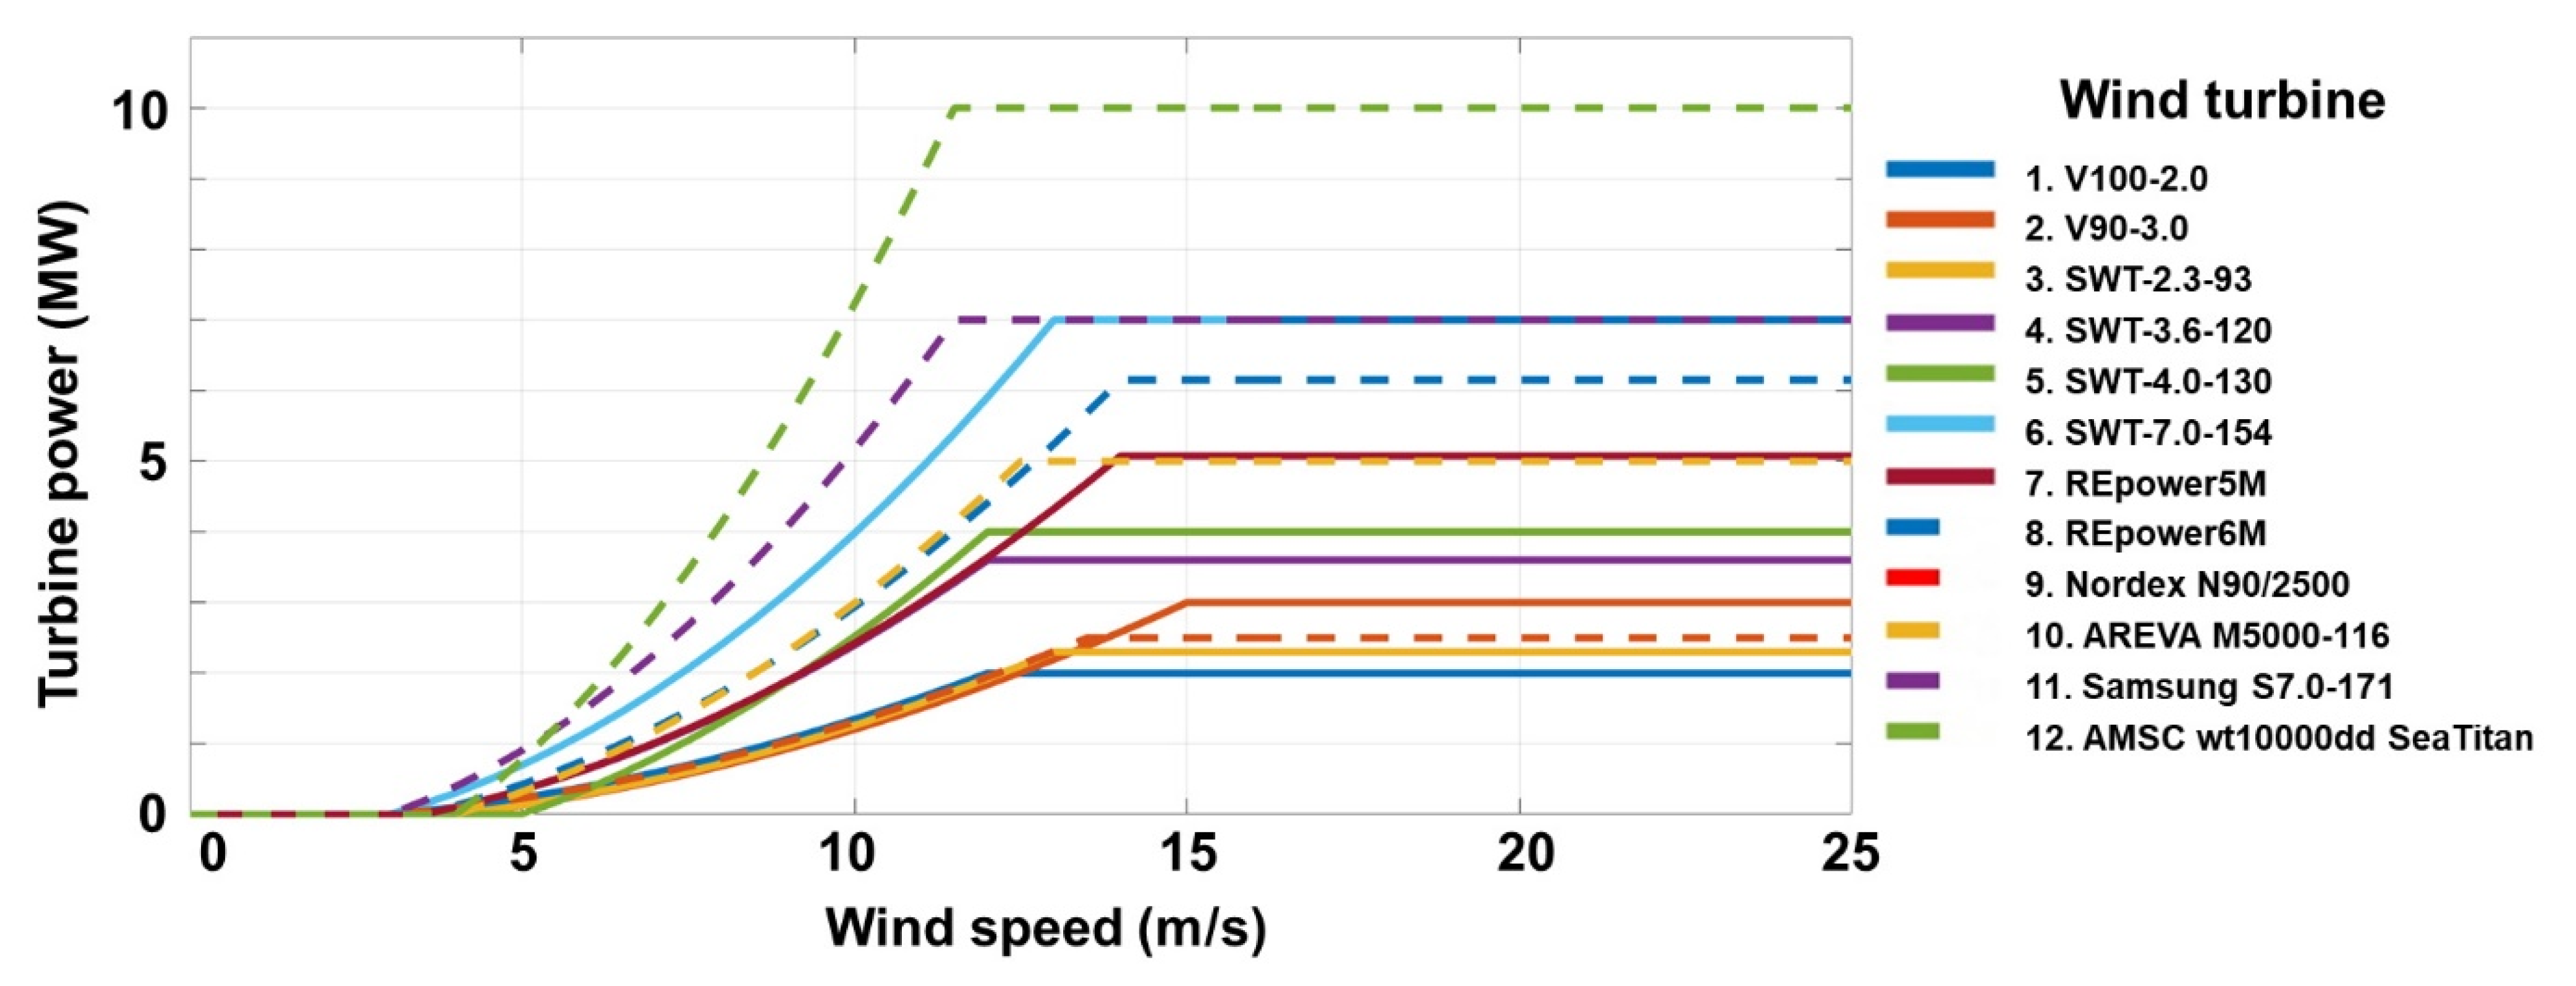
Since there is yet no ongoing wind energy project in the Black Sea basin to emphasize the performances of a wind energy conversion system in the target area, some already operational wind turbines were considered for analysis. The main characteristics of these systems are presented in Table 2, systems that are currently considered for implementation in some European offshore wind projects. The average rated power is close to 8.20 MW, and more than 30% of the projects developed last year included larger systems. However, turbine orders placed online already reveal a trend towards the next generation in terms of size, with turbines ranging from 10 to 13 MW for upcoming projects starting with 2022 [25]. The size of new wind farms is estimated at 788 MW, while the distance to the shore and the water depth has increased to 52 km and 44 m, respectively [25]. The 12 selected turbines embrace a full spectrum of rated capacity, starting from 2 MW and ending with the AMSC wt10000dd SeaTitan—a production of American Superconductor, a manufacturer from the US—having the highest-rated power—10 MW. It is essential to mention that, although these systems can operate at different heights above sea level, their performances were evaluated at 100 m since, at this level, there is a higher wind potential. Figure 2 reveals the power curve of each system, identifiable throughout the cut-in, rated speed and cut-out thresholds, all operating at a hub height of 100 m.
The Annual Electricity Production (AEP) of any wind turbine can be expressed as follows [28]:
where AEP is displayed in MWh, T represents the average number of operational hours per year, f(u) the Weibull probability density function, P(u) the power curve of a wind turbine (also represented in Figure 2 for each of the 12 systems), and the cut-out and cut-in speeds are wind turbine technical terms.
The Weibull probability density function can be denoted as follows [29]:
where u represents the wind speed (expressed in m/s), k the shape parameter, and c the scale parameter (expressed in m/s).
One method, which can be used to estimate the reliability of a particular energy system converter, is to assess its capacity factor (Cf), which can be defined as follows [30]:
where Pturbine represents the electric power expected to be generated by each turbine and Prated represents the rated power of each generator.
3. Results
3.1. Analysis of the Wind Resources
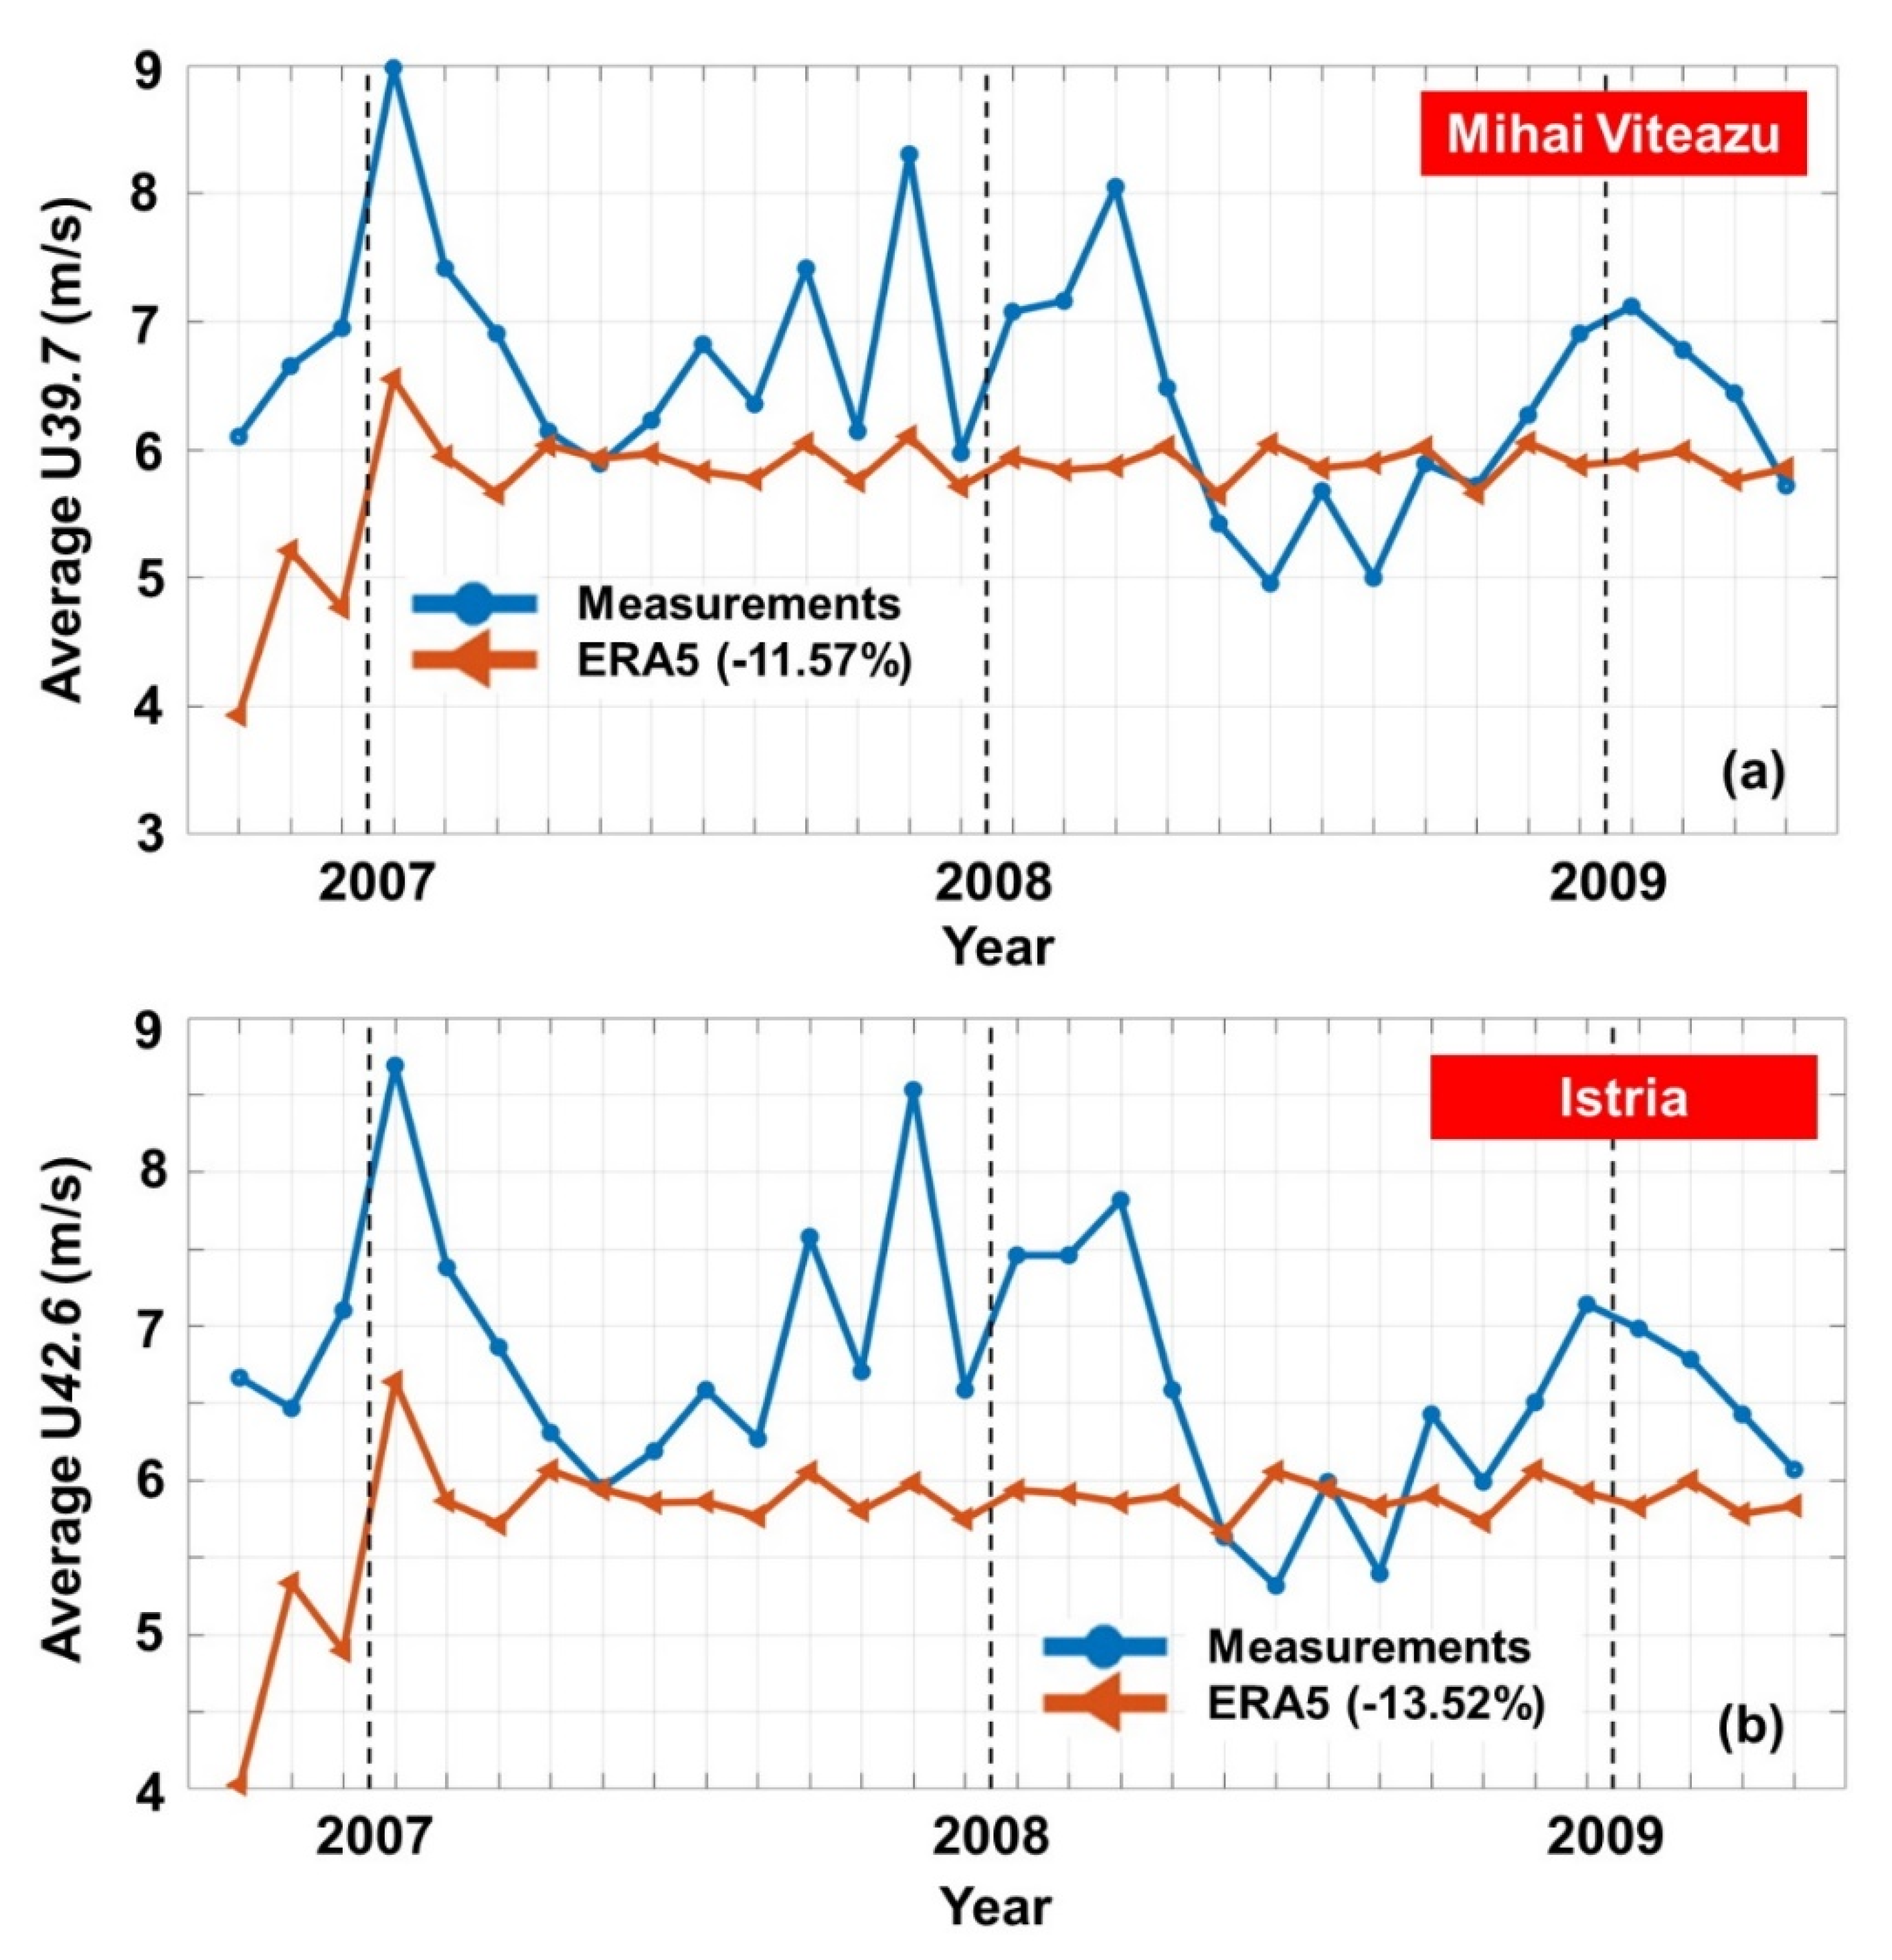
ERA5 wind data is the principal data source used in this work; therefore, it is essential to understand and take into consideration the differences between alternative data sources, in this case, the in situ measurements. Based on the comparisons against some in situ measurements for two existing wind projects located onshore near the Dobrogea region, considering the time interval from October 2006 to April 2009, it appears that the ECMWF wind data underestimates the wind conditions, as illustrated in Figure 3. For the Mihai–Viteazu wind project, located at 39.70 m height, in the vicinity of reference sites B1 and B2 (see Figure 1), the ERA5 data undervalues the wind speed by at least 11.57%. Regarding the Istria site, located at a height of 42.60 m and closer to the coastline, the percentage is even higher, namely 13.52%.
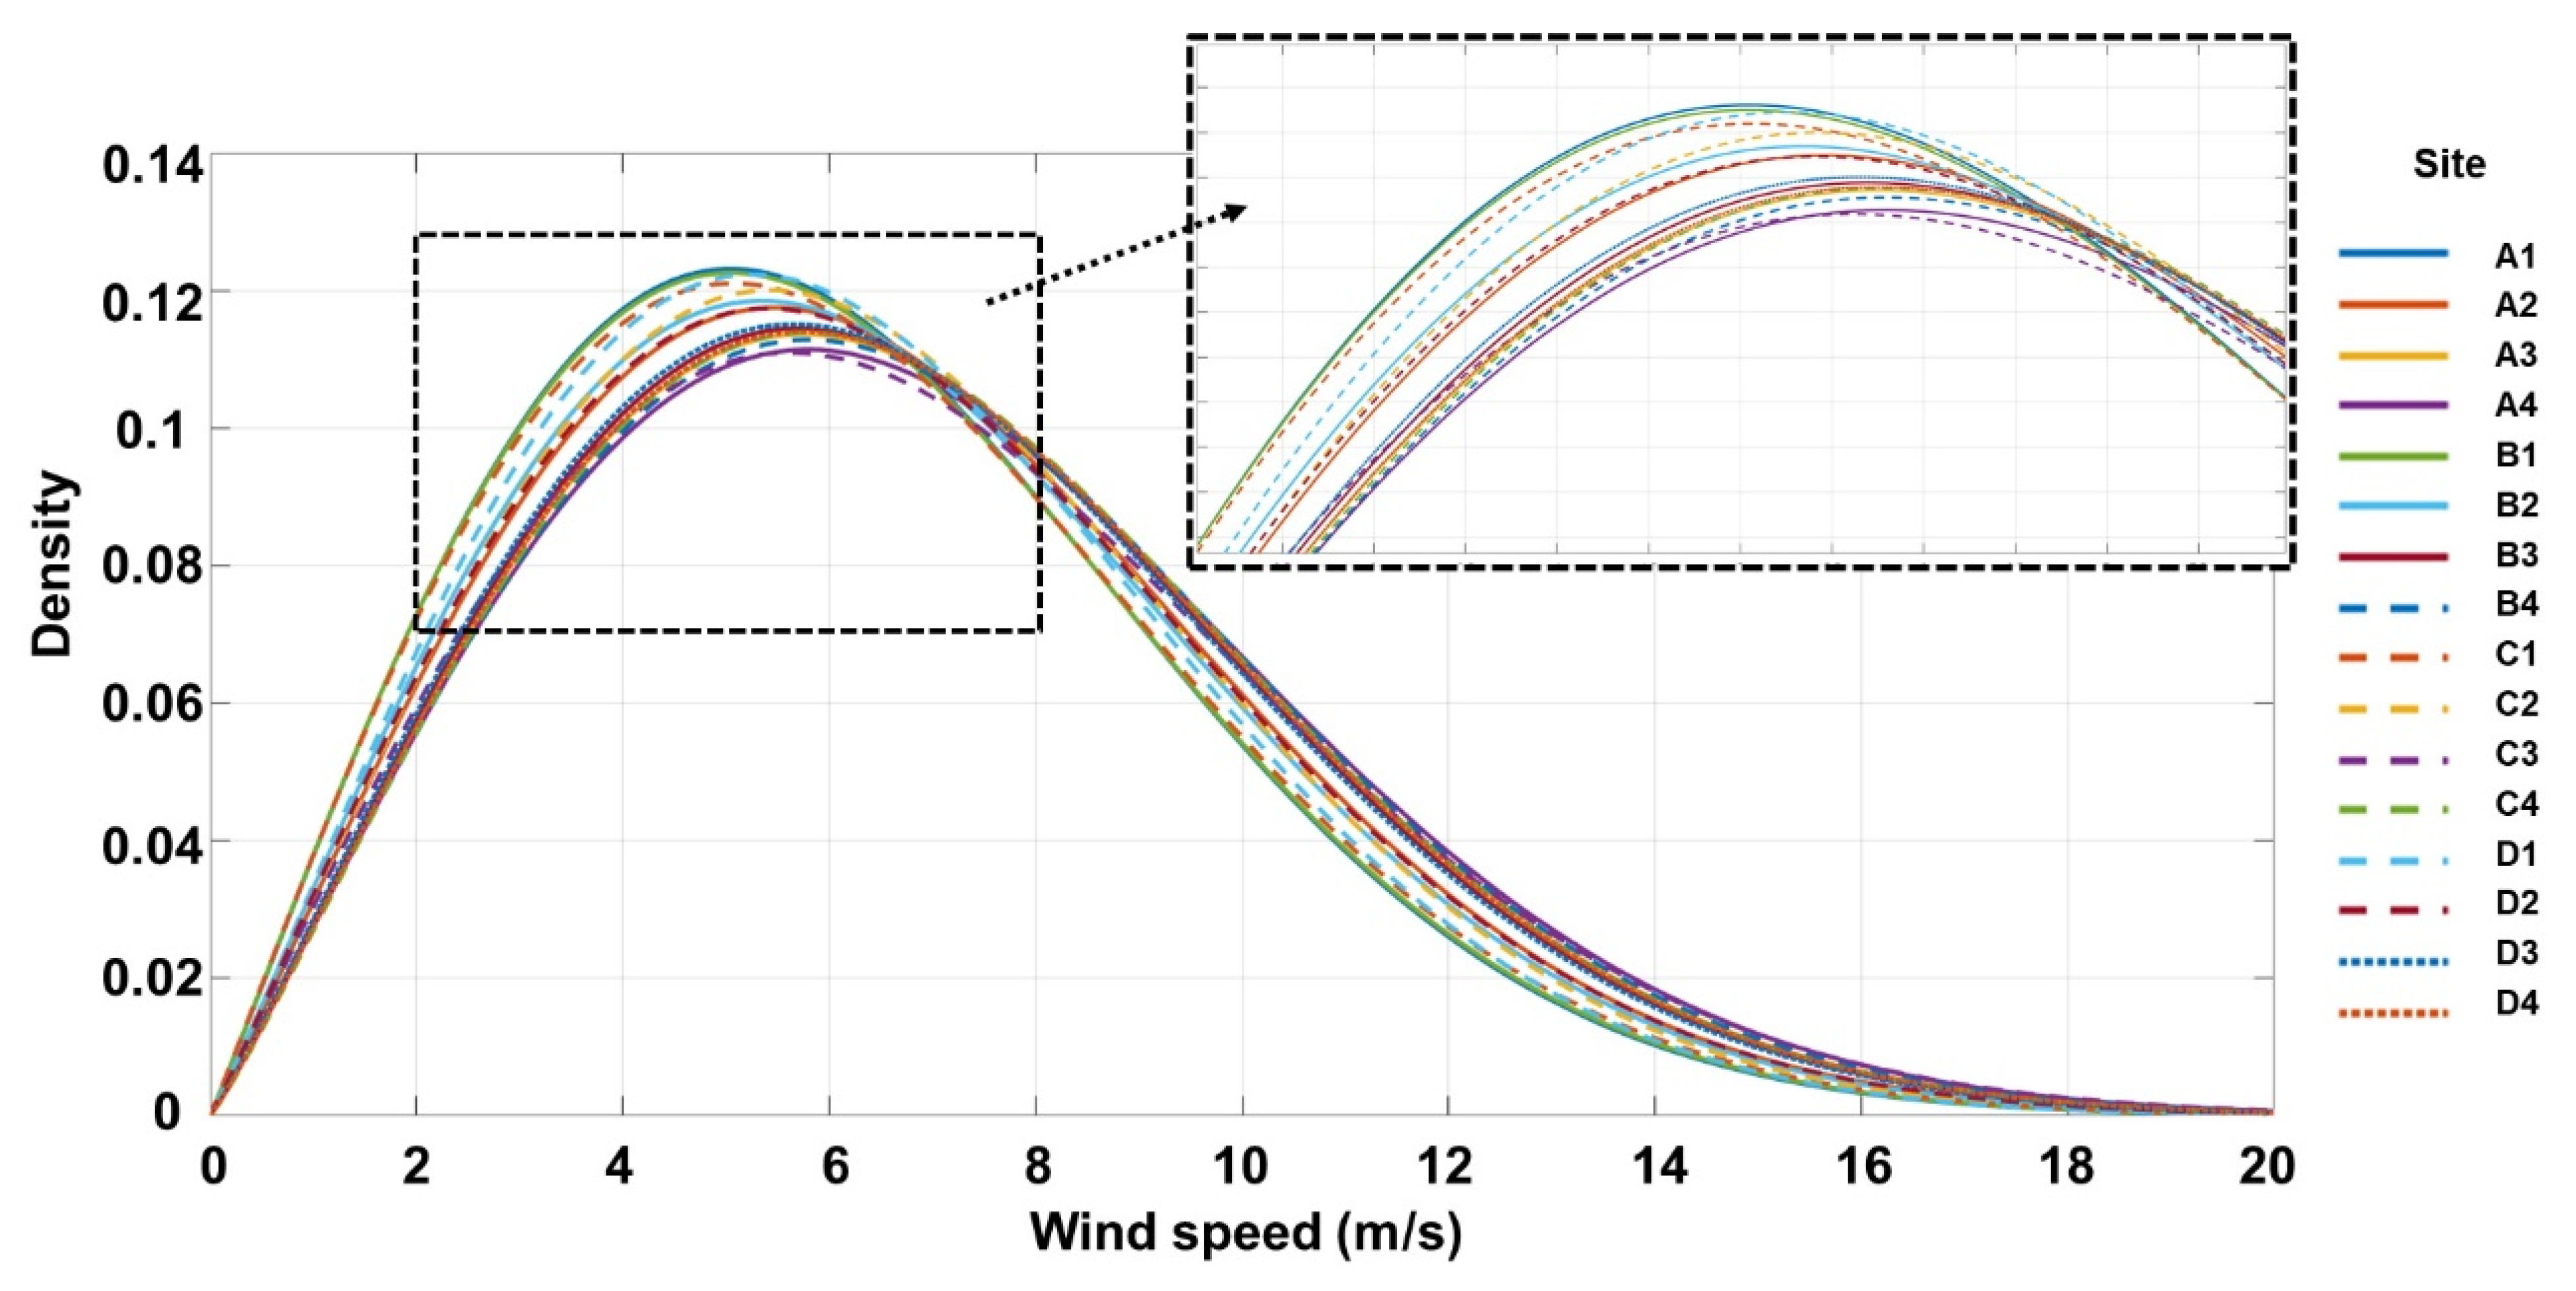
Figure 4 and Table 3 show the Weibull probability distribution and characteristics, including the specific parameters (k and c), considering all 16 reference sites. It is important to mention that there is no significant variation between the sites, although the points determine a relatively extended area. The results are built upon the ERA5 values (January 1979 to December 2020) and provide insight into the distribution of the wind resources by intervals and each site’s energy potential. All sites have wind conditions in the range of 6–20 m/s that will significantly increase the power production of an offshore wind turbine. The most moderate performances are expected for B2 and D2 sites, with wind speed peaks of approximately 4–5 m/s, while sites A3, A4, B4, and C3 exhibit the highest performances. Another noteworthy aspect is that none of the sites indicates wind conditions higher than 25 m/s, representing the cut-out threshold for most operational wind generators.
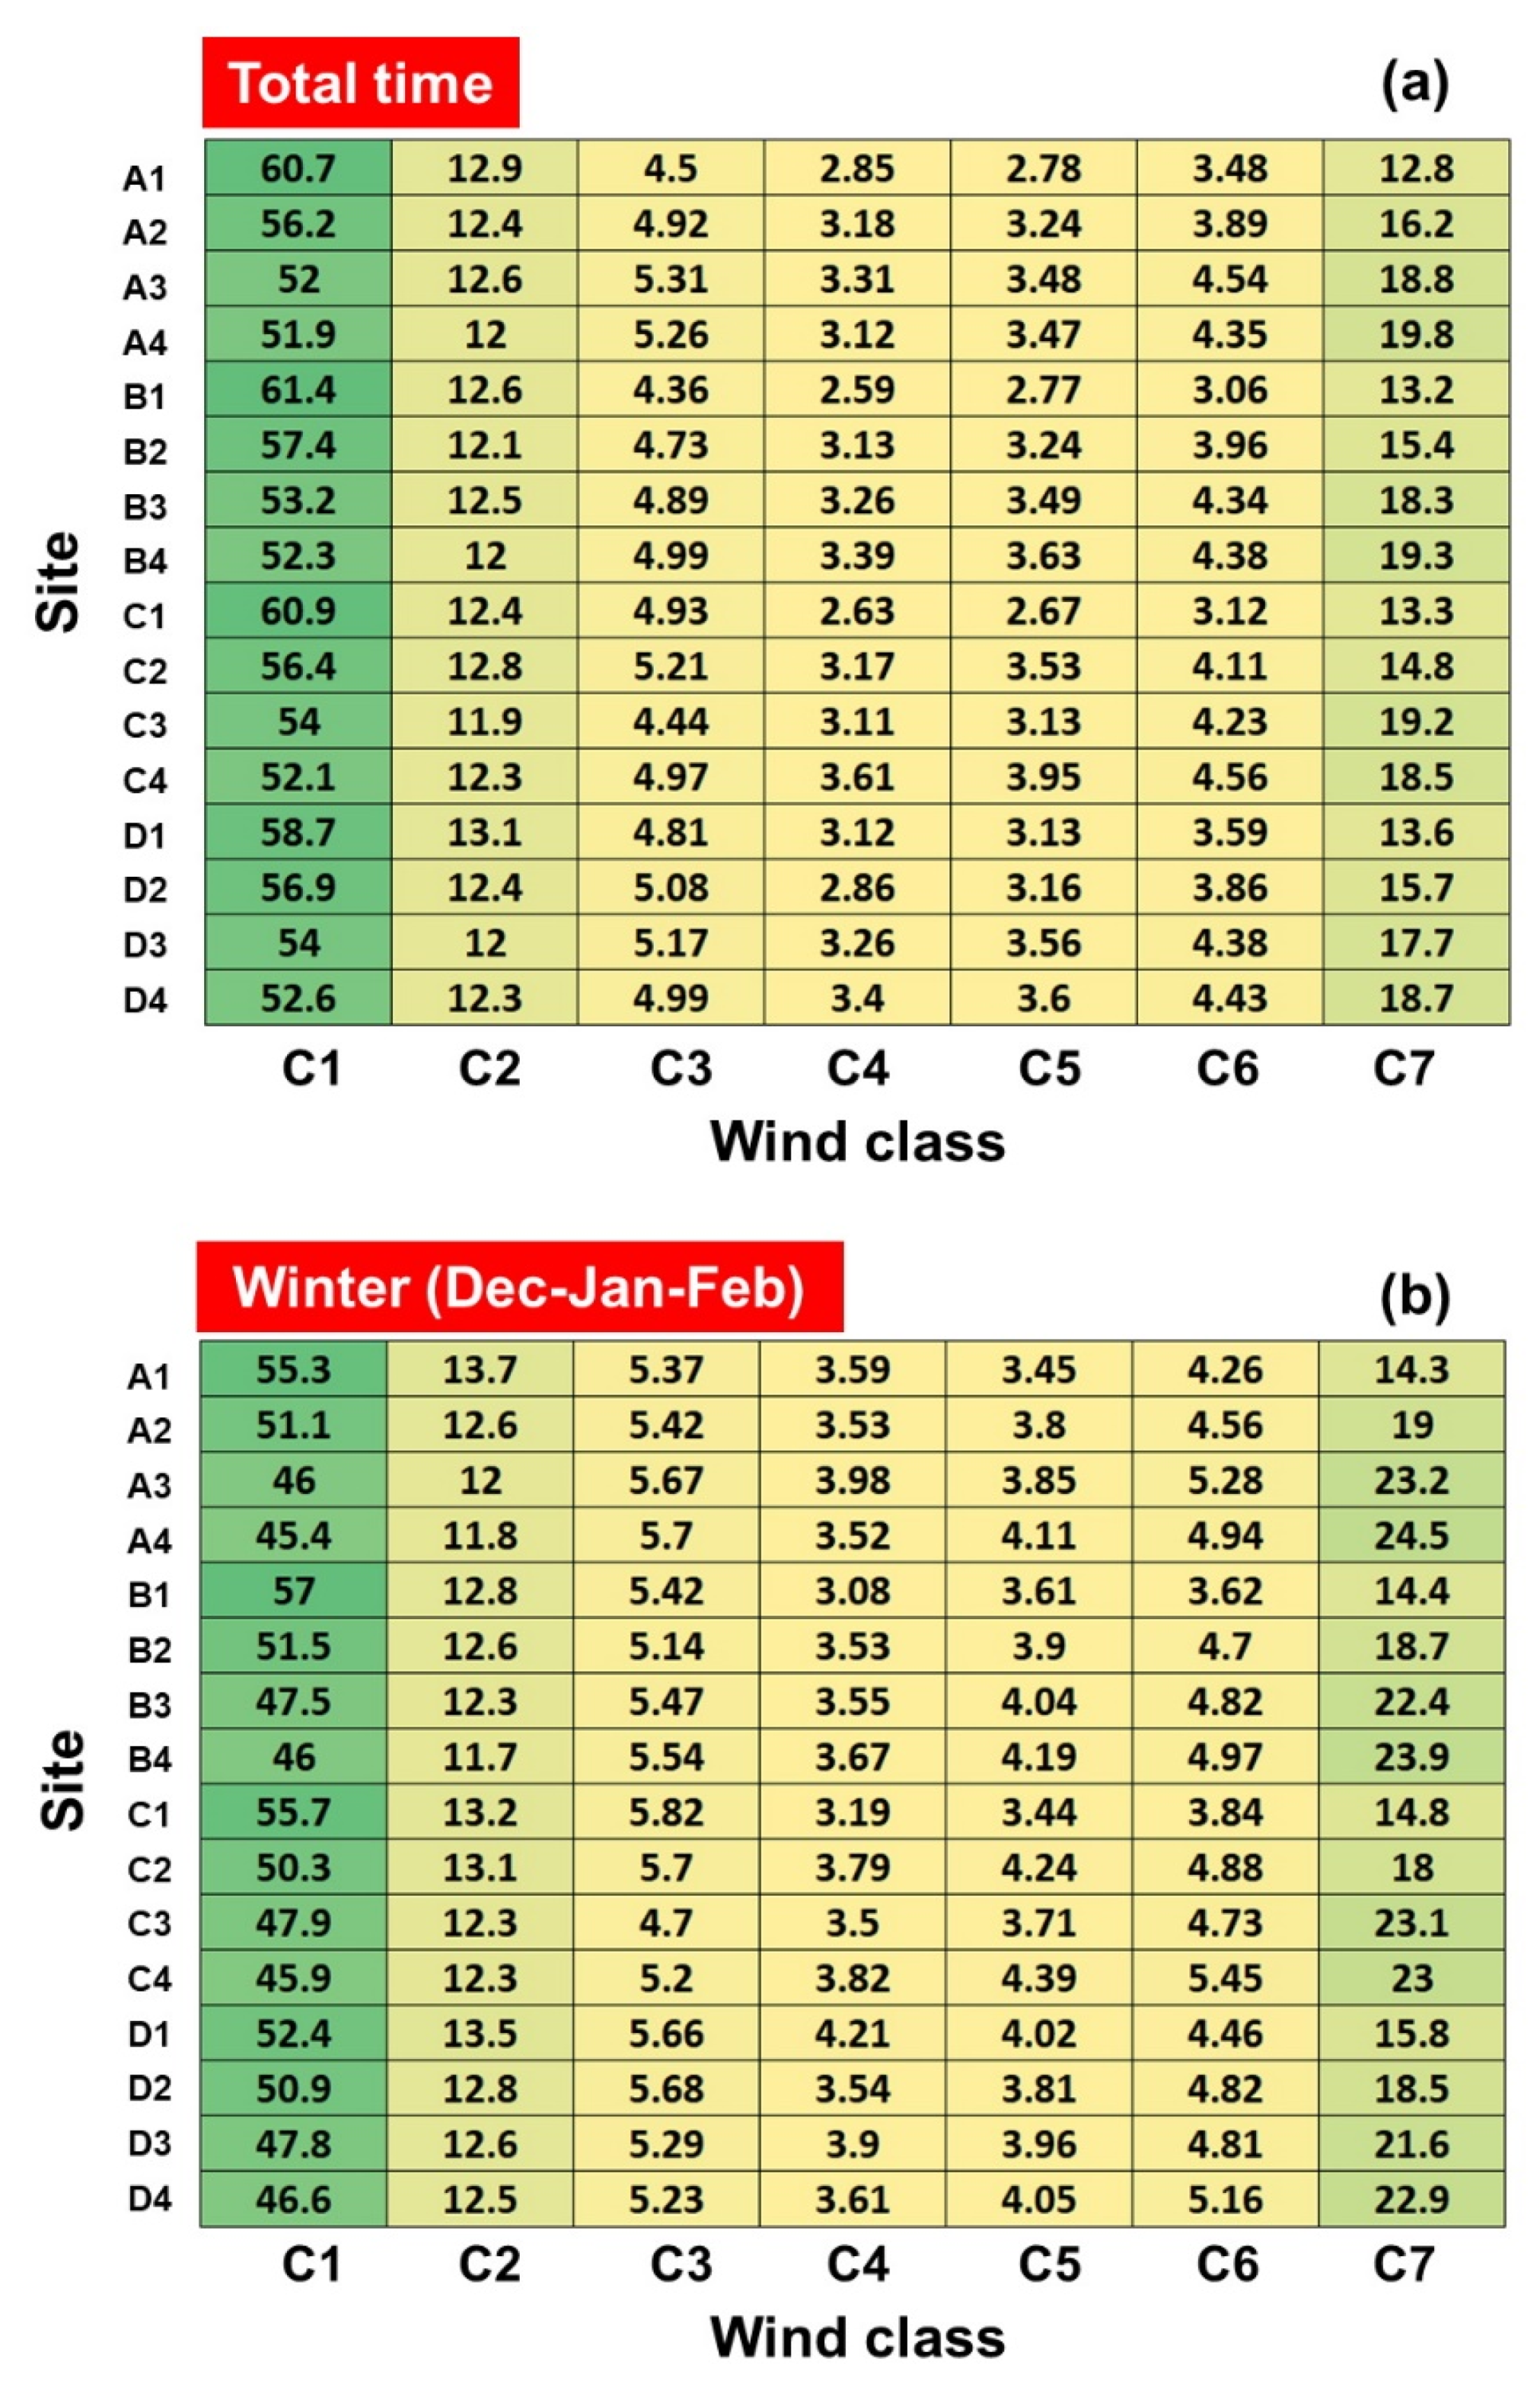
Figure 5 provides the first representation of the wind energy distribution over the Romanian coastal zone, including the land. The results show that the wind speed increases from land to the shoreline and further to the offshore region. Moreover, Figure 5 illustrates the full-time and wintertime (December–January–February) distribution of the U100 parameter by wind classes (C1–C7), the higher classes (C4–C7) considered more attractive for developing future renewable projects [27]. The organization of wind capacities by classes is highlighted in Table 4, providing a clearer understanding of the classification. The results provided in Figure 5 are based upon the ERA5 values from January 1979 until December 2020. Regardless of the time interval analyzed, it can be noticed that C1 is the prevailing wind class present, with values of wind speed smaller than 6.10 m/s [31] and distribution of 50–60%, followed closely by the C7 wind class (characteristic of wind speeds higher than 9.70 m/s [31]) with a distribution of 12–20% (total time) and 14–24% (wintertime), respectively. As expected, the winter season is highly prone to more wind speed values close to C6 and C7 wind classes and less of C1 compared to the total time distribution.
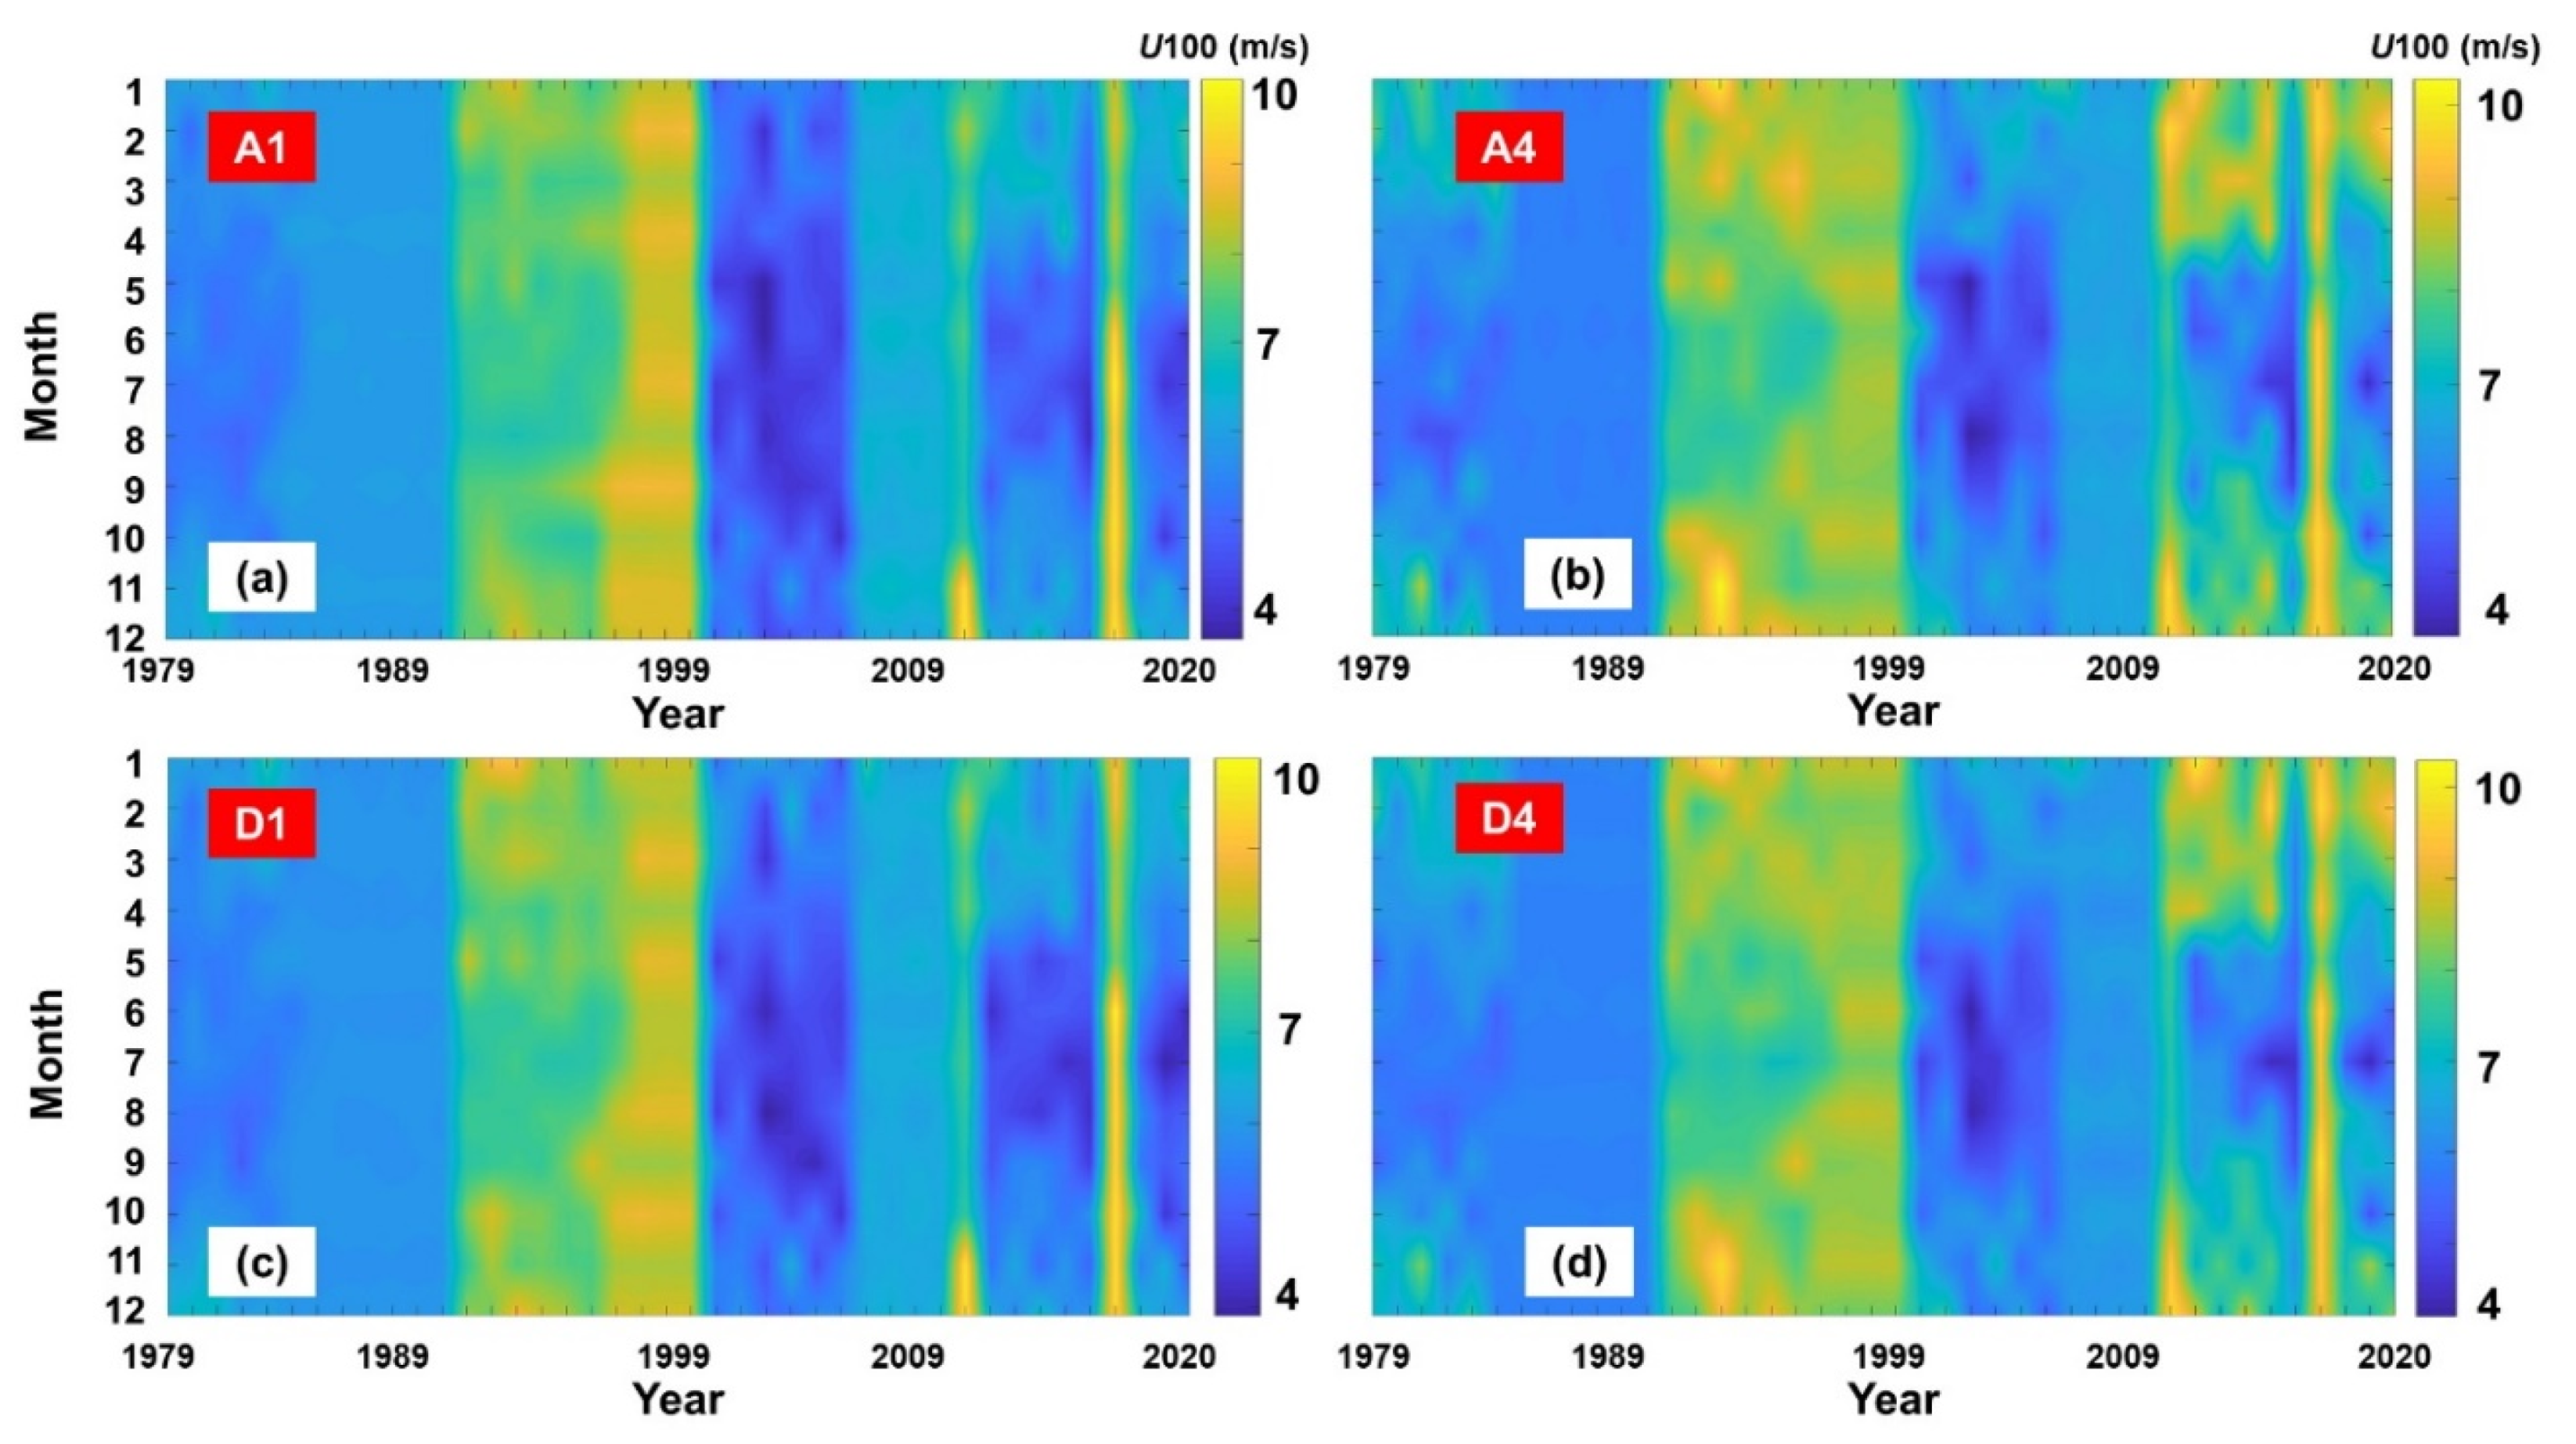
Figure 6 presents the spatial distribution of the monthly and annual mean wind speed values (U100 parameter) based on the ERA5 data reported for 1979–2020, the reference sites A1, A4, D1, and D4, respectively. These four maps highlight that the wind speeds slightly increase as we approach the offshore area, although there are no significant differences. From the analysis of the parameter U100, it can be noticed that the wind speed values corresponding to the offshore sites are steadier and more resourceful, especially during the winter season (December–January–February), where there are constant values of 9–10 m/s, suggesting that during the most energetic season (winter), a wind project located offshore will obtain the best performances. The average wind speed value is a relevant parameter in this context since it indicates what type of wind turbine is most suitable for the analyzed coastal climate.
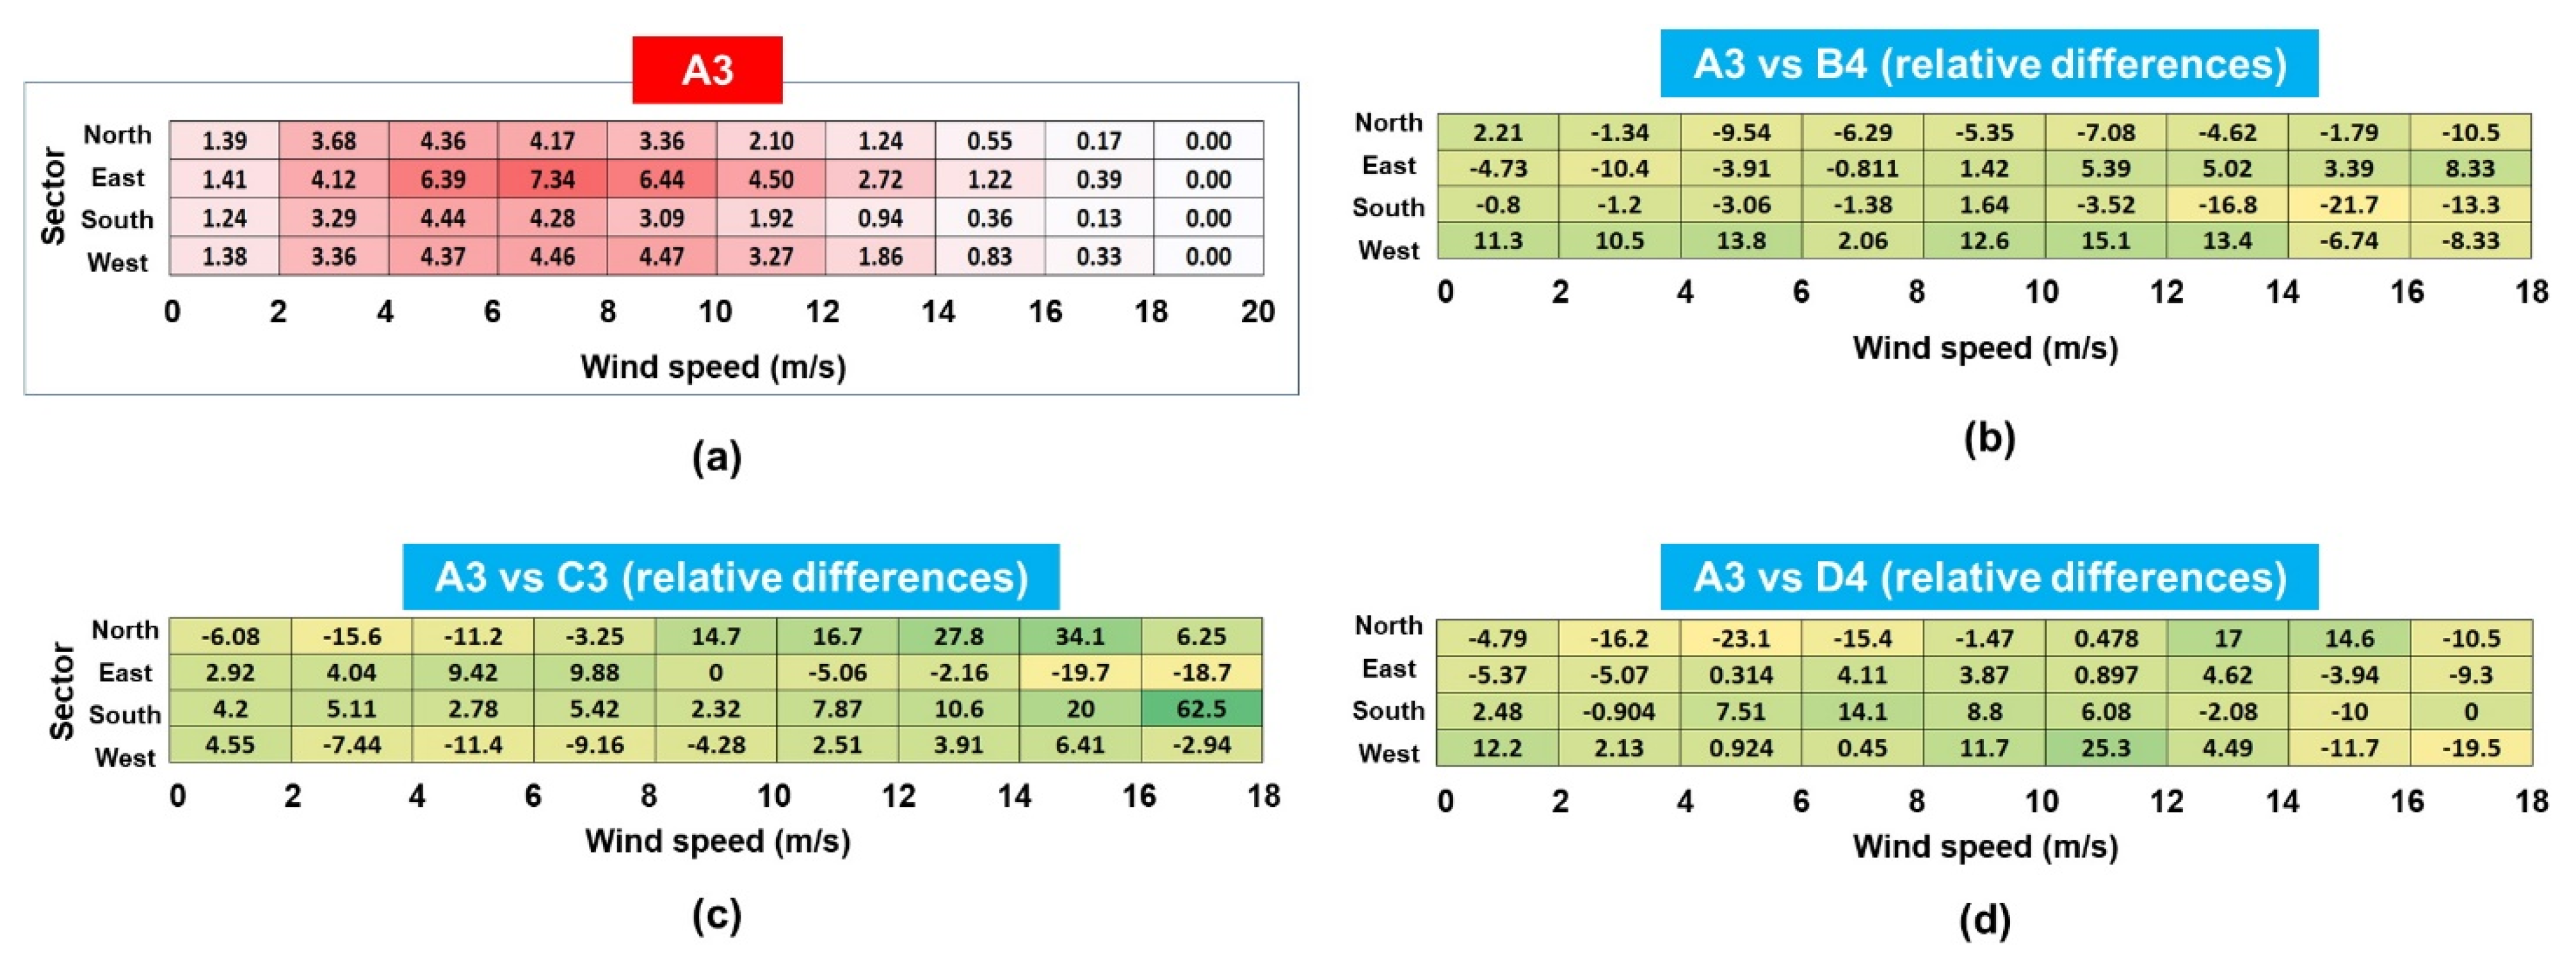
Another critical parameter is the wind direction, represented in Figure 7 for sites A3, B4, C3, D4, considering the 42-year time interval from January 1979 to December 2020, distributed by wind speeds. Each site has a different energy pattern, indicating for A3 a significant contribution coming from the offshore area from the north-eastern sector (7.34%) with wind speeds in the range 6–8 m/s. Compared to A3, the B4 site appears to have a higher share of wind resource from the southern sector, and D4 from the western one, especially wind speeds between 10–12 m/s. It seems that, stepping further into the offshore zone, the wind fields are oriented to the southwest direction. Moreover, the wind direction represents an essential viewpoint of the design of a wind farm, considering that the energy produced is significantly influenced by the ‘wake effect’. According to [32], it is estimated that the total losses could reach 10–25% for offshore projects.
3.2. Evaluation of the Wind Turbine Performances
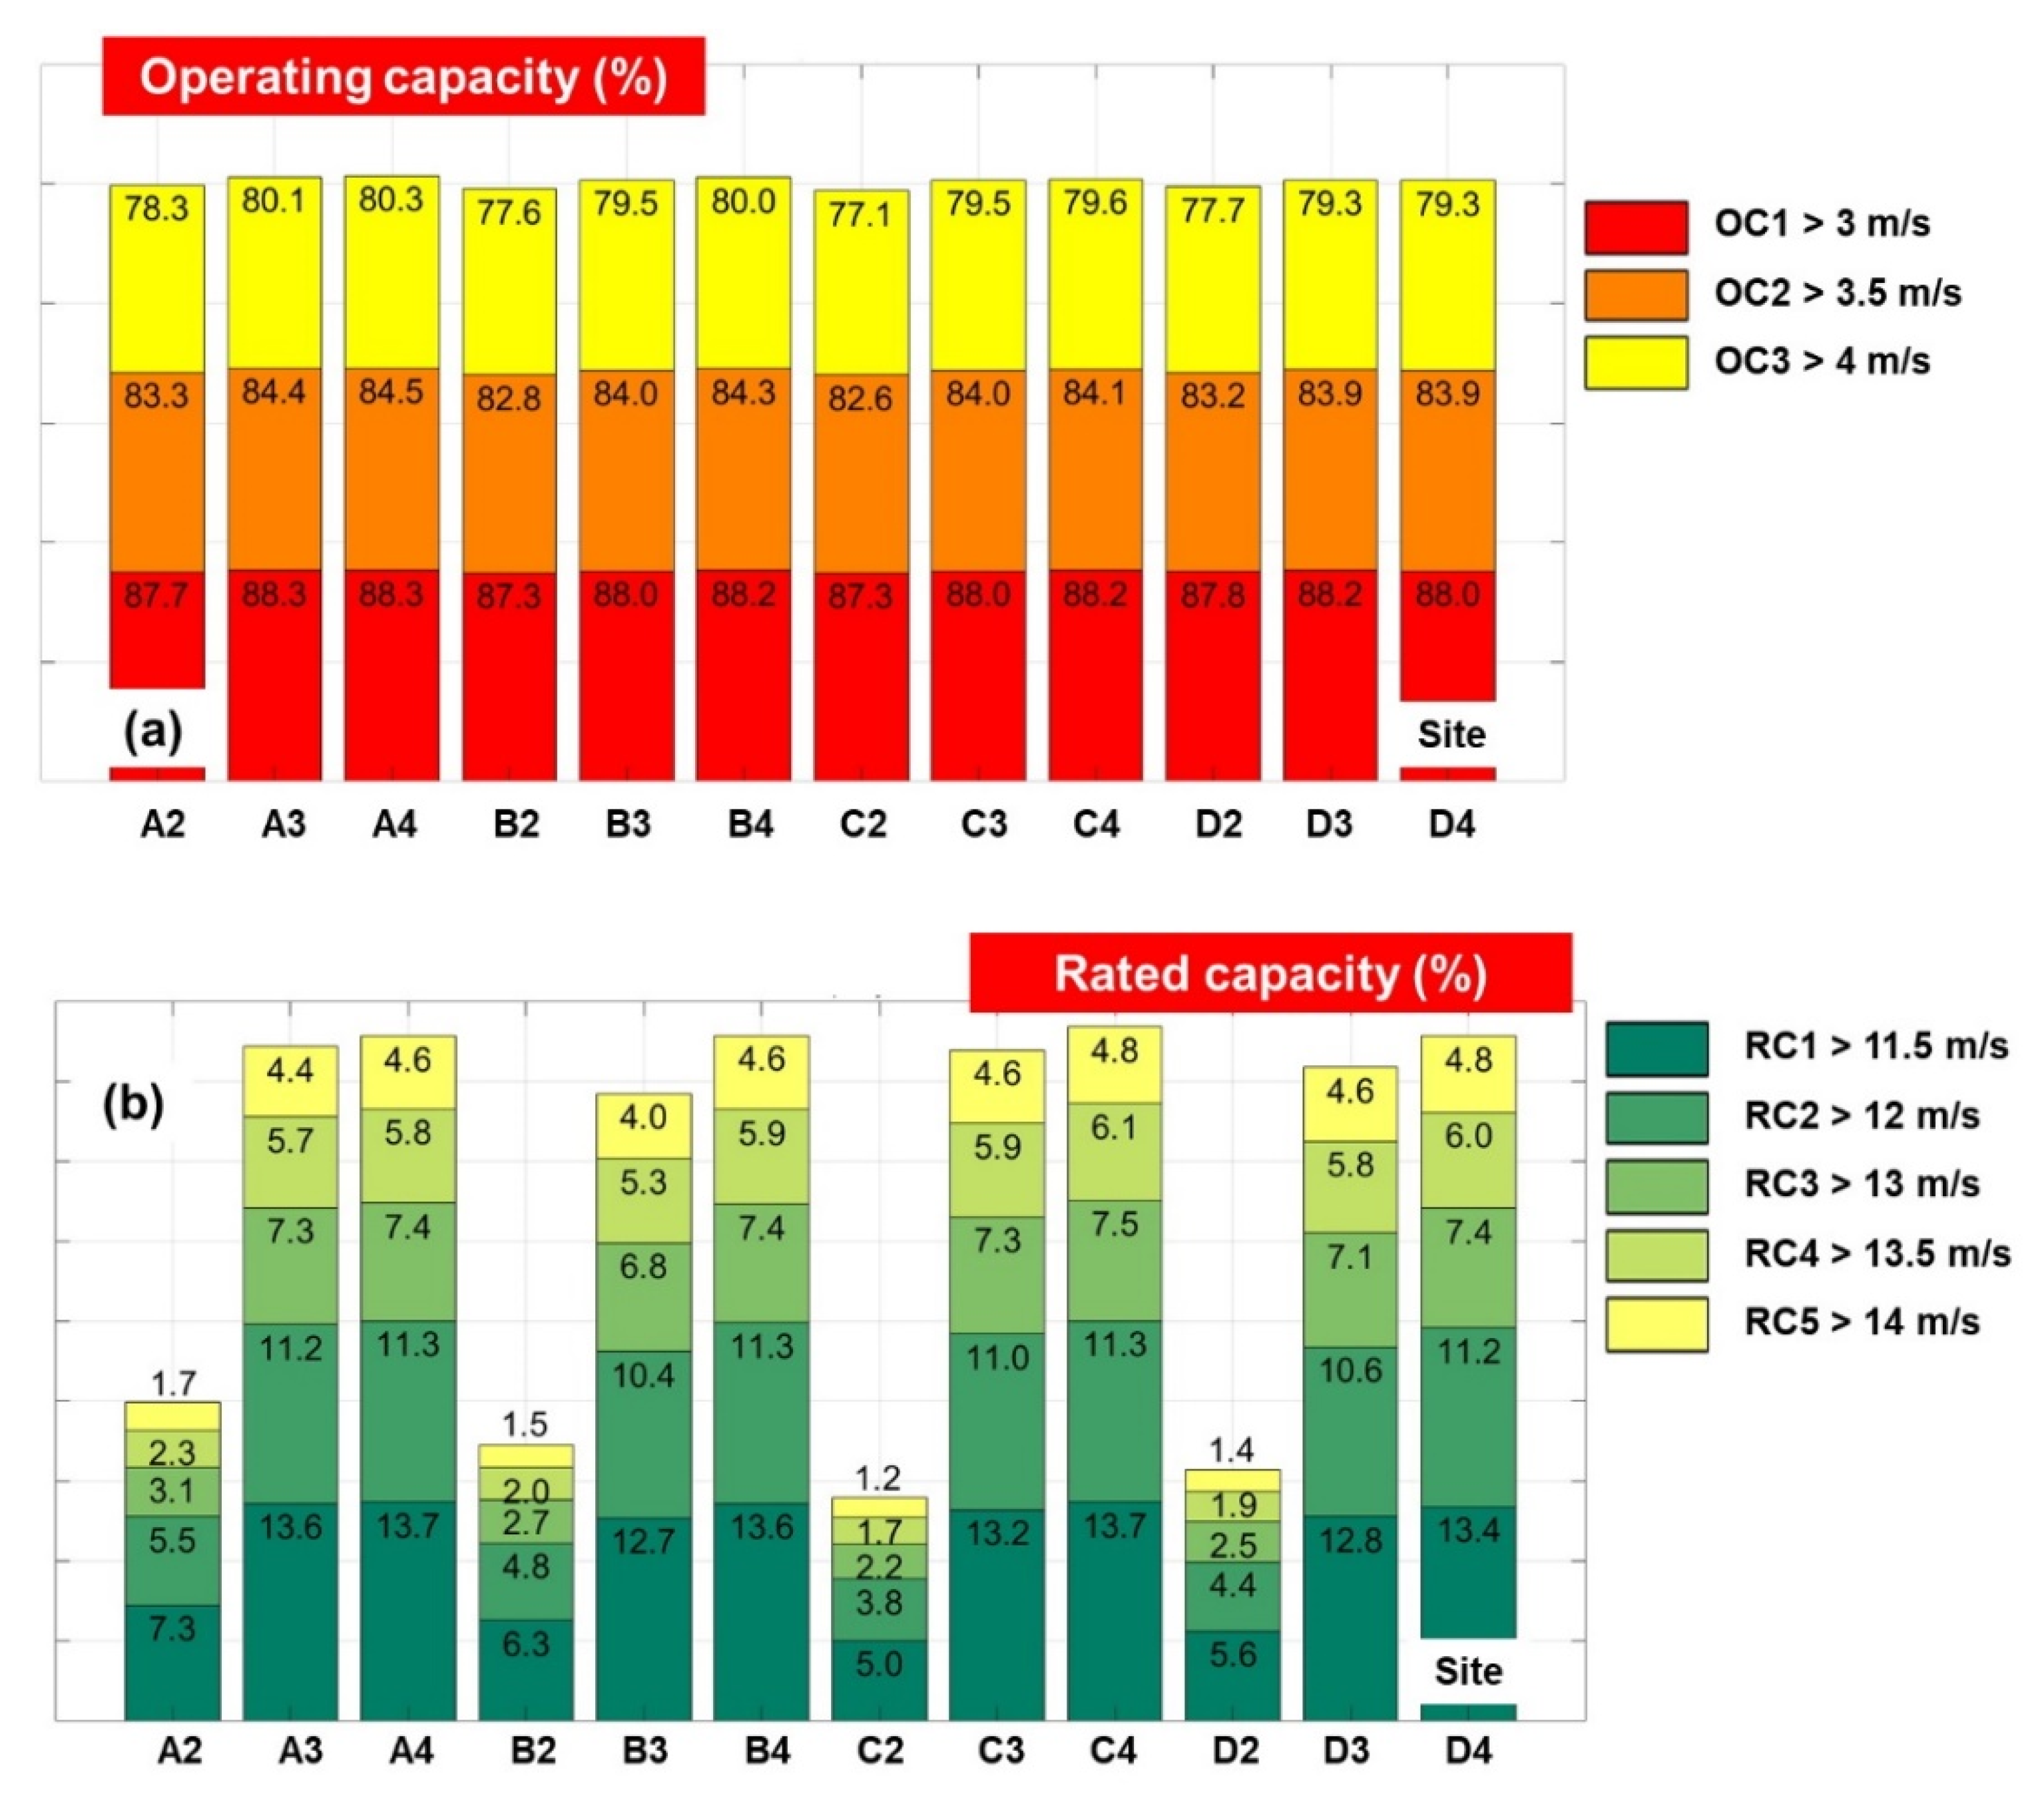
The first parameter analyzed is the operating capacity (in %), which indicates the percentage of the total time during which the specific system will perform at its total capacity. This parameter is computed based upon the cut-in speed—the initial point at which the wind turbine generates electricity; and the cut-out speed, which, for most significant offshore wind turbines, is set to 25 m/s, except for the V100–2.0 (T1), which has a cut-out speed of 22 m/s (see Table 2). When a system reaches the cut-out speed, it is set to shut down to prevent irreversible damage. Figure 8a illustrates that the most satisfying performances were obtained in the north-eastern part of the target area, at reference points A3 and A4, with a maximum value of 88.30% for the system Samsung S7.0-171, which has a cut-in speed of 3 m. As the cut-in speed increases from 3 to 4 m/s, a slight decrease in operating capacity is visible (80.10% for A3 and 80.30% for A4). The least attractive site, in this case, is represented by C2, regardless of the cut-in speed (77.10% when the cut-in speed is 4 m/s).
Secondly, the rated capacity (in %) highlights the maximum performance of each system, for which only the wind conditions located between the rated speed and cut-out values were assessed. In Figure 8b, the evolution of this parameter, which does not exceed 13.70%, is noticeable. The systems Samsung S7.0-171 (T11) and AMSC wt1000dd SeaTitan present the best performances (their rated capacity is >11.50 m/s) for the reference points A4 and C4 (13.70%), and A3 and B4 (13.60%). The values gradually decrease for B2 and D2, the rated capacity being in the range 5.60–6.30%, the lowest value being reported for C2 (5%).
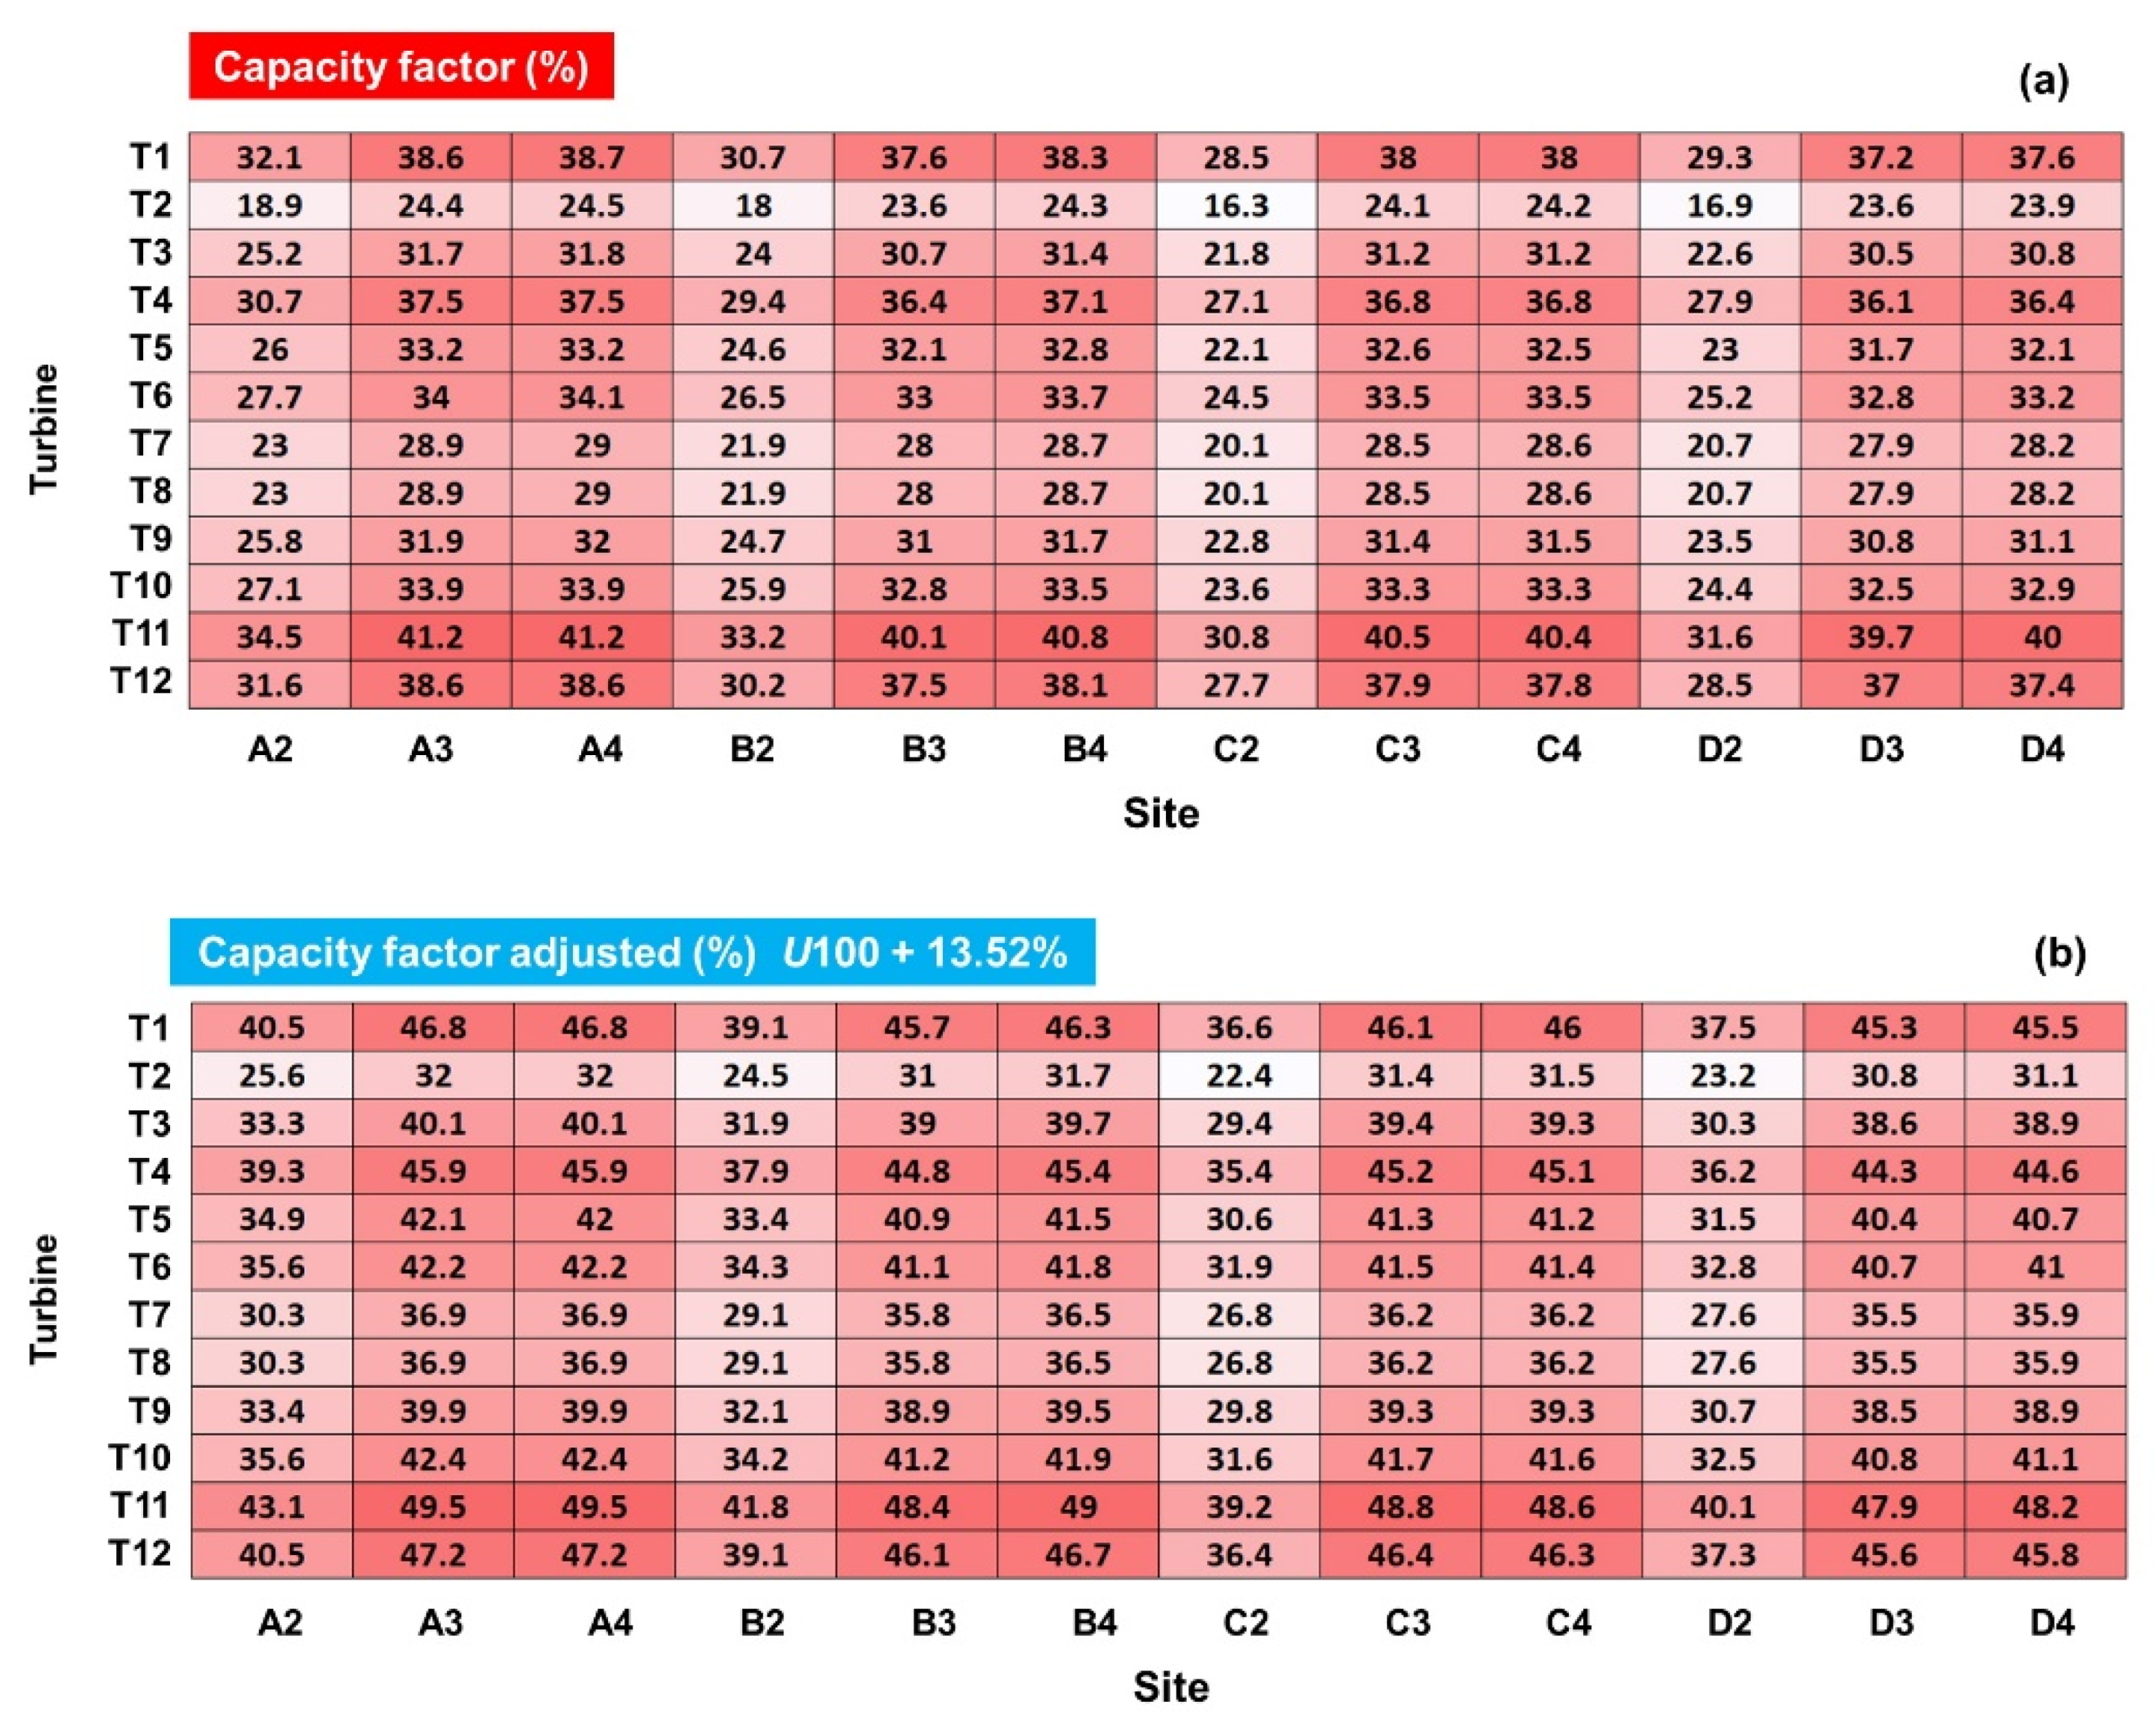
The capacity factor (Cf), which is used to determine the efficiency of a particular generator, is presented in Figure 9a, based on the values corresponding to the 20-year time interval 2000–2019. Closer to shore, near the reference sites A2, B2, C2, and D2, a single turbine’s capacity factor is in the extent of 16.30% (T2) and 34.50% (T11) and can reach up to 41.20% (T11) close to the 50 m contour line, near the A3 site. However, there is a slight improvement regarding the percentage (not even 1%) as the distance from the shore increases. For example, the Cf increases from 40.10% near reference site B3 to 40.80% near B4 for the system T11 and from 37.50% to 38.10% for T12, respectively. Nevertheless, given the fact that it has been considered that the wind measurements used for these calculations underestimate the wind power potential by 13.52%, Figure 9b illustrates the results by considering an adjustment of the U100 time series (each value) by 13.52%. Thus, a maximum value of 48.40% is registered for turbine T11 operating in B3 and 46.10% for T12. Regarding A3, where the highest values of Cf are located, the adjusted results report a 49.50% for T11 and 47.20% for T12. On the other hand, C2 and D2 sites represent the less attractive solutions for a wind project, regardless of the type of generator chosen.
The estimation of the AEP is shown in Figure 10, the values corresponding to a single wind turbine. The analysis of the total time data reveals that, generally, high rated-power turbines, such as T12-AMSC wt10000dd SeaTitan, will not exceed an output of 33.80 GWh/year for the two sites that stand out regarding the wind energy potential—A3 and A4—based on the ECMWF data considered for the interval 2000–2019. However, when considering an adjustment of 13.52% of the U100 time series, the AEP index for T12 could reach up to 41.30 GWh/year for both sites as highlighted in Figure 10b (A3 is situated at a distance of 49 km from shore and A4 at 100 km). The second best performance was attributed to T11, indicating sites A3, A4, B4, and C4 with the following results: 25.20, 25.30, 25, and 24.80 GWh/year, respectively. Nevertheless, upon an adjustment of 13.52%, T11 could reach a substantial 30.30 GWh/year value.
According to the previous results, two types of wind turbines stand out considering both capacity factor and the annual electricity production, corresponding to the shoreline and offshore sites that are most suitable for developing wind projects. Based on the results available for the time interval from January 2000 until December 2019, the top five sites and the two systems that are the most assuring regarding the wind power potential in the Romanian coastal zone are listed in Table 5. As expected, the Samsung S7.0-171 (T11) has the highest capacity factor for the sites located offshore, namely A3, A4, B4, C3, and C4, with values of the Cf in the range of 40.40–41.20%. Moreover, the AMSC wt10000dd SeaTitan (T12) reported the highest AEP, ranging from 33.10 to 33.80 GWh for sites C4 and A3, respectively. All in all, A3 seems to be the most attractive solution since the other four sites are defined by a higher water depth (>50 m). However, the installation of floating wind turbines might be a viable solution in areas with water depths that do not allow the implementation of fixed systems.
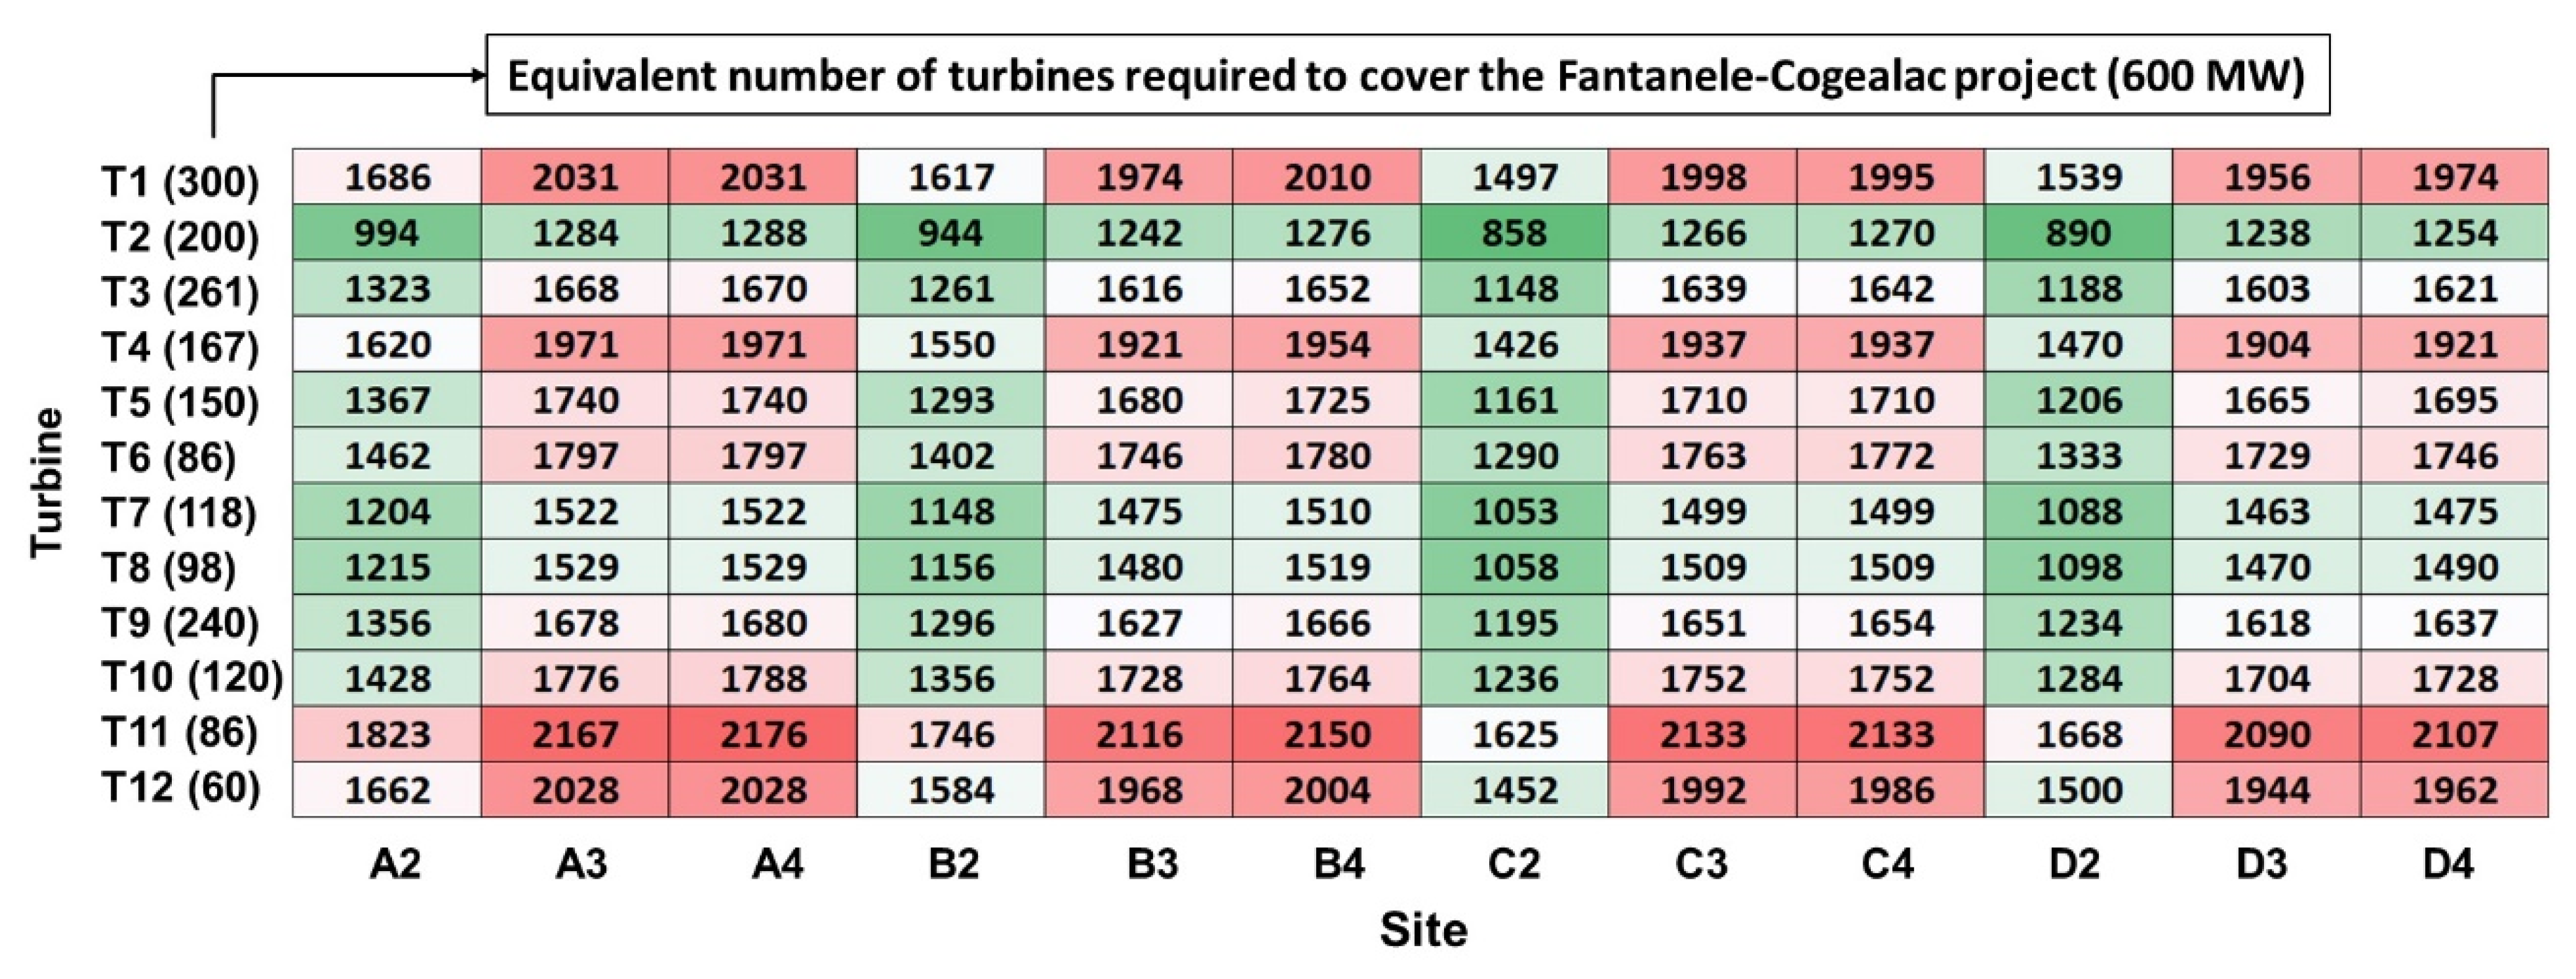
Since there is currently no operational offshore wind project in the Black Sea zone, the purpose of the following section is to identify the expected AEP (in GWh) of a wind farm that replicates the Fantanele–Cogealac project (600 MW capacity) for the 12 reference sites considered. Thus, Figure 11 presents the equivalent number of necessary wind turbines to cover the Fantanele–Cogealac project and the estimated AEP generated. As expected, only 60 system AMSC wt10000dd SeaTitan will ensure A3 and A4 sites an AEP of 2028 GWh, while 86 turbine Samsung S7.0-171 will provide for the same sites 2167 GWh. As assumed, the number of turbines significantly increases as the rated power drops. Hence, for system T1, 300 turbines will be necessary to guarantee 2031 GWh for site A3. By studying the current European offshore sector, the tendency for the marine environment is to adopt large-scale wind turbines for cost-effectiveness purposes. Consequently, systems with low-rated capacities will no longer be considered an attractive solution.
4. Discussion
According to the Statistical Review of World Energy [33], Romania’s primary energy consumption and coal production had decreased from 2.80 EJ in 1989 to 0.20 EJ at the end of 2019 and from 2.60 EJ to 0.15 EJ, respectively. On the other hand, the electricity generation from renewable sources—hydroelectricity, solar, and wind—reveals an ascending trend, with the highest peak of 0.03 EJ recorded in 2017 [33]. Considering the time interval 2008–2018, however, the growth rate in wind power generation is more than 104% [33]. The foreseeable future of the energy market represents a constant topic of debate, especially in the EU countries, which constantly establish objectives and performance criteria that are currently stipulated in the European Green Deal, focusing on the near future, 2021–2050. Generally, the discussions concentrate on topics such as the effects of global warming, the strategies for ensuring energy security, and a sustainable future based upon net-zero greenhouse gas emissions. The most affordable way to support these policies is to identify renewable energy sources, such as those from the marine environment, where it is possible to develop large-scale projects. As discussed in this study, one of the most economical energy sources is offshore wind, where brand-new technical solutions have already been submitted, such as the emerging floating platforms that can operate in deep water.
The purpose of this work is to identify the most significant wind conditions in the Romanian coastal environment so that an offshore wind farm could become operational soon. The outcome of this research study is based on the ERA5 data, and from the assessment of the U100 index, it is noticeable that the wind assets are more attractive offshore than onshore, heedless of the period considered. Given that Fantanele–Cogealac, located in the Dobrogea region, is the largest onshore wind farm in Europe and represents approximately double the largest ever existing European wind farm (600 MW) is more than inspiring for the offshore wind market in Romania [34]. An important aspect that requires more detailed investigation is that offshore wind development across Europe, onshore grid access, and infrastructure pose serious challenges [20]. For example, any offshore wind farm developed in the Romanian waters will have to be connected to the grid in Dobrogea, where a significant part of the country’s renewable power generation assets is already situated [20]. According to the NECP [7], some additional GW of renewable energy—primarily wind power—are expected to be produced in the already congested Dobrogea region.
In connection with some other related previous studies [3,21,22], this one embodies one of the first studies that evaluate the Romanian wind potential relying on the new ECMWF product—ERA 5. Even though it is used to estimate the resourcefulness of renewables, due to the relatively low resolution of the global model, it is reasonable to somehow underestimate the wind speed in some coastal zones (Mihai–Viteazu and Istria sites for the Black Sea—see Figure 3). Other constraints of the ERA5 datasets in the coastal areas of the North Sea are further highlighted in Kalverla et al. [35]. It is necessary to mention that most reanalysis datasets are provided at a standard height of 10 m [36], which is proper for evaluating the wind conditions from a meteorological point of view. A significant part of the previous studies evaluated the wind conditions in the Black Sea coastal zone at a height of 80 m (U80), where older-generation wind turbines used to operate [17]. The innovative feature of ERA5 is that it provides wind data directly at 100 m, admitting that this is a reference height for the offshore industry [7,37]; therefore, there is no need for further adjustments that could discredit the results.
On balance, considering the wind speed and water depth conditions, the study points out that the most suitable sites for the development of an offshore wind project appear to be located close to the 50 m contour line, thus bypassing any interference with shipping routes and port activities [38]. Furthermore, the figures indicated for the capacity factor of the most attractive offshore wind systems are in line with other values reported at the European level (around 40%). They could be even higher (almost 50%), acknowledging the underestimation of 13.52% of the wind speed data reported compared with the in situ measurements considered for this study (see Figure 3).
5. Conclusions
In the present work, the Romanian coastal zone’s wind energy resources from the Black Sea region were evaluated by considering some environmental parameters (such as U100) and some relevant technical features of some state-of-the-art wind turbines that either operate or are currently implemented within several offshore wind projects. Based on the ERA5 wind datasets considering the 42-year time interval from January 1979 to December 2020, it was possible to outline the dominant energy patterns of the target area, thus revealing the most appropriate hot spots for developing renewable wind energy designs. The results reveal an upward trend concerning relevant wind conditions when approaching the offshore zone from the land, implying that an offshore project might become a certainty shortly.
During wintertime, which is the most energetic season, the average wind speed can frequently reach and overcome 9 m/s, values that are related to the International Electrotechnical Commission (IEC) classes II and III. The present work reveals that higher wind resources are characteristic in the northern part of the target area, where the capacity factor of the Samsung S7.0-171 system frequently registers a value of about 40% and can reach up to 41.20%, close to the 50 m depth contour line, near the A3 site, which is situated 49 km from the shore. Considering the proximity of some of the attractive sites for developing a wind project to the Port of Constanta and its facilities, these sites become compatible in terms of accessibility for both the development process and operation and maintenance activities. For example, opposed to fixed offshore turbines, floating platforms require constructing a different infrastructure for their installation, since elements are regularly assembled onshore and then towed to the offshore site. Moreover, floating turbines must be brought back to ports for some critical operations and maintenance activities. From this perspective, Romania’s Port of Constanta can play a significant role in developing floating wind turbines in the Black Sea coastal zone. Furthermore, it could represent an enabling factor for tapping into uncharted territories represented by offshore fields, thus generating new business opportunities and jobs.
To obtain a comprehensive picture of the wind energy potential, an entire portfolio of offshore wind turbines had to be assessed to identify the most representative systems for this geographical region. Thus, another direction of this study was related to the evaluation of the performances provided by some wind turbines covering a full spectrum of rated capacities, in the range of 2–10 MW, being in line with other values reported from offshore wind farms at the European level.
To sum up, it has been proved that the Romanian coastal zone represents a viable solution for the development of an offshore wind project. The western part of the Black Sea basin has significant wind supplies that require precise quantification to authenticate the expected performances of the offshore wind turbines. As outlined in this study, the global reanalysis wind datasets underestimate the wind speed by at least 11.57%, and this value increases as we approach the coastline and go further in the offshore sector. Thus, the results achieved in terms of wind power potential and the evaluation of the wind turbine’s parameters might not match the reality, the potential of the target area being much more substantial. Therefore, the present work should encourage researchers and investors to understand the limitations of the wind datasets by performing direct comparisons against in situ measurements.
Author Contributions
A.G. performed the literature review, wrote the final form of the manuscript and drew the conclusions. F.O. processed the wind data, carried out the statistical analysis and interpreted the results. E.R. guided the entire research and provided the needed resources. All authors have read and agreed to the published version of the manuscript.
Funding
This work was carried out in the framework of the research project DREAM (Dynamics of the REsources and technological Advance in harvesting Marine renewable energy), supported by the Romanian Executive Agency for Higher Education, Research, Development, and Innovation Funding—UEFISCDI, grant number PN–III–P4–ID–PCE–2020–0008.
Institutional Review Board Statement
Not applicable.
Data Availability Statement
The data used in this study are openly available. ERA5 data used in this study were obtained from the ECMWF data server.
Acknowledgments
The results of this work will also be presented to the 9th edition of the Scientific Conference organized by the Doctoral Schools of “Dunărea de Jos” University of Galati (SCDS-UDJG) http://www.cssd-udjg.ugal.ro/ (accessed on 3 June 2021) that will be held on 10th and 11th of June 2021, in Galati, Romania.
Conflicts of Interest
The authors declare no conflict of interest.
References
- European Commission. A Clean Planet for All. A European Strategic Long–Term Vision for a Prosperous, Modern, Competitive and Climate Neutral Economy. In Depth Analysis in Support of the Commission Communication; European Commission: Brussels, Belgium, 2018. [Google Scholar]
- Future of Wind. Deployment, Investment, Technology, Grid Integration and Socio–Economic Aspects. Available online: https://irena.org/-/media/Files/IRENA/Agency/Publication/2019/Oct/IRENA_Future_of_wind_2019 (accessed on 15 May 2021).
- Onea, F.; Rusu, E. A Study on the Wind Energy Potential in the Romanian Coastal Environment. J. Mar. Sci. Eng. 2019, 7, 142. [Google Scholar] [CrossRef] [Green Version]
- Raileanu, A.; Onea, F.; Rusu, E. An Overview of the Expected Shoreline Impact of the Marine Energy Farms Operating in Different Coastal Environments. J. Mar. Sci. Eng. 2020, 8, 228. [Google Scholar] [CrossRef] [Green Version]
- Rusu, E. An Evaluation of the Wind Energy Dynamics in the Baltic Sea, Past and Future Projections. Renew. Energy 2020, 160, 350–362. [Google Scholar] [CrossRef]
- Rusu, E.; Onea, F. An Assessment of the Wind and Wave Power Potential in the Island Environment. Energy 2019, 175, 830–846. [Google Scholar] [CrossRef]
- NECP. Planul National Integrat in Domeniul Energiei Si Schimbarilor Climatice 2021–2030. COM, Romania. 2020. Available online: https://ec.europa.eu/energy/sites/ener/files/documents/ro_final_necp_main_ro.pdf (accessed on 25 May 2021).
- Dragomir, G.; Serban, A.; Nastase, G.; Brezeanu, A.I. Wind Energy in Romania: A Review from 2009 to 2016. Renew. Sustain. Energy Rev. 2016, 64, 129–143. [Google Scholar] [CrossRef]
- Rusu, L.; Raileanu, A.; Onea, F. A Comparative Analysis of the Wind and Wave Climate in the Black Sea along the Shipping Routes. Water 2018, 10, 924. [Google Scholar] [CrossRef] [Green Version]
- Ganea, D.; Mereuta, E.; Rusu, L. Estimation of the Near Future Wind Power Potential in the Black Sea. Energies 2018, 11, 3198. [Google Scholar] [CrossRef] [Green Version]
- Rusu, E. A 30–Year Projection of the Future Wind Energy Resources in the Coastal Environment of the Black Sea. Renew. Energy 2019, 139, 2283. [Google Scholar] [CrossRef]
- Onea, F.; Rusu, E. Efficiency Assessments for Some State-of-the-Art Wind Turbines in the Coastal Environments of the Black and the Caspian Seas. Energy Explor. Exploit. 2016, 34, 217–234. [Google Scholar] [CrossRef] [Green Version]
- Onea, F.; Rusu, E. Wind Energy Assessments along the Black Sea Basin. Meteorol. Appl. 2014, 21, 316–329. [Google Scholar] [CrossRef]
- Onea, F.; Rusu, L. Evaluation of Some State-Of-The-Art Wind Technologies in the Nearshore of the Black Sea. Energies 2018, 11, 2452. [Google Scholar] [CrossRef] [Green Version]
- Argin, M.; Yerci, V. The Assessment of Offshore Wind Power Potential of Turkey. In Proceedings of the 2015 9th International Conference on Electrical and Electronics Engineering (ELECO), Bursa, Turkey, 26–28 November 2015; pp. 966–970. [Google Scholar]
- Raileanu, A.B.; Onea, F.; Rusu, E. Evaluation of the Offshore Wind Resources in the European Seas Based on Satellite Measurements. In Proceedings of the International Multidisciplinary Scientific Geo Conference SGEM, Albena, Bulgaria, 16–25 June 2015; pp. 227–234. [Google Scholar]
- Onea, F.; Rusu, L. An Evaluation of the Wind Energy in the North-West of the Black Sea. Int. J. Green Energy 2014, 11, 465–487. [Google Scholar] [CrossRef]
- IEA. Offshore Wind Outlook 2019, Paris. Available online: https://www.Iea.Org/Reports/Offshore-Wind-Outlook-2019 (accessed on 15 May 2021).
- WindEurope. Offshore Wind in Europe—Key Trends and Statistics. 2019. Available online: https://www.iea.org/reports/offshore-wind-outlook-2019 (accessed on 15 May 2021).
- Romania’s Offshore Wind Energy Resources: Natural Potential, Regulatory Framework, and Development Prospects; EPG: Bucharest, Romania, 2020.
- Onea, F.; Rusu, L. Offshore Wind Energy and the Romanian Energy Future. E3S Web Conf. ICACER 2019, 103, 001004. [Google Scholar] [CrossRef]
- Onea, F.; Rusu, L. Assessment of the Romanian Onshore and Offshore Wind Energy Potential. E3S Web Conf. REEE 2019, 122, 01003. [Google Scholar] [CrossRef]
- Girleanu, A.; Onea, F.; Rusu, E. The Efficiency and Coastal Protection Provided by a Floating Wind Farm Operating in the Romanian Nearshore. In Proceedings of the 6th International Conference on Clean Energy Research, ICACER 2021, Barcelona, Spain, 15–17 April 2021. [Google Scholar]
- Hersbach, H.; Bell, B.; Berrisford, P.; Horanyi, A.; Sabater, J.M.; Nicolas, J.; Radu, R.; Schepers, D.; Simmons, A.; Soci, C.; et al. Global reanalysis: Goodbye ERA–Interim, hello ERA5. ECMWF Newsl. 2019, 159, 17–24. [Google Scholar]
- WindEurope. Offshore Wind in Europe—Key Trends and Statistics. 2020. Available online: https://windeurope.org/intelligence-platform/product/offshore-wind-in-europe-key-trends-and-statistics-2020/ (accessed on 15 May 2021).
- Welcome to Wind-Turbine-Models. Available online: https://en.wind-turbine-models.com/ (accessed on 1 June 2021).
- Wen, Y.; Kamranzad, B.; Lin, P. Assessment of Long-Term Offshore Wind Energy Potential in the South and Southeast Coasts of China Based on a 55-Year Dataset. Energy 2021, 224, 120225. [Google Scholar] [CrossRef]
- Salvacao, N.; Guesdes Soares, C. Wind Resource Assessment Offshore the Atlantic Iberian Coast with the WRF Model. Energy 2018, 145, 276–287. [Google Scholar] [CrossRef]
- Al–Nasaar, W.K.; Neelamani, S.; Al-Salem, K.A.; Al–Dashti, H.A. Feasibility of Offshore Wind Energy as a Model. Energy 2019, 169, 783–796. [Google Scholar] [CrossRef]
- Project Description—Wind Parks Mihai Viteazu I–IV (80 MW); Nek Umwelttechnik AG: Constanta, Romania, 2010.
- Oh, K.Y.; Kim, J.Y.; Lee, J.K.; Ryu, M.S.; Lee, J.S. An Assessment of Wind Energy Potential at the Demonstration Offshore Wind Farm in Korea. Energy 2020, 46, 555–563. [Google Scholar] [CrossRef]
- Xie, K.; Yang, H.; Hu, B.; Li, C. Optimal Layout of a Wind Farm Considering Multiple Wind Directions. In Proceedings of the 2014 International Conference on Probabilistic Methods Applied to Power Systems (PMAPS), Durham, UK, 7–10 July 2014. [Google Scholar]
- Statistical Review of World Energy. Energy Economics. Available online: https://www.bp.com/en/global/corporate/energy-economics/statistical-review-of-world-energy.html (accessed on 19 March 2021).
- Girleanu, A.; Rusu, E.; Onea, F. An Insight into the Energy Market in the Context of Climate Change and the European Gre Green Deal. In Proceedings of the International Multidisciplinary Scientific GeoConference SGEM, Albena, Bulgaria, 2021. under review. [Google Scholar]
- Kalverla, P.C.; Holtslag, A.A.M.; Ronda, R.J.; Steeneveld, G.J. Quality of Wind Characteristics in Recent Wind Atlases over the North Sea. Meteorol. Soc. 2020, 146, 1498–1515. [Google Scholar] [CrossRef]
- Onea, F.; Rusu, L. Long–Term Analysis of the Black Sea Weather Windows. J. Mar. Sci. Eng. 2019, 7, 303. [Google Scholar] [CrossRef] [Green Version]
- ERA5: How Are the 100m Winds Calculated, Copernicus User Support Forum—ECMWF Confluence Wiki. Available online: https://confluence.ecmwf.int/ (accessed on 29 April 2021).
- Raileanu, A.; Onea, F.; Rusu, E. Implementation of Offshore Wind Turbines to Reduce Air Pollution in Coastal Areas—A Case Study of Constanta Harbour in the Black Sea. J. Mar. Sci. Eng. 2020, 7, 550. [Google Scholar] [CrossRef]
Figure 1.
The Romanian coastal area, including the Exclusive Economic Zone (EEZ) boundaries and the reference sites considered. Map processed from Google Earth, 2021.
Figure 1.
The Romanian coastal area, including the Exclusive Economic Zone (EEZ) boundaries and the reference sites considered. Map processed from Google Earth, 2021.

Figure 2.
Representation of the wind turbine power curves considered for this study.

Figure 3.
Wind speed comparison between ERA5 and in situ measurements, considering the time interval October 2006 to April 2009. Results for: (a) Mihai-Viteazu site, at 39.7 m height; (b) Istria site, at 42.6 m height. The in situ values were adapted from [30]. The percentage values indicate the average differences (in %) between ERA5 and in situ data, in this case ERA5 underestimating the wind speed.

Figure 4.
The Weibull distributions corresponding to the ERA5 values (January 1979 to December 2020).
Figure 4.
The Weibull distributions corresponding to the ERA5 values (January 1979 to December 2020).

Figure 5.
Distribution of the U100 parameter by wind classes (January 1979 to December 2020), where: (a) Total time values; (b) winter values.
Figure 5.
Distribution of the U100 parameter by wind classes (January 1979 to December 2020), where: (a) Total time values; (b) winter values.

Figure 6.
Monthly and annual distribution of the U100 (average values) reported between January 1979 and December 2020; (a) site A1; (b) site A4; (c) site D1; (d) site D4.
Figure 6.
Monthly and annual distribution of the U100 (average values) reported between January 1979 and December 2020; (a) site A1; (b) site A4; (c) site D1; (d) site D4.

Figure 7.
Distribution of the wind conditions (U100) by wind speed and directions, considering the 42-year time interval from January 1979 to December 2020. Results for: (a) A3-joint distribution; (b–d) differences (in %) reported between A3 and the sites B4, C3, and D4, respectively. A positive value indicates that, for A3, compared to the other sites, a higher share corresponds.

Figure 8.
Performances of the selected wind turbines, for the time interval from January 2000 to December 2019. Results indicated for: (a) Operating capacity; (b) rated capacity. The OC and RC selection are based on the most frequent cut-in and rated speed values indicated by the current offshore wind turbines (see Table 2).

Figure 9.
Capacity factor computed for different wind turbines and sites corresponding to the 20-year time interval 2000–2019. The results are indicated in terms of: (a) Cf —expected values based on ERA5 data; (b) adjusted Cf by considering an adjustment of the U100 time series (each value) by 13.52%.

Figure 10.
Annual Electricity Production (in GWh) expected to be provided by the wind turbines considered for the interval 2000–2019. Results indicated in terms of: (a) AEP—expected values based on ERA5 data; (b) adjusted AEP by considering an adjustment of the U100 time series (each value) by 13.52%.

Figure 11.
Expected AEP (in GWh) indicated by a wind farm that replicated the Cogealac–Fantanele project (600 MW capacity). Results corresponding to the interval 2000–2019, where, for example, T2 (200) means that from 200 wind turbines (V100–3.0) a total of 994 GWh will be generated for the site A2.


Table 1.
The main characteristics of the sites considered onshore and offshore of the Romanian coastal environment. Data obtained from Google Earth 2021.
Table 1.
The main characteristics of the sites considered onshore and offshore of the Romanian coastal environment. Data obtained from Google Earth 2021.
| ID | Location | Long (°) | Lat (°) | Distance to Shore (km) | Height/Depth (m) |
|---|---|---|---|---|---|
| A1 | Land | 28.899 | 45.084 | 60 | 68 |
| A2 | Shoreline | 29.635 | 44.952 | 0 | 0 |
| A3 | Offshore | 30.247 | 44.837 | 49 | −50 |
| A4 | Offshore | 30.839 | 44.716 | 100 | −81 |
| B1 | Land | 28.309 | 44.800 | 57 | 185 |
| B2 | Shoreline | 29.015 | 44.683 | 0 | 0 |
| B3 | Offshore | 29.680 | 44.569 | 55 | −61 |
| B4 | Offshore | 30.478 | 44.438 | 118 | −84 |
| C1 | Land | 27.960 | 44.471 | 60 | 11 |
| C2 | Shoreline | 28.693 | 44.351 | 0 | 0 |
| C3 | Offshore | 29.377 | 44.250 | 56 | −51 |
| C4 | Offshore | 30.114 | 44.122 | 115 | −89 |
| D1 | Land | 27.942 | 44.081 | 60 | 145 |
| D2 | Shoreline | 28.675 | 43.976 | 0 | 0 |
| D3 | Offshore | 29.179 | 43.916 | 43 | −51 |
| D4 | Offshore | 29.755 | 43.841 | 90 | −83 |
Table 2.
Technical details of the wind turbines considered in this work. Data processed from [26,27].
| ID | Turbine | Power (MW) | Cut–in Speed (m/s) | Rated Speed (m/s) | Cut–out Speed (m/s) | Hub Height (m) |
|---|---|---|---|---|---|---|
| T1 | V100–2.0 | 2.00 | 3.00 | 12 | 22 | 100 |
| T2 | V100–3.0 | 3.00 | 4.00 | 15 | 25 | 100 |
| T3 | SWT–2.3–93 | 2.30 | 4.00 | 13 | 25 | 100 |
| T4 | SWT–3.6–120 | 3.60 | 3.50 | 12 | 25 | 100 |
| T5 | SWT–4.0–130 | 4.00 | 5.00 | 12 | 25 | 100 |
| T6 | SWT–7.0–154 | 7.00 | 3.00 | 13 | 25 | 100 |
| T7 | REpower5M | 5.075 | 3.50 | 14 | 25 | 100 |
| T8 | REpower6M | 6.15 | 3.50 | 14 | 25 | 100 |
| T9 | Nordex N90/2500 | 2.50 | 3.00 | 13.50 | 25 | 100 |
| T10 | AREVA M5000–116 | 5.00 | 4.00 | 12.50 | 25 | 100 |
| T11 | Samsung S7.0–171 | 7.00 | 3.00 | 11.50 | 25 | 100 |
| T12 | AMSC wt10000dd SeaTitan | 10.00 | 4.00 | 11.50 | 25 | 100 |
Table 3.
Weibull characteristics corresponding to locations considered. The results are reported for the U100 parameter for the time interval from January 1979 until December 2020.
Table 3.
Weibull characteristics corresponding to locations considered. The results are reported for the U100 parameter for the time interval from January 1979 until December 2020.
| Site | A1 | A2 | A3 | A4 | B1 | B2 | B3 | B4 |
| k (m/s) | 7.04 | 7.49 | 7.81 | 7.92 | 7.06 | 7.38 | 7.75 | 7.87 |
| c | 2.03 | 2.08 | 2.10 | 2.09 | 2.02 | 2.06 | 2.10 | 2.10 |
| Site | C1 | C2 | C3 | C4 | D1 | D2 | D3 | D4 |
| k (m/s) | 7.12 | 7.38 | 7.82 | 7.82 | 7.20 | 7.46 | 7.70 | 7.80 |
| c | 2.01 | 2.10 | 2.04 | 2.11 | 2.08 | 2.06 | 2.10 | 2.11 |
Table 4.
Wind classification at 100 m, processed from Oh et al. [31].
Table 4.
Wind classification at 100 m, processed from Oh et al. [31].
| Wind Class | 100 m Reference Height | |
|---|---|---|
| Power Density (W/m2) | Wind Speed (m/s) | |
| C1 (poor) | <260 | <6.1 |
| C2 (marginal) | 260–420 | 6.1–7.1 |
| C3 (fair) | 420–560 | 7.1–7.8 |
| C4 (good) | 560–670 | 7.8–8.3 |
| C5 (excellent) | 670–820 | 8.3–8.9 |
| C6 (outstanding) | 820–1060 | 8.9–9.7 |
| C7 (superb) | >1060 | >9.7 |
Table 5.
Top five capacity factor and AEP corresponding to the shoreline and offshore sites, excluding the points A1, B1, C1, and D1. Results available for the time interval from January 2000 until December 2019.
Table 5.
Top five capacity factor and AEP corresponding to the shoreline and offshore sites, excluding the points A1, B1, C1, and D1. Results available for the time interval from January 2000 until December 2019.
| Site/Turbine | A3—T11 | A4—T11 | B4—T11 | C3—T11 | C4—T11 |
| Capacity factor (%) | 41.20 | 41.20 | 40.80 | 40.50 | 40.40 |
| Site/Turbine | A3—T12 | A4—T12 | B4—T12 | C3—T12 | C4—T12 |
| AEP (GWh) | 33.80 | 33.80 | 33.40 | 33.20 | 33.10 |
Publisher’s Note: MDPI stays neutral with regard to jurisdictional claims in published maps and institutional affiliations. |
© 2021 by the authors. Licensee MDPI, Basel, Switzerland. This article is an open access article distributed under the terms and conditions of the Creative Commons Attribution (CC BY) license (https://creativecommons.org/licenses/by/4.0/).
Share and Cite
MDPI and ACS Style
Girleanu, A.; Onea, F.; Rusu, E. Assessment of the Wind Energy Potential along the Romanian Coastal Zone. Inventions 2021, 6, 41. https://0-doi-org.brum.beds.ac.uk/10.3390/inventions6020041
AMA Style
Girleanu A, Onea F, Rusu E. Assessment of the Wind Energy Potential along the Romanian Coastal Zone. Inventions. 2021; 6(2):41. https://0-doi-org.brum.beds.ac.uk/10.3390/inventions6020041
Chicago/Turabian StyleGirleanu, Alina, Florin Onea, and Eugen Rusu. 2021. "Assessment of the Wind Energy Potential along the Romanian Coastal Zone" Inventions 6, no. 2: 41. https://0-doi-org.brum.beds.ac.uk/10.3390/inventions6020041