
Strategies for Studying Acidification and Eutrophication Potentials, a Case Study of 150 Countries


1
Local Environment Management & Analysis (LEMA), ArGEnCo Department, University of Liege, 4000 Liege, Belgium
2
Department of Architectural Engineering, 104 Engineering Unit A, Pennsylvania State University, State College, PA 16802, USA
3
Indoor Environmental Quality Laboratory, School of Architecture, Design, and Planning, The University of Sydney, Sydney, NSW 2006, Australia
J 2022, 5(1), 150-165; https://0-doi-org.brum.beds.ac.uk/10.3390/j5010012
Submission received: 20 November 2021
/
Revised: 21 February 2022
/
Accepted: 23 February 2022
/
Published: 1 March 2022
(This article belongs to the Section Environmental Sciences)
Abstract
:Acidification and eutrophication are two environmental impacts that have a significant effect on air pollution and human health. The quantitative analysis of these two impacts remains hitherto unknown at the scale of new neighborhoods. The main objective of this study is to evaluate, analyze and compare the acidification and eutrophication potentials of one neighborhood initially located in Belgium. For making this comparison, this neighborhood was built in 149 other countries by applying four parameters such as building materials, energy mix, occupants’ mobility and local climate. The environmental costs of acidification and eutrophication coming from this neighborhood were assessed over 100 years. This research, extended to the scale of several nations, will enable new researchers, and especially policy-makers, to measure the effectiveness of sustainable neighborhoods. Eutrophication and acidification potentials were assessed under different phases (construction, use, renovation and demolition), with Pleiades software (version 4.19.1.0). The effects of the energy mix were the most significant among the other parameters. The results show that 72%, and 65% of acidification and eutrophication potentials are produced during the operational phase of the neighborhood. In the case of sustainable neighborhoods, the acidification potential is 22.1% higher in the 10 top low-income countries than in the 10 top high-income countries. At the neighborhood scale, the main eutrophication potential component is water (34.2%), while the main source of acidification potential is electricity production (45.1%).
1. Introduction
In recent years, large-scale growth of the pollution rate in the world has been noticed. This has led many researchers to focus on finding solutions to reduce environmental pollution [1]. These solutions, which are the result of differences between different political systems, wider problems such as diffuse pollution, loss of biodiversity, acidification and eutrophication have caused huge losses for humanity [1]. Generally, there are no products whose environmental impact is zero. Environmental impacts primarily affect air quality, water quality, resources and human health [1].
The protection of ecosystems is a requirement that will be imposed on building designers. The emissions coming from the building sector, transportation and industry affect the environment. One of the fundamental steps in environmental assessment is determining the nature, intensity, extent and duration of all pollution impacts attributed to buildings [1,2]. All different impacts, such as greenhouse gas, acidification and eutrophication, do not have the same damage to the environment. Indeed, some of them are more harmful and destructive than others. Eutrophication occurs when a body of water receives an excessive nutrient load, particularly phosphorus and nitrogen [2]. This often results in an overgrowth of algae. As the algae die and decompose, oxygen is depleted from the water, and this lack of oxygen in the water causes the death of aquatic animals, such as fish [3].The eutrophication sources are multiple and can give rise to complex interactive situations depending on various factors (phosphorus, nitrates, temperature, morphological functioning of the media, flow, etc.). The eutrophication degree describes the trophic (agronomic or ecological) status of a terrestrial or aquatic environment or an agro-environment where living things are exposed to “excess” [4]. The biodiversity of eutrophication-depleted environments is losing its richness, impacting non-aquatic wildlife and humans [4].
Acidification is defined as emissions which increase acidity concentration (lower potential of hydrogen) of water and soils. Acidification is the result of atmospheric pollution resulting from nitrogen, sulfur in the form of nitrogen oxides (NOx) or ammonia [4]. Acidification is one of the important contemporary environmental hazards at the global scale that directly affects the ecosystem [5]. Acid rain is essentially composed of sulfur dioxide (SO2) and NOx that can lead to the death of some species. It does major damage to buildings [5]. The higher the value of acidification, the more the environmental damages are important. Bouwman and Vuuren [6] explained that today, the load of acidification and eutrophication reach 6–15% and 7–18% of the total area of the natural ecosystem. Several studies, such as Heijung et al. [7], showed that the acidification potential varies with atmospheric environments and also regional characteristics. Seppälä et al. [8] suggested one of the main indicators in life-cycle analysis applications for studying a site dependent on acidification and terrestrial eutrophication.
Wei-Jun Cai et al. [9] showed that one of the sources of water acidification may be due to the growth of certain algae in an aquatic environment. In 2013, a study of life cycle assessment carried out by the Environmental Protection Agency (EPA) in single-family homes reported an acidification potential (AP) of 5500 kg SO2 eq. and a eutrophication potential (EP) of 320 kg PO4 eq. [10]. Other studies in the same field campaign were detailed in [11,12,13,14,15]. One of the challenges for research is to better understand the very complex synergistic effects that exist or may exist between acidification and eutrophication. Taking into account the research of Debacker [16], which focused on the study of the environmental cost in Belgium and in other countries in Europe, we have taken the reflection further by studying the case of several countries spread over all climatic zones. Urban acidification and eutrophication require more research. Most of the studies in this field focus on aquatic environments. After a certain period of use, solar panels can perhaps have a significant effect on the production of acidification and eutrophication (depending on the origin of manufacture, the type of climate and the different materials of manufacture). This area needs more research. The terrestrial environment requires advanced research. In order to carry out this study, we needed to collect the data coming from the energy mix, weather, local material of construction, etc., for each country. In this study, a technique is suggested to analyze the variation of acidification and eutrophication at the scale of neighborhoods. Eutrophication and acidification are both considerate as ecological and economic problems such as biodiversity damage, odor, waste, etc. This study allows us to know the concentration of these two impacts in a neighborhood. We are pursuing this study because we are convinced that our results will be beneficial in the future to the scientific community and to humanity. The procedures followed in this research to assess eutrophication and acidification concentrations can serve as a guide for future research in this area. Due to its numerous effects on aquatic and terrestrial environments, eutrophication and acidification can affect health (both in humans and other organisms). The consequences of eutrophication on infectious diseases are still poorly understood due to a lack of scientific work, but, above all, due to the complexity of the mechanisms underlying the epidemics. At low nutrient inputs, eutrophication promotes primary production. This can induce the expression of virulence factors by opportunistic pathogens and favor their transmission.
This study evaluates the impact of solar panels (after a few years of use) on the concentration of acidification and eutrophication at the scale of an adapted district in all climates of the world.
The method applied to assess acidification and eutrophication costs is detailed in [17]. In the research published in [17], the authors describe the methods and data used to monetize the life cycle impact assessment (LCIA) as a further development of the approach used in the global method of monetization 2012 [16]. They discuss some general changes to methods and data; for each impact category of the approach, they discuss the data and results. They focus on new developments (i.e., MMG2014) compared with MMG2012 and refer to previous studies for the details.
The purpose of this study is to assess, analyze and compare the acidification (AP) and eutrophication potentials (EP) of a neighborhood initially located in Belgium as well as the same neighborhood that has been later designed in 150 countries.
2. Materials and Methods
Overall, this research is constituted of five important steps: (1) choice and neighborhood design; (2) LCA of the selected neighborhood; (3) modelling of the same neighborhood in other countries; (4) study of the cost (acidification and eutrophication potentials) and (5) a method to reduce these two impacts. The next sections describe the neighborhood case study, the countries and databases for this research, the analysis of data and the environmental indicators, the simulation of LCA for each country, the method of calculating the environmental cost and the neighborhood improvement scenario tested.
2.1. Analysis of the Neighbourhood
In this study, just the residential section of the neighborhood was studied. The residential eco-neighborhood consists of 35,000 m2 comprising 10,000 m2 of roads, driveways and parking lots, 17,800 m2 of green space, 19,740 m2 of floor space, residence of around 219 inhabitants studied over a period of 100 years [18,19]. Other details regarding this studied neighborhood are found in [20].
2.2. Adaption of the Neighborhood
The capital of each country was selected as the adaption place of this neighborhood. We selected capitals as design places because in the majority of these countries it was recognized as the most populated place with the highest CO2 emission and energy demand. The majority of information regarding the energy mix and electricity mix comes from the International Energy Agency (IEA) database [21] and also from the Energy Information System of each country.
Some energy sources such as renewable energy, coal, gas fuel, etc., were freely selected in the simulation software. The meteorological data were downloaded with the most recent version of Meteonorm tool (version 8, Meteotest AG, Bern, Switzerland) [22]. The building materials adapted to each country are assessed under the basis of the building standard of each country [20].
We fixed 1 km as the distance of the weekly commute between home and trade; 500 m as the distance from the public transport network and the distance from the daily commute to work is on average between 5 km and 10 km [20]. The presence of bike paths and public transportation such as bus, subway and tram were taken into account [23]. A complete list of building materials is detailed in [20].
2.3. Data
2.4. Simulation Tools
In this research, we used the Pleiades software, version 4.19.1.0, Izuba, Paris France, which is divided into 6 interfaces: library, modeler, BIM, editor, results and LCA. Modeler software has as its main role to draw the building, solar masks and zoning… [29].
We used the software essentially made up of five components: generals (construction data, project library, LCA association, weather and horizon); plan; 3D and calculation [23,30,31].
Editing COMFIE-PLEIADES software (version 4.19.1, Izuba, Paris, France) is designed for making the thermal simulation of buildings [29,32]. This neighborhood was constituted of 10 blocks of which the different heating requirements are shown in Table 2.
The LCA module is required to assess the different environmental impacts [32]. This module is essentially made up of four datasets as follows:
- (i)
- DataSome data used in this study were freely selected in the Pleiades tool. They were essentially constituted of data on the structure of the building and the elements involved in thermal calculations and/or energy consumption.
- (ii)
- Software structureThe Pleiades tool has five axes:
- (a)
- Library: In this study, we set: surplus of materials at the site at 5%; default typical service life of families of element: interior and exterior doors at 30 years; global equipment at 20 years; glazing at 30 years; coating at 10 years; distance of transport: site of production towards building site at 100 km and site towards inert discharge finally of life: 20 km [23].
- (b)
- Project: Project management with structure data for any type of project and use of the building with the EQUER engine [31]. In this research, we fixed: loss of electrical network from 9% to 40% according to country. Water system yield: 80%, hot water consumption 40 L/day/person; cold water consumption 100 L/day/person; selective collection of glass: yes; sorted glass: 90%; incinerated waste: 40%; recovery to incineration: yes; substituted energy: gas or fuel oil (depending on the country); recovery yield: 80%; selective collection of paper: yes; sorted paper: 80%; distance from the site to the incinerator: 10 km; distance from the site to the recycling center: 100 km [15,33].
- (c)
- Campaign: Specific seizures PEBN E + C−;
- (d)
- Beginning the calculations and observing the results.
- (e)
- Management of the neighborhood.
The acidification potential of soils and water is evaluated by the potential of H+ ion. It is also sometimes evaluated by the ability to release an equivalent amount of SO2.The indicator is calculated as follows:
with mi: mass of (i) element emitted in kg. The eutrophication potential is:
with mi: quantity of substance i released into the air, water or soil in kg. The indicator is therefore expressed in kg of equivalents (PO4)2−.
2.5. Environmental Cost
The acidification and eutrophication quantities were translated into environmental costs, which make them comparable with each other. The cost calculation is based on the global method of monetization [16,17,20]. The Table 3 below show the conversion values of the environmental impacts of environmental costs.
2.6. Mitigation of Impacts
We also examined a scenario to reduce both environmental costs; the sustainable strategy involved using photovoltaic panels combined with mobility [18].
In the reference scenario, the total electricity was supplied from the central electricity grid of each country. In this new configuration, we have a photovoltaic system on all the roofs on the site. Installed photovoltaic panels cover a total area of 580 m2 that can yield a peak power of 82.8 kW [23,33]. The residential buildings use energy only for light and HVAC systems. The installation consists of monocrystalline photovoltaic solar panels [31]. They are oriented toward the south in the northern hemisphere and toward the north in the southern hemisphere; they are also inclined at 37° for the countries located in the temperate and cold zones and inclined at 45° for the countries located in the hot zone [33]. This allows us to have optimal inclination in all the countries. We have then performed the thermal simulation of each building and completed the final LCA of the neighborhoods [34,35,36]. A prediction of Acidification and Eutrophication is given in Table 4.
We have also examined the impact of mobility on the neighborhood’s environmental record. In our basic scenario, we considered an important use of the car for daily commuting. We recapitulated the mobility hypotheses: (i) initial scenario: 80% of the occupants commute daily in developed countries and 50% of the occupants commute daily in developing countries; the distance from home to work of 5–10 km is carried out daily by car; the distance from home to shops of 1 km is carried out weekly by car [31,33]; (ii) new scenario or “Urban Site” scenario: 100% of the occupants make the trip daily in all the countries; the distance from home to work of 2–5 km is carried out daily by bus; the distance from home to shops of 0.5–1 km is carried out weekly by bike or on foot [37]. Finally, both scenarios have been combined to obtain a mixed scenario having a significant effect on the three environmental impacts assessment [33].
3. Results and Discussion
This section presents and analyzes two environmental impacts such as acidification (AP) and eutrophication (EP) as well as their associated costs. The parameters that most influence the different environmental impacts are highlighted.
3.1. Analysis of Environmental Impacts in Different Phases of Neighbourhoods
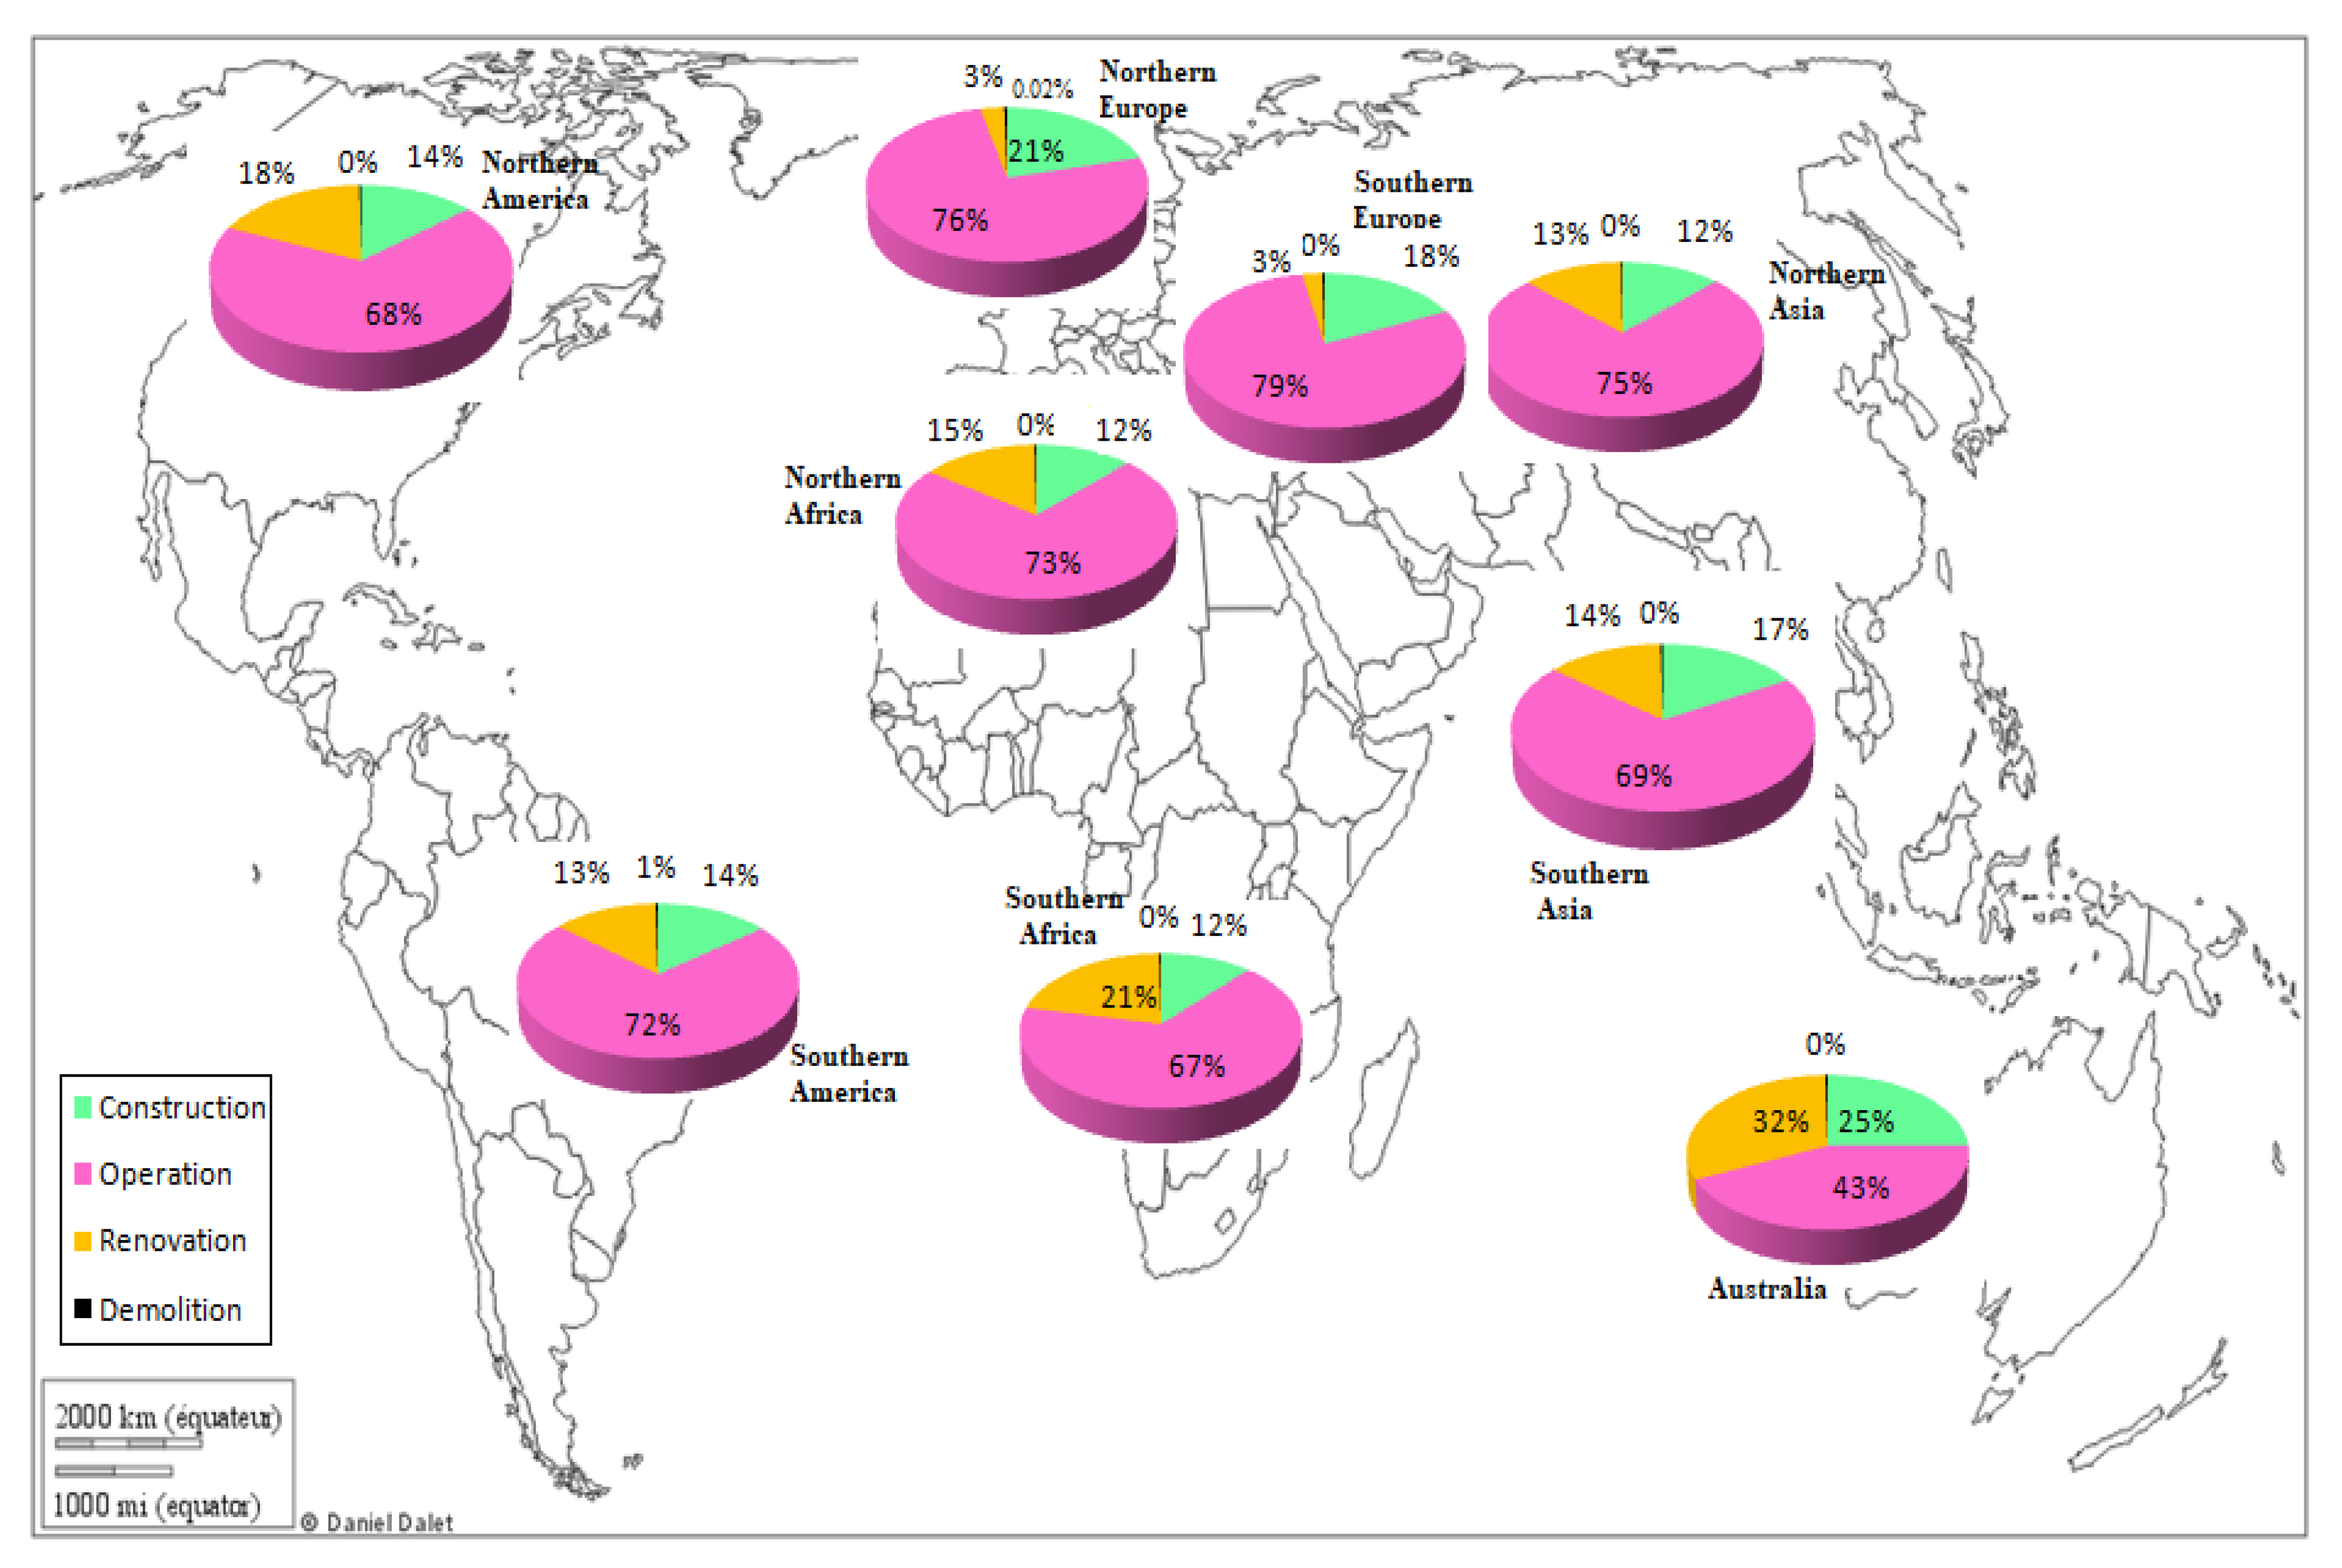
Figure 1 and Figure 2 show the results of the two environmental impact assessments of studied neighborhoods, adapted in several countries over a period of 100 years that include four different phases: (1) construction, (2) operation, (3) renovation and (4) demolition. Figure 1 shows that in America (northern and southern regions), the majority of acidification potential (the 70%, AP) are issued during the operation or use phase of the neighborhood. During the demolition phase alone, 0.51% of AP was emitted. In Europe (northern and southern parts), 77.5% of AP are generated from the operation phase of the neighborhood and only 3% during the renovation of this one. In addition, in Asia (southern and northern regions) and Africa, 72% and 70% of AP are generated, respectively, during the operation phase of building. These results suggest that, globally, in the world, in the sustainable neighborhood, the “use phase of the neighborhood” produces between 67% and 79% of AP and the construction phase of this neighborhood produced between 12% and 25%.
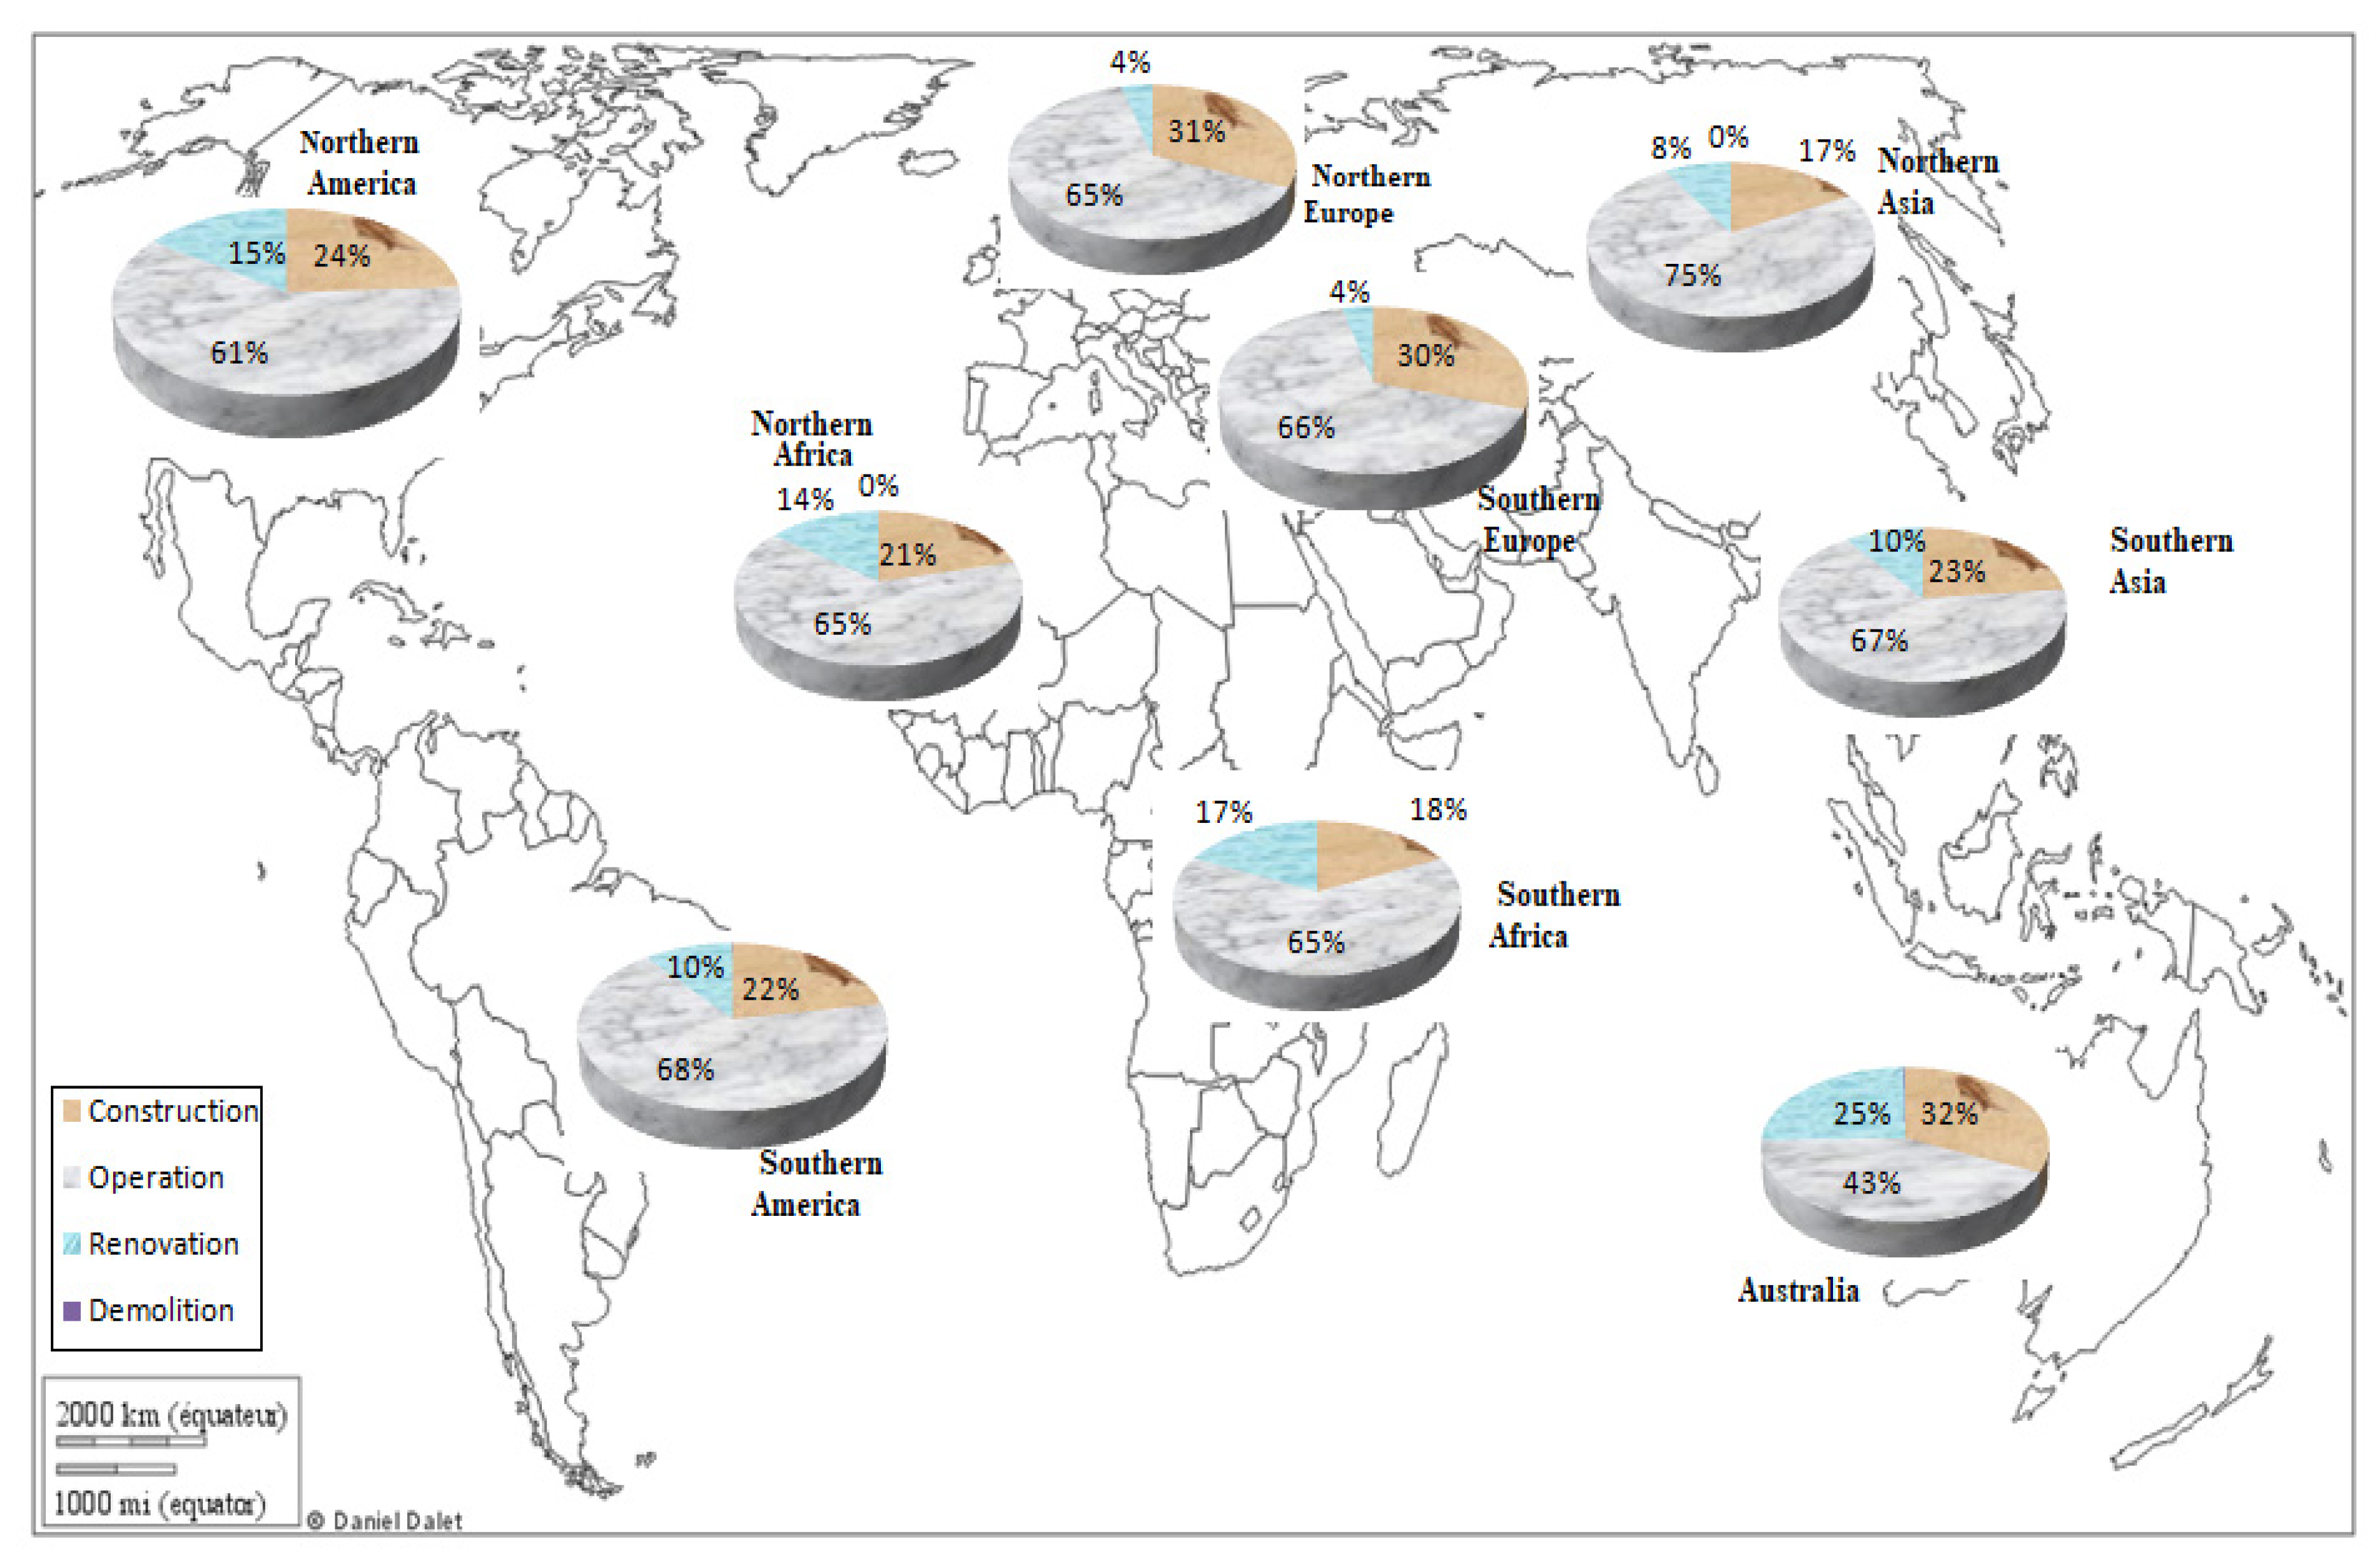
In Figure 2, it is interesting to notice that, during the neighborhood demolition phase, the EP is null. In total, 65% and 14% of total EP is rejected during the phase of use and renovation in Africa and America, respectively. On the other hand, on average, 20.0% and 30.5% are produced during the neighborhood construction phase in the countries of Europe and Asia.
Globally, the majority of two environmental impacts are produced during “utilization phase of neighborhood” and a minority during the “demolition phase of the neighborhood“. These findings confirm results found by Nematchoua et al. [33] who explained that the majority of environmental impacts are produced during the operational phase of building the neighborhood.
3.2. Analysis of Environmental Impacts per Square Meter Living Space
Figure 3 and Figure 4 show the analysis of two environmental impacts per square meter living space per year due to a neighborhood adapted in several regions in the world.
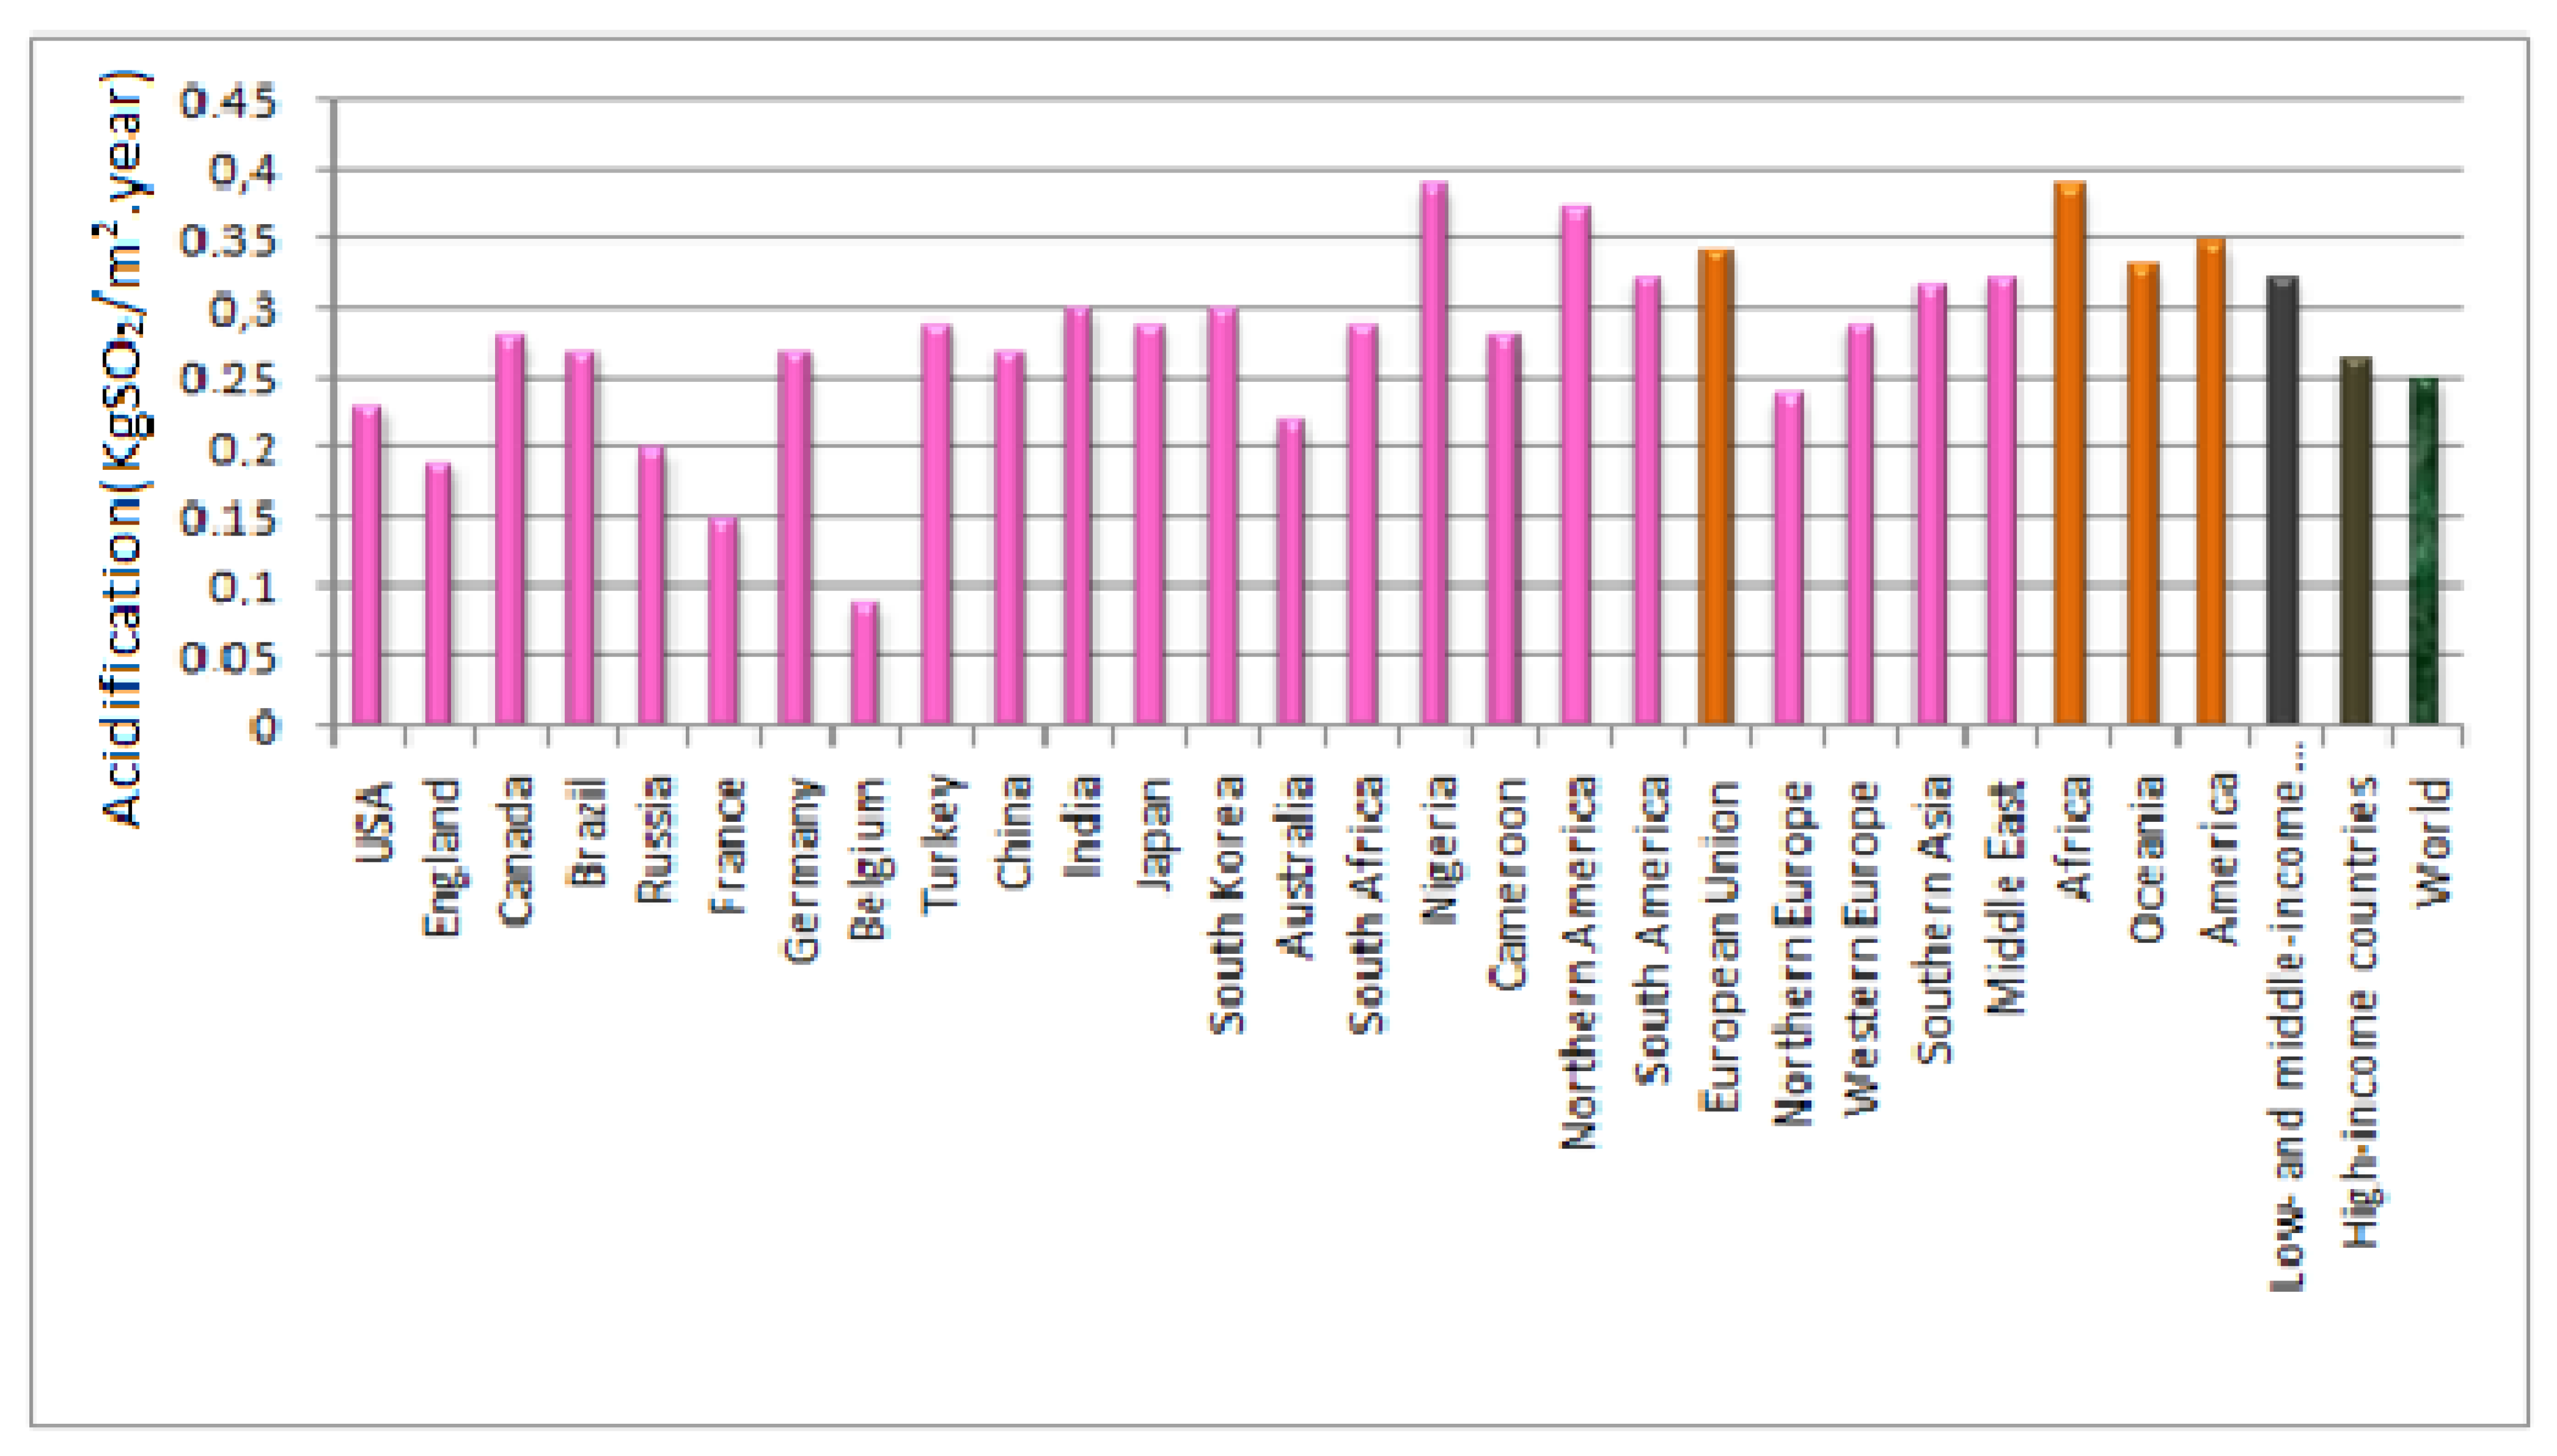
As shown in Figure 3, the average of the acidification of an eco-neighborhood (including buildings, road construction and daily mobility) located in the 150 studied countries is 0.249 kg SO2/m2. Indeed, the average acidification is 0.388 kg SO2/m2 in Africa; 0.347 kg-SO2/m2 in America and 0.340 kg-SO2/m2 in the European Union. Note that it is 0.262320 kg SO2/m2 in the high-income (top 20) countries while 0.320 kg SO2/m2, in the low-income (top 10) countries. These results show that in sustainable buildings or neighborhoods, the acidification potential is more significant in the top 10 low-income countries than the top 10 high-income countries. In addition, it is worth to note that acidification potential is more important in Africa than in America and Europe. These results are not surprising, they vary according to the environment of adaptation of the eco-neighborhood. Indeed, in low-income countries, mostly located in Africa and South America, poor maintenance of neighborhood infrastructure and poor waste management can be two of the causes.
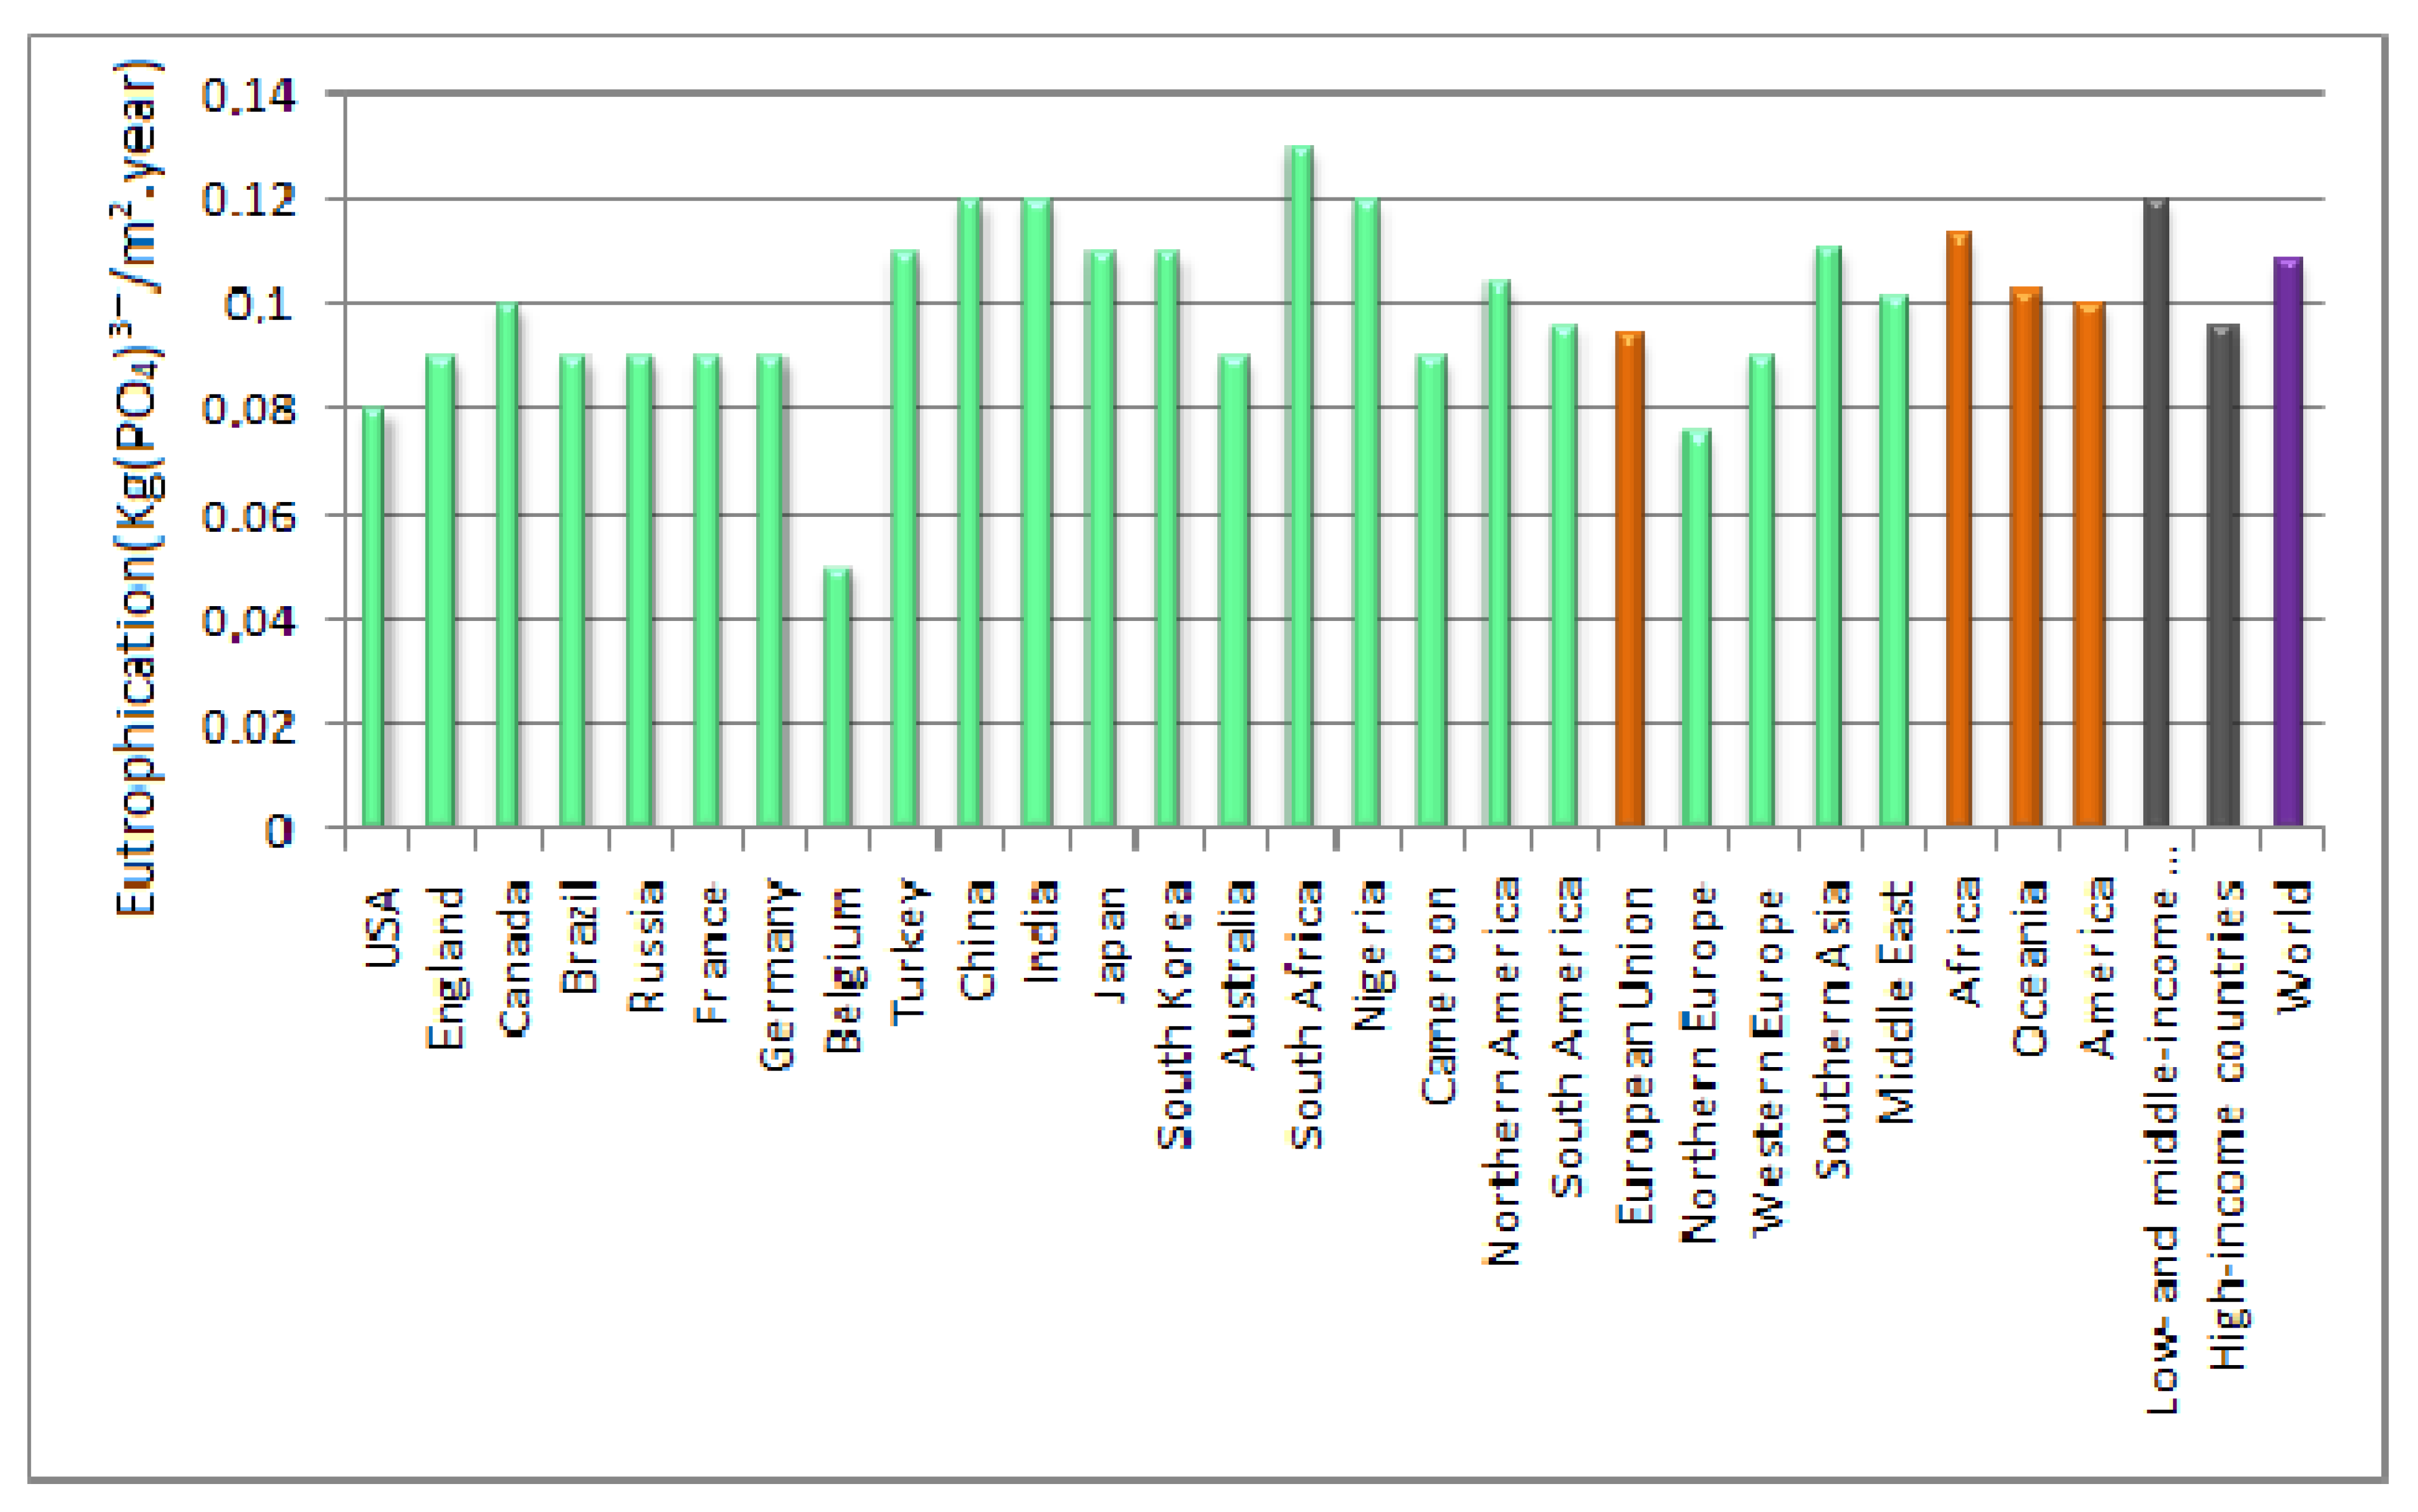
According to Figure 4, the estimated eutrophication potential (EP) values are 0.05 kg-PO4/m2 in Belgium; 0.08 kg-PO4/m2 in the USA and 0.09 kg-PO4/m2 in the UK, Brazil, Russia, France, Germany and Australia.
Globally, the EP is 13.1% lower in Europe than the average of the other 150 countries. On the other hand, the EP is 11.5% lower in the high-income countries (top 20) than the average in the studied countries. It is interesting to see that the EP is 11.0%, and 10.9% higher in China and low-income countries, respectively, than the mean in the different studied countries (see Figure 4).
3.3. Analysis of Photovoltaic Effect on Acidification and Eutrophication Potentials
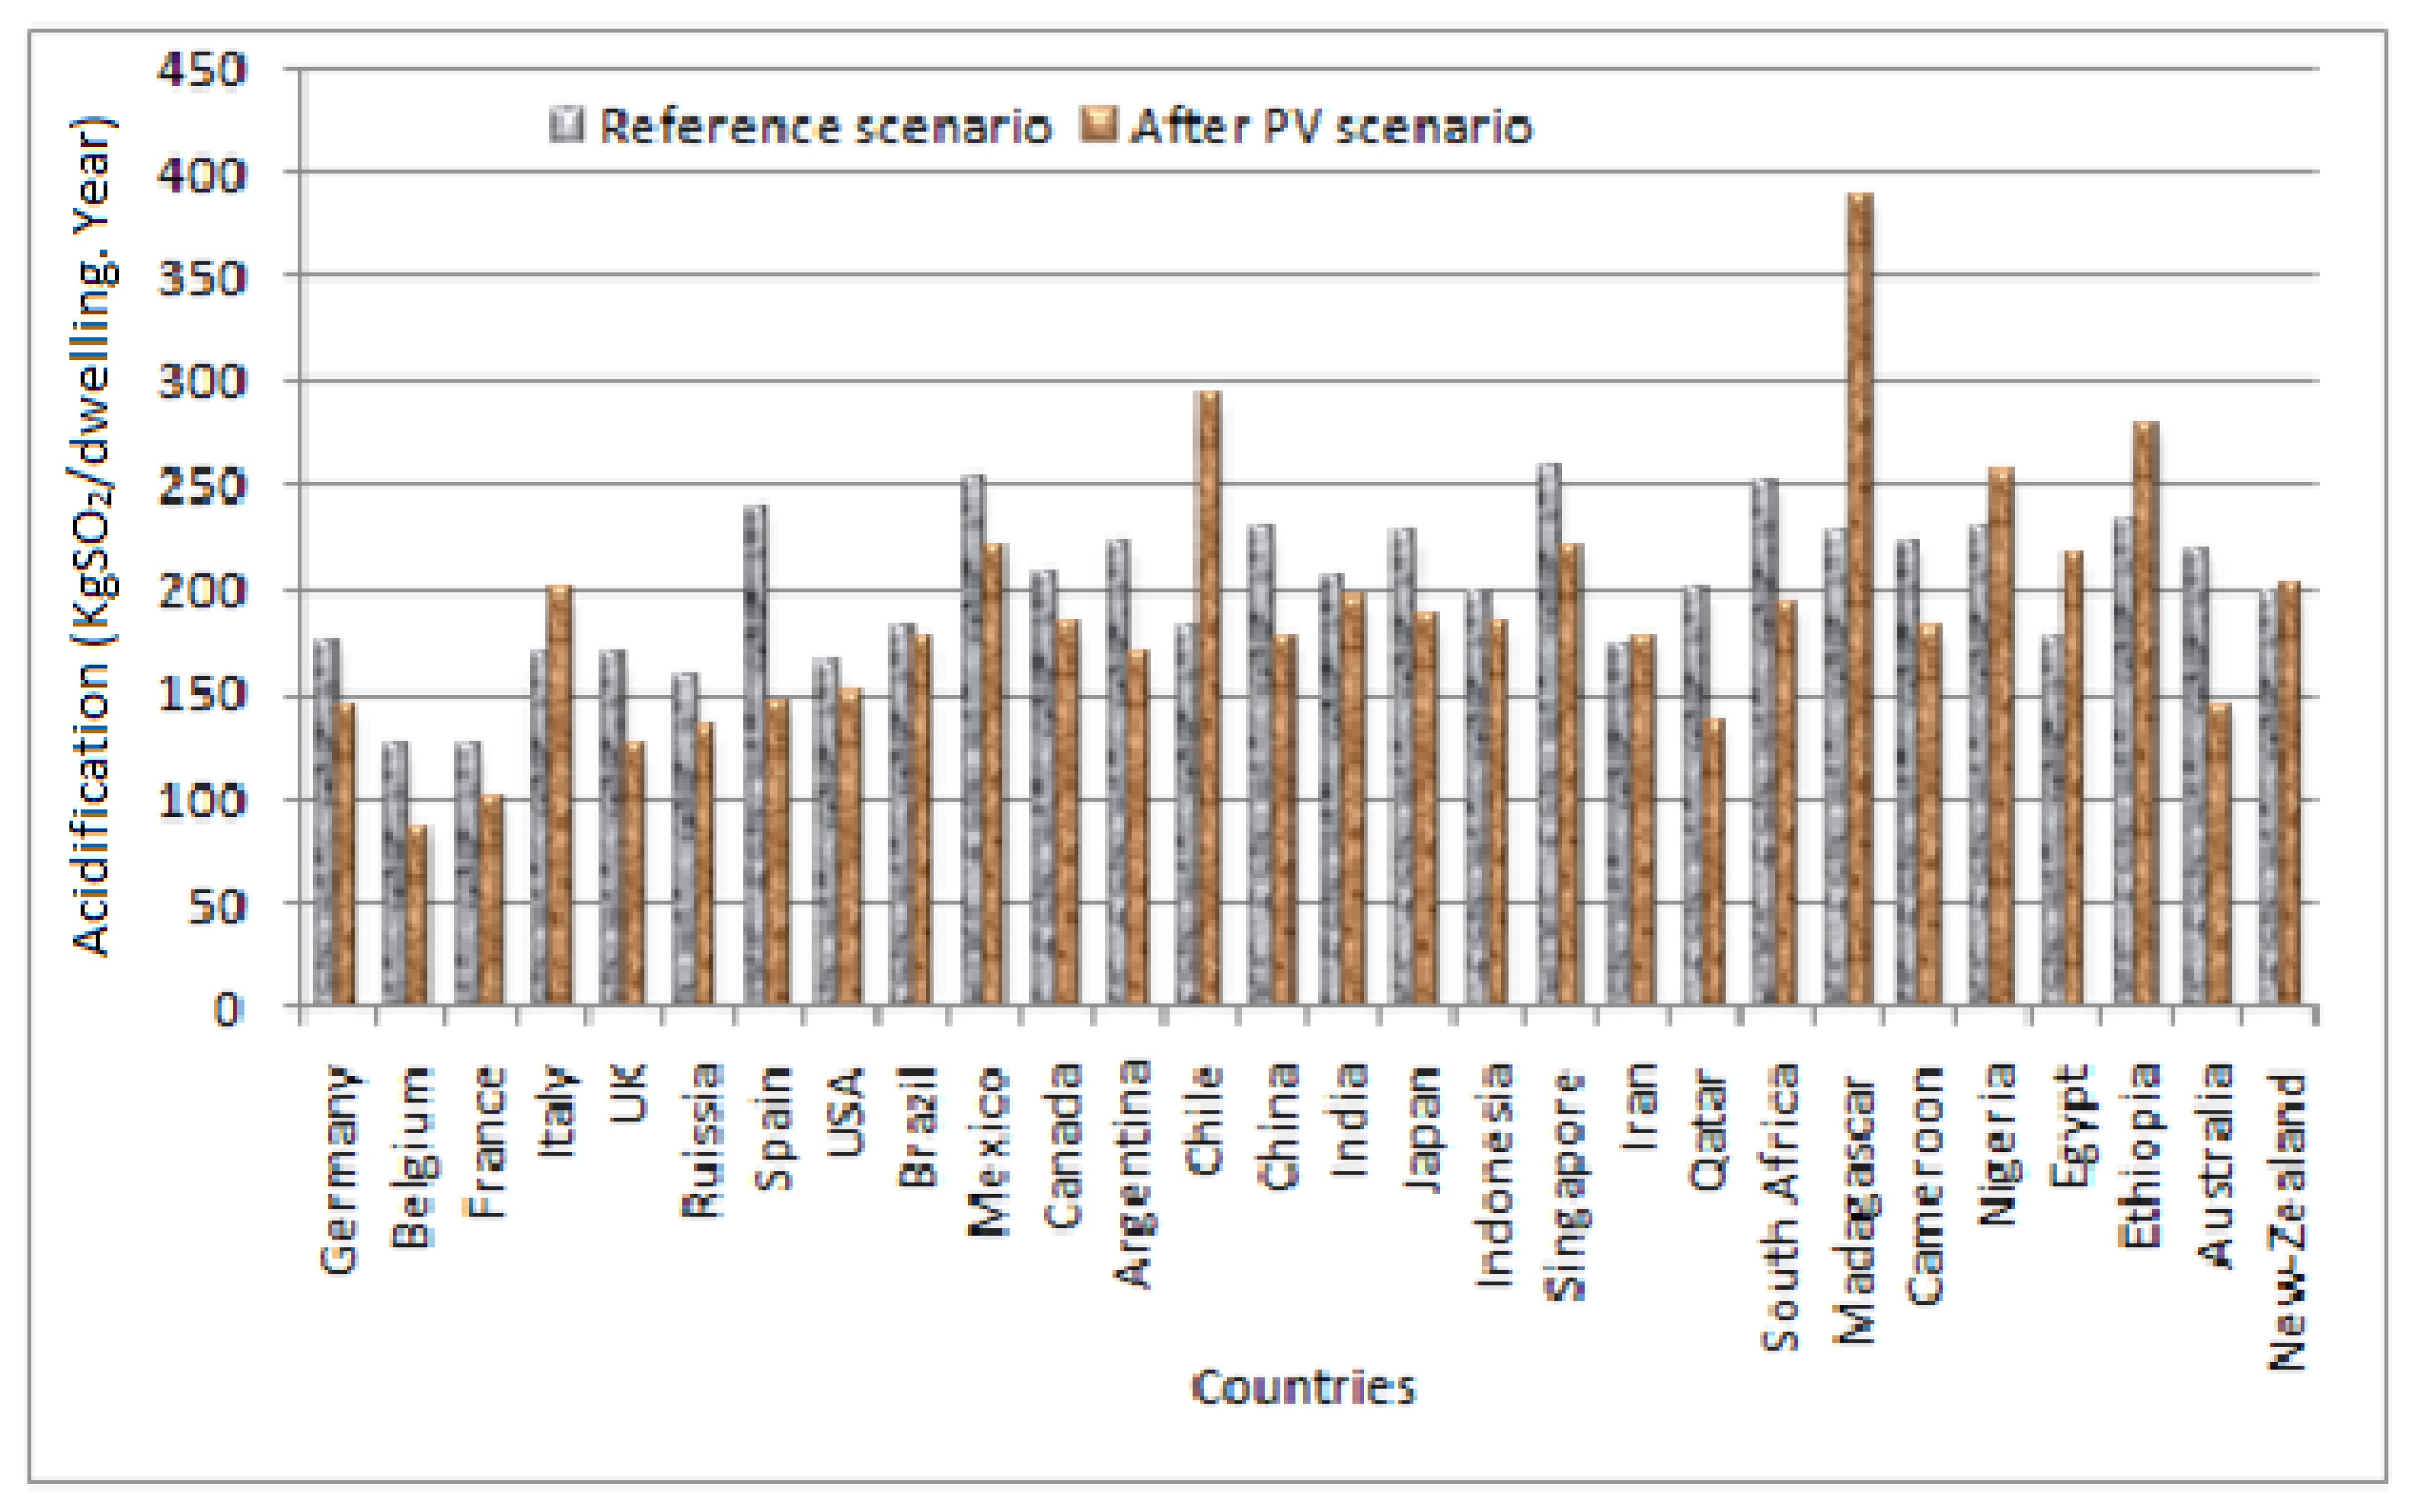
The effects of photovoltaic on the acidification and eutrophication were evaluated in this section as shown in the Figure 5 and Figure 6.
Globally, as found in Figure 5 and Figure 6, the implementation of the photovoltaic panel (PV) allows a reduction in acidification concentration of up to 6.3% at the neighborhood scale. The reduction rates are 38.6% in Spain, 15.3% in Russia, 9.17% in the USA, 22.7% in China and 11.7% in Canada. In the majority of African countries, the implementation of PV increases the acidification potential (see cases of Madagascar island, Ethiopia, Egypt, Nigeria, etc.). The results also show that the implementation of PV produces a high yield of acidification in the countries with a temperate climate, such as China, France, Belgium, UK, etc.
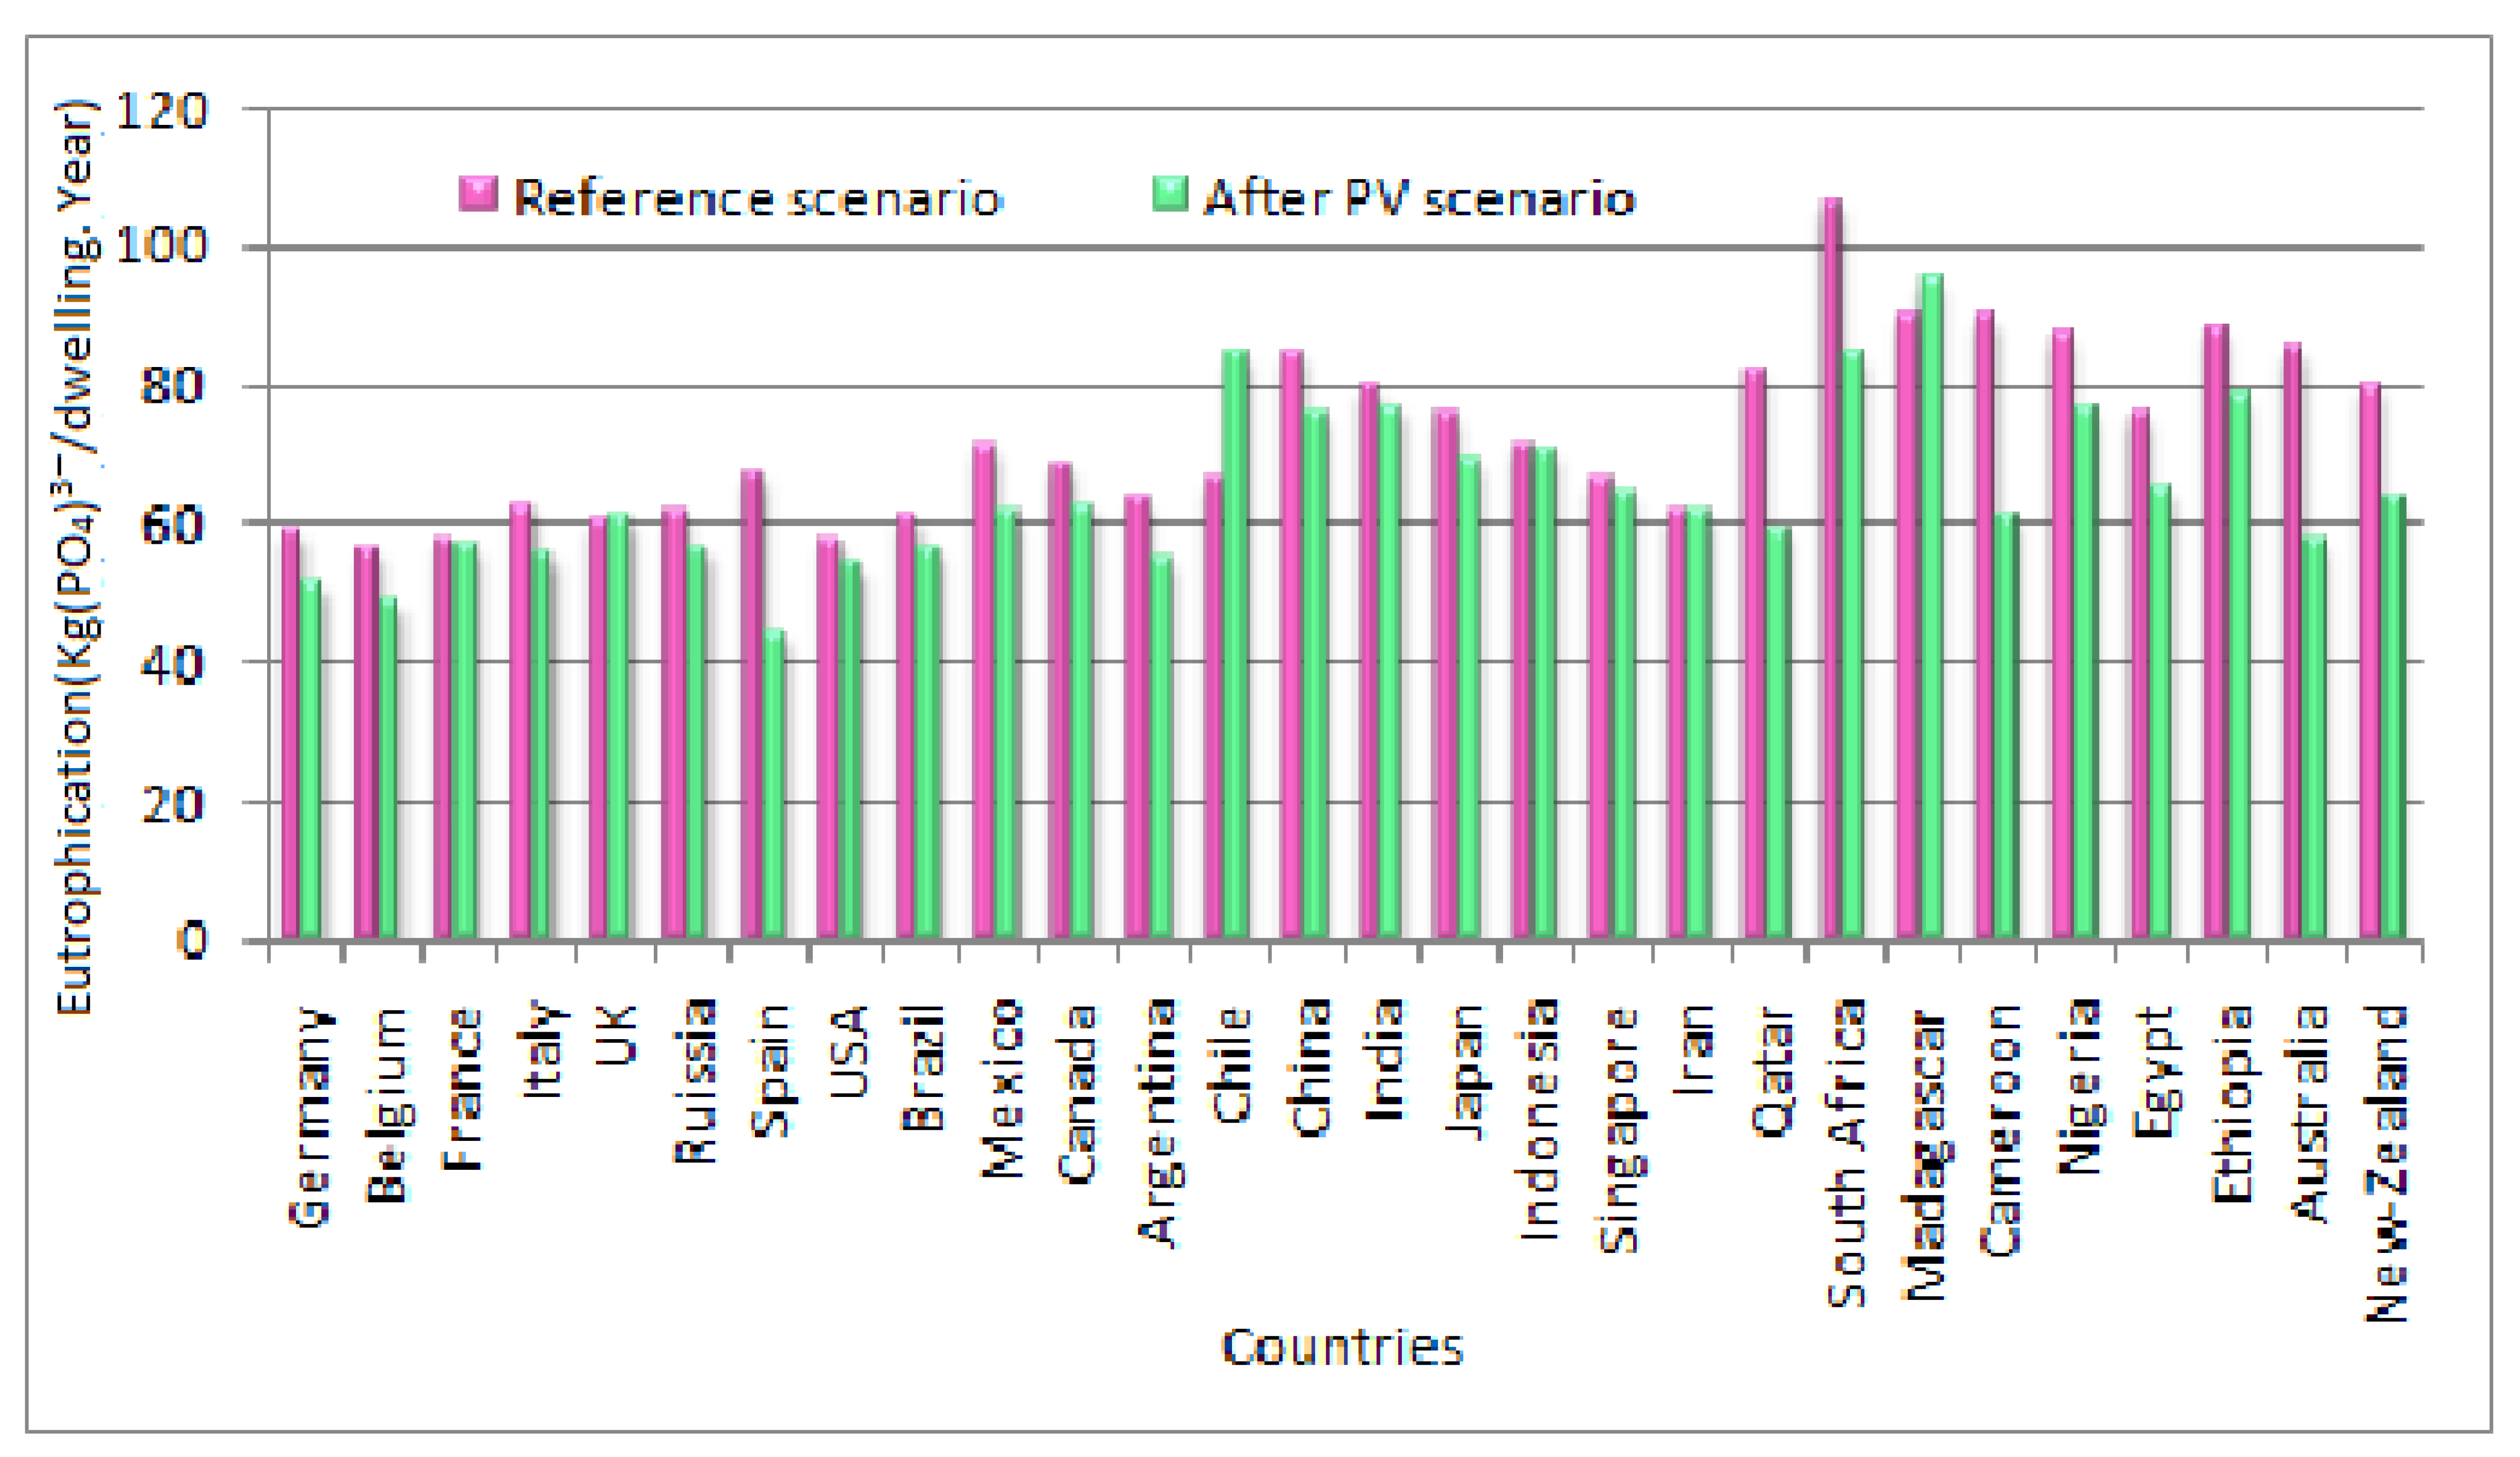
Globally, reductions in eutrophication potential are up to 10.4% with the implementation of PV (see Figure 6). EP decreases to 12.7% in Germany, 34.3% in Spain, 32.6% in Australia and 8.7% in Japan. We assess the effect of PV development in each country for EP by calculating and analyzing for each studied country the difference of EP concentration (EP rate for each country with PV installed on building roof—EP rate for each country without PV installed on building roof).
The global results show that the acidification and eutrophication potential decrease after applying the photovoltaic scenario. In addition, the yield is better intemperate climates than in tropical climate countries.
The EP reduction after installing PV can be due to many reasons: it may be because the Pleiades software which we used includes some PO4 eq. reduction due, for example, to lower emissions of NOx oxides during transport or heating, which can be changed to PO4 eq. In addition, it is noticed that the integration of PV reduces the consumption of primary energy and the quantity of radioactive waste generated, which can significantly affected the rate of acidification and eutrophication. Solar panels are composed of photovoltaic (PV) cells that convert sunlight to electricity. When these panels enter landfills, valuable resources go to waste. In addition, because solar panels contain toxic materials such as lead that can leach out as they break down, landfilling also creates new environmental hazards. This can perhaps slightly affect the concentration of eutrophication and acidification.
3.4. Environmental Components and Costs
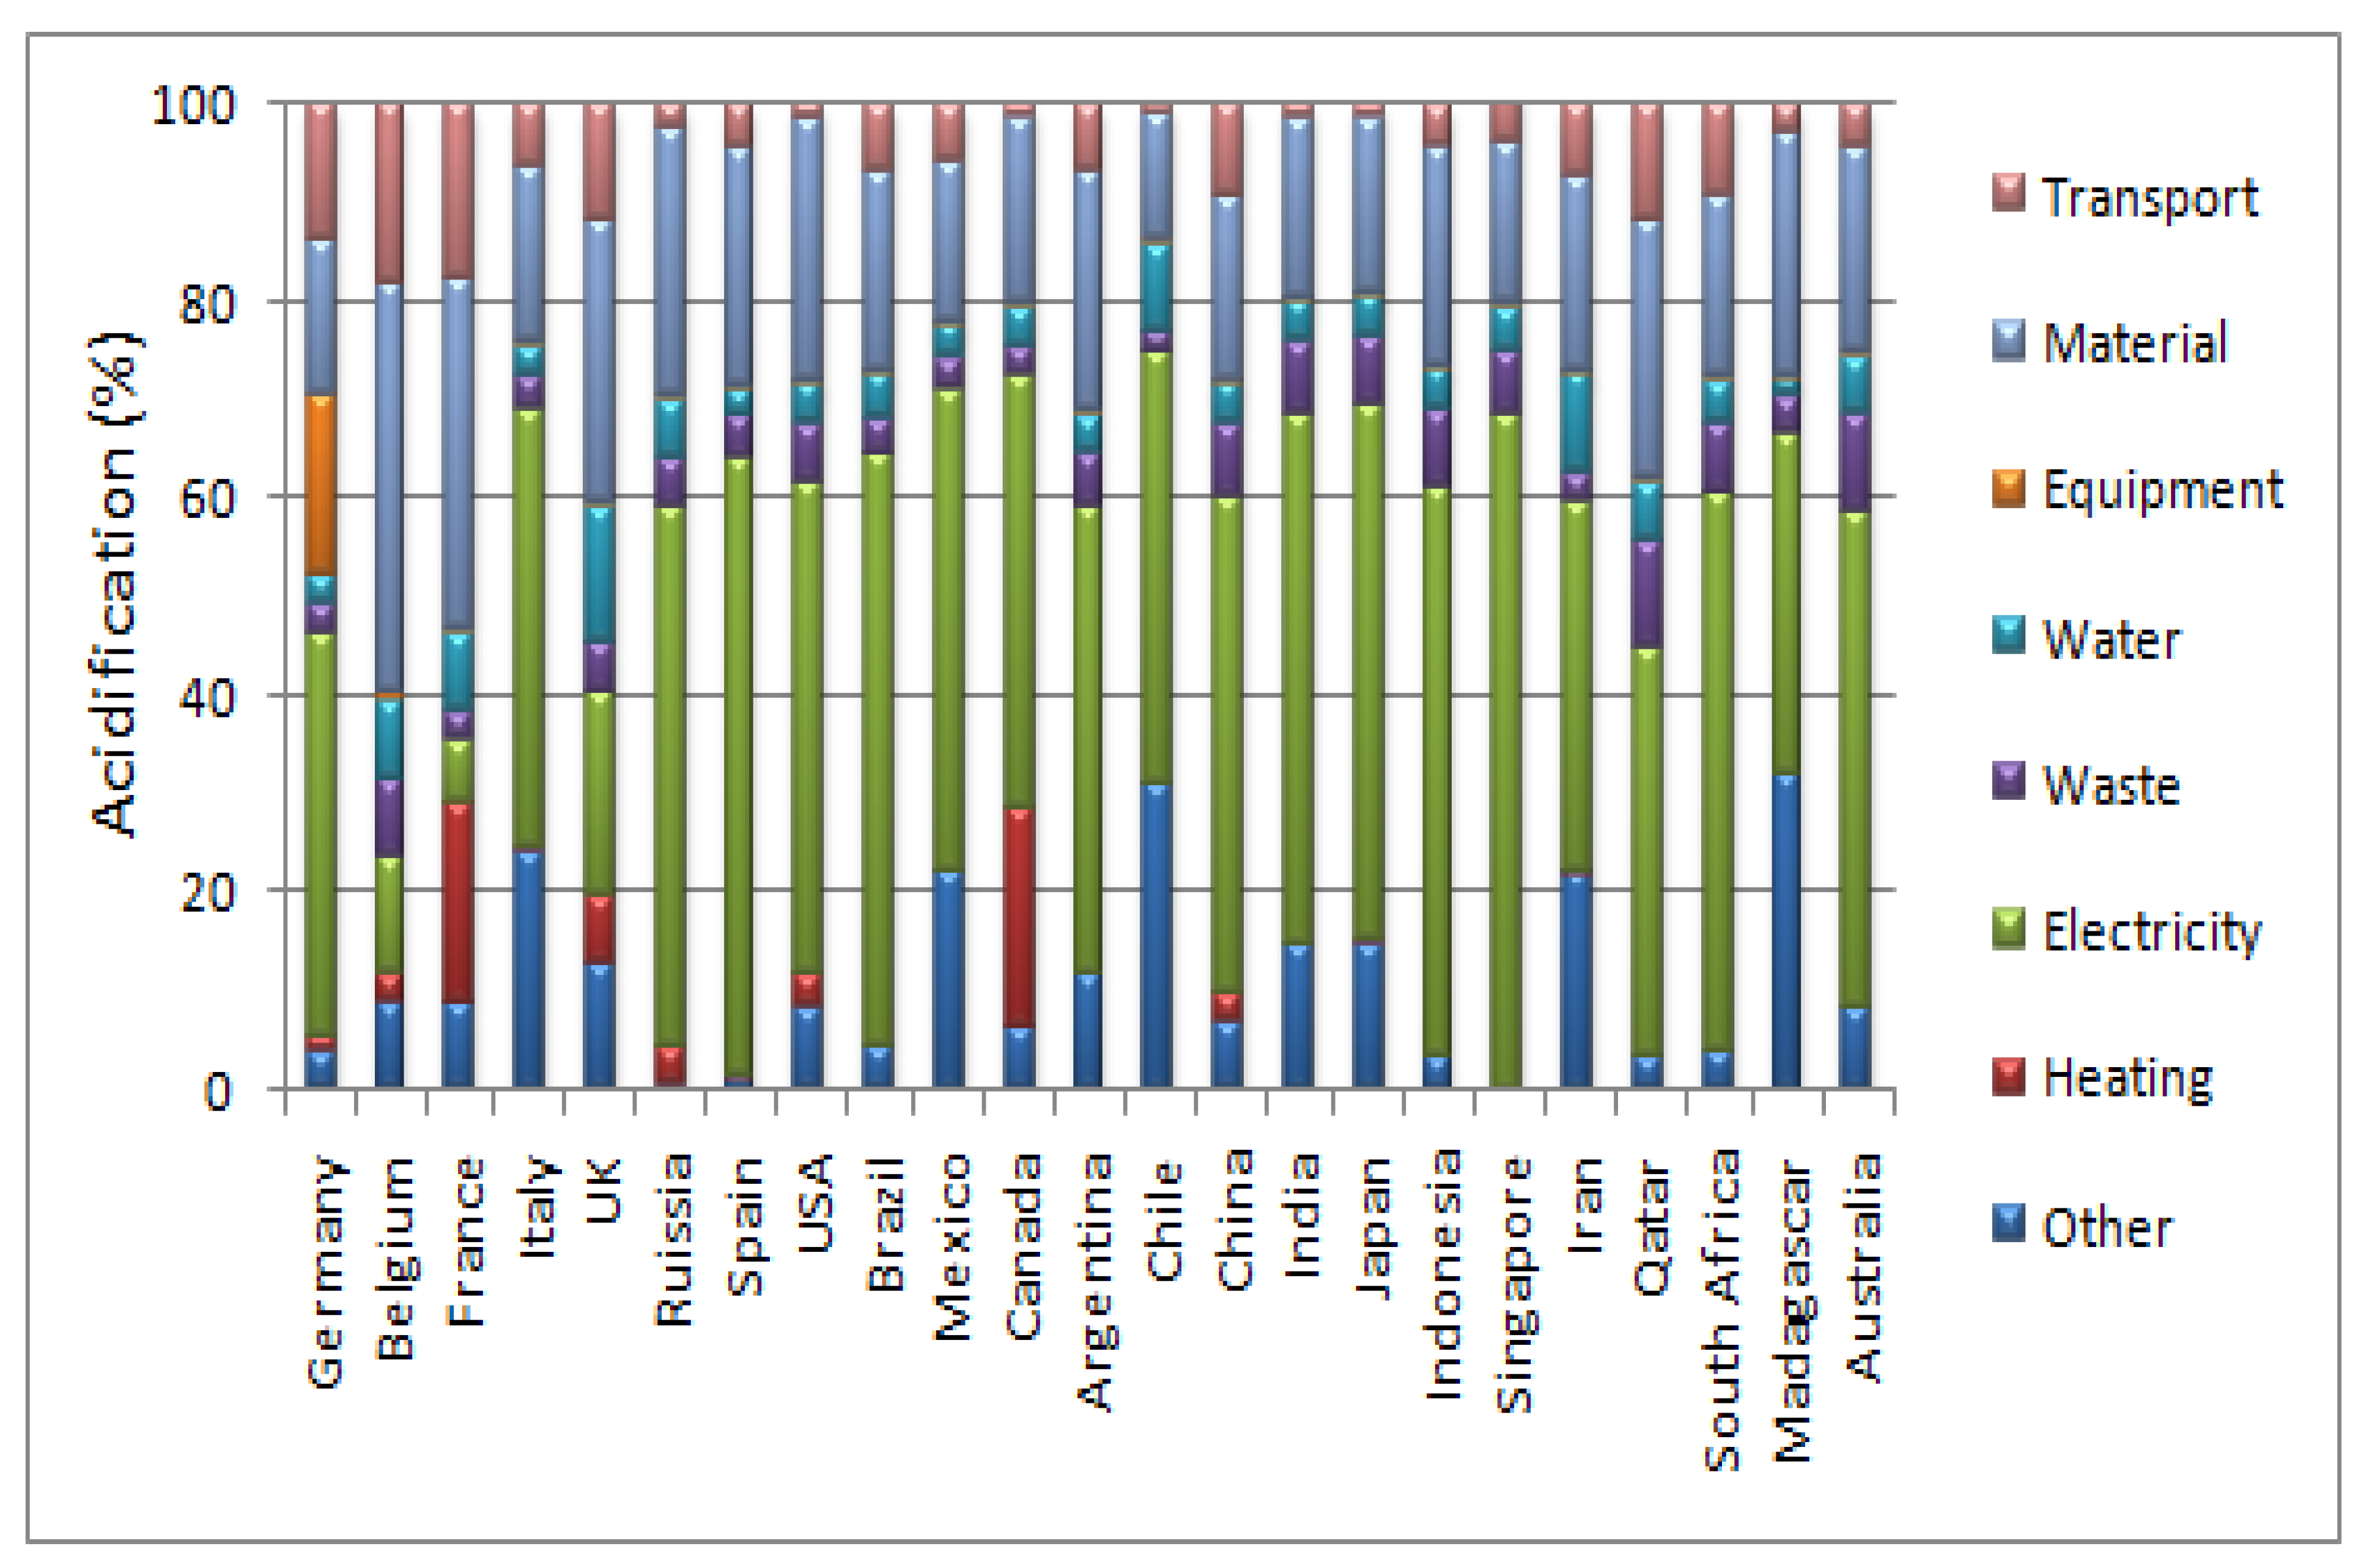
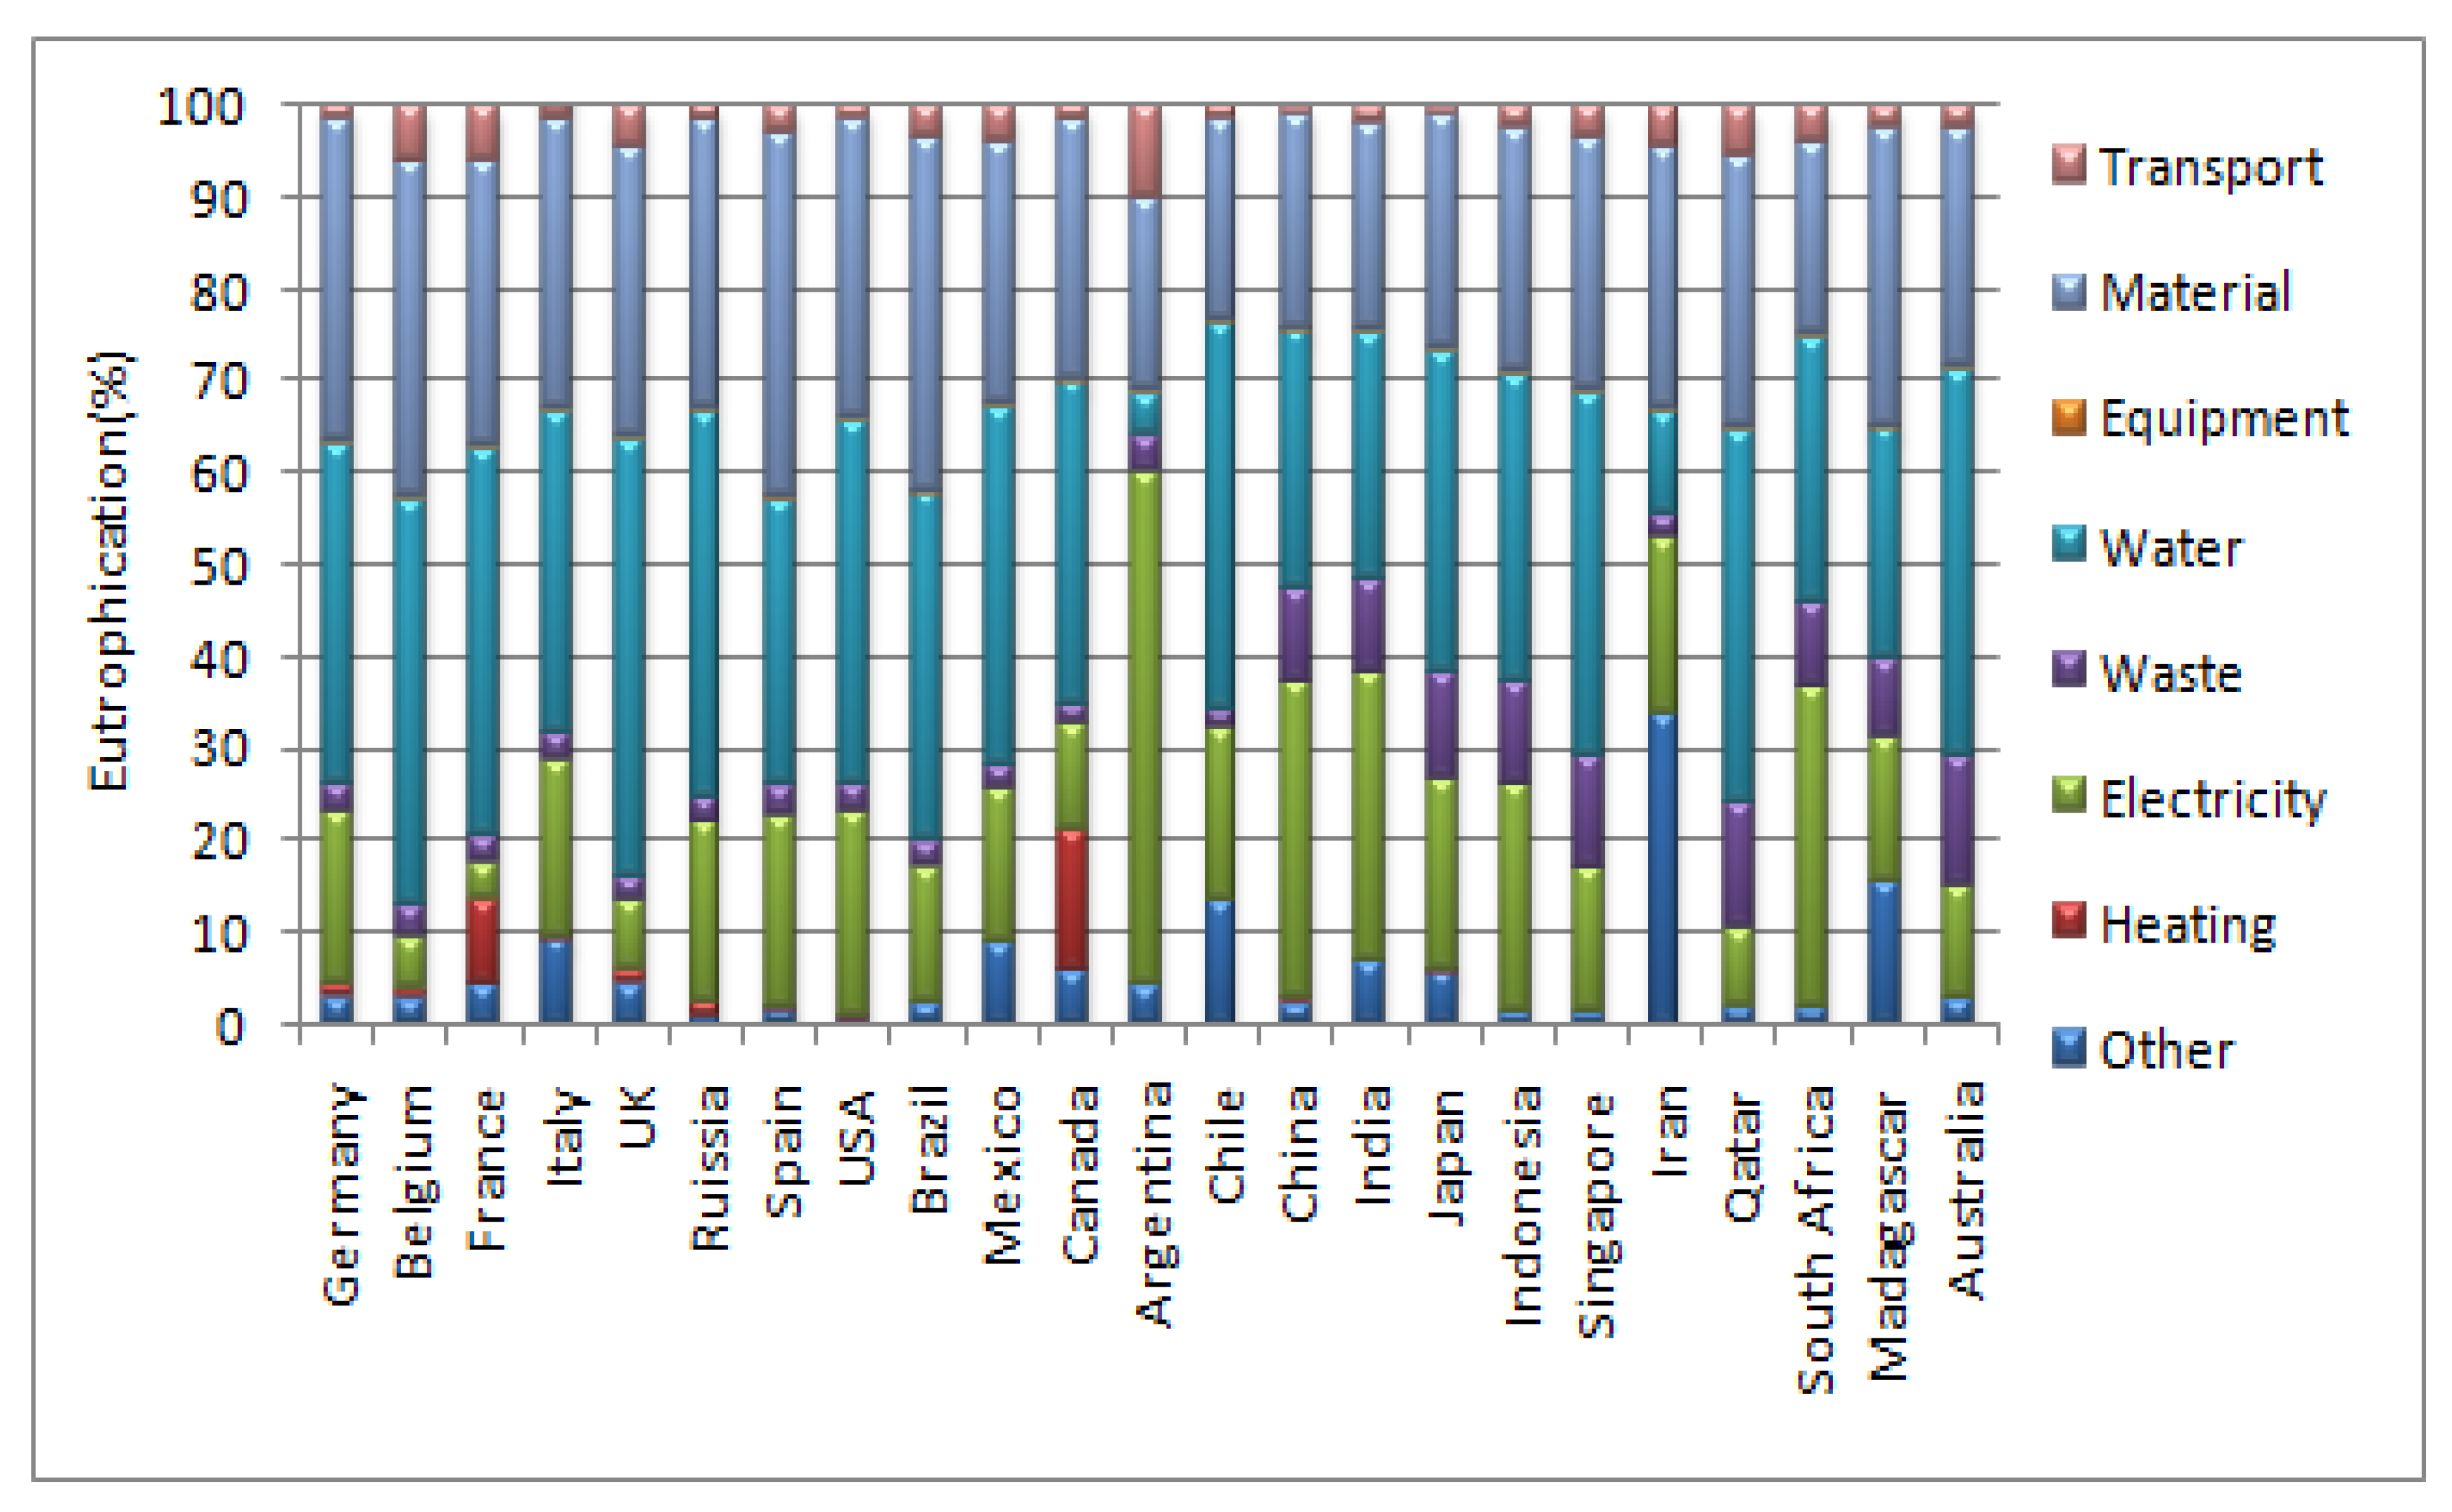
Figure 7 and Figure 8 show the frequency of the different environmental components in the generation of the acidification and eutrophication in 29 representative countries located in the five continents of the world (Europe, America, Africa, Asia and Oceania).
Globally, the results show that the main source of acidification potential in different countries “electricity production” is 45.1%. It is important to note that 22.2% and 6.9% of total (AP) emissions come from building material and transportation, respectively. Only 2.8% of the total acidification is attributed to the heating of buildings. However, in Canada and France, more than 20% of total acidification is due to the heating of buildings. According to Figure 8, the main eutrophication potential source is water (34.2%). Despite this, 28.9% and 19.6% of total (EP) emissions are attributed to building material and electricity. These results reveal that better water management is recommended to reduce the eutrophication potential in urban environments.
Table 5 shows some details of acidification and eutrophication costs in some regions. The global cost of acidification and eutrophication potentials are estimated from 2.4€/m2 and 43.3€/m2, respectively. In China, the eutrophication expenditure cost per square meter is 10.8% higher than the world mean. In the USA, acidification and eutrophication expenditure costs are 20.8% and 26.1%, respectively, lower than the world mean. In the European Union (27 countries except for the UK) and the Middle East, acidification expenditure costs are 25.0% and 12.5%, respectively, which are higher than the world mean, while eutrophication expenditure costs are 13.2% and 5.8%, respectively, which are lower than the world mean. In Africa, Oceania and America, the acidification expenditure costs are 37.5%, 16.7% and 20.8%, respectively, higher than the world mean, while eutrophication expenditure cost is 4.4% higher in Africa than the world mean, and 7.6% lower in America than this one. Some details are showed in Table 5.
Globally, acidification and eutrophication expenditure costs are 22.7% and 25.3% higher in low-income countries than high-income countries. These expenditure costs, although still neglected by public opinion, should be known to the population.
Acidification and eutrophication potentials are two impacts significantly affecting human health. Nowadays, water eutrophication is a major problem for the researchers’ of the disturbance of the ecosystem [38]. The increase in the air acidity is mainly due to SO2, NOx and HCl emissions, which, by oxidation, produce the acids HNO3 and H2SO4. In this research, we have found that 72% of acidification potential and 65% and eutrophication potentials are produced during the operational phase of neighborhoods.
These results show that the majority of these two impacts are produced during the operational phase of the neighborhood. These findings agree with some studies in the literature carried out in a more conventional neighborhoods [23].
Global acidification produces in a sustainable neighborhood 0.249 kg-SO2/m2. Indeed, this number is 28.2% higher in low-income countries than the world mean. In addition, the acidification concentration due to the sustainable neighborhood is 22.1% higher in low-income countries than high-income countries. Despite this, at the world scale, it is important to know that ocean acidification is very significant in some countries such as: US, UK, Germania, France, Chine, Australia, Canada and Japan [37]. Indeed, the pollution rate rejected in nature by the industries located in these countries is very important.
Acidification and eutrophication were showed by Hyoung and Chae [35] as the main sources of red-tide phenomena, forest destruction and air pollution. A simple case is the acidification of oceans, which refers to the gradual decline in the pH of the oceans, caused in particular by human pollution. The rate of environmental pollution is becoming more important in low-income countries with non-mastery of waste treatment techniques. This waste is for the most part thrown into the ocean. The ocean becomes more and more acidic, disrupting the ocean ecosystem in low-income countries [39,40]. A case study of the Madagascar Island in the Indian Ocean found that in recent decades the eutrophication rate considerably increased. In the case of the sustainable neighborhood, it is seen that the eutrophication concentration per square meter is 11.6% lower in high-income countries than the world mean and 20.2% lower in high-income countries than low-income countries.
Several studies focus on the effect of photovoltaic (PV) panels on the reduction in energy consumption in buildings while other studies focus on the carbon content generated by PV; in this research, it is found that the implementation of PV can have a positive effect on other environmental impacts, indeed, it allows to reduce up to 6.3% of acidification concentration and up to 10.4% of eutrophication. The analysis of the results of this research shows that the main acidification and eutrophication sources are electricity and water, respectively. The annual expense cost allocated to these two impacts is very important. The eutrophication cost assessed by the square meter in this research is estimated to be up to eighteen times higher than the acidification cost. Overall, climate change is very different from ocean acidification. Indeed, climate change is considered as the consequence of a set of greenhouse gases that make the Earth’s system retain more solar energy (global warming), while the ocean acidification is due to increased atmospheric CO2 levels dissolved in the Ocean.
4. Conclusions
This study focuses on the LCA and evaluation of the environmental costs of a sustainable neighborhood initially located in Belgium. The same neighborhood is built in 149 other countries by respecting some parameters of each country, such as the use of different materials, the heating/cooling systems, the energy mix, the buildings insulation thicknesses, mobility and the climate related to the temperatures. The EP and AP were quantified in this neighborhood as were their environmental costs. Water eutrophication due to the electricity production is the phenomenon the most met in low- and middle-income countries. The eutrophication and acidification concentration is very significant in coastal countries. The acidification and eutrophication potential due to the transportation component is known but its impact is low in the sustainable neighborhood. These two impacts, very little known to the public, are denounced and considered as one of the major sources of air pollution. This study recommends better management of industrial waste and rational planning of agricultural exploitation areas to limit or reduce the damage caused by these different impacts. The methodology used in this research is reproducible to another category of the neighborhoods. This research can serve as a guide for many environmentalists. This study should serve as a reference for all future researches that will be oriented towards this area. In future research, we are going to compare the concentration of these two environmental impacts produced by different categories of neighborhoods (Rural, urban and suburban).
Funding
This research received no external funding.
Institutional Review Board Statement
Not applicable.
Informed Consent Statement
Not applicable.
Data Availability Statement
The data of this study will be available under the request of the reader.
Conflicts of Interest
The authors declare no conflict of interest.
References
- ADEME-Agence de l’Environnement et de la Maîtrise de l’Énergie. 2020, pp. 1–10. Available online: https://www.ademe.fr/expertises/consommer-autrement/elements-contexte/impacts-environnementaux (accessed on 19 July 2020).
- Smith, V.; Tilman, G.; Nekola, J. Eutrophication: Impacts of excess nutrient inputs on freshwater, marine, and terrestrial ecosystems. Environ. Pollut. 1999, 100, 179–196. [Google Scholar] [CrossRef]
- Eutrophisation des Milieux Aquatiques. Écotoxicolog. 2012, p. 1. Available online: https://ecotoxicologie.fr/eutrophisation-milieux-aquatiques (accessed on 12 October 2020).
- Heijungs, R.; Guinée, J.B.; Huppes, G.; Lankreijer, R.M.; Udo de Haes, H.A.; Wegener Sleeswijk, A.; Ansems, A.M.M.; Egges, P.G.; van Duin, R.; de Goede, H.P. Environmental Life Cycle Assessment of Products: Guide and Backgrounds (Part 1); Centre of Environmental Science: Leiden, The Netherlands, 1992; pp. 5–8. [Google Scholar]
- Dahlgren, L.; Stripple, H.; Oliveira, F. Life Cycle Assessment: Comparative Study of Virgin Fibre Based Packaging Products with Competing Plastic Materials; IVL Swedish Environmental Research Institute: Stockholm, Sweden, 2015. [Google Scholar]
- Bouwman, A.F.; van Vuuren, D.P. Global Assessment of Acidification and Eutrophication of Natural Ecosystems; RIVM report 402001 012; National Institute of Public Health and the Environment: Bilthoven, The Netherlands, 1999; pp. 1–12. [Google Scholar]
- Nematchoua, M.K.; Nishimwe, A.M.-R.; Reiter, S. Towards Nearly Zero-Energy Residential Neighbourhoods in the European Union: A Case Study. Renew. Sustain. Energy Rev. 2021, 135, 110198. [Google Scholar] [CrossRef]
- Seppälä, J.; Posch, M.; Johansson, M.; Hettelingh, J.-P. Country-dependent Characterisation Factors for Acidification and Terrestrial Eutrophication Based on Accumulated Exceedance as an Impact Category Indicator. Int. J. Life Cycle Assess. 2006, 11, 403–416. [Google Scholar] [CrossRef]
- Cai, W.-J.; Hu, X.; Huang, W.-J.; Murrell, M.C.; Lehrter, J.C.; Lohrenz, S.E.; Chou, W.-C.; Zhai, W.; Hollibaugh, J.T.; Wang, Y.; et al. Acidification of subsur-face coastal waters enhanced by eutrophication. Nat. Geosci. 2011, 4, 766–770. [Google Scholar] [CrossRef]
- Analysis of the Life Cycle Impacts and Potential for Avoided Impacts Associated with Single-Family Homes; Environmental Protection Agency: Washington, WA, USA, 2013; 530-R-13-004J.
- Blau, S.; Seneviratne, S. Acidification and Eutrophication in Life Cycle Assessment. Ph.D. Thesis, ETH, Zürich, Switzerland, 1995; pp. 25–50. [Google Scholar]
- Finnveden, G.; Potting, J. Eutrophication—Aquatic and Terrestrial—State-of-the-Art. In International Workshop on Life Cycle Impact Assessment Sophistication; Bare, J.C., Pennington, D.W., Udo de Haes, H.A., Eds.; National Risk Management and Research Laboratory, Office of Research and Development, U.S. Environmental Protection Agency: Cincinnati, OH, USA, 2000; pp. 1–50. [Google Scholar]
- Potting, J.M.B.; Schopp, W.; Blok, K.; Hauschild, M.Z. Levels of sophistication in life cycle impact assessment of acidification: Points of discussion additional to the presentation. In International Workshop on Life Cycle Impact Assessment Sophistication; Eco-Informa Press: Bayreuth, Germany, 2000; pp. 10–20. [Google Scholar]
- Udo de Haes, H.A.; Jollier, O.; Finnveden, G.; Hauschild, M.; Krewitt, W.; Mueller-Wenk, R. Best available practice regarding impact categories and category indicators in Life Cycle Impact Assessment, Background document for the second working group on Life Cycle Impact Assessment of SETAC-Europe (WIA-2). Int. J. Life Cycle Assess. 1999, 4, 66–74. [Google Scholar] [CrossRef]
- Nematchoua, M.K.; Reiter, S. Evaluation of Bioclimatic Potential for Comfort, Energy Consumption, CO2-emission, and Life Cycle Cost of a Residential Building located in Sub-Saharan Africa; A case Study of eight countries. Solar Energy 2021, 218, 512–524. [Google Scholar] [CrossRef]
- Debacker, W.; Allacker, K.; De Troyer, F.; Janssen, A.; Delem, L.; Peeters, K.; De Nocker, L.; Spirinckx, C.; Van Dessel, J. Final Rapport (Environmental Material Performance of Building Elements Final Report). Public Waste Agency of Flanders (OVAM). pp. 11–35. Available online: http://www.ovam.be/sites/default/files/FILE1349102121400ovor121001_MMG_eindrapport.pdf (accessed on July 2014).
- De Nocker, L. VITO—Wim Debacker; VITO. Annex: Monetisation of the MMG Method (Update 2017); Danny Wille: Mechelen, Belgium, 2018; pp. 1–65. [Google Scholar]
- Teller, J.; Marique, A.F.; Loiseau, V.; Godard, F.; Delbar, C. Référentiel Quartiers Durables (Guides Méthodologiques); SPW, DGO4: Namur, Belgium, 2014; p. 1. [Google Scholar]
- Pérez, M.G.R.; Rey, E. A multi-criteria approach to compare urban renewal scenarios for an existing neighborhood. Case study in Lausanne (Switzerland). Build. Environ. 2013, 65, 58–70. [Google Scholar] [CrossRef]
- Nematchoua, M.K.; Asadi, S.; Reiter, S. Influence of Energy Mix on the Life Cycle of an Eco-Neighborhood, a Case Study of 150 Countries. Renew. Energy 2020, 162, 81–97. [Google Scholar] [CrossRef]
- Site Web of International Energy Statistics. Available online: https://www.eia.gov/beta/international/data/browser/#/?pa=0000000010000000000000000000000000000000000000000000000000u&c=ruvvvvvfvtvnvv1urvvvvfvvvvvvfvvvou20evvvvvvvvvnvvuvo&ct=0&vs=INTL.44-2-BLR-QBTU.A&ord=CR&vo=0&v=H&end=2016 (accessed on 5 July 2020).
- Remund, J.; Muller, S.; Schmutz, M.; Barsotti, D.; Studer, C.; Cattin, R. Global Meteorological Database Version 7 Software and Data for Engineers, Planers and Education; METEOTEST, Fabrikstrasse 14 CH-3012: Bern, Switzerland, 2017; pp. 1–17. [Google Scholar]
- Nematchouaa, M.K.; Teller, J.; Reiter, S. Statistical life cycle assessment of residential buildings in a temperate climate of northern part of Europe. J. Clean. Prod. 2019, 229, 621–631. [Google Scholar] [CrossRef] [Green Version]
- Peuportier, B.; Popovici, E.; Troccmé, M. Analyse du cycle de vie à l’échelle du quartier, bilan et perspectives du projet ADEQUA. Build. Environ. 2013, 3, 17. [Google Scholar]
- Ecoinvent LCI Database. Available online: https://simapro.com/databases/ecoinvent/?gclid=CjwKCAjwsdfZBRAkEiwAh2z65sg-fOlOpNksILo (accessed on 5 June 2019).
- Goedkoop, M.; Spriensma, R. The Eco-Indicator 99: A Damage Oriented Method for Life Cycle Impact Assessment; Pre Consultans B.V.: Amersfoort, The Netherlands, 2000; p. 142. [Google Scholar]
- Guinée, J.; Gorree, M.; Heijungs, R.; Kleijn, R.; de Koning, A.; van Oers, L.; Sleeswijk, A.W.; Suh, S.; Udo de Haes, H.A.; de Bruijn, H.; et al. Handbook on Life Cycle Assessment An Operational Guide to the ISO Standards; Kluwer Academic Publishers: Dordrecht, The Netherlands, 2001; p. 704. [Google Scholar]
- Byron, A. Ellis. Life Cycle Cost. 2007, pp. 2–8. Available online: http://www.barringer1.com/lcc.xls (accessed on 5 June 2019).
- Colombert, M.; De Chastenet, C.; Diab, Y.; Gobin, C.; Herfray, G.; Jarrin, T.; Trocmé, M. Analyse de cycle de vie à l’échelle du quartier: Un outil d’aide à la décision? Le cas de la ZAC Claude Bernard à Paris (France). Environ. Urbain 2011, 5, c1–c21. [Google Scholar] [CrossRef] [Green Version]
- Tokarik, M.S.; Richman, R.C. Life cycle cost optimization of passive energy efficiency improvements in a Toronto house. Energy Build. 2016, 118, 160–169. [Google Scholar] [CrossRef]
- Nematchoua, M.K.; Noelson, J.C.V.; Saadi, I.; Kenfack, H.; Andrianaharinjaka, A.-Z.F.R.; Ngoumdoum, D.F.; Sela, J.B.; Reiter, S. Application of phase change materials, thermal insulation, and external shading for thermal comfort improvement and cooling energy demand reduction in an office building under different coastal tropical climates. Solar Energy 2020, 207, 458–470. [Google Scholar]
- Salomon, T.; Mikolasek, R.; Peuportier, B. Outil de simulation thermique du bâtiment, COMFIE. Journée Themat. SFT-IBPS 2005, 1–8. [Google Scholar]
- Modeste, K.N.; Orosa, J.A.; Buratti, C.; Obonyo, E.; Rim, D.; Ricciardi, P.; Reiter, S. Comparative Analysis of Bioclimatic Zones, Energy Consumption, CO2 Emission, and Life Cycle Cost of Residential and Commercial Buildings located in a Tropical Region, A case study of the big island of Madagascar. Energy 2020, 202, 117754. [Google Scholar]
- Kameni Nematchoua, M.; Reiter, S. Analysis, reduction and comparison of the life cycle environmental costs of an eco-neighborhood in Belgium. Sustain. Cities Soc. 2019, 48, 101558. [Google Scholar] [CrossRef]
- Kameni Nematchoua, M.; Mahsan, S.; Reiter, S. Strategies and scenarios to reduce energy consumption and CO2 emission in the urban, rural and sustainable neighbourhoods. Sustain. Cities Soc. 2021, 72, 103053. [Google Scholar] [CrossRef]
- Kim, T.H.; Chae, C.U. Environmental Impact Analysis of Acidification and Eutrophication Due to Emissions from the Production of Concrete. Sustainability 2016, 8, 578. [Google Scholar] [CrossRef] [Green Version]
- Laffoley, D.; Baxter, J.M.; Turley, C.; Lagos, N.A. (Eds.) Introduction à l’Acidification de l’Océan: Ce que c’est, ce que Nous Savons et ce qui Peut Arriver; UICN: Gland, Switzerland, 2017; p. 30. [Google Scholar]
- Yang, X.; Wu, X.; Hao, H.; Hem, Z. Mechanisms and assessment of water eutrophication. J. Zhejiang Univ. Sci. B 2008, 9, 197–209. [Google Scholar] [CrossRef]
- Saini, J.; Dutta, M.; Marques, G. A comprehensive review on indoor air quality monitoring systems for enhanced public health. Sustain. Environ. Res. 2020, 30, 6. [Google Scholar] [CrossRef] [Green Version]
- Teow, Y.H.; Chong, M.T.; Ho, K.C.; Mohammad, A.W. Comparative environmental impact evaluation using life cycle assessment approach: A case study of integrated membrane-filtration system for the treatment of aerobically-digested palm oil mill effluent. Sustain. Environ. Res. 2021, 31, 15. [Google Scholar] [CrossRef]
Figure 1.
Distribution of acidification potential frequency of different phases of the sustainable neighborhood in several world regions.
Figure 1.
Distribution of acidification potential frequency of different phases of the sustainable neighborhood in several world regions.

Figure 2.
Distribution of eutrophication potential of different phases of the sustainable neighborhood in several world regions.
Figure 2.
Distribution of eutrophication potential of different phases of the sustainable neighborhood in several world regions.

Figure 3.
Assessment of acidification quantity per square meter coming from a sustainable neighborhood distributed in some countries, regions and continents in the world.
Figure 3.
Assessment of acidification quantity per square meter coming from a sustainable neighborhood distributed in some countries, regions and continents in the world.

Figure 4.
Assessment of eutrophication quantity per square meter coming from a sustainable neighborhood distributed in some countries, regions and continents in the world.
Figure 4.
Assessment of eutrophication quantity per square meter coming from a sustainable neighborhood distributed in some countries, regions and continents in the world.

Figure 5.
Comparative diagram of the acidification impact of the “Initial” and “Photovoltaic” Scenarios.
Figure 5.
Comparative diagram of the acidification impact of the “Initial” and “Photovoltaic” Scenarios.

Figure 6.
Comparative diagram of the eutrophication impact of the “Initial” and “Photovoltaic” scenarios.
Figure 6.
Comparative diagram of the eutrophication impact of the “Initial” and “Photovoltaic” scenarios.

Figure 7.
Frequency (%) of the different environmental components in the generation of the acidification for some countries located in the five continents of the world.
Figure 7.
Frequency (%) of the different environmental components in the generation of the acidification for some countries located in the five continents of the world.

Figure 8.
Frequency (%) of the different environmental components in the generation of eutrophication for some countries located in the five continents of the world.
Figure 8.
Frequency (%) of the different environmental components in the generation of eutrophication for some countries located in the five continents of the world.


Table 1.
Concentration of Acidification and Eutrophication in the reference the neighborhood.
| Environmental Indicator (CEN) | Unit | Yearly Value | Value (per m2/Year) |
|---|---|---|---|
| Acidification | Kg SO2 eq. | 860.92 | 0.09 |
| Eutrophication | Kg (PO4)3− eq. | 486.21 | 0.05 |
Table 2.
Heating requirements of different neighborhood buildings in the basic and high configuration of a floor.
Table 2.
Heating requirements of different neighborhood buildings in the basic and high configuration of a floor.
| Heating Requirements (kWh/m2 Year) | ||
|---|---|---|
| Buildings | Initial Situation | First Floor |
| A1 | 15.0 | 14.0 |
| A2 | 12.0 | 12.0 |
| A3 | 14.0 | 13.0 |
| A4 | 19.0 | 20 |
| A5 | 20.1 | 20.1 |
| A6 | 20.0 | 21.0 |
| A7 | 18.0 | 19.0 |
| A8 | 12.0 | 11.0 |
| A9 | 13.0 | 12.0 |
| A10 | 13.0 | 11.0 |
| Mean | 15.6 | 15.3 |
Table 3.
Monetary indicators for CEN indicators.
| Environmental Indicator (CEN) | Unit | Belgium (€/Unit) | Rest of World (€/Unit) |
|---|---|---|---|
| Acidification | kg SO2 eq. | 1.01 | 0.17 |
| Eutrophication | Kg (PO4)3− eq. | 40.00 | 8 |
The rest of the world monetary indicators are used as default for Western Europe and Flanders.
Table 4.
The average environmental cost of each phase of the eco-neighborhood in Belgium.
| Environmental Impacts | Year | €/Unit | Construction | Operation | Maintenance | Dismantling | Total Cost |
|---|---|---|---|---|---|---|---|
| Acidification | 2030 | €/dwelling | 448.2 | 607.1 | 66.3 | 8.8 | 1130.4 |
| €/m2 | 0.5 | 0.5 | 0.1 | 0 | 1.2 | ||
| €/inhabitant | 20.4 | 27.6 | 3.1 | 0.4 | 51.4 | ||
| 2050 | €/dwelling | 1137.8 | 1540.9 | 168.4 | 22.4 | 1620.5 | |
| €/m2 | 1.4 | 1.7 | 0.4 | 0 | 3.2 | ||
| €/inhabitant | 51.7 | 65.5 | 7.6 | 130.4 | |||
| Eutrophication | 2030 | €/dwelling | 8850.9 | 15272.4 | 1089.9 | 69.7 | 25,282.9 |
| €/m2 | 10.4 | 15.6 | 0 | 0 | 26.0 | ||
| €/inhabitant | 402.5 | 694.2 | 49.5 | 3.2 | 1149.2 | ||
| 2050 | €/dwelling | 22,467.7 | 38,768.4 | 2766.7 | 176.9 | 64,179.7 | |
| €/m2 | 26.4 | 39.6 | 0 | 0 | 66.0 | ||
| €/inhabitant | 1021.3 | 1762.2 | 125.8 | 8.1 | 2917.3 |
Table 5.
Environmental impact cost over 50 years.
| Region | Acidification (€/m2) | Eutrophication (€/m2) |
|---|---|---|
| China | 2.3 | 48.0 |
| USA | 1.9 | 32 |
| European Union | 3.0 | 37.6 |
| Middle East | 2.7 | 40.8 |
| Africa | 3.3 | 45.2 |
| Oceania | 2.8 | 40.8 |
| America | 2.9 | 40.0 |
| Low- and middle-income countries | 2.7 | 48.0 |
| High-income countries | 2.2 | 38.3 |
| World | 2.4 | 43.3 |
Publisher’s Note: MDPI stays neutral with regard to jurisdictional claims in published maps and institutional affiliations. |
© 2022 by the author. Licensee MDPI, Basel, Switzerland. This article is an open access article distributed under the terms and conditions of the Creative Commons Attribution (CC BY) license (https://creativecommons.org/licenses/by/4.0/).
Share and Cite
MDPI and ACS Style
Kameni Nematchoua, M. Strategies for Studying Acidification and Eutrophication Potentials, a Case Study of 150 Countries. J 2022, 5, 150-165. https://0-doi-org.brum.beds.ac.uk/10.3390/j5010012
AMA Style
Kameni Nematchoua M. Strategies for Studying Acidification and Eutrophication Potentials, a Case Study of 150 Countries. J. 2022; 5(1):150-165. https://0-doi-org.brum.beds.ac.uk/10.3390/j5010012
Chicago/Turabian StyleKameni Nematchoua, Modeste. 2022. "Strategies for Studying Acidification and Eutrophication Potentials, a Case Study of 150 Countries" J 5, no. 1: 150-165. https://0-doi-org.brum.beds.ac.uk/10.3390/j5010012