Association of NAFLD and Insulin Resistance with Non Metastatic Bladder Cancer Patients: A Cross-Sectional Retrospective Study

 ,
,  ,
,
Abstract
:1. Introduction
2. Methods
2.1. Study Design and Data Source
2.2. Bladder Cancer Diagnosis
2.3. Metabolic Assessment
2.4. Laboratory Data
2.5. Statistics
3. Results
3.1. Principal Characteristics of the Studied Population
3.2. Predictions
4. Discussion
5. Limitations
6. Conclusions
7. Future Directions
Author Contributions
Funding
Data Availability Statement
Conflicts of Interest
Abbreviations
| BCa | Bladder Cancer |
| NMIBC | Non Muscle-Invasive Bladder Cancer |
| MS | Metabolic Syndrome |
| T2DM | type 2 diabetes mellitus |
| IR | Insulin Resistance |
| TyG Index | Triglycerides/Glucose Index |
| NAFLD | NonAlcoholic Fatty Liver Disease |
| TURBT | Transurethral Resection of Bladder Tumor |
| IFG | Impaired Fasting Glucose |
| FPG | Fasting Plasma Glucose |
| ALP | Alkaline Phosphatase |
| IQR | Interquartile Range |
| LAD | Least Absolute Deviations |
References
- Siegel, R.L.; Miller, K.D.; Jemal, A. Cancer statistics, 2018. CA Cancer J. Clin. 2018, 68, 7–30. [Google Scholar] [CrossRef]
- Sun, M.; Trinh, Q.-D. Diagnosis and staging of bladder cancer. Hematol. Oncol. Clin. North Am. 2015, 29, 205–218. [Google Scholar] [CrossRef]
- Cantiello, F.; Cicione, A.; Salonia, A.; Autorino, R.; De Nunzio, C.; Briganti, A.; Gandaglia, G.; Dell’Oglio, P.; Capogrosso, P.; Damiano, R. Association between metabolic syndrome, obesity, diabetes mellitus and oncological outcomes of bladder cancer: A systematic review. Int. J. Urol. 2015, 22, 22–32. [Google Scholar] [CrossRef] [Green Version]
- Stocks, T.; Bjørge, T.; Ulmer, H.; Manjer, J.; Häggström, C.; Nagel, G.; Engeland, A.; Johansen, D.; Hallmans, G.; Selmer, R.; et al. Metabolic risk score and cancer risk: Pooled analysis of seven cohorts. Int. J. Epidemiol. 2015, 44, 1353–1363. [Google Scholar] [CrossRef] [Green Version]
- Montella, M.; Di Maso, M.; Crispo, A.; Grimaldi, M.; Bosetti, C.; Turati, F.; Giudice, A.; Libra, M.; Serraino, D.; La Vecchia, C.; et al. Metabolic syndrome and the risk of urothelial carcinoma of the bladder: A case-control study. BMC Cancer 2015, 15, 720. [Google Scholar] [CrossRef] [Green Version]
- Peng, X.F.; Meng, X.Y.; Wei, C.; Xing, Z.H.; Huang, J.B.; Fang, Z.F.; Hu, X.Q.; Liu, Q.M.; Zhu, Z.W.; Zhou, S.H. The association between metabolic syndrome and bladder cancer susceptibility and prognosis: An updated comprehensive evidence synthesis of 95 observational studies involving 97,795,299 subjects. Cancer Manag. Res. 2018, 10, 6263–6274. [Google Scholar] [CrossRef] [Green Version]
- Tseng, C.-H. Diabetes and risk of bladder cancer: A study using the National Health Insurance database in Taiwan. Diabetologia 2011, 54, 2009–2015. [Google Scholar] [CrossRef] [PubMed]
- Larsson, S.C.; Orsini, N.; Brismar, K.; Wolk, A. Diabetes mellitus and risk of bladder cancer: A meta-analysis. Diabetologia 2006, 49, 2819–2823. [Google Scholar] [CrossRef] [PubMed] [Green Version]
- Rousseau, M.-C.; Parent, M.-E.; Pollak, M.N.; Siemiatycki, J. Diabetes mellitus and cancer risk in a population-based case-control study among men from Montreal, Canada. Int. J. Cancer 2006, 118, 2105–2109. [Google Scholar] [CrossRef] [PubMed]
- Newton, C.C.; Gapstur, S.M.; Campbell, P.T.; Jacobs, E.J. Type 2 diabetes mellitus, insulin-use and risk of bladder cancer in a large cohort study. Int. J. Cancer 2013, 132, 2186–2191. [Google Scholar] [CrossRef] [PubMed]
- Utzschneider, K.M.; Kahn, S.E. The Role of Insulin Resistance in Nonalcoholic Fatty Liver Disease. J. Clin. Endocrinol. Metab. 2006, 91, 4753–4761. [Google Scholar] [CrossRef] [PubMed] [Green Version]
- González-Chávez, A.; Simental-Mendía, L.E.; Elizondo-Argueta, S. Elevated triglycerides/HDL-cholesterol ratio associated with insulin resistance. Cir. Cir. 2011, 79, 126–131. [Google Scholar] [PubMed]
- Yeh, W.-C.; Tsao, Y.-C.; Li, W.-C.; Tzeng, I.-S.; Chen, L.-S.; Chen, J.-Y. Elevated triglyceride-to-HDL cholesterol ratio is an indicator for insulin resistance in middle-aged and elderly Taiwanese population: A cross-sectional study. Lipids Health Dis. 2019, 18, 176. [Google Scholar] [CrossRef] [PubMed] [Green Version]
- Salazar, M.R.; Carbajal, H.A.; Espeche, W.G.; Leiva Sisnieguez, C.E.; Balbín, E.; Dulbecco, C.A.; Aizpurúa, M.; Marillet, A.G.; Reaven, G.M. Relation among the plasma triglyceride/high-density lipoprotein cholesterol concentration ratio, insulin resistance, and associated cardio-metabolic risk factors in men and women. Am. J. Cardiol. 2012, 109, 1749–1753. [Google Scholar] [CrossRef] [PubMed]
- Guerrero-Romero, F.; Simental-Mendía, L.E.; González-Ortiz, M.; Martínez-Abundis, E.; Ramos-Zavala, M.G.; Hernández-González, S.O.; Jacques-Camarena, O.; Rodríguez-Morán, M. The product of triglycerides and glucose, a simple measure of insulin sensitivity. Comparison with the euglycemic-hyperinsulinemic clamp. J. Clin. Endocrinol. Metab. 2010, 95, 3347–3351. [Google Scholar] [CrossRef] [Green Version]
- Simental-Mendía, L.E.; Simental-Mendía, E.; Rodríguez-Hernández, H.; Rodríguez-Morán, M.; Guerrero-Romero, F. The product of triglycerides and glucose as biomarker for screening simple steatosis and NASH in asymptomatic women. Ann. Hepatol. 2016, 15, 715–720. [Google Scholar]
- Kotronen, A.; Peltonen, M.; Hakkarainen, A.; Sevastianova, K.; Bergholm, R.; Johansson, L.M.; Lundbom, N.; Rissanen, A.; Ridderstråle, M.; Groop, L.; et al. Prediction of non-alcoholic fatty liver disease and liver fat using metabolic and genetic factors. Gastroenterology 2009, 137, 865–872. [Google Scholar] [CrossRef]
- American Cancer Society. Available online: https://www.cancer.org/ (accessed on 30 January 2019).
- American Diabetes Association. Classification and Diagnosis of Diabetes: Standards of Medical Care in Diabetes-2020. Diabetes Care 2020, 43, S14–S31. [Google Scholar] [CrossRef] [Green Version]
- Sorbi, D.; Boynton, J.; Lindor, K.D. The ratio of aspartate aminotransferase to alanine aminotransferase: Potential value in differentiating nonalcoholic steatohepatitis from alcoholic liver disease. Am. J. Gastroenterol. 1999, 94, 1018–1022. [Google Scholar] [CrossRef]
- Browning, J.D.; Szczepaniak, L.S.; Dobbins, R.; Nuremberg, P.; Horton, J.D.; Cohen, J.C.; Grundy, S.M.; Hobbs, H.H. Prevalence of hepatic steatosis in an urban population in the United States: Impact of ethnicity. Hepatology 2004, 40, 1387–1395. [Google Scholar] [CrossRef]
- Clark, J.M.; Brancati, F.L.; Diehl, A.M. The prevalence and etiology of elevated aminotransferase levels in the United States. Am. J. Gastroenterol. 2003, 98, 960–967. [Google Scholar] [CrossRef] [PubMed]
- Chiang, C.-L.; Huang, H.-H.; Huang, T.-Y.; Shih, Y.-L.; Hsieh, T.-Y.; Lin, H.-H. Nonalcoholic Fatty Liver Disease Associated With Bladder Cancer. Am. J. Med. Sci. 2020, 360, 161–165. [Google Scholar] [CrossRef] [PubMed]
- Golabi, P.; Paik, J.; Reddy, R.; Bugianesi, E.; Trimble, G.; Younossi, Z.M. Prevalence and long-term outcomes of non-alcoholic fatty liver disease among elderly individuals from the United States. BMC Gastroenterol. 2019, 19, 56. [Google Scholar] [CrossRef] [PubMed]
- Mari, A.; Tura, A.; Natali, A.; Laville, M.; Laakso, M.; Gabriel, R.; Beck-Nielsen, H.; Ferrannini, E. The RISC Investigators Impaired beta cell glucose sensitivity rather than inadequate compensation for insulin resistance is the dominant defect in glucose intolerance. Diabetologia 2010, 53, 749–756. [Google Scholar] [CrossRef] [PubMed] [Green Version]
- Rose, D.P.; Vona-Davis, L. The cellular and molecular mechanisms by which insulin influences breast cancer risk and progression. Endocr. Relat. Cancer 2012, 19, R225–R241. [Google Scholar] [CrossRef] [PubMed]
- Tomas, N.M.; Masur, K.; Piecha, J.C.; Niggemann, B.; Zänker, K.S. Akt and phospholipase Cγ are involved in the regulation of growth and migration of MDA-MB-468 breast cancer and SW480 colon cancer cells when cultured with diabetogenic levels of glucose and insulin. BMC Res. Notes 2012, 5, 214. [Google Scholar] [CrossRef] [Green Version]
- Runchey, S.S.; Boyko, E.J.; Ioannou, G.N.; Utzschneider, K.M. Relationship between serum circulating insulin-like growth factor-1 and liver fat in the United States. J. Gastroenterol. Hepatol. 2014, 29, 589–596. [Google Scholar] [CrossRef]
- Weroha, S.J.; Haluska, P. The insulin-like growth factor system in cancer. Endocrinol. Metab. Clin. North Am. 2012, 41, 335–350. [Google Scholar] [CrossRef] [Green Version]
- Simental-Mendía, L.E.; Guerrero-Romero, F. The correct formula for the triglycerides and glucose index. Eur. J. Pediatr. 2020, 179, 1171. [Google Scholar] [CrossRef]
- Li, C.; Ford, E.S.; Meng, Y.-X.; Mokdad, A.H.; Reaven, G.M. Does the association of the triglyceride to high-density lipoprotein cholesterol ratio with fasting serum insulin differ by race/ethnicity? Cardiovasc. Diabetol. 2008, 7, 4. [Google Scholar] [CrossRef] [Green Version]
- Staten, M.A.; Stern, M.P.; Miller, W.G.; Steffes, M.; Campbell, S.E. Insulin assay standardization: Leading to measures of insulin sensitivity and secretion for practical clinical care. Diab. Care 2010, 33, 205–206. [Google Scholar] [CrossRef] [PubMed] [Green Version]
- Gastaldelli, A.; Folli, F.; DeFronzo, R.A. The Product of Triglycerides and Glucose as index of insulin resistance. Validation in the SAM study. J. Clin. Endocrinol. Metab. 2010, 95, 3347–3351. [Google Scholar]
- Vasques, A.C.J.; Novaes, F.S.; de Oliveira, M.S.; Souza, J.R.M.; Yamanaka, A.; Pareja, J.C.; Tambascia, M.A.; Saad, M.J.A.; Geloneze, B. TyG index performs better than HOMA in a Brazilian population: A hyperglycemic clamp validated study. Diabetes Res. Clin. Pract. 2011, 93, e98–e100. [Google Scholar] [CrossRef] [PubMed] [Green Version]
- Salazar, J.; Bermúdez, V.; Calvo, M.; Olivar, L.C.; Luzardo, E.; Navarro, C.; Mencia, H.; Martínez, M.; Rivas-Ríos, J.; Wilches-Durán, S.; et al. Optimal cutoff for the evaluation of insulin resistance through triglyceride-glucose index: A cross-sectional study in a Venezuelan population. F1000Research 2018, 6, 1337. [Google Scholar] [CrossRef] [PubMed]
- Khan, S.H.; Sobia, F.; Niazi, N.K.; Manzoor, S.M.; Fazal, N.; Ahmad, F. Metabolic clustering of risk factors: Evaluation of triglyceride-glucose index (TyG index) for evaluation of insulin resistance. Diabetol. Metab. Syndr. 2018, 10, 74. [Google Scholar] [CrossRef] [Green Version]
- Simental-Mendía, L.E.; Rodríguez-Morán, M.; Guerrero-Romero, F. The product of fasting glucose and triglycerides as surrogate for identifying insulin resistance in apparently healthy subjects. Metab. Syndr. Related. Disord. 2008, 6, 299–304. [Google Scholar] [CrossRef]
- Abbasi, F.; Reaven, G.M. Comparison of two methods using plasma triglyceride concentration as a surrogate estimate of insulin action in nondiabetic subjects: Triglycerides × glucose versus triglyceride/high-density lipoprotein cholesterol. Metab. 2011, 60, 1673–1676. [Google Scholar] [CrossRef]
- Toro-Huamanchumo, C.J.; Urrunaga-Pastor, D.; Guarnizo-Poma, M.; Lazaro-Alcantara, H.; Paico-Palacios, S.; Pantoja-Torres, B.; Ranilla-Seguin, V.D.C.; Benites-Zapata, V.A. Insulin Resistance and Metabolic Syndrome Research Group Triglycerides and glucose index as an insulin resistance marker in a sample of healthy adults. Diabetes Metab. Syndr. 2019, 13, 272–277. [Google Scholar] [CrossRef]
- Lee, S.-H.; Kwon, H.-S.; Park, Y.-M.; Ha, H.-S.; Jeong, S.H.; Ha, H.S.; Jeong, S.H.; Yang, H.K.; Lee, J.-H.; Yim, H.-W.; et al. Predicting the development of diabetes using the product of triglycerides and glucose: The Chungju Metabolic Disease Cohort (CMC) study. PLoS ONE 2014, 9, e90430. [Google Scholar] [CrossRef]
- Lee, D.Y.; Lee, E.S.; Kim, J.H.; Park, S.E.; Park, C.-Y.; Oh, K.-W.; Park, S.-W.; Rhee, E.-J.; Lee, W.-Y. Predictive value of triglyceride glucose index for the risk of incident diabetes: A 4-year retrospective longitudinal study. PLoS ONE 2016, 11, e0163465. [Google Scholar] [CrossRef] [Green Version]
- Tohidi, M.; Baghbani-Oskouei, A.; Ahanchi, N.S.; Azizi, F.; Hadaegh, F. Fasting plasma glucose is a stronger predictor of diabetes than triglyceride–glucose index, triglycerides/high-density lipoprotein cholesterol, and homeostasis model assessment of insulin resistance: Tehran Lipid and Glucose Study. Acta Diabetol. 2018, 55, 1067–1074. [Google Scholar] [CrossRef] [PubMed]
- Chamroonkiadtikun, P.; Ananchaisarp, T.; Wanichanon, W. The triglyceride-glucose index, a predictor of type 2 diabetes development: A retrospective cohort study. Primary Care Diabetes 2020, 14, 161–167. [Google Scholar] [CrossRef] [PubMed]
- Sánchez-Íñigo, L.; Navarro-González, D.; Fernández-Montero, A.; Pastrana-Delgado, J.; Martínez, J.A. The TyG index may predict the development of cardiovascular events. Eur. J. Clin. Investig. 2016, 46, 189–197. [Google Scholar] [CrossRef] [PubMed]
- Kitae, A.; Hashimoto, Y.; Hamaguchi, M.; Obora, A.; Kojima, T.; Fukui, M. The Triglyceride and Glucose Index Is a Predictor of Incident Nonalcoholic Fatty Liver Disease: A Population-Based Cohort Study. Can. J. Gastroenterol. Hepatol. 2019, 2019, 5121574. [Google Scholar] [CrossRef] [PubMed] [Green Version]
- McLaughlin, T.; Reaven, G.; Abbasi, F.; Lamendola, C.; Saad, M.; Waters, D.; Simon, J.; Krauss, R.M. Is there a simple way to identify insulin-resistant individuals at increased risk of cardiovascular disease? Am. J. Cardiol. 2005, 96, 399–404. [Google Scholar] [CrossRef]
- Grimes, D.A.; Schulz, K.F. Compared to what? Finding controls for case-control studies. Lancet 2005, 365, 1429–1433. [Google Scholar] [CrossRef]
- Megwalu, I.I.; Vlahiotis, A.; Radwan, M.; Piccirillo, J.F.; Kibel, A.S. Prognostic impact of comorbidity in patients with bladder cancer. Eur. Urol. 2008, 53, 581–589. [Google Scholar] [CrossRef] [Green Version]
- Massari, F.; Ciccarese, C.; Santoni, M.; Iacovelli, R.; Mazzucchelli, R.; Piva, F.; Scarpelli, M.; Berardi, R.; Tortora, G.; Lopez-Beltran, A.; et al. Metabolic phenotype of bladder cancer. Cancer Treat. Rev. 2016, 45, 46–57. [Google Scholar] [CrossRef]
- Mastroianni, R.; Brassetti, A.; Krajewski, W.; Zdrojowy, R.; Salhi, Y.A.; Anceschi, U.; Bove, A.M.; Carbone, A.; De Nunzio, C.; Fuschi, A.; et al. Assessing the impact of the absence of detrusor muscle in Ta low-grade urothelial carcinoma of the bladder on recurrence-free survival. Eur. Urol. Focus 2020. [Google Scholar] [CrossRef]


| Variables | BCa pts | No Ca BD pts | p |
|---|---|---|---|
| Age (yrs), median (IQR) | 71.5 (64–77) | 69 (61–74) | 0.056 |
| Gender, F/M (n of pts) | 34 /170 | 10/40 | 0.58 |
| Prediabetes/T2DM (n of pts) | 48/38 out of 196 | 10/2 out of 50 | 0.024 |
| FPG mg/dL, median (IQR) | 97.5 (85-121) | 91 (81–100) | 0.0063 |
| Triglycerides mg/dL, median (IQR) | 109 (81–142) | 93 (67.5–129.5) | 0.083 |
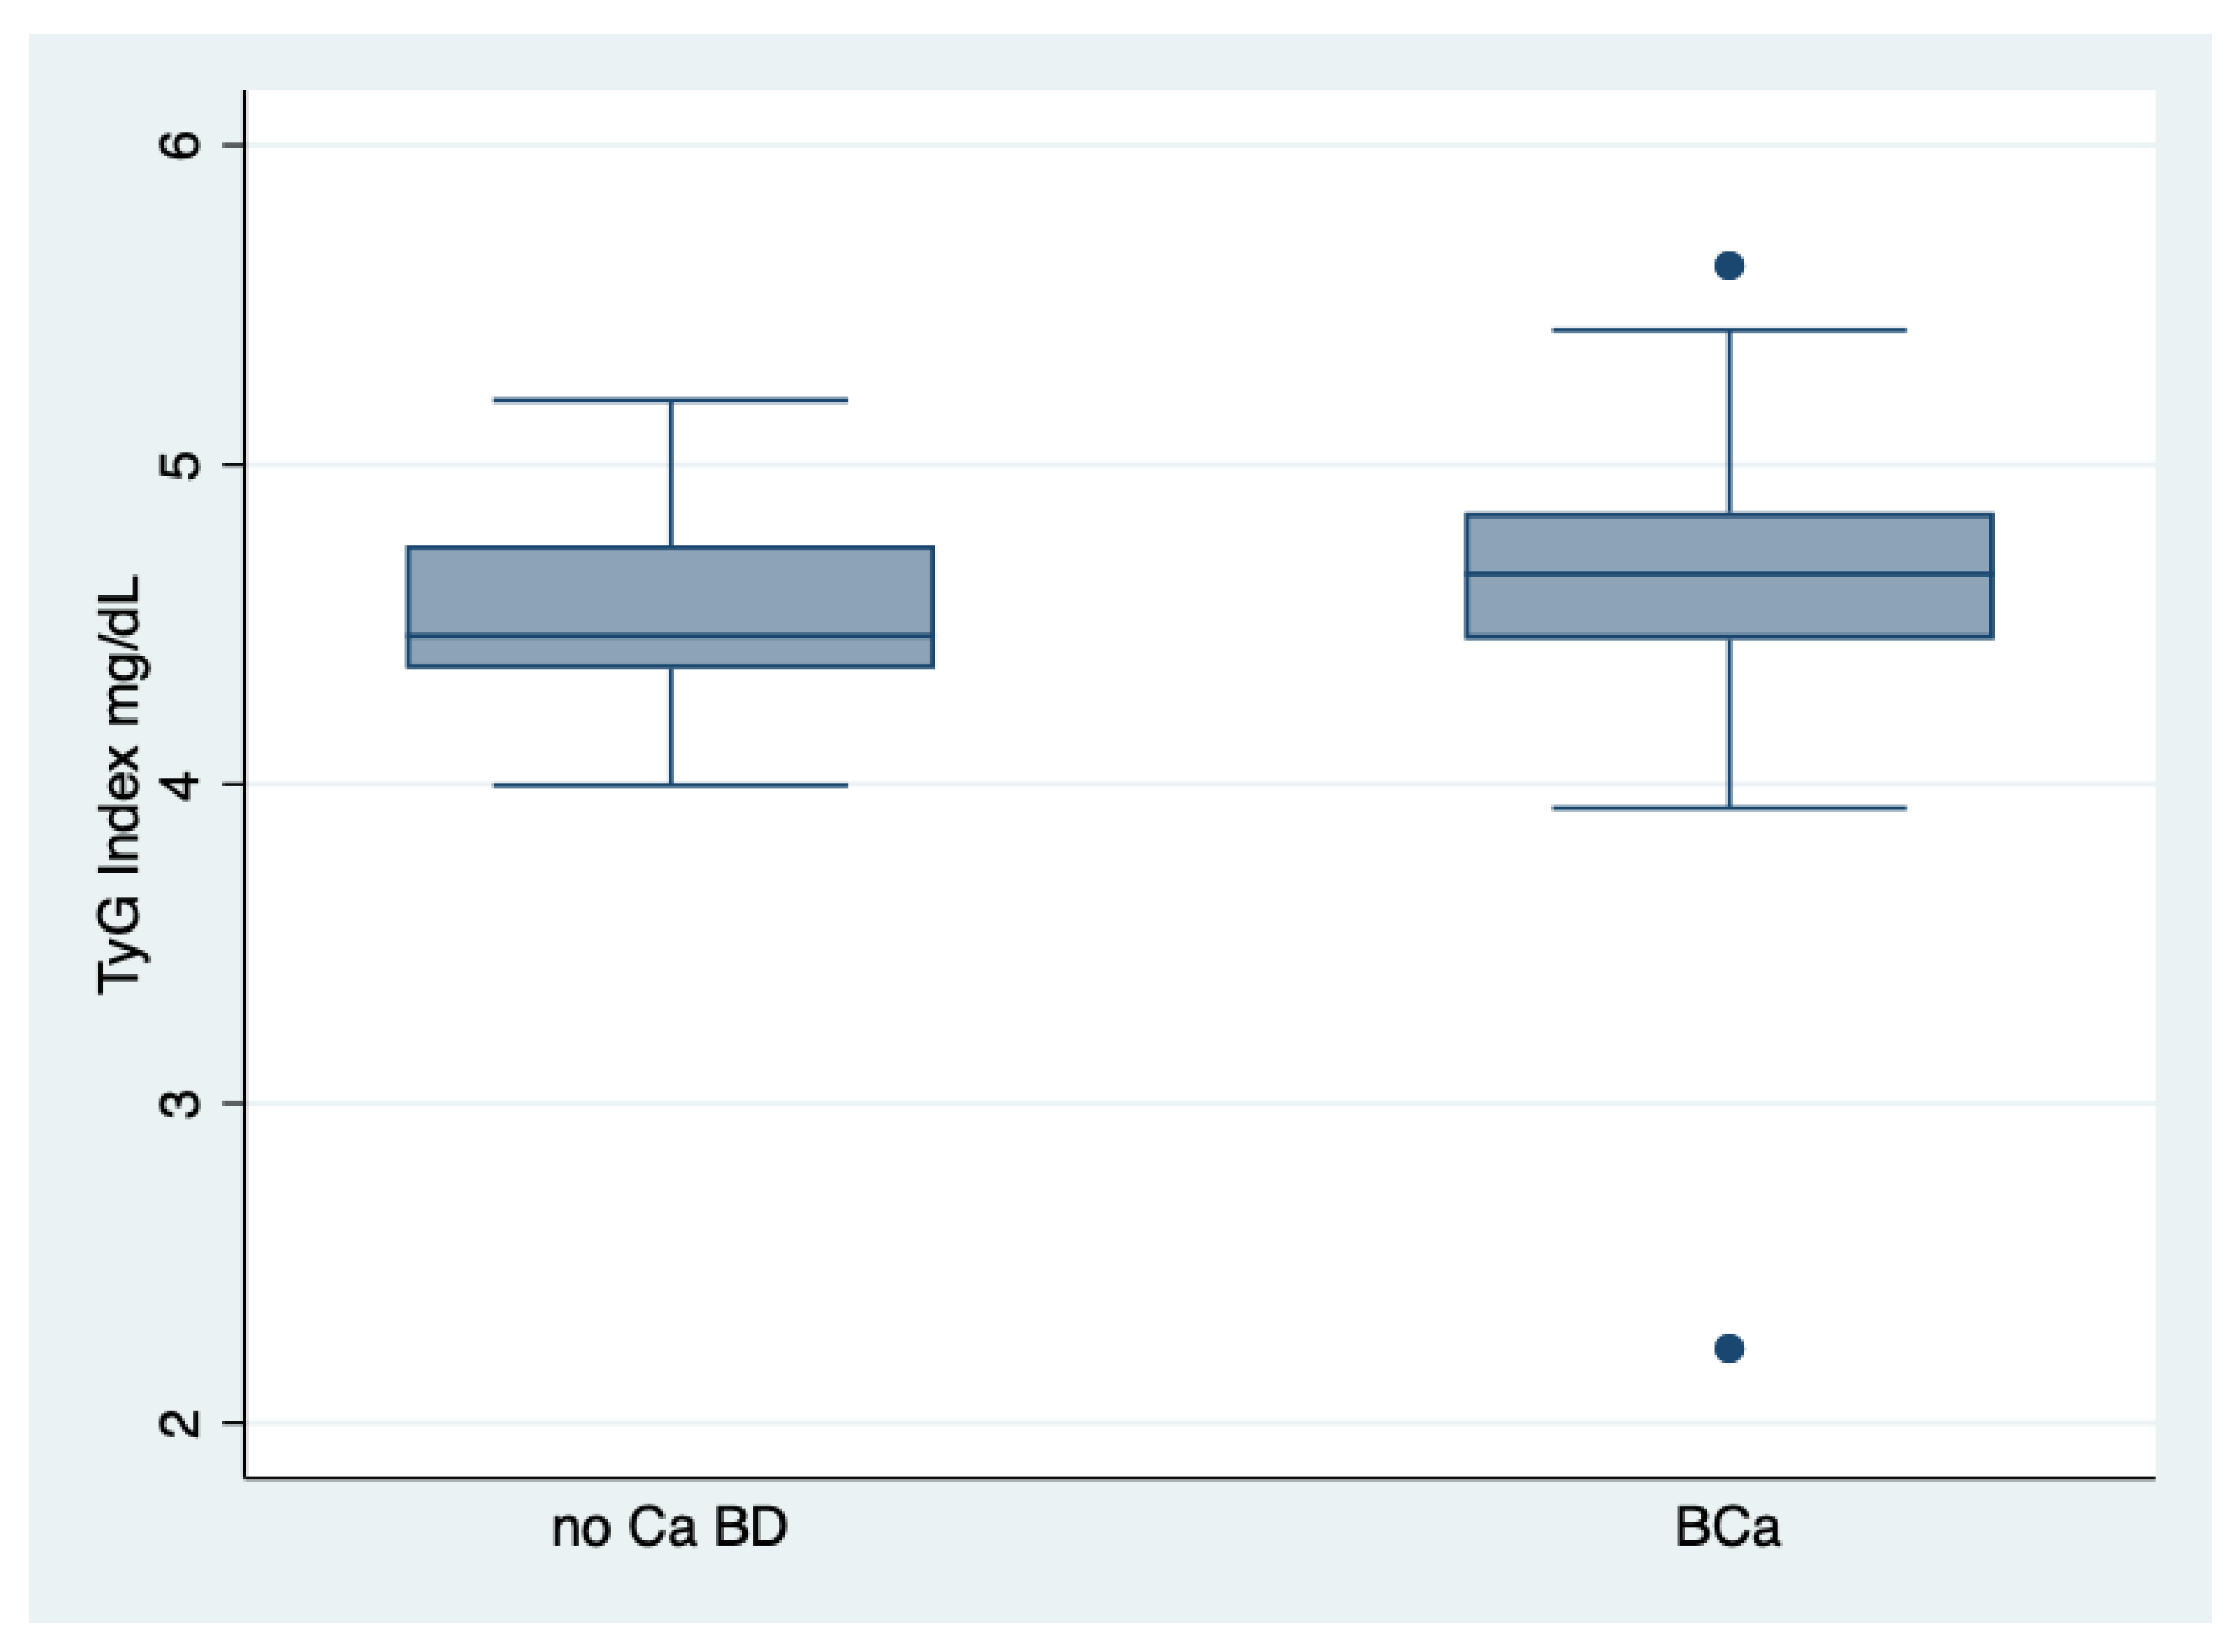
| TyG Index median (IQR) | 4.66 (4.45–4.85) | 4.46 (4.36–4.74) | 0.0092 |
| HDL-Cholesterol mg/dL, median (IQR) | 44 (35–53) | 48.5 (38.5–55.5) | 0.17 |
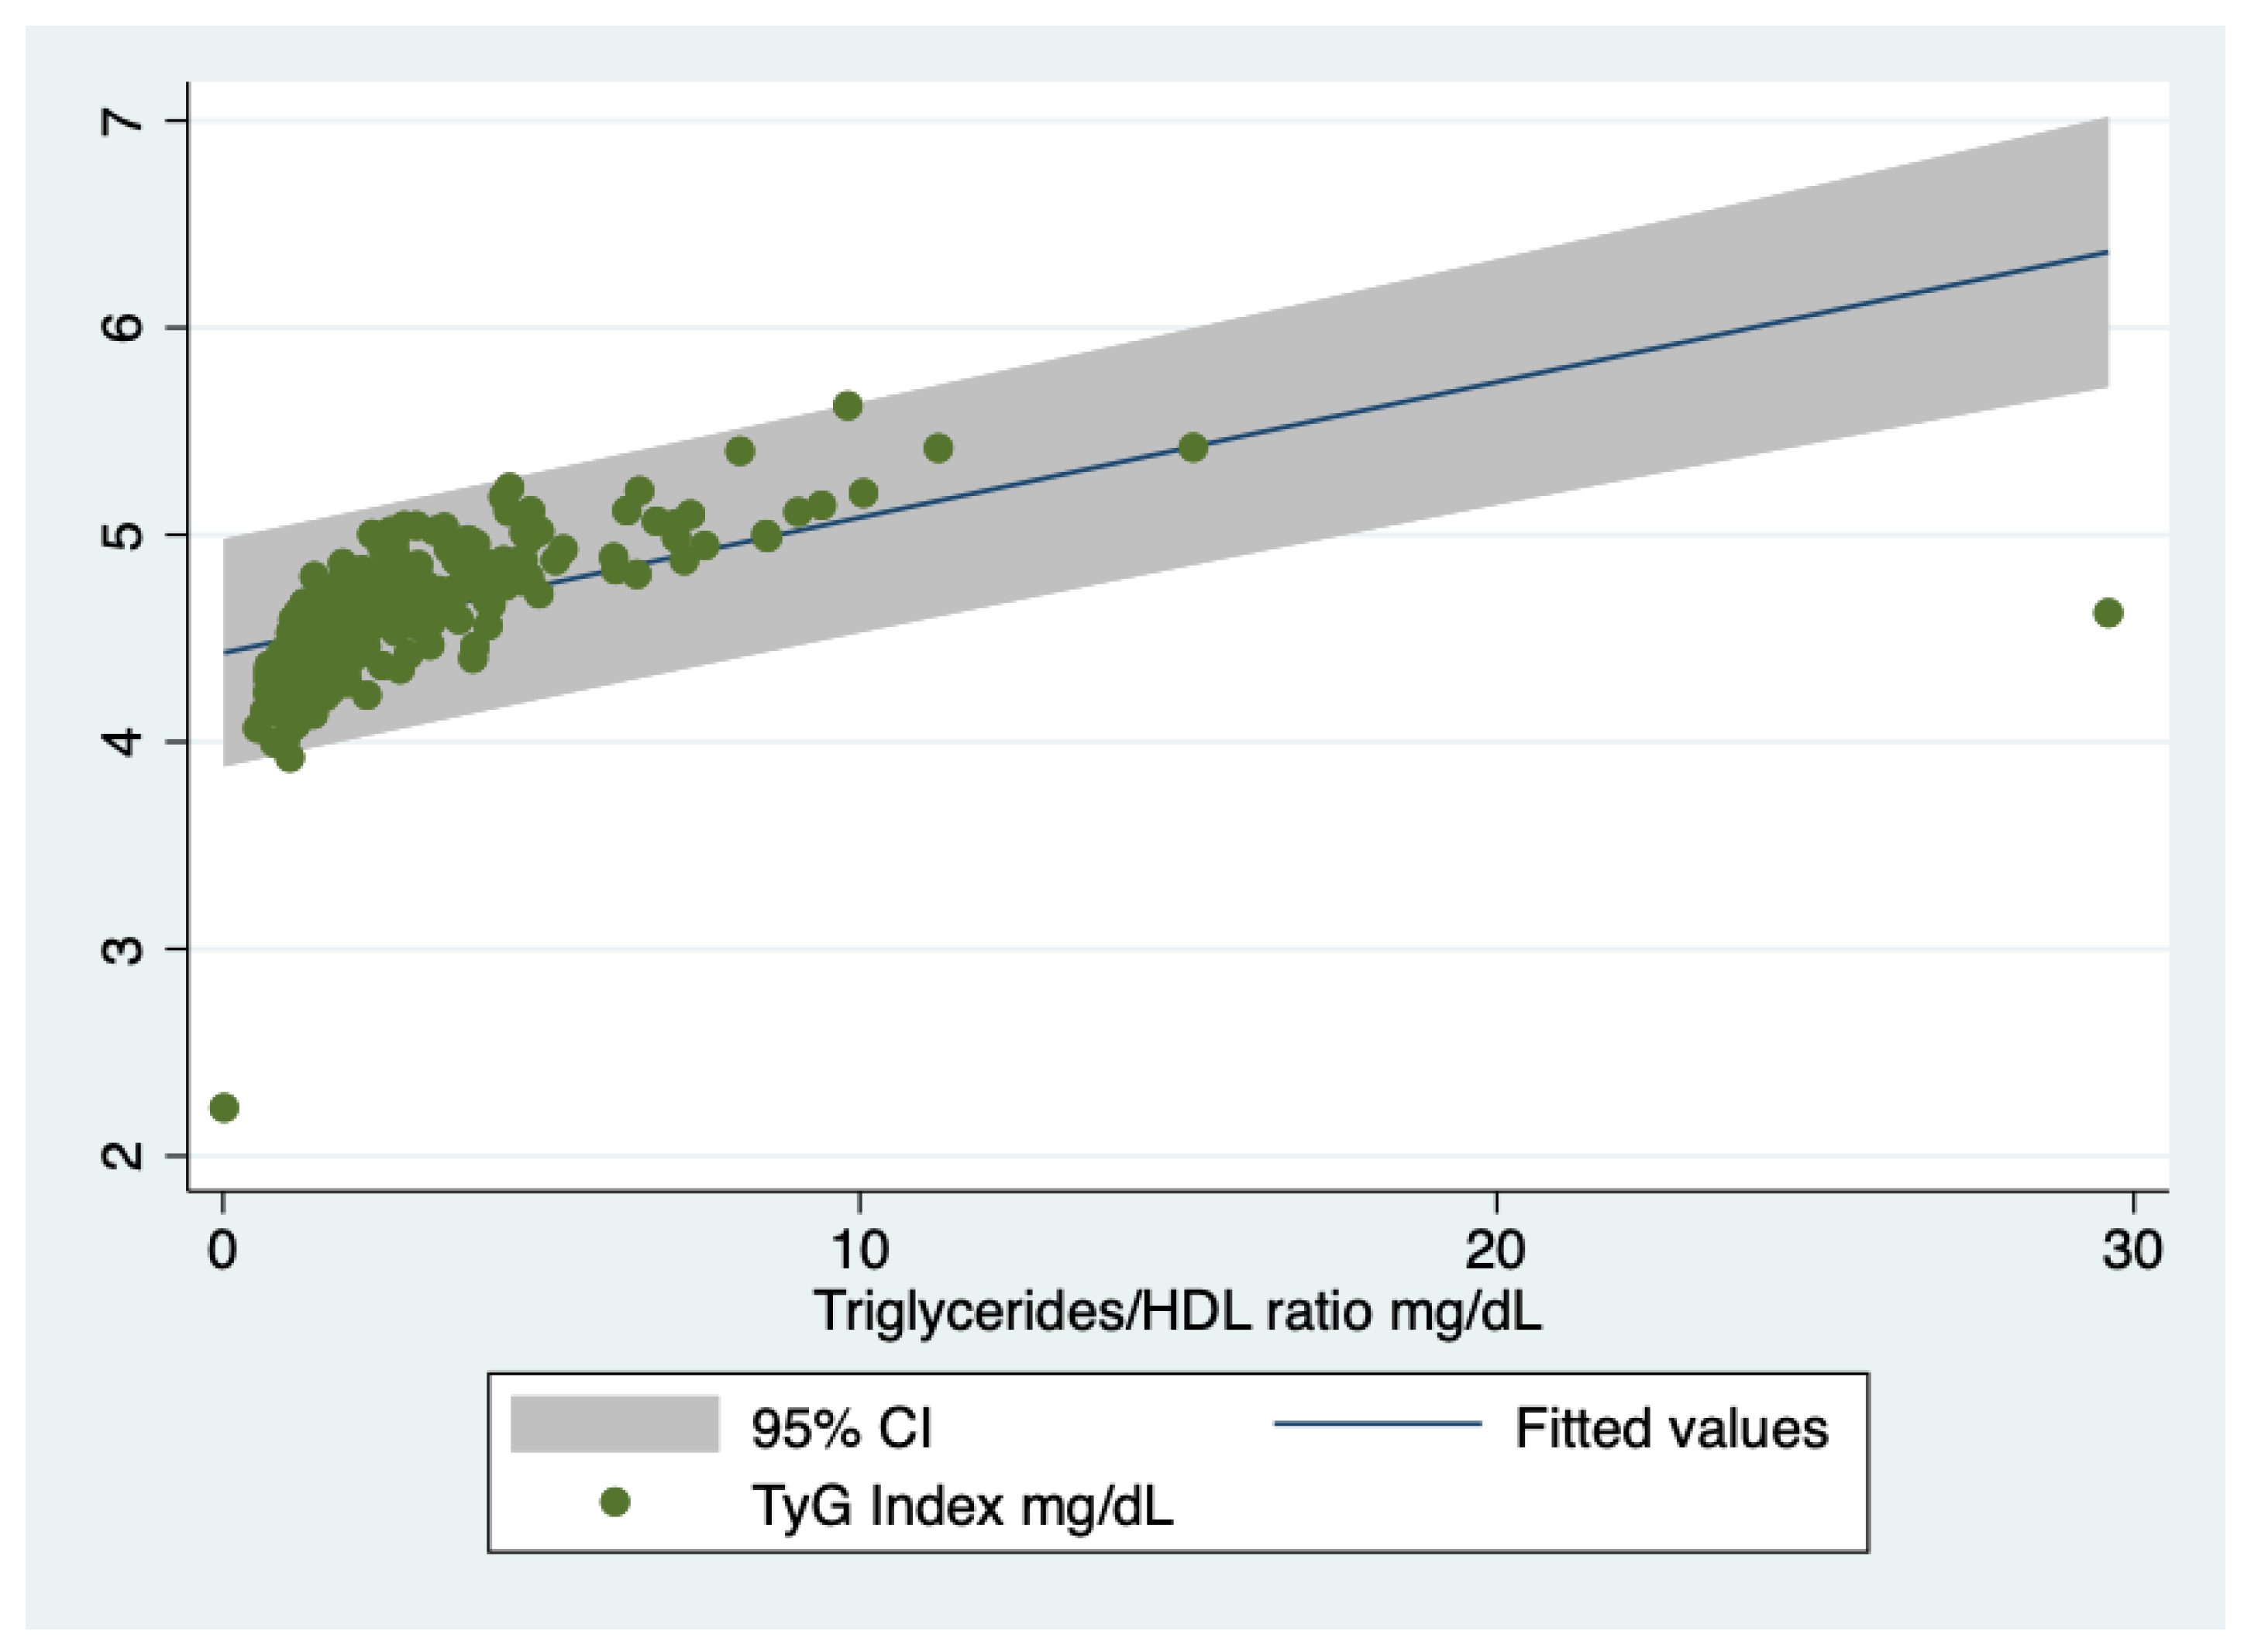
| Triglycerides/HDL ratio, median (IQR) | 2.53 (1.68–3.95) | 1.87 (1.33–3.02) | 0.022 |
| AST/ALT ratio | 1.14 (0.89–1.5) | 1.06 (0.85–1.45) | 0.27 |
| GGT U/L, median (IQR) | 21 (15–34) | 24.5 (14–33.5) | 0.90 |
| NAFLD n ** | 104 out of 177 | 19 out of 48 | 0.06 |
| IR n *** | 83 out of 177 | 18 out of 48 | 0.24 |
| Diagnosis | Normal FPG | Pre-Diabetes | T2DM | Total |
|---|---|---|---|---|
| Bca | 110 | 48 | 38 | 196 |
| no Ca BD | 36 | 12 | 2 | 50 |
| Total | 146 | 60 | 40 | 246 |
| Linear Regression, Robust. Number of Observations = 205. R-Squared = 0.051 | |||||
| d.v. Staging | Coef. | Std. Err. | t | p > |t| | 95% Conf. Interval |
| i.v. Age | 0.01361 | 0.00321 | 4.23 | 0.000 | 0.0072–0.01996 |
| Linear Regression, Robust. Number of Observations = 158. R-Squared = 0.0536 | |||||
| d.v. Grading | Coef. | Std. Err. | t | p > |t| | 95% Conf. Interval |
| i.v. Age | 0.02566 | 0.00756 | 3.39 | 0.001 | 0.0107232–0.0406108 |
| Linear Regression, Robust. Number of Observations = 248. R-Squared = 0.04 | |||||
| d.v. Glucose homeostasis | Coef. | Std. Err. | t | p >|t| | 95% Conf. Interval |
| i.v. Age | 0.01406 | 0.00339 | 4.14 | 0.000 | 0.00737–0.02074 |
| Logistic Regression, Robust. Number of Observations = 232. Pseudo R-Squared = 0.424 | |||||
| d.v. NAFLD | Coef. | Std. Err. | t | p > |t| | 95% Conf. Interval |
| i.v. TyG Index | 6.548 | 1.898 | 6.48 | 0.000 | 3.70–11.560 |
| Linear Regression, Robust. Number of Observations = 230. R-Squared = 0.094 | |||||
| d.v. Glucose homeostasis | Coef. | Std. Err. | t | p > |t| | 95% Conf. Interval |
| i.v. TyG Index | 0.765 | 0.164 | 4.66 | 0.000 | 0.4422–1.089 |
| Linear Regression, Robust. Number of Observations = 227. R-Squared = 0.126 | |||||
| d.v. Glucose homeostasis | Coef. | Std. Err. | t | p > |t| | 95% Conf. Interval |
| i.v. TyG Index | 0.7276 | 0.1414 | 5.14 | 0.000 | 0.4487–1.00 |
| Cov. Age | 0.0120 | 0.0036 | 3.27 | 0.001 | 0.004–0.019 |
| Linear Regression, Robust. Number of Observations = 179. R-Squared = 0.016 | |||||
| d.v. Staging | Coef. | Std. Err. | t | p > |t| | 95% Conf. Interval |
| i.v. TyG Index | −0.2543 | 0.1319 | −1.93 | 0.056 | −0.5148–0.0061 |
| Linear Regression, Robust. Number of Observations = 140. R-Squared = 0.012 | |||||
| d.v Grading | Coef. | Std. Err. | t | p > |t| | 95% Conf. Interval |
| i.v. Age | −0.3258 | 0.199 | −1.63 | 0.104 | −0.7199–0.0683 |
Publisher’s Note: MDPI stays neutral with regard to jurisdictional claims in published maps and institutional affiliations. |
© 2021 by the authors. Licensee MDPI, Basel, Switzerland. This article is an open access article distributed under the terms and conditions of the Creative Commons Attribution (CC BY) license (http://creativecommons.org/licenses/by/4.0/).
Share and Cite
Tarantino, G.; Crocetto, F.; Di Vito, C.; Creta, M.; Martino, R.; Pandolfo, S.D.; Pesce, S.; Napolitano, L.; Capone, D.; Imbimbo, C. Association of NAFLD and Insulin Resistance with Non Metastatic Bladder Cancer Patients: A Cross-Sectional Retrospective Study. J. Clin. Med. 2021, 10, 346. https://0-doi-org.brum.beds.ac.uk/10.3390/jcm10020346
Tarantino G, Crocetto F, Di Vito C, Creta M, Martino R, Pandolfo SD, Pesce S, Napolitano L, Capone D, Imbimbo C. Association of NAFLD and Insulin Resistance with Non Metastatic Bladder Cancer Patients: A Cross-Sectional Retrospective Study. Journal of Clinical Medicine. 2021; 10(2):346. https://0-doi-org.brum.beds.ac.uk/10.3390/jcm10020346
Chicago/Turabian StyleTarantino, Giovanni, Felice Crocetto, Concetta Di Vito, Massimiliano Creta, Raffaele Martino, Savio Domenico Pandolfo, Salvatore Pesce, Luigi Napolitano, Domenico Capone, and Ciro Imbimbo. 2021. "Association of NAFLD and Insulin Resistance with Non Metastatic Bladder Cancer Patients: A Cross-Sectional Retrospective Study" Journal of Clinical Medicine 10, no. 2: 346. https://0-doi-org.brum.beds.ac.uk/10.3390/jcm10020346