Applications of Functional Near-Infrared Spectroscopy (fNIRS) Neuroimaging in Exercise–Cognition Science: A Systematic, Methodology-Focused Review


Abstract
:1. Introduction
2. Methods
2.1. Search Strategy and Process
- exercis* OR fitness OR physical activity OR training OR strength OR endurance OR aerobic OR agility OR cycling OR running OR dance OR dancing OR walking OR “going outdoor”
- cogniti* OR mental OR executive OR memory OR attention OR “reaction time” OR “response time” OR processing OR Stroop OR Flanker OR Sternberg OR “Verbal Fluency Task” OR “Tower of Hanoi” OR “Tower of London” OR “Wisconsin card sorting task” OR “Trail Making Test” OR “visual search” OR visuospatial OR “decision making” OR oddball OR accuracy OR error
- NIR OR fNIR* OR "functional near-infrared spectroscopy" OR "near-infrared spectroscopy" OR "functional near-infrared spectroscopic" OR "optical imaging system" OR "optical topography" OR oxygenation
2.2. Inclusion and Exclusion Criteria
2.3. Data Extraction
3. Results
3.1. fNIRS Optode Placement
3.2. fNIRS Experimental Paradigms of Data Recording
3.3. DPF Values
3.4. fNIRS Signal Filtering
3.5. Final fNIRS Data Processing
3.6. Cortical Hemodynamics during Cognitive Testing in Response to Physical Activity
4. Discussion
4.1. How Should the fNIRS Optodes be Placed?
4.2. How fNIRS Data be Recorded?
4.3. How Should the “Optimal” Value for the DPF be Found?
4.4. How Should the Artefacts from the fNIRS Data be Removed?
4.4.1. How Should Motion-Related Artefacts be Removed?
4.4.2. How Should Physiological Artefacts be Removed?
4.5. How Should the fNIRS Data be Processed after Filtering?
4.6. Cortical Hemodynamics during Cognitive Testing in Response to Physical Activity
- (i)
- (ii)
- Cognitive tasks that necessitate (inner) speech could induce hypocapnia (i.e. a decrease in the arterial carbon dioxide (CO2) concentration in the blood), which provokes a cerebral vasoconstriction and lower cerebral blood flow that results in a reduced concentration of total hemoglobin and thus also oxygenated and deoxygenated hemoglobin [270,344,345,346]. Exemplarily, if the task is changing the respiration (rate or depth) of the subject, the fNIRS data will likely be influenced by this CO2 effect and will not represent changes in neurovascular coupling primarily.
- (iii)
- (iv)
- The biological sex of the participants influences the relationship between physical activity and cognition [350,351,352,353]. Sex-specific changes are also noticed in fNIRS signals obtained during cognitive testing [354,355]. Hence, the biological sex of the participants should be considered as a moderating factor in future studies.
5. Conclusions
Supplementary Materials
Author Contributions
Funding
Acknowledgment
Conflict of interest statement
References
- Turner, C.E.; Barker-Collo, S.L.; Connell, C.J.W.; Gant, N. Acute hypoxic gas breathing severely impairs cognition and task learning in humans. Physiol. Behav. 2015, 142, 104–110. [Google Scholar] [CrossRef] [PubMed]
- Moss, M.C.; Scholey, A.B. Oxygen administration enhances memory formation in healthy young adults. Psychopharmacology 1996, 124, 255–260. [Google Scholar] [CrossRef] [PubMed]
- Chung, S.-C.; Kwon, J.-H.; Lee, H.-W.; Tack, G.-R.; Lee, B.; Yi, J.-H.; Lee, S.-Y. Effects of high concentration oxygen administration on n-back task performance and physiological signals. Physiol. Meas. 2007, 28, 389–396. [Google Scholar] [CrossRef] [PubMed]
- Chung, S.-C.; Lee, B.; Tack, G.-R.; Yi, J.-H.; Lee, H.-W.; Kwon, J.-H.; Choi, M.-H.; Eom, J.-S.; Sohn, J.-H. Physiological mechanism underlying the improvement in visuospatial performance due to 30% oxygen inhalation. Appl. Ergon. 2008, 39, 166–170. [Google Scholar] [CrossRef] [PubMed]
- Alosco, M.L.; Gunstad, J.; Jerskey, B.A.; Xu, X.; Clark, U.S.; Hassenstab, J.; Cote, D.M.; Walsh, E.G.; Labbe, D.R.; Hoge, R.; et al. The adverse effects of reduced cerebral perfusion on cognition and brain structure in older adults with cardiovascular disease. Brain Behav. 2013, 3, 626–636. [Google Scholar] [CrossRef] [PubMed] [Green Version]
- Yanagisawa, H.; Dan, I.; Tsuzuki, D.; Kato, M.; Okamoto, M.; Kyutoku, Y.; Soya, H. Acute moderate exercise elicits increased dorsolateral prefrontal activation and improves cognitive performance with Stroop test. NeuroImage 2010, 50, 1702–1710. [Google Scholar] [CrossRef] [PubMed]
- Hyodo, K.; Dan, I.; Suwabe, K.; Kyutoku, Y.; Yamada, Y.; Akahori, M.; Byun, K.; Kato, M.; Soya, H. Acute moderate exercise enhances compensatory brain activation in older adults. Neurobiol. Aging 2012, 33, 2621–2632. [Google Scholar] [CrossRef] [PubMed]
- Byun, K.; Hyodo, K.; Suwabe, K.; Ochi, G.; Sakairi, Y.; Kato, M.; Dan, I.; Soya, H. Positive effect of acute mild exercise on executive function via arousal-related prefrontal activations: An fNIRS study. NeuroImage 2014, 98, 336–345. [Google Scholar] [CrossRef] [PubMed]
- Tam, N.D. Optical imaging of prefrontal cortex hemodynamic response in executive function induced by increased cardiovascular activity. BMC Neurosci. 2014, 15, P34. [Google Scholar] [CrossRef]
- Suhr, J.A.; Chelberg, M.B. Use of near-infrared spectroscopy as a measure of cerebrovascular health in aging adults. Neuropsychol. Dev. Cogn. B Aging Neuropsychol. Cogn. 2013, 20, 243–252. [Google Scholar] [CrossRef] [PubMed]
- Dupuy, O.; Gauthier, C.J.; Fraser, S.A.; Desjardins-Crepeau, L.; Desjardins, M.; Mekary, S.; Lesage, F.; Hoge, R.D.; Pouliot, P.; Bherer, L. Higher levels of cardiovascular fitness are associated with better executive function and prefrontal oxygenation in younger and older women. Front. Hum. Neurosci. 2015, 9, 66. [Google Scholar] [CrossRef] [PubMed]
- Hyodo, K.; Dan, I.; Kyutoku, Y.; Suwabe, K.; Byun, K.; Ochi, G.; Kato, M.; Soya, H. The association between aerobic fitness and cognitive function in older men mediated by frontal lateralization. NeuroImage 2016, 125, 291–300. [Google Scholar] [CrossRef] [PubMed]
- Albinet, C.T.; Mandrick, K.; Bernard, P.L.; Perrey, S.; Blain, H. Improved cerebral oxygenation response and executive performance as a function of cardiorespiratory fitness in older women: A fNIRS study. Front. Aging Neurosci. 2014, 6, 273185. [Google Scholar] [CrossRef] [PubMed]
- Byun, K.; Hyodo, K.; Suwabe, K.; Fukuie, T.; Soya, H. Possible neurophysiological mechanisms for mild-exercise-enhanced executive function: An fNIRS neuroimaging study. J. Phys. Fit. Sports Med. 2016, 5, 361–367. [Google Scholar] [CrossRef]
- Hillman, C.H.; Erickson, K.I.; Kramer, A.F. Be smart, exercise your heart: Exercise effects on brain and cognition. Nat. Rev. Neurosci. 2008, 9, 58–65. [Google Scholar] [CrossRef] [PubMed]
- Stimpson, N.J.; Davison, G.; Javadi, A.-H. Joggin'the noggin: Towards a physiological understanding of exercise-induced cognitive benefits. Neurosci. Biobehav. Rev. 2018, 88, 177–186. [Google Scholar] [CrossRef] [PubMed]
- Pontifex, M.B.; McGowan, A.L.; Chandler, M.C.; Gwizdala, K.L.; Parks, A.C.; Fenn, K.; Kamijo, K. A primer on investigating the after effects of acute bouts of physical activity on cognition. Psychol. Sport Exerc. 2018. [Google Scholar] [CrossRef]
- Herold, F.; Hamacher, D.; Schega, L.; Müller, N.G. Thinking while moving or moving while thinking—Concepts of motor-cognitive training for cognitive performance enhancement. Front. Aging Neurosci. 2018, 1–11. [Google Scholar] [CrossRef] [PubMed]
- Bherer, L.; Erickson, K.I.; Liu-Ambrose, T. A review of the effects of physical activity and exercise on cognitive and brain functions in older adults. J. Aging Res. 2013, 2013, 657508. [Google Scholar] [CrossRef] [PubMed]
- Törpel, A.; Herold, F.; Hamacher, D.; Müller, N.G.; Schega, L. Strengthening the brain—Is resistance training with blood flow restriction an effective strategy for cognitive improvement? J. Clin. Med. 2018, 7, 377. [Google Scholar] [CrossRef] [PubMed]
- Agbangla, N.F.; Audiffren, M.; Albinet, C.T. Use of near-infrared spectroscopy in the investigation of brain activation during cognitive aging: A systematic review of an emerging area of research. Ageing Res. Rev. 2017. [Google Scholar] [CrossRef] [PubMed]
- Rudroff, T.; Ketelhut, N.B.; Kindred, J.H. Metabolic imaging in exercise physiology. J. Appl. Physiol. 2017. [Google Scholar] [CrossRef] [PubMed]
- Chou, P.-H.; Lan, T.-H. The role of near-infrared spectroscopy in Alzheimer’s disease. J. Clin. Gerontol. Geriatr. 2013, 4, 33–36. [Google Scholar] [CrossRef]
- Kim, H.Y.; Seo, K.; Jeon, H.J.; Lee, U.; Lee, H. application of functional near-infrared spectroscopy to the study of brain function in humans and animal models. Mol. Cells 2017. [Google Scholar] [CrossRef] [PubMed]
- Hamacher, D.; Herold, F.; Wiegel, P.; Hamacher, D.; Schega, L. Brain activity during walking: A systematic review. Neurosci. Biobehav. Rev. 2015, 57, 310–327. [Google Scholar] [CrossRef] [PubMed]
- Park, J.L.; Fairweather, M.M.; Donaldson, D.I. Making the case for mobile cognition: EEG and sports performance. Neurosci. Biobehav. Rev. 2015, 52, 117–130. [Google Scholar] [CrossRef] [PubMed]
- Thompson, T.; Steffert, T.; Ros, T.; Leach, J.; Gruzelier, J. EEG applications for sport and performance. Methods 2008, 45, 279–288. [Google Scholar] [CrossRef] [PubMed]
- Crabbe, J.B.; Dishman, R.K. Brain electrocortical activity during and after exercise: A quantitative synthesis. Psychophysiology 2004, 41, 563–574. [Google Scholar] [CrossRef] [PubMed]
- Lloyd-Fox, S.; Blasi, A.; Elwell, C.E. Illuminating the developing brain: The past, present and future of functional near infrared spectroscopy. Neurosci. Biobehav. Rev. 2010, 34, 269–284. [Google Scholar] [CrossRef] [PubMed]
- Quaresima, V.; Ferrari, M. Functional near-infrared spectroscopy (fNIRs) for assessing cerebral cortex function during human behavior in natural/social situations: A concise review. Organ. Res. Methods 2016. [Google Scholar] [CrossRef]
- Saliba, J.; Bortfeld, H.; Levitin, D.J.; Oghalai, J.S. Functional near-infrared spectroscopy for neuroimaging in cochlear implant recipients. Hearing Res. 2016. [Google Scholar] [CrossRef] [PubMed]
- Scarapicchia, V.; Brown, C.; Mayo, C.; Gawryluk, J.R. Functional magnetic resonance imaging and functional near-infrared spectroscopy: Insights from combined recording studies. Front. Hum. Neurosci. 2017, 11, 419. [Google Scholar] [CrossRef] [PubMed]
- Glover, G.H. Overview of functional magnetic resonance imaging. Neurosurg. Clin. N. Am. 2011, 22, 133–139. [Google Scholar] [CrossRef] [PubMed]
- Aslin, R.N.; Shukla, M.; Emberson, L.L. Hemodynamic correlates of cognition in human infants. Annu. Rev. Psychol. 2015, 66, 349–379. [Google Scholar] [CrossRef] [PubMed]
- Ferreri, L.; Bigand, E.; Perrey, S.; Bugaiska, A. The promise of Near-Infrared Spectroscopy (NIRS) for psychological research: A brief review. Annee Psychol. 2014, 114, 537–569. [Google Scholar] [CrossRef]
- Herold, F.; Wiegel, P.; Scholkmann, F.; Thiers, A.; Hamacher, D.; Schega, L. Functional near-infrared spectroscopy in movement science: A systematic review on cortical activity in postural and walking tasks. Neurophoton 2017, 4, 41403. [Google Scholar] [CrossRef] [PubMed]
- Cohen, M.X. Where does EEG come from and what does it mean? Trends Neurosci. 2017, 40, 208–218. [Google Scholar] [CrossRef] [PubMed]
- Cutini, S.; Brigadoi, S. Unleashing the future potential of functional near-infrared spectroscopy in brain sciences. J. Neurosci. Methods 2014, 232, 152–156. [Google Scholar] [CrossRef] [PubMed]
- Bunce, S.C.; Izzetoglu, M.; Izzetoglu, K.; Onaral, B.; Pourrezaei, K. Functional near-infrared spectroscopy. IEEE Eng. Med. Biol. Mag. 2006, 25, 54–62. [Google Scholar] [CrossRef] [PubMed]
- Pinti, P.; Tachtsidis, I.; Hamilton, A.; Hirsch, J.; Aichelburg, C.; Gilbert, S.; Burgess, P.W. The present and future use of functional near-infrared spectroscopy (fNIRS) for cognitive neuroscience. Ann. N. Y. Acad. Sci. 2018. [Google Scholar] [CrossRef] [PubMed]
- Pinti, P.; Aichelburg, C.; Gilbert, S.; Hamilton, A.; Hirsch, J.; Burgess, P.; Tachtsidis, I. A review on the use of wearable functional near-infrared spectroscopy in naturalistic environments. Jpn. Psychol. Res. 2018, 2, 20801. [Google Scholar] [CrossRef]
- Smith, M. Shedding light on the adult brain: A review of the clinical applications of near-infrared spectroscopy. Philos. Trans. A Math. Phys. Eng. Sci. 2011, 369, 4452–4469. [Google Scholar] [CrossRef] [PubMed]
- Maskeliunas, R.; Damasevicius, R.; Martisius, I.; Vasiljevas, M. Consumer-grade EEG devices: Are they usable for control tasks? PeerJ 2016, 4, 1746. [Google Scholar] [CrossRef] [PubMed]
- Leff, D.R.; Orihuela-Espina, F.; Elwell, C.E.; Athanasiou, T.; Delpy, D.T.; Darzi, A.W.; Yang, G.-Z. Assessment of the cerebral cortex during motor task behaviours in adults: A systematic review of functional near infrared spectroscopy (fNIRs) studies. NeuroImage 2011, 54, 2922–2936. [Google Scholar] [CrossRef] [PubMed]
- Villringer, A.; Chance, B. Non-invasive optical spectroscopy and imaging of human brain function. Trends Neurosci. 1997, 20, 435–442. [Google Scholar] [CrossRef]
- Liao, L.-D.; Tsytsarev, V.; Delgado-Martínez, I.; Li, M.-L.; Erzurumlu, R.; Vipin, A.; Orellana, J.; Lin, Y.-R.; Lai, H.-Y.; Chen, Y.-Y.; et al. Neurovascular coupling: In vivo optical techniques for functional brain imaging. BioMed. Eng. OnLine 2013, 12, 38. [Google Scholar] [CrossRef] [PubMed]
- Scholkmann, F.; Kleiser, S.; Metz, A.J.; Zimmermann, R.; Mata Pavia, J.; Wolf, U.; Wolf, M. A review on continuous wave functional near-infrared spectroscopy and imaging instrumentation and methodology. NeuroImage 2014, 85, 6–27. [Google Scholar] [CrossRef] [PubMed] [Green Version]
- Lindauer, U.; Dirnagl, U.; Fuchtemeier, M.; Bottiger, C.; Offenhauser, N.; Leithner, C.; Royl, G. Pathophysiological interference with neurovascular coupling—When imaging based on hemoglobin might go blind. Front. Neuroenergetics 2010, 2. [Google Scholar] [CrossRef] [PubMed]
- Scholkmann, F.; Wolf, M. Measuring brain activity using functional near infrared spectroscopy: A short review. Spectrosc. Eur. 2012, 24, 6–10. [Google Scholar]
- Nippert, A.R.; Biesecker, K.R.; Newman, E.A. Mechanisms mediating functional hyperemia in the brain. Neuroscientist 2018, 24, 73–83. [Google Scholar] [CrossRef] [PubMed]
- Izzetoglu, M.; Bunce, S.C.; Izzetoglu, K.; Onaral, B.; Pourrezaei, K. Functional brain imaging using near-infrared technology. IEEE Eng. Med. Biol. Mag. 2007, 26, 38–46. [Google Scholar] [CrossRef] [PubMed]
- Ekkekakis, P. Illuminating the black box: Investigating prefrontal cortical hemodynamics during exercise with near-infrared spectroscopy. J. Sport Exerc. Psychol. 2009, 31, 505–553. [Google Scholar] [CrossRef] [PubMed]
- Obrig, H.; Wenzel, R.; Kohl, M.; Horst, S.; Wobst, P.; Steinbrink, J.; Thomas, F.; Villringer, A. Near-infrared spectroscopy: Does it function in functional activation studies of the adult brain? Int. J. Psychophysiol. 2000, 35, 125–142. [Google Scholar] [CrossRef]
- Perrey, S. Non-invasive NIR spectroscopy of human brain function during exercise. Methods 2008, 45, 289–299. [Google Scholar] [CrossRef] [PubMed]
- Rupawala, M.; Dehghani, H.; Lucas, S.J.E.; Tino, P.; Cruse, D. Shining a light on awareness: A review of functional near-infrared spectroscopy for prolonged disorders of consciousness. Front. Neurol. 2018, 9, 68. [Google Scholar] [CrossRef] [PubMed]
- Gervain, J.; Mehler, J.; Werker, J.F.; Nelson, C.A.; Csibra, G.; Lloyd-Fox, S.; Shukla, M.; Aslin, R.N. Near-infrared spectroscopy: A report from the McDonnell infant methodology consortium. Dev. Cogn. Neurosci. 2011, 1, 22–46. [Google Scholar] [CrossRef] [PubMed] [Green Version]
- Delpy, D.T.; Cope, M. Quantification in tissue near-infrared spectroscopy. Philos. Trans. R. Soc. Lond. B Biol. Sci. 1997, 352, 649–659. [Google Scholar] [CrossRef]
- Obrig, H.; Villringer, A. Beyond the visible—Imaging the human brain with light. J. Cereb. Blood Flow Metab. 2003, 23, 1–18. [Google Scholar] [CrossRef] [PubMed]
- Gratton, G.; Chiarelli, A.M.; Fabiani, M. From brain to blood vessels and back: A noninvasive optical imaging approach. Neurophotonics 2017, 4, 31208. [Google Scholar] [CrossRef] [PubMed]
- Obrig, H. NIRS in clinical neurology—A ‘promising’ tool? NeuroImage 2014, 85, 535–546. [Google Scholar] [CrossRef] [PubMed]
- Yücel, M.A.; Selb, J.J.; Huppert, T.J.; Franceschini, M.A.; Boas, D.A. Functional near infrared spectroscopy: Enabling routine functional brain imaging. Curr. Opin. Biomed. Eng. 2017, 4, 78–86. [Google Scholar] [CrossRef] [PubMed]
- Quaresima, V.; Bisconti, S.; Ferrari, M. A brief review on the use of functional near-infrared spectroscopy (fNIRS) for language imaging studies in human newborns and adults. Brain Lang. 2012, 121, 79–89. [Google Scholar] [CrossRef] [PubMed]
- De Roever, I.; Bale, G.; Cooper, R.J.; Tachtsidis, I. Functional NIRS measurement of cytochrome-c-oxidase demonstrates a more brain-specific marker of frontal lobe activation compared to the haemoglobins. Adv. Exp. Med. Biol. 2017, 977, 141–147. [Google Scholar] [CrossRef] [PubMed]
- Heekeren, H.R.; Kohl, M.; Obrig, H.; Wenzel, R.; von Pannwitz, W.; Matcher, S.J.; Dirnagl, U.; Cooper, C.E.; Villringer, A. Noninvasive assessment of changes in cytochrome-c oxidase oxidation in human subjects during visual stimulation. J. Cereb. Blood Flow Metab. 1999, 19, 592–603. [Google Scholar] [CrossRef] [PubMed]
- Bale, G.; Elwell, C.E.; Tachtsidis, I. From Jobsis to the present day: A review of clinical near-infrared spectroscopy measurements of cerebral cytochrome-c-oxidase. J. Biomed. Opt. 2016, 21, 91307. [Google Scholar] [CrossRef] [PubMed]
- Cooper, C.E.; Springett, R. Measurement of cytochrome oxidase and mitochondrial energetics by near-infrared spectroscopy. Philos. Trans. R. Soc. Lond. B Biol. Sci. 1997, 352, 669–676. [Google Scholar] [CrossRef] [PubMed]
- Brigadoi, S.; Phan, P.; Highton, D.; Powell, S.; Cooper, R.J.; Hebden, J.; Smith, M.; Tachtsidis, I.; Elwell, C.E.; Gibson, A.P. Image reconstruction of oxidized cerebral cytochrome C oxidase changes from broadband near-infrared spectroscopy data. Neurophotonics 2017, 4, 21105. [Google Scholar] [CrossRef] [PubMed] [Green Version]
- Pellicer, A.; del Carmen, B.M. Near-infrared spectroscopy: A methodology-focused review. Semin. Fetal Neonatal Med. 2011, 16, 42–49. [Google Scholar] [CrossRef] [PubMed]
- Tachtsidis, I.; Scholkmann, F. False positives and false negatives in functional near-infrared spectroscopy: Issues, challenges, and the way forward. Neurophotonics 2016, 3, 30401. [Google Scholar] [CrossRef] [PubMed]
- Kirilina, E.; Jelzow, A.; Heine, A.; Niessing, M.; Wabnitz, H.; Brühl, R.; Ittermann, B.; Jacobs, A.M.; Tachtsidis, I. The physiological origin of task-evoked systemic artefacts in functional near infrared spectroscopy. NeuroImage 2012, 61, 70–81. [Google Scholar] [CrossRef] [PubMed] [Green Version]
- Caldwell, M.; Scholkmann, F.; Wolf, U.; Wolf, M.; Elwell, C.; Tachtsidis, I. Modelling confounding effects from extracerebral contamination and systemic factors on functional near-infrared spectroscopy. NeuroImage 2016, 143, 91–105. [Google Scholar] [CrossRef] [PubMed] [Green Version]
- Scholkmann, F.; Hafner, T.; Metz, A.J.; Wolf, M.; Wolf, U. Effect of short-term colored-light exposure on cerebral hemodynamics and oxygenation, and systemic physiological activity. Neurophoton 2017, 4, 1. [Google Scholar] [CrossRef] [PubMed] [Green Version]
- Herold, F.; Orlowski, K.; Börmel, S.; Müller, N.G. Cortical activation during balancing on a balance board. Hum. Mov. Sci. 2017, 51, 51–58. [Google Scholar] [CrossRef] [PubMed]
- Bonetti, L.V.; Hassan, S.A.; Lau, S.-T.; Melo, L.T.; Tanaka, T.; Patterson, K.; Reid, W.D. Oxyhemoglobin changes in the prefrontal cortex in response to cognitive tasks: A systematic review. Int. J. Neurosci. 2018, 1–23. [Google Scholar] [CrossRef] [PubMed]
- Rooks, C.R.; Thom, N.J.; McCully, K.K.; Dishman, R.K. Effects of incremental exercise on cerebral oxygenation measured by near-infrared spectroscopy: A systematic review. Prog. Neurobiol. 2010, 92, 134–150. [Google Scholar] [CrossRef] [PubMed]
- Moher, D.; Liberati, A.; Tetzlaff, J.; Altman, D.G. Preferred reporting items for systematic reviews and meta-analyses: The PRISMA statement. J. Clin. Epidemiol. 2009, 62, 1006–1012. [Google Scholar] [CrossRef] [PubMed]
- Hyodo, K.; Suwabe, K.; Soya, H.; Nagamatsu, T. The effect of an acute bout of slow aerobic dance on mood and executive function in older adults: A pilot study. Bull. Phys. Fit. Res. Inst. 2017, 35–41. [Google Scholar] [CrossRef]
- Murata, Y.; Watanabe, A.; Terasawa, S.; Nakajima, K.; Kobayashi, T.; Yong, Z.; Okuhara, M.; Nakade, K.; Terasawa, K.; Maruo, S.K. moderate exercise improves cognitive performance and decreases cortical activation in go/no-go task. BAOJ Med. Nurs. 2015, 1, 1–7. [Google Scholar] [CrossRef]
- Wang, W.; Qiu, C.; Ota, T.; Sawada, M.; Kishimoto, N.; Kishimoto, T. Effects of Tai-Chi exercise on attention in healthy elderly subject as measured by near-infrared spectroscopy during the Stroop task. J. Nara. Med. Assoc. 2013, 64, 79–86. [Google Scholar]
- Harris, J.D.; Quatman, C.E.; Manring, M.M.; Siston, R.A.; Flanigan, D.C. How to write a systematic review. Am. J. Sports Med. 2014, 42, 2761–2768. [Google Scholar] [CrossRef] [PubMed]
- Sudo, M.; Ando, S.; Nagamatsu, T. The effects of stretching exercise on affective states and cognitive function in inactive people. Bull. Phys. Fit. Res. Inst. 2016, 14, 11–19. [Google Scholar]
- Sudo, M.; Ando, S.; Nagamatsu, T. The effects of acute stretch exercise on cognitive function, cerebral oxygen dynamics, and affective state. Bull. Phys. Fit. Res. Inst. 2015, 113, 19–26. [Google Scholar]
- Hashimoto, N.; Yokogawa, M.; Yamazaki, T.; Nakagawa, T. Effects of the intensity of transient aerobic exercise on attention. Rigakuryoho Kagaku 2013, 28, 377–381. [Google Scholar] [CrossRef]
- Giles, G.E.; Brunye, T.T.; Eddy, M.D.; Mahoney, C.R.; Gagnon, S.A.; Taylor, H.A.; Kanarek, R.B. Acute exercise increases oxygenated and deoxygenated hemoglobin in the prefrontal cortex. NeuroReport 2014, 25, 1320–1325. [Google Scholar] [CrossRef] [PubMed]
- Drigny, J.; Gremeaux, V.; Dupuy, O.; Gayda, M.; Bherer, L.; Juneau, M.; Nigam, A. Effect of interval training on cognitive functioning and cerebral oxygenation in obese patients: A pilot study. J. Rehabil. Med. 2014, 46, 1050–1054. [Google Scholar] [CrossRef] [PubMed] [Green Version]
- MacIntosh, B.J.; Crane, D.E.; Sage, M.D.; Rajab, A.S.; Donahue, M.J.; McIlroy, W.E.; Middleton, L.E. Impact of a single bout of aerobic exercise on regional brain perfusion and activation responses in healthy young adults. PLoS ONE 2014, 9. [Google Scholar] [CrossRef] [PubMed]
- Byun, K.; Hyodo, K.; Suwabe, K.; Kujach, S.; Kato, M.; Soya, H. Possible influences of exercise-intensity-dependent increases in non-cortical hemodynamic variables on NIRS-based neuroimaging analysis during cognitive tasks: Technical note. J. Exerc. Nutr. Biochem. 2014, 18, 327–332. [Google Scholar] [CrossRef] [PubMed]
- Bosch, B.M.; Bringard, A.; Ferretti, G.; Schwartz, S.; Iglói, K. Effect of cerebral vasomotion during physical exercise on associative memory, a near-infrared spectroscopy study. Neurophoton 2017, 4, 41404. [Google Scholar] [CrossRef] [PubMed] [Green Version]
- Shimizu, N.; Umemura, T.; Matsunaga, M.; Hirai, T. Effects of movement music therapy with a percussion instrument on physical and frontal lobe function in older adults with mild cognitive impairment: A randomized controlled trial. Aging Ment. Health 2017, 1–13. [Google Scholar] [CrossRef] [PubMed]
- Lucas, S.J.E.; Cotter, J.D.; Brassard, P.; Bailey, D.M. High-intensity interval exercise and cerebrovascular health: Curiosity, cause, and consequence. J. Cereb. Blood Flow Metab. 2015, 35, 902–911. [Google Scholar] [CrossRef] [PubMed]
- Radel, R.; Tempest, G.D.; Brisswalter, J. The long and winding road: Effects of exercise intensity and type upon sustained attention. Physiol. Behav. 2018, 195, 82–89. [Google Scholar] [CrossRef] [PubMed]
- Decroix, L.; Tonoli, C.; Soares, D.D.; Tagougui, S.; Heyman, E.; Meeusen, R. Acute cocoa flavanol improves cerebral oxygenation without enhancing executive function at rest or after exercise. Appl. Physiol. Nutr. Metab. 2016, 41, 1225–1232. [Google Scholar] [CrossRef] [PubMed]
- Caspersen, C.J.; Powell, K.E.; Christenson, G.M. Physical activity, exercise, and physical fitness: Definitions and distinctions for health-related research. Public Health Rep. 1985, 100, 126–131. [Google Scholar] [PubMed]
- Howley, E.T. Type of activity: Resistance, aerobic and leisure versus occupational physical activity. Med. Sci. Sports Exerc. 2001, 33. [Google Scholar] [CrossRef]
- Budde, H.; Schwarz, R.; Velasques, B.; Ribeiro, P.; Holzweg, M.; Machado, S.; Brazaitis, M.; Staack, F.; Wegner, M. The need for differentiating between exercise, physical activity, and training. Autoimmun. Rev. 2016, 15, 110–111. [Google Scholar] [CrossRef] [PubMed]
- Xu, X.; Deng, Z.-Y.; Huang, Q.; Zhang, W.-X.; Qi, C.-Z.; Huang, J.-A. Prefrontal cortex-mediated executive function as assessed by Stroop task performance associates with weight loss among overweight and obese adolescents and young adults. Behav. Brain Res. 2017, 321, 240–248. [Google Scholar] [CrossRef] [PubMed]
- Faulkner, J.; Stoner, L.; Grigg, R.; Fryer, S.; Stone, K.; Lambrick, D. Acute effects of exercise posture on executive function in transient ischemic attack patients. Psychophysiology 2017. [Google Scholar] [CrossRef] [PubMed]
- Endo, K.; Matsukawa, K.; Liang, N.; Nakatsuka, C.; Tsuchimochi, H.; Okamura, H.; Hamaoka, T. Dynamic exercise improves cognitive function in association with increased prefrontal oxygenation. J. Physiol. Sci. 2013, 63, 287–298. [Google Scholar] [CrossRef] [PubMed]
- Moriya, M.; Aoki, C.; Sakatani, K. Effects of Physical exercise on working memory and prefrontal cortex function in post-stroke patients. Adv. Exp. Med. Biol. 2016, 923, 203–208. [Google Scholar] [CrossRef] [PubMed]
- Tsujii, T.; Komatsu, K.; Sakatani, K. Acute effects of physical exercise on prefrontal cortex activity in older adults: A functional near-infrared spectroscopy study. Adv. Exp. Med. Biol. 2013, 765, 293–298. [Google Scholar] [CrossRef] [PubMed]
- Coetsee, C.; Terblanche, E. Cerebral oxygenation during cortical activation: The differential influence of three exercise training modalities. A randomized controlled trial. Eur. J. Appl. Physiol. 2017. [Google Scholar] [CrossRef] [PubMed]
- Chen, T.; Yue, G.H.; Tian, Y.; Jiang, C. Baduanjin mind-body intervention improves the executive control function. Front. Psychol. 2016, 7, 2015. [Google Scholar] [CrossRef] [PubMed]
- Mücke, M.; Andra, C.; Gerber, M.; Puhse, U.; Ludyga, S. Moderate-to-vigorous physical activity, executive functions and prefrontal brain oxygenation in children: A functional near-infrared spectroscopy study. J. Sports Sci. 2017, 1–7. [Google Scholar] [CrossRef] [PubMed]
- Kato, K.; Iwamoto, K.; Kawano, N.; Noda, Y.; Ozaki, N.; Noda, A. Differential effects of physical activity and sleep duration on cognitive function in young adults. J. Sport Health Sci. 2017. [Google Scholar] [CrossRef] [PubMed]
- Sudo, M.; Komiyama, T.; Aoyagi, R.; Nagamatsu, T.; Higaki, Y.; Ando, S. Executive function after exhaustive exercise. Eur. J. Appl. Physiol. 2017. [Google Scholar] [CrossRef] [PubMed]
- Matsuda, K.; Ikeda, S.; Mitsutake, T.; Nakahara, M.; Nagai, Y.; Ikeda, T.; Horikawa, E. Factors influencing executive function by physical activity level among young adults: A near-infrared spectroscopy study. J. Phys. Ther. Sci. 2017, 29, 470–475. [Google Scholar] [CrossRef] [PubMed]
- Makizako, H.; Doi, T.; Shimada, H.; Park, H.; Uemura, K.; Yoshida, D.; Tsutsumimoto, K.; Anan, Y.; Suzuki, T. Relationship between going outdoors daily and activation of the prefrontal cortex during verbal fluency tasks (VFTs) among older adults: A near-infrared spectroscopy study. Arch. Gerontol. Geriatr. 2013, 56, 118–123. [Google Scholar] [CrossRef] [PubMed]
- Sudo, M.; Ando, S.; Nagamatsu, T. Effects of acute static stretching on visual search performance and mood state. J. Phys. Educ. 2015, 15, 651–656. [Google Scholar] [CrossRef]
- Kujach, S.; Byun, K.; Hyodo, K.; Suwabe, K.; Fukuie, T.; Laskowski, R.; Dan, I.; Soya, H. A transferable high-intensity intermittent exercise improves executive performance in association with dorsolateral prefrontal activation in young adults. NeuroImage 2017. [Google Scholar] [CrossRef] [PubMed]
- Giles, G.E.; Cantelon, J.A.; Eddy, M.D.; Brunyé, T.T.; Urry, H.L.; Mahoney, C.R.; Kanarek, R.B. Habitual exercise is associated with cognitive control and cognitive reappraisal success. Exp. Brain Res. 2017. [Google Scholar] [CrossRef] [PubMed]
- Yamazaki, Y.; Sato, D.; Yamashiro, K.; Tsubaki, A.; Yamaguchi, Y.; Takehara, N.; Maruyama, A. Inter-individual differences in exercise-induced spatial working memory improvement: A near-infrared spectroscopy study. Adv. Exp. Med. Biol. 2017, 977, 81–88. [Google Scholar] [CrossRef] [PubMed]
- Fabiani, M.; Gordon, B.A.; Maclin, E.L.; Pearson, M.A.; Brumback-Peltz, C.R.; Low, K.A.; McAuley, E.; Sutton, B.P.; Kramer, A.F.; Gratton, G. Neurovascular coupling in normal aging: A combined optical, ERP and fMRI study. NeuroImage 2014, 85 Pt 1, 592–607. [Google Scholar] [CrossRef] [Green Version]
- Tsuchiya, K.; Mitsui, S.; Fukuyama, R.; Yamaya, N.; Fujita, T.; Shimoda, K.; Tozato, F. An acute bout of housework activities has beneficial effects on executive function. Neuropsychiatr. Dis. Treat. 2018, 14, 61–72. [Google Scholar] [CrossRef] [PubMed]
- Ochi, G.; Yamada, Y.; Hyodo, K.; Suwabe, K.; Fukuie, T.; Byun, K.; Dan, I.; Soya, H. Neural basis for reduced executive performance with hypoxic exercise. NeuroImage 2018, 171, 75–83. [Google Scholar] [CrossRef] [PubMed]
- Chang, H.; Kim, K.; Jung, Y.-J.; Kato, M. Effects of Acute High-Intensity Resistance Exercise on Cognitive Function and Oxygenation in Prefrontal Cortex. J. Exerc. Nutr. Biochem. 2017, 21, 1–8. [Google Scholar] [CrossRef] [PubMed]
- Faulkner, J.; Lambrick, D.; Kaufmann, S.; Stoner, L. Effects of upright and recumbent cycling on executive function and prefrontal cortex oxygenation in young, healthy, men. J. Phys. Act. Health 2016. [Google Scholar] [CrossRef] [PubMed]
- Bediz, C.S.; Oniz, A.; Guducu, C.; Ural Demirci, E.; Ogut, H.; Gunay, E.; Cetinkaya, C.; Ozgoren, M. Acute supramaximal exercise increases the brain oxygenation in relation to cognitive workload. Front. Hum. Neurosci. 2016, 10, 771. [Google Scholar] [CrossRef] [PubMed]
- Cameron, T.A.; Lucas, S.J.E.; Machado, L. Near-infrared spectroscopy reveals link between chronic physical activity and anterior frontal oxygenated hemoglobin in healthy young women. Psychophysiology 2015, 52, 609–617. [Google Scholar] [CrossRef] [PubMed]
- Lambrick, D.; Stoner, L.; Grigg, R.; Faulkner, J. Effects of continuous and intermittent exercise on executive function in children aged 8–10 years. Psychophysiology 2016. [Google Scholar] [CrossRef] [PubMed]
- Ando, S.; Yamada, Y.; Kokubu, M. Reaction time to peripheral visual stimuli during exercise under hypoxia. J. Appl. Physiol. Respir. Environ. Exerc. Physiol. 2010, 108, 1210–1216. [Google Scholar] [CrossRef] [PubMed] [Green Version]
- Strangman, G.; Franceschini, M.A.; Boas, D.A. Factors affecting the accuracy of near-infrared spectroscopy concentration calculations for focal changes in oxygenation parameters. NeuroImage 2003, 18, 865–879. [Google Scholar] [CrossRef]
- Scholkmann, F.; Wolf, M. General equation for the differential pathlength factor of the frontal human head depending on wavelength and age. J. Biomed. Opt. 2013, 18, 105004. [Google Scholar] [CrossRef] [PubMed] [Green Version]
- Duncan, A.; Meek, J.H.; Clemence, M.; Elwell, C.E.; Fallon, P.; Tyszczuk, L.; Cope, M.; Delpy, D.T. Measurement of cranial optical path length as a function of age using phase resolved near infrared spectroscopy. Pediatr. Res. 1996, 39, 889–894. [Google Scholar] [CrossRef] [PubMed]
- Maki, A.; Yamashita, Y.; Ito, Y.; Watanabe, E.; Mayanagi, Y.; Koizumi, H. Spatial and temporal analysis of human motor activity using noninvasive NIR topography. Med. Phys. 1995, 22, 1997–2005. [Google Scholar] [CrossRef] [PubMed]
- Wolf, M.; Ferrari, M.; Quaresima, V. Progress of near-infrared spectroscopy and topography for brain and muscle clinical applications. J. Biomed. Opt. 2007, 12, 62104. [Google Scholar] [CrossRef]
- Brett, M.; Johnsrude, I.S.; Owen, A.M. The problem of functional localization in the human brain. Nat. Rev. Neurosci. 2002, 3, 243–249. [Google Scholar] [CrossRef] [PubMed]
- Zhang, H.; Duan, L.; Zhang, Y.-J.; Lu, C.-M.; Liu, H.; Zhu, C.-Z. Test-retest assessment of independent component analysis-derived resting-state functional connectivity based on functional near-infrared spectroscopy. NeuroImage 2011, 55, 607–615. [Google Scholar] [CrossRef] [PubMed]
- Plichta, M.M.; Herrmann, M.J.; Baehne, C.G.; Ehlis, A.-C.; Richter, M.M.; Pauli, P.; Fallgatter, A.J. Event-related functional near-infrared spectroscopy (fNIRS): Are the measurements reliable? NeuroImage 2006, 31, 116–124. [Google Scholar] [CrossRef] [PubMed]
- Sato, H.; Fuchino, Y.; Kiguchi, M.; Katura, T.; Maki, A.; Yoro, T.; Koizumi, H. Intersubject variability of near-infrared spectroscopy signals during sensorimotor cortex activation. J. Biomed. Opt. 2005, 10, 44001. [Google Scholar] [CrossRef] [PubMed]
- Wiggins, I.M.; Anderson, C.A.; Kitterick, P.T.; Hartley, D.E.H. Speech-evoked activation in adult temporal cortex measured using functional near-infrared spectroscopy (fNIRS): Are the measurements reliable? Hear. Res. 2016, 339, 142–154. [Google Scholar] [CrossRef] [PubMed]
- Orihuela-Espina, F.; Leff, D.R.; James, D.R.C.; Darzi, A.W.; Yang, G.Z. Quality control and assurance in functional near infrared spectroscopy (fNIRS) experimentation. Phys. Med. Biol. 2010, 55, 3701–3724. [Google Scholar] [CrossRef] [PubMed] [Green Version]
- Singh, A.K.; Okamoto, M.; Dan, H.; Jurcak, V.; Dan, I. Spatial registration of multichannel multi-subject fNIRS data to MNI space without MRI. NeuroImage 2005, 27, 842–851. [Google Scholar] [CrossRef] [PubMed]
- Jurcak, V.; Tsuzuki, D.; Dan, I. 10/20, 10/10, and 10/5 systems revisited: Their validity as relative head-surface-based positioning systems. NeuroImage 2007, 34, 1600–1611. [Google Scholar] [CrossRef] [PubMed]
- Tsuzuki, D.; Cai, D.-S.; Dan, H.; Kyutoku, Y.; Fujita, A.; Watanabe, E.; Dan, I. Stable and convenient spatial registration of stand-alone NIRS data through anchor-based probabilistic registration. Neurosci. Res. 2012, 72, 163–171. [Google Scholar] [CrossRef] [PubMed]
- Tsuzuki, D.; Dan, I. Spatial registration for functional near-infrared spectroscopy: From channel position on the scalp to cortical location in individual and group analyses. NeuroImage 2014, 85 Pt 1, 92–103. [Google Scholar] [CrossRef] [Green Version]
- Tsuzuki, D.; Jurcak, V.; Singh, A.K.; Okamoto, M.; Watanabe, E.; Dan, I. Virtual spatial registration of stand-alone fNIRS data to MNI space. NeuroImage 2007, 34, 1506–1518. [Google Scholar] [CrossRef] [PubMed]
- Okamoto, M.; Dan, H.; Sakamoto, K.; Takeo, K.; Shimizu, K.; Kohno, S.; Oda, I.; Isobe, S.; Suzuki, T.; Kohyama, K.; et al. Three-dimensional probabilistic anatomical cranio-cerebral correlation via the international 10–20 system oriented for transcranial functional brain mapping. NeuroImage 2004, 21, 99–111. [Google Scholar] [CrossRef] [PubMed]
- Okamoto, M.; Dan, I. Automated cortical projection of head-surface locations for transcranial functional brain mapping. NeuroImage 2005, 26, 18–28. [Google Scholar] [CrossRef] [PubMed]
- Cutini, S.; Scatturin, P.; Zorzi, M. A new method based on ICBM152 head surface for probe placement in multichannel fNIRS. NeuroImage 2011, 54, 919–927. [Google Scholar] [CrossRef] [PubMed]
- Cutini, S.; Moro, S.; Bisconti, S. Review: Functional near infrared optical imaging in cognitive neuroscience: An introductory review. J. Near Infrared Spectrosc. 2012, 20, 75. [Google Scholar] [CrossRef]
- Zimeo Morais, G.A.; Balardin, J.B.; Sato, J.R. fNIRS Optodes’ Location Decider (fOLD): A toolbox for probe arrangement guided by brain regions-of-interest. Sci. Rep. 2018, 8, 3341. [Google Scholar] [CrossRef] [PubMed]
- Brigadoi, S.; Salvagnin, D.; Fischetti, M.; Cooper, R.J. Array designer: Automated optimized array design for functional near-infrared spectroscopy. Neurophotonics 2018, 5, 1. [Google Scholar] [CrossRef] [PubMed]
- Aasted, C.M.; Yücel, M.A.; Cooper, R.J.; Dubb, J.; Tsuzuki, D.; Becerra, L.; Petkov, M.P.; Borsook, D.; Dan, I.; Boas, D.A. Anatomical guidance for functional near-infrared spectroscopy: AtlasViewer tutorial. Neurophotonics 2015, 2, 20801. [Google Scholar] [CrossRef] [PubMed] [Green Version]
- Dravida, S.; Noah, J.A.; Zhang, X.; Hirsch, J. Comparison of oxyhemoglobin and deoxyhemoglobin signal reliability with and without global mean removal for digit manipulation motor tasks. Neurophotonics 2018, 5, 11006. [Google Scholar] [CrossRef] [PubMed]
- Schönfeldt-Lecuona, C.; Thielscher, A.; Freudenmann, R.W.; Kron, M.; Spitzer, M.; Herwig, U. Accuracy of stereotaxic positioning of transcranial magnetic stimulation. Brain Topogr. 2005, 17, 253–259. [Google Scholar] [CrossRef] [PubMed]
- Machado, A.; Cai, Z.; Pellegrino, G.; Marcotte, O.; Vincent, T.; Lina, J.-M.; Kobayashi, E.; Grova, C. Optimal positioning of optodes on the scalp for personalized functional near-infrared spectroscopy investigations. J. Neurosci. Methods 2018. [Google Scholar] [CrossRef] [PubMed]
- León-Carrión, J.; León-Domniguez, U. Functional Near-Infrared Spectroscopy (fNIRS): Principles and Neuroscientific Applications. In Neuroimaging—Methods; Bright, P., Ed.; InTech: Rijeka, Croatia, 2017; pp. 48–74. [Google Scholar]
- Patil, A.V.; Safaie, J.; Moghaddam, H.A.; Wallois, F.; Grebe, R. Experimental investigation of NIRS spatial sensitivity. Biomed. Opt. Express 2011, 2, 1478–1493. [Google Scholar] [CrossRef] [PubMed]
- Issard, C.; Gervain, J. Variability of the hemodynamic response in infants: Influence of experimental design and stimulus complexity. Dev. Cogn. Neurosci. 2018. [Google Scholar] [CrossRef] [PubMed]
- Ferrari, M.; Mottola, L.; Quaresima, V. principles, techniques, and limitations of near infrared spectroscopy. Can. J. Appl. Physiol. 2004, 29, 463–487. [Google Scholar] [CrossRef] [PubMed]
- Kohri, S.; Hoshi, Y.; Tamura, M.; Kato, C.; Kuge, Y.; Tamaki, N. Quantitative evaluation of the relative contribution ratio of cerebral tissue to near-infrared signals in the adult human head: A preliminary study. Physiol. Meas. 2002, 23, 301–312. [Google Scholar] [CrossRef] [PubMed]
- Funane, T.; Atsumori, H.; Katura, T.; Obata, A.N.; Sato, H.; Tanikawa, Y.; Okada, E.; Kiguchi, M. Quantitative evaluation of deep and shallow tissue layers’ contribution to fNIRS signal using multi-distance optodes and independent component analysis. NeuroImage 2014, 85 Pt 1, 150–165. [Google Scholar] [CrossRef]
- Funane, T.; Homae, F.; Watanabe, H.; Kiguchi, M.; Taga, G. Greater contribution of cerebral than extracerebral hemodynamics to near-infrared spectroscopy signals for functional activation and resting-state connectivity in infants. Neurophotonics 2014, 1, 25003. [Google Scholar] [CrossRef] [PubMed] [Green Version]
- Gunadi, S.; Leung, T.S.; Elwell, C.E.; Tachtsidis, I. Spatial sensitivity and penetration depth of three cerebral oxygenation monitors. Biomed. Opt. Express 2014, 5, 2896–2912. [Google Scholar] [CrossRef] [PubMed]
- Pollonini, L.; Bortfeld, H.; Oghalai, J.S. PHOEBE: A method for real time mapping of optodes-scalp coupling in functional near-infrared spectroscopy. Biomed. Opt. Express 2016, 7, 5104–5119. [Google Scholar] [CrossRef] [PubMed]
- Gusnard, D.A.; Raichle, M.E. Searching for a baseline: Functional imaging and the resting human brain. Nat. Rev. Neurosci. 2001, 2, 685–694. [Google Scholar] [CrossRef] [PubMed]
- Yücel, M.A.; Selb, J.; Aasted, C.M.; Lin, P.-Y.; Borsook, D.; Becerra, L.; Boas, D.A. Mayer waves reduce the accuracy of estimated hemodynamic response functions in functional near-infrared spectroscopy. Biomed. Opt. Express 2016, 7, 3078–3088. [Google Scholar] [CrossRef] [PubMed]
- Tachtsidis, I.; Elwell, C.E.; Leung, T.S.; Lee, C.-W.; Smith, M.; Delpy, D.T. Investigation of cerebral haemodynamics by near-infrared spectroscopy in young healthy volunteers reveals posture-dependent spontaneous oscillations. Physiol. Meas. 2004, 25, 437–445. [Google Scholar] [CrossRef] [PubMed]
- Tachtsidis, I.; Elwell, C.E.; Lee, C.-W.; Leung, T.S.; Smith, M.; Delpy, D.T. Spectral Characteristics of Spontaneous Oscillations in Cerebral Haemodynamics are Posture Dependent. In Oxygen Transport to Tissue XXV; Thorniley, M., Harrison, D.K., James, P.E., Eds.; Springer: Boston, MA, USA, 2003; pp. 31–36. [Google Scholar]
- Ozgoren, M.; Tetik, M.; Izzetoglu, K.; Oniz, A.; Onaral, B. Effect of Body Position on NIRS Based Hemodynamic Measures from Prefrontal Cortex. In Advances in Brain Inspired Cognitive Systems; Hutchison, D., Kanade, T., Kittler, J., Kleinberg, J.M., Mattern, F., Mitchell, J.C., Naor, M., Nierstrasz, O., Pandu Rangan, C., Steffen, B., et al., Eds.; Springer: Berlin/Heidelberg, Germany, 2012; pp. 138–146. [Google Scholar]
- Tsaroucha, A.; Paraskeva, A.; Fassoulaki, A. Measurements of oxygen saturation of brain, liver and heart areas in the supine and sitting position using near infrared spectrophotometry. Rom. J. Anaesth. Intensive Care 2017, 24, 101–106. [Google Scholar] [CrossRef] [PubMed]
- Durantin, G.; Dehais, F.; Delorme, A. Characterization of mind wandering using fNIRS. Front. Syst. Neurosci. 2015, 9, 98. [Google Scholar] [CrossRef] [PubMed] [Green Version]
- Killingsworth, M.A.; Gilbert, D.T. A wandering mind is an unhappy mind. Science 2010, 330, 932. [Google Scholar] [CrossRef] [PubMed]
- Lin, C.T.; Chuang, C.H.; Kerick, S.; Mullen, T.; Jung, T.P.; Ko, L.W.; Chen, S.A.; King, J.T.; McDowell, K. Mind-Wandering Tends to Occur under Low Perceptual Demands during Driving. Sci. Rep. 2016, 6, 21353. [Google Scholar] [CrossRef] [PubMed] [Green Version]
- Spronken, M.; Holland, R.W.; Figner, B.; Dijksterhuis, A. Temporal focus, temporal distance, and mind-wandering valence: Results from an experience sampling and an experimental study. Conscious. Cogn. 2016, 41, 104–118. [Google Scholar] [CrossRef] [PubMed]
- Smallwood, J.; Schooler, J.W. The restless mind. Psychol. Bull. 2006, 132, 946–958. [Google Scholar] [CrossRef] [PubMed]
- Mason, M.F.; Norton, M.I.; van Horn, J.D.; Wegner, D.M.; Grafton, S.T.; Macrae, C.N. Wandering minds: The default network and stimulus-independent thought. Science 2007, 315, 393–395. [Google Scholar] [CrossRef] [PubMed]
- Fox, K.C.; Nijeboer, S.; Solomonova, E.; Domhoff, G.W.; Christoff, K. Dreaming as mind wandering: Evidence from functional neuroimaging and first-person content reports. Front. Hum. Neurosci. 2013, 7, 412. [Google Scholar] [CrossRef] [PubMed]
- Holtzer, R.; Mahoney, J.R.; Izzetoglu, M.; Wang, C.; England, S.; Verghese, J. Online fronto-cortical control of simple and attention-demanding locomotion in humans. NeuroImage 2015, 112, 152–159. [Google Scholar] [CrossRef] [PubMed] [Green Version]
- Holtzer, R.; Verghese, J.; Allali, G.; Izzetoglu, M.; Wang, C.; Mahoney, J.R. Neurological Gait Abnormalities Moderate the Functional Brain Signature of the Posture First Hypothesis. Brain Topogr. 2016, 29, 334–343. [Google Scholar] [CrossRef] [PubMed]
- Cannestra, A.F.; Pouratian, N.; Shomer, M.H.; Toga, A.W. Refractory periods observed by intrinsic signal and fluorescent dye imaging. J. Neurophysiol. 1998, 80, 1522–1532. [Google Scholar] [CrossRef] [PubMed]
- Schroeter, M.L.; Zysset, S.; von Cramon, D.Y. Shortening intertrial intervals in event-related cognitive studies with near-infrared spectroscopy. NeuroImage 2004, 22, 341–346. [Google Scholar] [CrossRef] [PubMed]
- Schroeter, M.L.; Zysset, S.; Wahl, M.; von Cramon, D.Y. Prefrontal activation due to Stroop interference increases during development—An event-related fNIRS study. NeuroImage 2004, 23, 1317–1325. [Google Scholar] [CrossRef] [PubMed]
- Schroeter, M.L.; Bücheler, M.M.; Müller, K.; Uludağ, K.; Obrig, H.; Lohmann, G.; Tittgemeyer, M.; Villringer, A.; von Cramon, D.Y. Towards a standard analysis for functional near-infrared imaging. NeuroImage 2004, 21, 283–290. [Google Scholar] [CrossRef] [PubMed] [Green Version]
- Arichi, T.; Fagiolo, G.; Varela, M.; Melendez-Calderon, A.; Allievi, A.; Merchant, N.; Tusor, N.; Counsell, S.J.; Burdet, E.; Beckmann, C.F.; et al. Development of BOLD signal hemodynamic responses in the human brain. NeuroImage 2012, 63, 663–673. [Google Scholar] [CrossRef] [PubMed] [Green Version]
- Wang, J.; Dong, Q.; Niu, H. The minimum resting-state fNIRS imaging duration for accurate and stable mapping of brain connectivity network in children. Sci. Rep. 2017, 7, 6461. [Google Scholar] [CrossRef] [PubMed]
- Geng, S.; Liu, X.; Biswal, B.B.; Niu, H. Effect of Resting-State fNIRS Scanning Duration on Functional Brain Connectivity and Graph Theory Metrics of Brain Network. Front. Neurosci. 2017, 11, 392. [Google Scholar] [CrossRef] [PubMed]
- Dale, A.M.; Buckner, R.L. Selective averaging of rapidly presented individual trials using fMRI. Hum. Brain Mapp. 1997, 5, 329–340. [Google Scholar] [CrossRef]
- Miezin, F.M.; Maccotta, L.; Ollinger, J.M.; Petersen, S.E.; Buckner, R.L. Characterizing the hemodynamic response: Effects of presentation rate, sampling procedure, and the possibility of ordering brain activity based on relative timing. NeuroImage 2000, 11, 735–759. [Google Scholar] [CrossRef] [PubMed]
- Grabowski, T.J.; Damasio, A.R. Improving functional imaging techniques: The dream of a single image for a single mental event. Proc. Natl. Acad. Sci. USA 1996, 93, 14302–14303. [Google Scholar] [CrossRef] [PubMed] [Green Version]
- Amaro, E.; Barker, G.J. Study design in fMRI: Basic principles. Brain Cogn. 2006, 60, 220–232. [Google Scholar] [CrossRef] [PubMed]
- Friston, K.J.; Zarahn, E.; Josephs, O.; Henson, R.N.; Dale, A.M. Stochastic designs in event-related fMRI. NeuroImage 1999, 10, 607–619. [Google Scholar] [CrossRef] [PubMed]
- Petersen, S.E.; Dubis, J.W. The mixed block/event-related design. NeuroImage 2012, 62, 1177–1184. [Google Scholar] [CrossRef] [PubMed] [Green Version]
- Meltzer, J.A.; Negishi, M.; Constable, R.T. Biphasic hemodynamic responses influence deactivation and may mask activation in block-design fMRI paradigms. Hum. Brain Mapp. 2008, 29, 385–399. [Google Scholar] [CrossRef] [PubMed] [Green Version]
- Donaldson, D.I. Parsing brain activity with fMRI and mixed designs: What kind of a state is neuroimaging in? Trends Neurosci. 2004, 27, 442–444. [Google Scholar] [CrossRef] [PubMed]
- Delpy, D.T.; Cope, M.; van der Zee, P.; Arridge, S.; Wray, S.; Wyatt, J. Estimation of optical pathlength through tissue from direct time of flight measurement. Phys. Med. Biol. 1988, 33, 1433–1442. [Google Scholar] [CrossRef] [PubMed]
- Cope, M.; Delpy, D.T.; Reynolds, E.O.R.; Wray, S.; Wyatt, J.; van der Zee, P. Methods of Quantitating Cerebral Near Infrared Spectroscopy Data. In Oxygen Transport to Tissue X; Mochizuki, M., Honig, C.R., Koyama, T., Goldstick, T.K., Bruley, D.F., Eds.; Springer: Boston, MA, USA, 1988; pp. 183–189. [Google Scholar]
- Talukdar, T.; Moore, J.H.; Diamond, S.G. Continuous correction of differential path length factor in near-infrared spectroscopy. J. Biomed. Opt. 2013, 18, 56001. [Google Scholar] [CrossRef] [PubMed] [Green Version]
- Wang, L.; Ayaz, H.; Izzetoglu, M.; Onaral, B. Evaluation of light detector surface area for functional Near Infrared Spectroscopy. Comput. Biol. Med. 2017, 89, 68–75. [Google Scholar] [CrossRef] [PubMed]
- Zhao, H.; Tanikawa, Y.; Gao, F.; Onodera, Y.; Sassaroli, A.; Tanaka, K.; Yamada, Y. Maps of optical differential pathlength factor of human adult forehead, somatosensory motor and occipital regions at multi-wavelengths in NIR. Phys. Med. Biol. 2002, 47, 2075–2093. [Google Scholar] [CrossRef] [PubMed]
- Kamran, M.A.; Mannann, M.M.N.; Jeong, M.Y. Differential path-length factor’s effect on the characterization of brain’s hemodynamic response function: A functional near-infrared study. Front. Neuroinform. 2018, 12, 37. [Google Scholar] [CrossRef] [PubMed]
- Scholkmann, F.; Zohdi, H.; Nasseri, N.; Wolf, U. Absolute values of optical properties (µa, µ’s, µeff and DPF) of human head tissue: Dependence on head region and individual. Adv. Exp. Med. Biol. 2018, 1072, 325–330. [Google Scholar] [CrossRef] [PubMed]
- Nakamura, K.; Kurihara, K.; Kawaguchi, H.; Obata, T.; Ito, H.; Okada, E. Estimation of partial optical path length in the brain in subject-specific head models for near-infrared spectroscopy. Opt. Rev. 2016, 23, 316–322. [Google Scholar] [CrossRef]
- Essenpreis, M.; Elwell, C.E.; Cope, M.; van der Zee, P.; Arridge, S.R.; Delpy, D.T. Spectral dependence of temporal point spread functions in human tissues. Appl. Opt. 1993, 32, 418–425. [Google Scholar] [CrossRef] [PubMed]
- Hoshi, Y. Functional Near-Infrared Spectroscopy: Potential and Limitations in Neuroimaging Studies; Elsevier: Amsterdam, The Netherlands, 2005; pp. 237–266. [Google Scholar]
- Hoshi, Y. Functional near-infrared spectroscopy: Current status and future prospects. J. Biomed. Opt. 2007, 12, 62106. [Google Scholar] [CrossRef] [PubMed]
- Van der Zee, P.; Cope, M.; Arridge, S.R.; Essenpreis, M.; Potter, L.A.; Edwards, A.D.; Wyatt, J.S.; McCormick, D.C.; Roth, S.C.; Reynolds, E.O.R.; et al. Experimentally Measured Optical Pathlengths for the Adult Head, Calf and Forearm and the Head of the Newborn Infant as a Function of Inter Optode Spacing. In Oxygen Transport to Tissue XIII; Goldstick, T.K., McCabe, M., Maguire, D.J., Eds.; Springer: Boston, MA, USA, 1992; pp. 143–153. [Google Scholar]
- Zohdi, H.; Scholkmann, F.; Nasseri, N.; Wolf, U. Long-term changes in optical properties (µa, µ’s, µeff and DPF) of human head tissue during functional neuroimaging experiments. Adv. Exp. Med. Biol. 2018, 1072, 331–337. [Google Scholar] [CrossRef] [PubMed]
- Janani, A.; Sasikala, M. Investigation of different approaches for noise reduction in functional near-infrared spectroscopy signals for brain–computer interface applications. Neural. Comput. Appl. 2017, 4, 219. [Google Scholar] [CrossRef]
- Chaddad, A. Brain function diagnosis enhanced using denoised fNIRS raw signals. J. Biomed. Sci. Eng. 2014, 07, 218–227. [Google Scholar] [CrossRef]
- Robertson, F.C.; Douglas, T.S.; Meintjes, E.M. Motion artifact removal for functional near infrared spectroscopy: A comparison of methods. IEEE Trans. Biomed. Eng. 2010, 57, 1377–1387. [Google Scholar] [CrossRef] [PubMed]
- Scholkmann, F.; Spichtig, S.; Muehlemann, T.; Wolf, M. How to detect and reduce movement artefacts in near-infrared imaging using moving standard deviation and spline interpolation. Physiol. Meas. 2010, 31, 649–662. [Google Scholar] [CrossRef] [PubMed]
- Kirilina, E.; Yu, N.; Jelzow, A.; Wabnitz, H.; Jacobs, A.M.; Tachtsidis, I. Identifying and quantifying main components of physiological noise in functional near infrared spectroscopy on the prefrontal cortex. Front. Hum. Neurosci. 2013, 7, 864. [Google Scholar] [CrossRef] [PubMed]
- Huppert, T.J.; Diamond, S.G.; Franceschini, M.A.; Boas, D.A. HomER: A review of time-series analysis methods for near-infrared spectroscopy of the brain. Appl. Opt. 2009, 48, 98. [Google Scholar] [CrossRef]
- Cooper, R.J.; Selb, J.; Gagnon, L.; Phillip, D.; Schytz, H.W.; Iversen, H.K.; Ashina, M.; Boas, D.A. A systematic comparison of motion artifact correction techniques for functional near-infrared spectroscopy. Front. Neurosci. 2012, 6, 147. [Google Scholar] [CrossRef] [PubMed] [Green Version]
- Brigadoi, S.; Ceccherini, L.; Cutini, S.; Scarpa, F.; Scatturin, P.; Selb, J.; Gagnon, L.; Boas, D.A.; Cooper, R.J. Motion artefacts in functional near-infrared spectroscopy: A comparison of motion correction techniques applied to real cognitive data. NeuroImage 2014, 85, 181–191. [Google Scholar] [CrossRef] [PubMed]
- Della-Maggiore, V.; Chau, W.; Peres-Neto, P.R.; McIntosh, A.R. An empirical comparison of spm preprocessing parameters to the analysis of fMRI data. NeuroImage 2002, 17, 19–28. [Google Scholar] [CrossRef] [PubMed]
- Kruggel, F.; Cramon, D.Y. von; Descombes, X. Comparison of filtering methods for fMRI datasets. NeuroImage 1999, 10, 530–543. [Google Scholar] [CrossRef] [PubMed]
- Savitzky, A.; Golay, M.J.E. Smoothing and differentiation of data by simplified least squares procedures. Anal. Chem. 1964, 36, 1627–1639. [Google Scholar] [CrossRef]
- Vrana, A.; Meier, M.L.; Hotz-Boendermaker, S.; Humphreys, B.K.; Scholkmann, F. Cortical sensorimotor processing of painful pressure in patients with chronic lower back pain—An optical neuroimaging study using fNIRS. Front. Hum. Neurosci. 2016, 10, 20801. [Google Scholar] [CrossRef] [PubMed]
- Vrana, A.; Meier, M.L.; Hotz-Boendermaker, S.; Humphreys, B.K.; Scholkmann, F. Different mechanosensory stimulations of the lower back elicit specific changes in hemodynamics and oxygenation in cortical sensorimotor areas—A fNIRS study. Brain Behav. 2016, e00575. [Google Scholar] [CrossRef] [PubMed]
- Pfeifer, M.D.; Scholkmann, F.; Labruyère, R. Signal processing in functional near-infrared spectroscopy (fNIRS): Methodological differences lead to different statistical results. Front. Hum. Neurosci. 2018, 11, 20801. [Google Scholar] [CrossRef] [PubMed]
- Schafer, R. What is a Savitzky-Golay filter?: [Lecture Notes]. IEEE Signal Process. Mag. 2011, 28, 111–117. [Google Scholar] [CrossRef]
- Hu, X.-S.; Hong, K.-S.; Ge, S.S. Reduction of trial-to-trial variability in functional near-infrared spectroscopy signals by accounting for resting-state functional connectivity. J. Biomed. Opt. 2013, 18, 17003. [Google Scholar] [CrossRef] [PubMed]
- Naseer, N.; Hong, K.-S. fNIRS-based brain-computer interfaces: A review. Front. Hum. Neurosci. 2015, 9, 3. [Google Scholar] [CrossRef] [PubMed]
- Santosa, H.; Zhai, X.; Fishburn, F.; Huppert, T. The NIRS brain AnalyzIR toolbox. Algorithms 2018, 11, 73. [Google Scholar] [CrossRef]
- Sutoko, S.; Sato, H.; Maki, A.; Kiguchi, M.; Hirabayashi, Y.; Atsumori, H.; Obata, A.; Funane, T.; Katura, T. Tutorial on platform for optical topography analysis tools. Neurophotonics 2016, 3, 10801. [Google Scholar] [CrossRef] [PubMed] [Green Version]
- Xu, J.; Liu, X.; Zhang, J.; Li, Z.; Wang, X.; Fang, F.; Niu, H. FC-NIRS: A functional connectivity analysis tool for near-infrared spectroscopy data. Biomed. Res. Int. 2015, 2015, 248724. [Google Scholar] [CrossRef] [PubMed]
- Ye, J.C.; Tak, S.; Jang, K.E.; Jung, J.; Jang, J. NIRS-SPM: Statistical parametric mapping for near-infrared spectroscopy. NeuroImage 2009, 44, 428–447. [Google Scholar] [CrossRef] [PubMed]
- Fekete, T.; Rubin, D.; Carlson, J.M.; Mujica-Parodi, L.R. The NIRS analysis package: Noise reduction and statistical inference. PLoS ONE 2011, 6, e24322. [Google Scholar] [CrossRef] [PubMed]
- Muccigrosso, D.; Eggebrecht, A. NeuroDOT: A new neuroimaging toolbox for DOT. J. Opt. Soc. Am. 2018. [Google Scholar] [CrossRef]
- Tadel, F.; Baillet, S.; Mosher, J.C.; Pantazis, D.; Leahy, R.M. Brainstorm: A user-friendly application for MEG/EEG analysis. Comput. Intell. Neurosci. 2011, 2011, 879716. [Google Scholar] [CrossRef] [PubMed]
- Tanaka, H.; Katura, T.; Sato, H. Task-related oxygenation and cerebral blood volume changes estimated from NIRS signals in motor and cognitive tasks. NeuroImage 2014, 94, 107–119. [Google Scholar] [CrossRef] [PubMed]
- Tanaka, H.; Katura, T.; Sato, H. Task-related component analysis for functional neuroimaging and application to near-infrared spectroscopy data. NeuroImage 2013, 64, 308–327. [Google Scholar] [CrossRef] [PubMed]
- Yücel, M.A.; Selb, J.; Cooper, R.J.; Boas, D.A. Target principal component analysis: A new motion artefact correction approach for near-infrared spectroscopy. J. Innov. Opt. Health Sci. 2014, 7. [Google Scholar] [CrossRef] [PubMed]
- Cui, X.; Bray, S.; Reiss, A.L. Functional near infrared spectroscopy (NIRS) signal improvement based on negative correlation between oxygenated and deoxygenated hemoglobin dynamics. NeuroImage 2010, 49, 3039–3046. [Google Scholar] [CrossRef] [PubMed] [Green Version]
- Barker, J.W.; Aarabi, A.; Huppert, T.J. Autoregressive model based algorithm for correcting motion and serially correlated errors in fNIRS. Biomed. Opt. Express 2013, 4, 1366–1379. [Google Scholar] [CrossRef] [PubMed]
- Izzetoglu, M.; Chitrapu, P.; Bunce, S.; Onaral, B. Motion artifact cancellation in NIR spectroscopy using discrete Kalman filtering. BioMed. Eng. OnLine 2010, 9, 16. [Google Scholar] [CrossRef] [PubMed] [Green Version]
- Izzetoglu, M.; Devaraj, A.; Bunce, S.; Onaral, B. Motion artifact cancellation in NIR spectroscopy using wiener filtering. IEEE Trans. Biomed. Eng. 2005, 52, 934–938. [Google Scholar] [CrossRef] [PubMed]
- Molavi, B.; Dumont, G.A. Wavelet-based motion artifact removal for functional near-infrared spectroscopy. Physiol. Meas. 2012, 33, 259–270. [Google Scholar] [CrossRef] [PubMed]
- Jang, K.E.; Tak, S.; Jung, J.; Jang, J.; Jeong, Y.; Ye, J.C. Wavelet minimum description length detrending for near-infrared spectroscopy. J. Biomed. Opt. 2009, 14, 34004. [Google Scholar] [CrossRef] [PubMed]
- Chiarelli, A.M.; Maclin, E.L.; Fabiani, M.; Gratton, G. A kurtosis-based wavelet algorithm for motion artifact correction of fNIRS data. NeuroImage 2015, 112, 128–137. [Google Scholar] [CrossRef] [PubMed] [Green Version]
- Sato, H.; Tanaka, N.; Uchida, M.; Hirabayashi, Y.; Kanai, M.; Ashida, T.; Konishi, I.; Maki, A. Wavelet analysis for detecting body-movement artefacts in optical topography signals. NeuroImage 2006, 33, 580–587. [Google Scholar] [CrossRef] [PubMed]
- Virtanen, J.; Noponen, T.; Kotilahti, K.; Virtanen, J.; Ilmoniemi, R.J. Accelerometer-based method for correcting signal baseline changes caused by motion artefacts in medical near-infrared spectroscopy. J. Biomed. Opt. 2011, 16, 87005. [Google Scholar] [CrossRef] [PubMed]
- Zhang, Y.; Brooks, D.H.; Franceschini, M.A.; Boas, D.A. Eigenvector-based spatial filtering for reduction of physiological interference in diffuse optical imaging. J. Biomed. Opt. 2005, 10, 11014. [Google Scholar] [CrossRef] [PubMed]
- Santosa, H.; Hong, M.J.; Kim, S.-P.; Hong, K.-S. Noise reduction in functional near-infrared spectroscopy signals by independent component analysis. Rev. Sci. Instrum. 2013, 84, 73106. [Google Scholar] [CrossRef] [PubMed] [Green Version]
- Fishburn, F.A.; Norr, M.E.; Medvedev, A.V.; Vaidya, C.J. Sensitivity of fNIRS to cognitive state and load. Front. Hum. Neurosci. 2014, 8, 76. [Google Scholar] [CrossRef] [PubMed]
- Lee, G.; Jin, S.H.; An, J. Motion artifact correction of multi-measured functional near-infrared spectroscopy signals based on signal reconstruction using an artificial neural network. Sensors 2018, 18. [Google Scholar] [CrossRef] [PubMed]
- Jahani, S.; Setarehdan, S.K.; Boas, D.A.; Yücel, M.A. Motion artifact detection and correction in functional near-infrared spectroscopy: A new hybrid method based on spline interpolation method and Savitzky-Golay filtering. Neurophotonics 2018, 5, 15003. [Google Scholar] [CrossRef] [PubMed]
- Scholkmann, F.; Metz, A.J.; Wolf, M. Measuring tissue hemodynamics and oxygenation by continuous-wave functional near-infrared spectroscopy--how robust are the different calculation methods against movement artefacts? Physiol. Meas. 2014, 35, 717–734. [Google Scholar] [CrossRef] [PubMed]
- Miyazawa, T.; Horiuchi, M.; Komine, H.; Sugawara, J.; Fadel, P.J.; Ogoh, S. Skin blood flow influences cerebral oxygenation measured by near-infrared spectroscopy during dynamic exercise. Eur. J. Appl. Physiol. 2013, 113, 2841–2848. [Google Scholar] [CrossRef] [PubMed]
- Takahashi, T.; Takikawa, Y.; Kawagoe, R.; Shibuya, S.; Iwano, T.; Kitazawa, S. Influence of skin blood flow on near-infrared spectroscopy signals measured on the forehead during a verbal fluency task. NeuroImage 2011, 57, 991–1002. [Google Scholar] [CrossRef] [PubMed]
- Saager, R.; Berger, A. Measurement of layer-like hemodynamic trends in scalp and cortex: Implications for physiological baseline suppression in functional near-infrared spectroscopy. J. Biomed. Opt. 2008, 13, 34017. [Google Scholar] [CrossRef] [PubMed]
- Gagnon, L.; Yücel, M.A.; Dehaes, M.; Cooper, R.J.; Perdue, K.L.; Selb, J.; Huppert, T.J.; Hoge, R.D.; Boas, D.A. Quantification of the cortical contribution to the NIRS signal over the motor cortex using concurrent NIRS-fMRI measurements. NeuroImage 2012, 59, 3933–3940. [Google Scholar] [CrossRef] [PubMed] [Green Version]
- Al-Rawi, P.G.; Smielewski, P.; Kirkpatrick, P.J. Evaluation of a near-infrared spectrometer (NIRO 300) for the detection of intracranial oxygenation changes in the adult head. Stroke 2001, 32, 2492–2500. [Google Scholar] [CrossRef] [PubMed]
- Canova, D.; Roatta, S.; Bosone, D.; Micieli, G. Inconsistent detection of changes in cerebral blood volume by near infrared spectroscopy in standard clinical tests. J. Appl. Physiol. 2011, 110, 1646–1655. [Google Scholar] [CrossRef] [PubMed] [Green Version]
- Tsubaki, A.; Takai, H.; Kojima, S.; Miyaguchi, S.; Sugawara, K.; Sato, D.; Tamaki, H.; Onishi, H. Changes in cortical oxyhaemoglobin signal during low-intensity cycle ergometer activity: A near-infrared spectroscopy study. Adv. Exp. Med. Biol. 2016, 876, 79–85. [Google Scholar] [CrossRef] [PubMed]
- Tsubaki, A.; Takehara, N.; Sato, D.; Morishita, S.; Tokunaga, Y.; Sugawara, K.; Kojima, S.; Tamaki, H.; Yamazaki, Y.; Onishi, H. Cortical oxyhemoglobin elevation persists after moderate-intensity cycling exercise: A near-infrared spectroscopy study. Adv. Exp. Med. Biol. 2017, 977, 261–268. [Google Scholar] [CrossRef] [PubMed]
- Zimeo Morais, G.A.; Scholkmann, F.; Balardin, J.B.; Furucho, R.A.; de Paula, R.C.V.; Biazoli, C.E.; Sato, J.R. Non-neuronal evoked and spontaneous hemodynamic changes in the anterior temporal region of the human head may lead to misinterpretations of functional near-infrared spectroscopy signals. Neurophoton 2018, 5, 1. [Google Scholar] [CrossRef] [PubMed]
- Schecklmann, M.; Mann, A.; Langguth, B.; Ehlis, A.-C.; Fallgatter, A.J.; Haeussinger, F.B. The Temporal Muscle of the Head Can Cause artefacts in Optical Imaging Studies with Functional Near-Infrared Spectroscopy. Front. Hum. Neurosci. 2017, 11, 25005. [Google Scholar] [CrossRef] [PubMed]
- Matsukawa, K.; Endo, K.; Asahara, R.; Yoshikawa, M.; Kusunoki, S.; Ishida, T. Prefrontal oxygenation correlates to the responses in facial skin blood flows during exposure to pleasantly charged movie. Physiol. Rep. 2017, 5. [Google Scholar] [CrossRef] [PubMed]
- Nasseri, N.; Caicedo, A.; Scholkmann, F.; Zohdi, H.; Wolf, U. Impact of changes in systemic physiology on fnirs/nirs signals: analysis based on oblique subspace projections decomposition. Adv. Exp. Med. Biol. 2018, 1072, 119–125. [Google Scholar] [CrossRef] [PubMed]
- Gagnon, L.; Cooper, R.J.; Yücel, M.A.; Perdue, K.L.; Greve, D.N.; Boas, D.A. Short separation channel location impacts the performance of short channel regression in NIRS. NeuroImage 2012, 59, 2518–2528. [Google Scholar] [CrossRef] [PubMed] [Green Version]
- Gagnon, L.; Perdue, K.; Greve, D.N.; Goldenholz, D.; Kaskhedikar, G.; Boas, D.A. Improved recovery of the hemodynamic response in diffuse optical imaging using short optode separations and state-space modeling. NeuroImage 2011, 56, 1362–1371. [Google Scholar] [CrossRef] [PubMed] [Green Version]
- Gagnon, L.; Yücel, M.A.; Boas, D.A.; Cooper, R.J. Further improvement in reducing superficial contamination in NIRS using double short separation measurements. NeuroImage 2014, 85 Pt 1, 127–135. [Google Scholar] [CrossRef] [Green Version]
- Brigadoi, S.; Cooper, R.J. How short is short? Optimum source-detector distance for short-separation channels in functional near-infrared spectroscopy. Neurophotonics 2015, 2, 25005. [Google Scholar] [CrossRef] [PubMed]
- Goodwin, J.R.; Gaudet, C.R.; Berger, A.J. Short-channel functional near-infrared spectroscopy regressions improve when source-detector separation is reduced. Neurophotonics 2014, 1, 15002. [Google Scholar] [CrossRef] [PubMed] [Green Version]
- Sato, T.; Nambu, I.; Takeda, K.; Aihara, T.; Yamashita, O.; Isogaya, Y.; Inoue, Y.; Otaka, Y.; Wada, Y.; Kawato, M.; et al. Reduction of global interference of scalp-hemodynamics in functional near-infrared spectroscopy using short distance probes. NeuroImage 2016, 141, 120–132. [Google Scholar] [CrossRef] [PubMed] [Green Version]
- Zhang, Y.; Tan, F.; Xu, X.; Duan, L.; Liu, H.; Tian, F.; Zhu, C.-Z. Multiregional functional near-infrared spectroscopy reveals globally symmetrical and frequency-specific patterns of superficial interference. Biomed. Opt. Express. 2015, 6, 2786–2802. [Google Scholar] [CrossRef] [PubMed] [Green Version]
- Saager, R.B.; Telleri, N.L.; Berger, A.J. Two-detector corrected near infrared spectroscopy (C-NIRS) detects hemodynamic activation responses more robustly than single-detector NIRS. NeuroImage 2011, 55, 1679–1685. [Google Scholar] [CrossRef] [PubMed]
- Saager, R.B.; Berger, A.J. Direct characterization and removal of interfering absorption trends in two-layer turbid media. J. Opt. Soc. Am. A 2005, 22, 1874. [Google Scholar] [CrossRef]
- Santosa, H.; Aarabi, A.; Perlman, S.B.; Huppert, T.J. Characterization and correction of the false-discovery rates in resting state connectivity using functional near-infrared spectroscopy. J. Biomed. Opt. 2017, 22, 55002. [Google Scholar] [CrossRef] [PubMed] [Green Version]
- Pumprla, J.; Howorka, K.; Groves, D.; Chester, M.; Nolan, J. Functional assessment of heart rate variability: Physiological basis and practical applications. Int. J. Cardiol. 2002, 84, 1–14. [Google Scholar] [CrossRef]
- Hautala, A.J.; Kiviniemi, A.M.; Tulppo, M.P. Individual responses to aerobic exercise: The role of the autonomic nervous system. Neurosci. Biobehav. Rev. 2009, 33, 107–115. [Google Scholar] [CrossRef] [PubMed]
- Murray, N.P.; Russoniello, C. Acute physical activity on cognitive function: A heart rate variability examination. Appl. Psychophysiol. Biofeedback 2012, 37, 219–227. [Google Scholar] [CrossRef] [PubMed]
- Di Luft, C.B.; Takase, E.; Darby, D. Heart rate variability and cognitive function: Effects of physical effort. Biol. Psychol. 2009, 82, 164–168. [Google Scholar] [CrossRef] [PubMed]
- Ranchet, M.; Morgan, J.C.; Akinwuntan, A.E.; Devos, H. Cognitive workload across the spectrum of cognitive impairments: A systematic review of physiological measures. Neurosci. Biobehav. Rev. 2017, 80, 516–537. [Google Scholar] [CrossRef] [PubMed] [Green Version]
- Soga, K.; Shishido, T.; Nagatomi, R. Executive function during and after acute moderate aerobic exercise in adolescents. Psychol. Sport Exerc. 2015, 16, 7–17. [Google Scholar] [CrossRef]
- Holper, L.; Scholkmann, F.; Wolf, M. The relationship between sympathetic nervous activity and cerebral hemodynamics and oxygenation: A study using skin conductance measurement and functional near-infrared spectroscopy. Behav. Brain Res. 2014, 270, 95–107. [Google Scholar] [CrossRef] [PubMed]
- Scholkmann, F.; Wolf, M.; Wolf, U. The effect of inner speech on arterial CO2 and cerebral hemodynamics and oxygenation: A functional NIRS study. Adv. Exp. Med. Biol. 2013, 789, 81–87. [Google Scholar] [CrossRef] [PubMed] [Green Version]
- Metz, A.J.; Klein, S.D.; Scholkmann, F.; Wolf, U. Continuous coloured light altered human brain haemodynamics and oxygenation assessed by systemic physiology augmented functional near-infrared spectroscopy. Sci. Rep. 2017, 7, 10027. [Google Scholar] [CrossRef] [PubMed]
- Holper, L.; Gross, A.; Scholkmann, F.; Humphreys, B.K.; Meier, M.L.; Wolf, U.; Wolf, M.; Hotz-Boendermaker, S. Physiological effects of mechanical pain stimulation at the lower back measured by functional near-infrared spectroscopy and capnography. J. Integr. Neurosci. 2014, 13, 121–142. [Google Scholar] [CrossRef] [PubMed]
- Murkin, J.M.; Arango, M. Near-infrared spectroscopy as an index of brain and tissue oxygenation. Br. J. Anaesth. 2009, 103 (Suppl. 1), 3–13. [Google Scholar] [CrossRef] [PubMed]
- Blasi, A.; Lloyd-Fox, S.; Johnson, M.H.; Elwell, C. Test-retest reliability of functional near infrared spectroscopy in infants. Neurophotonics 2014, 1, 25005. [Google Scholar] [CrossRef] [PubMed]
- Schecklmann, M.; Ehlis, A.-C.; Plichta, M.M.; Fallgatter, A.J. Functional near-infrared spectroscopy: A long-term reliable tool for measuring brain activity during verbal fluency. NeuroImage 2008, 43, 147–155. [Google Scholar] [CrossRef] [PubMed]
- Strangman, G.; Goldstein, R.; Rauch, S.L.; Stein, J. Near-infrared spectroscopy and imaging for investigating stroke rehabilitation: Test-retest reliability and review of the literature. Arch. Phys. Med. Rehabil. 2006, 87, 9. [Google Scholar] [CrossRef] [PubMed]
- Vitorio, R.; Stuart, S.; Rochester, L.; Alcock, L.; Pantall, A. fNIRS response during walking—Artefact or cortical activity? A systematic review. Neurosci. Biobehav. Rev. 2017, 83, 160–172. [Google Scholar] [CrossRef] [PubMed]
- Holper, L.; Muehlemann, T.; Scholkmann, F.; Eng, K.; Kiper, D.; Wolf, M. Testing the potential of a virtual reality neurorehabilitation system during performance of observation, imagery and imitation of motor actions recorded by wireless functional near-infrared spectroscopy (fNIRS). J. Neuroeng. Rehabil. 2010, 7, 57. [Google Scholar] [CrossRef] [PubMed] [Green Version]
- Khan, M.J.; Hong, K.-S. Passive BCI based on drowsiness detection: An fNIRS study. Biomed. Opt. Express 2015, 6, 4063–4078. [Google Scholar] [CrossRef] [PubMed]
- Halliday, D.W.R.; Mulligan, B.P.; Garrett, D.D.; Schmidt, S.; Hundza, S.R.; Garcia-Barrera, M.A.; Stawski, R.S.; MacDonald, S.W.S. Mean and variability in functional brain activations differentially predict executive function in older adults: An investigation employing functional near-infrared spectroscopy. Neurophotonics 2018, 5, 11013. [Google Scholar] [CrossRef] [PubMed]
- Garrett, D.D.; Lindenberger, U.; Hoge, R.D.; Gauthier, C.J. Age differences in brain signal variability are robust to multiple vascular controls. Sci. Rep. 2017, 7, 10149. [Google Scholar] [CrossRef] [PubMed]
- Armbruster-Genç, D.J.N.; Ueltzhöffer, K.; Fiebach, C.J. Brain Signal Variability Differentially Affects Cognitive Flexibility and Cognitive Stability. J. Neurosci. 2016, 36, 3978–3987. [Google Scholar] [CrossRef] [PubMed] [Green Version]
- Garrett, D.D.; McIntosh, A.R.; Grady, C.L. Brain signal variability is parametrically modifiable. Cereb. Cortex 2014, 24, 2931–2940. [Google Scholar] [CrossRef] [PubMed]
- Garrett, D.D.; Samanez-Larkin, G.R.; MacDonald, S.W.S.; Lindenberger, U.; McIntosh, A.R.; Grady, C.L. Moment-to-moment brain signal variability: A next frontier in human brain mapping? Neurosci. Biobehav. Rev. 2013, 37, 610–624. [Google Scholar] [CrossRef] [PubMed] [Green Version]
- Grady, C.L.; Garrett, D.D. Brain signal variability is modulated as a function of internal and external demand in younger and older adults. NeuroImage 2017, 169, 510–523. [Google Scholar] [CrossRef] [PubMed]
- Tong, Y.; Frederick, B.d. Time lag dependent multimodal processing of concurrent fMRI and near-infrared spectroscopy (NIRS) data suggests a global circulatory origin for low-frequency oscillation signals in human brain. NeuroImage 2010, 53, 553–564. [Google Scholar] [CrossRef] [PubMed] [Green Version]
- Cui, X.; Bray, S.; Reiss, A.L. Speeded near infrared spectroscopy (NIRS) response detection. PLoS ONE 2010, 5, e15474. [Google Scholar] [CrossRef] [PubMed]
- Strangman, G.; Boas, D.A.; Sutton, J.P. Non-invasive neuroimaging using near-infrared light. Biol. Psychiatry 2002, 52, 679–693. [Google Scholar] [CrossRef]
- Steinbrink, J.; Villringer, A.; Kempf, F.; Haux, D.; Boden, S.; Obrig, H. Illuminating the BOLD signal: Combined fMRI-fNIRS studies. Magn. Reson. Imaging 2006, 24, 495–505. [Google Scholar] [CrossRef] [PubMed]
- Uga, M.; Dan, I.; Sano, T.; Dan, H.; Watanabe, E. Optimizing the general linear model for functional near-infrared spectroscopy: An adaptive hemodynamic response function approach. Neurophotonics 2014, 1, 15004. [Google Scholar] [CrossRef] [PubMed]
- Boas, D.A.; Jones, S.R.; Devor, A.; Huppert, T.J.; Dale, A.M. A vascular anatomical network model of the spatio-temporal response to brain activation. NeuroImage 2008, 40, 1116–1129. [Google Scholar] [CrossRef] [PubMed] [Green Version]
- Boden, S.; Obrig, H.; Köhncke, C.; Benav, H.; Koch, S.P.; Steinbrink, J. The oxygenation response to functional stimulation: Is there a physiological meaning to the lag between parameters? NeuroImage 2007, 36, 100–107. [Google Scholar] [CrossRef] [PubMed]
- Tam, N.D.; Zouridakis, G. Temporal decoupling of oxy- and deoxy-hemoglobin hemodynamic responses detected by functional near-infrared spectroscopy (fNIRS). JBEMi 2014, 1, 18–28. [Google Scholar] [CrossRef] [Green Version]
- Tam, N.D.; Zouridakis, G. Differential temporal activation of oxy- and deoxy-hemodynamic signals in optical imaging using functional near-infrared spectroscopy (fNIRS). BMC Neurosci. 2015, 16, P245. [Google Scholar] [CrossRef]
- Obrig, H.; Hirth, C.; Junge-Hülsing, J.G.; Döge, C.; Wolf, T.; Dirnagl, U.; Villringer, A. Cerebral oxygenation changes in response to motor stimulation. J. Appl. Physiol. 1996, 81, 1174–1183. [Google Scholar] [CrossRef] [PubMed]
- Malonek, D.; Grinvald, A. Vascular Regulation at Sub Millimeter Range. In Optical Imaging of Brain Function and Metabolism 2: Physiological Basis and Comparison to Other Functional Neuroimaging Methods; Villringer, A., Dirnagl, U., Eds.; Springer: Boston, MA, USA, 1997; pp. 215–220. [Google Scholar]
- Friston, K.J.; Josephs, O.; Rees, G.; Turner, R. Nonlinear event-related responses in fMRI. Magn. Reson. Med. 1998, 39, 41–52. [Google Scholar] [CrossRef] [PubMed] [Green Version]
- Kumar, V.; Shivakumar, V.; Chhabra, H.; Bose, A.; Venkatasubramanian, G.; Gangadhar, B.N. Functional near infra-red spectroscopy (fNIRS) in schizophrenia: A review. Asian J. Plant Pathol. 2017, 27, 18–31. [Google Scholar] [CrossRef] [PubMed]
- Seidel, O.; Carius, D.; Kenville, R.; Ragert, P. Motor learning in a complex balance task and associated neuroplasticity: A comparison between endurance athletes and non-athletes. J. Neurophysiol. 2017. [Google Scholar] [CrossRef] [PubMed]
- Obrig, H.; Neufang, M.; Wenzel, R.; Kohl, M.; Steinbrink, J.; Einhäupl, K.; Villringer, A. Spontaneous low frequency oscillations of cerebral hemodynamics and metabolism in human adults. NeuroImage 2000, 12, 623–639. [Google Scholar] [CrossRef] [PubMed]
- Haeussinger, F.B.; Dresler, T.; Heinzel, S.; Schecklmann, M.; Fallgatter, A.J.; Ehlis, A.-C. Reconstructing functional near-infrared spectroscopy (fNIRS) signals impaired by extra-cranial confounds: An easy-to-use filter method. NeuroImage 2014, 95, 69–79. [Google Scholar] [CrossRef] [PubMed]
- Heinzel, S.; Haeussinger, F.B.; Hahn, T.; Ehlis, A.-C.; Plichta, M.M.; Fallgatter, A.J. Variability of (functional) hemodynamics as measured with simultaneous fNIRS and fMRI during intertemporal choice. NeuroImage 2013, 71, 125–134. [Google Scholar] [CrossRef] [PubMed]
- Strangman, G.; Culver, J.P.; Thompson, J.H.; Boas, D.A. A quantitative comparison of simultaneous BOLD fMRI and NIRS recordings during functional brain activation. NeuroImage 2002, 17, 719–731. [Google Scholar] [CrossRef] [PubMed]
- Kleinschmidt, A.; Obrig, H.; Requardt, M.; Merboldt, K.D.; Dirnagl, U.; Villringer, A.; Frahm, J. Simultaneous recording of cerebral blood oxygenation changes during human brain activation by magnetic resonance imaging and near-infrared spectroscopy. J. Cereb. Blood Flow Metab. 1996, 16, 817–826. [Google Scholar] [CrossRef] [PubMed]
- Toronov, V.; Webb, A.; Choi, J.H.; Wolf, M.; Michalos, A.; Gratton, E.; Hueber, D. Investigation of human brain hemodynamics by simultaneous near-infrared spectroscopy and functional magnetic resonance imaging. Med. Phys. 2001, 28, 521–527. [Google Scholar] [CrossRef] [PubMed] [Green Version]
- Huppert, T.J.; Hoge, R.D.; Diamond, S.G.; Franceschini, M.A.; Boas, D.A. A temporal comparison of BOLD, ASL, and NIRS hemodynamic responses to motor stimuli in adult humans. NeuroImage 2006, 29, 368–382. [Google Scholar] [CrossRef] [PubMed] [Green Version]
- Huppert, T.J.; Hoge, R.D.; Dale, A.M.; Franceschini, M.A.; Boas, D.A. Quantitative spatial comparison of diffuse optical imaging with blood oxygen level-dependent and arterial spin labeling-based functional magnetic resonance imaging. J. Biomed. Opt. 2006, 11, 64018. [Google Scholar] [CrossRef] [PubMed] [Green Version]
- Toronov, V.Y.; Zhang, X.; Webb, A.G. A spatial and temporal comparison of hemodynamic signals measured using optical and functional magnetic resonance imaging during activation in the human primary visual cortex. NeuroImage 2007, 34, 1136–1148. [Google Scholar] [CrossRef] [PubMed] [Green Version]
- Kono, T.; Matsuo, K.; Tsunashima, K.; Kasai, K.; Takizawa, R.; Rogers, M.A.; Yamasue, H.; Yano, T.; Taketani, Y.; Kato, N. Multiple-time replicability of near-infrared spectroscopy recording during prefrontal activation task in healthy men. Neurosci. Res. 2007, 57, 504–512. [Google Scholar] [CrossRef] [PubMed]
- Plichta, M.M.; Herrmann, M.J.; Baehne, C.G.; Ehlis, A.-C.; Richter, M.M.; Pauli, P.; Fallgatter, A.J. Event-related functional near-infrared spectroscopy (fNIRS) based on craniocerebral correlations: Reproducibility of activation? Hum. Brain Mapp. 2007, 28, 733–741. [Google Scholar] [CrossRef] [PubMed]
- Cannestra, A.F.; Wartenburger, I.; Obrig, H.; Villringer, A.; Toga, A.W. Functional assessment of Broca’s area using near infrared spectroscopy in humans. NeuroReport 2003, 14, 1961–1965. [Google Scholar] [CrossRef] [PubMed]
- Hoshi, Y.; Yamada, Y. Overview of diffuse optical tomography and its clinical applications. J. Biomed. Opt. 2016, 21, 91312. [Google Scholar] [CrossRef] [PubMed] [Green Version]
- Miyai, I.; Tanabe, H.C.; Sase, I.; Eda, H.; Oda, I.; Konishi, I.; Tsunazawa, Y.; Suzuki, T.; Yanagida, T.; Kubota, K. Cortical mapping of gait in humans: A near-infrared spectroscopic topography study. NeuroImage 2001, 14, 1186–1192. [Google Scholar] [CrossRef] [PubMed]
- Watanabe, E.; Yamashita, Y.; Maki, A.; Ito, Y.; Koizumi, H. Non-invasive functional mapping with multi-channel near infra-red spectroscopic topography in humans. Neurosci. Lett. 1996, 205, 41–44. [Google Scholar] [CrossRef]
- Yamamoto, T.; Kato, T. Paradoxical correlation between signal in functional magnetic resonance imaging and deoxygenated haemoglobin content in capillaries: A new theoretical explanation. Phys. Med. Biol. 2002, 47, 1121–1141. [Google Scholar] [CrossRef] [PubMed]
- Hoshi, Y. Functional near-infrared optical imaging: Utility and limitations in human brain mapping. Psychophysiology 2003, 40, 511–520. [Google Scholar] [CrossRef] [PubMed]
- Boas, D.A.; Gaudette, T.; Strangman, G.; Cheng, X.; Marota, J.J.; Mandeville, J.B. The accuracy of near infrared spectroscopy and imaging during focal changes in cerebral hemodynamics. NeuroImage 2001, 13, 76–90. [Google Scholar] [CrossRef] [PubMed]
- Holper, L.; Shalom, D.E.; Wolf, M.; Sigman, M. Understanding inverse oxygenation responses during motor imagery: A functional near-infrared spectroscopy study. Eur. J. Neurosci. 2011, 33, 2318–2328. [Google Scholar] [CrossRef] [PubMed]
- Tak, S.; Ye, J.C. Statistical analysis of fNIRS data: A comprehensive review. NeuroImage 2014, 85, 72–91. [Google Scholar] [CrossRef] [PubMed]
- Huppert, T.J. Commentary on the statistical properties of noise and its implication on general linear models in functional near-infrared spectroscopy. Neurophotonics 2016, 3, 10401. [Google Scholar] [CrossRef] [PubMed] [Green Version]
- Singh, A.K.; Dan, I. Exploring the false discovery rate in multichannel NIRS. NeuroImage 2006, 33, 542–549. [Google Scholar] [CrossRef] [PubMed]
- Glickman, M.E.; Rao, S.R.; Schultz, M.R. False discovery rate control is a recommended alternative to Bonferroni-type adjustments in health studies. J. Clin. Epidemiol. 2014, 67, 850–857. [Google Scholar] [CrossRef] [PubMed]
- Benjamini, Y.; Hochberg, Y. Controlling the False Discovery Rate: A Practical and Powerful Approach to Multiple Testing. J. R. Stat. Soc. Ser. B Stat. Methodol. 1995, 57, 289–300. [Google Scholar]
- Boisgontier, M.P.; Cheval, B. The anova to mixed model transition. Neurosci. Biobehav. Rev. 2016. [Google Scholar] [CrossRef] [PubMed]
- Aarts, E.; Verhage, M.; Veenvliet, J.V.; Dolan, C.V.; van der Sluis, S. A solution to dependency: Using multilevel analysis to accommodate nested data. Nat. Neurosci. 2014, 17, 491–496. [Google Scholar] [CrossRef] [PubMed]
- Judd, C.M.; Westfall, J.; Kenny, D.A. Treating stimuli as a random factor in social psychology: A new and comprehensive solution to a pervasive but largely ignored problem. J. Pers. Soc. Psychol. 2012, 103, 54–69. [Google Scholar] [CrossRef] [PubMed]
- Bolker, B.M.; Brooks, M.E.; Clark, C.J.; Geange, S.W.; Poulsen, J.R.; Stevens, M.H.H.; White, J.-S.S. Generalized linear mixed models: A practical guide for ecology and evolution. Trends Ecol. Evol. 2009, 24, 127–135. [Google Scholar] [CrossRef] [PubMed]
- Plichta, M.M.; Heinzel, S.; Ehlis, A.C.; Pauli, P.; Fallgatter, A.J. Model-based analysis of rapid event-related functional near-infrared spectroscopy (NIRS) data: A parametric validation study. NeuroImage 2007, 35, 625–634. [Google Scholar] [CrossRef] [PubMed]
- Kamran, M.A.; Mannan, M.M.N.; Jeong, M.Y. Cortical Signal Analysis and Advances in Functional Near-Infrared Spectroscopy Signal: A Review. Front. Hum. Neurosci. 2016, 10, 261. [Google Scholar] [CrossRef] [PubMed]
- Ikegami, T.; Taga, G. Decrease in cortical activation during learning of a multi-joint discrete motor task. Exp. Brain Res. 2008, 191, 221–236. [Google Scholar] [CrossRef] [PubMed]
- Ong, M.; Russell, P.N.; Helton, W.S. Frontal cerebral oxygen response as an indicator of initial attention effort during perceptual learning. Exp. Brain Res. 2013, 229, 571–578. [Google Scholar] [CrossRef] [PubMed]
- Ono, Y.; Noah, J.A.; Zhang, X.; Nomoto, Y.; Suzuki, T.; Shimada, S.; Tachibana, A.; Bronner, S.; Hirsch, J. Motor learning and modulation of prefrontal cortex: An fNIRS assessment. J. Neural. Eng. 2015, 12, 66004. [Google Scholar] [CrossRef] [PubMed]
- Chang, Y.K.; Labban, J.D.; Gapin, J.I.; Etnier, J.L. The effects of acute exercise on cognitive performance: A meta-analysis. Brain Res. 2012, 1453, 87–101. [Google Scholar] [CrossRef] [PubMed] [Green Version]
- McMorris, T.; Hale, B.J. Differential effects of differing intensities of acute exercise on speed and accuracy of cognition: A meta-analytical investigation. Brain Cogn. 2012, 80, 338–351. [Google Scholar] [CrossRef] [PubMed]
- Crush, E.A.; Loprinzi, P.D. Dose-Response Effects of Exercise Duration and Recovery on Cognitive Functioning. Percept. Mot. Skills 2017, 124. [Google Scholar] [CrossRef] [PubMed]
- McMorris, T.; Hale, B.J.; Barwood, M.; Costello, J.; Corbett, J. Effect of acute hypoxia on cognition: A systematic review and meta-regression analysis. Neurosci. Biobehav. Rev. 2017. [Google Scholar] [CrossRef] [PubMed]
- Davenport, M.H.; Hogan, D.B.; Eskes, G.A.; Longman, R.S.; Poulin, M.J. Cerebrovascular reserve: The link between fitness and cognitive function? Exerc. Sport Sci. Rev. 2012, 40, 153–158. [Google Scholar] [CrossRef] [PubMed]
- Brown, A.D.; McMorris, C.A.; Longman, R.S.; Leigh, R.; Hill, M.D.; Friedenreich, C.M.; Poulin, M.J. Effects of cardiorespiratory fitness and cerebral blood flow on cognitive outcomes in older women. Neurobiol. Aging 2010, 31, 2047–2057. [Google Scholar] [CrossRef] [PubMed]
- Billinger, S.A.; Vidoni, E.D.; Morris, J.K.; Thyfault, J.P.; Burns, J.M. Exercise Test Performance Reveals Evidence of the Cardiorespiratory Fitness Hypothesis. J. Aging Phys. Act. 2017, 25, 240–246. [Google Scholar] [CrossRef] [PubMed]
- Burke, T.M.; Scheer, F.A.J.L.; Ronda, J.M.; Czeisler, C.A.; Wright, K.P. Sleep inertia, sleep homeostatic and circadian influences on higher-order cognitive functions. J. Sleep Res. 2015, 24, 364–371. [Google Scholar] [CrossRef] [PubMed] [Green Version]
- Anderson, J.A.E.; Campbell, K.L.; Amer, T.; Grady, C.L.; Hasher, L. Timing is everything: Age differences in the cognitive control network are modulated by time of day. Psychol. Aging 2014, 29, 648–657. [Google Scholar] [CrossRef] [PubMed]
- Hodyl, N.A.; Schneider, L.; Vallence, A.-M.; Clow, A.; Ridding, M.C.; Pitcher, J.B. The cortisol awakening response is associated with performance of a serial sequence reaction time task. Int. J. Psychophysiol. 2016, 100, 12–18. [Google Scholar] [CrossRef] [PubMed]
- Schroeter, M.L.; Bücheler, M.M.; Scheid, R. Circadian variability is negligible in primary visual cortices as measured by fNIRS. Int. J. Psychophysiol. 2006, 62, 9–13. [Google Scholar] [CrossRef] [PubMed]
- Scholkmann, F.; Gerber, U.; Wolf, M.; Wolf, U. End-tidal CO2: An important parameter for a correct interpretation in functional brain studies using speech tasks. NeuroImage 2013, 66, 71–79. [Google Scholar] [CrossRef] [PubMed]
- Scholkmann, F.; Klein, S.D.; Gerber, U.; Wolf, M.; Wolf, U. Cerebral hemodynamic and oxygenation changes induced by inner and heard speech: A study combining functional near-infrared spectroscopy and capnography. J. Biomed. Opt. 2014, 19, 17002. [Google Scholar] [CrossRef] [PubMed]
- Szabo, K.; Lako, E.; Juhasz, T.; Rosengarten, B.; Csiba, L.; Olah, L. Hypocapnia induced vasoconstriction significantly inhibits the neurovascular coupling in humans. J. Neurol. Sci. 2011, 309, 58–62. [Google Scholar] [CrossRef] [PubMed]
- Chang, Y.-K.; Chi, L.; Etnier, J.L.; Wang, C.-C.; Chu, C.-H.; Zhou, C. Effect of acute aerobic exercise on cognitive performance: Role of cardiovascular fitness. Psychol. Sport Exerc. 2014, 15, 464–470. [Google Scholar] [CrossRef]
- Oberste, M.; Bloch, W.; Hubner, S.T.; Zimmer, P. Do Reported Effects of Acute Aerobic Exercise on Subsequent Higher Cognitive Performances Remain if Tested against an Instructed Self-Myofascial Release Training Control Group? A Randomized Controlled Trial. PLoS ONE 2016, 11, e0167818. [Google Scholar] [CrossRef] [PubMed]
- Donath, L.; Ludyga, S.; Hammes, D.; Rossmeissl, A.; Andergassen, N.; Zahner, L.; Faude, O. Absolute and relative reliability of acute effects of aerobic exercise on executive function in seniors. BMC geriatrics 2017, 17, 247. [Google Scholar] [CrossRef] [PubMed]
- Loprinzi, P.D.; Frith, E. The Role of Sex in Memory Function: Considerations and Recommendations in the Context of Exercise. Int. J. Clin. Med. 2018, 7, 132. [Google Scholar] [CrossRef] [PubMed]
- Barha, C.K.; Davis, J.C.; Falck, R.S.; Nagamatsu, L.S.; Liu-Ambrose, T. Sex differences in exercise efficacy to improve cognition: A systematic review and meta-analysis of randomized controlled trials in older humans. Front. Neuroendocrinol. 2017. [Google Scholar] [CrossRef] [PubMed]
- Barha, C.K.; Liu-Ambrose, T. Exercise and the Aging Brain: Considerations for Sex Differences. Brain Plast. 2018, 3, 1–11. [Google Scholar] [CrossRef]
- Barha, C.K.; Galea, L.A.; Nagamatsu, L.S.; Erickson, K.I.; Liu-Ambrose, T. Personalising exercise recommendations for brain health: Considerations and future directions. Br. J. Sports Med. 2017, 51, 636–639. [Google Scholar] [CrossRef] [PubMed]
- Li, T.; Luo, Q.; Gong, H. Gender-specific hemodynamics in prefrontal cortex during a verbal working memory task by near-infrared spectroscopy. Behav. Brain Res. 2010, 209, 148–153. [Google Scholar] [CrossRef] [PubMed]
- Yang, H.; Wang, Y.; Zhou, Z.; Gong, H.; Luo, Q.; Wang, Y.; Lu, Z. Sex differences in prefrontal hemodynamic response to mental arithmetic as assessed by near-infrared spectroscopy. Gend. Med. 2009, 6, 565–574. [Google Scholar] [CrossRef] [PubMed]
- Loprinzi, P.D.; Edwards, M.K.; Frith, E. Potential avenues for exercise to activate episodic memory-related pathways: A narrative review. Eur. J. Neurosci. 2017. [Google Scholar] [CrossRef] [PubMed]
- Müller, P.; Schmicker, M.; Müller, N.G. Präventionsstrategien gegen Demenz. Z. Gerontol. Geriatr. 2017. [Google Scholar] [CrossRef] [PubMed]
- Paillard, T. Preventive effects of regular physical exercise against cognitive decline and the risk of dementia with age advancement. J. Sports Med. 2015, 1, 4. [Google Scholar] [CrossRef] [PubMed]
- Loprinzi, P.D.; Herod, S.M.; Cardinal, B.J.; Noakes, T.D. Physical activity and the brain: A review of this dynamic, bi-directional relationship. Brain Res. 2013, 1539, 95–104. [Google Scholar] [CrossRef] [PubMed]


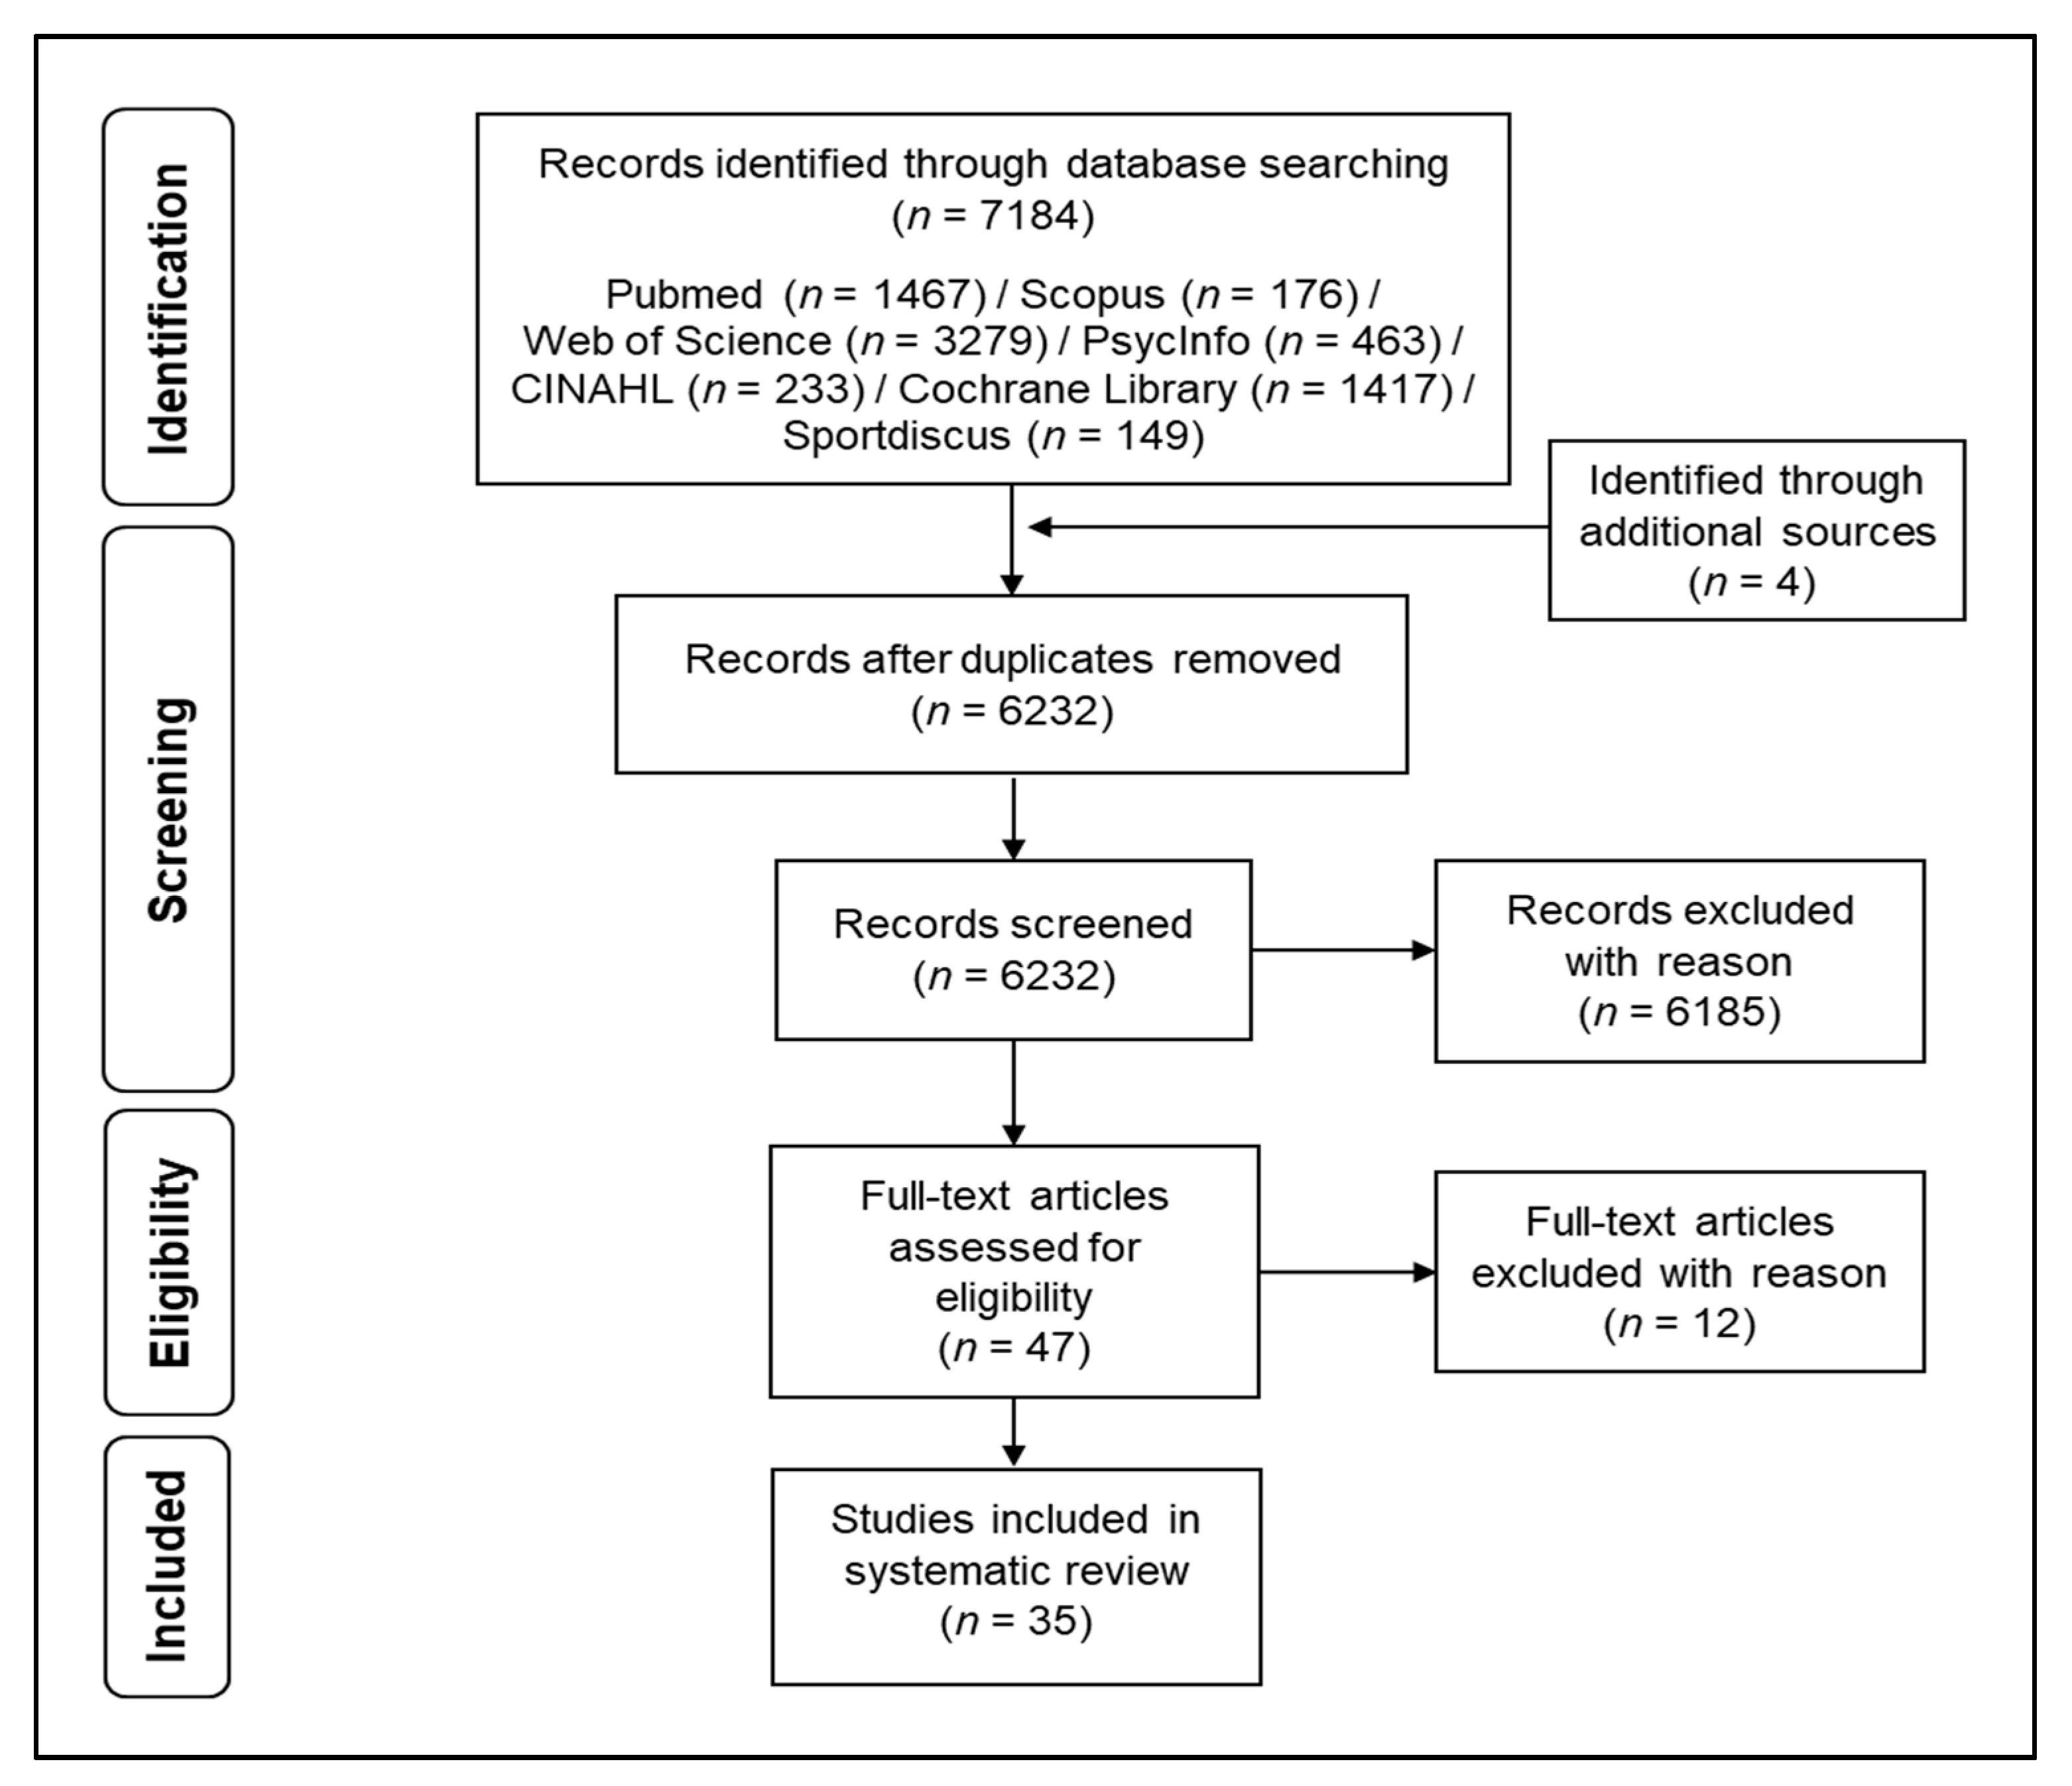
| First Author | Sample Characteristics—Number of Participants (n)/Mean Age in Years ± SD | Main Findings | Region of Interest (ROI) |
|---|---|---|---|
| Studies conducting an acute bout of physical activity | |||
| Ando et al. [120] | Healthy young adults n = 10 m/25.1 ± 3.4 | After cycling vs. prior cycling (normoxia): - ↑ oxyHb and TOI in rt. PFC during CT | rt. PFC |
| Bediz et al. [117] | Healthy young adults HP n = 18 m/21.0 ± 2.6 LP n = 17 m/20.6 ± 2.1 | After cycling vs. prior cycling:
| lt., rt. and md. PFC |
| Byun et al. [8] | Healthy young adults n = 25 (12 f, 13 m)/20.6 ± 1.0 | After cycling vs. control condition (sitting):
| lt. and rt. DLPFC, VLPFC; FPA |
| Chang et al. [115] | Healthy young adults HC n = 9 f/21.8 ± 1.4 HIR n = 9 f/21.1 ± 1.6 MIC n = 9 f/20.4 ± 1.5 HIA n = 9 f/22.1 ± 1.4 | Post-test (neutral condition):
| lt. and rt. PFC |
| Endo et al. [98] | Healthy young adults n = 13 (8 f, 5 m)/23.0 ± 1.0 | After cycling vs. prior cycling:
After cycling vs. control condition (sitting):
| lt. and/or rt. DLPFC |
| Faulkner et al. [116] | Healthy young adults n = 17 m/24.6 ± 4.3 | After cycling vs. prior cylcing: - ↑ rSO2 in PFC during CT | lt. and rt. PFC |
| Faulkner et al. [97] | Patients with TIA and HC TIA n = 11 (2 f, 9 m)/65.0 ± 10.0 HC n = 15 (2 f, 13 m)/62.0 ± 7.0 | After cycling vs. prior cycling:
| dominant side of PFC 1 |
| Hyodo et al. [7] | Healthy older adults n = 16 (5 f, 28 m)/69.3 ± 3.5 | After cycling vs. control condition (sitting):
| lt. and rt. DLPFC, VLPFC; FPA |
| Hyodo et al. [77] | Healthy older adults n = 13 (6 f, 7 m)/69.7 ± 2.7 (f); 69.3 ± 2.8 (m) | Cycling vs. dancing: - no significant differences between timepoints or groups | lt. and rt. DLPFC, VLPFC; FPA |
| Kujach et al. [109] | Healthy, sedentary young adults n = 25 (9 f, 16 m)/20.7 ± 1.9 (f); 21.1 ± 1.9 (m) | After cycling vs. prior cycling:
| lt. and rt. DLPFC, VLPFC; FPA |
| Lambrick et al. [119] | Healthy children n = 20 (11 f, 9 m)/8.8 ± 0.8 | After running vs. prior running:
| dominant side of PFC 1 |
| Moriya et al. [99] | Patients suffering from stroke n = 11 (4 f, 7 m)/69.6 ± 12.0 | After cycling vs. prior cycling: - ↑ oxyHb in rt. PFC post-exercise during CT | rt. and lt. PFC |
| Murata et al. [78] | Healthy young adults n = 15 (6 f, 9 m)/21.7 ± 2.4; 21.6 ± 3.0 (f); 21.8 ± 2.2 (m) | After cycling vs. prior cycling: - ↓ lt. DLPFC and SMA post-exercise during CT (Go-trials) | rt. and lt. DLPFC, SMA |
| Ochi et al. [114] | Healthy young adults n = 15 (8 f, 7 m)/20.7 ± 2.1 (18-25) | After cycling (normobaric hypoxia) vs. control condition (sitting/normobaric hypoxia):
| lt. and rt. DLPFC, VLPFC; FPA |
| Sudo et al. [108] | Healthy young adults Stretching group n = 8 m/23.9 ± 2.3 Control group n = 8 m/23.8 ± 2.1 | After stretching vs. prior stretching:
| lt. PFC |
| Sudo et al. [105] | Healthy young adults Cycling group n = 18 m/23.2 ± 2.1 Control group n = 14 m/22.3 ± 2.3 | After cycling vs. prior cycling:
| rt. PFC |
| Tsuchiya et al. [113] | Healthy young adults n = 25 (19 f, 6 m)/19.88 ± 0.60 (18-21) | Housework activities vs. control condition:
| lt. and rt. DLPFC, VLPFC; FPA |
| Tsujii et al. [100] | Healthy older adults n = 14 (9 f, 7 m)/65.9 ± 1.0 | After cycling vs. control condition (sitting): - ↑ oxyHb in lt. PFC during CT | rt. and lt. PFC |
| Yamazaki et al. [111] | Healthy young adults n = 14 (6 f, 8 m)/22 ± 0.6 | After recumbent cycling vs. prior cycling: - oxyHb no difference in the ROI’s during CT Responders vs. Non-Responders 2: - ↑ (maximum peak) oxyHb in rt. VLPFC during exercise | lt. and rt. DLPFC, VLPFC; FPA |
| Yanagisawa et al. [6] | Healthy young adults n = 20 (3 f, 17 m)/21.5 ± 4.8 | After cycling vs. control condition (sitting):
| lt. and rt. DLPFC, VLPFC; FPA |
| Studies conducting long-term physical exercises | |||
| Chen et al. [102] | Healthy young adults n = 42 (26 f, 16 m)/22.5 ± 2.0 | Post-test vs. pre-test: - ↑ oxyHb in lt. PFC in BMB (incongruent condition) | lt. and rt. PFC |
| Coetsee et al. [101] | Healthy older adults HIIT n = 13 (10 f, 3 m)/64.5 ± 6.3 MCT n = 13 (10 f, 3m)/61.6 ± 5.8 ReT n = 22 (15 f, 7 m)/62.4 ± 5.1 CON n = 19 (11 f, 8 m)/62.5 ± 5.6 | Post-test vs. pre-test:
| lt.and rt. PFC |
| Wang et al. [79] | Healthy older adults n = 12 (8 f, 4 m)/64.25 ± 3.14 (60 - 68) | Post-test vs. pre-test (after Tai-Chi intervention): - no significant differences between timepoints | frontal cortex |
| Xu et al. [96] | Obese young adults n = 31 (12 f, 19 m)/18.2 ± 3.2 | Participants with higher weight reduction vs. participants with lower weight reduction: - ↑ oxyHb in lt. and rt. DLPFC, VLPFC; FPA during CT | lt. and rt. DLPFC, VLPFC; FPA |
| Cross-sectional studies | |||
| Albinet et al. [13] | Healthy older adults n = 40 f/60-77 (low-fit group n = 17/high-fit group n = 17) | High-fit group vs. low-fit group: - ↑ oxyHb in rt. DLPFC Low-fit group: - ↑ oxyHb in rt. DLPFC compared to lt. DLPFC Correlation between hemodynamic responses during CT and physical fitness:
| lt. and rt. DLPFC |
| Cameron et al. [118] | Healthy young adults n = 52 f/20.7 ± 2.3 | Correlation between hemodynamic responses during CT and measures of physical activity or cognition:
| rt. PFC |
| Dupuy et al. [11] | Healthy younger adults n = 22 f/24.6 ± 3.6 (19-34) Healthy older adults n = 36 f/62.9 ± 5.4 (55-72) | High-fit individuals vs. low-fit individuals:
| lt. and rt., ant. and post. DLPFC and VLPFC |
| Fabiani et al. [112] | Healthy, high-fit older adults n = 20 (11 f, 9 m)/70.3 ± 4.2 Healthy, low-fit older adults n = 24 (13 f, 11 m)/72.2 ± 5.2 | High-fit older adults vs. low-fit older adults:
| lt. and rt. occipital cortex |
| Giles et al. [110] | Healthy young adults n = 74 (50 f, 24 m)/19.55 ± 0.27 | Correlation between hemodynamic responses during CT and habitual exercise level:
| ant. PFC and DLPFC |
| Hyodo et al. [12] | Healthy older adults n = 60 m/70.3 ± 3.2 | Correlation between hemodynamic responses during CT and physical fitness or cognition:
| lt. and rt. DLPFC |
| Kato et al. [104] | Healthy young adults n = 23 (10 f, 13 m)/22.0 ± 2.2 | Correlation between hemodynamic responses during CT and measures of physical activity or sleep duration:
| lt. and rt. frontal areas |
| Makizako et al. [107] | Healthy older adults n = 20 (10 f, 10 m)/76.1 ± 6.7 (66-89) | Group with high physical activity level vs. group with low physical activity level: - ↑ oxyHb in lt. and rt. IFG during CT | lt. and rt. IFG |
| Matsuda et al. [106] | Healthy young adults n = 40 (15 f, 25 m)/20.4 ± 1.1 | Group with high physical activity level vs. group with low physical activity level:
| lt. DLPFC |
| Mücke et al. [103] | Healthy children n = 50 (24 f, 26 m)/10.6 ± 0.3 (low MVPA n = 20/high MVPA n = 30) | Group with low MVPA vs. group with high MVPA:
| lt. and rt. ant. PFC; lt. and rt. intermediate and md. frontal region |
| Suhr and Chellenberg [10] | Healthy, older adults n = 22 (17 f, 5 m)/68.26 ± 8.39 (54-89) | Correlation between hemodynamic response during CT and measures of physical activity or cognition:
| lt. and rt. DLPFC |
| fNIRS recording | |
| Optode placement | Optimal solution:
|
| Source–detector separation |
|
| Baseline recording |
|
| fNIRS data processing: conversion and artefact removal | |
| Conversion of optical density changes into concentration changes of chromophores (e.g. oxyHb, deoxyHb, totHb) |
|
| - DPF value determination | Optimal solution:
|
| Artefact removal | |
| Removal of motion artefacts * |
|
| Removal of physiological artefacts |
|
| General artefact removal |
|
| fNIRS data processing: further analysis | |
| Detrending |
|
| Analysis |
|
© 2018 by the authors. Licensee MDPI, Basel, Switzerland. This article is an open access article distributed under the terms and conditions of the Creative Commons Attribution (CC BY) license (http://creativecommons.org/licenses/by/4.0/).
Share and Cite
Herold, F.; Wiegel, P.; Scholkmann, F.; Müller, N.G. Applications of Functional Near-Infrared Spectroscopy (fNIRS) Neuroimaging in Exercise–Cognition Science: A Systematic, Methodology-Focused Review. J. Clin. Med. 2018, 7, 466. https://0-doi-org.brum.beds.ac.uk/10.3390/jcm7120466
Herold F, Wiegel P, Scholkmann F, Müller NG. Applications of Functional Near-Infrared Spectroscopy (fNIRS) Neuroimaging in Exercise–Cognition Science: A Systematic, Methodology-Focused Review. Journal of Clinical Medicine. 2018; 7(12):466. https://0-doi-org.brum.beds.ac.uk/10.3390/jcm7120466
Chicago/Turabian StyleHerold, Fabian, Patrick Wiegel, Felix Scholkmann, and Notger G. Müller. 2018. "Applications of Functional Near-Infrared Spectroscopy (fNIRS) Neuroimaging in Exercise–Cognition Science: A Systematic, Methodology-Focused Review" Journal of Clinical Medicine 7, no. 12: 466. https://0-doi-org.brum.beds.ac.uk/10.3390/jcm7120466