Genetic Variants in Antineutrophil Cytoplasmic Antibody-Associated Vasculitis: A Bayesian Approach and Systematic Review

 , , , , and
Abstract
:1. Introduction
2. Experimental Section
2.1. Method
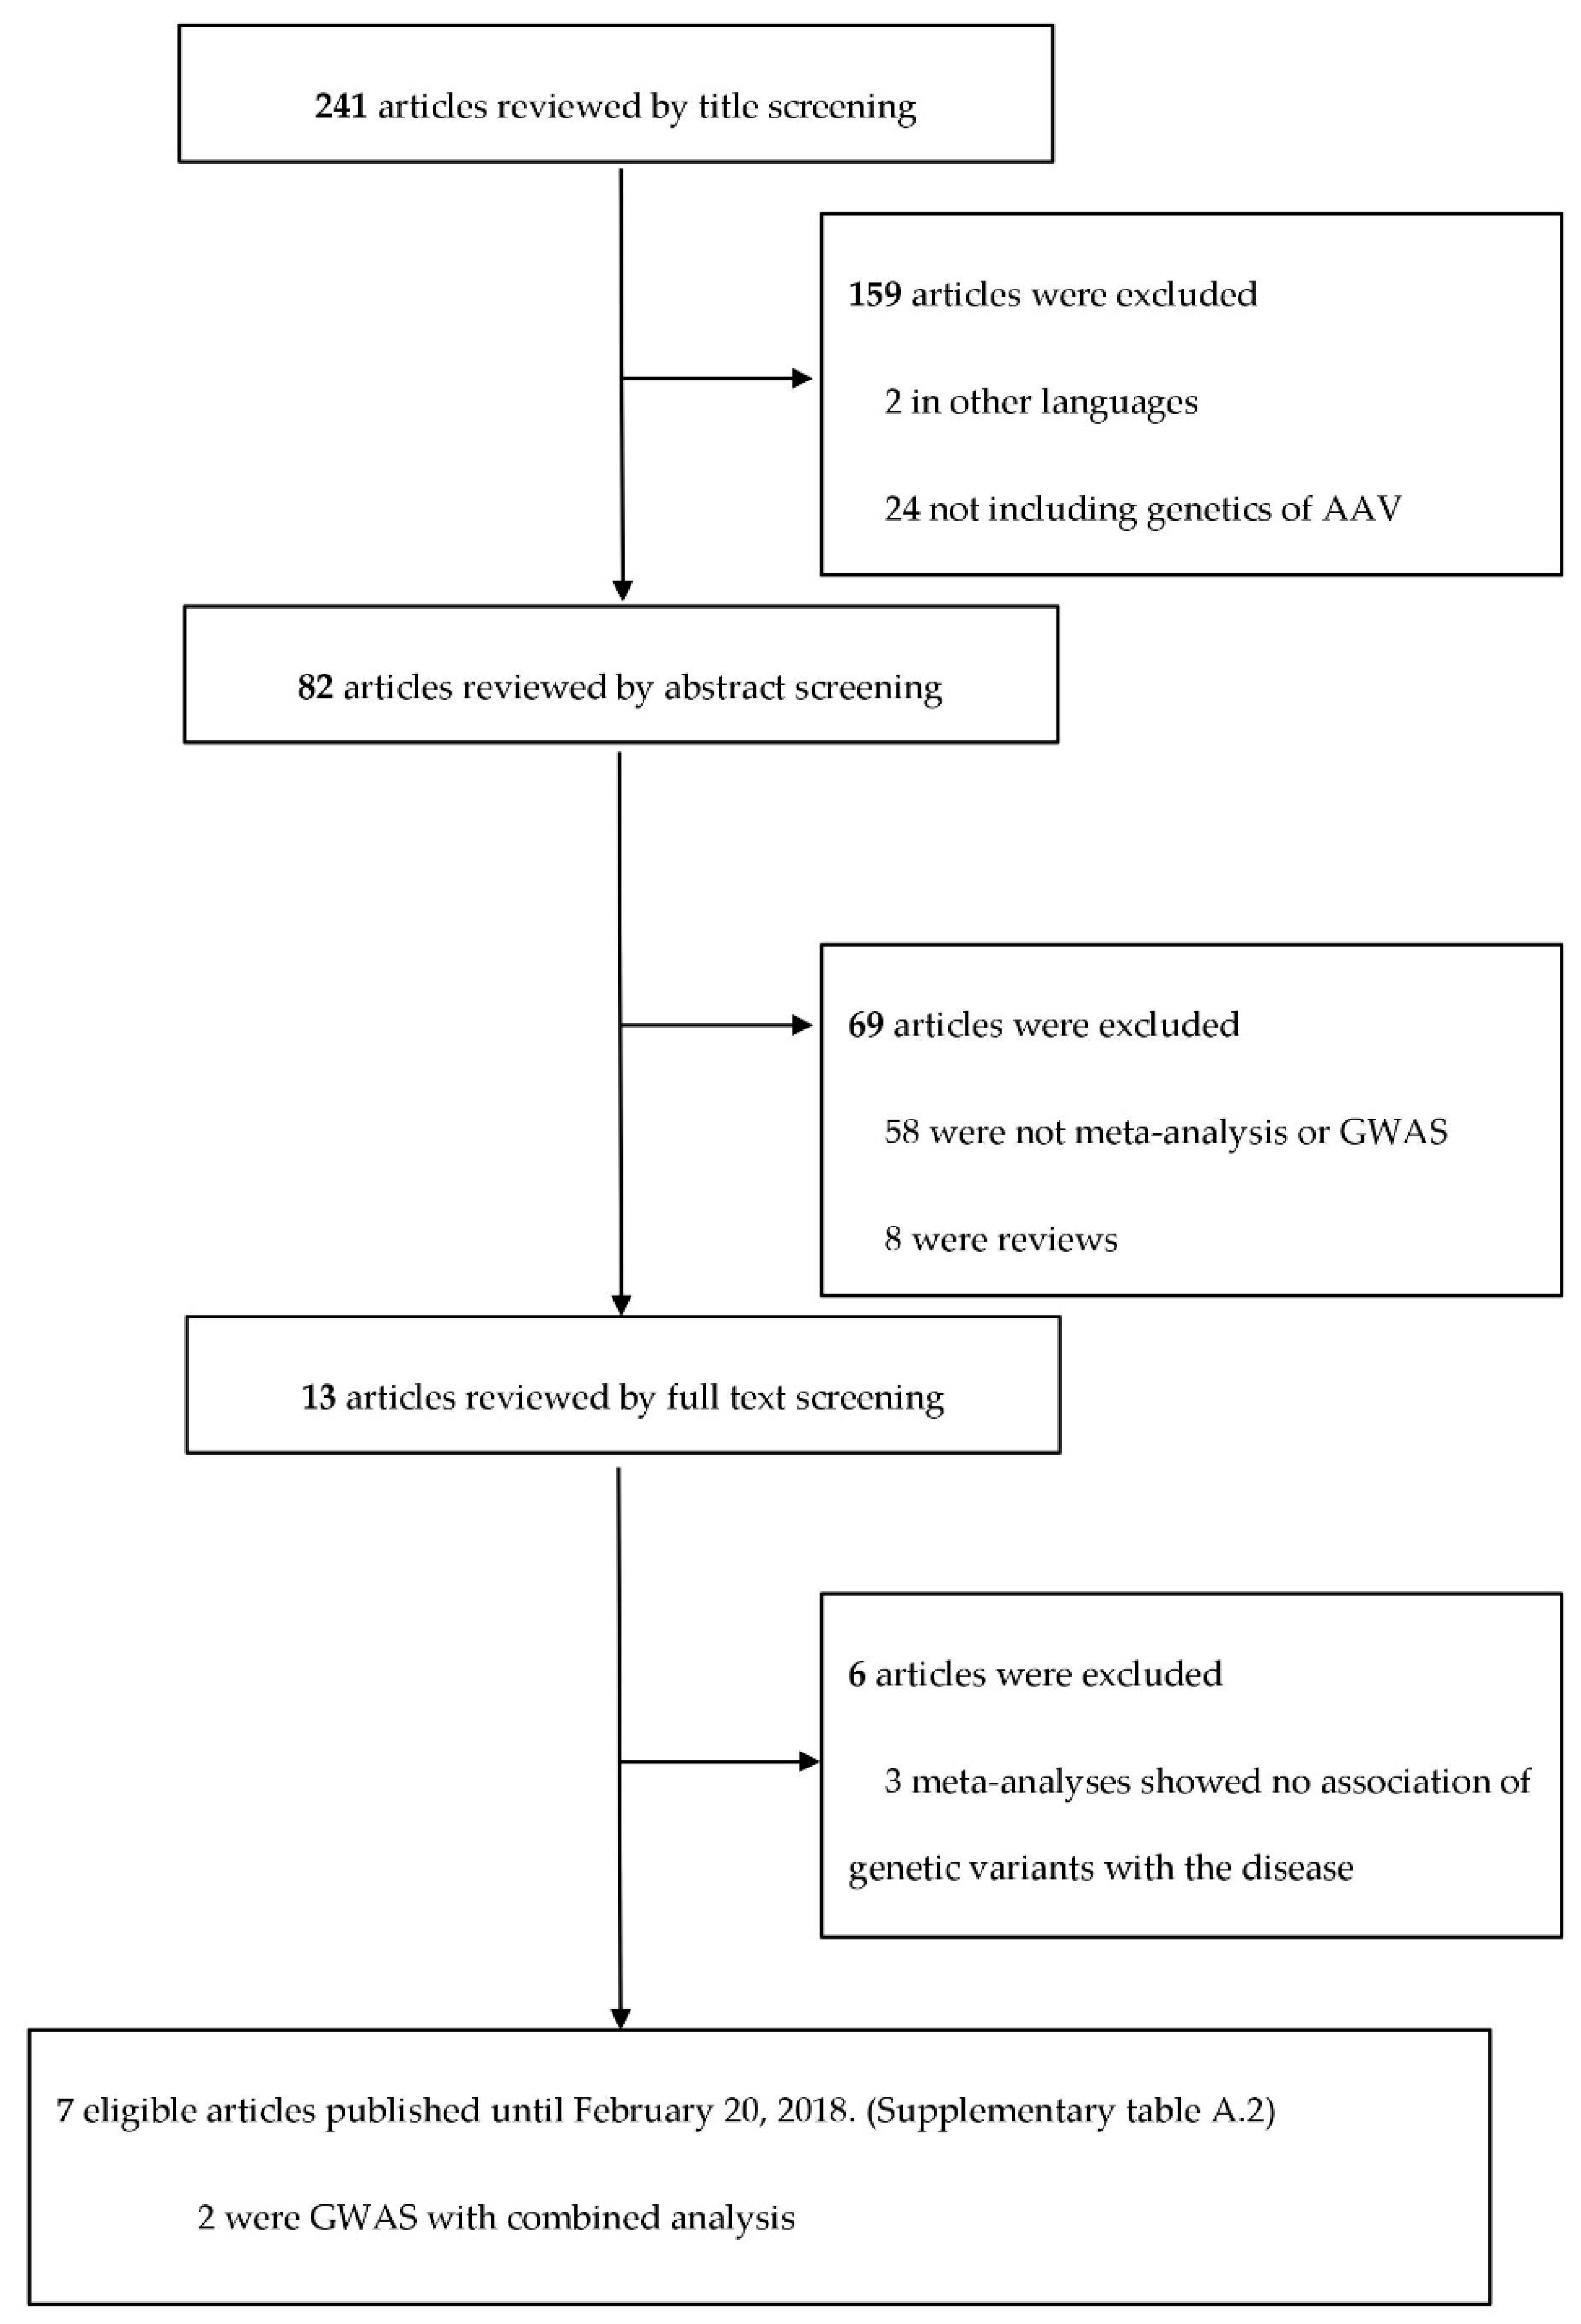
Database Search and Selection
2.2. Statistical Method
2.3. Outcomes
2.4. Construction of PPI (Protein–Protein Interaction) Network
3. Results
3.1. Computation of Noteworthy Variants
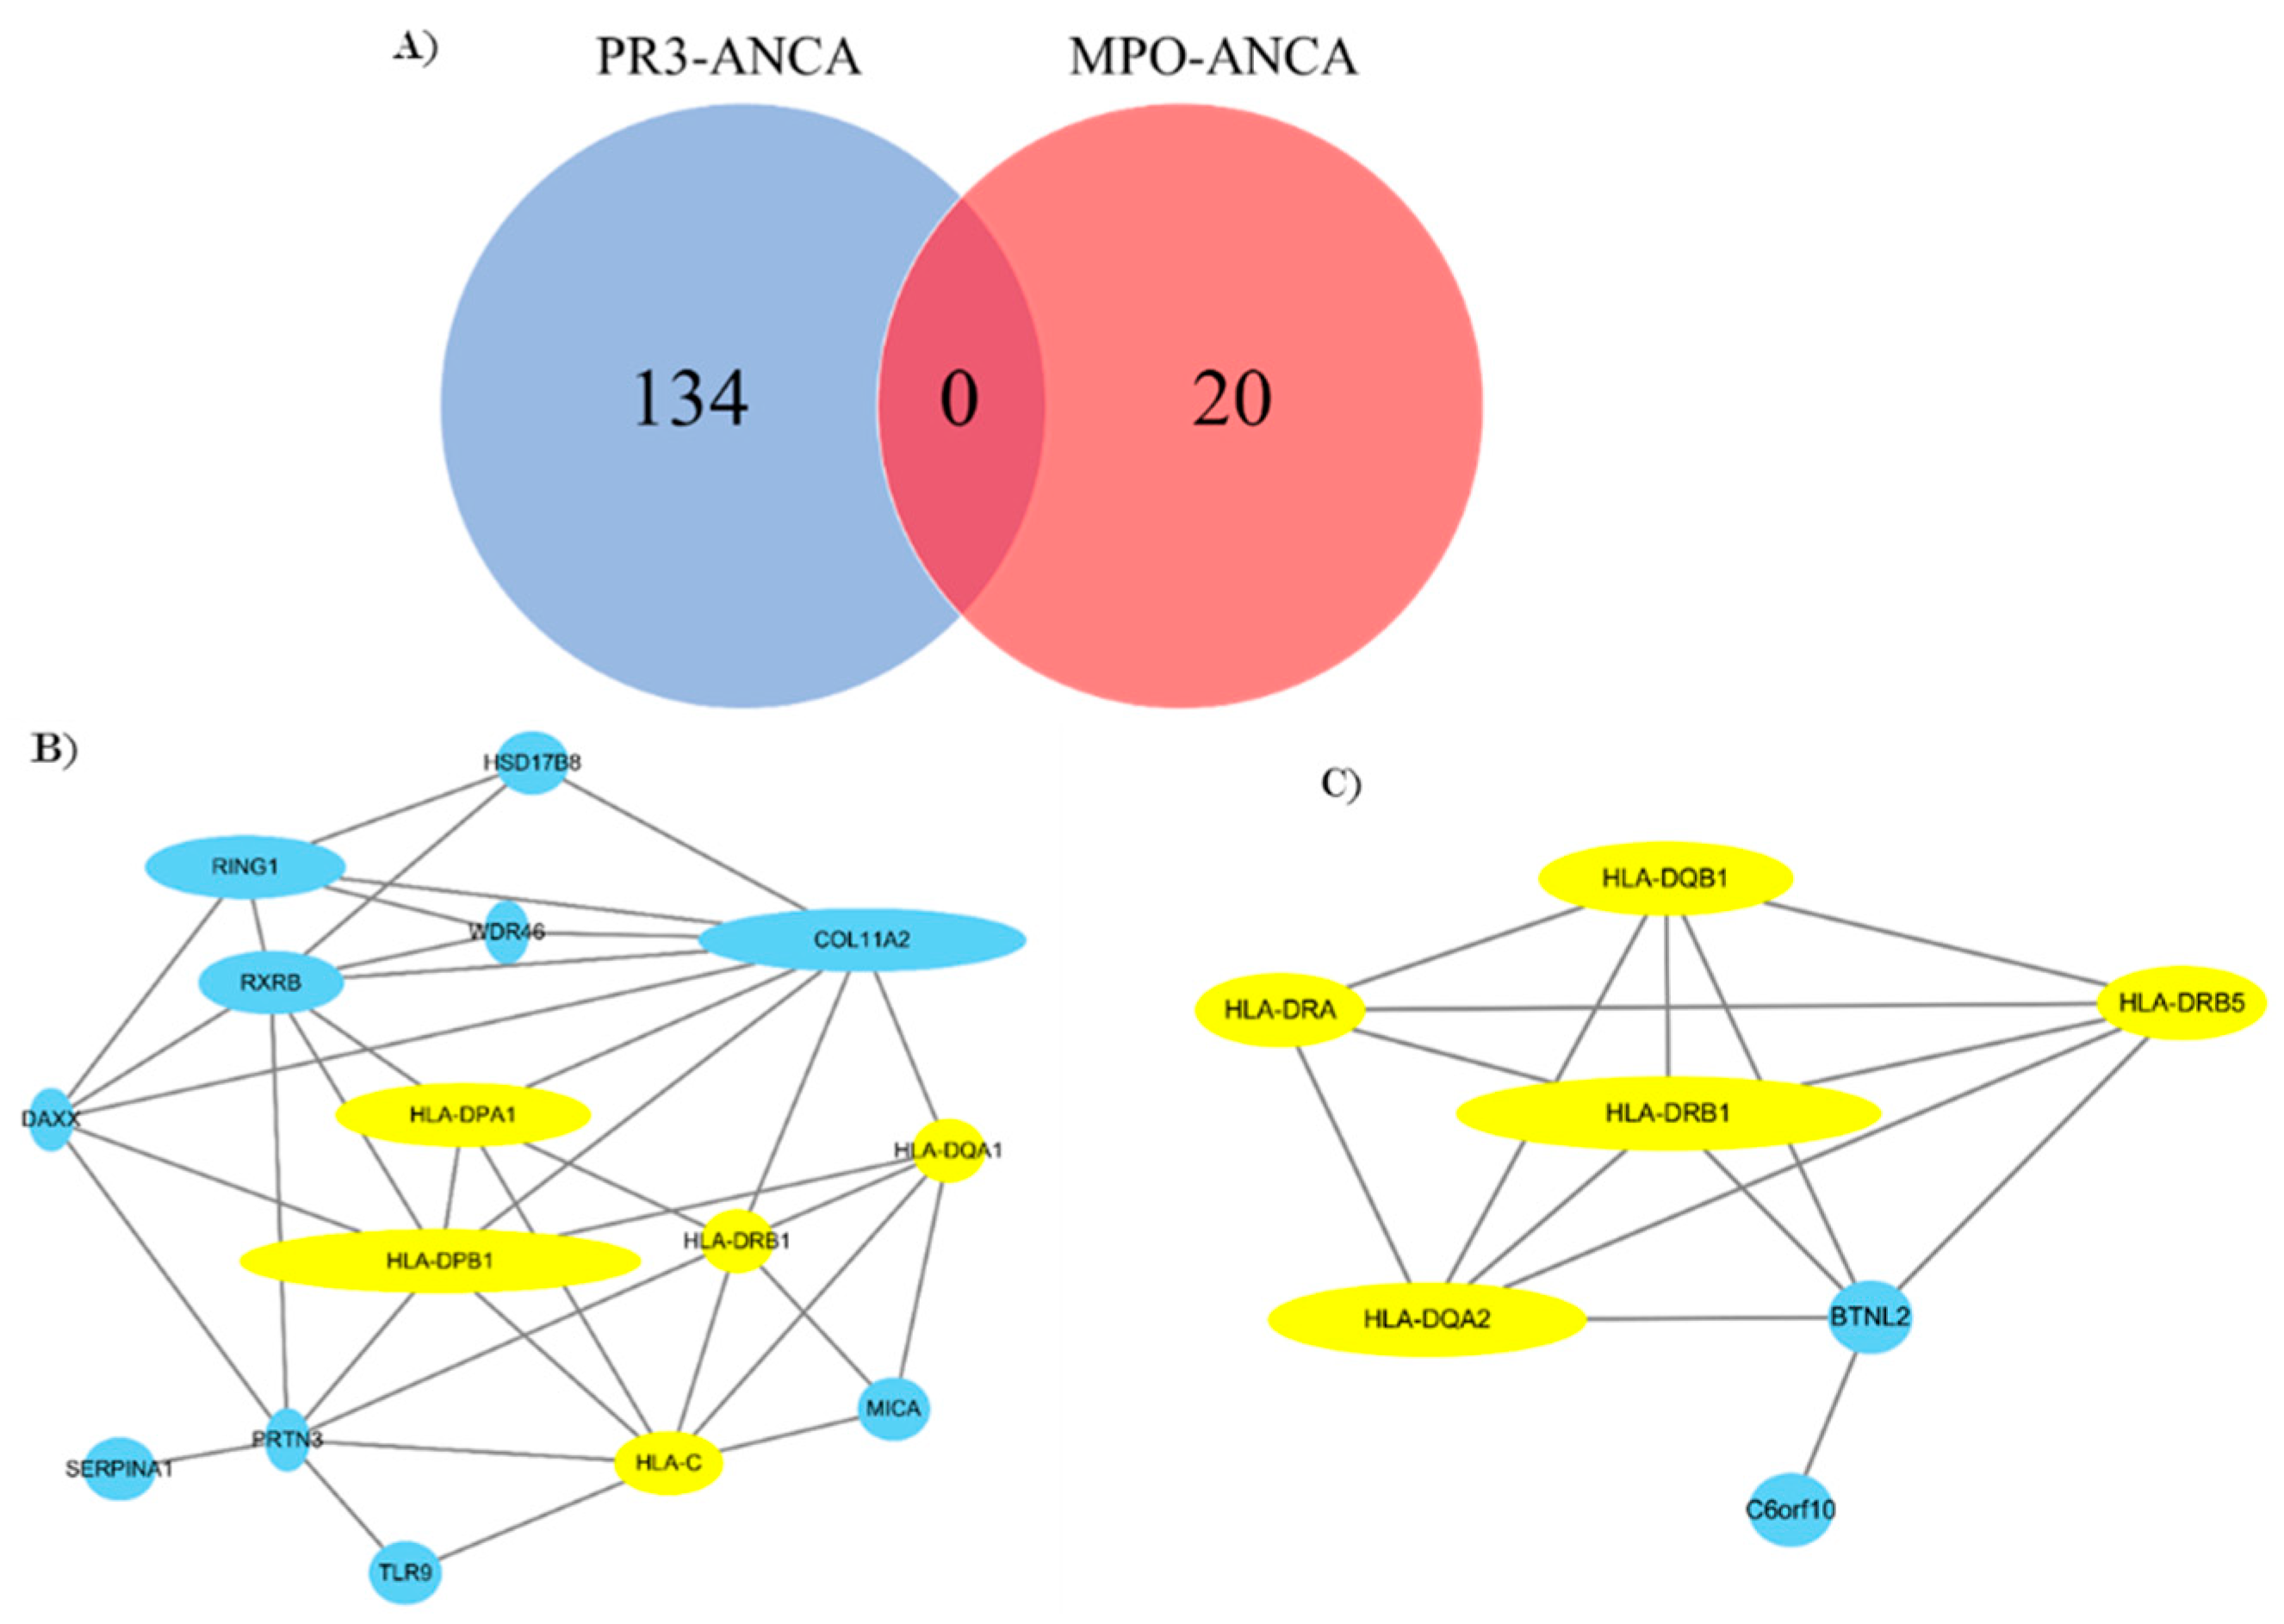
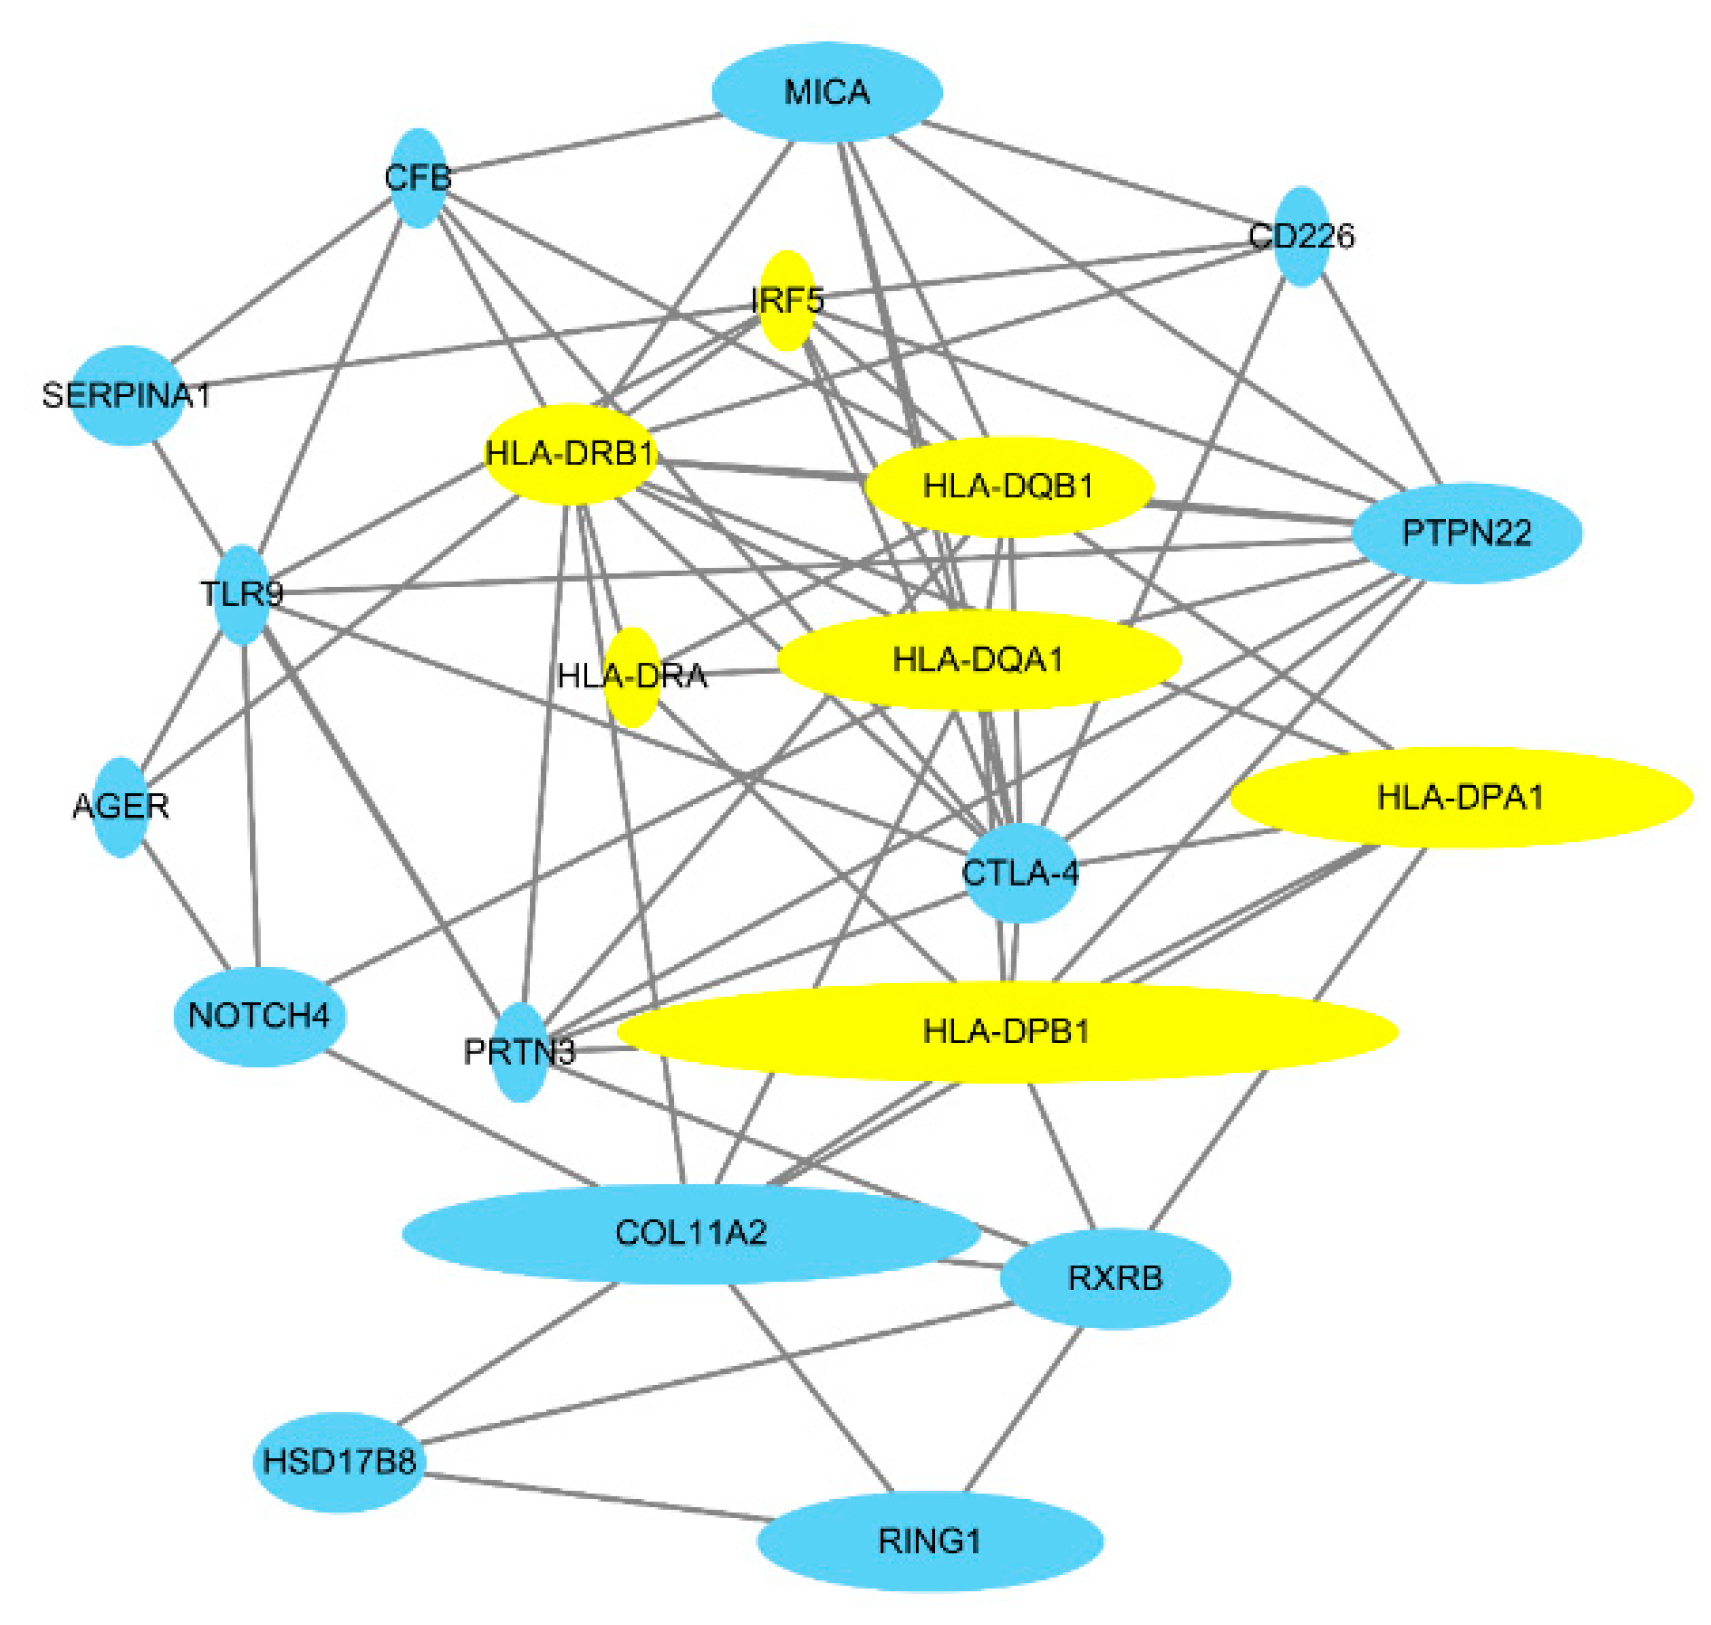
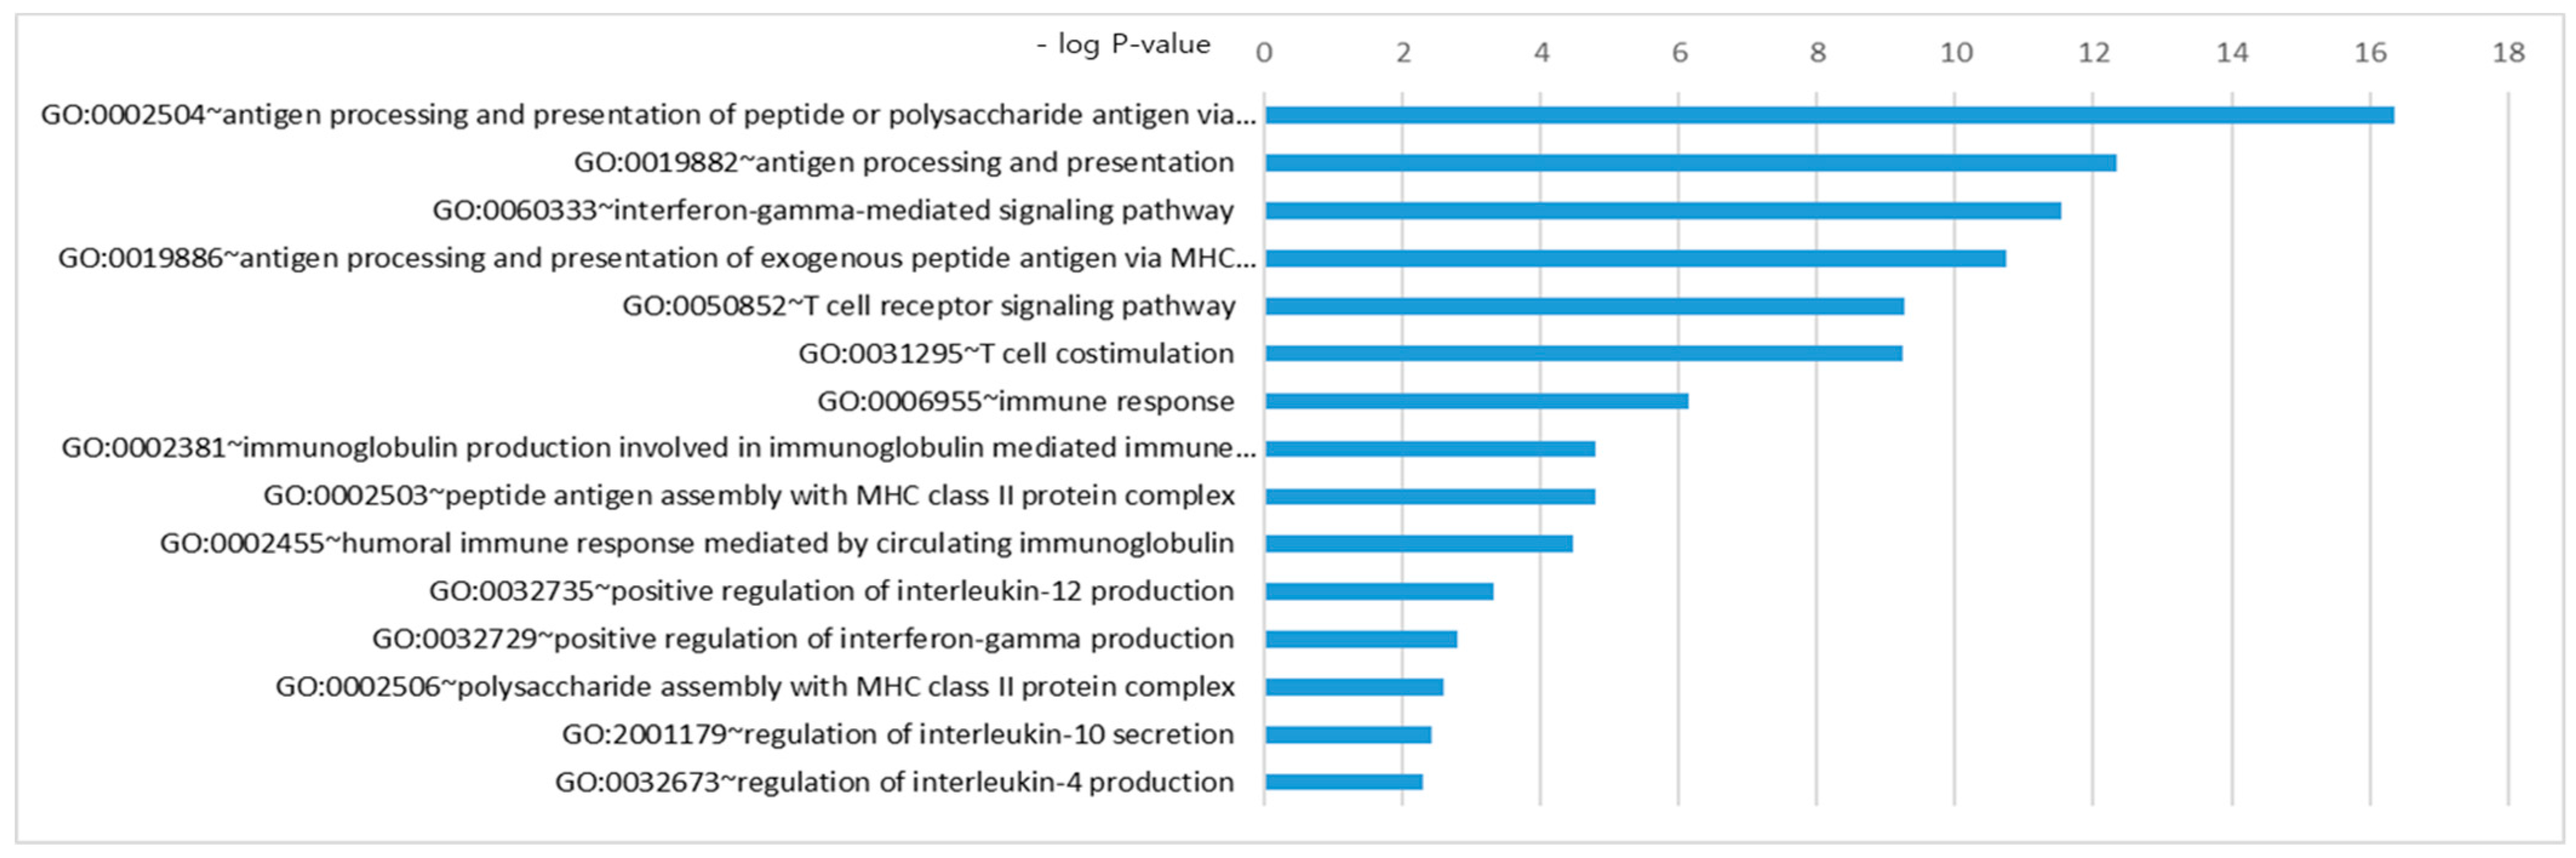
3.2. Gene Network Analysis
3.3. Bullets
- Several studies in ANCA-associated vasculitis have reported statistically significant genetic variants.
- Integration and further analysis of the data from several studies using FPRP, BFDP, and GO analysis identified novel biological pathways in ANCA-associated vasculitis, including a role of the IFN-γ pathway.
- Our results underline that there is a dichotomy between the respective target antigens, PR3 and MPO.
4. Discussion
Supplementary Materials
Author Contributions
Funding
Conflicts of Interest
References
- Pagnoux, C. Updates in anca-associated vasculitis. Eur. J. Rheumatol. 2016, 3, 122–133. [Google Scholar] [CrossRef] [PubMed]
- Mahr, A.; Katsahian, S.; Varet, H.; Guillevin, L.; Hagen, E.C.; Hoglund, P.; Merkel, P.A.; Pagnoux, C.; Rasmussen, N.; Westman, K.; et al. Revisiting the classification of clinical phenotypes of anti-neutrophil cytoplasmic antibody-associated vasculitis: A cluster analysis. Ann. Rheum. Dis. 2013, 72, 1003–1010. [Google Scholar] [CrossRef] [PubMed]
- Lyons, P.A.; Rayner, T.F.; Trivedi, S.; Holle, J.U.; Watts, R.A.; Jayne, D.R.; Baslund, B.; Brenchley, P.; Bruchfeld, A.; Chaudhry, A.N.; et al. Genetically distinct subsets within anca-associated vasculitis. N. Engl. J. Med. 2012, 367, 214–223. [Google Scholar] [CrossRef] [PubMed]
- Merkel, P.A.; Xie, G.; Monach, P.A.; Ji, X.; Ciavatta, D.J.; Byun, J.; Pinder, B.D.; Zhao, A.; Zhang, J.; Tadesse, Y.; et al. Identification of functional and expression polymorphisms associated with risk for antineutrophil cytoplasmic autoantibody-associated vasculitis. Arthritis Rheumatol. 2017, 69, 1054–1066. [Google Scholar] [CrossRef] [PubMed]
- Rahmattulla, C.; Mooyaart, A.L.; van Hooven, D.; Schoones, J.W.; Bruijn, J.A.; Dekkers, O.M.; Bajema, I.M. Genetic variants in anca-associated vasculitis: A meta-analysis. Ann. Rheum. Dis. 2016, 75, 1687–1692. [Google Scholar] [CrossRef] [PubMed]
- Xie, G.; Roshandel, D.; Sherva, R.; Monach, P.A.; Lu, E.Y.; Kung, T.; Carrington, K.; Zhang, S.S.; Pulit, S.L.; Ripke, S.; et al. Association of granulomatosis with polyangiitis (Wegener’s) with HLA-DPB1*04 and SEMA6A gene variants: Evidence from genome-wide analysis. Arthritis Rheum. 2013, 65, 2457–2468. [Google Scholar] [CrossRef]
- Moher, D.; Liberati, A.; Tetzlaff, J.; Altman, D.G.; Group, P. Preferred reporting items for systematic reviews and meta-analyses: The prisma statement. BMJ 2009, 339, 2535. [Google Scholar] [CrossRef]
- Lee, Y.H.; Choi, S.J.; Ji, J.D.; Song, G.G. CTLA-4 and TNF-alpha promoter-308 A/G polymorphisms and ANCA-associated vasculitis susceptibility: A meta-analysis. Mol. Biol. Rep. 2012, 39, 319–326. [Google Scholar] [CrossRef]
- Jung, J.H.; Song, G.G.; Lee, Y.H. Meta-analysis of associations between interleukin-10 polymorphisms and susceptibility to vasculitis. Immunol. Investig. 2015, 44, 553–565. [Google Scholar] [CrossRef]
- Chung, S.A.; Xie, G.; Roshandel, D.; Sherva, R.; Edberg, J.C.; Kravitz, M.; Dellaripa, P.F.; Hoffman, G.S.; Mahr, A.D.; Seo, P.; et al. Meta-analysis of genetic polymorphisms in granulomatosis with polyangiitis (Wegener’s) reveals shared susceptibility loci with rheumatoid arthritis. Arthritis Rheum. 2012, 64, 3463–3471. [Google Scholar] [CrossRef]
- Lee, Y.H.; Choi, S.J.; Ji, J.D.; Song, G.G. The protein tyrosine phosphatase nonreceptor 22 C1858T polymorphism and vasculitis: A meta-analysis. Mol. Biol. Rep. 2012, 39, 8505–8511. [Google Scholar] [CrossRef] [PubMed]
- Wacholder, S.; Chanock, S.; Garcia-Closas, M.; El Ghormli, L.; Rothman, N. Assessing the probability that a positive report is false: An approach for molecular epidemiology studies. J. Natl. Cancer Inst. 2004, 96, 434–442. [Google Scholar] [CrossRef] [PubMed]
- Wakefield, J. A bayesian measure of the probability of false discovery in genetic epidemiology studies. Am. J. Hum. Genet. 2007, 81, 208–227. [Google Scholar] [CrossRef] [PubMed]
- Cartin-Ceba, R.; Peikert, T.; Specks, U. Pathogenesis of anca-associated vasculitis. Curr. Rheumatol. Rep. 2012, 14, 481–493. [Google Scholar] [CrossRef] [PubMed]
- Brogan, P.; Eleftheriou, D. Vasculitis update: Pathogenesis and biomarkers. Pediatr. Nephrol. 2018, 33, 187–198. [Google Scholar] [CrossRef] [PubMed]
- Jarrot, P.A.; Kaplanski, G. Pathogenesis of anca-associated vasculitis: An update. Autoimmun. Rev. 2016, 15, 704–713. [Google Scholar] [CrossRef] [PubMed]
- Barnes, B.J. Genetic versus non-genetic drivers of SLE: Implications of IRF5 dysregulation in both roads leading to SLE. Curr. Rheumatol. Rep. 2019, 21, 2. [Google Scholar] [CrossRef]
- Monach, P.A.; Warner, R.L.; Tomasson, G.; Specks, U.; Stone, J.H.; Ding, L.; Fervenza, F.C.; Fessler, B.J.; Hoffman, G.S.; Ikle, D.; et al. Serum proteins reflecting inflammation, injury and repair as biomarkers of disease activity in anca-associated vasculitis. Ann. Rheum. Dis. 2013, 72, 1342–1350. [Google Scholar] [CrossRef]
- Antonelli, A.; Ferrari, S.M.; Giuggioli, D.; Ferrannini, E.; Ferri, C.; Fallahi, P. Chemokine (C-X-C motif) ligand (CXCL)10 in autoimmune diseases. Autoimmun. Rev. 2014, 13, 272–280. [Google Scholar] [CrossRef]
- Nathan, C.F.; Prendergast, T.J.; Wiebe, M.E.; Stanley, E.R.; Platzer, E.; Remold, H.G.; Welte, K.; Rubin, B.Y.; Murray, H.W. Activation of human macrophages. Comparison of other cytokines with interferon-gamma. J. Exp. Med. 1984, 160, 600–605. [Google Scholar] [CrossRef] [Green Version]
- Steimle, V.; Siegrist, C.A.; Mottet, A.; Lisowska-Grospierre, B.; Mach, B. Regulation of MHC class II expression by interferon-gamma mediated by the transactivator gene CIITA. Science 1994, 265, 106–109. [Google Scholar] [CrossRef] [PubMed]
- Wilke, C.M.; Wei, S.; Wang, L.; Kryczek, I.; Kao, J.; Zou, W. Dual biological effects of the cytokines interleukin-10 and interferon-gamma. Cancer Immunol. Immunother. 2011, 60, 1529–1541. [Google Scholar] [CrossRef] [PubMed]
- Goldszmid, R.S.; Caspar, P.; Rivollier, A.; White, S.; Dzutsev, A.; Hieny, S.; Kelsall, B.; Trinchieri, G.; Sher, A. Nk cell-derived interferon-gamma orchestrates cellular dynamics and the differentiation of monocytes into dendritic cells at the site of infection. Immunity 2012, 36, 1047–1059. [Google Scholar] [CrossRef] [PubMed]
- Yamaguchi, R.; Kawata, J.; Yamamoto, T.; Ishimaru, Y.; Sakamoto, A.; Ono, T.; Narahara, S.; Sugiuchi, H.; Hirose, E.; Yamaguchi, Y. Mechanism of interferon-gamma production by monocytes stimulated with myeloperoxidase and neutrophil extracellular traps. Blood Cells Mol. Dis. 2015, 55, 127–133. [Google Scholar] [CrossRef] [PubMed]
- Metzler, K.D.; Fuchs, T.A.; Nauseef, W.M.; Reumaux, D.; Roesler, J.; Schulze, I.; Wahn, V.; Papayannopoulos, V.; Zychlinsky, A. Myeloperoxidase is required for neutrophil extracellular trap formation: Implications for innate immunity. Blood 2011, 117, 953–959. [Google Scholar] [CrossRef] [PubMed]
- Relle, M.; Fohr, B.; Fasola, F.; Schwarting, A. Genetics and pathophysiology of granulomatosis with polyangiitis (GPA) and its main autoantigen proteinase 3. Mol. Cell Probes 2016, 30, 366–373. [Google Scholar] [CrossRef]
- Alberici, F.; Martorana, D.; Vaglio, A. Genetic aspects of anti-neutrophil cytoplasmic antibody-associated vasculitis. Nephrol. Dial. Transplant. 2015, 30, 37–45. [Google Scholar] [CrossRef]
- Yu, V.C.; Delsert, C.; Andersen, B.; Holloway, J.M.; Devary, O.V.; Naar, A.M.; Kim, S.Y.; Boutin, J.M.; Glass, C.K.; Rosenfeld, M.G. RXR beta: A coregulator that enhances binding of retinoic acid, thyroid hormone, and vitamin D receptors to their cognate response elements. Cell 1991, 67, 1251–1266. [Google Scholar] [CrossRef]
- Kalsch, A.I.; Peters, A.; Buhl, B.; Breedijk, A.; Prem, K.; Schmitt, W.H.; Weiss, C.; Heeringa, P.; Kallenberg, C.; Birck, R.; et al. Retinoid x receptor beta polymorphisms do not explain functional differences in vitamins d and a response in antineutrophil cytoplasmic antibody associated vasculitis patients. Autoimmunity 2009, 42, 467–474. [Google Scholar] [CrossRef]
- Noel, P.J.; Boise, L.H.; Green, J.M.; Thompson, C.B. CD28 costimulation prevents cell death during primary T cell activation. J. Immunol. 1996, 157, 636–642. [Google Scholar]
- Langford, C.A.; Monach, P.A.; Specks, U.; Seo, P.; Cuthbertson, D.; McAlear, C.A.; Ytterberg, S.R.; Hoffman, G.S.; Krischer, J.P.; Merkel, P.A.; et al. An open-label trial of abatacept (CTLA4-IG) in non-severe relapsing granulomatosis with polyangiitis (Wegener’s). Ann. Rheum. Dis. 2014, 73, 1376–1379. [Google Scholar] [CrossRef] [PubMed]
- Lucke, J.F. A critique of the false-positive report probability. Genet. Epidemiol. 2009, 33, 145–150. [Google Scholar] [CrossRef] [PubMed]
- Wakefield, J. Reporting and interpretation in genome-wide association studies. Int. J. Epidemiol. 2008, 37, 641–653. [Google Scholar] [CrossRef] [PubMed] [Green Version]


| Gene/Variant | Minor Allele/Comparison | OR (95% CI) | p-Value for Meta-Analysis | Publications (n) | Diagnosis (Clinical Subtypes) | No. of Cases/Controls | I2 (%) | I2 (P) | Egger’s p-Value | Power OR 1.2 | Power OR 1.5 | FPRP Values at Prior Probability | BFDP 0.001 | BFDP 0.000001 | Author, Year | |||
|---|---|---|---|---|---|---|---|---|---|---|---|---|---|---|---|---|---|---|
| OR 1.2 | OR 1.5 | |||||||||||||||||
| 0.001 | 0.000001 | 0.001 | 0.000001 | |||||||||||||||
| CD226 rs763361 | T | 1.14 (1.07–1.21) | <0.001 | 3 | AAV | 2422/17898 | 0 | 0.444 | 0.792 | 0.954 | 1.000 | 0.017 | 0.945 | 0.016 | 0.942 | 0.437 | 0.999 | Rahmattulla, et al. 2016 [5] |
| CTLA-4 rs3087243 (CT60) | A | 0.81 (0.75–0.87) | <0.001 | 3 | AAV | 2015/7855 | 25 | 0.262 | 0.122 | 0.218 | 1.000 | 0.000 | 0.033 | 0.000 | 0.007 | 0.001 | 0.347 | Rahmattulla, et al. 2016 [5] |
| CTLA-4 | (AT)86 | 0.54 (0.43–0.67) | <0.001 | 4 | AAV | 303/543 | 89 | <0.001 | 0.946 | 0.000 | 0.028 | 0.348 | 0.998 | 0.001 | 0.437 | 0.010 | 0.913 | Rahmattulla, et al. 2016 [5] |
| CTLA-4 rs3087243 (CT60) | AA vs. GG | 0.693 (0.512–0.796) | 6.39 × 10⁻⁵ | 2 | AAV | 797/9669 | 57.7 | 0.124 | 0.005 | 0.708 | 0.045 | 0.824 | 0.000 | 0.029 | 0.018 | 0.948 | Lee, et al. 2012 [8] | |
| HLA-DPA1 rs9277341 | C | 0.35 (0.30–0.40) | <0.001 | 2 | AAV | 1032/2200 | 54 | 0.116 | 0.215 | NA | NA | NA | NA | NA | NA | 0.000 | 0.000 | Rahmattulla, et al. 2016 [5] |
| HLA-DPB2 rs3130215 | A | 1.40 (1.29–1.52) | <0.001 | 3 | AAV | 1417/7249 | 99 | <0.001 | 0.446 | 0.000 | 0.950 | 0.000 | 0.000 | 0.000 | 0.000 | 0.000 | 0.000 | Rahmattulla, et al. 2016 [5] |
| HLA-DRB4 | - | 1.69 (1.36–2.10) | <0.001 | 4 | AAV | 260/1845 | 61 | 0.055 | 0.533 | 0.001 | 0.141 | 0.686 | 1.000 | 0.015 | 0.940 | 0.259 | 0.997 | Rahmattulla, et al. 2016 [5] |
| HSD17B8 rs421446 | C | 0.40 (0.34–0.48) | <0.001 | 2 | AAV | 738/1872 | 0 | 0.620 | NA | NA | NA | NA | NA | NA | NA | 0.000 | 0.000 | Rahmattulla, et al. 2016 [5] |
| IRF5 rs10954213 | G | 0.77 (0.70–0.83) | <0.001 | 3 | AAV | 1535/6977 | 99 | <0.001 | 0.948 | 0.019 | 1.000 | 0.000 | 0.000 | 0.000 | 0.000 | 0.000 | 0.001 | Rahmattulla, et al. 2016 [5] |
| PTPN22 rs2476601 | T vs. C | 1.415 (1.228–1.630) | 1.59 × 10⁻⁶ | 3 | AAV | 1184/10459 | 0 | 0.393 | 0.481 | 0.011 | 0.791 | 0.119 | 0.931 | 0.002 | 0.160 | 0.091 | 0.990 | Lee, et al. 2012 [8] |
| PTPN22 rs2476601 | A | 1.39 (1.24–1.56) | <0.001 | 4 | AAV | 2099/8678 | 0 | 0.693 | 0.500 | 0.006 | 0.902 | 0.004 | 0.780 | 0.000 | 0.024 | 0.002 | 0.654 | Rahmattulla, et al. 2016 [5] |
| RING1/RXRB rs213213 | A | 1.71 (1.57–1.86) | <0.001 | 3 | AAV | 1414/7238 | 73 | 0.026 | 0.187 | NA | NA | NA | NA | NA | NA | 0.000 | 0.000 | Rahmattulla, et al. 2016 [5] |
| RXRB rs6531 | C | 1.63 (1.50–1.77) | <0.001 | 3 | AAV | 1557/6955 | 96 | <0.001 | 0.292 | NA | NA | NA | NA | NA | NA | 0.000 | 0.000 | Rahmattulla, et al. 2016 [5] |
| RXRB rs9277935 | T | 0.44 (0.37–0.50) | <0.001 | 3 | AAV | 1417/7233 | 73 | 0.025 | 0.393 | NA | NA | NA | NA | NA | NA | 0.000 | 0.000 | Rahmattulla, et al. 2016 [5] |
| SERPINA 1 | Z allele | 2.94 (2.22–3.88) | <0.001 | 8 | AAV | 3662/8581 | 41 | 0.092 | 0.078 | 0.000 | 0.000 | 0.173 | 0.995 | 0.000 | 0.025 | 0.000 | 0.005 | Rahmattulla, et al. 2016 [5] |
| TLR9 rs352162 | T | 1.58 (1.43–1.75) | <0.001 | 1 | AAV | 1289/1898 | 96 | <0.001 | NA | NA | NA | NA | NA | NA | NA | 0.000 | 0.000 | Rahmattulla, et al. 2016 [5] |
| PTPN22 rs2476601 | T vs. C | 2.042 (1.534–2.719) | 1.02 × 10⁻⁶ | 2 | ANCA (+) GPA | - | 0 | 0.989 | NA | 0.000 | 0.017 | 0.882 | 0.999 | 0.056 | 0.855 | 0.375 | 0.998 | Lee, et al. 2012 [8] |
| CD226 rs763361 | T | 1.19 (1.11–1.28) | <0.001 | 3 | GPA | 2021/17898 | 72.2 | 0.006 | 0.589 | 1.000 | 0.005 | 0.832 | 0.003 | 0.745 | 0.124 | 0.993 | Rahmattulla, et al. 2016 [5] | |
| CLTA-4 rs3087243 | A | 0.80 (0.73–0.87) | <0.001 | 3 | GPA | 1561/7855 | 38.7 | 0.180 | 0.170 | 1.000 | 0.001 | 0.521 | 0.000 | 0.156 | 0.011 | 0.915 | Rahmattulla, et al. 2016 [5] | |
| CTLA-4 | (AT)86 | 0.44 (0.34–0.57) | <0.001 | 3 | GPA | 210/432 | 86.5 | 0.001 | 0.000 | 0.001 | 0.434 | 0.999 | 0.001 | 0.381 | 0.002 | 0.670 | Rahmattulla, et al. 2016 [5] | |
| CTLA-4 rs3087243 (CT60) | A vs. G | 0.79 (0.70–0.89) | 9.83 × 10⁻⁵ | 2 | GPA | 880/1969 | 0.190 | 0.997 | 0.358 | 0.982 | 0.096 | 0.914 | 0.779 | 1.000 | Chung, et al. 2012 [10] | |||
| HLA-DPA1 rs9277341 | C | 0.35 (0.30–0.41) | <0.001 | 2 | GPA | 1032/2200 | 54.8 | 0.109 | NA | NA | NA | NA | NA | NA | 0.000 | 0.000 | Rahmattulla, et al. 2016 [5] | |
| HLA-DPB1*0301 | - | 0.23 (0.16–0.32) | <0.001 | 3 | GPA | 774/918 | 61.7 | 0.050 | NA | NA | NA | NA | NA | NA | 0.000 | 0.000 | Rahmattulla, et al. 2016 [5] | |
| HLA-DPB1*0401 | - | 2.89 (2.50–3.35) | <0.001 | 3 | GPA | 774/918 | 67.5 | 0.026 | NA | NA | NA | NA | NA | NA | 0.000 | 0.000 | Rahmattulla, et al. 2016 [5] | |
| HLA-DR6 | - | 0.45 (0.33–0.62) | <0.001 | 4 | GPA | 301/6132 | 59.8 | 0.058 | 0.000 | 0.008 | 0.927 | 1.000 | 0.114 | 0.992 | 0.511 | 0.999 | Rahmattulla, et al. 2016 [5] | |
| IRF5 rs10954213 | G | 0.66 (0.59–0.74) | <0.001 | 2 | GPA | 1021/6267 | 99.1 | 0.000 | 0.000 | 0.432 | 0.000 | 0.033 | 0.000 | 0.000 | 0.000 | 0.000 | Rahmattulla, et al. 2016 [5] | |
| PTPN22 rs2476601 | A | 1.43 (1.26–1.62) | <0.001 | 4 | GPA | 1616/8678 | 0.0 | 0.411 | 0.003 | 0.774 | 0.006 | 0.867 | 0.000 | 0.024 | 0.002 | 0.649 | Rahmattulla, et al. 2016 [5] | |
| RING1/RXRB rs213213 | A | 1.91 (1.73–2.10) | <0.001 | 3 | GPA | 1132/7238 | 0.0 | 0.551 | NA | NA | NA | NA | NA | NA | 0.000 | 0.000 | Rahmattulla, et al. 2016 [5] | |
| RXRB rs6531 | C | 1.70 (1.55–1.86) | <0.001 | 3 | GPA | 1211/6955 | 96.5 | 0.000 | NA | NA | NA | NA | NA | NA | 0.000 | 0.000 | Rahmattulla, et al. 2016 [5] | |
| RXRB rs9277935 | T | 0.37 (0.31–0.43) | <0.001 | 3 | GPA | 1135/7233 | 0.0 | 0.798 | NA | NA | NA | NA | NA | NA | 0.000 | 0.000 | Rahmattulla, et al. 2016 [5] | |
| SERPINA 1 | Z allele | 2.40 (1.73–3.33) | <0.001 | 4 | GPA | 972/2636 | 0.0 | 0.763 | 0.000 | 0.002 | 0.906 | 1.000 | 0.062 | 0.985 | 0.282 | 0.997 | Rahmattulla, et al. 2016 [5] | |
| HLA-DRB4 | - | 2.06 (1.57–2.69) | <0.001 | 2 | EGPA | 150/691 | 0.4 | 0.316 | 0.000 | 0.010 | 0.754 | 1.000 | 0.011 | 0.918 | 0.089 | 0.990 | Rahmattulla, et al. 2016 [5] | |
| Gene/Variant | Minor Allele/ Comparison | OR (95% CI) | p-Value for Meta-Analysis | Publications (n) | Diagnosis (Serologic Subtypes) | No. of Cases/Controls | I2 (%) | I2 (P) | Egger’s p-Value | Power OR 1.2 | Power OR 1.5 | FPRP Values at Prior Probability | BFDP 0.001 | BFDP 0.000001 | Author, Year | |||
|---|---|---|---|---|---|---|---|---|---|---|---|---|---|---|---|---|---|---|
| OR 1.2 | OR 1.5 | |||||||||||||||||
| 0.001 | 0.000001 | 0.001 | 0.000001 | |||||||||||||||
| HLA-DPA1 rs9277341 | C | 0.27 (0.22–0.33) | <0.001 | 1 | PR3-ANCA | 578/1820 | - | - | NA | NA | NA | NA | NA | NA | 0.000 | 0.000 | Rahmattulla, et al. 2016 [5] | |
| HLA-DPB1*0401 | - | 3.93 (2.75–5.62) | <0.001 | 2 | PR3-ANCA | 183/139 | 0.0 | 0.960 | 0.000 | 0.000 | 0.615 | 0.999 | 0.001 | 0.495 | 0.000 | 0.170 | Rahmattulla, et al. 2016 [5] | |
| HLA-DPB2 rs3130215 | A | 0.65 (0.55–0.77) | <0.001 | 1 | PR3-ANCA | 326/5366 | - | - | 0.002 | 0.385 | 0.235 | 0.997 | 0.002 | 0.618 | 0.062 | 0.985 | Rahmattulla, et al. 2016 [5] | |
| HLA-DRB1*15 | - | 2.82 (2.00–3.96) | <0.001 | 2 | PR3-ANCA | 131/582 | 84.0 | 0.002 | 0.000 | 0.000 | 0.842 | 1.000 | 0.016 | 0.942 | 0.040 | 0.977 | Rahmattulla, et al. 2016 [5] | |
| RING1/RXRB rs213213 | A | 2.06 (1.75–2.41) | <0.001 | 1 | PR3-ANCA | 326/5366 | - | - | NA | NA | NA | NA | NA | NA | 0.000 | 0.000 | Rahmattulla, et al. 2016 [5] | |
| RXRB rs6531 | C | 2.19 (1.92–2.51) | <0.001 | 1 | PR3-ANCA | 478/5251 | - | - | NA | NA | NA | NA | NA | NA | 0.000 | 0.000 | Rahmattulla, et al. 2016 [5] | |
| RXRB rs9277935 | T | 0.24 (0.17–0.33) | <0.001 | 1 | PR3-ANCA | 326/5350 | - | - | NA | NA | NA | NA | NA | NA | 0.000 | 0.000 | Rahmattulla, et al. 2016 [5] | |
| SERPINA 1 | Z allele | 3.53 (2.28–5.49) | <0.001 | 5 | PR3-ANCA | 280/4788 | 21.3 | 0.279 | 0.000 | 0.000 | 0.963 | 1.000 | 0.229 | 0.997 | 0.512 | 0.999 | Rahmattulla, et al. 2016 [5] | |
| TLR9 rs352140 | T | 1.28 (1.12–1.45) | 0.018 | 1 | PR3-ANCA | NR/NR | 0.0 | 0.782 | 0.155 | 0.994 | 0.402 | 0.999 | 0.095 | 0.991 | 0.778 | 1.000 | Rahmattulla, et al. 2016 [5] | |
| TLR9 rs352162 | T | 1.30 (1.14–1.47) | <0.001 | 1 | PR3-ANCA | NR/NR | 0.0 | 0.503 | 0.101 | 0.989 | 0.221 | 0.996 | 0.028 | 0.967 | 0.532 | 0.999 | Rahmattulla, et al. 2016 [5] | |
| Gene/Variant | Comparison | OR (95% CI) | p-Value | Diagnosis (Clinical/Serologic Subtypes) | Ethnicity | No. of Cases/Controls | Power OR 1.2 | Power OR 1.5 | FPRP Values at Prior Probability | BFDP 0.001 | BFDP 0.000001 | Author, Year | |||
|---|---|---|---|---|---|---|---|---|---|---|---|---|---|---|---|
| OR 1.2 | OR 1.5 | ||||||||||||||
| 0.001 | 0.000001 | 0.001 | 0.000001 | ||||||||||||
| SNPs Statistically Significant (p < 5.00 × 10⁻⁸) | |||||||||||||||
| HLA-DPA1 rs9277341 | T vs. C | 2.44 (2.21–2.69) | 6.09 × 10−71 | AAV | Caucasian | 1986/4723 | NA | NA | NA | NA | NA | NA | 0.000 | 0.000 | Merkel, et al. 2017 [4] |
| HLA-DPB1 rs1042169 | G vs. A | 2.82 (2.54–3.13) | 1.12 × 10−84 | AAV | Caucasian | 1986/4723 | NA | NA | NA | NA | NA | NA | 0.000 | 0.000 | Merkel, et al. 2017 [4] |
| HLA-DPB1 rs141530233 | A del | 2.99 (2.69–3.33) | 1.13 × 10−89 | AAV | Caucasian | 1986/4723 | NA | NA | NA | NA | NA | NA | 0.000 | 0.000 | Merkel, et al. 2017 [4] |
| HLA-DQA1 rs35242582 | A vs. G | 1.60 (1.46–1.76) | 6.34 × 10⁻²³ | AAV | Caucasian | 1986/4723 | NA | NA | NA | NA | NA | NA | 0.000 | 0.000 | Merkel, et al. 2017 [4] |
| HLA-DQB1 rs1049072 | A vs. G | 1.40 (1.28–1.53) | 6.46 × 10⁻¹³ | AAV | Caucasian | 1986/4723 | 0.000 | 0.936 | 0.000 | 0.000 | 0.000 | 0.000 | 0.000 | 0.000 | Merkel, et al. 2017 [4] |
| PRTN3 rs62132293 | G vs. C | 1.29 (1.19–1.39) | 8.60 × 10⁻¹¹ | AAV | Caucasian | 1986/4723 | 0.029 | 1.000 | 0.000 | 0.000 | 0.000 | 0.000 | 0.000 | 0.002 | Merkel, et al. 2017 [4] |
| PTPN22 rs6679677 | A vs. C | 1.40 (1.25–1.57) | 1.88 × 10⁻⁸ | AAV | Caucasian | 1986/4723 | 0.004 | 0.881 | 0.002 | 0.172 | 0.000 | 0.001 | 0.001 | 0.447 | Merkel, et al. 2017 [4] |
| SERPINA1 rs28929474 | T vs. C | 2.18 (1.75–2.71) | 3.09 × 10⁻¹² | AAV | Caucasian | 1986/4723 | 0.000 | 0.000 | 0.056 | 0.855 | 0.000 | 0.001 | 0.000 | 0.010 | Merkel, et al. 2017 [4] |
| HLA-DPA1 rs9277341 | C vs. T | 0.33 (0.28–0.39) | 2.18 × 10−39 | GPA | Caucasian | 750/1820 | NA | NA | NA | NA | NA | NA | 0.000 | 0.000 | Xie, et al. 2013 [6] |
| HLA-DPB1 rs9277554 | T vs. C | 0.24 (0.20–0.30) | 1.92 × 10−50 | GPA | Caucasian | 750/1820 | NA | NA | NA | NA | NA | NA | 0.000 | 0.000 | Xie, et al. 2013 [6] |
| SEMA6A rs26595 | C vs. T | 0.74 (0.67–0.82) | 2.09 × 10⁻⁸ | GPA | Caucasian | 987/2731 | 0.012 | 0.977 | 0.001 | 0.071 | 0.000 | 0.001 | 0.001 | 0.423 | Xie, et al. 2013 [6] |
| HLA-DQA2 rs3998159 | C vs. A | 2.72 (2.24–3.22) | 5.24 × 10⁻²⁵ | MPO-ANCA | Caucasian | 378/4723 | NA | NA | NA | NA | NA | NA | 0.000 | 0.000 | Merkel, et al. 2017 [4] |
| HLA-DQA2 rs7454108 | C vs. T | 2.73 (2.25–3.24) | 5.03 × 10⁻²⁵ | MPO-ANCA | Caucasian | 378/4723 | NA | NA | NA | NA | NA | NA | 0.000 | 0.000 | Merkel, et al. 2017 [4] |
| HLA-DQB1 rs1049072 | A vs. G | 2.37 (2.01–2,78) | 2.13 × 10⁻²⁴ | MPO-ANCA | Caucasian | 378/4723 | NA | NA | NA | NA | NA | NA | 0.000 | 0.000 | Merkel, et al. 2017 [4] |
| SNPs with Statistically Borderline Significance (5.00 × 10⁻⁸ ≤ p < 0.05) | |||||||||||||||
| PTPN22(R620W) rs2476601 | A vs. G | 1.36 (1.21–1.53) | 1.86 × 10⁻⁷ | AAV | Caucasian | 1986/4723 | 0.019 | 0.948 | 0.016 | 0.625 | 0.000 | 0.032 | 0.020 | 0.953 | Merkel, et al. 2017 [4] |
| CCDC86 rs595018 | A vs. G | 1.46 (1.27–1.69) | 1.60 × 10⁻⁷ | GPA | Caucasian | 1986/4723 | 0.004 | 0.641 | 0.084 | 0.902 | 0.001 | 0.058 | 0.033 | 0.971 | Xie, et al. 2013 [6] |
| COBL rs1949829 | T vs. C | 1.78 (1.42–2.24) | 4.19 × 10⁻⁷ | GPA | Caucasian | 1986/4723 | 0.000 | 0.072 | 0.694 | 0.996 | 0.012 | 0.549 | 0.177 | 0.995 | Xie, et al. 2013 [6] |
| DCTD rs4862110 | C vs. T | 1.44 (1.24–1.67) | 2.14 × 10⁻⁶ | GPA | Caucasian | 1986/4723 | 0.008 | 0.705 | 0.151 | 0.947 | 0.002 | 0.167 | 0.092 | 0.990 | Xie, et al. 2013 [6] |
| DOK4 rs6023640 | T vs. G | 1.29 (1.14–1.45) | 2.73 × 10⁻⁵ | GPA | Caucasian | 987/2731 | 0.113 | 0.994 | 0.148 | 0.946 | 0.019 | 0.664 | 0.445 | 0.999 | Xie, et al. 2013 [6] |
| FLJ34870 rs7585252 | G vs. A | 1.26 (1.13–1.40) | 1.74 × 10⁻⁵ | GPA | Caucasian | 987/2731 | 0.182 | 0.999 | 0.086 | 0.904 | 0.017 | 0.632 | 0.408 | 0.999 | Xie, et al. 2013 [6] |
| PAEP rs705669 | G vs. A | 0.77 (0.68–0.87) | 2.52 × 10⁻⁵ | GPA | Caucasian | 987/2731 | 0.102 | 0.990 | 0.210 | 0.964 | 0.027 | 0.733 | 0.520 | 0.999 | Xie, et al. 2013 [6] |
| WSCD1 rs7503953 | A vs. C | 1.50 (1.29–1.76) | 1.93 × 10⁻⁷ | GPA | Caucasian | 1986/4723 | 0.003 | 0.500 | 0.176 | 0.955 | 0.001 | 0.117 | 0.058 | 0.984 | Xie, et al. 2013 [6] |
| Gene/Variant | Comparison | OR (95% CI) | p-Value | Diagnosis (Clinical/Serologic Subtypes) | Ethnicity | No. of Cases/Controls | Power OR 1.2 | Power OR 1.5 | FPRP Values at Prior Probability | BFDP 0.001 | BFDP 0.000001 | Author, Year | |||
|---|---|---|---|---|---|---|---|---|---|---|---|---|---|---|---|
| OR 1.2 | OR 1.5 | ||||||||||||||
| 0.001 | 0.000001 | 0.001 | 0.000001 | ||||||||||||
| SNPs with p-Value < 5.00 × 10⁻⁸ | |||||||||||||||
| HLA-DOA rs3130604 | G vs. A | 1.67 (1.39–2.02) | 4.39 × 10⁻⁸ | GPA | Caucasian | 459/1503 | 0.000 | 0.134 | 0.277 | 0.997 | 0.001 | 0.487 | 0.025 | 0.962 | Xie, et al. 2013 [6] |
| HLA-DOA rs763469 | A vs. G | 1.70 (1.41–2.04) | 1.46 × 10⁻⁸ | GPA | Caucasian | 459/1503 | 0.000 | 0.089 | 0.114 | 0.992 | 0.000 | 0.116 | 0.003 | 0.764 | Xie, et al. 2013 [6] |
| HLA-DPA1 rs2395309 | G vs. A | 0.27 (0.20–0.36) | 2.15 × 10⁻¹⁹ | GPA | Caucasian | 459/1503 | NA | NA | NA | NA | NA | NA | 0.000 | 0.000 | Xie, et al. 2013 [6] |
| HLA-DPA1 rs3077 | C vs. T | 0.27 (0.20–0.36) | 2.68 × 10⁻¹⁹ | GPA | Caucasian | 459/1503 | NA | NA | NA | NA | NA | NA | 0.000 | 0.000 | Xie, et al. 2013 [6] |
| HLA-DPA1 rs2301226 | T vs. C | 0.48 (0.36–0.62) | 4.85 × 10⁻⁸ | GPA | Caucasian | 459/1503 | 0.000 | 0.006 | 0.613 | 0.999 | 0.003 | 0.762 | 0.023 | 0.959 | Xie, et al. 2013 [6] |
| HLA-DPA1 rs9277341 | C vs. T | 0.30 (0.25–0.38) | 1.84 × 10⁻³⁰ | GPA | Caucasian | 459/1503 | NA | NA | NA | NA | NA | NA | 0.000 | 0.000 | Xie, et al. 2013 [6] |
| HLA-DPB1 rs987870 | C vs. T | 0.26 (0.19–0.37) | 6.09 × 10⁻¹⁶ | GPA | Caucasian | 459/1503 | 0.000 | 0.000 | 0.597 | 0.999 | 0.001 | 0.462 | 0.000 | 0.155 | Xie, et al. 2013 [6] |
| HLA-DPB1 rs9277535 | G vs. A | 0.24 (0.19–0.32) | 2.12 × 10⁻²⁸ | GPA | Caucasian | 459/1503 | NA | NA | NA | NA | NA | NA | 0.000 | 0.000 | Xie, et al. 2013 [6] |
| HLA-DPB1 rs9277554 | T vs. C | 0.22 (0.17–0.28) | 4.88 × 10−38 | GPA | Caucasian | 459/1503 | NA | NA | NA | NA | NA | NA | 0.000 | 0.000 | Xie, et al. 2013 [6] |
| HLA-DPB1 rs9277565 | T vs. C | 0.24 (0.18–0.32) | 1.91 × 10⁻²⁴ | GPA | Caucasian | 459/1503 | NA | NA | NA | NA | NA | NA | 0.000 | 0.000 | Xie, et al. 2013 [6] |
| HLA-DPB1 rs2281389 | C vs. T | 0.24 (0.18–0.34) | 1.69 × 10⁻²⁰ | GPA | Caucasian | 459/1503 | 0.000 | 0.000 | 0.458 | 0.999 | 0.000 | 0.187 | 0.000 | 0.013 | Xie, et al. 2013 [6] |
| HLA-DPB1 rs3128917 | G vs. T | 0.22 (0.17–0.29) | 4.92 × 10⁻³³ | GPA | Caucasian | 459/1503 | NA | NA | NA | NA | NA | NA | 0.000 | 0.000 | Xie, et al. 2013 [6] |
| HLA-DPB1 rs3117222 | A vs. G | 0.22 (0.17–0.29) | 3.05 × 10⁻³³ | GPA | Caucasian | 459/1503 | NA | NA | NA | NA | NA | NA | 0.000 | 0.000 | Xie, et al. 2013 [6] |
| HLA-DPB2 rs2064478 | A vs. G | 0.22 (0.17–0.30) | 4.29 × 10⁻²⁹ | GPA | Caucasian | 459/1503 | NA | NA | NA | NA | NA | NA | 0.000 | 0.000 | Xie, et al. 2013 [6] |
| HLA-DPB2 rs3130215 | A vs. G | 2.42 (2.08–2.82) | 2.37 × 10⁻³⁰ | GPA | Caucasian | 459/1503 | NA | NA | NA | NA | NA | NA | 0.000 | 0.000 | Xie, et al. 2013 [6] |
| HLA-DPB2 rs3117230 | C vs. T | 0.22 (0.17–0.30) | 4.29 × 10⁻²⁹ | GPA | Caucasian | 459/1503 | NA | NA | NA | NA | NA | NA | 0.000 | 0.000 | Xie, et al. 2013 [6] |
| HLA-DPB2 rs1883414 | T vs. C | 0.53 (0.44–0.64) | 1.13 × 10⁻¹¹ | GPA | Caucasian | 459/1503 | 0.000 | 0.009 | 0.031 | 0.970 | 0.000 | 0.005 | 0.000 | 0.039 | Xie, et al. 2013 [6] |
| HLA-DPB2 rs4713607 | A vs. G | 0.60 (0.52–0.70) | 6.70 × 10⁻¹¹ | GPA | Caucasian | 459/1503 | 0.000 | 0.090 | 0.006 | 0.849 | 0.000 | 0.001 | 0.000 | 0.027 | Xie, et al. 2013 [6] |
| HLA-DPB2 rs3129274 | G vs. A | 1.56 (1.34–1.82) | 1.35 × 10⁻⁸ | GPA | Caucasian | 459/1503 | 0.000 | 0.309 | 0.036 | 0.974 | 0.000 | 0.048 | 0.002 | 0.708 | Xie, et al. 2013 [6] |
| HLA-DPB2 rs3117016 | T vs. C | 0.48 (0.41–0.57) | 1.09 × 10⁻¹⁷ | GPA | Caucasian | 459/1503 | NA | NA | NA | NA | NA | NA | 0.000 | 0.000 | Xie, et al. 2013 [6] |
| HLA-DPB2 rs3117008 | T vs. C | 0.60 (0.51-0.70) | 4.90 × 10⁻¹¹ | GPA | Caucasian | 459/1503 | 0.000 | 0.090 | 0.006 | 0.849 | 0.000 | 0.001 | 0.000 | 0.027 | Xie, et al. 2013 [6] |
| HLA-DPB2 rs3117004 | C vs. T | 0.57 (0.48–0.68) | 1.90 × 10⁻¹⁰ | GPA | Caucasian | 459/1503 | 0.000 | 0.041 | 0.034 | 0.972 | 0.000 | 0.010 | 0.000 | 0.161 | Xie, et al. 2013 [6] |
| HLA-DPB2 rs6901221 | C vs. A | 0.42 (0.32–0.55) | 6.08 × 10⁻¹¹ | GPA | Caucasian | 459/1503 | 0.000 | 0.000 | 0.475 | 0.999 | 0.001 | 0.423 | 0.002 | 0.651 | Xie, et al. 2013 [6] |
| COL11A2 rs986521 | C vs. T | 1.85 (1.57–2.16) | 2.91 × 10⁻¹⁴ | GPA | Caucasian | 459/1503 | 0.000 | 0.004 | 0.000 | 0.246 | 0.000 | 0.000 | 0.000 | 0.000 | Xie, et al. 2013 [6] |
| COL11A2 rs2855430 | T vs. C | 0.33 (0.24–0.45) | 3.28 × 10⁻¹³ | GPA | Caucasian | 459/1503 | 0.000 | 0.000 | 0.505 | 0.999 | 0.001 | 0.357 | 0.000 | 0.237 | Xie, et al. 2013 [6] |
| COL11A2 rs2855425 | C vs. T | 1.80 (1.54–2.11) | 7.77 × 10⁻¹⁴ | GPA | Caucasian | 459/1503 | 0.000 | 0.012 | 0.001 | 0.594 | 0.000 | 0.000 | 0.000 | 0.000 | Xie, et al. 2013 [6] |
| COL11A2 rs2855459 | T vs. C | 0.32 (0.23–0.44) | 2.14 × 10⁻¹³ | GPA | Caucasian | 459/1503 | 0.000 | 0.000 | 0.548 | 0.999 | 0.001 | 0.427 | 0.000 | 0.287 | Xie, et al. 2013 [6] |
| RXRB rs6531 | C vs. T | 1.80 (1.54–2.11) | 8.48 × 10⁻¹⁴ | GPA | Caucasian | 459/1503 | 0.000 | 0.012 | 0.001 | 0.594 | 0.000 | 0.000 | 0.000 | 0.000 | Xie, et al. 2013 [6] |
| HSD17B8 rs439205 | T vs. C | 0.31 (0.24–0.39) | 3.51 × 10⁻²³ | GPA | Caucasian | 459/1503 | NA | NA | NA | NA | NA | NA | 0.000 | 0.000 | Xie, et al. 2013 [6] |
| HSD17B8 rs421446 | C vs. T | 0.39 (0.31–0.48) | 8.90 × 10⁻²⁰ | GPA | Caucasian | 459/1503 | NA | NA | NA | NA | NA | NA | 0.000 | 0.000 | Xie, et al. 2013 [6] |
| RING1 rs213213 | A vs. G | 1.83 (1.57–2.14) | 6.98 × 10⁻¹⁵ | GPA | Caucasian | 459/1503 | 0.000 | 0.006 | 0.001 | 0.375 | 0.000 | 0.000 | 0.000 | 0.000 | Xie, et al. 2013 [6] |
| RING1 rs213212 | G vs. T | 1.85 (1.58–2.17) | 7.63 × 10⁻¹⁵ | GPA | Caucasian | 459/1503 | 0.000 | 0.005 | 0.001 | 0.439 | 0.000 | 0.000 | 0.000 | 0.000 | Xie, et al. 2013 [6] |
| COBL rs1949829 | T vs. C | 2.19 (1.68–2.86) | 3.58 × 10⁻⁹ | GPA | Caucasian | 459/1503 | 0.000 | 0.003 | 0.632 | 0.999 | 0.003 | 0.759 | 0.017 | 0.946 | Xie, et al. 2013 [6] |
| CCDC86 rs595018 | A vs. G | 1.61 (1.36–1.90) | 2.74 × 10⁻⁸ | GPA | Caucasian | 459/1503 | 0.000 | 0.201 | 0.064 | 0.986 | 0.000 | 0.080 | 0.003 | 0.764 | Xie, et al. 2013 [6] |
| WSCD1 rs7503953 | A vs. C | 1.72 (1.44–2.06) | 1.39 × 10⁻⁹ | GPA | Caucasian | 459/1503 | 0.000 | 0.068 | 0.076 | 0.988 | 0.000 | 0.053 | 0.001 | 0.555 | Xie, et al. 2013 [6] |
| SNPs Reported Non-Significant (5.00 × 10⁻⁸ ≤ p < 1.00 × 10⁻⁴) | |||||||||||||||
| TCEB3 rs2076346 | C vs. T | 1.46 (1.24–1.73) | 8.62 × 10⁻⁶ | GPA | Caucasian | 459/1503 | 0.012 | 0.623 | 0.512 | 0.999 | 0.019 | 0.952 | 0.433 | 0.999 | Xie, et al. 2013 [6] |
| DAB1 rs264036 | C vs. T | 0.72 (0.62–0.85) | 9.82 × 10⁻⁵ | GPA | Caucasian | 459/1503 | 0.042 | 0.818 | 0.713 | 1.000 | 0.113 | 0.992 | 0.807 | 1.000 | Xie, et al. 2013 [6] |
| DAB1 rs542873 | T vs. C | 1.37 (1.18–1.59) | 4.70 × 10⁻⁵ | GPA | Caucasian | 459/1503 | 0.041 | 0.884 | 0.457 | 0.999 | 0.037 | 0.975 | 0.601 | 0.999 | Xie, et al. 2013 [6] |
| DAB1 rs197644 | G vs. A | 1.37 (1.18–1.59) | 3.89 × 10⁻⁵ | GPA | Caucasian | 459/1503 | 0.041 | 0.884 | 0.457 | 0.999 | 0.037 | 0.975 | 0.601 | 0.999 | Xie, et al. 2013 [6] |
| LPHN2 rs11579502 | C vs. T | 1.56 (1.28–1.90) | 9.43 × 10⁻⁶ | GPA | Caucasian | 459/1503 | 0.005 | 0.348 | 0.684 | 1.000 | 0.027 | 0.966 | 0.458 | 0.999 | Xie, et al. 2013 [6] |
| NCKAP5 rs1134119 | C vs. T | 1.79 (1.38–2.32) | 8.96 × 10⁻⁶ | GPA | Caucasian | 459/1503 | 0.001 | 0.091 | 0.896 | 1.000 | 0.106 | 0.992 | 0.658 | 0.999 | Xie, et al. 2013 [6] |
| NCKAP5 rs7585252 | G vs. A | 1.35 (1.16–1.57) | 9.69 × 10⁻⁵ | GPA | Caucasian | 459/1503 | 0.063 | 0.914 | 0.607 | 0.999 | 0.096 | 0.991 | 0.785 | 1.000 | Xie, et al. 2013 [6] |
| NEK10 rs1579900 | T vs. G | 1.51 (1.24–1.85) | 3.97 × 10⁻⁵ | GPA | Caucasian | 459/1503 | 0.013 | 0.474 | 0.840 | 1.000 | 0.128 | 0.993 | 0.800 | 1.000 | Xie, et al. 2013 [6] |
| CTNNB1 rs9842536 | T vs. C | 1.46 (1.23–1.74) | 1.63 × 10⁻⁵ | GPA | Caucasian | 459/1503 | 0.014 | 0.619 | 0.624 | 0.999 | 0.037 | 0.974 | 0.575 | 0.999 | Xie, et al. 2013 [6] |
| C3orf58 rs1512779 | C vs. A | 0.72 (0.61–0.84) | 2.86 × 10⁻⁵ | GPA | Caucasian | 459/1503 | 0.032 | 0.836 | 0.484 | 0.999 | 0.034 | 0.972 | 0.579 | 0.999 | Xie, et al. 2013 [6] |
| PLSCR4 rs7628805 | A vs. C | 1.41 (1.18–1.67) | 9.72 × 10⁻⁵ | GPA | Caucasian | 459/1503 | 0.031 | 0.763 | 0.691 | 1.000 | 0.083 | 0.989 | 0.754 | 1.000 | Xie, et al. 2013 [6] |
| ST6GAL1 rs10513807 | G vs. A | 0.71 (0.61–0.83) | 9.49 × 10⁻⁶ | GPA | Caucasian | 459/1503 | 0.022 | 0.785 | 0.436 | 0.999 | 0.021 | 0.956 | 0.471 | 0.999 | Xie, et al. 2013 [6] |
| KIAA0746 rs4269167 | T vs. C | 0.73 (0.63–0.86) | 7.72 × 10⁻⁵ | GPA | Caucasian | 459/1503 | 0.057 | 0.861 | 0.747 | 1.000 | 0.163 | 0.995 | 0.858 | 1.000 | Xie, et al. 2013 [6] |
| DCTD rs4862110 | C vs. T | 1.63 (1.36–1.94) | 5.00 × 10⁻⁸ | GPA | Caucasian | 459/1503 | 0.000 | 0.175 | 0.118 | 0.993 | 0.000 | 0.178 | 0.007 | 0.878 | Xie, et al. 2013 [6] |
| OSMR rs357291 | C vs. A | 0.72 (0.62–0.84) | 2.81 × 10⁻⁵ | GPA | Caucasian | 459/1503 | 0.032 | 0.836 | 0.484 | 0.999 | 0.034 | 0.972 | 0.579 | 0.999 | Xie, et al. 2013 [6] |
| SEMA6A rs26595 | C vs. T | 0.74 (0.63–0.86) | 9.58 × 10⁻⁵ | GPA | Caucasian | 459/1503 | 0.061 | 0.913 | 0.586 | 0.999 | 0.086 | 0.989 | 0.766 | 1.000 | Xie, et al. 2013 [6] |
| GRIA1 rs10515687 | T vs. C | 1.56 (1.25–1.94) | 8.11 × 10⁻⁵ | GPA | Caucasian | 459/1503 | 0.009 | 0.362 | 0.874 | 1.000 | 0.150 | 0.994 | 0.811 | 1.000 | Xie, et al. 2013 [6] |
| WWC1 rs3853242 | G vs. A | 0.74 (0.63–0.86) | 8.55 × 10⁻⁵ | GPA | Caucasian | 459/1503 | 0.061 | 0.913 | 0.586 | 0.999 | 0.086 | 0.989 | 0.766 | 1.000 | Xie, et al. 2013 [6] |
| ERGIC1 rs1564259 | A vs. G | 0.69 (0.58–0.83) | 7.19 × 10⁻⁵ | GPA | Caucasian | 459/1503 | 0.023 | 0.642 | 0.785 | 1.000 | 0.114 | 0.992 | 0.797 | 1.000 | Xie, et al. 2013 [6] |
| ERGIC1 rs1006721 | C vs. T | 0.69 (0.58–0.83) | 6.22 × 10⁻⁵ | GPA | Caucasian | 459/1503 | 0.023 | 0.642 | 0.785 | 1.000 | 0.114 | 0.992 | 0.797 | 1.000 | Xie, et al. 2013 [6] |
| OFCC1 rs9358619 | A vs. G | 1.45 (1.21–1.74) | 4.90 × 10⁻⁵ | GPA | Caucasian | 459/1503 | 0.021 | 0.642 | 0.756 | 1.000 | 0.092 | 0.990 | 0.762 | 1.000 | Xie, et al. 2013 [6] |
| HLA-DMA rs3135029 | A vs. C | 1.61 (1.28–2.02) | 4.55 × 10⁻⁵ | GPA | Caucasian | 459/1503 | 0.006 | 0.270 | 0.875 | 1.000 | 0.125 | 0.993 | 0.764 | 1.000 | Xie, et al. 2013 [6] |
| HLA-DOA rs176248 | T vs. C | 0.70 (0.58–0.83) | 8.16 × 10⁻⁵ | GPA | Caucasian | 459/1503 | 0.022 | 0.713 | 0.644 | 0.999 | 0.054 | 0.983 | 0.668 | 1.000 | Xie, et al. 2013 [6] |
| HLA-DOA rs206762 | C vs. T | 1.36 (1.17–1.58) | 5.92 × 10⁻⁵ | GPA | Caucasian | 459/1503 | 0.051 | 0.900 | 0.534 | 0.999 | 0.061 | 0.985 | 0.703 | 1.000 | Xie, et al. 2013 [6] |
| HLA-DOA rs9296068 | G vs. T | 0.68 (0.58–0.81) | 7.49 × 10⁻⁶ | GPA | Caucasian | 459/1503 | 0.011 | 0.588 | 0.578 | 0.999 | 0.026 | 0.964 | 0.491 | 0.999 | Xie, et al. 2013 [6] |
| HLA-DPB2 rs1810472 | G vs. A | 0.65 (0.54–0.77) | 1.06 × 10⁻⁶ | GPA | Caucasian | 459/1503 | 0.002 | 0.385 | 0.235 | 0.997 | 0.002 | 0.618 | 0.062 | 0.985 | Xie, et al. 2013 [6] |
| HLA-DPB2 rs3117035 | A vs. G | 0.72 (0.61–0.84) | 2.50 × 10⁻⁵ | GPA | Caucasian | 459/1503 | 0.032 | 0.836 | 0.484 | 0.999 | 0.034 | 0.972 | 0.579 | 0.999 | Xie, et al. 2013 [6] |
| COL11A2 rs2235498 | T vs. C | 0.67 (0.55–0.81) | 3.86 × 10⁻⁵ | GPA | Caucasian | 459/1503 | 0.012 | 0.521 | 0.744 | 1.000 | 0.063 | 0.985 | 0.678 | 1.000 | Xie, et al. 2013 [6] |
| WDR46 rs3130257 | T vs. C | 1.63 (1.32–2.01) | 5.61 × 10⁻⁶ | GPA | Caucasian | 459/1503 | 0.002 | 0.218 | 0.700 | 1.000 | 0.022 | 0.957 | 0.365 | 0.998 | Xie, et al. 2013 [6] |
| DAXX rs211474 | T vs. C | 0.71 (0.60–0.84) | 6.37 × 10⁻⁵ | GPA | Caucasian | 459/1503 | 0.031 | 0.769 | 0.679 | 1.000 | 0.078 | 0.988 | 0.744 | 1.000 | Xie, et al. 2013 [6] |
| KIFC1 rs211452 | C vs. T | 0.65 (0.55–0.76) | 1.98 × 10⁻⁷ | GPA | Caucasian | 459/1503 | 0.001 | 0.375 | 0.067 | 0.986 | 0.000 | 0.150 | 0.008 | 0.895 | Xie, et al. 2013 [6] |
| SYNGAP1 rs211456 | A vs. C | 0.72 (0.61–0.84) | 3.57 × 10⁻⁵ | GPA | Caucasian | 459/1503 | 0.032 | 0.836 | 0.484 | 0.999 | 0.034 | 0.972 | 0.579 | 0.999 | Xie, et al. 2013 [6] |
| SYNGAP1 rs2247385 | G vs. A | 0.69 (0.59–0.81) | 5.14 × 10⁻⁶ | GPA | Caucasian | 459/1503 | 0.011 | 0.663 | 0.353 | 0.998 | 0.009 | 0.896 | 0.271 | 0.997 | Xie, et al. 2013 [6] |
| FLJ43752 rs210120 | G vs. A | 0.72 (0.62–0.84) | 2.58 × 10⁻⁵ | GPA | Caucasian | 459/1503 | 0.032 | 0.836 | 0.484 | 0.999 | 0.034 | 0.972 | 0.579 | 0.999 | Xie, et al. 2013 [6] |
| BCKDHB rs515347 | G vs. A | 1.70 (1.32–2.18) | 3.13 × 10⁻⁵ | GPA | Caucasian | 459/1503 | 0.003 | 0.162 | 0.905 | 1.000 | 0.151 | 0.994 | 0.769 | 1.000 | Xie, et al. 2013 [6] |
| TCBA1 rs6924068 | G vs. A | 1.40 (1.20–1.63) | 1.37 × 10⁻⁵ | GPA | Caucasian | 459/1503 | 0.023 | 0.813 | 0.382 | 0.998 | 0.018 | 0.947 | 0.429 | 0.999 | Xie, et al. 2013 [6] |
| MAGI2 rs3779312 | A vs. G | 1.50 (1.26–1.78) | 5.26 × 10⁻⁶ | GPA | Caucasian | 459/1503 | 0.005 | 0.500 | 0.392 | 0.998 | 0.007 | 0.873 | 0.214 | 0.996 | Xie, et al. 2013 [6] |
| CUTL1 rs1734729 | T vs. C | 1.41 (1.20–1.67) | 4.54 × 10⁻⁵ | GPA | Caucasian | 459/1503 | 0.031 | 0.763 | 0.691 | 1.000 | 0.083 | 0.989 | 0.754 | 1.000 | Xie, et al. 2013 [6] |
| DPP6 rs4726422 | G vs. A | 0.74 (0.63–0.86) | 7.74 × 10⁻⁵ | GPA | Caucasian | 459/1503 | 0.061 | 0.913 | 0.586 | 0.999 | 0.086 | 0.989 | 0.766 | 1.000 | Xie, et al. 2013 [6] |
| LOC441376 rs3019885 | G vs. T | 1.44 (1.24–1.67) | 1.90 × 10⁻⁶ | GPA | Caucasian | 459/1503 | 0.008 | 0.705 | 0.151 | 0.994 | 0.002 | 0.667 | 0.092 | 0.990 | Xie, et al. 2013 [6] |
| SLC30A8 rs1793729 | C vs. T | 0.68 (0.57–0.80) | 5.68 × 10⁻⁶ | GPA | Caucasian | 459/1503 | 0.007 | 0.594 | 0.317 | 0.998 | 0.006 | 0.847 | 0.194 | 0.996 | Xie, et al. 2013 [6] |
| SLC30A8 rs1695715 | T vs. C | 0.69 (0.58–0.82) | 1.57 × 10⁻⁵ | GPA | Caucasian | 459/1503 | 0.016 | 0.652 | 0.610 | 0.999 | 0.037 | 0.975 | 0.582 | 0.999 | Xie, et al. 2013 [6] |
| KCNK9 rs2447406 | T vs. C | 1.58 (1.27–1.97) | 3.25 × 10⁻⁵ | GPA | Caucasian | 459/1503 | 0.007 | 0.322 | 0.869 | 1.000 | 0.130 | 0.993 | 0.781 | 1.000 | Xie, et al. 2013 [6] |
| C9orf66 rs584922 | T vs. C | 0.70 (0.60–0.82) | 1.30 × 10⁻⁵ | GPA | Caucasian | 459/1503 | 0.015 | 0.727 | 0.392 | 0.998 | 0.013 | 0.932 | 0.365 | 0.998 | Xie, et al. 2013 [6] |
| C9orf93 rs1341740 | T vs. C | 1.52 (1.23–1.87) | 9.73 × 10⁻⁵ | GPA | Caucasian | 459/1503 | 0.013 | 0.450 | 0.855 | 1.000 | 0.142 | 0.994 | 0.814 | 1.000 | Xie, et al. 2013 [6] |
| LRRN6C rs10491888 | G vs. A | 1.54 (1.25–1.91) | 5.75 × 10⁻⁵ | GPA | Caucasian | 459/1503 | 0.012 | 0.405 | 0.880 | 1.000 | 0.173 | 0.995 | 0.837 | 1.000 | Xie, et al. 2013 [6] |
| PAEP rs705669 | G vs. A | 0.69 (0.57–0.83) | 8.53 × 10⁻⁵ | GPA | Caucasian | 459/1503 | 0.023 | 0.642 | 0.785 | 1.000 | 0.114 | 0.992 | 0.797 | 1.000 | Xie, et al. 2013 [6] |
| NEUROG3 rs731573 | T vs. C | 1.44 (1.20–1.72) | 9.40 × 10⁻⁵ | GPA | Caucasian | 459/1503 | 0.022 | 0.674 | 0.722 | 1.000 | 0.079 | 0.988 | 0.738 | 1.000 | Xie, et al. 2013 [6] |
| TMPO rs2216021 | C vs. T | 1.36 (1.17–1.57) | 6.14 × 10⁻⁵ | GPA | Caucasian | 459/1503 | 0.044 | 0.909 | 0.382 | 0.998 | 0.029 | 0.967 | 0.544 | 0.999 | Xie, et al. 2013 [6] |
| TMPO rs2011247 | C vs. T | 0.73 (0.63–0.85) | 4.84 × 10⁻⁵ | GPA | Caucasian | 459/1503 | 0.044 | 0.879 | 0.534 | 0.999 | 0.054 | 0.983 | 0.680 | 1.000 | Xie, et al. 2013 [6] |
| FGF9 rs2031421 | T vs. G | 1.44 (1.21–1.72) | 4.01 × 10⁻⁵ | GPA | Caucasian | 459/1503 | 0.022 | 0.674 | 0.722 | 1.000 | 0.079 | 0.988 | 0.738 | 1.000 | Xie, et al. 2013 [6] |
| DOK5 rs6023640 | T vs. G | 1.40 (1.18–1.66) | 8.98 × 10⁻⁵ | GPA | Caucasian | 459/1503 | 0.038 | 0.786 | 0.740 | 1.000 | 0.121 | 0.993 | 0.815 | 1.000 | Xie, et al. 2013 [6] |
| PDE9A rs2269127 | A vs. G | 1.65 (1.36–2.01) | 4.06 × 10⁻⁷ | GPA | Caucasian | 459/1503 | 0.001 | 0.172 | 0.457 | 0.999 | 0.004 | 0.793 | 0.094 | 0.990 | Xie, et al. 2013 [6] |
© 2019 by the authors. Licensee MDPI, Basel, Switzerland. This article is an open access article distributed under the terms and conditions of the Creative Commons Attribution (CC BY) license (http://creativecommons.org/licenses/by/4.0/).
Share and Cite
Lee, K.S.; Kronbichler, A.; Pereira Vasconcelos, D.F.; Pereira da Silva, F.R.; Ko, Y.; Oh, Y.S.; Eisenhut, M.; Merkel, P.A.; Jayne, D.; Amos, C.I.; et al. Genetic Variants in Antineutrophil Cytoplasmic Antibody-Associated Vasculitis: A Bayesian Approach and Systematic Review. J. Clin. Med. 2019, 8, 266. https://0-doi-org.brum.beds.ac.uk/10.3390/jcm8020266
Lee KS, Kronbichler A, Pereira Vasconcelos DF, Pereira da Silva FR, Ko Y, Oh YS, Eisenhut M, Merkel PA, Jayne D, Amos CI, et al. Genetic Variants in Antineutrophil Cytoplasmic Antibody-Associated Vasculitis: A Bayesian Approach and Systematic Review. Journal of Clinical Medicine. 2019; 8(2):266. https://0-doi-org.brum.beds.ac.uk/10.3390/jcm8020266
Chicago/Turabian StyleLee, Kwang Seob, Andreas Kronbichler, Daniel Fernando Pereira Vasconcelos, Felipe Rodolfo Pereira da Silva, Younhee Ko, Yeon Su Oh, Michael Eisenhut, Peter A. Merkel, David Jayne, Christopher I. Amos, and et al. 2019. "Genetic Variants in Antineutrophil Cytoplasmic Antibody-Associated Vasculitis: A Bayesian Approach and Systematic Review" Journal of Clinical Medicine 8, no. 2: 266. https://0-doi-org.brum.beds.ac.uk/10.3390/jcm8020266